Mira: A Framework for Static Performance Analysis
11
Mira: A Framework for Static Performance Analysis Kewen Meng, Boyana Norris Department of Computer and Information Science University of Oregon Eugene, Oregon {kewen, norris}@cs.uoregon.edu Abstract—The performance model of an application can pro- vide understanding about its runtime behavior on particular hardware. Such information can be analyzed by developers for performance tuning. However, model building and analyzing is frequently ignored during software development until perfor- mance problems arise because they require significant expertise and can involve many time-consuming application runs. In this paper, we propose a fast, accurate, flexible and user-friendly tool, Mira, for generating performance models by applying static program analysis, targeting scientific applications running on supercomputers. We parse both the source code and binary to estimate performance attributes with better accuracy than considering just source or just binary code. Because our analysis is static, the target program does not need to be executed on the target architecture, which enables users to perform analysis on available machines instead of conducting expensive exper- iments on potentially expensive resources. Moreover, statically generated models enable performance prediction on non-existent or unavailable architectures. In addition to flexibility, because model generation time is significantly reduced compared to dynamic analysis approaches, our method is suitable for rapid application performance analysis and improvement. We present several scientific application validation results to demonstrate the current capabilities of our approach on small benchmarks and a mini application. I. I NTRODUCTION Understanding application and system performance plays a critical role in high-performance software and architecture design. Developers require a thorough insight of the appli- cation and system to aid their development and improvement. Performance modeling provides software developers with nec- essary information about bottlenecks and can guide users in identifying potential optimization opportunities. As the development of new hardware and architectures progresses, the computing capability of high performance computing (HPC) systems continues to increase dramatically. However along with the rise in computing capability, it is also true that many applications cannot use the full available computing potential, which wastes a considerable amount of computing power. The inability to fully utilize available computing resources or specific advantages of architectures during application development partially accounts for this waste. Hence, it is important to be able to understand and model program behavior in order to gain more information about its bottlenecks and performance potential. Analyzing the instruction mixes of programs at function or loop granularity can provide insight on CPU and memory characteristics, which can be used for further optimization of a program. In this paper, we introduce a new approach for analyzing and modeling programs using primarily static analysis techniques combining both source and binary program information. Our tool, Mira, generates parameterized performance models that can be used to estimate instruction mixes at different gran- ularity (from function to statement level) for different inputs and architectural features without requiring execution of the application. Current program performance analysis tools can be catego- rized into two types: static and dynamic. Dynamic (runtime) analysis is performed through execution of the target program and measurement of metrics of interest, e.g., time or hardware performance counters. By contrast, static analysis operates on the source or binary code without actually executing it. PBound [1] is an example static analysis tool for automatically modeling program performance based on source code analysis of C applications. Because PBound considers only the source code, it cannot capture compiler optimizations and hence produces less accurate estimates of performance metrics. We discuss other examples of these approaches in more detail in Sections II and V. While some past research efforts mix static and dynamic analysis to create a performance model, relatively little effort has been put into pure static performance analysis and increas- ing the accuracy of static analysis. Our approach starts from object code because the code transformations performed by optimizing compilers would cause non-negligible effects on the analysis accuracy. In addition, object code is language- independent and more directly reflects runtime behavior. Al- though object code could provide instruction-level informa- tion, it still fails to offer some critical factors for understanding the target program. For instance, it is difficult or impossible to obtain detailed information about high-level code structures (user-defined types, classes, loops) from just the object code. Therefore, source code is also analyzed in our project to supplement complementary high-level information. By combining source code and object code representa- tions, we are able to obtain a more precise description of the program and its possible behavior when running on a particular architecture, which results in improved modeling accuracy. The output of our tool can be used to rapidly explore program behavior for different inputs without requiring actual application execution. In addition, because the analysis is parameterized with respect to the architecture, Mira provides users valuable insight of how programs may run on particular arXiv:1705.07575v1 [cs.PF] 22 May 2017
Transcript of Mira: A Framework for Static Performance Analysis
Mira: A Framework for Static Performance AnalysisKewen Meng, Boyana Norris
Department of Computer and Information ScienceUniversity of Oregon
Eugene, Oregon{kewen, norris}@cs.uoregon.edu
Abstract—The performance model of an application can pro-vide understanding about its runtime behavior on particularhardware. Such information can be analyzed by developers forperformance tuning. However, model building and analyzing isfrequently ignored during software development until perfor-mance problems arise because they require significant expertiseand can involve many time-consuming application runs. In thispaper, we propose a fast, accurate, flexible and user-friendlytool, Mira, for generating performance models by applying staticprogram analysis, targeting scientific applications running onsupercomputers. We parse both the source code and binaryto estimate performance attributes with better accuracy thanconsidering just source or just binary code. Because our analysisis static, the target program does not need to be executed onthe target architecture, which enables users to perform analysison available machines instead of conducting expensive exper-iments on potentially expensive resources. Moreover, staticallygenerated models enable performance prediction on non-existentor unavailable architectures. In addition to flexibility, becausemodel generation time is significantly reduced compared todynamic analysis approaches, our method is suitable for rapidapplication performance analysis and improvement. We presentseveral scientific application validation results to demonstrate thecurrent capabilities of our approach on small benchmarks anda mini application.
I. INTRODUCTION
Understanding application and system performance playsa critical role in high-performance software and architecturedesign. Developers require a thorough insight of the appli-cation and system to aid their development and improvement.Performance modeling provides software developers with nec-essary information about bottlenecks and can guide users inidentifying potential optimization opportunities.
As the development of new hardware and architecturesprogresses, the computing capability of high performancecomputing (HPC) systems continues to increase dramatically.However along with the rise in computing capability, it isalso true that many applications cannot use the full availablecomputing potential, which wastes a considerable amountof computing power. The inability to fully utilize availablecomputing resources or specific advantages of architecturesduring application development partially accounts for thiswaste. Hence, it is important to be able to understand andmodel program behavior in order to gain more informationabout its bottlenecks and performance potential. Analyzing theinstruction mixes of programs at function or loop granularitycan provide insight on CPU and memory characteristics, whichcan be used for further optimization of a program.
In this paper, we introduce a new approach for analyzing andmodeling programs using primarily static analysis techniquescombining both source and binary program information. Ourtool, Mira, generates parameterized performance models thatcan be used to estimate instruction mixes at different gran-ularity (from function to statement level) for different inputsand architectural features without requiring execution of theapplication.
Current program performance analysis tools can be catego-rized into two types: static and dynamic. Dynamic (runtime)analysis is performed through execution of the target programand measurement of metrics of interest, e.g., time or hardwareperformance counters. By contrast, static analysis operateson the source or binary code without actually executing it.PBound [1] is an example static analysis tool for automaticallymodeling program performance based on source code analysisof C applications. Because PBound considers only the sourcecode, it cannot capture compiler optimizations and henceproduces less accurate estimates of performance metrics. Wediscuss other examples of these approaches in more detail inSections II and V.
While some past research efforts mix static and dynamicanalysis to create a performance model, relatively little efforthas been put into pure static performance analysis and increas-ing the accuracy of static analysis. Our approach starts fromobject code because the code transformations performed byoptimizing compilers would cause non-negligible effects onthe analysis accuracy. In addition, object code is language-independent and more directly reflects runtime behavior. Al-though object code could provide instruction-level informa-tion, it still fails to offer some critical factors for understandingthe target program. For instance, it is difficult or impossibleto obtain detailed information about high-level code structures(user-defined types, classes, loops) from just the object code.Therefore, source code is also analyzed in our project tosupplement complementary high-level information.
By combining source code and object code representa-tions, we are able to obtain a more precise description ofthe program and its possible behavior when running on aparticular architecture, which results in improved modelingaccuracy. The output of our tool can be used to rapidly exploreprogram behavior for different inputs without requiring actualapplication execution. In addition, because the analysis isparameterized with respect to the architecture, Mira providesusers valuable insight of how programs may run on particular
arX
iv:1
705.
0757
5v1
[cs
.PF]
22
May
201
7
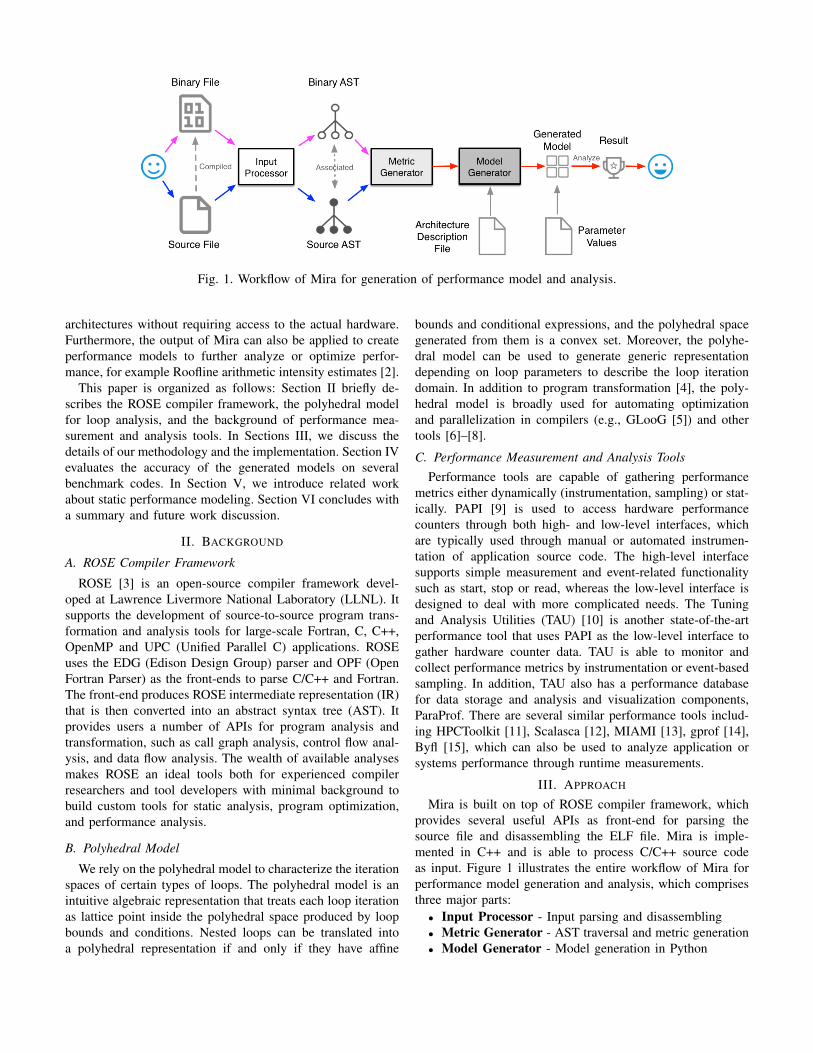
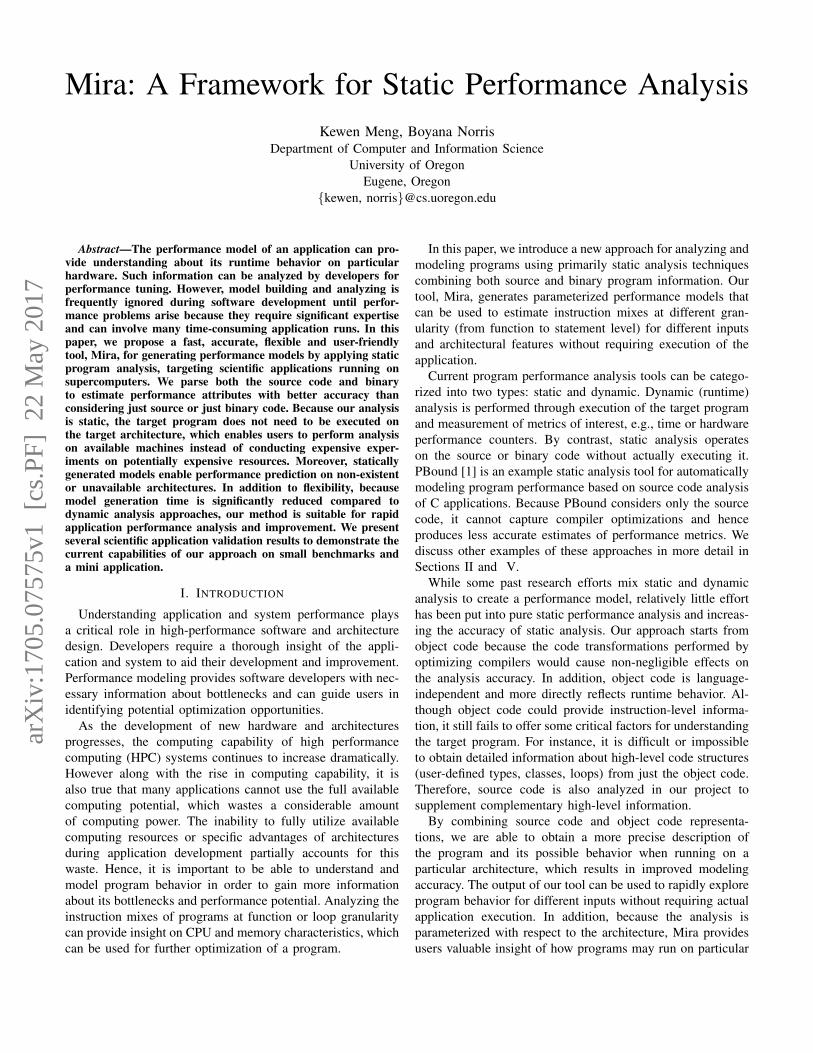
Fig. 1. Workflow of Mira for generation of performance model and analysis.
architectures without requiring access to the actual hardware.Furthermore, the output of Mira can also be applied to createperformance models to further analyze or optimize perfor-mance, for example Roofline arithmetic intensity estimates [2].
This paper is organized as follows: Section II briefly de-scribes the ROSE compiler framework, the polyhedral modelfor loop analysis, and the background of performance mea-surement and analysis tools. In Sections III, we discuss thedetails of our methodology and the implementation. Section IVevaluates the accuracy of the generated models on severalbenchmark codes. In Section V, we introduce related workabout static performance modeling. Section VI concludes witha summary and future work discussion.
II. BACKGROUND
A. ROSE Compiler Framework
ROSE [3] is an open-source compiler framework devel-oped at Lawrence Livermore National Laboratory (LLNL). Itsupports the development of source-to-source program trans-formation and analysis tools for large-scale Fortran, C, C++,OpenMP and UPC (Unified Parallel C) applications. ROSEuses the EDG (Edison Design Group) parser and OPF (OpenFortran Parser) as the front-ends to parse C/C++ and Fortran.The front-end produces ROSE intermediate representation (IR)that is then converted into an abstract syntax tree (AST). Itprovides users a number of APIs for program analysis andtransformation, such as call graph analysis, control flow anal-ysis, and data flow analysis. The wealth of available analysesmakes ROSE an ideal tools both for experienced compilerresearchers and tool developers with minimal background tobuild custom tools for static analysis, program optimization,and performance analysis.
B. Polyhedral Model
We rely on the polyhedral model to characterize the iterationspaces of certain types of loops. The polyhedral model is anintuitive algebraic representation that treats each loop iterationas lattice point inside the polyhedral space produced by loopbounds and conditions. Nested loops can be translated intoa polyhedral representation if and only if they have affine
bounds and conditional expressions, and the polyhedral spacegenerated from them is a convex set. Moreover, the polyhe-dral model can be used to generate generic representationdepending on loop parameters to describe the loop iterationdomain. In addition to program transformation [4], the poly-hedral model is broadly used for automating optimizationand parallelization in compilers (e.g., GLooG [5]) and othertools [6]–[8].
C. Performance Measurement and Analysis ToolsPerformance tools are capable of gathering performance
metrics either dynamically (instrumentation, sampling) or stat-ically. PAPI [9] is used to access hardware performancecounters through both high- and low-level interfaces, whichare typically used through manual or automated instrumen-tation of application source code. The high-level interfacesupports simple measurement and event-related functionalitysuch as start, stop or read, whereas the low-level interface isdesigned to deal with more complicated needs. The Tuningand Analysis Utilities (TAU) [10] is another state-of-the-artperformance tool that uses PAPI as the low-level interface togather hardware counter data. TAU is able to monitor andcollect performance metrics by instrumentation or event-basedsampling. In addition, TAU also has a performance databasefor data storage and analysis and visualization components,ParaProf. There are several similar performance tools includ-ing HPCToolkit [11], Scalasca [12], MIAMI [13], gprof [14],Byfl [15], which can also be used to analyze application orsystems performance through runtime measurements.
III. APPROACH
Mira is built on top of ROSE compiler framework, whichprovides several useful APIs as front-end for parsing thesource file and disassembling the ELF file. Mira is imple-mented in C++ and is able to process C/C++ source codeas input. Figure 1 illustrates the entire workflow of Mira forperformance model generation and analysis, which comprisesthree major parts:
• Input Processor - Input parsing and disassembling• Metric Generator - AST traversal and metric generation• Model Generator - Model generation in Python
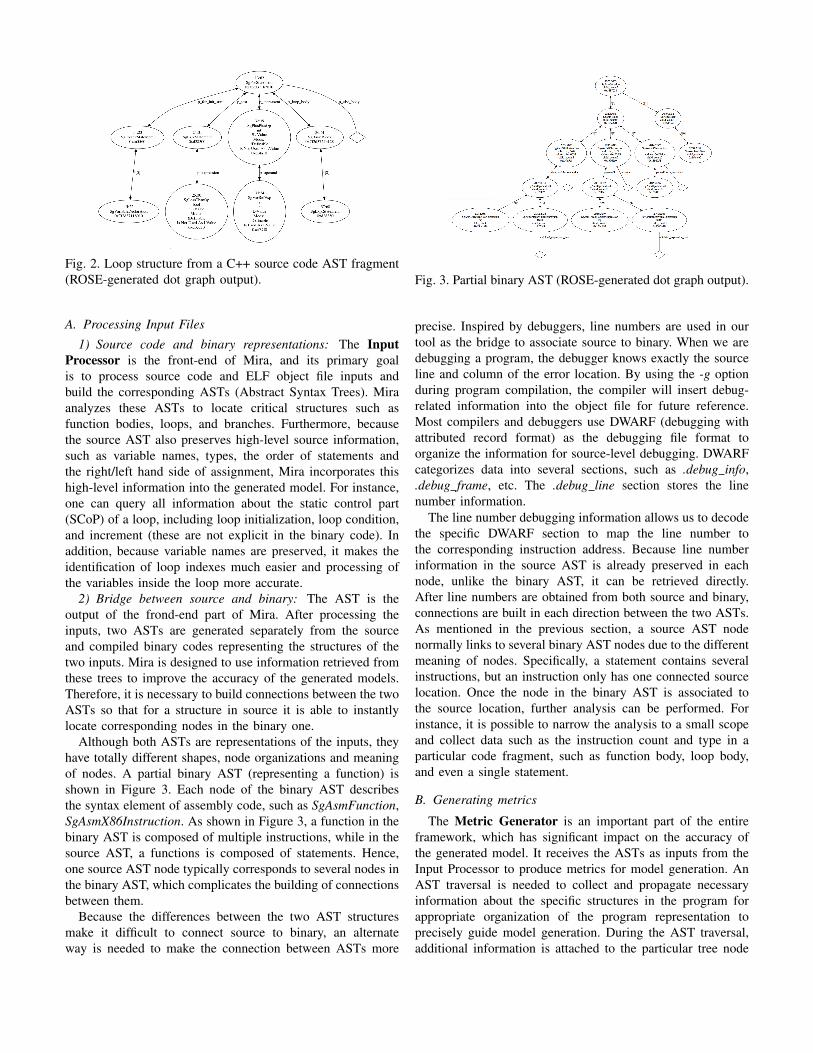
Fig. 2. Loop structure from a C++ source code AST fragment(ROSE-generated dot graph output).
A. Processing Input Files
1) Source code and binary representations: The InputProcessor is the front-end of Mira, and its primary goalis to process source code and ELF object file inputs andbuild the corresponding ASTs (Abstract Syntax Trees). Miraanalyzes these ASTs to locate critical structures such asfunction bodies, loops, and branches. Furthermore, becausethe source AST also preserves high-level source information,such as variable names, types, the order of statements andthe right/left hand side of assignment, Mira incorporates thishigh-level information into the generated model. For instance,one can query all information about the static control part(SCoP) of a loop, including loop initialization, loop condition,and increment (these are not explicit in the binary code). Inaddition, because variable names are preserved, it makes theidentification of loop indexes much easier and processing ofthe variables inside the loop more accurate.
2) Bridge between source and binary: The AST is theoutput of the frond-end part of Mira. After processing theinputs, two ASTs are generated separately from the sourceand compiled binary codes representing the structures of thetwo inputs. Mira is designed to use information retrieved fromthese trees to improve the accuracy of the generated models.Therefore, it is necessary to build connections between the twoASTs so that for a structure in source it is able to instantlylocate corresponding nodes in the binary one.
Although both ASTs are representations of the inputs, theyhave totally different shapes, node organizations and meaningof nodes. A partial binary AST (representing a function) isshown in Figure 3. Each node of the binary AST describesthe syntax element of assembly code, such as SgAsmFunction,SgAsmX86Instruction. As shown in Figure 3, a function in thebinary AST is composed of multiple instructions, while in thesource AST, a functions is composed of statements. Hence,one source AST node typically corresponds to several nodes inthe binary AST, which complicates the building of connectionsbetween them.
Because the differences between the two AST structuresmake it difficult to connect source to binary, an alternateway is needed to make the connection between ASTs more
Fig. 3. Partial binary AST (ROSE-generated dot graph output).
precise. Inspired by debuggers, line numbers are used in ourtool as the bridge to associate source to binary. When we aredebugging a program, the debugger knows exactly the sourceline and column of the error location. By using the -g optionduring program compilation, the compiler will insert debug-related information into the object file for future reference.Most compilers and debuggers use DWARF (debugging withattributed record format) as the debugging file format toorganize the information for source-level debugging. DWARFcategorizes data into several sections, such as .debug info,.debug frame, etc. The .debug line section stores the linenumber information.
The line number debugging information allows us to decodethe specific DWARF section to map the line number tothe corresponding instruction address. Because line numberinformation in the source AST is already preserved in eachnode, unlike the binary AST, it can be retrieved directly.After line numbers are obtained from both source and binary,connections are built in each direction between the two ASTs.As mentioned in the previous section, a source AST nodenormally links to several binary AST nodes due to the differentmeaning of nodes. Specifically, a statement contains severalinstructions, but an instruction only has one connected sourcelocation. Once the node in the binary AST is associated tothe source location, further analysis can be performed. Forinstance, it is possible to narrow the analysis to a small scopeand collect data such as the instruction count and type in aparticular code fragment, such as function body, loop body,and even a single statement.
B. Generating metrics
The Metric Generator is an important part of the entireframework, which has significant impact on the accuracy ofthe generated model. It receives the ASTs as inputs from theInput Processor to produce metrics for model generation. AnAST traversal is needed to collect and propagate necessaryinformation about the specific structures in the program forappropriate organization of the program representation toprecisely guide model generation. During the AST traversal,additional information is attached to the particular tree node
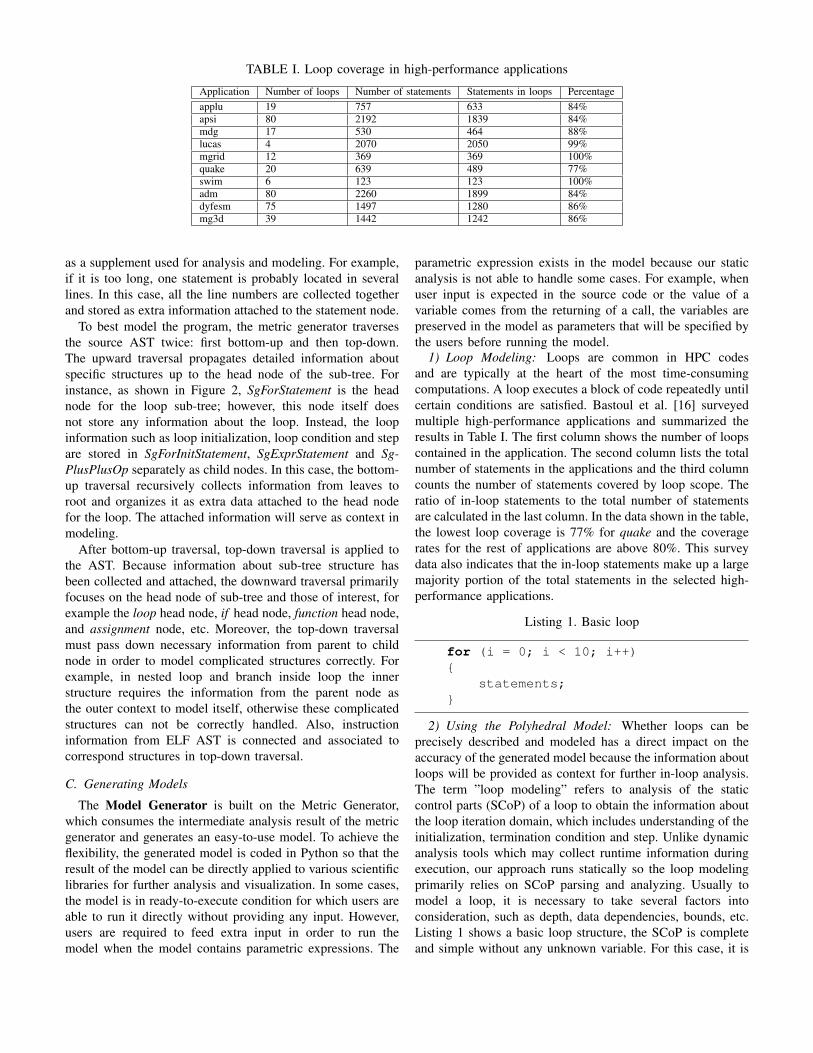
TABLE I. Loop coverage in high-performance applications
Application Number of loops Number of statements Statements in loops Percentageapplu 19 757 633 84%apsi 80 2192 1839 84%mdg 17 530 464 88%lucas 4 2070 2050 99%mgrid 12 369 369 100%quake 20 639 489 77%swim 6 123 123 100%adm 80 2260 1899 84%dyfesm 75 1497 1280 86%mg3d 39 1442 1242 86%
as a supplement used for analysis and modeling. For example,if it is too long, one statement is probably located in severallines. In this case, all the line numbers are collected togetherand stored as extra information attached to the statement node.
To best model the program, the metric generator traversesthe source AST twice: first bottom-up and then top-down.The upward traversal propagates detailed information aboutspecific structures up to the head node of the sub-tree. Forinstance, as shown in Figure 2, SgForStatement is the headnode for the loop sub-tree; however, this node itself doesnot store any information about the loop. Instead, the loopinformation such as loop initialization, loop condition and stepare stored in SgForInitStatement, SgExprStatement and Sg-PlusPlusOp separately as child nodes. In this case, the bottom-up traversal recursively collects information from leaves toroot and organizes it as extra data attached to the head nodefor the loop. The attached information will serve as context inmodeling.
After bottom-up traversal, top-down traversal is applied tothe AST. Because information about sub-tree structure hasbeen collected and attached, the downward traversal primarilyfocuses on the head node of sub-tree and those of interest, forexample the loop head node, if head node, function head node,and assignment node, etc. Moreover, the top-down traversalmust pass down necessary information from parent to childnode in order to model complicated structures correctly. Forexample, in nested loop and branch inside loop the innerstructure requires the information from the parent node asthe outer context to model itself, otherwise these complicatedstructures can not be correctly handled. Also, instructioninformation from ELF AST is connected and associated tocorrespond structures in top-down traversal.
C. Generating Models
The Model Generator is built on the Metric Generator,which consumes the intermediate analysis result of the metricgenerator and generates an easy-to-use model. To achieve theflexibility, the generated model is coded in Python so that theresult of the model can be directly applied to various scientificlibraries for further analysis and visualization. In some cases,the model is in ready-to-execute condition for which users areable to run it directly without providing any input. However,users are required to feed extra input in order to run themodel when the model contains parametric expressions. The
parametric expression exists in the model because our staticanalysis is not able to handle some cases. For example, whenuser input is expected in the source code or the value of avariable comes from the returning of a call, the variables arepreserved in the model as parameters that will be specified bythe users before running the model.
1) Loop Modeling: Loops are common in HPC codesand are typically at the heart of the most time-consumingcomputations. A loop executes a block of code repeatedly untilcertain conditions are satisfied. Bastoul et al. [16] surveyedmultiple high-performance applications and summarized theresults in Table I. The first column shows the number of loopscontained in the application. The second column lists the totalnumber of statements in the applications and the third columncounts the number of statements covered by loop scope. Theratio of in-loop statements to the total number of statementsare calculated in the last column. In the data shown in the table,the lowest loop coverage is 77% for quake and the coveragerates for the rest of applications are above 80%. This surveydata also indicates that the in-loop statements make up a largemajority portion of the total statements in the selected high-performance applications.
Listing 1. Basic loop
for (i = 0; i < 10; i++){
statements;}
2) Using the Polyhedral Model: Whether loops can beprecisely described and modeled has a direct impact on theaccuracy of the generated model because the information aboutloops will be provided as context for further in-loop analysis.The term ”loop modeling” refers to analysis of the staticcontrol parts (SCoP) of a loop to obtain the information aboutthe loop iteration domain, which includes understanding of theinitialization, termination condition and step. Unlike dynamicanalysis tools which may collect runtime information duringexecution, our approach runs statically so the loop modelingprimarily relies on SCoP parsing and analyzing. Usually tomodel a loop, it is necessary to take several factors intoconsideration, such as depth, data dependencies, bounds, etc.Listing 1 shows a basic loop structure, the SCoP is completeand simple without any unknown variable. For this case, it is
(a) Polyhedral representation for double-nestedloop
(b) Polyhedral representation with if constraint
(c) if constraint causing holes in the polyhedralarea
(d) Exceptions in polyhedral modeling
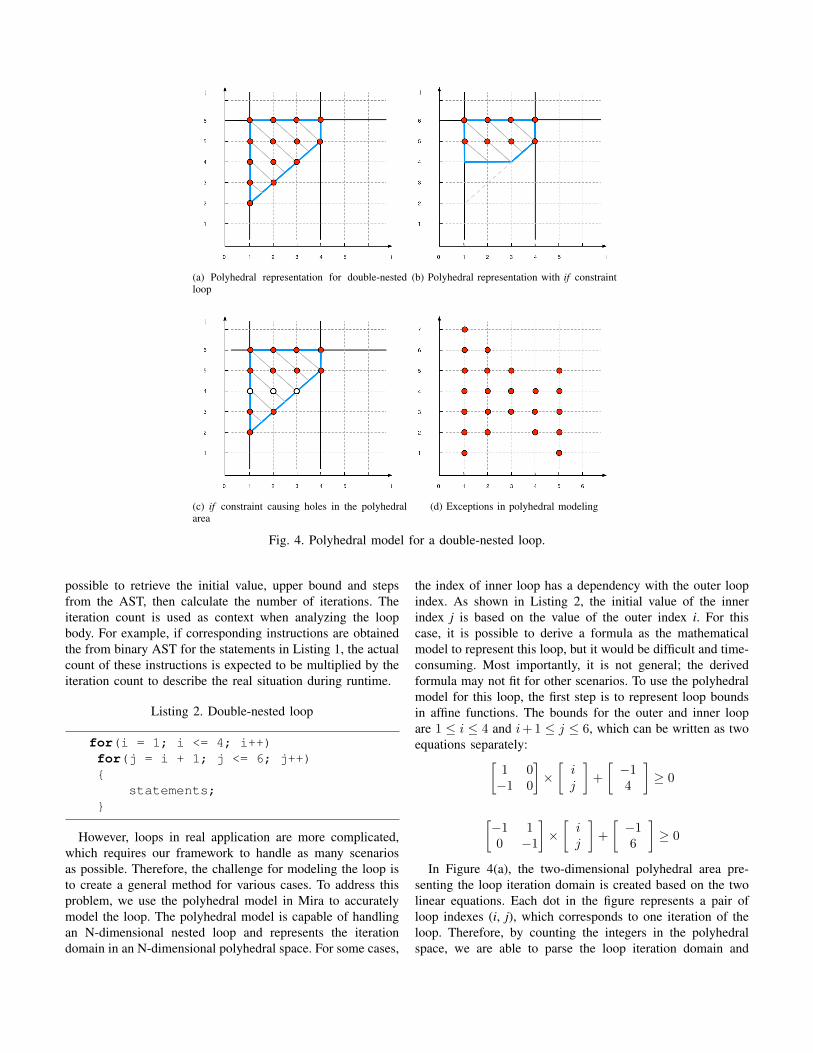
Fig. 4. Polyhedral model for a double-nested loop.
possible to retrieve the initial value, upper bound and stepsfrom the AST, then calculate the number of iterations. Theiteration count is used as context when analyzing the loopbody. For example, if corresponding instructions are obtainedthe from binary AST for the statements in Listing 1, the actualcount of these instructions is expected to be multiplied by theiteration count to describe the real situation during runtime.
Listing 2. Double-nested loop
for(i = 1; i <= 4; i++)for(j = i + 1; j <= 6; j++){
statements;}
However, loops in real application are more complicated,which requires our framework to handle as many scenariosas possible. Therefore, the challenge for modeling the loop isto create a general method for various cases. To address thisproblem, we use the polyhedral model in Mira to accuratelymodel the loop. The polyhedral model is capable of handlingan N-dimensional nested loop and represents the iterationdomain in an N-dimensional polyhedral space. For some cases,
the index of inner loop has a dependency with the outer loopindex. As shown in Listing 2, the initial value of the innerindex j is based on the value of the outer index i. For thiscase, it is possible to derive a formula as the mathematicalmodel to represent this loop, but it would be difficult and time-consuming. Most importantly, it is not general; the derivedformula may not fit for other scenarios. To use the polyhedralmodel for this loop, the first step is to represent loop boundsin affine functions. The bounds for the outer and inner loopare 1 ≤ i ≤ 4 and i+1 ≤ j ≤ 6, which can be written as twoequations separately:[
1 0−1 0
]×[
ij
]+
[−14
]≥ 0
[−1 10 −1
]×
[ij
]+
[−16
]≥ 0
In Figure 4(a), the two-dimensional polyhedral area pre-senting the loop iteration domain is created based on the twolinear equations. Each dot in the figure represents a pair ofloop indexes (i, j), which corresponds to one iteration of theloop. Therefore, by counting the integers in the polyhedralspace, we are able to parse the loop iteration domain and
obtain the iteration times. For loops with more complicatedSCoP, such as the ones contain variables instead of concretenumerical values, the polyhedral model is also applicable.When modeling loops with unknown variables, Mira usesthe polyhedral model to generate a parametric expressionrepresenting the iteration domain, which can be changed byspecifying different values to the input. Mira maintains thegenerated parametric expressions and uses as context in thefollowing analysis. In addition, the unknown variables in loopSCoP are preserved as parameters until the parametric modelis generated. With the parametric model, it is not necessary forthe users to re-generate the model for different values of theparameters. Instead, they just have to adjust the inputs for themodel and run the Python code to produce a concrete value.
Listing 3. Exception in polyhedral modeling
for(i = 1; i <= 5; i++)for(j = min(6 - i, 3);
j <= max(8 - i, i); j++){statements;
}
There are exceptions that the polyhedral model cannot handle.For the code snippet in Listing 3, the SCoP of the loopforms a non-convex set (Figure 4(d)) which is not handledby the polyhedral model. Another problem in this code isthat the loop initial value and loop bound depend on thereturn values of function calls. For static analysis to track andobtain the such values, more complex interprocedural analysisis required, which is planned as part of our future work.
Listing 4. Loop with if constraint
for(i = 1; i <= 4; i++)for(j = i + 1; j <= 6; j++){if(j > 4){statements;
}}
3) Branches: In addition to loops, branch statements arealso common structures. In scientific applications, branchstatements are frequently used to verify the intermediate outputduring the computing. Branch statements can be handled bythe information retrieved from the AST. However, it com-plicates the analysis when the branch statements reside in aloop. In Listing 4, the if constraint j > 4 is introduced intothe previous code snippet. The number of execution times ofthe statement inside the if depends on the branch condition.In our analysis, the polyhedral model of a loop is kept andpassed down to the inner scope. Thus the if node has theinformation of its outer scope. Because the loop conditionscombined with branch conditions form a polyhedral space
as well, shown in Figure 4(b), the polyhedral representationis still able to model this scenario by adding the branchconstraint and regenerate a new polyhedral model for the ifnode. Comparing Figure 4(b) with Figure 4(a), it is obviousthat the iteration domain becomes smaller and the numberof integers decreases after introducing the constraint, whichindicates the execution times of statements in the branch islimited by the if condition.
Listing 5. if constraint breaks polyhedral space
for(i = 1; i <= 4; i++)for(j = i + 1; j <= 6; j++){if(j % 4 != 0){statements;}
}
However, some branch constraints might break the definitionof a convex set that the polyhedral model is not applicable.For the code in Listing 5, the if condition excludes severalintegers in the polyhedral space causing ”holes” in the iterationspace as shown in Figure (c). The excluded integers break theintegrity of the space so that it no longer satisfies the definitionof the convex set, thus the polyhedral model is not available forthis particular circumstance. In this case, the true branch of theif statement raises the problem however the false branch stillsatisfies the polyhedral model. Thus we can use the followingequation to solve:
Counttrue branch = Countloop total − Countfalse branch
Because the counter of the outer loop and false branch both canbe expressed by the polyhedral model, using either concretevalue or parametric expression, so the count of the true branchis obtained. The generality of the polyhedral model makes itsuitable for most common cases in real applications, howeverthere are some cases that cannot be handled by the polyhedralmodel or even static analysis. For such circumstances, weprovide users an option to annotate branches or the loopswhich Mira is not able to handle statically.
4) Annotation: There are loop and branch cases that weare not able to process in a static way, such as conditionalsinvolving loop index-unrelated variables or external functioncalls used for computing loop initial values or loop/branchconditions. Mira accepts user annotations to address suchproblems. We designed three types of annotation: an estimatedpercentage or a numerical value representing the proportionof iterations branch may take inside a loop or the numberof iterations, which simplifies the loop/branch modeling; avariable used as initial value or condition to complete thepolyhedral model; or a flag to indicate that a structure ora scope should be skipped. To annotate the code, users justneed to put the information in a ”#pragma” directive in thisformat: #pragma @Annotation information. Mira processesthe annotations during metric generation.
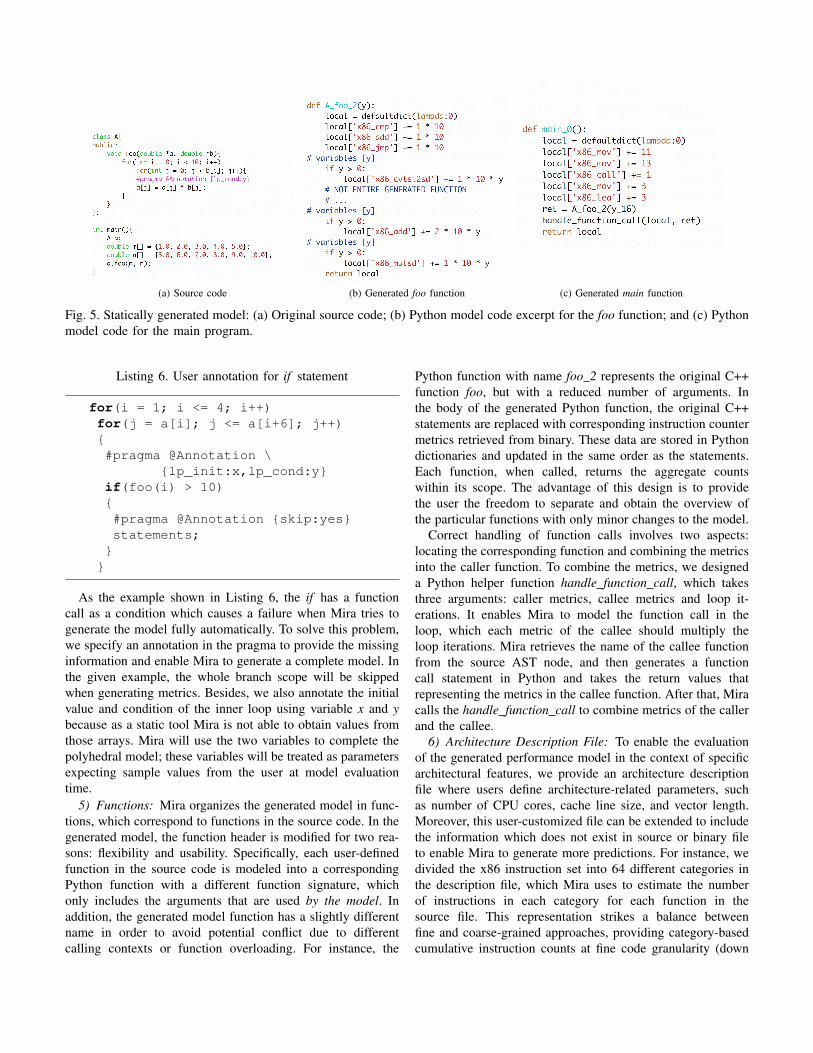
(a) Source code (b) Generated foo function (c) Generated main function
Fig. 5. Statically generated model: (a) Original source code; (b) Python model code excerpt for the foo function; and (c) Pythonmodel code for the main program.
Listing 6. User annotation for if statement
for(i = 1; i <= 4; i++)for(j = a[i]; j <= a[i+6]; j++){#pragma @Annotation \
{lp_init:x,lp_cond:y}if(foo(i) > 10){#pragma @Annotation {skip:yes}statements;
}}
As the example shown in Listing 6, the if has a functioncall as a condition which causes a failure when Mira tries togenerate the model fully automatically. To solve this problem,we specify an annotation in the pragma to provide the missinginformation and enable Mira to generate a complete model. Inthe given example, the whole branch scope will be skippedwhen generating metrics. Besides, we also annotate the initialvalue and condition of the inner loop using variable x and ybecause as a static tool Mira is not able to obtain values fromthose arrays. Mira will use the two variables to complete thepolyhedral model; these variables will be treated as parametersexpecting sample values from the user at model evaluationtime.
5) Functions: Mira organizes the generated model in func-tions, which correspond to functions in the source code. In thegenerated model, the function header is modified for two rea-sons: flexibility and usability. Specifically, each user-definedfunction in the source code is modeled into a correspondingPython function with a different function signature, whichonly includes the arguments that are used by the model. Inaddition, the generated model function has a slightly differentname in order to avoid potential conflict due to differentcalling contexts or function overloading. For instance, the
Python function with name foo 2 represents the original C++function foo, but with a reduced number of arguments. Inthe body of the generated Python function, the original C++statements are replaced with corresponding instruction countermetrics retrieved from binary. These data are stored in Pythondictionaries and updated in the same order as the statements.Each function, when called, returns the aggregate countswithin its scope. The advantage of this design is to providethe user the freedom to separate and obtain the overview ofthe particular functions with only minor changes to the model.
Correct handling of function calls involves two aspects:locating the corresponding function and combining the metricsinto the caller function. To combine the metrics, we designeda Python helper function handle function call, which takesthree arguments: caller metrics, callee metrics and loop it-erations. It enables Mira to model the function call in theloop, which each metric of the callee should multiply theloop iterations. Mira retrieves the name of the callee functionfrom the source AST node, and then generates a functioncall statement in Python and takes the return values thatrepresenting the metrics in the callee function. After that, Miracalls the handle function call to combine metrics of the callerand the callee.
6) Architecture Description File: To enable the evaluationof the generated performance model in the context of specificarchitectural features, we provide an architecture descriptionfile where users define architecture-related parameters, suchas number of CPU cores, cache line size, and vector length.Moreover, this user-customized file can be extended to includethe information which does not exist in source or binary fileto enable Mira to generate more predictions. For instance, wedivided the x86 instruction set into 64 different categories inthe description file, which Mira uses to estimate the numberof instructions in each category for each function in thesource file. This representation strikes a balance betweenfine and coarse-grained approaches, providing category-basedcumulative instruction counts at fine code granularity (down
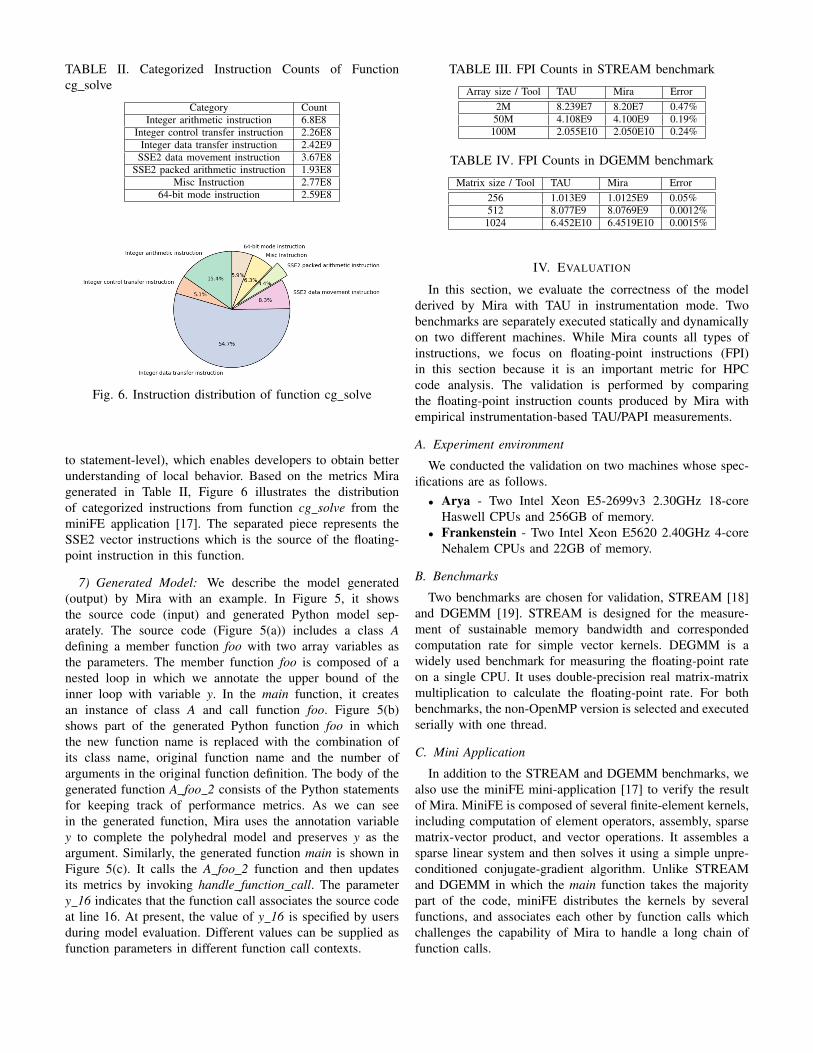
TABLE II. Categorized Instruction Counts of Functioncg solve
Category CountInteger arithmetic instruction 6.8E8
Integer control transfer instruction 2.26E8Integer data transfer instruction 2.42E9
SSE2 data movement instruction 3.67E8SSE2 packed arithmetic instruction 1.93E8
Misc Instruction 2.77E864-bit mode instruction 2.59E8
Fig. 6. Instruction distribution of function cg solve
to statement-level), which enables developers to obtain betterunderstanding of local behavior. Based on the metrics Miragenerated in Table II, Figure 6 illustrates the distributionof categorized instructions from function cg solve from theminiFE application [17]. The separated piece represents theSSE2 vector instructions which is the source of the floating-point instruction in this function.
7) Generated Model: We describe the model generated(output) by Mira with an example. In Figure 5, it showsthe source code (input) and generated Python model sep-arately. The source code (Figure 5(a)) includes a class Adefining a member function foo with two array variables asthe parameters. The member function foo is composed of anested loop in which we annotate the upper bound of theinner loop with variable y. In the main function, it createsan instance of class A and call function foo. Figure 5(b)shows part of the generated Python function foo in whichthe new function name is replaced with the combination ofits class name, original function name and the number ofarguments in the original function definition. The body of thegenerated function A foo 2 consists of the Python statementsfor keeping track of performance metrics. As we can seein the generated function, Mira uses the annotation variabley to complete the polyhedral model and preserves y as theargument. Similarly, the generated function main is shown inFigure 5(c). It calls the A foo 2 function and then updatesits metrics by invoking handle function call. The parametery 16 indicates that the function call associates the source codeat line 16. At present, the value of y 16 is specified by usersduring model evaluation. Different values can be supplied asfunction parameters in different function call contexts.
TABLE III. FPI Counts in STREAM benchmark
Array size / Tool TAU Mira Error2M 8.239E7 8.20E7 0.47%
50M 4.108E9 4.100E9 0.19%100M 2.055E10 2.050E10 0.24%
TABLE IV. FPI Counts in DGEMM benchmark
Matrix size / Tool TAU Mira Error256 1.013E9 1.0125E9 0.05%512 8.077E9 8.0769E9 0.0012%
1024 6.452E10 6.4519E10 0.0015%
IV. EVALUATION
In this section, we evaluate the correctness of the modelderived by Mira with TAU in instrumentation mode. Twobenchmarks are separately executed statically and dynamicallyon two different machines. While Mira counts all types ofinstructions, we focus on floating-point instructions (FPI)in this section because it is an important metric for HPCcode analysis. The validation is performed by comparingthe floating-point instruction counts produced by Mira withempirical instrumentation-based TAU/PAPI measurements.
A. Experiment environment
We conducted the validation on two machines whose spec-ifications are as follows.
• Arya - Two Intel Xeon E5-2699v3 2.30GHz 18-coreHaswell CPUs and 256GB of memory.
• Frankenstein - Two Intel Xeon E5620 2.40GHz 4-coreNehalem CPUs and 22GB of memory.
B. Benchmarks
Two benchmarks are chosen for validation, STREAM [18]and DGEMM [19]. STREAM is designed for the measure-ment of sustainable memory bandwidth and correspondedcomputation rate for simple vector kernels. DEGMM is awidely used benchmark for measuring the floating-point rateon a single CPU. It uses double-precision real matrix-matrixmultiplication to calculate the floating-point rate. For bothbenchmarks, the non-OpenMP version is selected and executedserially with one thread.
C. Mini Application
In addition to the STREAM and DGEMM benchmarks, wealso use the miniFE mini-application [17] to verify the resultof Mira. MiniFE is composed of several finite-element kernels,including computation of element operators, assembly, sparsematrix-vector product, and vector operations. It assembles asparse linear system and then solves it using a simple unpre-conditioned conjugate-gradient algorithm. Unlike STREAMand DGEMM in which the main function takes the majoritypart of the code, miniFE distributes the kernels by severalfunctions, and associates each other by function calls whichchallenges the capability of Mira to handle a long chain offunction calls.
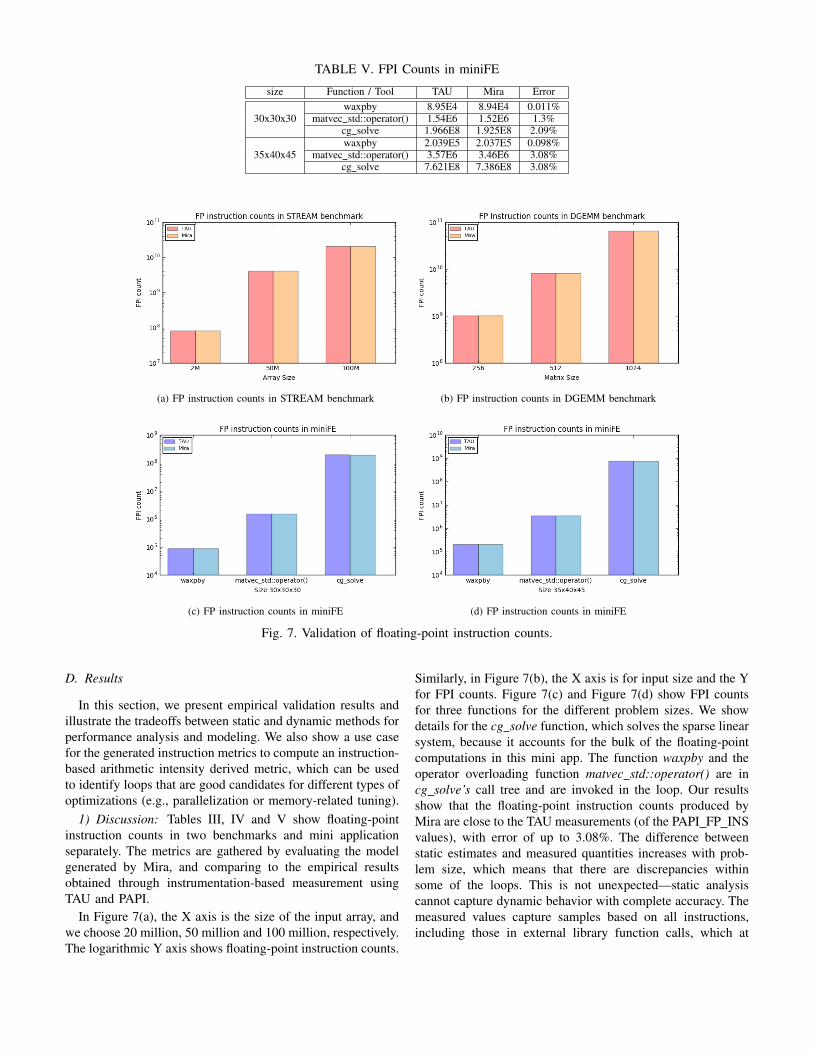
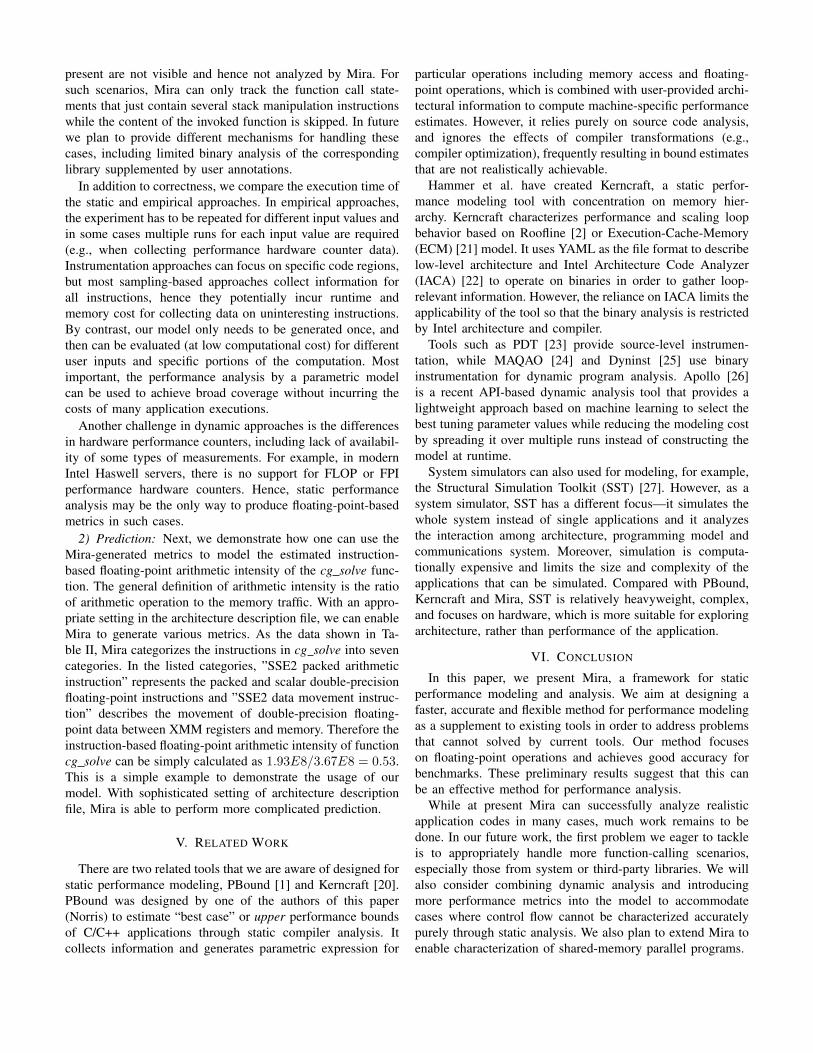
TABLE V. FPI Counts in miniFE
size Function / Tool TAU Mira Errorwaxpby 8.95E4 8.94E4 0.011%
30x30x30 matvec std::operator() 1.54E6 1.52E6 1.3%cg solve 1.966E8 1.925E8 2.09%waxpby 2.039E5 2.037E5 0.098%
35x40x45 matvec std::operator() 3.57E6 3.46E6 3.08%cg solve 7.621E8 7.386E8 3.08%
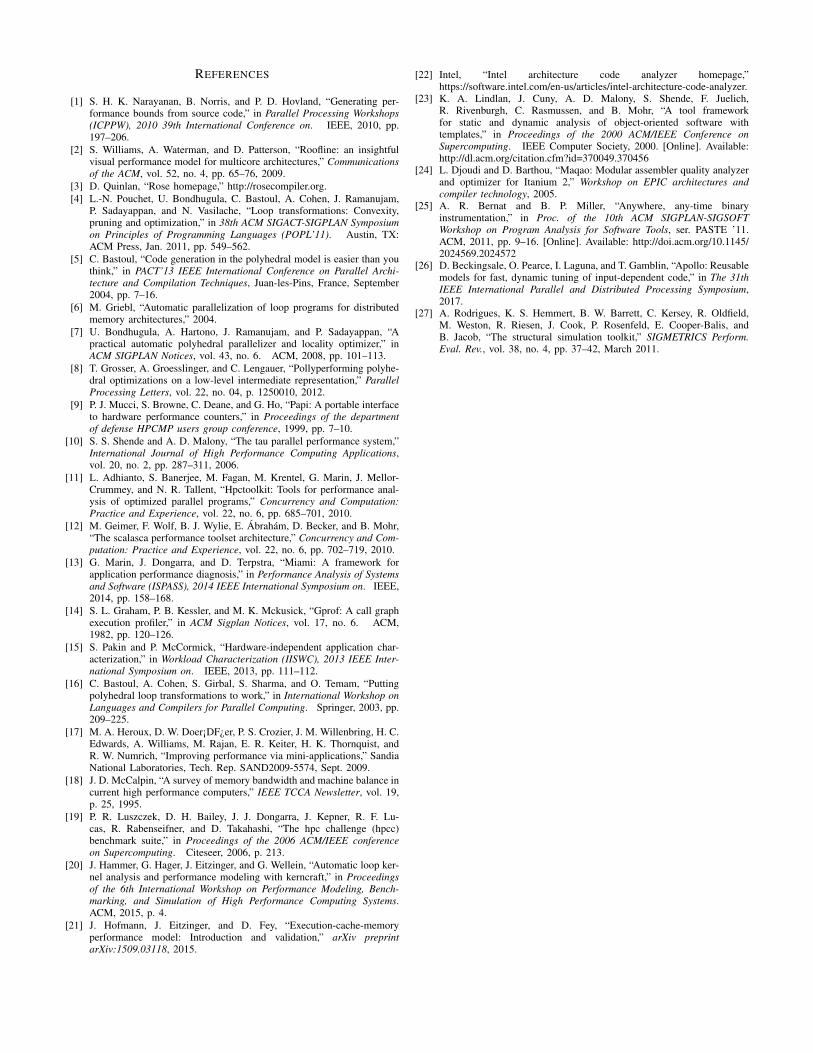
(a) FP instruction counts in STREAM benchmark (b) FP instruction counts in DGEMM benchmark
(c) FP instruction counts in miniFE (d) FP instruction counts in miniFE
Fig. 7. Validation of floating-point instruction counts.
D. Results
In this section, we present empirical validation results andillustrate the tradeoffs between static and dynamic methods forperformance analysis and modeling. We also show a use casefor the generated instruction metrics to compute an instruction-based arithmetic intensity derived metric, which can be usedto identify loops that are good candidates for different types ofoptimizations (e.g., parallelization or memory-related tuning).
1) Discussion: Tables III, IV and V show floating-pointinstruction counts in two benchmarks and mini applicationseparately. The metrics are gathered by evaluating the modelgenerated by Mira, and comparing to the empirical resultsobtained through instrumentation-based measurement usingTAU and PAPI.
In Figure 7(a), the X axis is the size of the input array, andwe choose 20 million, 50 million and 100 million, respectively.The logarithmic Y axis shows floating-point instruction counts.
Similarly, in Figure 7(b), the X axis is for input size and the Yfor FPI counts. Figure 7(c) and Figure 7(d) show FPI countsfor three functions for the different problem sizes. We showdetails for the cg solve function, which solves the sparse linearsystem, because it accounts for the bulk of the floating-pointcomputations in this mini app. The function waxpby and theoperator overloading function matvec std::operator() are incg solve’s call tree and are invoked in the loop. Our resultsshow that the floating-point instruction counts produced byMira are close to the TAU measurements (of the PAPI FP INSvalues), with error of up to 3.08%. The difference betweenstatic estimates and measured quantities increases with prob-lem size, which means that there are discrepancies withinsome of the loops. This is not unexpected—static analysiscannot capture dynamic behavior with complete accuracy. Themeasured values capture samples based on all instructions,including those in external library function calls, which at
present are not visible and hence not analyzed by Mira. Forsuch scenarios, Mira can only track the function call state-ments that just contain several stack manipulation instructionswhile the content of the invoked function is skipped. In futurewe plan to provide different mechanisms for handling thesecases, including limited binary analysis of the correspondinglibrary supplemented by user annotations.
In addition to correctness, we compare the execution time ofthe static and empirical approaches. In empirical approaches,the experiment has to be repeated for different input values andin some cases multiple runs for each input value are required(e.g., when collecting performance hardware counter data).Instrumentation approaches can focus on specific code regions,but most sampling-based approaches collect information forall instructions, hence they potentially incur runtime andmemory cost for collecting data on uninteresting instructions.By contrast, our model only needs to be generated once, andthen can be evaluated (at low computational cost) for differentuser inputs and specific portions of the computation. Mostimportant, the performance analysis by a parametric modelcan be used to achieve broad coverage without incurring thecosts of many application executions.
Another challenge in dynamic approaches is the differencesin hardware performance counters, including lack of availabil-ity of some types of measurements. For example, in modernIntel Haswell servers, there is no support for FLOP or FPIperformance hardware counters. Hence, static performanceanalysis may be the only way to produce floating-point-basedmetrics in such cases.
2) Prediction: Next, we demonstrate how one can use theMira-generated metrics to model the estimated instruction-based floating-point arithmetic intensity of the cg solve func-tion. The general definition of arithmetic intensity is the ratioof arithmetic operation to the memory traffic. With an appro-priate setting in the architecture description file, we can enableMira to generate various metrics. As the data shown in Ta-ble II, Mira categorizes the instructions in cg solve into sevencategories. In the listed categories, ”SSE2 packed arithmeticinstruction” represents the packed and scalar double-precisionfloating-point instructions and ”SSE2 data movement instruc-tion” describes the movement of double-precision floating-point data between XMM registers and memory. Therefore theinstruction-based floating-point arithmetic intensity of functioncg solve can be simply calculated as 1.93E8/3.67E8 = 0.53.This is a simple example to demonstrate the usage of ourmodel. With sophisticated setting of architecture descriptionfile, Mira is able to perform more complicated prediction.
V. RELATED WORK
There are two related tools that we are aware of designed forstatic performance modeling, PBound [1] and Kerncraft [20].PBound was designed by one of the authors of this paper(Norris) to estimate “best case” or upper performance boundsof C/C++ applications through static compiler analysis. Itcollects information and generates parametric expression for
particular operations including memory access and floating-point operations, which is combined with user-provided archi-tectural information to compute machine-specific performanceestimates. However, it relies purely on source code analysis,and ignores the effects of compiler transformations (e.g.,compiler optimization), frequently resulting in bound estimatesthat are not realistically achievable.
Hammer et al. have created Kerncraft, a static perfor-mance modeling tool with concentration on memory hier-archy. Kerncraft characterizes performance and scaling loopbehavior based on Roofline [2] or Execution-Cache-Memory(ECM) [21] model. It uses YAML as the file format to describelow-level architecture and Intel Architecture Code Analyzer(IACA) [22] to operate on binaries in order to gather loop-relevant information. However, the reliance on IACA limits theapplicability of the tool so that the binary analysis is restrictedby Intel architecture and compiler.
Tools such as PDT [23] provide source-level instrumen-tation, while MAQAO [24] and Dyninst [25] use binaryinstrumentation for dynamic program analysis. Apollo [26]is a recent API-based dynamic analysis tool that provides alightweight approach based on machine learning to select thebest tuning parameter values while reducing the modeling costby spreading it over multiple runs instead of constructing themodel at runtime.
System simulators can also used for modeling, for example,the Structural Simulation Toolkit (SST) [27]. However, as asystem simulator, SST has a different focus—it simulates thewhole system instead of single applications and it analyzesthe interaction among architecture, programming model andcommunications system. Moreover, simulation is computa-tionally expensive and limits the size and complexity of theapplications that can be simulated. Compared with PBound,Kerncraft and Mira, SST is relatively heavyweight, complex,and focuses on hardware, which is more suitable for exploringarchitecture, rather than performance of the application.
VI. CONCLUSION
In this paper, we present Mira, a framework for staticperformance modeling and analysis. We aim at designing afaster, accurate and flexible method for performance modelingas a supplement to existing tools in order to address problemsthat cannot solved by current tools. Our method focuseson floating-point operations and achieves good accuracy forbenchmarks. These preliminary results suggest that this canbe an effective method for performance analysis.
While at present Mira can successfully analyze realisticapplication codes in many cases, much work remains to bedone. In our future work, the first problem we eager to tackleis to appropriately handle more function-calling scenarios,especially those from system or third-party libraries. We willalso consider combining dynamic analysis and introducingmore performance metrics into the model to accommodatecases where control flow cannot be characterized accuratelypurely through static analysis. We also plan to extend Mira toenable characterization of shared-memory parallel programs.
REFERENCES
[1] S. H. K. Narayanan, B. Norris, and P. D. Hovland, “Generating per-formance bounds from source code,” in Parallel Processing Workshops(ICPPW), 2010 39th International Conference on. IEEE, 2010, pp.197–206.
[2] S. Williams, A. Waterman, and D. Patterson, “Roofline: an insightfulvisual performance model for multicore architectures,” Communicationsof the ACM, vol. 52, no. 4, pp. 65–76, 2009.
[3] D. Quinlan, “Rose homepage,” http://rosecompiler.org.[4] L.-N. Pouchet, U. Bondhugula, C. Bastoul, A. Cohen, J. Ramanujam,
P. Sadayappan, and N. Vasilache, “Loop transformations: Convexity,pruning and optimization,” in 38th ACM SIGACT-SIGPLAN Symposiumon Principles of Programming Languages (POPL’11). Austin, TX:ACM Press, Jan. 2011, pp. 549–562.
[5] C. Bastoul, “Code generation in the polyhedral model is easier than youthink,” in PACT’13 IEEE International Conference on Parallel Archi-tecture and Compilation Techniques, Juan-les-Pins, France, September2004, pp. 7–16.
[6] M. Griebl, “Automatic parallelization of loop programs for distributedmemory architectures,” 2004.
[7] U. Bondhugula, A. Hartono, J. Ramanujam, and P. Sadayappan, “Apractical automatic polyhedral parallelizer and locality optimizer,” inACM SIGPLAN Notices, vol. 43, no. 6. ACM, 2008, pp. 101–113.
[8] T. Grosser, A. Groesslinger, and C. Lengauer, “Pollyperforming polyhe-dral optimizations on a low-level intermediate representation,” ParallelProcessing Letters, vol. 22, no. 04, p. 1250010, 2012.
[9] P. J. Mucci, S. Browne, C. Deane, and G. Ho, “Papi: A portable interfaceto hardware performance counters,” in Proceedings of the departmentof defense HPCMP users group conference, 1999, pp. 7–10.
[10] S. S. Shende and A. D. Malony, “The tau parallel performance system,”International Journal of High Performance Computing Applications,vol. 20, no. 2, pp. 287–311, 2006.
[11] L. Adhianto, S. Banerjee, M. Fagan, M. Krentel, G. Marin, J. Mellor-Crummey, and N. R. Tallent, “Hpctoolkit: Tools for performance anal-ysis of optimized parallel programs,” Concurrency and Computation:Practice and Experience, vol. 22, no. 6, pp. 685–701, 2010.
[12] M. Geimer, F. Wolf, B. J. Wylie, E. Abraham, D. Becker, and B. Mohr,“The scalasca performance toolset architecture,” Concurrency and Com-putation: Practice and Experience, vol. 22, no. 6, pp. 702–719, 2010.
[13] G. Marin, J. Dongarra, and D. Terpstra, “Miami: A framework forapplication performance diagnosis,” in Performance Analysis of Systemsand Software (ISPASS), 2014 IEEE International Symposium on. IEEE,2014, pp. 158–168.
[14] S. L. Graham, P. B. Kessler, and M. K. Mckusick, “Gprof: A call graphexecution profiler,” in ACM Sigplan Notices, vol. 17, no. 6. ACM,1982, pp. 120–126.
[15] S. Pakin and P. McCormick, “Hardware-independent application char-acterization,” in Workload Characterization (IISWC), 2013 IEEE Inter-national Symposium on. IEEE, 2013, pp. 111–112.
[16] C. Bastoul, A. Cohen, S. Girbal, S. Sharma, and O. Temam, “Puttingpolyhedral loop transformations to work,” in International Workshop onLanguages and Compilers for Parallel Computing. Springer, 2003, pp.209–225.
[17] M. A. Heroux, D. W. Doer¡DF¿er, P. S. Crozier, J. M. Willenbring, H. C.Edwards, A. Williams, M. Rajan, E. R. Keiter, H. K. Thornquist, andR. W. Numrich, “Improving performance via mini-applications,” SandiaNational Laboratories, Tech. Rep. SAND2009-5574, Sept. 2009.
[18] J. D. McCalpin, “A survey of memory bandwidth and machine balance incurrent high performance computers,” IEEE TCCA Newsletter, vol. 19,p. 25, 1995.
[19] P. R. Luszczek, D. H. Bailey, J. J. Dongarra, J. Kepner, R. F. Lu-cas, R. Rabenseifner, and D. Takahashi, “The hpc challenge (hpcc)benchmark suite,” in Proceedings of the 2006 ACM/IEEE conferenceon Supercomputing. Citeseer, 2006, p. 213.
[20] J. Hammer, G. Hager, J. Eitzinger, and G. Wellein, “Automatic loop ker-nel analysis and performance modeling with kerncraft,” in Proceedingsof the 6th International Workshop on Performance Modeling, Bench-marking, and Simulation of High Performance Computing Systems.ACM, 2015, p. 4.
[21] J. Hofmann, J. Eitzinger, and D. Fey, “Execution-cache-memoryperformance model: Introduction and validation,” arXiv preprintarXiv:1509.03118, 2015.
[22] Intel, “Intel architecture code analyzer homepage,”https://software.intel.com/en-us/articles/intel-architecture-code-analyzer.
[23] K. A. Lindlan, J. Cuny, A. D. Malony, S. Shende, F. Juelich,R. Rivenburgh, C. Rasmussen, and B. Mohr, “A tool frameworkfor static and dynamic analysis of object-oriented software withtemplates,” in Proceedings of the 2000 ACM/IEEE Conference onSupercomputing. IEEE Computer Society, 2000. [Online]. Available:http://dl.acm.org/citation.cfm?id=370049.370456
[24] L. Djoudi and D. Barthou, “Maqao: Modular assembler quality analyzerand optimizer for Itanium 2,” Workshop on EPIC architectures andcompiler technology, 2005.
[25] A. R. Bernat and B. P. Miller, “Anywhere, any-time binaryinstrumentation,” in Proc. of the 10th ACM SIGPLAN-SIGSOFTWorkshop on Program Analysis for Software Tools, ser. PASTE ’11.ACM, 2011, pp. 9–16. [Online]. Available: http://doi.acm.org/10.1145/2024569.2024572
[26] D. Beckingsale, O. Pearce, I. Laguna, and T. Gamblin, “Apollo: Reusablemodels for fast, dynamic tuning of input-dependent code,” in The 31thIEEE International Parallel and Distributed Processing Symposium,2017.
[27] A. Rodrigues, K. S. Hemmert, B. W. Barrett, C. Kersey, R. Oldfield,M. Weston, R. Riesen, J. Cook, P. Rosenfeld, E. Cooper-Balis, andB. Jacob, “The structural simulation toolkit,” SIGMETRICS Perform.Eval. Rev., vol. 38, no. 4, pp. 37–42, March 2011.