Minnygap Wind Farm - Ecology Consult breeding bird r… · surveys presented in the ES included...
30
Minnygap Wind Farm: Post-construction Phase Breeding Bird Surveys 2018 (Year 2) Clockwise from top left: snipe, black grouse, skylark and meadow pipit © Steve Percival Ecology Consulting Report to Renewable Energy Systems Ltd Steve Percival, Tracey Percival and Tom Lowe Ecology Consulting, Swallow Ridge Barn, Old Cassop, Durham DH6 4QB Email: [email protected]
Transcript of Minnygap Wind Farm - Ecology Consult breeding bird r… · surveys presented in the ES included...

Minnygap Wind Farm: Post-construction Phase Breeding Bird Surveys 2018 (Year 2)
Clockwise from top left: snipe, black grouse, skylark and meadow pipit © Steve Percival
Ecology Consulting Report to Renewable Energy Systems Ltd
Steve Percival, Tracey Percival and Tom Lowe
Ecology Consulting, Swallow Ridge Barn, Old Cassop, Durham DH6 4QB
Email: [email protected]
Minnygap Wind Farm Breeding Bird Surveys 2018
Ecology Consulting
2
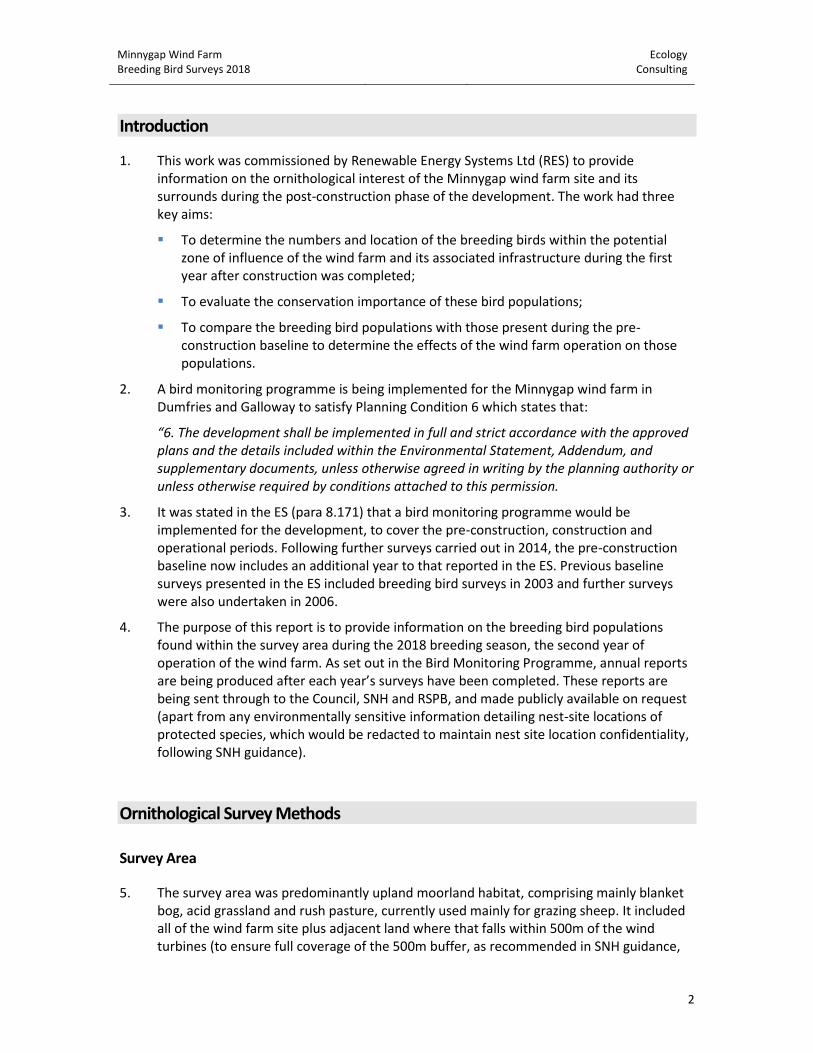
Introduction
1. This work was commissioned by Renewable Energy Systems Ltd (RES) to provide information on the ornithological interest of the Minnygap wind farm site and its surrounds during the post-construction phase of the development. The work had three key aims:
▪ To determine the numbers and location of the breeding birds within the potential zone of influence of the wind farm and its associated infrastructure during the first year after construction was completed;
▪ To evaluate the conservation importance of these bird populations;
▪ To compare the breeding bird populations with those present during the pre-construction baseline to determine the effects of the wind farm operation on those populations.
2. A bird monitoring programme is being implemented for the Minnygap wind farm in Dumfries and Galloway to satisfy Planning Condition 6 which states that:
“6. The development shall be implemented in full and strict accordance with the approved plans and the details included within the Environmental Statement, Addendum, and supplementary documents, unless otherwise agreed in writing by the planning authority or unless otherwise required by conditions attached to this permission.
3. It was stated in the ES (para 8.171) that a bird monitoring programme would be implemented for the development, to cover the pre-construction, construction and operational periods. Following further surveys carried out in 2014, the pre-construction baseline now includes an additional year to that reported in the ES. Previous baseline surveys presented in the ES included breeding bird surveys in 2003 and further surveys were also undertaken in 2006.
4. The purpose of this report is to provide information on the breeding bird populations found within the survey area during the 2018 breeding season, the second year of operation of the wind farm. As set out in the Bird Monitoring Programme, annual reports are being produced after each year’s surveys have been completed. These reports are being sent through to the Council, SNH and RSPB, and made publicly available on request (apart from any environmentally sensitive information detailing nest-site locations of protected species, which would be redacted to maintain nest site location confidentiality, following SNH guidance).
Ornithological Survey Methods
Survey Area
5. The survey area was predominantly upland moorland habitat, comprising mainly blanket bog, acid grassland and rush pasture, currently used mainly for grazing sheep. It included all of the wind farm site plus adjacent land where that falls within 500m of the wind turbines (to ensure full coverage of the 500m buffer, as recommended in SNH guidance,

Minnygap Wind Farm Breeding Bird Surveys 2018
Ecology Consulting
3
Whitfield et al. 2010, SNH 2014), plus an additional area outside this zone, as agreed for the Bird Monitoring Programme. It covered an area of 10.4km2. All of this area was covered by the pre-construction baseline survey in 2014, in 2016 during construction, and in 2017 in the first post-construction year. It includes a substantial reference area as well as the potential impact zone of the wind farm to facilitate a gradient analysis of bird distribution in relation to distance from the wind turbines. Its extent and the location of the wind turbines are shown in Figure 1.
6. The survey areas covered in 2003 and 2006 were not as extensive as in 2014, 2016, 2017 and 2018, so the comparisons with these years were limited to the areas covered in all six years (the ‘core’ survey area - see Figure 1).
7. Tree planting of an area on the southern edge of the survey area was carried out between the 2017 and 2018 surveys (together with associated deer fencing to protect the young trees), as part of the wind farm compensatory planting. Given the habitat change in this area, this has been excluded from the statistically analyses to avoid the possibility of any effects of the wind farm being compounded by the new forest planting.
Breeding Bird Survey
8. Breeding bird surveys were carried out during 2018, following the standard JNCC method devised by Brown and Shepherd (1993) for open upland habitats but with an additional survey visit giving three in total (as set out in the agreed Minnygap wind farm bird monitoring programme, to maintain comparability across all of the pre-construction baseline). These survey visits were made on 21-22 April, 16-17 May and 20-21 June 2018. In order to standardise the number of visits across all of the pre-construction and construction phase surveys, the previous 2014 and 2016 data were re-analysed using the first three survey visits (made during April-June) and excluding the additional fourth visits that were carried out in July in both of those years.
9. The Brown and Shepherd survey involved mapping all bird locations and behaviour to 1:10,000 scale, using the standard Common Birds Census notation. Supplementary behavioural observations and notes were made to determine breeding locations as accurately as possible. The area was subdivided into 0.25km2 areas. Birds were recorded systematically for 20-30 minutes in each of these areas, standardising the search effort per unit area. A route was chosen to ensure that all parts of the study area were covered to within 100m of the observer. The surveys were carried out avoiding strong winds, heavy rain, fog and low cloud. Birds were located by walking, listening and scanning by eye and with binoculars. Particular attention was given to ridges, pools, flushes and other topographical and vegetation features. Birds were considered to be breeding if singing, displaying, carrying nest material, nests or young found, repetitively alarmed adults, disturbance displaying, carrying food or in territorial dispute.
10. The survey data were used to obtain population estimates for all of the bird species breeding on the site. Maps were produced of the breeding pairs recorded during each visit and these were combined to produce an estimate of the overall breeding population for each species. Duplicate registrations were removed, using the criteria given by Brown and Shepherd (1993). The surveys during 2018 were all undertaken by Tom Lowe.
Minnygap Wind Farm Breeding Bird Surveys 2018
Ecology Consulting
4
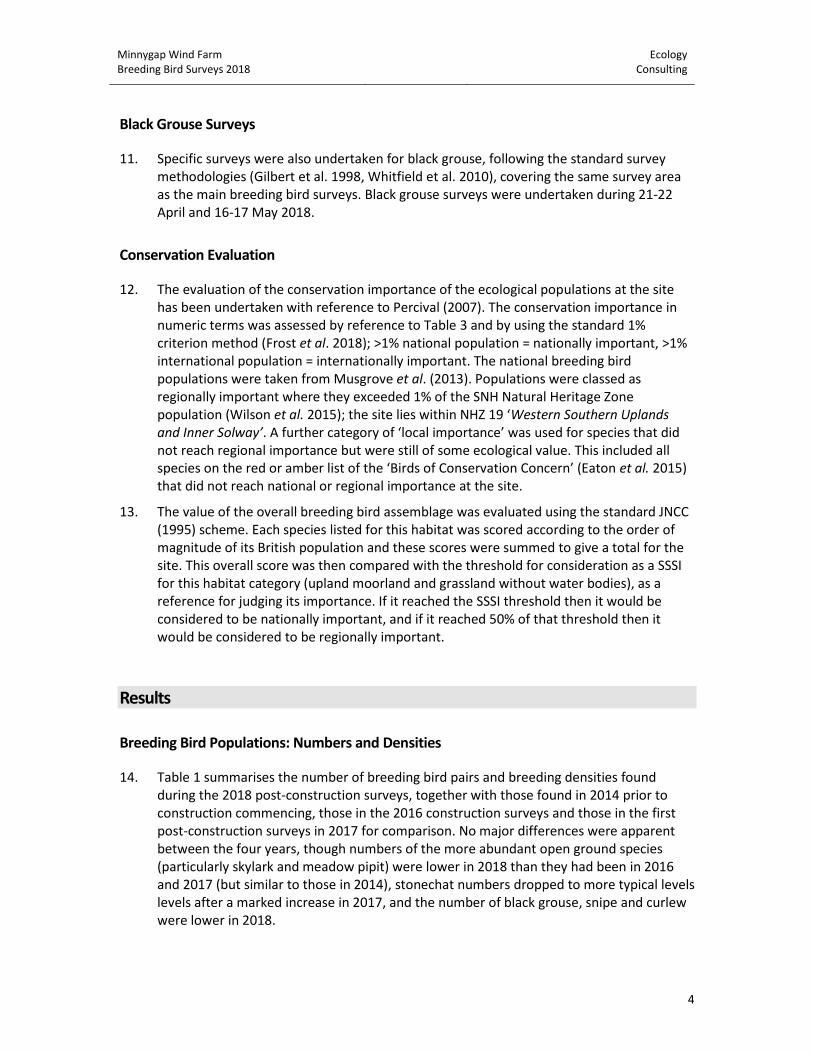
Black Grouse Surveys
11. Specific surveys were also undertaken for black grouse, following the standard survey methodologies (Gilbert et al. 1998, Whitfield et al. 2010), covering the same survey area as the main breeding bird surveys. Black grouse surveys were undertaken during 21-22 April and 16-17 May 2018.
Conservation Evaluation
12. The evaluation of the conservation importance of the ecological populations at the site has been undertaken with reference to Percival (2007). The conservation importance in numeric terms was assessed by reference to Table 3 and by using the standard 1% criterion method (Frost et al. 2018); >1% national population = nationally important, >1% international population = internationally important. The national breeding bird populations were taken from Musgrove et al. (2013). Populations were classed as regionally important where they exceeded 1% of the SNH Natural Heritage Zone population (Wilson et al. 2015); the site lies within NHZ 19 ‘Western Southern Uplands and Inner Solway’. A further category of ‘local importance’ was used for species that did not reach regional importance but were still of some ecological value. This included all species on the red or amber list of the ‘Birds of Conservation Concern’ (Eaton et al. 2015) that did not reach national or regional importance at the site.
13. The value of the overall breeding bird assemblage was evaluated using the standard JNCC (1995) scheme. Each species listed for this habitat was scored according to the order of magnitude of its British population and these scores were summed to give a total for the site. This overall score was then compared with the threshold for consideration as a SSSI for this habitat category (upland moorland and grassland without water bodies), as a reference for judging its importance. If it reached the SSSI threshold then it would be considered to be nationally important, and if it reached 50% of that threshold then it would be considered to be regionally important.
Results
Breeding Bird Populations: Numbers and Densities
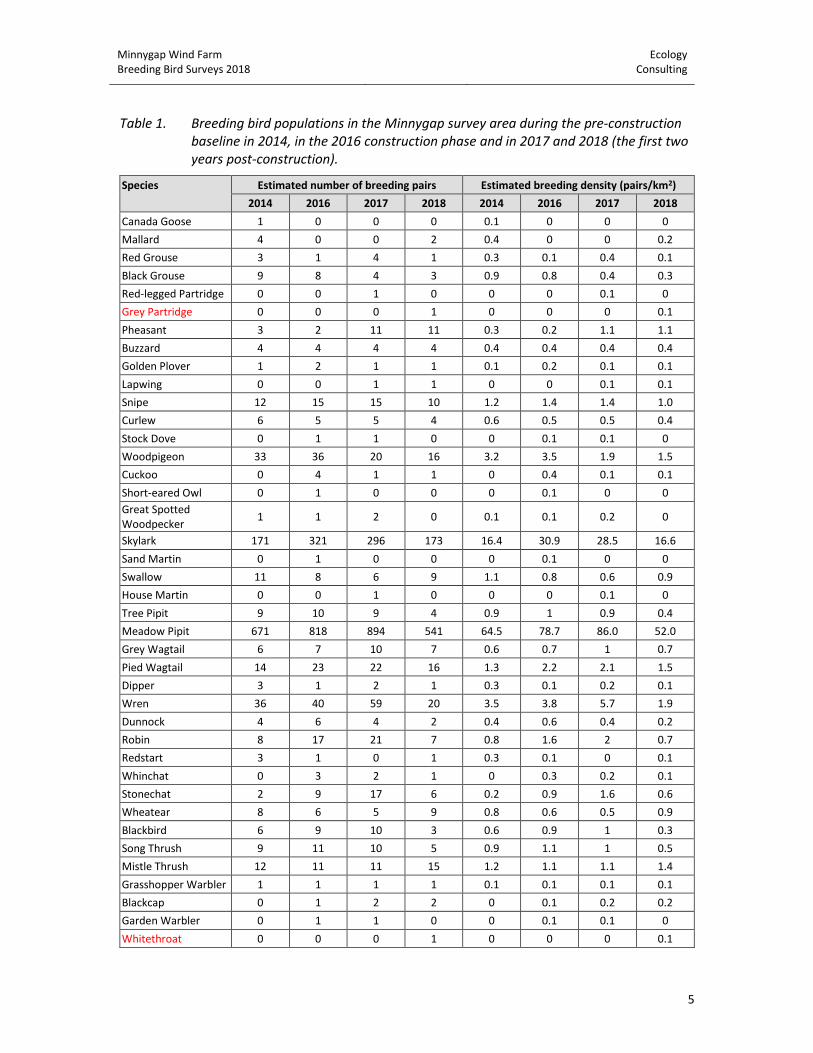
14. Table 1 summarises the number of breeding bird pairs and breeding densities found during the 2018 post-construction surveys, together with those found in 2014 prior to construction commencing, those in the 2016 construction surveys and those in the first post-construction surveys in 2017 for comparison. No major differences were apparent between the four years, though numbers of the more abundant open ground species (particularly skylark and meadow pipit) were lower in 2018 than they had been in 2016 and 2017 (but similar to those in 2014), stonechat numbers dropped to more typical levels levels after a marked increase in 2017, and the number of black grouse, snipe and curlew were lower in 2018.
Minnygap Wind Farm Breeding Bird Surveys 2018
Ecology Consulting
5
Table 1. Breeding bird populations in the Minnygap survey area during the pre-construction baseline in 2014, in the 2016 construction phase and in 2017 and 2018 (the first two years post-construction).
Species Estimated number of breeding pairs Estimated breeding density (pairs/km2)
2014 2016 2017 2018 2014 2016 2017 2018
Canada Goose 1 0 0 0 0.1 0 0 0
Mallard 4 0 0 2 0.4 0 0 0.2
Red Grouse 3 1 4 1 0.3 0.1 0.4 0.1
Black Grouse 9 8 4 3 0.9 0.8 0.4 0.3
Red-legged Partridge 0 0 1 0 0 0 0.1 0
Grey Partridge 0 0 0 1 0 0 0 0.1
Pheasant 3 2 11 11 0.3 0.2 1.1 1.1
Buzzard 4 4 4 4 0.4 0.4 0.4 0.4
Golden Plover 1 2 1 1 0.1 0.2 0.1 0.1
Lapwing 0 0 1 1 0 0 0.1 0.1
Snipe 12 15 15 10 1.2 1.4 1.4 1.0
Curlew 6 5 5 4 0.6 0.5 0.5 0.4
Stock Dove 0 1 1 0 0 0.1 0.1 0
Woodpigeon 33 36 20 16 3.2 3.5 1.9 1.5
Cuckoo 0 4 1 1 0 0.4 0.1 0.1
Short-eared Owl 0 1 0 0 0 0.1 0 0
Great Spotted Woodpecker
1 1 2 0 0.1 0.1 0.2 0
Skylark 171 321 296 173 16.4 30.9 28.5 16.6
Sand Martin 0 1 0 0 0 0.1 0 0
Swallow 11 8 6 9 1.1 0.8 0.6 0.9
House Martin 0 0 1 0 0 0 0.1 0
Tree Pipit 9 10 9 4 0.9 1 0.9 0.4
Meadow Pipit 671 818 894 541 64.5 78.7 86.0 52.0
Grey Wagtail 6 7 10 7 0.6 0.7 1 0.7
Pied Wagtail 14 23 22 16 1.3 2.2 2.1 1.5
Dipper 3 1 2 1 0.3 0.1 0.2 0.1
Wren 36 40 59 20 3.5 3.8 5.7 1.9
Dunnock 4 6 4 2 0.4 0.6 0.4 0.2
Robin 8 17 21 7 0.8 1.6 2 0.7
Redstart 3 1 0 1 0.3 0.1 0 0.1
Whinchat 0 3 2 1 0 0.3 0.2 0.1
Stonechat 2 9 17 6 0.2 0.9 1.6 0.6
Wheatear 8 6 5 9 0.8 0.6 0.5 0.9
Blackbird 6 9 10 3 0.6 0.9 1 0.3
Song Thrush 9 11 10 5 0.9 1.1 1 0.5
Mistle Thrush 12 11 11 15 1.2 1.1 1.1 1.4
Grasshopper Warbler 1 1 1 1 0.1 0.1 0.1 0.1
Blackcap 0 1 2 2 0 0.1 0.2 0.2
Garden Warbler 0 1 1 0 0 0.1 0.1 0
Whitethroat 0 0 0 1 0 0 0 0.1

Minnygap Wind Farm Breeding Bird Surveys 2018
Ecology Consulting
6
Species Estimated number of breeding pairs Estimated breeding density (pairs/km2)
2014 2016 2017 2018 2014 2016 2017 2018
Chiffchaff 1 2 0 0 0.1 0.2 0 0
Willow Warbler 21 61 54 24 2 5.9 5.2 2.3
Goldcrest 3 7 6 0 0.3 0.7 0.6 0
Spotted Flycatcher 1 2 0 0 0.1 0.2 0 0
Long-tailed Tit 0 0 0 1 0 0 0 0.1
Blue Tit 1 2 2 1 0.1 0.2 0.2 0.1
Great Tit 4 9 8 2 0.4 0.9 0.8 0.2
Coal Tit 5 11 10 8 0.5 1.1 1 0.8
Nuthatch 0 0 0 1 0 0 0 0.1
Treecreeper 0 0 1 0 0 0 0.1 0
Jay 2 1 2 2 0.2 0.1 0.2 0.2
Jackdaw 5 2 2 2 0.5 0.2 0.2 0.2
Carrion Crow 19 10 9 7 1.8 1 0.9 0.7
Raven 2 1 1 1 0.2 0.1 0.1 0.1
Starling 1 1 2 3 0.1 0.1 0.2 0.3
House Sparrow 0 4 2 1 0 0.4 0.2 0.1
Chaffinch 36 55 41 33 3.5 5.3 3.9 3.2
Greenfinch 1 0 1 0 0.1 0 0.1 0
Goldfinch 1 4 3 1 0.1 0.4 0.3 0.1
Siskin 2 9 7 3 0.2 0.9 0.7 0.3
Linnet 0 11 8 5 0 1.1 0.8 0.5
Lesser Redpoll 9 37 19 10 0.9 3.6 1.8 1.0
Common Crossbill 0 1 0 0 0 0.1 0 0
Bullfinch 0 2 1 0 0 0.2 0.1 0
Yellowhammer 0 0 0 1 0 0 0 0.1
Reed Bunting 18 26 34 14 1.7 2.5 3.3 1.3
Note: species in red were seen for the first time in the survey area in 2018.
15. Other non-breeding records of birds observed over-flying and/or using the survey area during the 2018 surveys included (with the peak count in brackets) red kite (a single seen over-flying in April), sparrowhawk (1), kestrel (4), golden plover (spring migrant flocks of 30 and 57 seen in April), swift (5) and common crossbill (4).
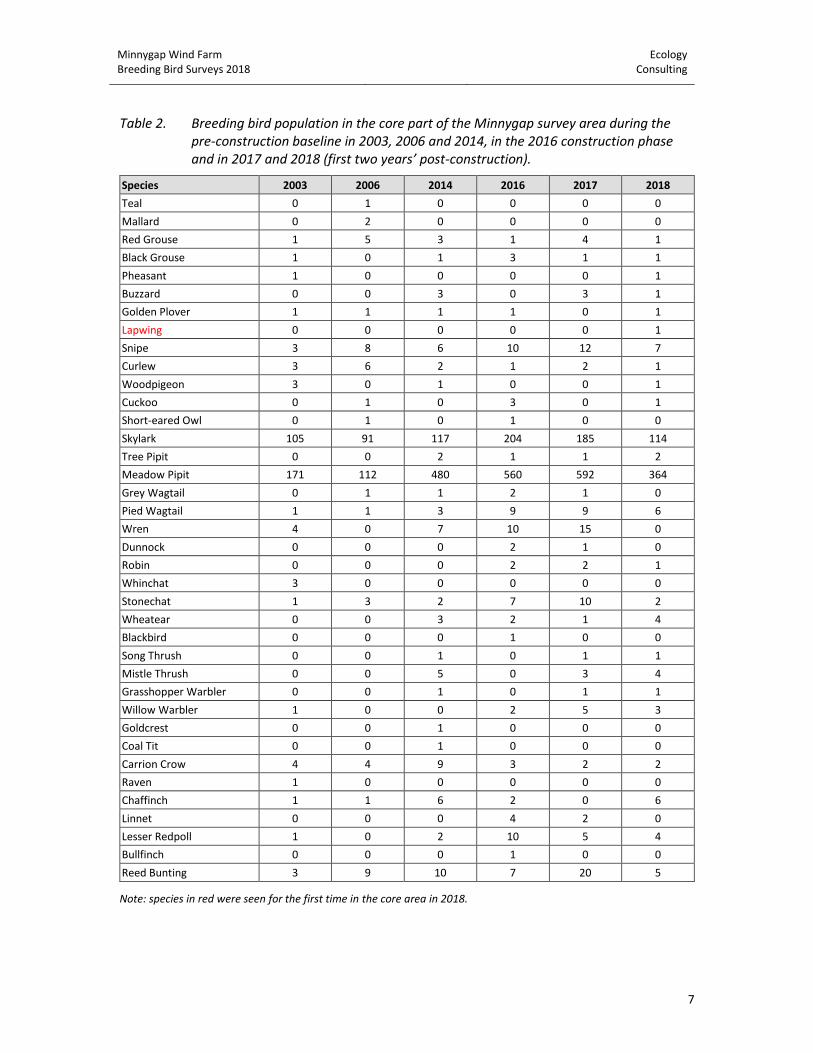
16. The breeding bird populations recorded within the core of area that that was surveyed in 2003 and 2006 as well as in 2014, 2016, 2017 and 2018 are shown in Table 2. This gives a longer-term view of breeding bird populations. Of note were lower numbers of curlew since 2014, higher numbers of snipe and skylark in 2016 and 2017, and higher numbers of meadow pipit in 2014, 2016 and 2017.
Minnygap Wind Farm Breeding Bird Surveys 2018
Ecology Consulting
7
Table 2. Breeding bird population in the core part of the Minnygap survey area during the pre-construction baseline in 2003, 2006 and 2014, in the 2016 construction phase and in 2017 and 2018 (first two years’ post-construction).
Species 2003 2006 2014 2016 2017 2018
Teal 0 1 0 0 0 0
Mallard 0 2 0 0 0 0
Red Grouse 1 5 3 1 4 1
Black Grouse 1 0 1 3 1 1
Pheasant 1 0 0 0 0 1
Buzzard 0 0 3 0 3 1
Golden Plover 1 1 1 1 0 1
Lapwing 0 0 0 0 0 1
Snipe 3 8 6 10 12 7
Curlew 3 6 2 1 2 1
Woodpigeon 3 0 1 0 0 1
Cuckoo 0 1 0 3 0 1
Short-eared Owl 0 1 0 1 0 0
Skylark 105 91 117 204 185 114
Tree Pipit 0 0 2 1 1 2
Meadow Pipit 171 112 480 560 592 364
Grey Wagtail 0 1 1 2 1 0
Pied Wagtail 1 1 3 9 9 6
Wren 4 0 7 10 15 0
Dunnock 0 0 0 2 1 0
Robin 0 0 0 2 2 1
Whinchat 3 0 0 0 0 0
Stonechat 1 3 2 7 10 2
Wheatear 0 0 3 2 1 4
Blackbird 0 0 0 1 0 0
Song Thrush 0 0 1 0 1 1
Mistle Thrush 0 0 5 0 3 4
Grasshopper Warbler 0 0 1 0 1 1
Willow Warbler 1 0 0 2 5 3
Goldcrest 0 0 1 0 0 0
Coal Tit 0 0 1 0 0 0
Carrion Crow 4 4 9 3 2 2
Raven 1 0 0 0 0 0
Chaffinch 1 1 6 2 0 6
Linnet 0 0 0 4 2 0
Lesser Redpoll 1 0 2 10 5 4
Bullfinch 0 0 0 1 0 0
Reed Bunting 3 9 10 7 20 5
Note: species in red were seen for the first time in the core area in 2018.
Minnygap Wind Farm Breeding Bird Surveys 2018
Ecology Consulting
8
Black Grouse Survey Results
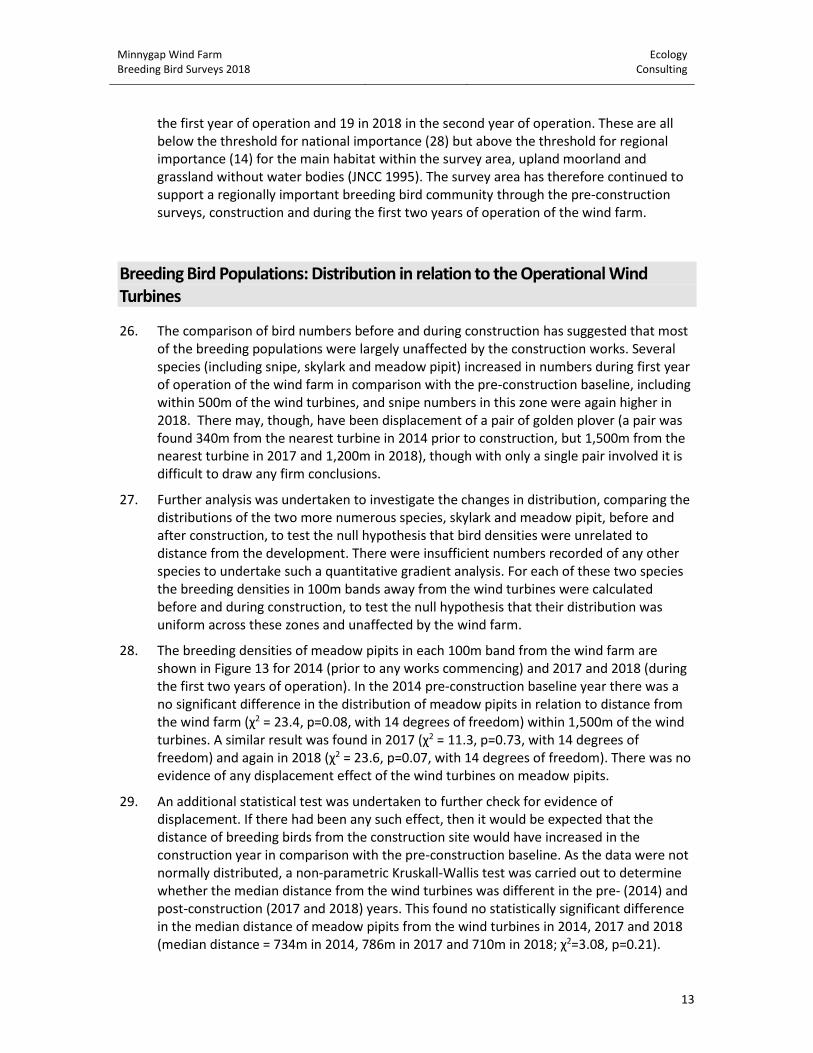
17. This species was recorded during the both specific dawn/dusk black grouse surveys, and during the other survey work. The summarised locations are shown in Figure 2, for 2014 (prior to construction), 2016 (during construction), 2017 (the first operational year) and 2018 (the second operational year). Numbers overall were lower in 2018 (3 lekking males) than found in 2014 (9), 2016 (8) or 2017 (4). There were no records of this species within 500m of the turbine locations in 2014 but three in 2016, one in 2017 and one in 2018. Most of the black grouse activity (including leks) continued to be to the east of the wind farm in 2018 (outside the 500m zone), as they had been in previous years.
Breeding Bird Populations: Distribution
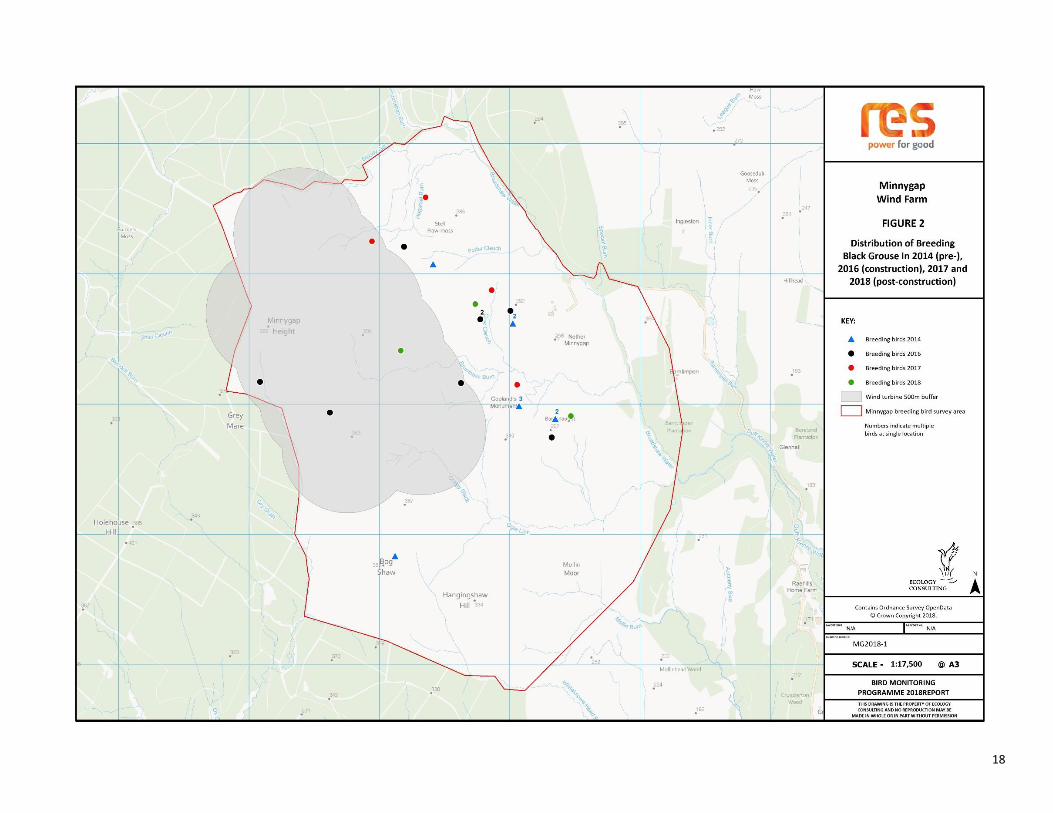
18. The locations of the breeding species of conservation importance in the survey area during the second post-construction year of the wind farm (2018) and in the 2014 pre-construction surveys are summarised in Figures 3-12. The more numerous and widespread species have been presented separately for clarity.
▪ Snipe (Figure 3) were widely distributed over the moorland areas. In the pre-construction baseline, higher densities were found to the east of the wind farm site and fewer within the wind farm itself, but there were more within 500m of the wind turbines in 2018, as there had been in the first operational year in 2017.
▪ Curlew (Figure 4) were found largely to the east of the wind farm, with only a single pair within 500m of the wind turbines in both 2014 and 2018.
▪ Skylarks (Figure 5) were common over most of the open ground within the study area, though with fewer on western and southern edges of the site adjoining forestry plantations. The distribution of this species was broadly similar in 2014 and 2018.
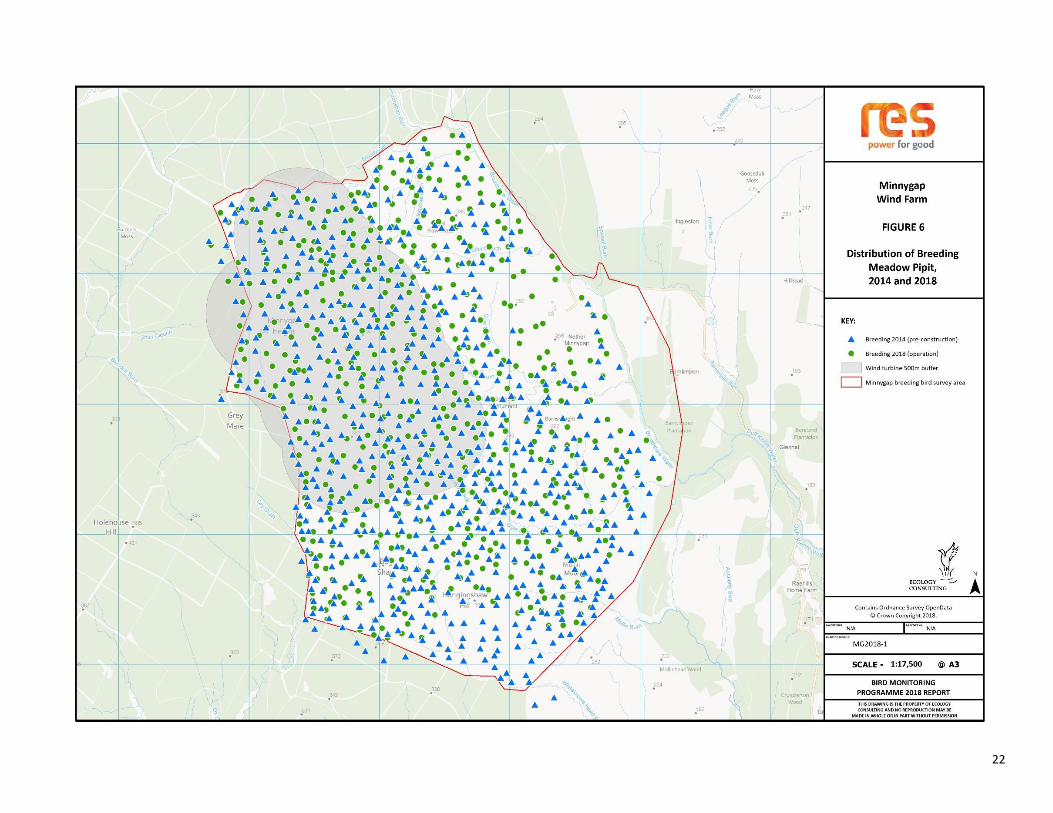
▪ Meadow pipits (Figure 6) were abundant over all of the open ground habitats, though with fewer in areas of agricultural grassland on the lower ground in the east of the survey area.
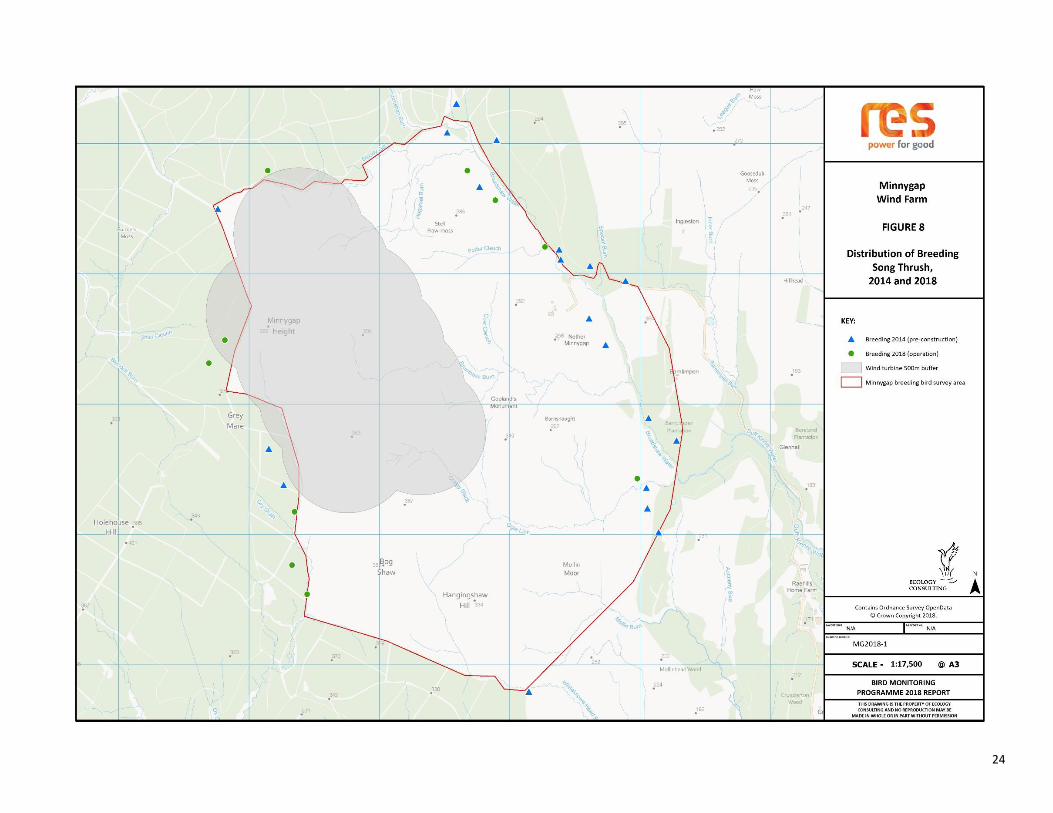
▪ Mistle thrush (Figure 7), song thrush (Figure 8) and willow warblers (Figure 9) were found primarily in the wooded habitats, with higher numbers in the lower areas in the eastern part of the survey area.
▪ Lesser redpoll (Figure 10) was another primarily woodland species found mainly in the eastern part of the survey area.
▪ Reed bunting (Figure 11) was widespread but with lower numbers on the higher ground in the western part of the site, including within the wind farm, in both 2014 and 2018 (with fewer within the wind farm in 2018).
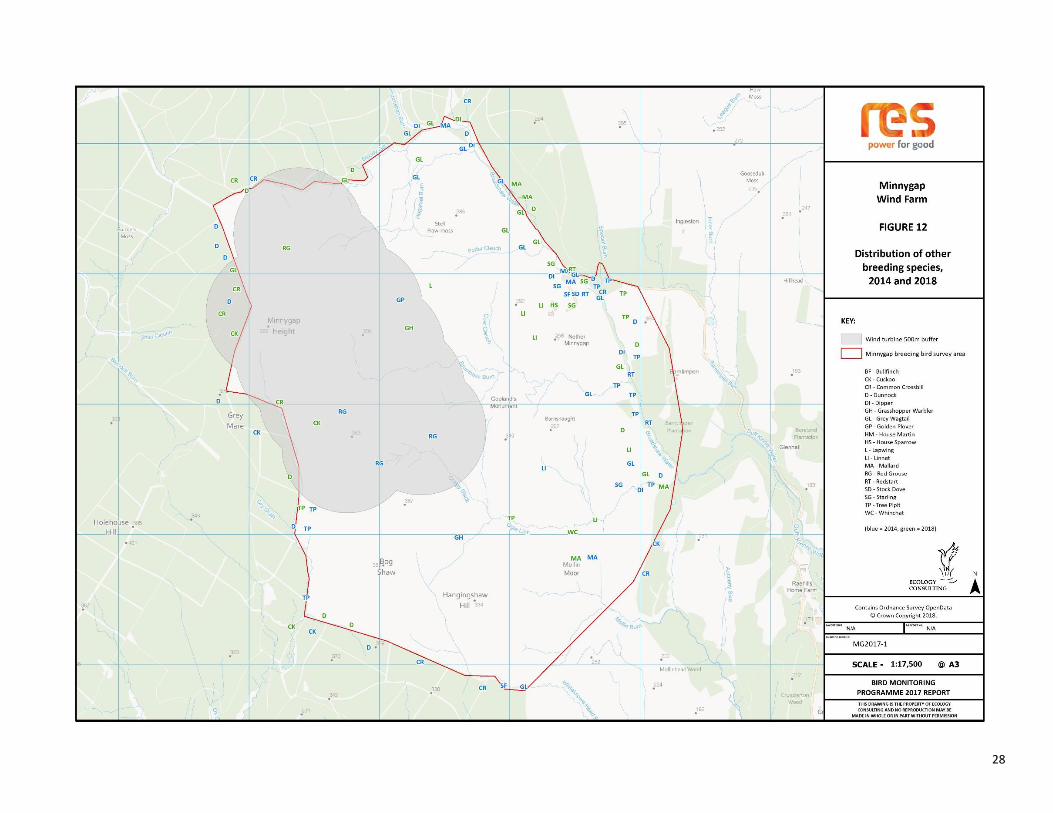
19. Of the less abundant species of conservation importance (Figure 12), most were found on the fringes of the survey area. No specific areas held any important bird concentrations. Species occurring within 500m of the wind turbine locations in 2018 included red grouse, cuckoo and grasshopper warbler. The only possible breeding record of golden plover in 2018 was a pair in suitable habitat on 21 April, 1.2km from the nearest turbine.

Minnygap Wind Farm Breeding Bird Surveys 2018
Ecology Consulting
9
Breeding Bird Populations in Proximity to the Wind Farm
20. Table 3 gives the estimated breeding bird populations within 500m of the wind turbines (and within the core survey area covered in all six years), the zone over which any displacement might be expected to occur.
Table 3. Breeding bird populations in the Minnygap core survey area within 500m of the wind farm during the pre-construction baseline in 2003, 2006 and 2014, construction in 2016 and in the first two post-construction years (2017 and 2018).
Species Pre-construction Construction Post-construction
2003 2006 2014 2016 2017 2018
Red Grouse 1 5 3 1 4 1
Black Grouse 0 0 0 3 1 1
Buzzard 0 0 2 0 3 0
Golden Plover 1 1 1 0 0 0
Snipe 0 4 3 4 8 6
Curlew 2 4 1 0 1 1
Woodpigeon 3 0 1 0 0 1
Cuckoo 0 1 0 2 0 1
Short-eared Owl 0 0 0 1 0 0
Skylark 71 59 65 113 106 59
Tree Pipit 0 0 0 0 1 0
Meadow Pipit 106 65 251 310 328 211
Grey Wagtail 0 0 0 2 0 1
Pied Wagtail 1 0 2 6 9 5
Wren 2 0 3 5 4 0
Robin 0 0 0 1 1 1
Stonechat 1 3 0 4 7 1
Wheatear 0 0 2 0 0 1
Song Thrush 0 0 0 0 1 0
Mistle Thrush 0 0 1 0 2 2
Grasshopper Warbler 0 0 0 0 0 1
Willow Warbler 1 0 0 1 0 1
Carrion Crow 3 3 6 2 1 1
Raven 1 0 0 0 0 0
Chaffinch 0 1 2 0 0 5
Linnet 0 0 0 1 2 0
Lesser Redpoll 1 0 0 4 3 2
Reed Bunting 2 6 4 6 11 1
21. Breeding bird populations within the 500m zone generally showed a similar trend to those in the wider survey area, including an increase in meadow pipits in 2014 which continued into 2016 and 2017 but then returned to earlier levels in 2018, and higher skylark numbers in 2016 and 2017, which also dropped in 2018 to levels similar to the pre-construction surveys. Snipe numbers were higher in the 500m zone in both 2017 and
Minnygap Wind Farm Breeding Bird Surveys 2018
Ecology Consulting
10
2018 than had been recorded previously. Whilst there was little evidence of any adverse effect of the wind farm construction from these results, it was of note that curlew were absent from this zone in 2016 but were seen there in 2017 and 2018, and golden plover has been absent since 2014 (when a single pair had been recorded there).
Conservation Importance of Breeding Bird Populations
22. The criteria used for the determination of the sensitivity of the bird populations present in the study area are summarised in Table 4 (which is based on the Percival, 2007, assessment methodology).
Table 4. Definition of terms relating to the sensitivity of the ornithological components of the site.
Sensitivity Definition
VERY HIGH A cited interest of SPAs, SACs and SSSIs. Cited means mentioned in the citation text for the site as a species for which the site is designated (SPAs/SACs) or notified (SSSIs).
HIGH Other species that contribute to the integrity of an SPA or SSSI.
A local population of more than 1% of the national population of a species.
An ecologically sensitive species, e.g. large birds of prey or rare birds (<300 breeding pairs in the UK).
MEDIUM A regionally important population of a species, either because of population size or distributional context.
Species listed on EU Birds Directive Annex 1, EU Habitats Directive priority habitat/species and/or W&C Act Schedule 1 species (if not covered above).
UK Biodiversity Action Plan (BAP) priority species (if not covered above).
LOW Any other species of conservation interest, e.g. species listed on the Birds of Conservation Concern (Eaton et al. 2015) not covered above.
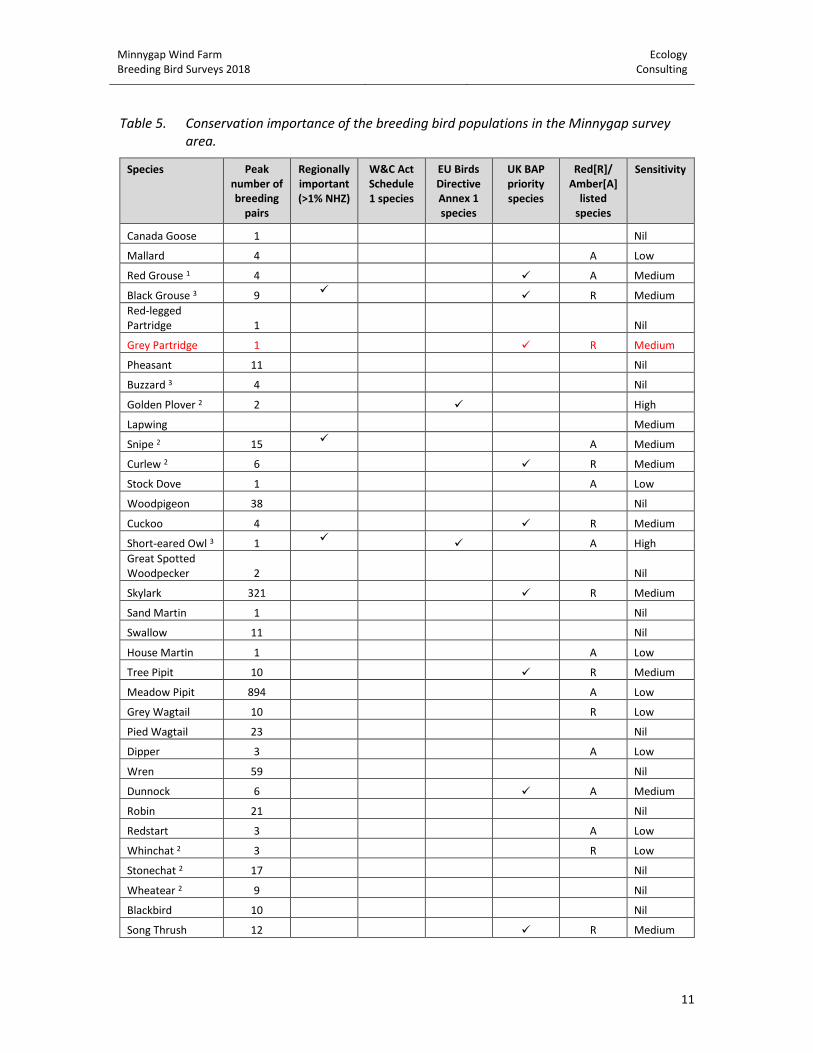
23. Table 5 summarises the conservation importance of each of the species found within the survey area in 2003-2018. No species listed on Schedule 1 of the 1981 Wildlife and Countryside Act and one EU Birds Directive Annex 1 species was recorded breeding within the survey area in 2018 (golden plover). Two species were found breeding in the survey area in 2018 in regionally important numbers; black grouse and snipe. Eighteen medium sensitivity species were found breeding within the survey area in 2018 in total. Five species were recorded in 2018 that had not been seen previously, grey partridge, whitethroat, long-tailed tit, nuthatch and yellowhammer.
24. Ten of the breeding species were determined to be low sensitivity (see Table 5). All are listed on the RSPB et al’s Birds of Conservation Concern red/amber list (Eaton et al. 2015).
Minnygap Wind Farm Breeding Bird Surveys 2018
Ecology Consulting
11
Table 5. Conservation importance of the breeding bird populations in the Minnygap survey area.
Species Peak number of breeding
pairs
Regionally important (>1% NHZ)
W&C Act Schedule 1 species
EU Birds Directive Annex 1 species
UK BAP priority species
Red[R]/ Amber[A]
listed species
Sensitivity
Canada Goose 1 Nil
Mallard 4 A Low
Red Grouse 1 4 ✓ A Medium
Black Grouse 3 9 ✓ ✓ R Medium
Red-legged Partridge 1
Nil
Grey Partridge 1 ✓ R Medium
Pheasant 11 Nil
Buzzard 3 4 Nil
Golden Plover 2 2 ✓ High
Lapwing Medium
Snipe 2 15 ✓ A Medium
Curlew 2 6 ✓ R Medium
Stock Dove 1 A Low
Woodpigeon 38 Nil
Cuckoo 4 ✓ R Medium
Short-eared Owl 3 1 ✓ ✓ A High
Great Spotted Woodpecker 2
Nil
Skylark 321 ✓ R Medium
Sand Martin 1 Nil
Swallow 11 Nil
House Martin 1 A Low
Tree Pipit 10 ✓ R Medium
Meadow Pipit 894 A Low
Grey Wagtail 10 R Low
Pied Wagtail 23 Nil
Dipper 3 A Low
Wren 59 Nil
Dunnock 6 ✓ A Medium
Robin 21 Nil
Redstart 3 A Low
Whinchat 2 3 R Low
Stonechat 2 17 Nil
Wheatear 2 9 Nil
Blackbird 10 Nil
Song Thrush 12 ✓ R Medium
Minnygap Wind Farm Breeding Bird Surveys 2018
Ecology Consulting
12
Species Peak number of breeding
pairs
Regionally important (>1% NHZ)
W&C Act Schedule 1 species
EU Birds Directive Annex 1 species
UK BAP priority species
Red[R]/ Amber[A]
listed species
Sensitivity
Mistle Thrush 15 R Low
Grasshopper Warbler 1
✓ R Medium
Blackcap 2 Nil
Garden Warbler 1 Nil
Whitethroat 1 Nil
Chiffchaff 2 Nil
Willow Warbler 61 A Low
Goldcrest 7 Nil
Spotted Flycatcher 2
✓ R Medium
Long-tailed Tit 1 Nil
Blue Tit 2 Nil
Great Tit 9 Nil
Coal Tit 11 Nil
Treecreeper 1 Nil
Nuthatch 1 Nil
Jay 2 Nil
Jackdaw 5 Nil
Carrion Crow 19 Nil
Raven 3 2 Nil
Starling 2 ✓ R Medium
House Sparrow 4 ✓ R Medium
Chaffinch 55 Nil
Greenfinch 1 Nil
Goldfinch 4 Nil
Siskin 9 Nil
Linnet 11 ✓ R Medium
Lesser Redpoll 37 ✓ R Medium
Common Crossbill 1 ✓ High
Bullfinch 2 ✓ A Medium
Yellowhammer 1 ✓ R Medium
Reed Bunting 34 ✓ A Medium
Note: superscripts indicate contribution to the JNCC breeding bird assemblage score for the main habitat within the
survey area, ‘Upland moorland and grassland without waterbodies’.
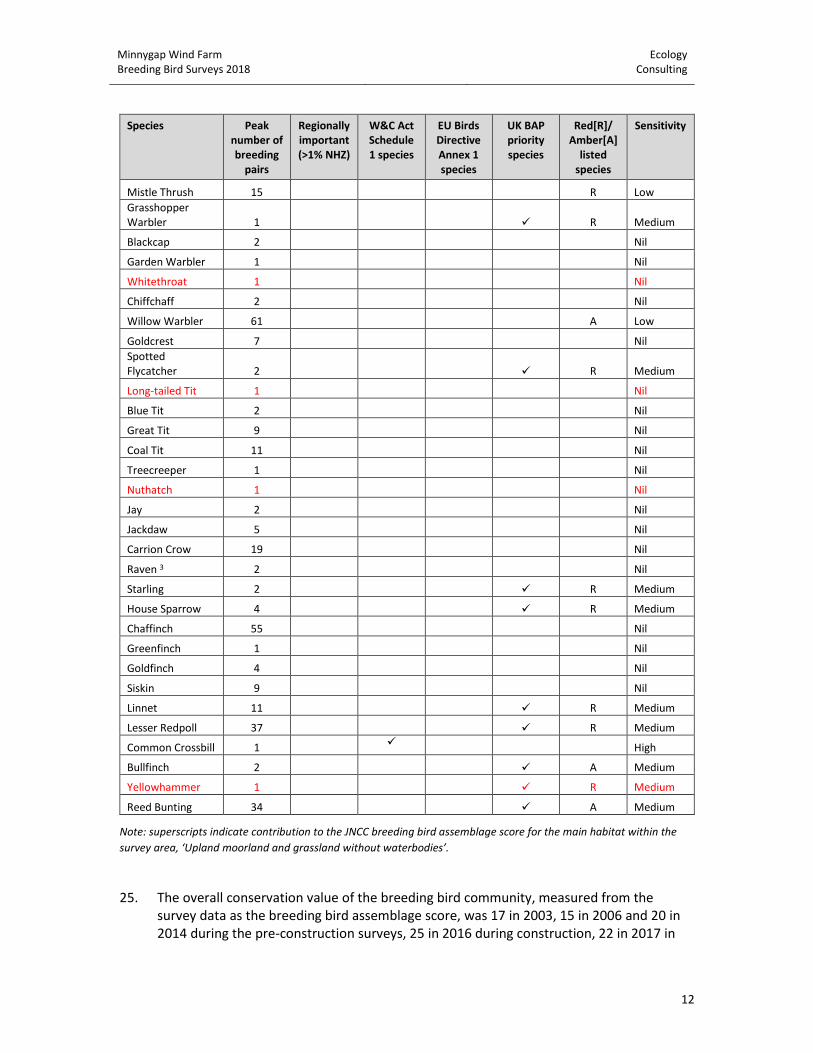
25. The overall conservation value of the breeding bird community, measured from the survey data as the breeding bird assemblage score, was 17 in 2003, 15 in 2006 and 20 in 2014 during the pre-construction surveys, 25 in 2016 during construction, 22 in 2017 in
Minnygap Wind Farm Breeding Bird Surveys 2018
Ecology Consulting
13
the first year of operation and 19 in 2018 in the second year of operation. These are all below the threshold for national importance (28) but above the threshold for regional importance (14) for the main habitat within the survey area, upland moorland and grassland without water bodies (JNCC 1995). The survey area has therefore continued to support a regionally important breeding bird community through the pre-construction surveys, construction and during the first two years of operation of the wind farm.
Breeding Bird Populations: Distribution in relation to the Operational Wind Turbines
26. The comparison of bird numbers before and during construction has suggested that most of the breeding populations were largely unaffected by the construction works. Several species (including snipe, skylark and meadow pipit) increased in numbers during first year of operation of the wind farm in comparison with the pre-construction baseline, including within 500m of the wind turbines, and snipe numbers in this zone were again higher in 2018. There may, though, have been displacement of a pair of golden plover (a pair was found 340m from the nearest turbine in 2014 prior to construction, but 1,500m from the nearest turbine in 2017 and 1,200m in 2018), though with only a single pair involved it is difficult to draw any firm conclusions.
27. Further analysis was undertaken to investigate the changes in distribution, comparing the distributions of the two more numerous species, skylark and meadow pipit, before and after construction, to test the null hypothesis that bird densities were unrelated to distance from the development. There were insufficient numbers recorded of any other species to undertake such a quantitative gradient analysis. For each of these two species the breeding densities in 100m bands away from the wind turbines were calculated before and during construction, to test the null hypothesis that their distribution was uniform across these zones and unaffected by the wind farm.
28. The breeding densities of meadow pipits in each 100m band from the wind farm are shown in Figure 13 for 2014 (prior to any works commencing) and 2017 and 2018 (during the first two years of operation). In the 2014 pre-construction baseline year there was a no significant difference in the distribution of meadow pipits in relation to distance from the wind farm (χ2 = 23.4, p=0.08, with 14 degrees of freedom) within 1,500m of the wind turbines. A similar result was found in 2017 (χ2 = 11.3, p=0.73, with 14 degrees of freedom) and again in 2018 (χ2 = 23.6, p=0.07, with 14 degrees of freedom). There was no evidence of any displacement effect of the wind turbines on meadow pipits.
29. An additional statistical test was undertaken to further check for evidence of displacement. If there had been any such effect, then it would be expected that the distance of breeding birds from the construction site would have increased in the construction year in comparison with the pre-construction baseline. As the data were not normally distributed, a non-parametric Kruskall-Wallis test was carried out to determine whether the median distance from the wind turbines was different in the pre- (2014) and post-construction (2017 and 2018) years. This found no statistically significant difference in the median distance of meadow pipits from the wind turbines in 2014, 2017 and 2018 (median distance = 734m in 2014, 786m in 2017 and 710m in 2018; χ2=3.08, p=0.21).

Minnygap Wind Farm Breeding Bird Surveys 2018
Ecology Consulting
14
There was, therefore, no evidence of any displacement of meadow pipits during the first two years of operation of the wind turbines.
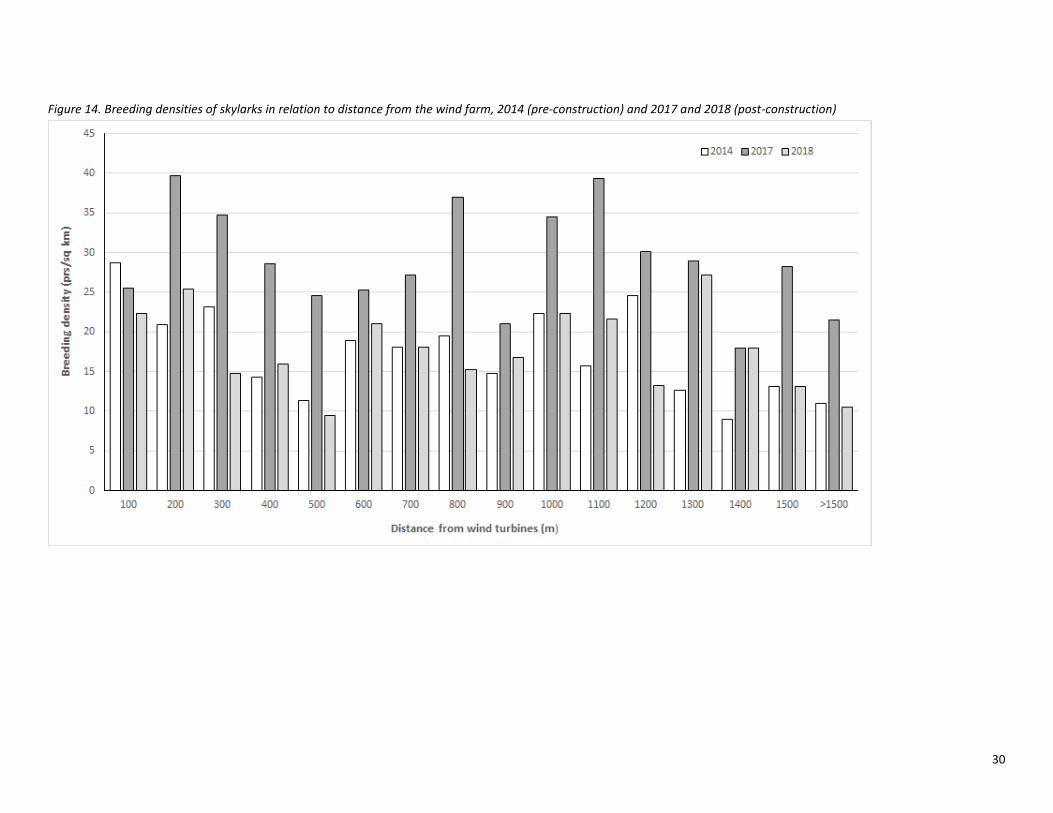
30. There was no evidence of any displacement from the wind farm during the first or second year of operation apparent for skylarks (Figure 14), with no significant difference in the numbers recorded in each zone from a uniform distribution in 2014, 2017 and 2018 (2014: χ2 = 13.9, p=0.53; 2017: χ2 = 12.8, p=0.62; 2018: χ2 = 13.1, p=0.59, with 14 degrees of freedom in all three years) within 1,500m of the wind turbines. There was also no statistically significant difference in the median distance of skylarks from the wind turbines in 2014, 2017 and 2018 (median distance = 714m in 2014, 791m in 2017 and 826m in 2018; Z=0.61, p=0.74).
31. Black grouse numbers were low again in 2018 in comparison with 2014 and 2016, with only three lekking males (compared with 9 in 2014, 8 in 2016 and 4 in 2017). However, from a longer-term perspective, only a single bird had been reported in the 2003 surveys, and none at all in 2006. There was also no statistically significant difference in the median distance of black grouse from the construction site in 2014, 2017 and 2018 (median distance = 911m in 2014, 884m in 2017 and 811m in 2018; χ2=0.17, p=0.92), though it should be noted that this analysis is based on only a small sample size, and that the main area used by this species was to the east of the wind farm (outside the zone within which any displacement would be likely to occur).
32. Curlew and snipe were both breeding in the survey area in 2014, 2017 and 2018. Curlew is a species that is generally considered to be vulnerable to wind farm disturbance (Pearce-Higgins et al. 2012), with displacement up to 800m reported. That same study found less effect of wind farms on snipe.
33. Snipe numbers increased in the first two years of post-construction monitoring at Minnygap, particularly within 500m of the wind turbines, with no evidence of any adverse effect on this species. The median distance from the wind turbines was smaller in 2017 and 2018 (though not statistically significantly so; χ2=2.8, p=0.24); 885m in 2014, 440m in 2017 and 374m in 2018. There was an increase from 4 to 8 pairs within 500m of the turbines between 2014 and 2017, and there were 6 in that zone in 2018.
34. There was a decline in the survey area curlew population from 6 pairs in 2014 to 5 in 2017 and 4 in 2018. There was also some evidence of a movement away from the wind turbines, with a median distance to the turbine of 640m in 2014, 964m in 2017 and 864m in 2018 (though this was not statistically significant, χ2=1.5, p=0.47, with only small sample sizes). As for black grouse, most records of this species were from the lower ground on the eastern side of the survey area further from the wind farm (and mostly outside the potential disturbance zone).
Conclusions
35. The breeding bird surveys during the first two years of operation of the Minnygap wind farm in 2017 and 2018 recorded a typical upland breeding bird community within the survey area, including a range of UK BAP priority species, as had been recorded during the previous pre-construction baseline surveys.

Minnygap Wind Farm Breeding Bird Surveys 2018
Ecology Consulting
15
36. No major changes to the breeding bird community were recorded in the first two years of operation of the wind farm, with the survey area still supporting a regionally important upland breeding bird community.
37. No statistically significant effects of operation of the wind farm were apparent on the distribution and abundance of the two more abundant species, meadow pipit and skylark. Areas in proximity to the wind farm held breeding densities of both species similar to those elsewhere in the survey area, both before and after construction of the wind farm.
38. There was a reduction in the curlew population from 6 to 5 pairs in 2017 and 4 in 2018, and a slight movement away from the wind turbines in 2017 and 2018 in comparison with the pre-construction baseline (though this was not statistically significant). Possible displacement of these species by the operation of the wind farm cannot be ruled out, but this only affected at most 1-2 pairs.
39. In contrast, numbers of snipe in proximity to the wind turbines have increased, so this species has clearly had no adverse effect from the operation of the wind farm.
40. Overall there was no clear evidence of any statistically or biologically significant shift of breeding birds away from the development during the first two years of operation of the Minnygap wind farm.
References
Brown, A.F. and Shepherd, K.B. 1993. A method for censusing upland breeding waders. Bird Study 40, 189-195.
Eaton, M. A., N. J. Aebischer, A. F. Brown, R. D. Hearn, L. Lock, A. J. Musgrove, D. G. Noble, D. A. Stroud, and R. D. Gregory. 2015. Birds of Conservation Concern 4: the population status of birds in the United Kingdom, Channel Islands and the Isle of Man. British Birds 108, 708-746.
Frost, T. M., Austin, G. E., Calbrade, N. A., Mellan, H. J., Hearn, R. D., Stroud, D. A., Wotton, S. R. and Balmer, D. E. 2018. Waterbirds in the UK 2016/17: The Wetland Bird Survey. British Trust for Ornithology, Thetford: BTO, RSPB and JNCC, in association with WWT.
Gilbert, G., D. W. Gibbons, and J. Evans. 1998. Bird Monitoring Methods: a manual of techniques for key UK species. RSPB /BTO/WWT/JNCC/ITE/The Seabird Group.
Hardey, J., H. Q. P. Crick, C. V. Wernham, H. T. Riley, B. Etheridge, and D. B. A. Thompson. 2007. Raptors: a field guide to survey and monitoring. The Stationary Office Ltd, Edinburgh.
JNCC. 1995. Guidelines for the selection of biological SSSIs. JNCC, Peterborough.
Musgrove, A., Aebischer, N., Eaton, M., Hearn, R., Newson, S., Noble, D., Parsons, M., Risely, K. and Stroud, D. (2013) Population estimates of birds in Great Britain and the United Kingdom. British Birds, 106, 64-100.
Pearce-Higgins, J. W., L. Stephen, A. Douse, and R. H. W. Langston. 2012. Greater impacts of wind farms on bird populations during construction than subsequent operation: results of a multi-site and multi-species analysis. Journal of Applied Ecology 49:386-394.

Minnygap Wind Farm Breeding Bird Surveys 2018
Ecology Consulting
16
Percival, S. M. 2007. Predicting the effects of wind farms on birds in the UK: the development of an objective assessment methodology. In M. de Lucas, Janss, G.F.E. and Ferrer, M., editor. Birds and Wind Farms: risk assessment and mitigation. Quercus, Madrid.
SNH 2014. Survey methods for use in assessment of the impacts of proposed onshore wind farms on bird communities. Scottish Natural Heritage.
Whitfield, P., and R. Bullman. 2010. Survey methods for use in assessment of the impacts of proposed onshore wind farms on bird communities. Scottish Natural Heritage.
Wilson, M. W., G. E. Austin, G. S., and C. V. Wernham. 2015. Natural Heritage Zone Bird Population Estimates. SWBSG Commissioned report 1504.

18
19

20

21
22

23
24

25

26

27
28

29
Figure 13. Breeding densities of meadow pipits in relation to distance from the wind farm, 2014 (pre-construction) and 2017 and 2018 (post-construction)
30
Figure 14. Breeding densities of skylarks in relation to distance from the wind farm, 2014 (pre-construction) and 2017 and 2018 (post-construction)