Minnesota KiDs Count 2014 - CDF-MN · Minnesota KiDs Count 2014: ... and state-by-state effort to...
32
MINNESOTA KIDS COUNT 2014: Budgeting for Better Child Outcomes Produced by Children’s Defense Fund–Minnesota
Transcript of Minnesota KiDs Count 2014 - CDF-MN · Minnesota KiDs Count 2014: ... and state-by-state effort to...
Minnesota KiDs Count 2014: Budgeting for Better Child Outcomes
Produced by Children’s Defense Fund–Minnesota
about Children’s Defense Fund The Children’s Defense Fund Leave
No Child Behind® mission is to
ensure every child a Healthy Start,
a Head Start, a Fair Start, a Safe
Start and a Moral Start in life and
successful passage to adulthood
with the help of caring families and
communities. CDF provides a strong,
effective voice for all the children
of America who cannot vote, lobby
or speak for themselves. We pay
particular attention to the needs of
poor and minority children and those
with disabilities. CDF educates the
nation about the needs of children
and encourages preventative
investments before they get sick or
into trouble, drop out of school or
suffer family breakdown.
CDF began in 1973, arriving in
Minnesota in 1985, and is a private,
nonprofit organization supported by
foundation and corporate grants and
individual donations.
What is KiDs Count?KIDS COUNT, a project of the Annie
E. Casey Foundation, is a national
and state-by-state effort to track
the status of children in the United
States. By providing policymakers
and citizens with benchmarks of
child well-being, KIDS COUNT seeks
to enrich local, state and national
discussions concerning ways to
secure better futures for all children.
As the Minnesota KIDS COUNT
grantee, Children’s Defense Fund-
Minnesota (CDF-MN) releases
periodic reports and an annual data
book regarding the well-being of
children and families in Minnesota.
Please visit our website at www.
cdf-mn.org/kidscount to locate the
electronic copy of this data book.
We thank the Annie E. Casey
Foundation for its support but
acknowledge that the findings and
conclusions presented in this book
are those of CDF-MN alone, and
do not necessarily represent the
opinions of the Foundation. Any
or all portions of this data book
may be reproduced without prior
permission, provided the source is
cited. Questions about the contents
of this book may be directed to
Stephanie Hogenson at shogenson@
childrensdefense.org or call
651-855-1175.
CDF-Mn staffPeggy Flanagan, Executive Director
Jessica Anderson, Legislative Affairs and Communications Director
Bailey Boelter, Promise Fellow
Emma Brainerd, Promise Fellow
Elaine Cunningham, Outreach Director
Alexandra Fitzsimmons, Advocacy Director
Nicole Hernandez, Youth Development Director
Stephanie Hogenson, Research and Policy Director
Debbie Leone, Outreach Coordinator
Alisha Porter, Finance and Operations Manager
acknowledgementsChildren’s Defense Fund-Minnesota thanks the following individuals for their help in providing data and assistance.
Kristen Boelcke-Stennes, Minnesota Department of Human Services
Angie Bowman, Minnesota Child Care Resource & Referral Network
Tony Compton, 360 Communities
Leslie Crichton, Minnesota Department of Human Services
Dana DeMaster, Minnesota Department of Human Services
Kim Edelman, Minnesota Department of Health
Amy Gehring, Minnesota Department of Human Services
Joy Johnson, Simpson Housing Services
Ryan Johnson, Minnesota Department of Human Services
Ray Kurth-Nelson, Minnesota Department of Human Services
James Redmond, Hunger Solutions Minnesota
Lisa Wojcik, Open Door Health Center
Alicia Petersen, White Bear Area Emergency Food Shelf
Stephanie Yendell, Minnesota Department of Health
Pamela Moore, Transit for Livable Communities
Cover photo provided by Simpson Housing Services, Minneapolis
Layout and design by Triangle Park Creative, Minneapolis
Printed by Concord Printing, St. Paul
Minnesota KiDs Count is a Project of Children’s Defense Fund–Minnesota

Letter from CDF-MN ................................................................................................................................ page 2
Introduction ............................................................................................................................................ page 3
expense sections
Food ..............................................................................................................................................pages 10–11
Housing .........................................................................................................................................pages 12–13
Health Care ....................................................................................................................................pages 14–15
Child Care ......................................................................................................................................pages 16–17
Transportation ....................................................................................................................................... page 18
Other Necessities .................................................................................................................................. page 19
Assets ...........................................................................................................................................pages 20–21
Data
State Data Tables ...........................................................................................................................pages 22–26
Technical Notes ..............................................................................................................................pages 27–28
Endnotes .............................................................................................................................................. page 29
table of Contents
The KIDS COUNT Data Center
provides one comprehensive website
of national, state, county and city
information to help community
members stay up-to-date on key
trends in child well-being. The
website contains more than 100
indicators and allows users to:
•Create custom reports for a specific
county or state;
• Compare and rank data for different
states and counties; and
•Design graphics like maps and
trend lines to use in presentations,
publications or feature on your own
website or blog.
The KIDS COUNT Data Center
provides state- and county-level data
for all 87 counties in Minnesota.
These data are collected by KIDS
COUNT grantees (including CDF-MN)
for use in their data books and other
publications. All county-level data
that were previously published in the
Minnesota KIDS COUNT Data Book
are available through the interactive
KIDS COUNT Data Center website—
datacenter.kidscount.org.
sparking Conversations, ideas and Change: the KiDs Count Data Center
2 KIDS COUNT DATA BOOK 2014 | Children’s Defense Fund–Minnesota
Letter from CDF-Mn
Tia* entered foster care at age 3. By the time she was 14, she had lived in 47 different homes. At 14,
she was adopted by a friend’s family. But at age 19, she found herself disconnected from her adopted
family, pregnant and living in a homeless shelter. Tia was connected with Simpson Housing Services
(SHS) in Minneapolis. She started receiving supportive housing, parental support and education, and,
once her daughter was born, early childhood education services. Now, Tia works full time, receives an
affordable housing subsidy from SHS and her daughter attends a child care program with assistance from
the Child Care Assistance Program. Tia is still working hard with SHS to ensure her daughter, now 3 years
old, has a safe and healthy foundation in her life.
It’s families like Tia’s that are represented in our KIDS COUNT Data. You might find Tia or her daughter
counted in the number of single-parent households, children in low-income families or children
enrolled in preschool. While data is critical in assessing child well-being, it’s only part of the story. Data
doesn’t explain what day-to-day life is like for Minnesotans like Tia and her daughter or exactly how
circumstances and events affect their outcomes. To CDF-MN, children and their families are more than
just numbers. That’s why the 2014 Minnesota KIDS COUNT Data Book will look different from prior
years’ books. This year, we’re weaving in stories from parents and their children to inform policymakers,
elected officials and child advocates of what real families are experiencing. We asked them for their
solutions to the complex issues that face children and families across Minnesota.
Tia put it best. “[Advocates and politicians] should look into real people’s lives to understand the urgency
of getting people on programs that help.”
We’re framing the conversation around the family budget. Family income affects child outcomes. So what
better way to assess if families have the resources not only to survive, but to thrive, than by evaluating
the family budget? Each month families across the state assess their income, taxes, other resources and
expenses to calculate what’s leftover. For many families, and not just families living near the poverty
thresholds, impossible decisions include which bills will have to be paid late this month or whether or
not a visit to the food shelf is necessary. By providing data and family stories, we hope to convey what
life is like for these families that live paycheck to paycheck and how this family budget dilemma affects
child outcomes. We hope a comprehensive look into the family budget will spark conversation and
policies that increase family resources to improve child outcomes.
—Children’s Defense Fund-Minnesota, October 2014
*Tia chose not to provide her last name.
Children’s Defense Fund–Minnesota | KIDS COUNT DATA BOOK 2014 3
introDuCtion: Budgeting for Better Child outcomes
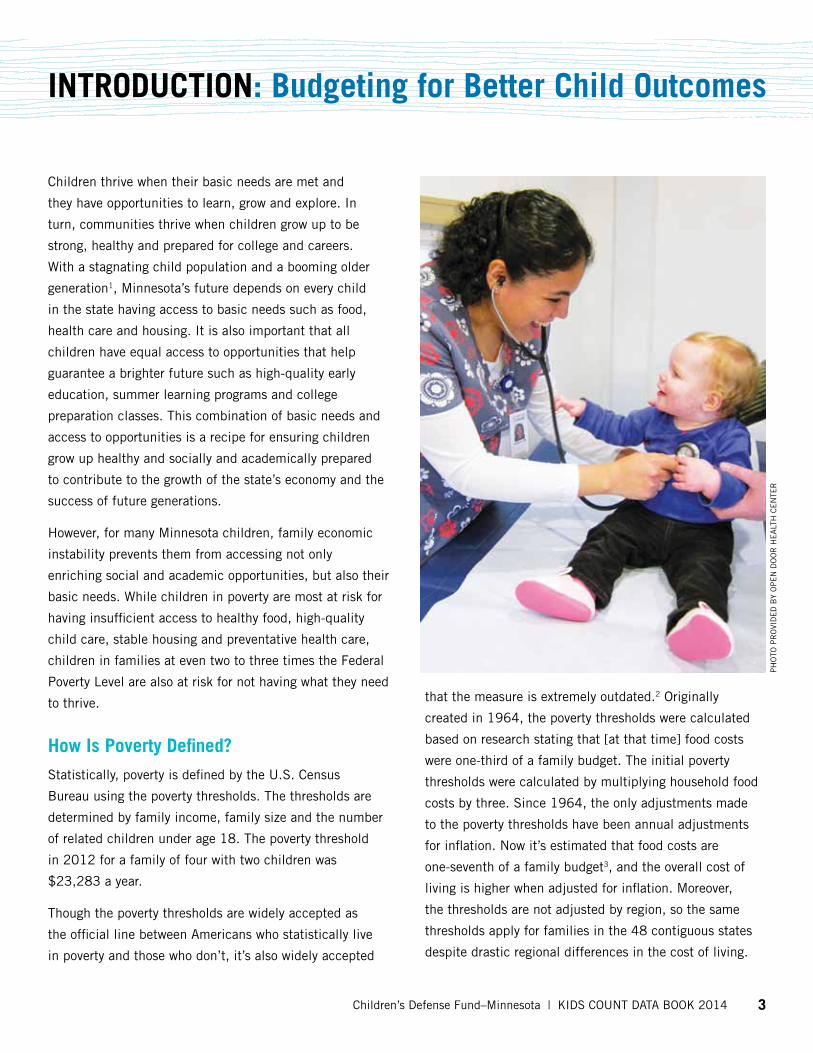
Children thrive when their basic needs are met and
they have opportunities to learn, grow and explore. In
turn, communities thrive when children grow up to be
strong, healthy and prepared for college and careers.
With a stagnating child population and a booming older
generation1, Minnesota’s future depends on every child
in the state having access to basic needs such as food,
health care and housing. It is also important that all
children have equal access to opportunities that help
guarantee a brighter future such as high-quality early
education, summer learning programs and college
preparation classes. This combination of basic needs and
access to opportunities is a recipe for ensuring children
grow up healthy and socially and academically prepared
to contribute to the growth of the state’s economy and the
success of future generations.
However, for many Minnesota children, family economic
instability prevents them from accessing not only
enriching social and academic opportunities, but also their
basic needs. While children in poverty are most at risk for
having insufficient access to healthy food, high-quality
child care, stable housing and preventative health care,
children in families at even two to three times the Federal
Poverty Level are also at risk for not having what they need
to thrive.
How is Poverty Defined?Statistically, poverty is defined by the U.S. Census
Bureau using the poverty thresholds. The thresholds are
determined by family income, family size and the number
of related children under age 18. The poverty threshold
in 2012 for a family of four with two children was
$23,283 a year.
Though the poverty thresholds are widely accepted as
the official line between Americans who statistically live
in poverty and those who don’t, it’s also widely accepted
that the measure is extremely outdated.2 Originally
created in 1964, the poverty thresholds were calculated
based on research stating that [at that time] food costs
were one-third of a family budget. The initial poverty
thresholds were calculated by multiplying household food
costs by three. Since 1964, the only adjustments made
to the poverty thresholds have been annual adjustments
for inflation. Now it’s estimated that food costs are
one-seventh of a family budget3, and the overall cost of
living is higher when adjusted for inflation. Moreover,
the thresholds are not adjusted by region, so the same
thresholds apply for families in the 48 contiguous states
despite drastic regional differences in the cost of living.
PH
OTO
PR
OvI
DE
D B
Y O
PE
N D
OO
R H
EA
LTH
CE
NTE
R
4 KIDS COUNT DATA BOOK 2014 | Children’s Defense Fund–Minnesota
twice the poverty threshold. Families living at twice the
poverty level are defined as low-income. Though twice the
poverty level is still less than the cost of living for a family,
the number of low-income families is a more accurate
depiction of families that do not have enough income to
meet basic needs. Nearly one-third of Minnesota children
live in low-income households by this definition.9 Research
indicates that low-income children face disparities in
education, health and development similar to children
in poverty.10
effects of economic instability on Child outcomesIt’s really no surprise that research shows that children
experiencing food insecurity have more trouble
concentrating and behaving in school, children without
health insurance are more likely to receive delayed care
when they’re sick or injured, and children who don’t attend
preschool are less likely to be prepared for and successful
in school. For families with minimal income and resources,
these issues compound and affect outcomes not only
in childhood and adolescence but well into adulthood.
Moreover, the younger children are when they experience
poverty and the longer the period of time they experience
it, the greater the effect on their development and future
outcomes.11 Unfortunately, Minnesota children experience
poverty at higher rates when they’re younger—17 percent
of children under age 5 live in poverty.12
Children growing up in households with lower incomes are
more likely to have lower earnings, fewer work hours, poorer
health and less schooling as adults.13 They’re also more
likely to get arrested (data on men only) and are more likely
to receive food stamps.
To prevent these expensive costs, it is imperative that
investments be made early and often in children from lower
income households not only to ensure their successful
passage into adulthood, but also to maintain the economic
vitality of our state. Investments in early childhood
education, work support programs and preventative health
care will pay off by reducing the costly long-term effects of
child poverty.
the supplemental Poverty MeasureThe Supplemental Poverty Measure (SPM) was created
in 2011 by the U.S. Census Bureau to more accurately
measure the number of families without sufficient
resources to meet basic needs. The SPM will not replace
the poverty thresholds and should be viewed as a work in
progress4. In addition to family income, the SPM accounts
for family resources by taking cash income plus federal
government benefits that families can use to meet food,
clothing, shelter and utility costs, and then subtracting
taxes (plus tax credits), work expenses (commuting and
child care) and out-of-pocket medical expenses. The
measure also accounts for food, clothing, shelter and utility
expenses and a small amount for other needs.
The SPM shows that work support programs such as the
Supplemental Nutrition Assistance Program (SNAP),
Women, Infants & Children (WIC), School Meal Program,
tax credits and Energy Assistance, do help families meet
basic needs.5 For example, in 2012, without benefits from
the refundable Earned Income Tax Credit (EITC) and Child
Tax Credit, the national SPM child poverty rate would have
been higher, 24.7 percent rather than 18 percent.6
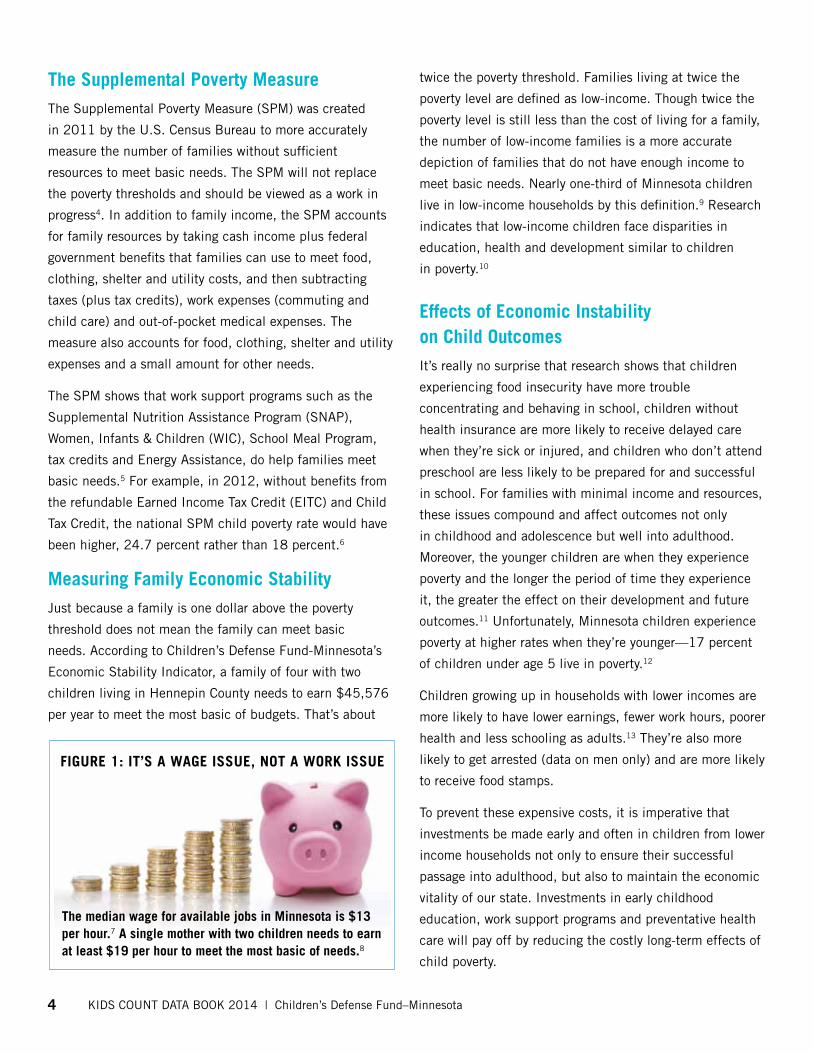
Measuring Family economic stabilityJust because a family is one dollar above the poverty
threshold does not mean the family can meet basic
needs. According to Children’s Defense Fund-Minnesota’s
Economic Stability Indicator, a family of four with two
children living in Hennepin County needs to earn $45,576
per year to meet the most basic of budgets. That’s about
the median wage for available jobs in Minnesota is $13 per hour.7 a single mother with two children needs to earn at least $19 per hour to meet the most basic of needs.8
Figure 1: it’s a Wage issue, not a WorK issue
Children’s Defense Fund–Minnesota | KIDS COUNT DATA BOOK 2014 5
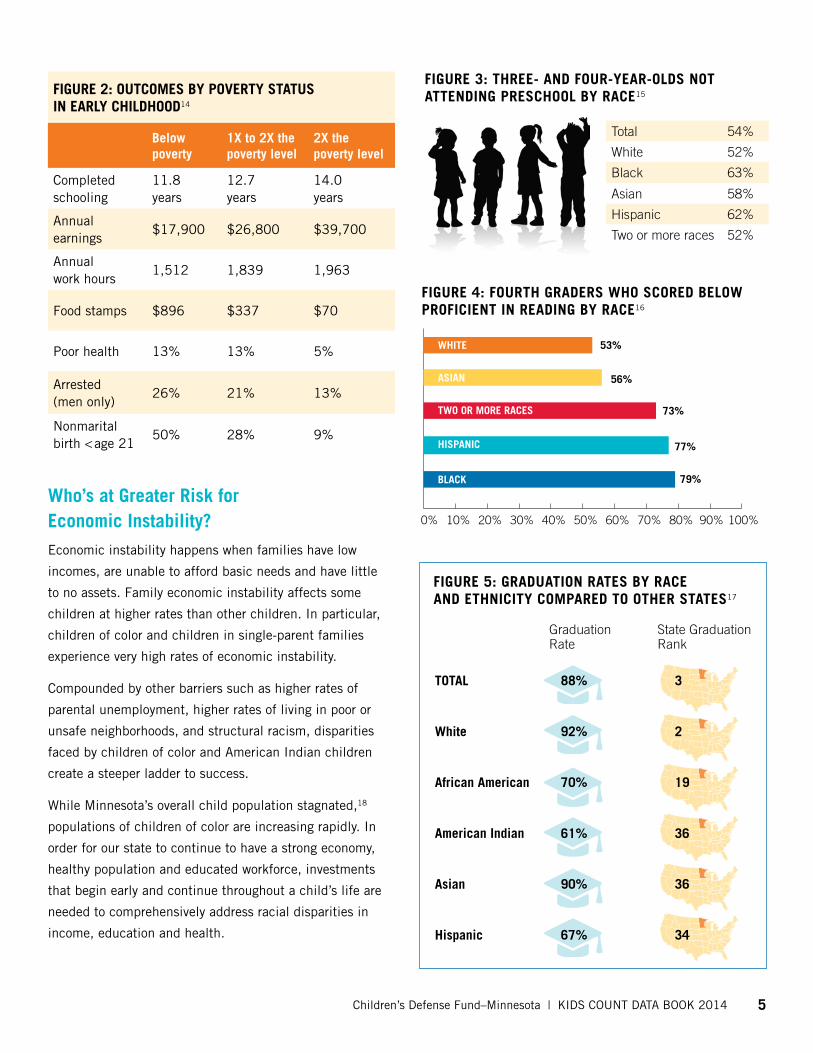
Figure 4: FourtH graDers WHo sCoreD BeLoW ProFiCient in reaDing By raCe16
0% 10% 20% 30% 40% 50% 60% 70% 80% 90% 100%
53%WHite
asian
tWo or More raCes
HisPaniC
BLaCK
56%
73%
77%
79%
Total 54%
White 52%
Black 63%
Asian 58%
Hispanic 62%
Two or more races 52%
Figure 3: tHree- anD Four-year-oLDs not attenDing PresCHooL By raCe15
totaL 88% 3
White 92% 2
african american 70% 19
american indian 61% 36
asian 90% 36
Hispanic 67% 34
Figure 5: graDuation rates By raCe anD etHniCity CoMPareD to otHer states17
Graduation Rate
State Graduation Rank
Who’s at greater risk for economic instability?Economic instability happens when families have low
incomes, are unable to afford basic needs and have little
to no assets. Family economic instability affects some
children at higher rates than other children. In particular,
children of color and children in single-parent families
experience very high rates of economic instability.
Compounded by other barriers such as higher rates of
parental unemployment, higher rates of living in poor or
unsafe neighborhoods, and structural racism, disparities
faced by children of color and American Indian children
create a steeper ladder to success.
While Minnesota’s overall child population stagnated,18
populations of children of color are increasing rapidly. In
order for our state to continue to have a strong economy,
healthy population and educated workforce, investments
that begin early and continue throughout a child’s life are
needed to comprehensively address racial disparities in
income, education and health.
Figure 2: outCoMes By Poverty status in earLy CHiLDHooD14
Below poverty
1X to 2X the poverty level
2X the poverty level
Completed schooling
11.8 years
12.7 years
14.0 years
Annual earnings
$17,900 $26,800 $39,700
Annual work hours
1,512 1,839 1,963
Food stamps $896 $337 $70
Poor health 13% 13% 5%
Arrested (men only)
26% 21% 13%
Nonmarital birth < age 21
50% 28% 9%
6 KIDS COUNT DATA BOOK 2014 | Children’s Defense Fund–Minnesota
Child
ren o
f two o
r mor
e rac
es in
pove
rty
Child
ren o
f two o
r mor
e rac
es in
pove
rty, a
s % of
all ch
ildre
n of t
wo or m
ore r
aces
.
Single-parent households face additional economic barriers
to providing for their families with the most obvious being
that there is only one available worker in the household.
Moreover, most single-parent families are headed by women
who often earn less than men even when working in similar
careers. Additional hardships like affording and arranging
child care and transportation affect single-parents’ ability
to work and earn enough to meet basic needs.
0%
10%
20%
30%
40%
50%
0
50,000
100,000
150,000
200,000
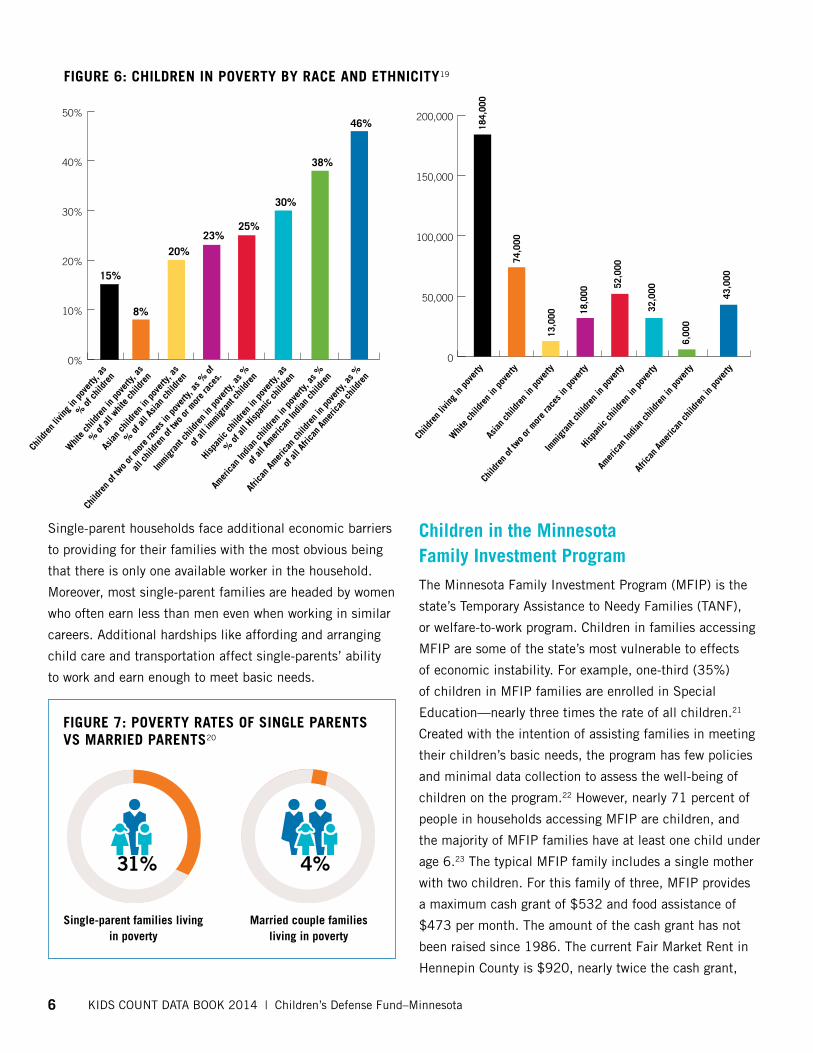
Figure 6: CHiLDren in Poverty By raCe anD etHniCity19
Child
ren l
iving
in po
verty
, as
% of
child
ren
Child
ren l
iving
in po
verty
Whit
e chil
dren
in po
verty
, as
% of
all w
hite c
hildr
en
Whit
e chil
dren
in po
verty
asian
child
ren i
n pov
erty,
as
% of
all a
sian c
hildr
en
asian
child
ren i
n pov
erty
immigr
ant c
hildr
en in
pove
rty, a
s %
of all
immigr
ant c
hildr
en
immigr
ant c
hildr
en in
pove
rty
Hisp
anic
child
ren i
n pov
erty,
as
% of
all H
ispan
ic ch
ildre
n
Hisp
anic
child
ren i
n pov
erty
amer
ican i
ndian
child
ren i
n pov
erty,
as %
of all
amer
ican i
ndian
child
ren
amer
ican i
ndian
child
ren i
n pov
erty
afric
an a
merica
n chil
dren
in po
verty
, as %
of all
afri
can a
merica
n chil
dren
afric
an a
merica
n chil
dren
in po
verty
15%
8%
20%
184,
000
74,0
00
13,0
00
52,0
00
32,0
00
6,00
0
43,0
00
18,0
00
25%
30%
38%
46%
23%
Children in the Minnesota Family investment ProgramThe Minnesota Family Investment Program (MFIP) is the
state’s Temporary Assistance to Needy Families (TANF),
or welfare-to-work program. Children in families accessing
MFIP are some of the state’s most vulnerable to effects
of economic instability. For example, one-third (35%)
of children in MFIP families are enrolled in Special
Education—nearly three times the rate of all children.21
Created with the intention of assisting families in meeting
their children’s basic needs, the program has few policies
and minimal data collection to assess the well-being of
children on the program.22 However, nearly 71 percent of
people in households accessing MFIP are children, and
the majority of MFIP families have at least one child under
age 6.23 The typical MFIP family includes a single mother
with two children. For this family of three, MFIP provides
a maximum cash grant of $532 and food assistance of
$473 per month. The amount of the cash grant has not
been raised since 1986. The current Fair Market Rent in
Hennepin County is $920, nearly twice the cash grant,
Figure 7: Poverty rates oF singLe Parents vs MarrieD Parents20
Married couple families living in poverty
single-parent families living in poverty
31% 4%
Children’s Defense Fund–Minnesota | KIDS COUNT DATA BOOK 2014 7
and only 28 percent of MFIP families receive a housing
subsidy.25 Obviously, families accessing MFIP are not able
to meet even the most bare bones basic needs budget.
Children in households accessing MFIP are at risk of, or
are already experiencing, the harmful effects of living in
deep poverty that can last a lifetime. Increasing the grant,
improving access to high-quality early childhood education
and stimulating parents’ earning potential are investments
in these children that will prevent high cost remedial
services and improve long-term outcomes.26
the Family BudgetTo assess the compounding effects of economic instability,
examining a family budget allows for a closer look at how
and why so many families across the state are struggling to
provide basic needs for their children. This year’s data book
examines how the components of the family budget affect
access to basic needs and opportunities. The data book is
organized by basic needs expenses: food, housing, health
care, child care, transportation and other necessities.
Most families have additional expenses beyond covering
their basic needs such as debt payments, cell phone bills
and school-related expenses. Ideally, families would also
have the resources to pay for these expenses and save for
emergencies, retirement and college. But first, families
must be able to meet their basic needs. To examine the
ability of Minnesota families to afford basic needs, each
section of the data book will feature a basic need expense
with data and information about how families meet (or
don’t meet) each expense using income and work support
programs. The last section will discuss asset development
and how critical it is to sustaining economic stability.
Work support Programs27 Work support programs such as Medicaid, Supplemental
Nutrition Assistance (SNAP), Energy Assistance, School
Meal and Women, Infants & Children (WIC) were created
to help low-wage workers meet their basic needs because
federal and state policymakers recognized that low-wage
jobs did not provide enough to make ends meet. Tax
policies that placed less liability on lower income workers
were enacted for similar reasons.
Work support programs are often lumped into the category
of welfare programs; however, they are uniquely different
than traditional cash assistance programs that are aimed at
helping people with very little to no income. Work support
programs were created to encourage workers to take low-
wage jobs rather than rely on welfare or cash programs.
In fact, the United States has long relied on government
policies to provide incentives for the lower class to build
assets, achieve economic security and move into the
middle class. For centuries, government has enacted tax
policies and programs to influence citizen behavior such
as land grants, homestead acts, farm credits, college
loans, subsidized retirement accounts, home mortgage
deductions, the G.I. Bill and Social Security just to name
a few.
$0
$10,000
$20,000
$30,000
$40,000
$50,000
$60,000
$70,000
$80,000
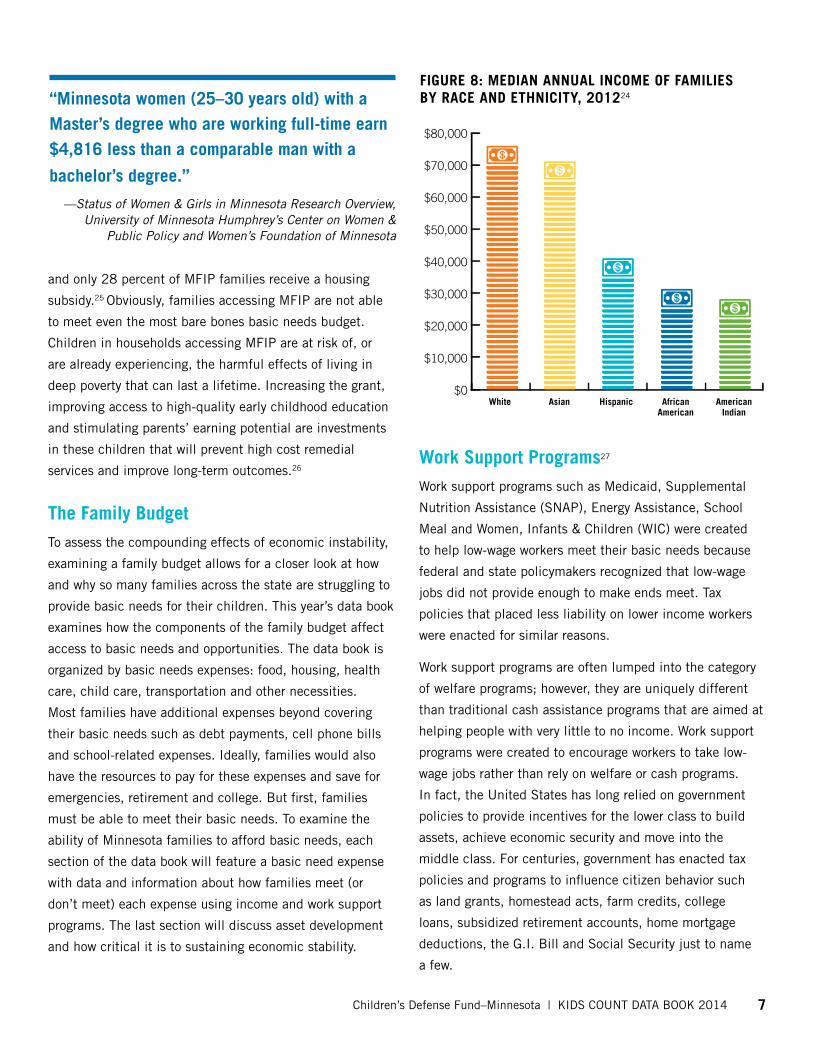
Figure 8: MeDian annuaL inCoMe oF FaMiLies By raCe anD etHniCity, 201224
White asian Hispanic african american
american indian
“Minnesota women (25–30 years old) with a Master’s degree who are working full-time earn $4,816 less than a comparable man with a
bachelor’s degree.”
—Status of Women & Girls in Minnesota Research Overview, University of Minnesota Humphrey’s Center on Women &
Public Policy and Women’s Foundation of Minnesota
8 KIDS COUNT DATA BOOK 2014 | Children’s Defense Fund–Minnesota
0%
20%
40%
60%
80%
100%
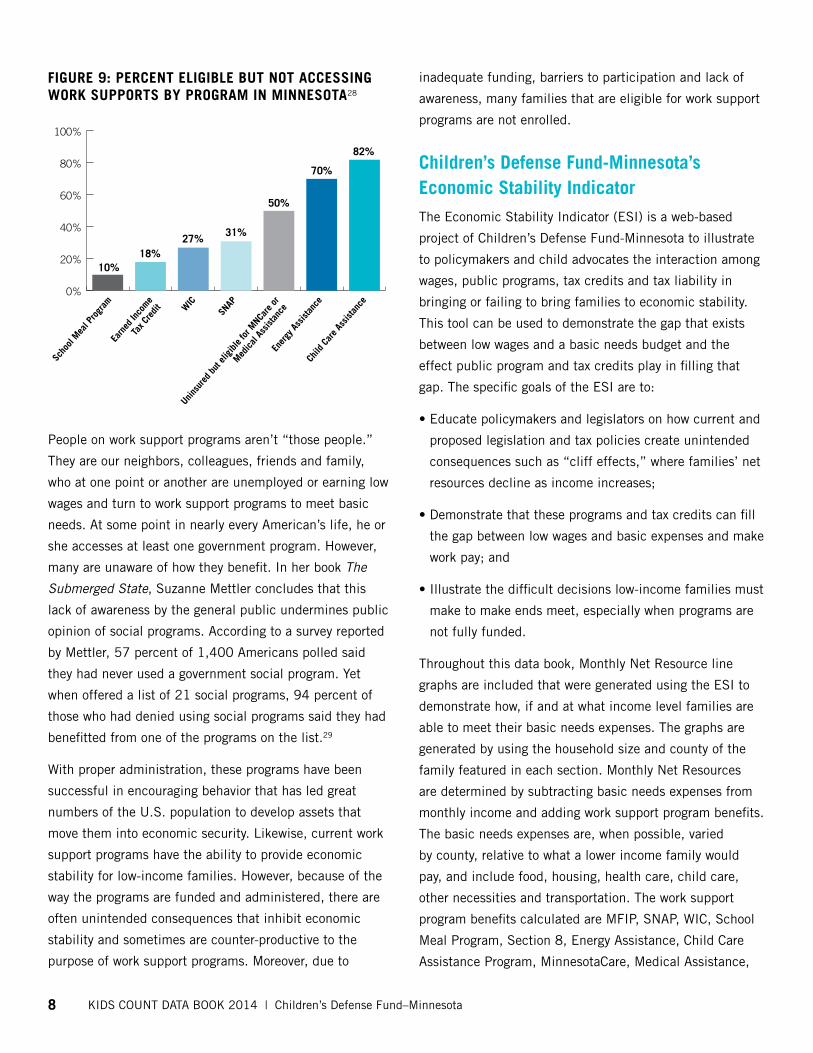
Figure 9: PerCent eLigiBLe But not aCCessing WorK suPPorts By PrograM in Minnesota28
scho
ol Mea
l Pro
gram
earn
ed in
come
tax C
redit W
iC
snaP
unins
ured
but e
ligibl
e for
MnC
are o
r
Medica
l ass
istan
ceen
ergy
ass
istan
ce
Child
Car
e ass
istan
ce
10%18%
27%31%
50%
70%
82%
People on work support programs aren’t “those people.”
They are our neighbors, colleagues, friends and family,
who at one point or another are unemployed or earning low
wages and turn to work support programs to meet basic
needs. At some point in nearly every American’s life, he or
she accesses at least one government program. However,
many are unaware of how they benefit. In her book The
Submerged State, Suzanne Mettler concludes that this
lack of awareness by the general public undermines public
opinion of social programs. According to a survey reported
by Mettler, 57 percent of 1,400 Americans polled said
they had never used a government social program. Yet
when offered a list of 21 social programs, 94 percent of
those who had denied using social programs said they had
benefitted from one of the programs on the list.29
With proper administration, these programs have been
successful in encouraging behavior that has led great
numbers of the U.S. population to develop assets that
move them into economic security. Likewise, current work
support programs have the ability to provide economic
stability for low-income families. However, because of the
way the programs are funded and administered, there are
often unintended consequences that inhibit economic
stability and sometimes are counter-productive to the
purpose of work support programs. Moreover, due to
inadequate funding, barriers to participation and lack of
awareness, many families that are eligible for work support
programs are not enrolled.
Children’s Defense Fund-Minnesota’s economic stability indicatorThe Economic Stability Indicator (ESI) is a web-based
project of Children’s Defense Fund-Minnesota to illustrate
to policymakers and child advocates the interaction among
wages, public programs, tax credits and tax liability in
bringing or failing to bring families to economic stability.
This tool can be used to demonstrate the gap that exists
between low wages and a basic needs budget and the
effect public program and tax credits play in filling that
gap. The specific goals of the ESI are to:
•Educatepolicymakersandlegislatorsonhowcurrentand
proposed legislation and tax policies create unintended
consequences such as “cliff effects,” where families’ net
resources decline as income increases;
•Demonstratethattheseprogramsandtaxcreditscanfill
the gap between low wages and basic expenses and make
work pay; and
•Illustratethedifficultdecisionslow-incomefamiliesmust
make to make ends meet, especially when programs are
not fully funded.
Throughout this data book, Monthly Net Resource line
graphs are included that were generated using the ESI to
demonstrate how, if and at what income level families are
able to meet their basic needs expenses. The graphs are
generated by using the household size and county of the
family featured in each section. Monthly Net Resources
are determined by subtracting basic needs expenses from
monthly income and adding work support program benefits.
The basic needs expenses are, when possible, varied
by county, relative to what a lower income family would
pay, and include food, housing, health care, child care,
other necessities and transportation. The work support
program benefits calculated are MFIP, SNAP, WIC, School
Meal Program, Section 8, Energy Assistance, Child Care
Assistance Program, MinnesotaCare, Medical Assistance,
Children’s Defense Fund–Minnesota | KIDS COUNT DATA BOOK 2014 9
Advanced Premium Tax Credit, Earned Income Tax Credit,
Minnesota Working Family Credit, Federal Child Tax Credit,
Federal Child Care Tax Credit and Minnesota Child Care
Tax Credit.
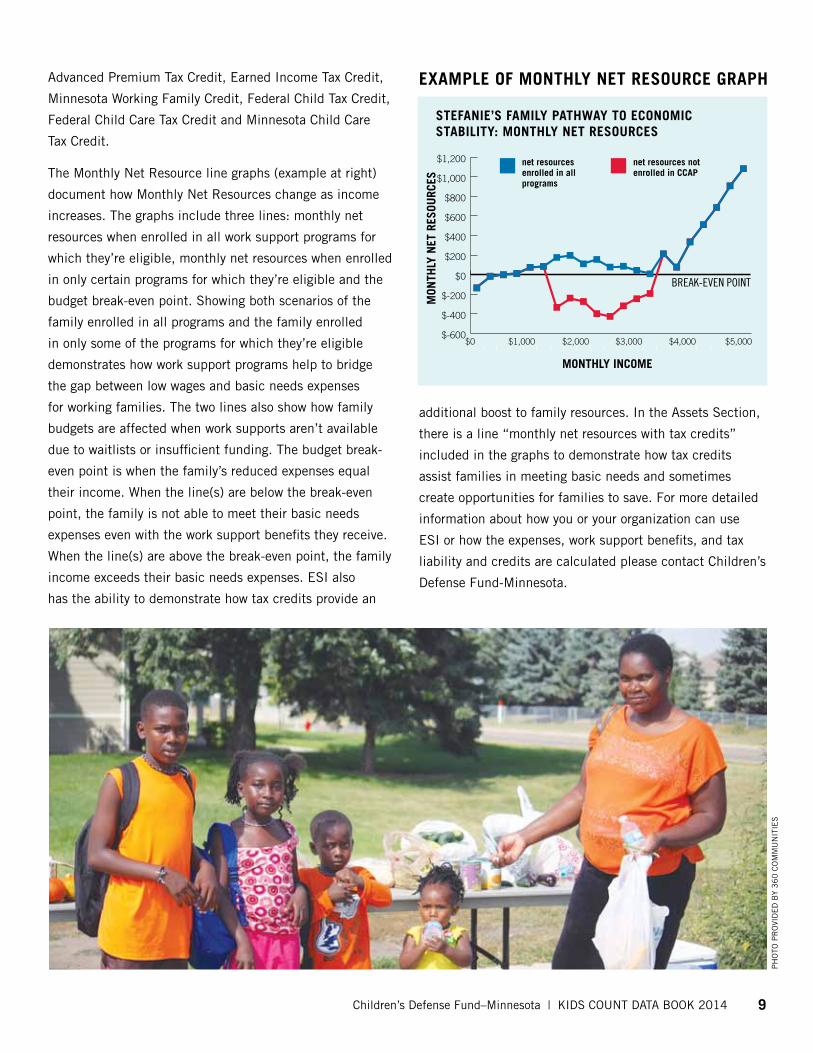
The Monthly Net Resource line graphs (example at right)
document how Monthly Net Resources change as income
increases. The graphs include three lines: monthly net
resources when enrolled in all work support programs for
which they’re eligible, monthly net resources when enrolled
in only certain programs for which they’re eligible and the
budget break-even point. Showing both scenarios of the
family enrolled in all programs and the family enrolled
in only some of the programs for which they’re eligible
demonstrates how work support programs help to bridge
the gap between low wages and basic needs expenses
for working families. The two lines also show how family
budgets are affected when work supports aren’t available
due to waitlists or insufficient funding. The budget break-
even point is when the family’s reduced expenses equal
their income. When the line(s) are below the break-even
point, the family is not able to meet their basic needs
expenses even with the work support benefits they receive.
When the line(s) are above the break-even point, the family
income exceeds their basic needs expenses. ESI also
has the ability to demonstrate how tax credits provide an
additional boost to family resources. In the Assets Section,
there is a line “monthly net resources with tax credits”
included in the graphs to demonstrate how tax credits
assist families in meeting basic needs and sometimes
create opportunities for families to save. For more detailed
information about how you or your organization can use
ESI or how the expenses, work support benefits, and tax
liability and credits are calculated please contact Children’s
Defense Fund-Minnesota.
eXaMPLe oF MontHLy net resourCe graPH
$-600
$-400
$-200
$0
$200
$400
$600
$800
$1,000
$1,200
$5,000$4,000$3,000$2,000$1,000
BREAK-EVEN POINT
$0
steFanie’s FaMiLy PatHWay to eConoMiC staBiLity: MontHLy net resourCes
net resources enrolled in all programs
net resources not enrolled in CCaP
Mon
tHLy
net
res
ourC
es
MontHLy inCoMe
PH
OTO
PR
OvI
DE
D B
Y 3
60
CO
MM
UN
ITIE
S

10 KIDS COUNT DATA BOOK 2014 | Children’s Defense Fund–Minnesota
in a state riCH with agriculture and
one of the fastest growing economies
nationwide, it’s easy to imagine that no
child in Minnesota would have to go to
bed hungry. Hunger pains shouldn’t be
affecting Minnesota children’s ability to
pay attention in school or be active and
healthy. Far too often, however, families
across the state can’t access or afford
enough food for their children. Nearly 1 in 6
children in Minnesota live in food insecure
households.30 Research shows that hunger,
especially when persistent, has long-
term effects on a child’s development.31
To ensure all children are on track
developmentally, ready to learn and are
healthy, it’s imperative that children have
enough nutritious food to eat.
FooD
By tHe nuMBers
0
20,000
40,000
60,000
80,000
100,000
120,000
2007 2008 2009 2010 2011 2012
HouseHoLDs WitH CHiLDren enroLLeD in snaP34
600.000
775,000
950,000
1,125,000
1,300,000
2007 2008 2009 2010 2011 2012 2013
nuMBer oF CHiLDren WHose FaMiLies visiteD FooD sHeLves (non-unique)35
FooD Deserts in Mn32
CHiLDren PartiCiPating in snaP eDuCation33
SNAP-Ed is free nutrition education for SNAP-eligible clients delivered by community nutrition educators from the University of Minnesota Extension and Minnesota Chippewa Tribe.
41,194
A food desert is an area with
limited access to affordable,
nutritious food, particularly in
low-income neighborhoods.
Map courtesy of Zack Avre, Minnesota 2020. Areas in orange are food deserts.
Children’s Defense Fund–Minnesota | KIDS COUNT DATA BOOK 2014 11
Work support Programs that reduce Food expenses
supplemental nutrition assistance
Program (snaP) helps families and
individuals pay for food. Benefits can
be spent at participating grocery and
convenience stores. In 2012, 239,674
Minnesota children, or 18.8%, were
enrolled in SNAP. Often referred to
as the “SNAP vaccine,” the program
has proven to reduce developmental
delays and improve health outcomes in
children.36
Woman, infants and Children (WiC)
Program provides food vouchers for
pregnant women, breastfeeding moth-
ers and children under age 5. The
vouchers pay for nutritious foods such
as infant formula, beans, fruits, veg-
etables and milk. In 2012, 40 percent
of infants and 20 percent of children
ages 1 to 5 were enrolled in WIC.
school Meal Program pays for the cost
of breakfast and lunch for children at
school. Nearly 40 percent of school-
age children were enrolled in 2013.
Children enrolled in the School Meal
Program often do not eat the free
school breakfast. Only 45 percent of
school breakfast meals available to
low-income children are being served
at Minnesota schools.37 Students who
participate in the School Breakfast
Program have better attendance,
behavior and academic performance.38
FaMiLy story: WHite Bear LaKe area eMergenCy FooD sHeLF
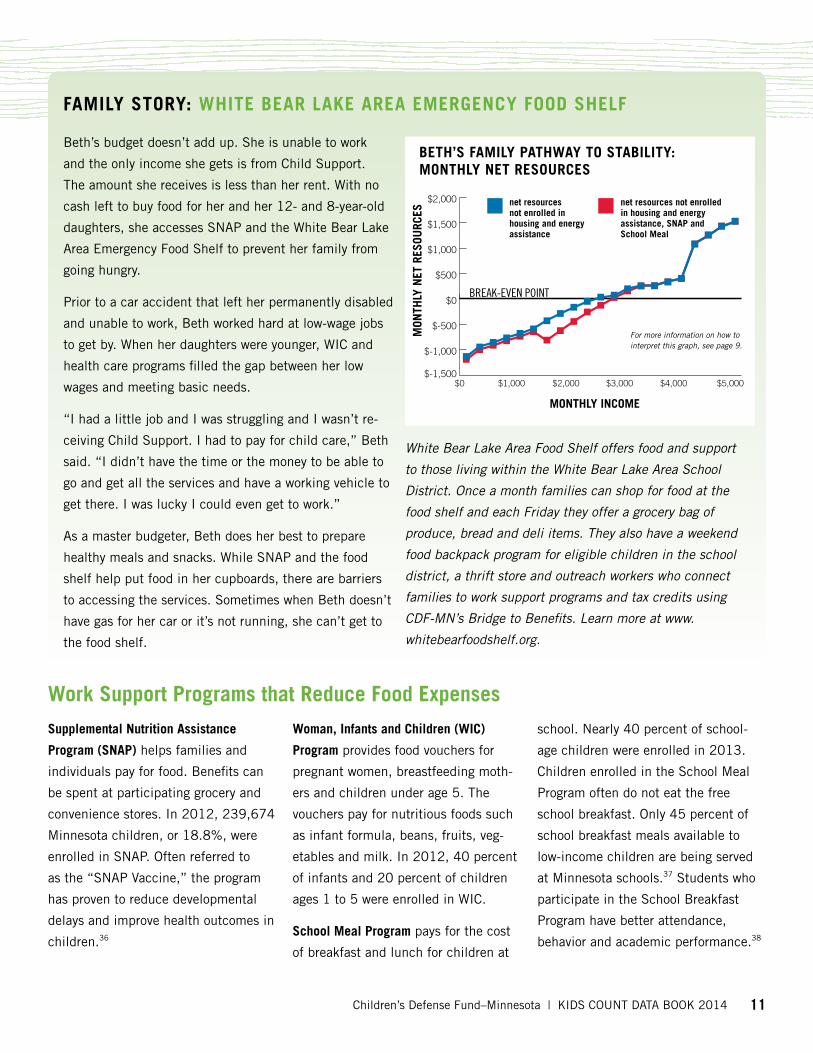
Beth’s budget doesn’t add up. She is unable to work
and the only income she gets is from Child Support.
The amount she receives is less than her rent. With no
cash left to buy food for her and her 12- and 8-year-old
daughters, she accesses SNAP and the White Bear Lake
Area Emergency Food Shelf to prevent her family from
going hungry.
Prior to a car accident that left her permanently disabled
and unable to work, Beth worked hard at low-wage jobs
to get by. When her daughters were younger, WIC and
health care programs filled the gap between her low
wages and meeting basic needs.
“I had a little job and I was struggling and I wasn’t re-
ceiving Child Support. I had to pay for child care,” Beth
said. “I didn’t have the time or the money to be able to
go and get all the services and have a working vehicle to
get there. I was lucky I could even get to work.”
As a master budgeter, Beth does her best to prepare
healthy meals and snacks. While SNAP and the food
shelf help put food in her cupboards, there are barriers
to accessing the services. Sometimes when Beth doesn’t
have gas for her car or it’s not running, she can’t get to
the food shelf.
$-1,500
$-1,000
$-500
$0
$500
$1,000
$1,500
$2,000
$5,000$4,000$3,000$2,000$1,000
BREAK-EVEN POINT
$0
BetH’s FaMiLy PatHWay to staBiLity:MontHLy net resourCes
net resources not enrolled in housing and energy assistance
net resources not enrolled in housing and energy assistance, snaP and school Meal
Mon
tHLy
net
res
ourC
esMontHLy inCoMe
White Bear Lake Area Food Shelf offers food and support
to those living within the White Bear Lake Area School
District. Once a month families can shop for food at the
food shelf and each Friday they offer a grocery bag of
produce, bread and deli items. They also have a weekend
food backpack program for eligible children in the school
district, a thrift store and outreach workers who connect
families to work support programs and tax credits using
CDF-MN’s Bridge to Benefits. Learn more at www.
whitebearfoodshelf.org.
For more information on how to interpret this graph, see page 9.
12 KIDS COUNT DATA BOOK 2014 | Children’s Defense Fund–Minnesota
Housing
MuCH oF a CHiLD’s Learning and
development happens at home. But if
the home isn’t a stable, safe or healthy
environment, the negative effects on children
go with them to child care centers, school and
into adulthood. Research shows children in
low-income families that have limited access
to affordable housing are more likely to live
in crowded housing or become homeless, and
are more likely to be food insecure and have
to postpone accessing health care.39 Moreover,
children who live in more affordable areas have
better health and academic outcomes and
fewer behavioral problems in adolescence.40
Affordable housing provides more room in the
family budget to pay for other basic necessities
such as food and health care, and provides
stability and an environment for a child to
better learn and grow.
By tHe nuMBers
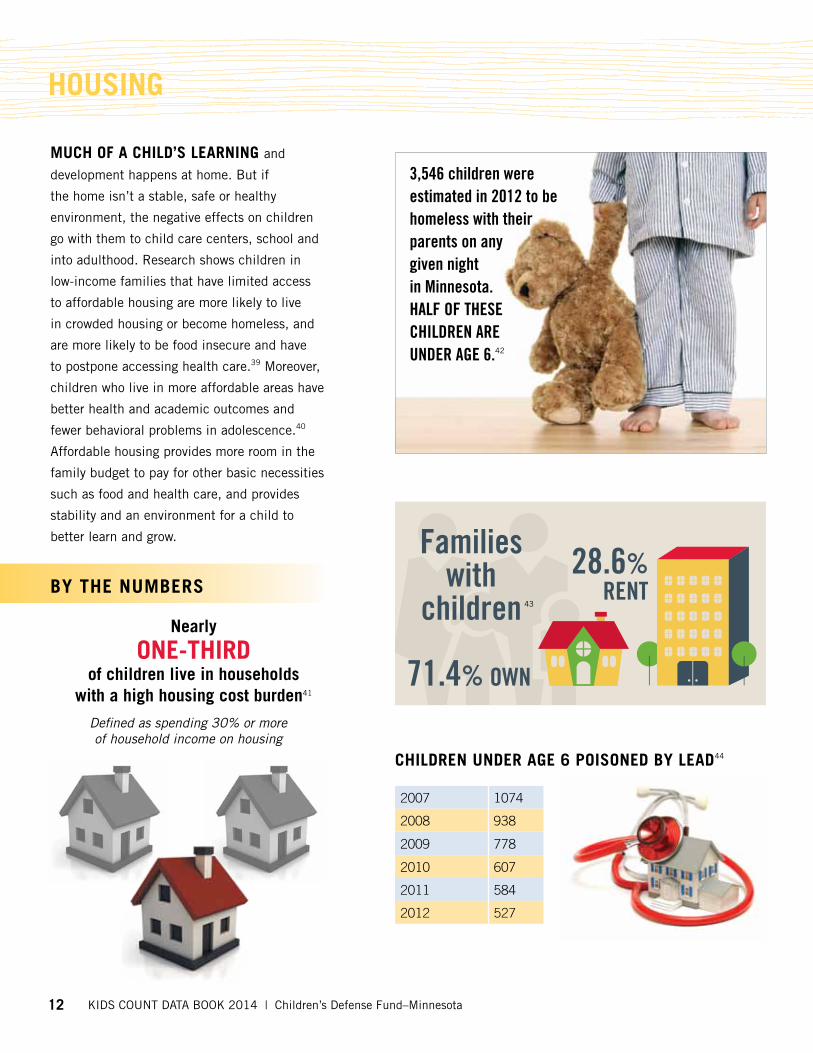
CHiLDren unDer age 6 PoisoneD By LeaD44
nearly
one-tHirD of children live in households
with a high housing cost burden41
3,546 children were estimated in 2012 to be homeless with their parents on any given night in Minnesota. Half of tHese cHildren are under age 6.42
28.6%RENT
71.4% OWN
Families with
children
2007 1074
2008 938
2009 778
2010 607
2011 584
2012 527
Defined as spending 30% or more of household income on housing
43
Children’s Defense Fund–Minnesota | KIDS COUNT DATA BOOK 2014 13
Work support Programs that reduce Housing expenses
Programs that make housing
affordable are notoriously underfunded
and, therefore, unavailable to the
majority of lower income families.
For every 100 families across the
country with income less than 30
percent of median income, there
are only 31 affordable and available
housing units.45 Most families with
lower incomes pay market rate for
housing. In the metro area, Fair
Market Rent for a two-bedroom
apartment is $920.46 That’s nearly
half the earnings of someone with
income equal to the Federal Poverty
Guidelines for a family of four.
section 8 is a housing choice voucher
program that helps people with lower
incomes, the elderly and the disabled
pay for housing. Recipients of the
program pay 30 percent of their
household income toward rent.
various other state and federal public
and private programs lower housing
costs for lower income families
through affordable housing complexes
and voucher programs.
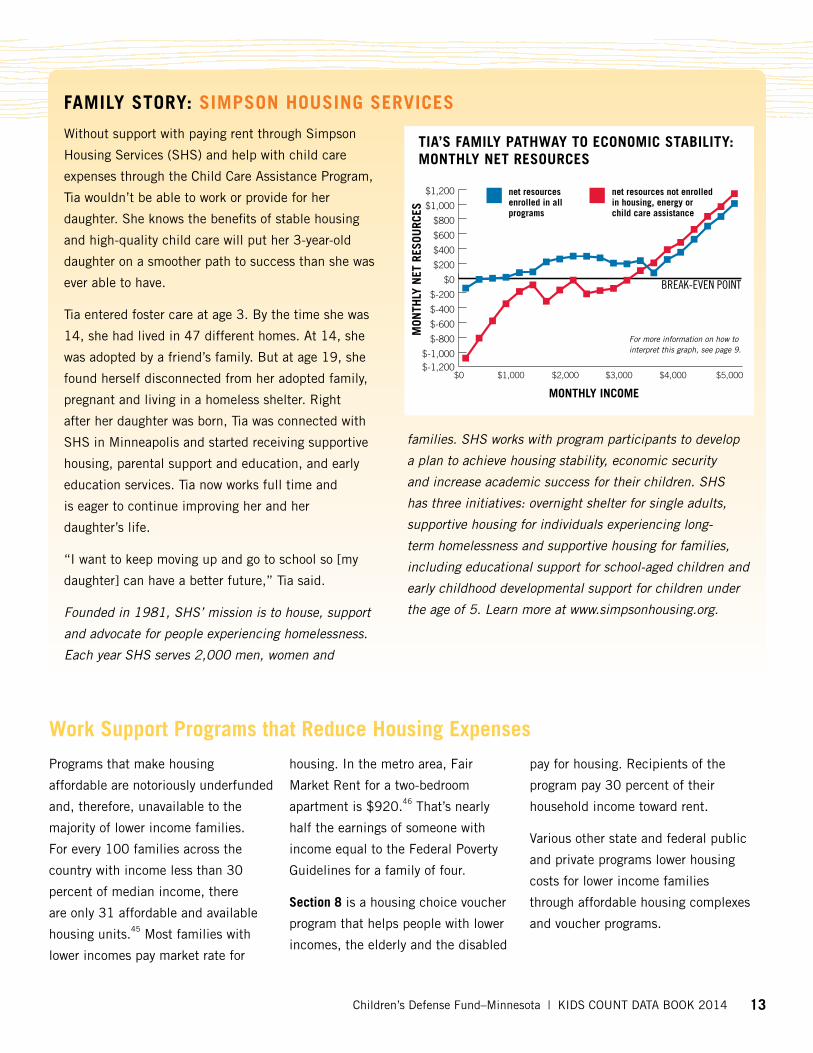
FaMiLy story: siMPson Housing serviCes
Without support with paying rent through Simpson
Housing Services (SHS) and help with child care
expenses through the Child Care Assistance Program,
Tia wouldn’t be able to work or provide for her
daughter. She knows the benefits of stable housing
and high-quality child care will put her 3-year-old
daughter on a smoother path to success than she was
ever able to have.
Tia entered foster care at age 3. By the time she was
14, she had lived in 47 different homes. At 14, she
was adopted by a friend’s family. But at age 19, she
found herself disconnected from her adopted family,
pregnant and living in a homeless shelter. Right
after her daughter was born, Tia was connected with
SHS in Minneapolis and started receiving supportive
housing, parental support and education, and early
education services. Tia now works full time and
is eager to continue improving her and her
daughter’s life.
“I want to keep moving up and go to school so [my
daughter] can have a better future,” Tia said.
Founded in 1981, SHS’ mission is to house, support
and advocate for people experiencing homelessness.
Each year SHS serves 2,000 men, women and
$-1,200$-1,000
$-800
$-600
$-400
$-200
$0
$200
$400
$600
$800
$1,000
$1,200
$5,000$4,000$3,000$2,000$1,000
BREAK-EVEN POINT
$0
tia’s FaMiLy PatHWay to eConoMiC staBiLity:MontHLy net resourCes
net resources enrolled in all programs
net resources not enrolled in housing, energy or child care assistance
Mon
tHLy
net
res
ourC
es
MontHLy inCoMe
families. SHS works with program participants to develop
a plan to achieve housing stability, economic security
and increase academic success for their children. SHS
has three initiatives: overnight shelter for single adults,
supportive housing for individuals experiencing long-
term homelessness and supportive housing for families,
including educational support for school-aged children and
early childhood developmental support for children under
the age of 5. Learn more at www.simpsonhousing.org.
For more information on how to interpret this graph, see page 9.
14 KIDS COUNT DATA BOOK 2014 | Children’s Defense Fund–Minnesota
HeaLtH Care
a CHiLD’s HeaLtH from prenatal to early
adulthood is the foundation for successful
passage into adulthood. To improve children’s
life outcomes, it’s necessary to ensure they live
in a healthy environment, have health insurance
and access regular preventative care. A child’s
health affects his of her ability to attend and
focus in school, social development and health
outcomes as adults. First and foremost, a child
needs to be insured to improve access and
affordability of care. Even families with moderate
income struggle to afford insurance and access
care. Medical debt is the number one cause
for filing bankruptcy, and more than 16 million
American children live in households struggling
to pay medical bills.47 In addition, an insufficient
number of providers, especially in rural areas, is
a barrier to seeing a dentist, family practitioner
or mental health professional. As progress in
recent years fueled by Medicaid, Children’s
Health Insurance Program (CHIP) and the
Affordable Care Act have demonstrated, it is
not only possible but economically sensible
to ensure all children have access to health
insurance and care.
By tHe nuMBers
0
20,000
40,000
60,000
80,000
100,000
2008–2010 2009–2011 2010–2012
5%
6%
7%
8%
2008 2009 2010 2011 2012 2013
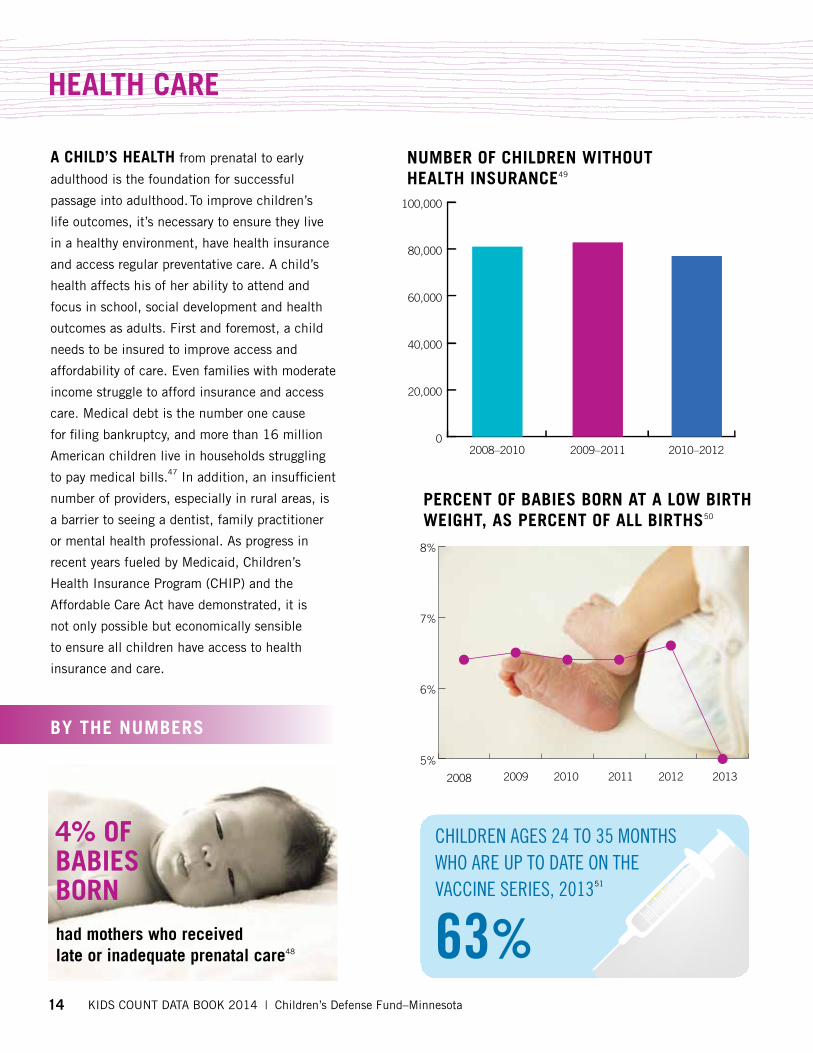
nuMBer oF CHiLDren WitHout HeaLtH insuranCe49
PerCent oF BaBies Born at a LoW BirtH WeigHt, as PerCent oF aLL BirtHs50
4% oF BaBies Bornhad mothers who received late or inadequate prenatal care48
Children Ages 24 to 35 months who Are up to dAte on the vACCine series, 201351
63%
Children’s Defense Fund–Minnesota | KIDS COUNT DATA BOOK 2014 15
Work support Programs that reduce Health Care expenses
Medical assistance (Ma), Minnesota’s
name for Medicaid, is a health care
program for some lower income
Minnesotans. It’s a completely free
program for children, but there are
some very minimal costs for parents
and adults without children. On
average, 329,064 Minnesota children
were enrolled in MA each month in
2013. Evidence across the country
suggests that expanded access to
Medicaid led to lower high school
dropout rates, increased college
attendance and more bachelor’s
degrees.52
MinnesotaCare is a health insurance
program for Minnesotans with lower
incomes who cannot get affordable
insurance through their employer
and do not qualify for Medical
Assistance. On average, 41,763
Minnesota children were enrolled in
MinnesotaCare each month in 2013.
Most of these children were moved into
MA when the program was expanded
by the Affordable Care Act on January
1, 2014.
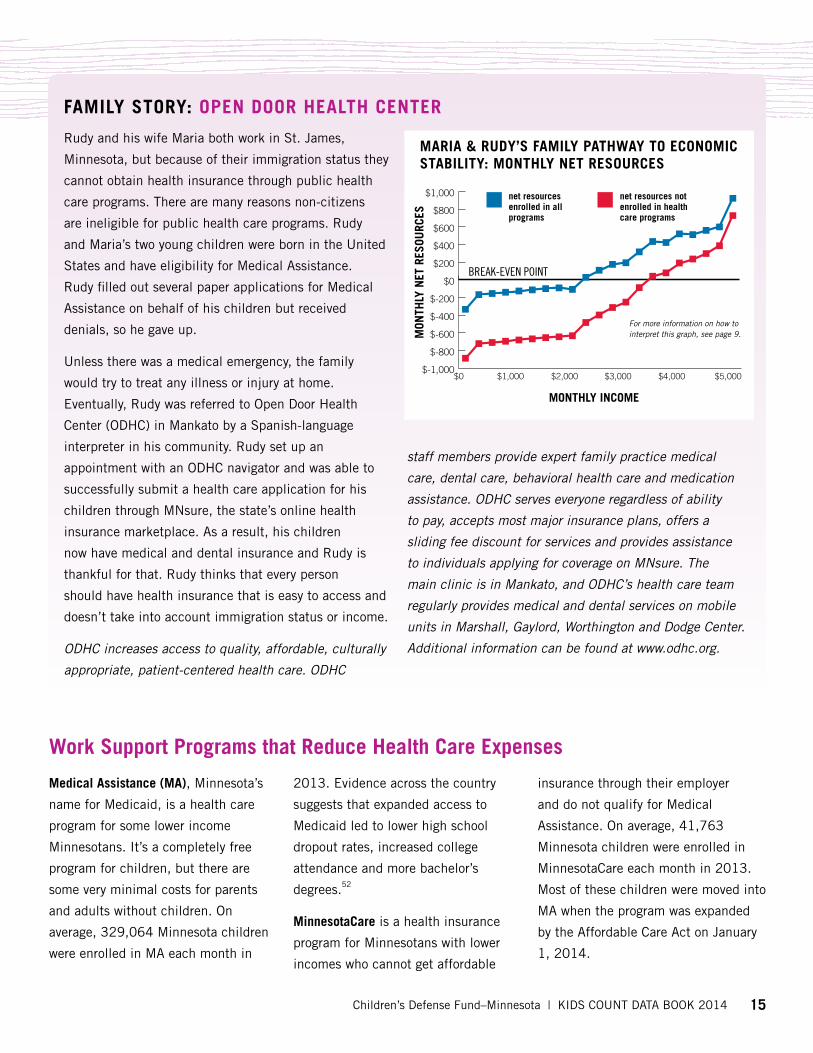
FaMiLy story: oPen Door HeaLtH Center
Rudy and his wife Maria both work in St. James,
Minnesota, but because of their immigration status they
cannot obtain health insurance through public health
care programs. There are many reasons non-citizens
are ineligible for public health care programs. Rudy
and Maria’s two young children were born in the United
States and have eligibility for Medical Assistance.
Rudy filled out several paper applications for Medical
Assistance on behalf of his children but received
denials, so he gave up.
Unless there was a medical emergency, the family
would try to treat any illness or injury at home.
Eventually, Rudy was referred to Open Door Health
Center (ODHC) in Mankato by a Spanish-language
interpreter in his community. Rudy set up an
appointment with an ODHC navigator and was able to
successfully submit a health care application for his
children through MNsure, the state’s online health
insurance marketplace. As a result, his children
now have medical and dental insurance and Rudy is
thankful for that. Rudy thinks that every person
should have health insurance that is easy to access and
doesn’t take into account immigration status or income.
ODHC increases access to quality, affordable, culturally
appropriate, patient-centered health care. ODHC
$-1,000
$-800
$-600
$-400
$-200
$0
$200
$400
$600
$800
$1,000
$5,000$4,000$3,000$2,000$1,000
BREAK-EVEN POINT
$0
Maria & ruDy’s FaMiLy PatHWay to eConoMiC staBiLity: MontHLy net resourCes
net resources enrolled in all programs
net resources not enrolled in health care programs
Mon
tHLy
net
res
ourC
es
MontHLy inCoMe
staff members provide expert family practice medical
care, dental care, behavioral health care and medication
assistance. ODHC serves everyone regardless of ability
to pay, accepts most major insurance plans, offers a
sliding fee discount for services and provides assistance
to individuals applying for coverage on MNsure. The
main clinic is in Mankato, and ODHC’s health care team
regularly provides medical and dental services on mobile
units in Marshall, Gaylord, Worthington and Dodge Center.
Additional information can be found at www.odhc.org.
For more information on how to interpret this graph, see page 9.
16 KIDS COUNT DATA BOOK 2014 | Children’s Defense Fund–Minnesota
CHiLD Care
as Part oF tHe FaMiLy BuDget, child
care is an expense that is often necessary for one
or both parents to work outside the home. But
child care can be much more than a safe place
to bring children while at work. A high-quality
child care setting—one with nurturing teacher-
child interaction, high-quality instruction and on-
going assessment of the child’s development53—
improves a child’s chances to be academically
and socially ready for kindergarten. This leads
to increased opportunity for success in grade
school, graduation from high school and higher
earnings as an adult.54 But affordable child care,
regardless of quality, is often far too expensive
for working families. According to Child Care
Aware of America, Minnesota ranked third
among states for the most expensive child care.55
Even for families earning the annual median
income for families raising children in Minnesota
($73,900), the cost of child care for one infant
is nearly 19 percent of household income.56
Increased access to and affordability of high-
quality early childhood education programs is a
two-generation approach to improving outcomes
for lower income children because it allows
parents to work, increases family income and
starts children on a path to success.
By tHe nuMBers
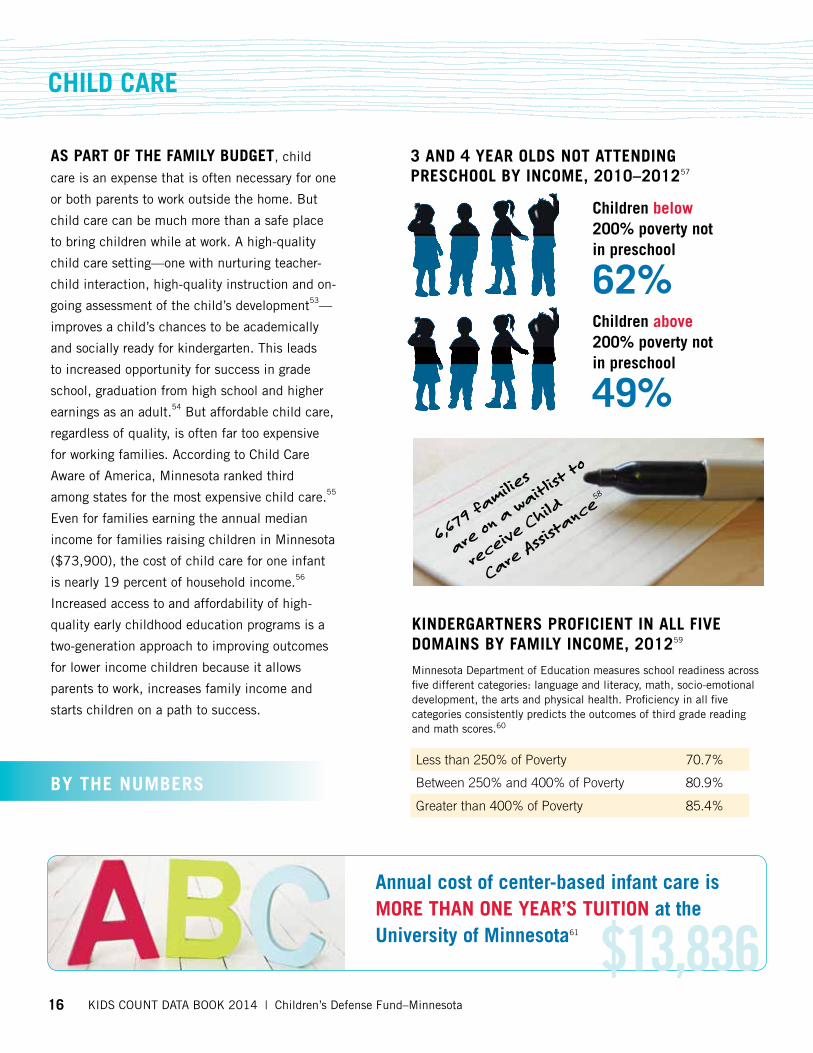
3 anD 4 year oLDs not attenDing PresCHooL By inCoMe, 2010–201257
Children below 200% poverty not in preschool
62%Children above 200% poverty not in preschool
49%
$13,836
KinDergartners ProFiCient in aLL Five DoMains By FaMiLy inCoMe, 201259
Minnesota Department of Education measures school readiness across five different categories: language and literacy, math, socio-emotional development, the arts and physical health. Proficiency in all five categories consistently predicts the outcomes of third grade reading and math scores.60
Less than 250% of Poverty 70.7%
Between 250% and 400% of Poverty 80.9%
Greater than 400% of Poverty 85.4%
6,679
familie
s
are on a waitli
st to
receive Child
Care Assista
nce
58
annual cost of center-based infant care is More tHan one year’s tuition at the university of Minnesota61
Children’s Defense Fund–Minnesota | KIDS COUNT DATA BOOK 2014 17
Work support Programs that reduce Child Care expensesChild Care assistance Program helps
parents with lower incomes pay for
child care for children under 13 or
children with disabilities under age 15.
CCAP has three subprograms to help
families:
•BasicSlidingFee(BSF)isfor
parents who are working, looking for
work or going to school;
•MinnesotaFamilyInvestment
Program (MFIP) Child Care is for
parents on MFIP; and
•TransitionYearChildCareisfor
parents in the first year after leaving
MFIP.
All families on MFIP that meet work
requirements have access to MFIP
Child Care and nearly all have access
to Transition Year Child Care. However,
BSF CCAP is not fully funded, so
nearly 7,000 families are on a waitlist
for the program. Only 82 percent of
income eligible children are enrolled
in CCAP.62 In 2013, 15,538 children
participated in BSF CCAP and 15,681
children participated in MFIP Child
Care and Transition Year.
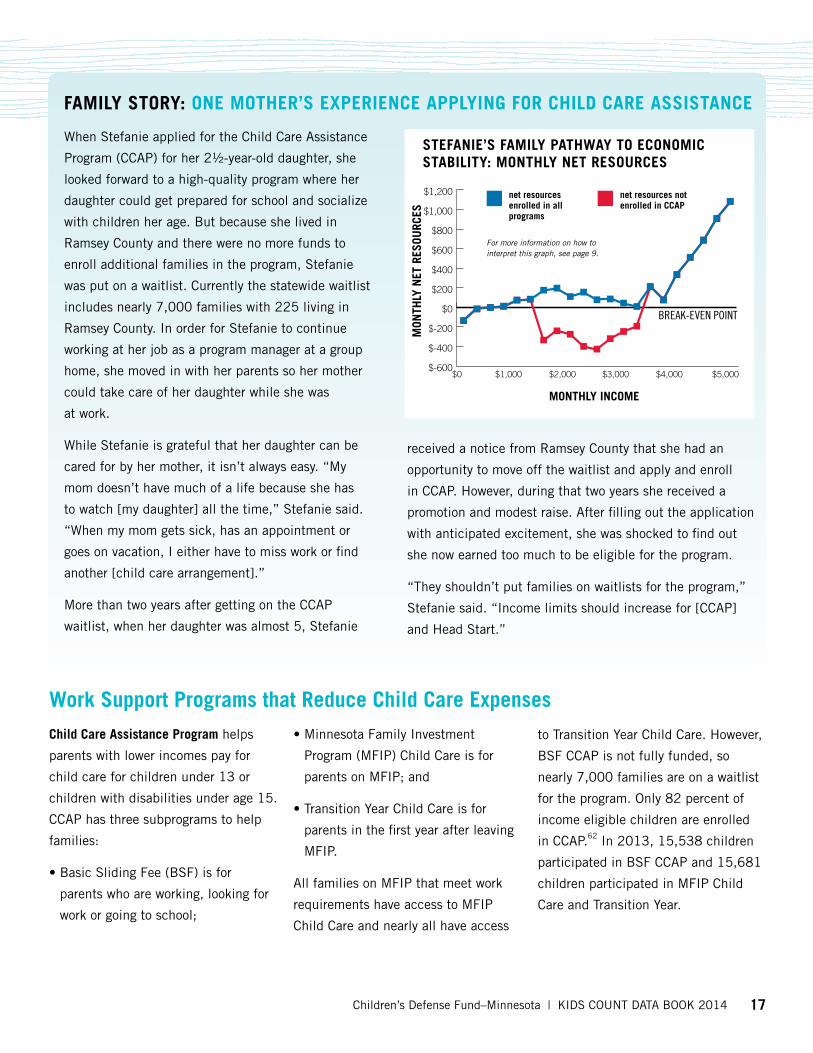
When Stefanie applied for the Child Care Assistance
Program (CCAP) for her 2½-year-old daughter, she
looked forward to a high-quality program where her
daughter could get prepared for school and socialize
with children her age. But because she lived in
Ramsey County and there were no more funds to
enroll additional families in the program, Stefanie
was put on a waitlist. Currently the statewide waitlist
includes nearly 7,000 families with 225 living in
Ramsey County. In order for Stefanie to continue
working at her job as a program manager at a group
home, she moved in with her parents so her mother
could take care of her daughter while she was
at work.
While Stefanie is grateful that her daughter can be
cared for by her mother, it isn’t always easy. “My
mom doesn’t have much of a life because she has
to watch [my daughter] all the time,” Stefanie said.
“When my mom gets sick, has an appointment or
goes on vacation, I either have to miss work or find
another [child care arrangement].”
More than two years after getting on the CCAP
waitlist, when her daughter was almost 5, Stefanie
$-600
$-400
$-200
$0
$200
$400
$600
$800
$1,000
$1,200
$5,000$4,000$3,000$2,000$1,000
BREAK-EVEN POINT
$0
steFanie’s FaMiLy PatHWay to eConoMiC staBiLity: MontHLy net resourCes
net resources enrolled in all programs
net resources not enrolled in CCaP
Mon
tHLy
net
res
ourC
es
MontHLy inCoMe
received a notice from Ramsey County that she had an
opportunity to move off the waitlist and apply and enroll
in CCAP. However, during that two years she received a
promotion and modest raise. After filling out the application
with anticipated excitement, she was shocked to find out
she now earned too much to be eligible for the program.
“They shouldn’t put families on waitlists for the program,”
Stefanie said. “Income limits should increase for [CCAP]
and Head Start.”
FaMiLy story: one MotHer’s eXPerienCe aPPLying For CHiLD Care assistanCe
For more information on how to interpret this graph, see page 9.
18 KIDS COUNT DATA BOOK 2014 | Children’s Defense Fund–Minnesota
transPortation
DroP CHiLD oFF at CHiLD Care. Drive to
work. Pick up child from child care. Drive to
grocery store. Drop child off at t-ball practice.
Pick child up from t-ball practice and drive
home. For many parents a lot of time is spent
in their car shuttling children to and from
school and activities and driving to and from
work. Every minute spent in the car is money
spent on gas, maintenance and insurance
—expenses so high that many low-income
families struggle to afford a car. When families
don’t have money to purchase or maintain a
car, let alone fill up the gas tank, it can prevent
parents from working, increase their stress
level and reduce a child’s access to after-
school programs and healthy food. Moreover,
there are few public or private programs
that assist families with purchasing and
maintaining a car and filling gas tanks. The
programs across the state that do help a family
purchase a car have proven to increase work
hours and reduce welfare participation.
By tHe nuMBers
Transit for Livable Communities (TLC) is a nonprofit
organization working to transform Minnesota’s transportation
system to strengthen community, improve health and
opportunity for all people, foster a sound economy, and
protect our natural resources. Recognizing that transportation
is often an unmet basic need, TLC’s Transportation Options
program combines workshops for social service staff and
assistance for clients/participants with the goal of addressing
the high cost of getting around. The program focuses on the
asset building potential of options such as biking, walking,
transit, car sharing and bike sharing. The workshop immerses
social service staff into the realities, barriers and solutions to
using options other than driving to access jobs, education and
financial stability. Learn more at www.tlcminnesota.org.
FaMiLy resourCe: transit For LivaBLe CoMMunities
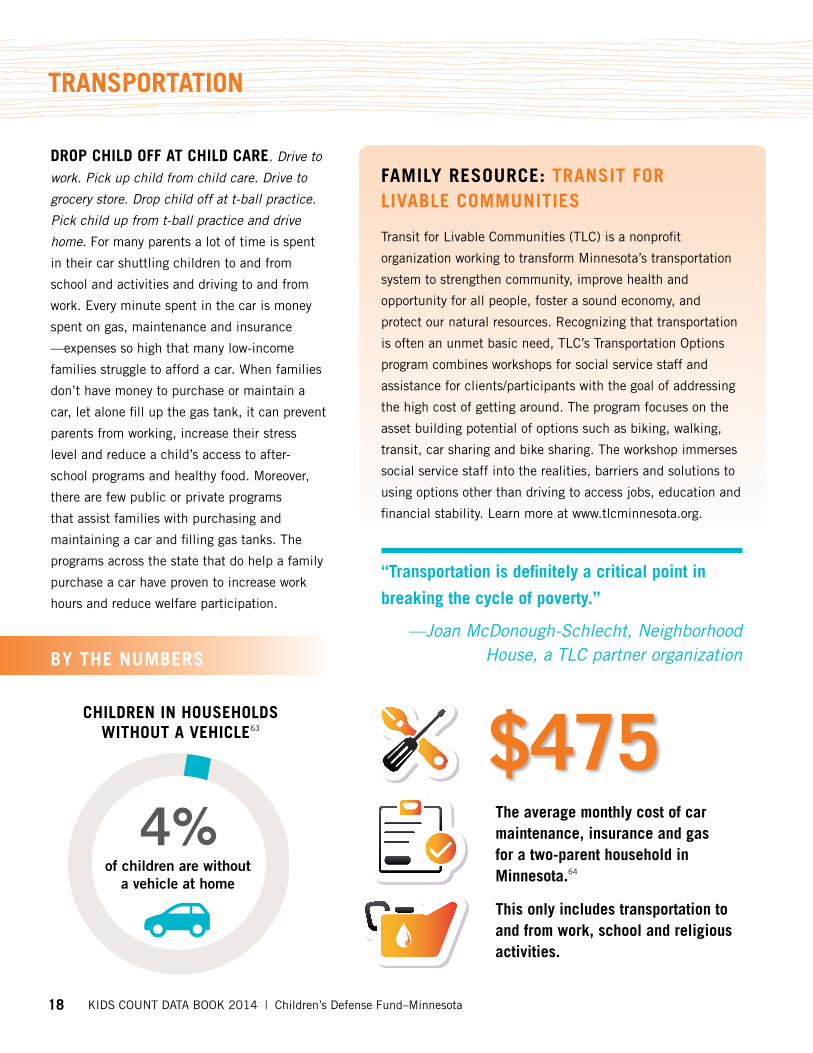
CHiLDren in HouseHoLDs WitHout a veHiCLe63
4%of children are without
a vehicle at home
“transportation is definitely a critical point in
breaking the cycle of poverty.”
—Joan McDonough-Schlecht, Neighborhood House, a TLC partner organization
$475the average monthly cost of car maintenance, insurance and gas for a two-parent household in Minnesota.64
this only includes transportation to and from work, school and religious activities.
Children’s Defense Fund–Minnesota | KIDS COUNT DATA BOOK 2014 19
otHer neCessities
BesiDes tHe oBvious FaMiLy BuDget Line iteMs, there are a few other
necessities that families need to have a safe
and healthy standard of living. This includes
housekeeping supplies, household furnishings
and equipment, telephone services, clothing,
and personal care products and services.
For families with younger children this also
includes the cost of diapers, wipes, car seats
and other items necessary for young children.
Oftentimes these items are the first to be
sacrificed when families face a budget crunch.
There are few public or private programs to
reduce the costs of these types of items.
Occasionally, these items are available at
food shelves and other distribution centers,
but quantities are limited and they are quick
to leave the shelves. Safety, self-esteem and
health concerns can affect children in families
who struggle to afford these necessities.
By tHe nuMBers
When Karen’s family home burned down a couple of years ago,
they lost nearly everything. During their time of need, Angels of
Hope in Pine City was a lifesaver, Karen said. The nonprofit food
shelf is one of few organizations in rural Minnesota that provides
donated essentials to families in need. Karen received furniture,
clothing and food to help her family rebuild their home.
Started and run by local community member Len Slama, Angels
of Hope is a service for lower income families in rural Pine City
for monthly food shelf visits, holiday food baskets and other ne-
cessities such as furnishings, diapers and clothing. With no paid
staff, just volunteers, they go above and beyond by delivering
food baskets to families or seniors that lack transportation and
periodically checking up on the people they serve.
“Angels of Hope will always remain lovingly in our hearts,”
Karen said. “When people kept giving us stuff after the fire, we
gave the excess items to Angels of Hope so we could give back.”
FaMiLy story: angeLs oF HoPe
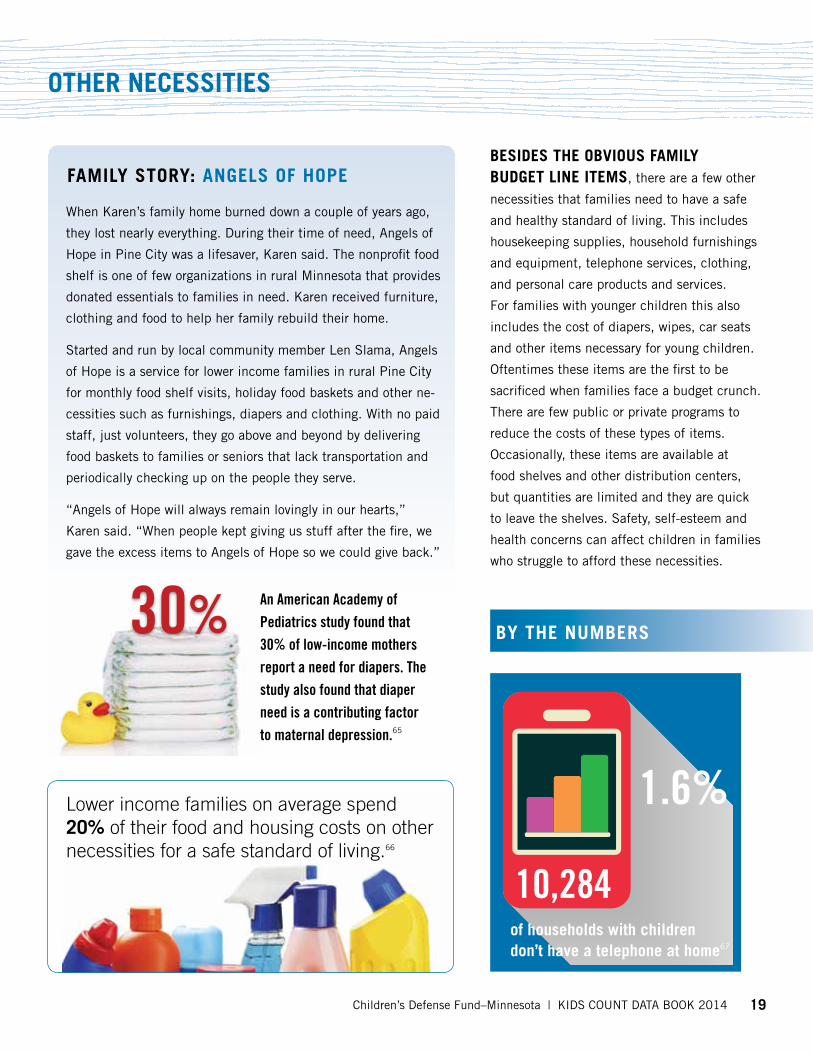
an american academy of Pediatrics study found that 30% of low-income mothers report a need for diapers. the study also found that diaper need is a contributing factor to maternal depression.65
30%
10,284 of households with children don’t have a telephone at home67
1.6%Lower income families on average spend 20% of their food and housing costs on other necessities for a safe standard of living.66
20 KIDS COUNT DATA BOOK 2014 | Children’s Defense Fund–Minnesota
assets
For FaMiLies struggLing to meet their
basic needs, developing assets often appears
to be an unattainable dream afforded to
those who don’t have to worry about where
their next meal will come from or whether
or not they will be able to make the rent
payment. Although not necessarily a basic
need, assets cannot be overlooked when
examining how family economics affect
child outcomes. For all families, developing
assets is the pathway to achieving economic
stability that allows them to weather the
inevitable financial storms of flat tires, pink
slips and medical emergencies. Assets should
include savings for emergencies, retirement
and college, as well as purchases that
improve economic stability and opportunity
such as homes, cars and education. It’s
not just low-income families that struggle
to develop assets. One-quarter of middle
class households in the United States are
liquid-asset poor.68 Liquid asset poverty is
conservatively defined as having savings
that equal less than three months worth of
earnings at the poverty level or $5,887 for
a family of four.69 Asset development starts
with being able to meet basic needs, so that’s
why work support programs are essential
to creating long-term economic stability.
The next step for many families is getting
household debt under control and improving
credit scores. Then lower income families
can identify opportunities to save through
budgeting, tax credits and increased access
to mainstream financial services.
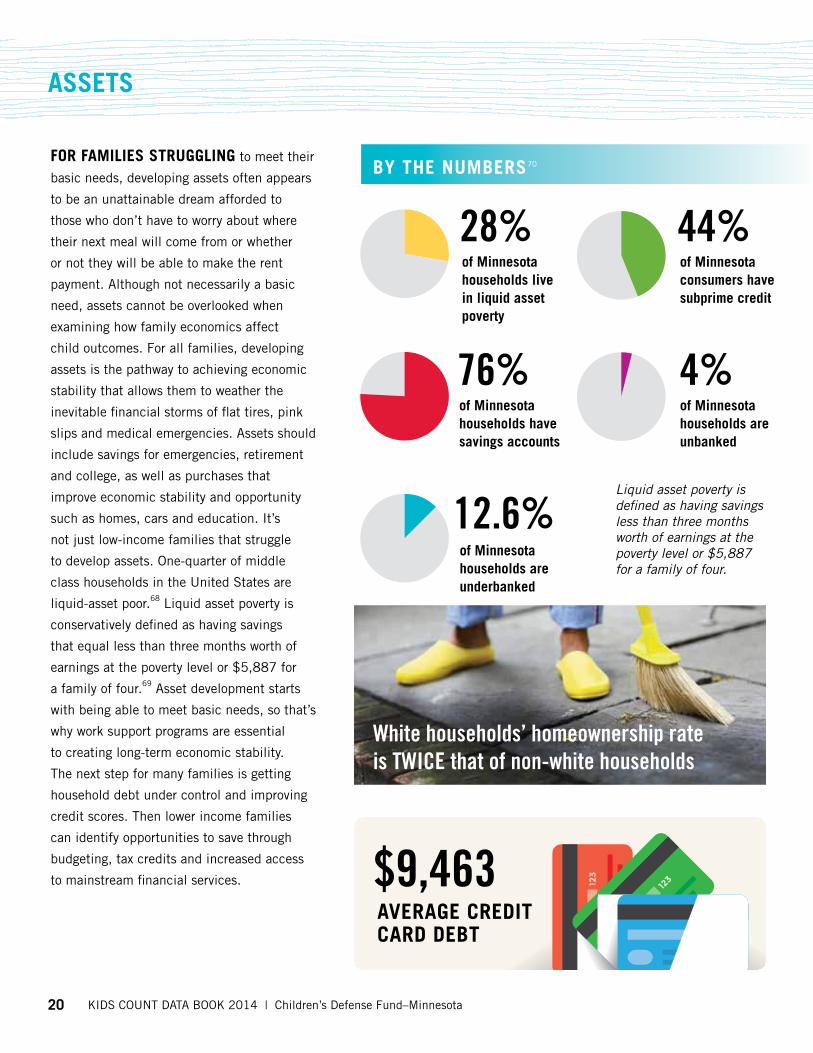
By tHe nuMBers70
of Minnesota households live in liquid asset poverty
of Minnesota consumers have subprime credit
of Minnesota households have savings accounts
of Minnesota households are unbanked
of Minnesota households are underbanked
28% 44%
76% 4%
12.6%
average CreDit CarD DeBt
$9,463
White households’ homeownership rate is tWice that of non-white households
Liquid asset poverty is defined as having savings less than three months worth of earnings at the poverty level or $5,887 for a family of four.
Children’s Defense Fund–Minnesota | KIDS COUNT DATA BOOK 2014 21
Programs that assist Families in Building assets
Family assets for independence in
Minnesota (FaiM): The FAIM program
helps Minnesota workers build assets
through purchase of a first home,
pursuit of a higher education at an
accredited public post-secondary
institution or small business
capitalization. FAIM account holders
place monthly savings into Bremer
Bank or City County Federal Credit
Union family asset accounts (savings
accounts) that will be matched $3
to $1 upon completion of program
requirements. The FAIM program is
administered by agencies throughout
Minnesota. Learn more about FAIM at
http://minnesotafaim.com.
$-400
$-200
$0
$200
$400
$600
$800
$1,000
$1,200
$5,000$4,000$3,000$2,000$1,000$0
BREAK-EVEN POINT
MontHLy net resourCes, FuLLy enroLLeD in aLL PrograMs
net income with tax credits
net income without tax credits
Mon
tHLy
net
res
ourC
es
MontHLy inCoMe
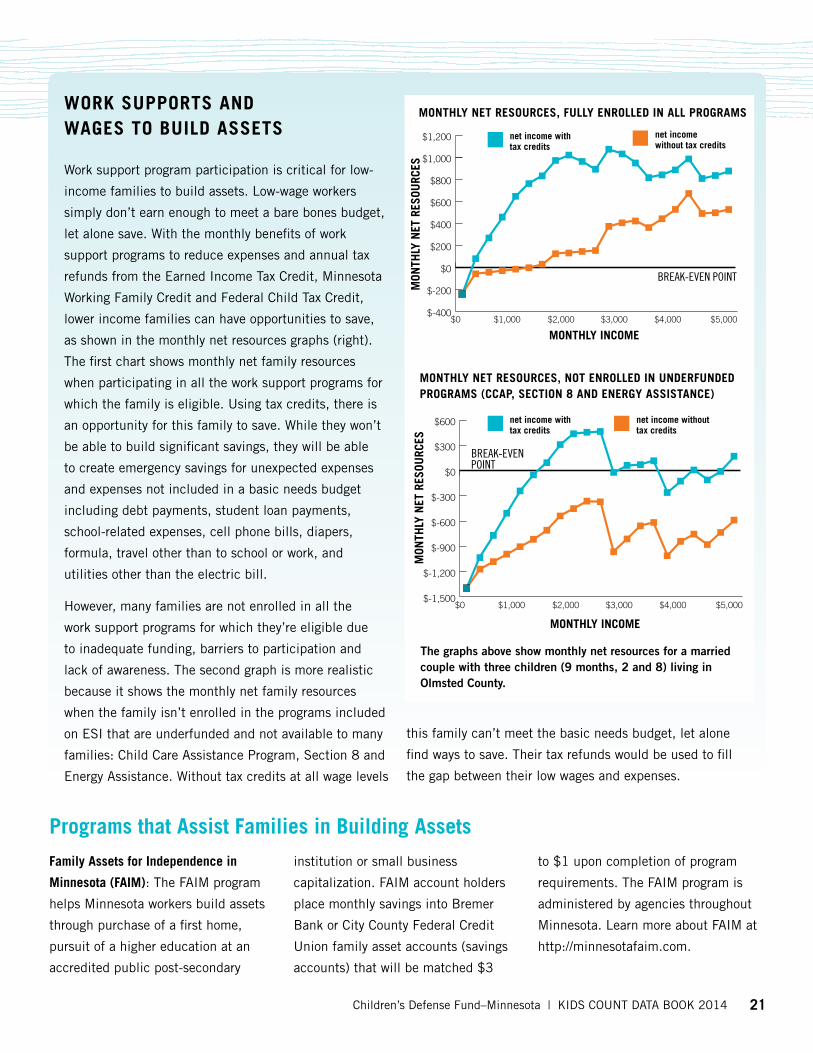
WorK suPPorts anD Wages to BuiLD assets
$-1,500
$-1,200
$-900
$-600
$-300
$0
$300
$600
$5,000$4,000$3,000$2,000$1,000$0
BREAK-EVEN POINT
MontHLy net resourCes, not enroLLeD in unDerFunDeD PrograMs (CCaP, seCtion 8 anD energy assistanCe)
net income with tax credits
net income without tax credits
Mon
tHLy
net
res
ourC
es
MontHLy inCoMe
Work support program participation is critical for low-
income families to build assets. Low-wage workers
simply don’t earn enough to meet a bare bones budget,
let alone save. With the monthly benefits of work
support programs to reduce expenses and annual tax
refunds from the Earned Income Tax Credit, Minnesota
Working Family Credit and Federal Child Tax Credit,
lower income families can have opportunities to save,
as shown in the monthly net resources graphs (right).
The first chart shows monthly net family resources
when participating in all the work support programs for
which the family is eligible. Using tax credits, there is
an opportunity for this family to save. While they won’t
be able to build significant savings, they will be able
to create emergency savings for unexpected expenses
and expenses not included in a basic needs budget
including debt payments, student loan payments,
school-related expenses, cell phone bills, diapers,
formula, travel other than to school or work, and
utilities other than the electric bill.
However, many families are not enrolled in all the
work support programs for which they’re eligible due
to inadequate funding, barriers to participation and
lack of awareness. The second graph is more realistic
because it shows the monthly net family resources
when the family isn’t enrolled in the programs included
on ESI that are underfunded and not available to many
families: Child Care Assistance Program, Section 8 and
Energy Assistance. Without tax credits at all wage levels
this family can’t meet the basic needs budget, let alone
find ways to save. Their tax refunds would be used to fill
the gap between their low wages and expenses.
The graphs above show monthly net resources for a married couple with three children (9 months, 2 and 8) living in Olmsted County.

22 KIDS COUNT DATA BOOK 2014 | Children’s Defense Fund–Minnesota
DeMograPHiCs number Percent/rate year(s)Ct Child population, As % of total population 1,276,148 24% 2012
Children 0-4, As % of children 348,338 27% 2012
Children 5-11, As % of children 501,505 39% 2012
Children 12-14, As % of children 212,115 17% 2012
Children 15-17, As % of children 214,190 17% 2012
Ct Children by Race/Ethnicity
White, non-Hispanic, As % of children 924,463 72% 2012
Black, non-Hispanic, As % of children 98,200 8% 2012
American Indian, non-Hispanic, As % of children 17,361 1% 2012
Asian, non-Hispanic, As % of children 69,266 5% 2012
Two or more races, non-Hispanic, As % of children 58,474 5% 2012
Hispanic or Latino, As % of children 103,969 8% 2012
Ct= Data also available by county on KIDS COUNT Data Center website: http://datacenter.kidscount.org
state-Level Data tables
State-level data historically collected in the Minnesota KIDS COUNT Data book can be found on the following pages.
The data are broken out into eight categories so that readers can easily find the information:
•Demographics
•FamilyandCaregivers
•EconomicSecurity
•EarlyChildhood
•K–12Education
•HealthyDevelopment
•FoodandNutrition
•SafeHomesandCommunities
Indicators available at the county
level are highlighted with a Ct in
the left hand column. Please visit
the KIDS COUNT Data Center
(datacenter.kidscount.org) to find the
most recent county-level information
along with other state-level data.
PH
OTO
PR
OvI
DE
D B
Y 3
60
CO
MM
UN
ITIE
S
Children’s Defense Fund–Minnesota | KIDS COUNT DATA BOOK 2014 23
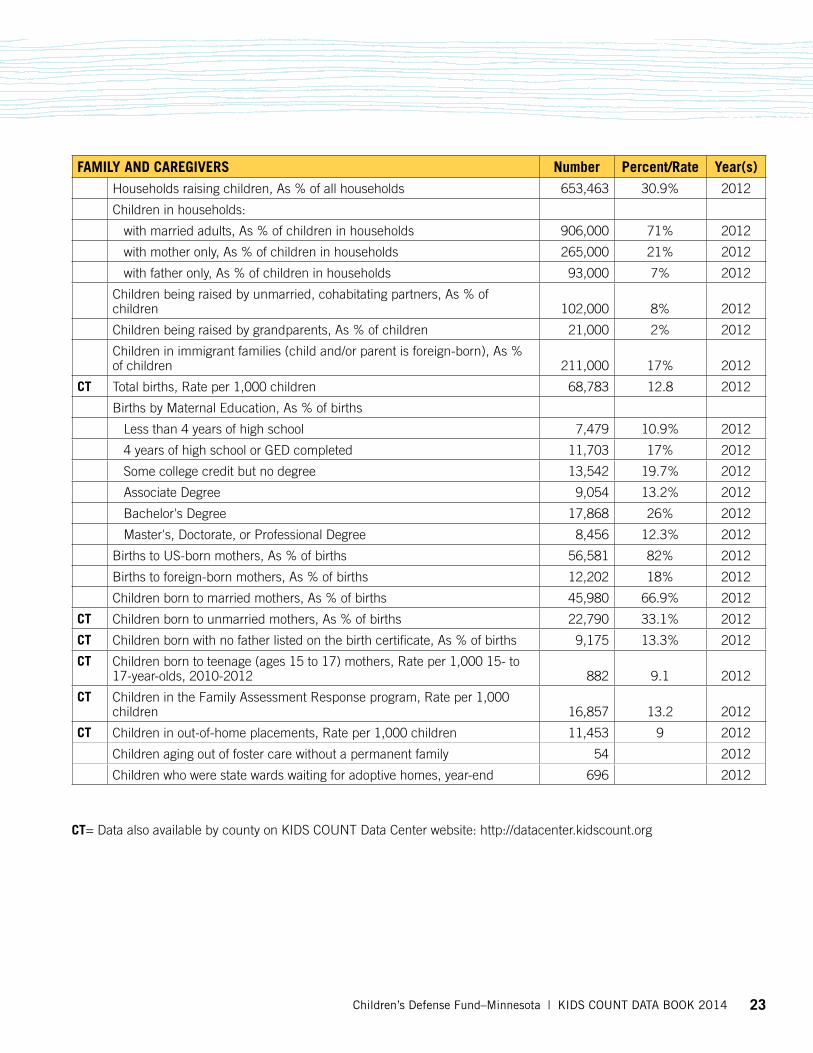
FaMiLy anD Caregivers number Percent/rate year(s)Households raising children, As % of all households 653,463 30.9% 2012
Children in households:
with married adults, As % of children in households 906,000 71% 2012
with mother only, As % of children in households 265,000 21% 2012
with father only, As % of children in households 93,000 7% 2012
Children being raised by unmarried, cohabitating partners, As % of children 102,000 8% 2012
Children being raised by grandparents, As % of children 21,000 2% 2012
Children in immigrant families (child and/or parent is foreign-born), As % of children 211,000 17% 2012
Ct Total births, Rate per 1,000 children 68,783 12.8 2012
Births by Maternal Education, As % of births
Less than 4 years of high school 7,479 10.9% 2012
4 years of high school or GED completed 11,703 17% 2012
Some college credit but no degree 13,542 19.7% 2012
Associate Degree 9,054 13.2% 2012
Bachelor's Degree 17,868 26% 2012
Master's, Doctorate, or Professional Degree 8,456 12.3% 2012
Births to US-born mothers, As % of births 56,581 82% 2012
Births to foreign-born mothers, As % of births 12,202 18% 2012
Children born to married mothers, As % of births 45,980 66.9% 2012
Ct Children born to unmarried mothers, As % of births 22,790 33.1% 2012
Ct Children born with no father listed on the birth certificate, As % of births 9,175 13.3% 2012
Ct Children born to teenage (ages 15 to 17) mothers, Rate per 1,000 15- to 17-year-olds, 2010-2012 882 9.1 2012
Ct Children in the Family Assessment Response program, Rate per 1,000 children 16,857 13.2 2012
Ct Children in out-of-home placements, Rate per 1,000 children 11,453 9 2012
Children aging out of foster care without a permanent family 54 2012
Children who were state wards waiting for adoptive homes, year-end 696 2012
Ct= Data also available by county on KIDS COUNT Data Center website: http://datacenter.kidscount.org
24 KIDS COUNT DATA BOOK 2014 | Children’s Defense Fund–Minnesota
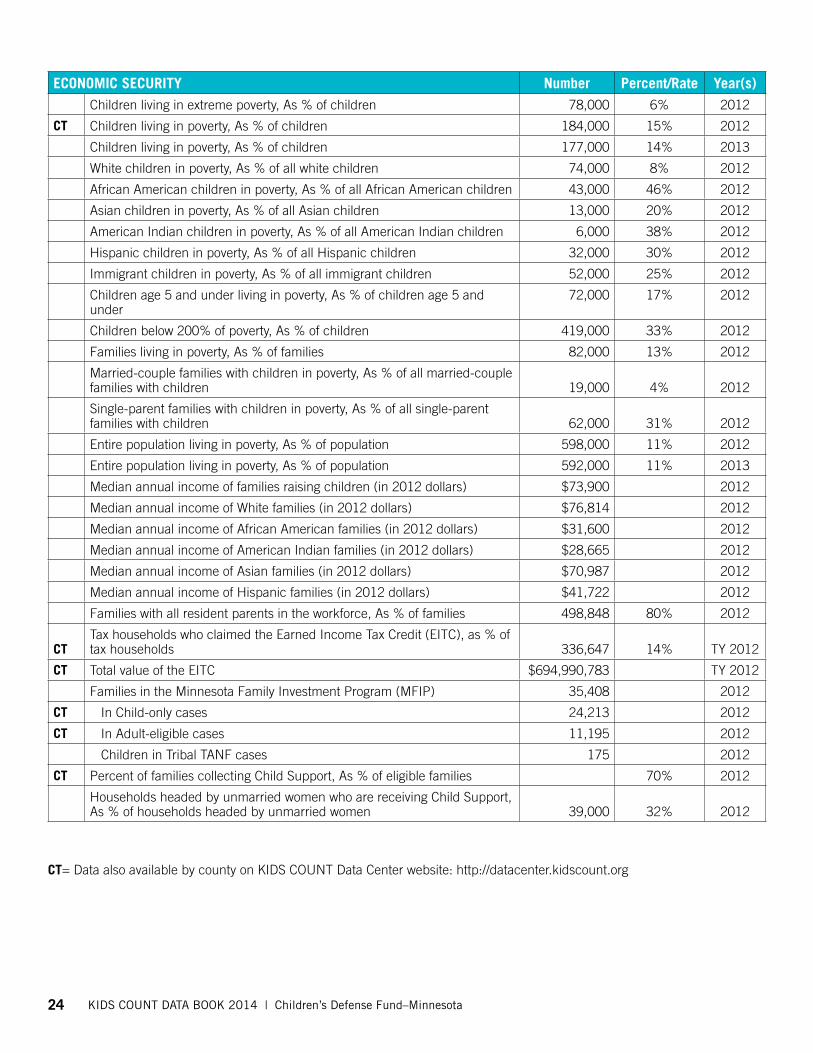
eConoMiC seCurity number Percent/rate year(s)Children living in extreme poverty, As % of children 78,000 6% 2012
Ct Children living in poverty, As % of children 184,000 15% 2012
Children living in poverty, As % of children 177,000 14% 2013
White children in poverty, As % of all white children 74,000 8% 2012
African American children in poverty, As % of all African American children 43,000 46% 2012
Asian children in poverty, As % of all Asian children 13,000 20% 2012
American Indian children in poverty, As % of all American Indian children 6,000 38% 2012
Hispanic children in poverty, As % of all Hispanic children 32,000 30% 2012
Immigrant children in poverty, As % of all immigrant children 52,000 25% 2012
Children age 5 and under living in poverty, As % of children age 5 and under
72,000 17% 2012
Children below 200% of poverty, As % of children 419,000 33% 2012
Families living in poverty, As % of families 82,000 13% 2012
Married-couple families with children in poverty, As % of all married-couple families with children 19,000 4% 2012
Single-parent families with children in poverty, As % of all single-parent families with children 62,000 31% 2012
Entire population living in poverty, As % of population 598,000 11% 2012
Entire population living in poverty, As % of population 592,000 11% 2013
Median annual income of families raising children (in 2012 dollars) $73,900 2012
Median annual income of White families (in 2012 dollars) $76,814 2012
Median annual income of African American families (in 2012 dollars) $31,600 2012
Median annual income of American Indian families (in 2012 dollars) $28,665 2012
Median annual income of Asian families (in 2012 dollars) $70,987 2012
Median annual income of Hispanic families (in 2012 dollars) $41,722 2012
Families with all resident parents in the workforce, As % of families 498,848 80% 2012
CtTax households who claimed the Earned Income Tax Credit (EITC), as % of tax households 336,647 14% TY 2012
Ct Total value of the EITC $694,990,783 TY 2012
Families in the Minnesota Family Investment Program (MFIP) 35,408 2012
Ct In Child-only cases 24,213 2012
Ct In Adult-eligible cases 11,195 2012
Children in Tribal TANF cases 175 2012
Ct Percent of families collecting Child Support, As % of eligible families 70% 2012
Households headed by unmarried women who are receiving Child Support, As % of households headed by unmarried women 39,000 32% 2012
Ct= Data also available by county on KIDS COUNT Data Center website: http://datacenter.kidscount.org

Children’s Defense Fund–Minnesota | KIDS COUNT DATA BOOK 2014 25
earLy CHiLDHooD number Percent/rate year(s)Ct Children born preterm, As % of births 5,287 8.4% 2012
Ct Children born at low birth weight, As % of births 3,297 5% 2012
Children age 3 and 4 not enrolled in preschool 76,000 54% 2010-2012
Ct Cost of center-based child care
Infant $13,836 2012-2013
Toddler $11,929 2012-2013
Preschooler $10,641 2012-2013
School-Age $9,143 2012-2013
Ct Cost of family-based child care
Infant $7,737 2012-2013
Toddler $7,337 2012-2013
Preschooler $6,997 2012-2013
School-Age $6,326 2012-2013
Children under age 6 with all available parents in the workforce, As % of children under age 6 310,000 75% 2012
Children in the Child Care Assistance Program (CCAP), average monthly enrollment
Minnesota Family Investment Program (MFIP) or Transition Year Child Care Assistance Program
15,681 2013
Basic Sliding Fee (BSF) 15,538 2013
Families on waiting lists for the CCAP 6,679 Jun-14
Children served by Head Start or Early Head Start 14,898 2013
Children served by Part C Early Intervention and have Individual Family Service Plans (IFSPs), 2012-13 school year
5,027 2.4% 2012
K–12 eDuCation number Percent/rate year(s)Students enrolled in non-public schools 68,521 2013
Ct Students enrolled in K-12 public schools 836,207 2013
Ct K-12 public school students with limited English proficiency, As % of K-12 public school students 64,362 7.7% 2013
Ct K-12 public school students enrolled in special education, As % of K-12 public school students 112,273 13.4% 2013
Ct Students changing schools, As % of K-12 public school students 107,742 12.9% 2012
Ct Students who graduated in 4 years, As % of public school students 53,962 79.8% 2012
Ct Students who dropped out within 4 years, As % of public school students 3,418 5.1% 2012
Children age 6 to 12 with all available parents in the workforce, As % of children 6 to 12 381,000 76% 2012
Ct= Data also available by county on KIDS COUNT Data Center website: http://datacenter.kidscount.org
26 KIDS COUNT DATA BOOK 2014 | Children’s Defense Fund–Minnesota
Ct= Data also available by county on KIDS COUNT Data Center website: http://datacenter.kidscount.org
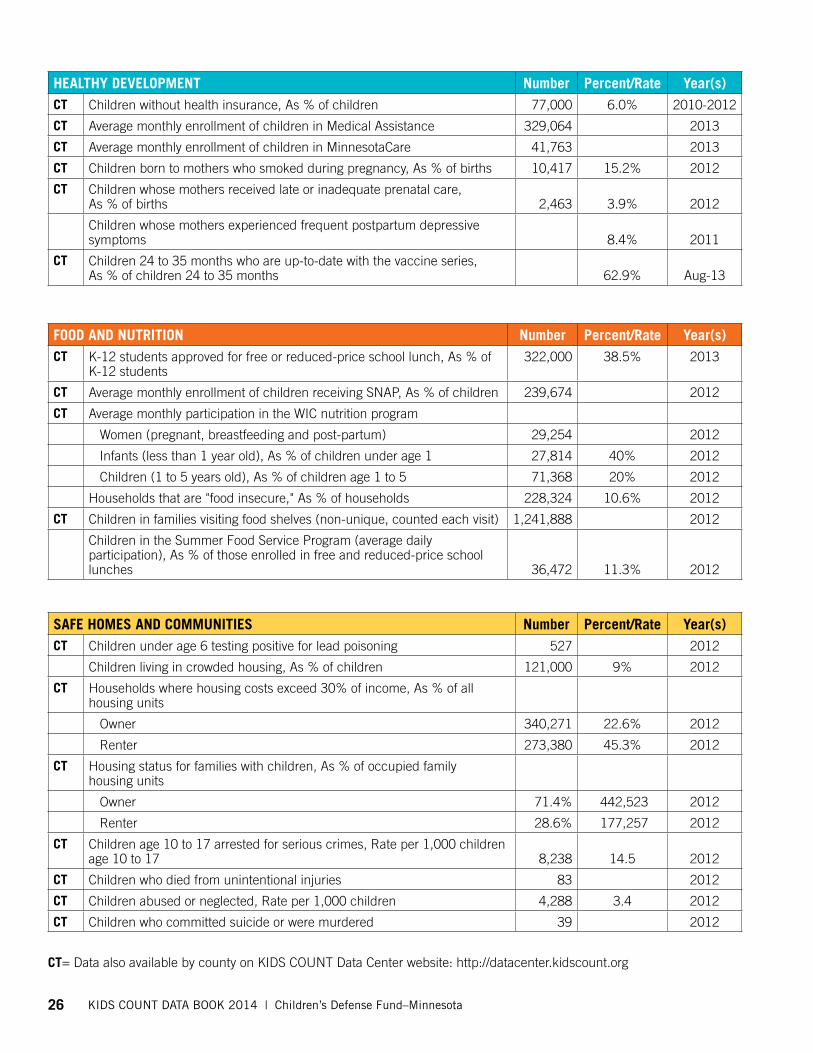
HeaLtHy DeveLoPMent number Percent/rate year(s)Ct Children without health insurance, As % of children 77,000 6.0% 2010-2012
Ct Average monthly enrollment of children in Medical Assistance 329,064 2013
Ct Average monthly enrollment of children in MinnesotaCare 41,763 2013
Ct Children born to mothers who smoked during pregnancy, As % of births 10,417 15.2% 2012
Ct Children whose mothers received late or inadequate prenatal care, As % of births 2,463 3.9% 2012
Children whose mothers experienced frequent postpartum depressive symptoms 8.4% 2011
Ct Children 24 to 35 months who are up-to-date with the vaccine series, As % of children 24 to 35 months 62.9% Aug-13
FooD anD nutrition number Percent/rate year(s)Ct K-12 students approved for free or reduced-price school lunch, As % of
K-12 students322,000 38.5% 2013
Ct Average monthly enrollment of children receiving SNAP, As % of children 239,674 2012
Ct Average monthly participation in the WIC nutrition program
Women (pregnant, breastfeeding and post-partum) 29,254 2012
Infants (less than 1 year old), As % of children under age 1 27,814 40% 2012
Children (1 to 5 years old), As % of children age 1 to 5 71,368 20% 2012
Households that are "food insecure," As % of households 228,324 10.6% 2012
Ct Children in families visiting food shelves (non-unique, counted each visit) 1,241,888 2012
Children in the Summer Food Service Program (average daily participation), As % of those enrolled in free and reduced-price school lunches 36,472 11.3% 2012
saFe HoMes anD CoMMunities number Percent/rate year(s)Ct Children under age 6 testing positive for lead poisoning 527 2012
Children living in crowded housing, As % of children 121,000 9% 2012
Ct Households where housing costs exceed 30% of income, As % of all housing units
Owner 340,271 22.6% 2012
Renter 273,380 45.3% 2012
Ct Housing status for families with children, As % of occupied family housing units
Owner 71.4% 442,523 2012
Renter 28.6% 177,257 2012
Ct Children age 10 to 17 arrested for serious crimes, Rate per 1,000 children age 10 to 17 8,238 14.5 2012
Ct Children who died from unintentional injuries 83 2012
Ct Children abused or neglected, Rate per 1,000 children 4,288 3.4 2012
Ct Children who committed suicide or were murdered 39 2012
Children’s Defense Fund–Minnesota | KIDS COUNT DATA BOOK 2014 27
“Children” if not otherwise defined refers to those under age 18 (0-17). A “parent” may be either biological, adoptive or a stepparent. “Families” refer to a parent raising one or more children in their household. A “household” may contain a single family, more than one family, a family and one or more sub-families (such as three generations living together), or it may contain members that are unrelated. Total and sub-group child populations used for calculating most rates are from the U.S. Census Bureau’s year that corresponds to the data.
Statewide poverty estimates are based upon the universe for which poverty status is determined in the 2012 American Community Survey. Poverty status is not determined for people in military barracks, institutional quarters or for unrelated individuals under age 18 (such as foster children). The federal poverty definition consists of a series of thresholds based on family size and composition.
Some data presented in this book is reflective of actual counts, while other data is obtained from survey estimates. In the latter case, the figures are rounded to the nearest 500 or 1,000 to emphasize that the figure is an estimate, which contains a margin of error. For additional information about sampling methodology and confidence intervals, please refer to the original data source or contact Children’s Defense Fund-Minnesota.
DeMograPHiCs Child population, 2012Source: U.S. Census Bureau, Population Estimates for July 1, 2012.
Child population by age group, 2012Source: U.S. Census Bureau, Population Estimates for July 1, 2012.
Child population by race/ethnicity, 2012Source: U.S. Census Bureau, Population Estimates for July 1, 2012. Note: Hispanic/Latino children are not counted in racial groupings.
FaMiLy anD Caregivers Households raising children, 2012Source: U.S. Census Bureau, 2012 American Community Survey.
Children in households, 2012Source: U.S. Census Bureau, 2012 American Community Survey. Note: Analysis by Population Reference Bureau. See KIDS COUNT Data Center online.
Children being raised by unmarried, cohabitating partners, 2012Source: U.S. Census Bureau, 2012 American Community Survey. Note: Analysis by Population Reference Bureau. See KIDS COUNT Data Center online.
Children being raised by grandparents, 2012Source: U.S. Census Bureau, 2012 American Community Survey. Note: Analysis by Population Reference Bureau. See KIDS COUNT Data Center online.
Children in immigrant families, 2012Source: U.S. Census Bureau, 2012 American Community Survey. Note: Analysis by Population Reference Bureau. See KIDS COUNT Data Center online.
total births, 2012Source: Minnesota Department of Health, Center for Health Statistics. 2012 Minnesota County Health Tables, Natality Table 1.
Births by maternal education, 2012Source: Minnesota Department of Health, Center for Health Statistics. 2012 Minnesota County Health Tables. Personal contact with Kim Edelman.
Births to us-born mothers, 2012Source: Minnesota Department of Health, Center for Health Statistics. 2012 Minnesota County Health Tables. Personal contact with Kim Edelman.
Births to foreign-born mothers, 2012Source: Minnesota Department of Health, Center for Health Statistics. 2012 Minnesota County Health Tables. Personal contact with Kim Edelman.
Children born to married mothers, 2012Source: Minnesota Department of Health, Center for Health Statistics. 2012 Minnesota County Health Tables. Personal contact with Kim Edelman.
Children born to unmarried mothers, 2012Source: Minnesota Department of Health, Center for Health Statistics. 2012 Minnesota County Health Tables. Personal contact with Kim Edelman.
Children born with no father listed on the birth certificate, 2012Source: Minnesota Department of Health, Center for Health Statistics. 2012 Minnesota County Health Tables. Personal contact with Kim Edelman.
Children born to teenage (15 to 17) mothers, 2012Source: Minnesota Department of Health, Center for Health Statistics. 2012 Minnesota County Health Tables. Personal contact with Kim Edelman. Note: Due to small numbers, rate represents 3-year average for 2010-2012; rate given per 1,000 teenage girls ages 15 to 17.
Children in the Family assessment response Program, 2012Source: Minnesota Department of Human Services. Minnesota’s Child Welfare Report for 2012, September, 2012, # DHS-5408E-ENG.
Children in out-of-home placements, 2012Source: Minnesota Department of Human Services. Minnesota’s Child Welfare Report for 2012, September, 2012, # DHS-5408E-ENG.
Children aging out of foster care without a permanent family, 2012Source: Minnesota Department of Human Services. Minnesota’s Child Welfare Report for 2012, September, 2012, # DHS-5408E-ENG.
Children who were state wards waiting for adoptive homes, year-end, 2012Source: Minnesota Department of Human Services. Minnesota’s Child Welfare Report for 2012, September, 2012, # DHS-5408E-ENG.
eConoMiC seCurityChildren living in extreme poverty, 2012Source: U.S. Census Bureau, 2012 American Community Survey. Note: Analysis by Population Reference Bureau. See KIDS COUNT Data Center online.
Children living in poverty, 2012Source: U.S. Census Bureau, 2012 American Community Survey. Note: Analysis by Population Reference Bureau. See KIDS COUNT Data Center online
Children living in poverty, 2013Source: U.S. Census Bureau, 2013 American Community Survey.
Children in poverty by race/ethnicity, 2012Source: U.S. Census Bureau, 2012 American Community Survey. Note: Analysis by Population Reference Bureau. See KIDS COUNT Data Center online.
immigrant children in poverty, 2012Source: U.S. Census Bureau, 2012 American Community Survey. Note: Analysis by Population Reference Bureau. See KIDS COUNT Data Center online.
Children under age 5 living in poverty, 2012Source: U.S. Census Bureau, 2012 American Community Survey. Note: Analysis by Population Reference Bureau. See KIDS COUNT Data Center online.
Children below 200% of the poverty line, 2012Source: U.S. Census Bureau, 2012 American Community Survey. Note: Analysis by Population Reference Bureau. See KIDS COUNT Data Center online.
Families living in poverty, 2012Source: U.S. Census Bureau, 2012 American Community Survey. Note: Analysis by Population Reference Bureau. See KIDS COUNT Data Center online.
Married-couple families with children in poverty, 2012Source: U.S. Census Bureau, 2012 American Community Survey. Note: Analysis by Population Reference Bureau. See KIDS COUNT Data Center online.
single-parent families with children in poverty, 2012Source: U.S. Census Bureau, 2012 American Community Survey. Note: Analysis by Population Reference Bureau. See KIDS COUNT Data Center online.
entire population living in poverty, 2012Source: U.S. Census Bureau, 2012 American Community Survey. Note: Analysis by Population Reference Bureau. See KIDS COUNT Data Center online.
entire population living in poverty, 2013Source: U.S. Census Bureau, 2013 American Community Survey.
Median annual income of families raising children, 2012Source: U.S. Census Bureau, 2012 American Community Survey.
Median family income by race/ethnicity, 2012Source: U.S. Census Bureau, 2012 American Community Survey. Note: See tables B19113A, B, C, D, E, and I.
Families with all resident parents in the workforce, 2012Source: U.S. Census Bureau, 2012
American Community Survey. Note: Due to significant changes starting in 2008 to the American Community Survey questions on labor force participation and number of weeks worked, comparisons to previous years’ estimates are not recommended.
tax households that claimed the earned income tax Credit (eitC), 2013 (tax year 2012)Source: Internal Revenue Service, Stakeholder Partnerships, Education & Communications (SPEC) Tax Return Information Database for Tax year 2012. Note: Data retrieved from The Brookings Institution, EITC Interactive: http://www.brookings.edu/research/interactives/eitc. A tax household is the unit containing all people listed on a single return. Note: Data only includes taxes filed from January to June of 2013 for Tax Year 2012. SPEC estimates that for any given tax year, 90 percent of tax data is captured by the part-year data.
total value of the earned income tax Credit (eitC), 2013 (tax year 2012)Source: Internal Revenue Service, Stakeholder Partnerships, Education & Communications (SPEC) Tax Return Information Database for Tax year 2012. Note: Data retrieved from The Brookings Institution, EITC Interactive: http://www.brookings.edu/research/interactives/eitc. A tax household is the unit containing all people listed on a single return. Note: Data only includes taxes filed from January to June of 2013 for Tax Year 2012. SPEC estimates that for any given tax year, 90 percent of tax data is captured by the part-year data.
Families in the Minnesota Family investment Program (MFiP), 2012Source: Minnesota Department of Human Services. Program Assessment and Integrity Division. Minnesota Family Investment Program and the Diversionary Work Program: Characteristics of December 2012 Cases and Eligible Adults (May 2013). Retrieved from the Internet: https://edocs.dhs.state.mn.us/lfserver/Public/DHS-4219O-ENG
Percent of families collecting Child support, 2012Source: Minnesota Department of Human Services, Child Support Enforcement Division. Child Support Performance Report 2012. Arrears collection based on the federal fiscal year. Retrieved from the Internet: https://edocs.dhs.state.mn.us/lfserver/Public/DHS-4252M-ENG
Households headed by unmarried women who are receiving Child support, 2011Source: U.S. Census Bureau, Current Population Survey, Annual Social and Economic Supplement, 2012. Note: Analysis by Population Reference Bureau. See KIDS COUNT Data Center online.
earLy CHiLDHooDChildren born preterm, 2012Source: Minnesota Department of Health, Center for Health Statistics. 2012 Minnesota County Health Tables. Personal contact with Kim Edelman. Note: Live births of babies who are less than 37 weeks gestation at birth. Single births only; not multiples.
technical notes
28 KIDS COUNT DATA BOOK 2014 | Children’s Defense Fund–Minnesota
Children born at low birth weight, 2012Source: Minnesota Department of Health, Center for Health Statistics. 2012 Minnesota County Health Tables. Personal contact with Kim Edelman. Note: Refers to live births during 2012 in which the child weighed less than 2500 grams at birth. Single births only; not multiples.
Children age 3 and 4 not attending preschool, 2012Source: U.S. Census Bureau, 2010-2012 American Community Survey. Note: Analysis by Population Reference Bureau. See KIDS COUNT Data Center Online.
Cost of center-based child care, 2012Source: Minnesota Department of Human Services, 2012 Child Care Provider Rate Survey. Note: In 2012 the survey went from being published annually to biannually, so these numbers are the same published in the 2013 KIDS COUNT Data Book.
Cost of family-based child care, 2012Source: Minnesota Department of Human Services, 2012 Child Care Provider Rate Survey. Note: In 2012 the survey went from being published annually to biannually, so these numbers are the same published in the 2013 KIDS COUNT Data Book.
Children under age 6 with all available parents in the workforce, 2012Source: U.S. Census Bureau, 2012 American Community Survey. Note: Analysis by Population Reference Bureau. See KIDS COUNT Data Center Online. Due to significant changes in 2008 to the American Community Survey, questions on labor force participation and number of weeks worked have changed and comparisons to previous years estimates are not recommended.
average monthly enrollment of children in the Child Care assistance Program (CCaP), 2012Source: Minnesota Department of Human Services, Reports and Forecasts Division. Family Self-Sufficiency and Health Care Program Statistics, August 2012. Note: Monthly averages of children receiving CCAP including MFIP, TY and BSF families during state fiscal year 2012 (July 1, 2012 to June 30, 2013).
Families on the waiting list for CCaP, June 2014Source: Minnesota Department of Human Services. Note: The June 2014 waiting list was the most recent available at the time of publication.
Children served by Head start or early Head start, 2013Source: 2013 Minnesota Head Start Facts, Minnesota Head Start Association.
Children served by Part C early intervention services and have individual family service plans, 2012Source: Minnesota Part C Annual Performance Report, 2012 Governor’s Interagency Coordinating Council.
K-12 eDuCationstudents enrolled in non-public schools, 2013-14Source: Minnesota Department of Education, Data Center, 2013-14 Enrollments-Non-public spreadsheet. Note: Count as of October 1, 2013.
students enrolled in K-12 public schools, 2013-14Source: Minnesota Department of Education, Minnesota Education Statistics Summary 2013-14.
K-12 public school students with limited english proficiency, 2013-14Source: Minnesota Department of Education, Data Center, 2013-14 Enrollments-County-Special Populations spreadsheet.
K-12 public school students enrolled in special education, 2013-14Source: Minnesota Department of Education, Data Center, 2013-14 Enrollments-County-Special Populations spreadsheet.
students changing schools, 2012Source: Minnesota Department of Education, Data Center, Student Mobility-District Level, 2012-13.
students who graduated in 4 years, 2012Source: Minnesota Department of Education, Data Center, 2012-2013 Graduation Rates.
students who dropped out in 4 years, 2012Source: Minnesota Department of Education, Data Center, 2012-13 Graduation Rates.
Children age 6 to 12 with all available parents in the workforce, 2012Source: U.S. Census Bureau, 2012 American Community Survey. Note: Analysis by Population Reference Bureau. See KIDS COUNT Data Center online. Due to significant changes starting in 2008 to the American Community Survey, questions on labor force participation and number of weeks worked have changed and comparisons to previous years estimates are not recommended.
HeaLtHy DeveLoPMent Children without health insurance, 2010-2012Source: U.S. Census Bureau, 2010-12 American Community Survey.
average monthly enrollment of children in Medical assistance, 2013 Source: Minnesota Department of Human Services, Reports & Forecasts Division. Note: Includes children in MFIP households. Refers to children below age 18, although 18- to 20-year-olds are eligible to receive Medical Assistance. Child’s age calculated as of July 1, 2013. Children are counted in only one county even if they moved during the year. Children are counted in both Medical Assistance and MinnesotaCare enrollee counts if they were enrolled in both programs during the year.
average monthly enrollment of children in MinnesotaCare, 2013Source: Minnesota Department of Human Services, Reports & Forecasts Division. Note: Child’s age calculated as of July 1, 2013. Children are counted in only one county even if they moved during the year. Children are counted in both Medical Assistance and MinnesotaCare enrollee counts if they were enrolled in both programs during the year.
Children born to mothers who smoked during pregnancy, 2012Source: Minnesota Department of Health, Center for Health Statistics. 2012 Minnesota County Health Tables. Personal contact with Kim Edelman. Note: Births are assigned to the mother’s county of residence, regardless where the birth occurred.
Children whose mothers received late or inadequate prenatal care, 2012Source: Minnesota Department of Health, Center for Health Statistics. 2012 Minnesota County Health Tables. Personal contact with Kim Edelman. Note: “Inadequate” is defined as either no prenatal care, care beginning in the 3rd trimester, or an inadequate range of visits, regardless of when prenatal care began.
Children whose mothers experienced frequent postpartum depressive symptoms, 2011Source: Minnesota Pregnancy Risk Assessment and Monitoring System (PRAMS), Minnesota Department of Health, Division of Community and Family Health, Maternal and Child Health. Note: Grant number IU01DP003117-01 made this data possible from the Centers for Disease Control and Prevention.
Children 24-35 months who are up-to-date with the vaccine series, 2013Source: Minnesota Department of Health, Immunization Program. Childhood Immunization Coverage in Minnesota, January 2013. Note: The vaccine series consists of 4+ DTaP, 3+ Polio, 1+ MMR, Complete Hib, 3+ HelpB, 1+ Varicella, and Complete Prevnar.
FooD anD nutrition K-12 students approved for free or reduced-price school lunch, 2013-14Source: Minnesota Department of Education, Data Center, 2013-14 Enrollments-County-Special Populations spreadsheet.
average monthly enrollment of children receiving snaP, 2012Source: Minnesota Department of Human Services, MAXIS Data Warehouse. Note: Average monthly enrollment during calendar year 2012 of unique children in SNAP households. Includes children from MFIP Food Portion cases. Count of children only includes SNAP-eligible children in the household.
average monthly participation in the WiC nutrition program, 2012Source: Food Research and Action Center, State of the States 2012, Minnesota page. Note: WIC is officially called the Special Supplemental Nutrition Program for Women, Infants, and Children.
Percent of households that are “food insecure,” 2012Source: U.S. Department of Agriculture, Economic Research Service, Household Food Security in the United States, 2012. Note: Based on data from the Current Population Survey Food Security Supplement.
Children in families visiting food shelves, 2012Source: Hunger Solutions Minnesota, Food Shelf Statistics Report, 01/2012 to 12/2012. Personal contact with James
Redmond. Note: Not a unique count of children served. All children in a family were counted each time a family member visited a food shelf during the year.
Children in the summer Food service Program, 2012Source: Food Research and Action Center, State of the States 2012, Minnesota page. Note: Average daily participation during the month of July (busiest month). Rate is calculated by dividing summer participation figure by free and reduced-price school lunch enrollment figure.
saFe HoMes anD CoMMunitiesChildren under age 6 testing positive for lead poisoning, 2012Source: Minnesota Department of Health, Center for Health Statistics, Surveillance Database Reports. Note: Refers to children who were tested and found to have blood lead levels of 10 Micrograms per Deciliter (µg/dL) or greater. In 2012, the Commissioner of Health issued a finding that changed the state’s definition of elevated blood lead level to 5 mcg/dL. Data on children under 6 who had blood lead levels 5 mcg/dL or greater can be found on the KIDS COUNT Data Center online.
Children living in crowded housing, 2012Source: U.S. Census Bureau, 2012 American Community Survey. Note: Analysis by Population Reference Bureau. See KIDS COUNT Data Center online.
Households where housing costs exceed 30% of income, 2012Source: U.S. Census Bureau, 2012 American Community Survey 1-Year Estimates. Table B25091: Mortgage Status by Selected Monthly Owner Costs as a Percentage of Household Income in the Past 12 Months.
Children age 10-17 arrested for a serious crime, 2012Source: Minnesota Department of Public Safety, 2012 Bureau of Criminal Apprehension, Minnesota Justice Information Services, Uniform Crime Report (July 2013). Note: Refers to arrests of juveniles age 10-17. Rate per 1,000 is calculated by dividing the number of juvenile arrests by the total number of children ages 10-17, then multiplying by 1,000. “Serious” crimes (Part I crimes) include murder, rape, robbery, aggravated assault, burglary, larceny, vehicle theft and arson. Not all children arrested for serious crimes may have committed these crimes, and not all children who committed serious crimes may have been arrested.
Children who died from unintentional injuries, 2012Source: Minnesota Department of Health, Center for Health Statistics. 2012 Minnesota County Health Tables. Personal contact with Kim Edelman.
Children abused or neglected, 2012Source: Minnesota Department of Human Services. Minnesota’s Child Welfare Report for 2012, September 2013, #DHS-5408D-ENG 8-12. Table 1.
Children who committed suicide or were murdered, 2012Source: Minnesota Department of Health, Center for Health Statistics. 2012 Minnesota County Health Tables. Personal contact with Kim Edelman.
Children’s Defense Fund–Minnesota | KIDS COUNT DATA BOOK 2014 29
1 U.S. Census Bureau, Population Estimates for July 1, 2012.
2 Fass, S. (2009). Measuring Poverty in the United States. National Center for Children in Poverty. http://www.nccp.org/publications/pub_876.html.
3 Ibid.
4 The U.S. Census Bureau (March 2010). Observation from the Interagency Technical Working Group on Developing a Supplemental Poverty Measure.
5 Short, Kathleen (2012). The Research SUPPLEMENTAL POVERTY MEASURE: 2012. Current Population reports, U.S. Census Bureau.
6 Ibid.
7 Minnesota Department of Employment and Economic Development, Job Vacancy Survey. Fourth quarter 2013.
8 Children’s Defense Fund-Minnesota, Economic Stability Indicator (2014).
9 U.S. Census Bureau, 2012 American Community Survey.
10 Duncan, G., Morria, P. & Rodriguew, C (2011). Does Money Really Matter? Estimating the Impacts of Family Income on young Children’s Achievement with Data from Random-Assignment Experiments.
11 Ratcliffe, C. & McKernan, S (2010). Childhood Poverty Persistence: Facts and Consequences.
12 U.S. Census Bureau, 2012 American Community Survey. Note: Analysis by the Population Reference Bureau. See KIDS COUNT Data Center online.
13 Duncan, G., Morria, P. & Rodriguew, C (2011). Does Money Really Matter? Estimating the Impacts of Family Income on young Children’s Achievement with Data from Random-Assignment Experiments.
14 Ibid.
15 U.S. Census Bureau, 2010-2012 American Community Survey. Note: Analysis by the Population Reference Bureau. See KIDS COUNT Data Center online.
16 U.S Department of Education, National Center for Education Statistics, National Assessment of Educational Progress (NAEP). Available online at http://nces.ed.gov/nationsreportcard.
17 U.S. Department of Education, National Center for Education Statistics, Common Core of Data (CCD), State Dropout and Completion Data. Note: Analysis by the Population Reference Bureau. See KIDS COUNT Data Center online.
18 U.S. Census Bureau, Population Estimates for July 1, 2012.
19 U.S. Census Bureau, 2012 American Community Survey. Note: Analysis by the Population Reference Bureau. See KIDS COUNT Data Center online.
20 Ibid.
21 Jefferys, M. (October 2011). Minnesota’s Invisible Children: Children in Families Receiving MFIP. St. Paul, MN: Children’s Defense Fund-Minnesota.
22 Ibid.
23 Minnesota Department of Human Services. Program Assessment and Integrity Division. Minnesota Family Investment Program and the Diversionary Work Program: Characteristics of December 2013 Cases and Eligible Adults (May 2014).
24 U.S. Census Bureau, 2012 American Community Survey. Note: Analysis by the Population Reference Bureau. See KIDS COUNT Data Center online.
25 Minnesota Department of Human Services. Program Assessment and Integrity Division. Minnesota Family Investment Program and the Diversionary Work Program: Characteristics of December 2013 Cases and Eligible Adults (May 2014).
26 Jefferys, M. (October 2011). Minnesota’s Invisible Children: Children in Families Receiving MFIP. St. Paul, MN: Children’s Defense Fund-Minnesota.
27 Adapted from What are Work Support Programs? section on Economic Stability Indicator website. Children’s Defense Fund-Minnesota, 2013. http://www.economicstabilityindicatormn.org/
28 Children’s Defense Fund-Minnesota, Bridge to Benefits Frequently Asked Questions (2012).
29 Hogenson, S. (June 2012). The Five Reasons Work Support Programs Deserve Legislators Support. Spotlight on Poverty and Opportunity.
30 U.S. department of Agriculture, Economic Research Service, Household Food Security in the United States, 2012. Note: Based on data from the Current Population Survey Food Security Supplement.
31 Children’s HealthWatch (2012). The SNAP Vaccine.
32 U.S. Department of Agriculture, Economic Research Service, Food Access Research Atlas. (2010). http://www.ers.usda.gov/data-products/food-access-research-atlas.aspx#.
33 Personal contact with Ryan Johnson, SNAP Education Liaison, Minnesota Department of Human Services Office of Economic Opportunity.
34 Minnesota Department of Human Services, MAXIS Data Warehouse. Personal contact with Amy Gehring. Note: Average monthly enrollment during the calendar year of unique SNAP households with children. Includes households from MFIP Food Portion cases.
35 Hunger Solutions Minnesota, Food Shelf Statistics Report, 01/2012 to 12-2012. Personal contact with James Redmond. Note: Not a unique count of children served. All children
in a family were counted each time a family member visited a food shelf during the year.
36 Children’s HealthWatch (2012). The SNAP Vaccine.
37 Hunger Free Minnesota Analysis (2013). www.http://hungerfreemn.org/.
38 Breakfast for Health (Spring 2014). Food Research and Action Center.
39 Addy, S., Aratani, Y., Chau, M., & Wight, V. (2011). Rent Burden, Housing Subsidies and the Well-being of Children and Youth. New York, NY: National Center for Children in Poverty.
40 Ibid.
41 U.S. Census Bureau, 2012 American Community Survey. Note: Analysis by Population Reference Bureau. See KIDS COUNT Data Center online.
42 Homelessness in Minnesota: Findings from the 2012 homeless study (2013). St. Paul, MN: Wilder Research.
43 U.S. Census Bureau, 2012 American Community Survey.
44 Minnesota Department of Health, Center for Health Statistics, Surveillance Database Reports. Note: Refers to children who were tested and found to have blood lead levels of 10 Micrograms per Deciliter (µg/dL) or greater.
45 Arnold, A., Crowley, S., Bravve, E., Brundage, S., & Biddlecombe, C. (2014). Out of Reach. Washington, D.C.: National Low-Income Housing Coalition.
46 Department of Housing and Urban Development, Fair Market Rent for Fiscal Year 2013.
47 LaMontagne, C. (2013). NerdWallet Health Finds Medical Bankruptcy Accounts for Majority of Personal Bankruptcies.
48 Minnesota Department of Health, Center for Health Statistics. 2013 Minnesota County Health Tables, Natality Table 4. Note: “Inadequate” is defined as either no prenatal care, care beginning in the 3rd trimester, or an inadequate range of visits regardless of when prenatal care began.
49 U.S. Census Bureau, 2010-12 American Community Survey.
50 Minnesota Department of Health, Center for Health Statistics. 2013 Minnesota County Health Tables, Natality Table 2. Note: Refers to live births during 2012 in which the child weighed less than 2500 grams at birth. Single births only; not multiples.
51 Minnesota Department of Health, Immunization Program. Childhood Immunization Coverage in Minnesota, January 2014. Note: The vaccine series consists of 4+ DTaP, 3+ Polio, 1+ MMR, Complete Hib, 3+ HepB, 1+ Varicella, and complete Prevnar.
52 Cohodes, S., Grossman, D., Kleiner, S., & Lovenheim, M. (2014). The Effect of Child Health Insurance Expansion on Schooling: Evidence from Public Insurance Expansion. Cambridge, MA: The National Bureau of Economic Research.
53 Burchinal, P., Kainz, K., Cai, K., Tout, K., Zaslow, M., Martinez-Beck, I, & Rathgeb, C. (2009). Early Care and Education Quality and Child Outcomes. Bethesda, MD: Child Trends.
54 Isaacs, J. (2012). Starting School at a Disadvantage: The School Readiness of Poor Children. Washington, DC: Center of Children and Families, Brookings Institution.
55 Parents and the High Cost of Child Care 2013 Report. Arlington, VA: Child Care Aware of America.
56 Ibid.
57 U.S. Census Bureau, 2010-2012 American Community Survey. Note: Analysis by Population Reference Bureau. See KIDS COUNT Data Center Online.
58 Minnesota Department of Human Services, June 2014.
59 Minnesota Department of Education (November 2013). Minnesota School readiness Study: Developmental Assessment at Kindergarten Entrance.
60 Human Capital Research Collaborative (2011). Assessing the Validity of Minnesota School Readiness Indicators. St. Paul, MN: Early Learning Services, Minnesota Department of Education.
61 Minnesota Department of Human Services, 2012 Child Care Provider Rate Survey.
62 Analysis by Children’s Defense Fund-Minnesota (2012).
63 U.S. Census Bureau, 2012 American Community Survey. Note: Analysis by Population Reference Bureau. See KIDS COUNT Data Center Online.
64 Children’s Defense Fund-Minnesota (2012). Economic Stability Indicator. www.economicstabilityindicatormn.org.
65 Goldblum, J., Kruse, A., Smith, M., & Weir, A. (2013). Diaper Need and its Impact on Child Health. American Academy of Pediatrics.
66 Bureau of Labor and Statistics Consumer Expenditure Survey (2012).
67 U.S. Census Bureau, 2012 American Community Survey. Note: Analysis by Population Reference Bureau.
68 Brooks, J., Wiedrich, K., Sims, L., & Medina, J. (2014). Treading Water in the Deep End: Findings from the 2014 Assets & Opportunity Scorecard. Corporation for Enterprise Development (CFED).
69 Ibid.
70 Ibid.
endnotes
555ParkStreet•SaintPaul,MN55103•651-227-6121•www.cdf-mn.org
KiDs Count online
National KIDS COUNT | www.kidscount.org
KIDS COUNT Data Center (National, State and Local Data) | datacenter.kidscount.org
Minnesota KIDS COUNT | www.cdf-mn.org/kidscount