Minnesota Department of Health€¦ · The Minnesota Department of Health is required to collect...
63
Health Economics Program PO Box 64882 St. Paul, MN 55164-0882 651-201-3550 www.health.state.mn.us/healtheconomics Administrative Costs at Minnesota Health Plans in 2010 Minnesota Department of Health January, 2012
Transcript of Minnesota Department of Health€¦ · The Minnesota Department of Health is required to collect...

Health Economics Program PO Box 64882 St. Paul, MN 55164-0882 651-201-3550 www.health.state.mn.us/healtheconomics
Administrative Costs at Minnesota Health Plans in 2010
Minnesota Department of Health January, 2012

Health Economics Program PO Box 64882 St. Paul, MN 55164-0882 651201-3550 www.health.state.mn.us/healtheconomics
Administrative Costs at Minnesota Health Plans in 2010 Minnesota Department of Health January, 2012


Introduction
The Minnesota Department of Health is required to collect and publish information on administrative costs of health plans (group purchasers) that do business in Minnesota.1 This report presents data on 2010 administrative costs for all health plans that reported more than $3 million in total health premiums for Minnesota residents. The detailed tables on the following pages present information on administrative costs as reported by group purchasers for each of 14 categories of administrative spending. Appendix A provides the definitions of the 14 administrative cost categories included in this report. Averaged across all health plan companies, the following table shows administrative costs as a share of total costs over time: As required by Minnesota Statutes Section 62J.321, subdivision 5, health plans were provided an opportunity to review and comment on the data included in this report. MDH received no comments from health plans. Comments or questions related to this report may be directed to [email protected].
1 Minnesota Statutes, Section 62J.38, paragraph (b). 2 Revised from 8.1% to 8.0% since initial publication in June 2010 due to changes in data reported by health plans.
Year Administrative Cost as %
of Total Cost 2001 10.6% 2002 8.9% 2003 8.3% 2004 8.6% 2005 8.3% 2006 8.3% 2007 8.4% 2008 8.0%2 2009 2010
7.9% 7.2%

2010 Health Plan CompaniesTotal 2010
Administrative Costs
Total 2010 Spending
2010 Administrative
Costs (as a percent of total
spending) Aetna Life Insurance Company 20,143,758 327,189,195 6.2%American Family Mutual Insurance Company 2,321,853 5,155,817 45.0%American Fidelity Assurance Company 685,547 3,089,357 22.2%Ameritas Life Insurance Corp 990,935 7,083,765 14.0%Bankers Life and Casualty Company 1,383,033 8,675,359 15.9%Blue Cross Blue Shield of Minnesota 301,989,000 4,323,689,000 7.0%Blue Plus 61,572,000 944,796,000 6.5%Combined Insurance Company of America 303,788 3,504,820 8.7%Companion Life Insurance Company 33,779 33,779 100.0%Connecticut General Life Insurance Company 35,027,151 366,010,342 9.6%Continental Life Insurance Company of Brentwood TN 413,180 4,173,028 9.9%Delta Dental Plan of Minnesota 59,219,191 1,040,770,352 5.7%Federated Mutual Insurance Company 7,834,871 53,683,841 14.6%First Health Life & Health Insurance Company 360,572 20,819,756 1.7%Guarantee Trust Life Insurance Company 2,012,960 12,563,912 16.0%Guardian Life Insurance Company of America 33,637 20,244,857 0.2%HCC Life Insurance Company 708,365 7,293,342 9.7%HealthPartners, Inc. 245,174,023 3,635,508,795 6.7%Healthspring Life & Health Insurance Company 747,218 7,791,945 9.6%Humana Insurance Company 30,137,113 221,553,429 13.6%Itasca Medical Care 3,545,743 44,337,694 8.0%John Alden Life Insurance Company 779,806 5,337,815 14.6%Lincoln National Life Insurance Company 502,840 6,395,130 7.9%Medica Health Plans 74,008,097 1,320,441,718 5.6%Medica Insurance Company 135,088,753 1,281,329,954 10.5%Medica Self Insured 59,837,363 1,365,358,274 4.4%Metropolitan HealthPlan (MHP) 19,785,914 140,810,863 14.1%Metropolitan Life Insurance Company 4,923,908 58,135,880 8.5%Mutual of Omaha Insurance Company 813,747 6,378,184 12.8%Pan-American Life 49,803 5,106,857 1.0%Pennsylvania Life Insurance Company 2,569,840 24,743,715 10.4%Physicians Mutual Ins. Co. & Physicians Life Ins. Co. 1,328,475 5,087,710 26.1%PreferredOne Community Health Plan 14,026,383 134,009,227 10.5%PreferredOne Insurance Company 10,722,171 98,074,021 10.9%PrimeWest Health System 16,370,001 152,507,963 10.7%Principal Life Insurance Company 2,024,344 36,806,326 5.5%Pyramid Life Insurance Company 1,155,728 10,697,730 10.8%ReliaStar Life Insurance Company 1,979,326 16,173,170 12.2%Security Life Insurance Company of America 578,591 3,324,618 17.4%SilverScript Insurance Company 2,040,434 17,011,149 12.0%South Country Health Alliance 18,531,923 202,791,416 9.1%State Farm Mutual Automobile Insurance Company 2,198,706 20,463,853 10.7%Sterling Life Insurance Company 575,064 3,425,812 16.8%Sun Life Assurance Company of Canada 740,125 5,029,984 14.7%Time Insurance Company 10,594,220 44,062,997 24.0%UCare Minnesota 106,681,226 1,545,256,185 6.9%UniCare Life & Health Insurance Company 6,451,158 39,828,968 16.2%Union Security Insurance Company 3,049,418 16,867,254 18.1%United World Life Insurance Company 1,856,045 8,171,341 22.7%UnitedHealthcare Insurance Company 26,629,212 383,074,283 7.0%WellCare Health Insurance of Illinois, Inc. 558,233 3,306,089 16.9%World Insurance Company 746,546 7,142,583 10.5%
Totals: 1,301,835,117 18,025,119,454 7.2%
Table 1. Administrative Costs as Percent of Total Costs, 2010

Minnesota Health Plan Spending on Administrative Services, 2010
7.2%
10.3%
6.8%
10.9%
Indirect Health Care Expenses (Medical and Dental), 2010
Indirect Expense CategorySalaries and
BenefitsOther Expense
Total Indirect Health Care
Expense (by category)
Percent of Total Admin Expenses
Percent of Total Expenses
Billing and Enrollment 28,705,680 50,052,134 78,757,814 6.0% 0.4%
Claim Processing 86,149,315 169,600,525 255,749,840 19.6% 1.4%
Detection and Prevention of Fraud 2,421,846 2,164,865 4,586,711 0.4% 0.0%
Customer Service 48,782,510 37,153,138 85,935,648 6.6% 0.5%
Product Management and Marketing 68,188,324 173,645,807 241,834,131 18.6% 1.3%
Underwriting 12,828,039 4,594,191 17,422,230 1.3% 0.1%
Regulatory Compliance and Government
9,439,944 15,407,360 24,847,304 1.9% 0.1%
Lobbying 799,972 626,146 1,426,118 0.1% 0.0%
Provider Relations and Contracting 25,565,514 31,891,737 57,457,251 4.4% 0.3%
Quality Assurance and Utilization Management
51,363,773 45,734,408 97,098,181 7.5% 0.5%
Wellness and Health Education 19,086,841 25,450,256 44,537,097 3.4% 0.2%
Research and Product Development 14,757,702 22,526,631 37,284,333 2.9% 0.2%
Charitable Contributions 5,030 21,672,026 21,677,056 1.7% 0.1%
General Administration 163,703,637 169,517,766 333,221,403 25.6% 1.8%
Total 531,798,127 770,036,990 1,301,835,117 100.0% 7.2%
Taxes and Assessments, 2009
MinnesotaCare Tax 143,319,630
Other Taxes and Assessments 266,018,585
Capital Costs
2010 Incurred 2010 Payments
Capital Costs on Behalf of a Hospital or Clinic
8,021,026 8,451,690
Capital Acquisitions 63,216,825 63,744,636
Other Capital Costs 37,829 37,829
Total Capital Expenditures 71,275,680 72,234,155
Total Administrative Spending as percent of Total Carrier Spending: 1
Commercial Administrative Spending as percent of Commercial Spending:
MN Public Programs Administrative Spending as percent of MN Public Programs Spending:
Medicare Administrative Spending as percent of Medicare Spending (includes Medicare Advantage, Part D, and Medicare Supplement):1Self-insured expenses are not required to be reported, but are encouraged. When reported, these amounts are included in Total Administrative and Total Carrier Spending; thus, the Total Administrative percentage may not fall within the range reported for the Commercial, MN Public Program, and Medicare categories.

2010 Administrative Spending: Aetna Life Insurance Company
6.2%
20.8%
Not Applicable
4.5%
Calendar Year 2010
Indirect Expense Category Salaries and Benefits Other ExpenseTotal Indirect Health Care
Expense (by category)
Billing and Enrollment 547,372 810,901 1,358,273
Claim Processing 1,116,937 682,703 1,799,640
Detection and Prevention of Fraud 181,050 294,174 475,224
Customer Service 1,366,659 712,323 2,078,982
Product Management and Marketing 1,534,376 4,360,668 5,895,044
Underwriting 402,348 190,015 592,363
Regulatory Compliance and Government
162,424 125,283 287,707
Lobbying 0 59,550 59,550
Provider Relations and Contracting 519,449 358,387 877,836
Quality Assurance and Utilization Management
736,277 764,578 1,500,855
Wellness and Health Education 543,052 324,318 867,370
Research and Product Development 124,509 46,613 171,122
Charitable Contributions 3,661 37,121 40,782
General Administration 2,673,539 1,465,471 4,139,010
Total Indirect Health Care Expenses
9,911,653 10,232,105 20,143,758
Taxes and Assessments Calendar Year 2010
MinnesotaCare Tax
Other Taxes and Assessments 2,068,020
Capital Costs Calendar Year 2010
2010 Incurred 2010 Payments
Capital Costs on Behalf of a Hospital or Clinic
Capital Acquisitions
Other Capital Costs
Total Capital Expenditures
Total Administrative Spending as percent of Total Carrier Spending1:
Commercial Administrative Spending as percent of Commercial Spending:
MN Public Programs Administrative Spending as percent of MN Public Programs Spending:
Medicare Administrative Spending as percent of Medicare Spending (includes Medicare Advantage, Part D, and Medicare Supplement):1Self-insured expenses are not required to be reported, but are encouraged. When reported, these amounts are included in Total Administrative and Total Carrier Spending; thus, the Total Administrative percentage may not fall within the range reported for the Commercial, MN Public Program, and Medicare categories.
Indirect Health Care Expenses (Medical and Dental)

2010 Administrative Spending: American Family Mutual Insurance Company
45.0%
43.1%
Not Applicable
59.2%
Calendar Year 2010
Indirect Expense Category Salaries and Benefits Other ExpenseTotal Indirect Health Care
Expense (by category)
Billing and Enrollment 32,389 19,795 52,184
Claim Processing 137 219,731 219,868
Detection and Prevention of Fraud 0 0
Customer Service 52 24 76
Product Management and Marketing 12,341 877,801 890,142
Underwriting 0 0
Regulatory Compliance and Government
2,911 813,888 816,799
Lobbying 0 0
Provider Relations and Contracting 970 448 1,418
Quality Assurance and Utilization Management
13,710 6,326 20,036
Wellness and Health Education 7 3 10
Research and Product Development 0 0
Charitable Contributions 1,340 618 1,958
General Administration 175,794 143,568 319,362
Total Indirect Health Care Expenses
239,651 2,082,202 2,321,853
Taxes and Assessments Calendar Year 2010
MinnesotaCare Tax
Other Taxes and Assessments 641,504
Capital Costs Calendar Year 2010
2010 Incurred 2010 Payments
Capital Costs on Behalf of a Hospital or Clinic
Capital Acquisitions
Other Capital Costs
Total Capital Expenditures
Total Administrative Spending as percent of Total Carrier Spending1:
Commercial Administrative Spending as percent of Commercial Spending:
MN Public Programs Administrative Spending as percent of MN Public Programs Spending:
Medicare Administrative Spending as percent of Medicare Spending (includes Medicare Advantage, Part D, and Medicare Supplement):1Self-insured expenses are not required to be reported, but are encouraged. When reported, these amounts are included in Total Administrative and Total Carrier Spending; thus, the Total Administrative percentage may not fall within the range reported for the Commercial, MN Public Program, and Medicare categories.
Indirect Health Care Expenses (Medical and Dental)

2010 Administrative Spending: American Fidelity Assurance Company
22.2%
31.0%
Not Applicable
Not Applicable
Calendar Year 2010
Indirect Expense Category Salaries and Benefits Other ExpenseTotal Indirect Health Care
Expense (by category)
Billing and Enrollment 2,072 710 2,782
Claim Processing 15,215 5,078 20,293
Detection and Prevention of Fraud 0 0
Customer Service 26,695 14,963 41,658
Product Management and Marketing 1,786 954 2,740
Underwriting 4,054 2,541 6,595
Regulatory Compliance and Government
9,018 1,959 10,977
Lobbying 0 0
Provider Relations and Contracting 0 0
Quality Assurance and Utilization Management
1,329 1,572 2,901
Wellness and Health Education 0 0
Research and Product Development 9,190 1,487 10,677
Charitable Contributions 0 2,933 2,933
General Administration 552,638 31,353 583,991
Total Indirect Health Care Expenses
621,997 63,550 685,547
Taxes and Assessments Calendar Year 2010
MinnesotaCare Tax
Other Taxes and Assessments 163,464
Capital Costs Calendar Year 2010
2010 Incurred 2010 Payments
Capital Costs on Behalf of a Hospital or Clinic
Capital Acquisitions
Other Capital Costs
Total Capital Expenditures
Total Administrative Spending as percent of Total Carrier Spending1:
Commercial Administrative Spending as percent of Commercial Spending:
MN Public Programs Administrative Spending as percent of MN Public Programs Spending:
Medicare Administrative Spending as percent of Medicare Spending (includes Medicare Advantage, Part D, and Medicare Supplement):1Self-insured expenses are not required to be reported, but are encouraged. When reported, these amounts are included in Total Administrative and Total Carrier Spending; thus, the Total Administrative percentage may not fall within the range reported for the Commercial, MN Public Program, and Medicare categories.
Indirect Health Care Expenses (Medical and Dental)

2010 Administrative Spending: Ameritas Life Insurance Corp
14.0%
13.6%
Not Applicable
Not Applicable
Calendar Year 2010
Indirect Expense Category Salaries and Benefits Other ExpenseTotal Indirect Health Care
Expense (by category)
Billing and Enrollment
Claim Processing
Detection and Prevention of Fraud
Customer Service
Product Management and Marketing
Underwriting
Regulatory Compliance and Government
Lobbying
Provider Relations and Contracting
Quality Assurance and Utilization Management
Wellness and Health Education
Research and Product Development
Charitable Contributions
General Administration 645,315 345,620 990,935
Total Indirect Health Care Expenses
645,315 345,620 990,935
Taxes and Assessments Calendar Year 2010
MinnesotaCare Tax
Other Taxes and Assessments 156,113
Capital Costs Calendar Year 2010
2010 Incurred 2010 Payments
Capital Costs on Behalf of a Hospital or Clinic
Capital Acquisitions
Other Capital Costs
Total Capital Expenditures
Total Administrative Spending as percent of Total Carrier Spending1:
Commercial Administrative Spending as percent of Commercial Spending:
MN Public Programs Administrative Spending as percent of MN Public Programs Spending:
Medicare Administrative Spending as percent of Medicare Spending (includes Medicare Advantage, Part D, and Medicare Supplement):1Self-insured expenses are not required to be reported, but are encouraged. When reported, these amounts are included in Total Administrative and Total Carrier Spending; thus, the Total Administrative percentage may not fall within the range reported for the Commercial, MN Public Program, and Medicare categories.
Indirect Health Care Expenses (Medical and Dental)

2010 Administrative Spending: Bankers Life and Casualty Company
15.9%
2.3%
Not Applicable
18.2%
Calendar Year 2010
Indirect Expense Category Salaries and Benefits Other ExpenseTotal Indirect Health Care
Expense (by category)
Billing and Enrollment 3,176 4,595 7,771
Claim Processing 67,985 98,343 166,328
Detection and Prevention of Fraud 14,223 20,574 34,797
Customer Service 37,217 53,835 91,052
Product Management and Marketing 300,661 434,922 735,583
Underwriting 47,409 68,580 115,989
Regulatory Compliance and Government
5,168 7,475 12,643
Lobbying 1,422 2,057 3,479
Provider Relations and Contracting 0 0
Quality Assurance and Utilization Management
0 0
Wellness and Health Education 379 549 928
Research and Product Development 10,477 15,156 25,633
Charitable Contributions 0 0
General Administration 77,182 111,648 188,830
Total Indirect Health Care Expenses
565,299 817,734 1,383,033
Taxes and Assessments Calendar Year 2010
MinnesotaCare Tax 0
Other Taxes and Assessments 972,185
Capital Costs Calendar Year 2010
2010 Incurred 2010 Payments
Capital Costs on Behalf of a Hospital or Clinic
0 0
Capital Acquisitions 0 0
Other Capital Costs 0 0
Total Capital Expenditures
Total Administrative Spending as percent of Total Carrier Spending1:
Commercial Administrative Spending as percent of Commercial Spending:
MN Public Programs Administrative Spending as percent of MN Public Programs Spending:
Medicare Administrative Spending as percent of Medicare Spending (includes Medicare Advantage, Part D, and Medicare Supplement):1Self-insured expenses are not required to be reported, but are encouraged. When reported, these amounts are included in Total Administrative and Total Carrier Spending; thus, the Total Administrative percentage may not fall within the range reported for the Commercial, MN Public Program, and Medicare categories.
Indirect Health Care Expenses (Medical and Dental)

2010 Administrative Spending: Blue Cross Blue Shield of Minnesota
7.0%
10.8%
Not Applicable
15.8%
Calendar Year 2010
Indirect Expense Category Salaries and Benefits Other ExpenseTotal Indirect Health Care
Expense (by category)
Billing and Enrollment 7,377,000 2,588,000 9,965,000
Claim Processing 29,281,000 62,955,000 92,236,000
Detection and Prevention of Fraud 154,000 43,000 197,000
Customer Service 12,549,000 4,294,000 16,843,000
Product Management and Marketing 11,581,000 45,864,000 57,445,000
Underwriting 3,198,000 647,000 3,845,000
Regulatory Compliance and Government
323,000 308,000 631,000
Lobbying 32,000 54,000 86,000
Provider Relations and Contracting 9,245,000 2,903,000 12,148,000
Quality Assurance and Utilization Management
1,628,000 1,780,000 3,408,000
Wellness and Health Education 6,693,000 10,928,000 17,621,000
Research and Product Development 8,353,000 11,953,000 20,306,000
Charitable Contributions 0 187,000 187,000
General Administration 26,677,000 40,394,000 67,071,000
Total Indirect Health Care Expenses
117,091,000 184,898,000 301,989,000
Taxes and Assessments Calendar Year 2010
MinnesotaCare Tax 70,391,000
Other Taxes and Assessments 55,597,000
Capital Costs Calendar Year 2010
2010 Incurred 2010 Payments
Capital Costs on Behalf of a Hospital or Clinic
0 0
Capital Acquisitions 34,561,000 34,561,000
Other Capital Costs 0 0
Total Capital Expenditures 34,561,000 34,561,000
Total Administrative Spending as percent of Total Carrier Spending1:
Commercial Administrative Spending as percent of Commercial Spending:
MN Public Programs Administrative Spending as percent of MN Public Programs Spending:
Medicare Administrative Spending as percent of Medicare Spending (includes Medicare Advantage, Part D, and Medicare Supplement):1Self-insured expenses are not required to be reported, but are encouraged. When reported, these amounts are included in Total Administrative and Total Carrier Spending; thus, the Total Administrative percentage may not fall within the range reported for the Commercial, MN Public Program, and Medicare categories.
Indirect Health Care Expenses (Medical and Dental)

2010 Administrative Spending: Blue Plus
6.5%
7.8%
6.4%
12.5%
Calendar Year 2010
Indirect Expense Category Salaries and Benefits Other ExpenseTotal Indirect Health Care
Expense (by category)
Billing and Enrollment 962,000 385,000 1,347,000
Claim Processing 9,403,000 9,466,000 18,869,000
Detection and Prevention of Fraud 24,000 6,000 30,000
Customer Service 1,713,000 444,000 2,157,000
Product Management and Marketing 2,296,000 3,364,000 5,660,000
Underwriting 161,000 27,000 188,000
Regulatory Compliance and Government
76,000 209,000 285,000
Lobbying 12,000 21,000 33,000
Provider Relations and Contracting 1,567,000 613,000 2,180,000
Quality Assurance and Utilization Management
1,609,000 1,001,000 2,610,000
Wellness and Health Education 5,983,000 3,447,000 9,430,000
Research and Product Development 1,210,000 1,720,000 2,930,000
Charitable Contributions 0 45,000 45,000
General Administration 5,697,000 10,111,000 15,808,000
Total Indirect Health Care Expenses
30,713,000 30,859,000 61,572,000
Taxes and Assessments Calendar Year 2010
MinnesotaCare Tax 17,598,000
Other Taxes and Assessments 13,168,000
Capital Costs Calendar Year 2010
2010 Incurred 2010 Payments
Capital Costs on Behalf of a Hospital or Clinic
0 0
Capital Acquisitions 0 0
Other Capital Costs 0 0
Total Capital Expenditures
Total Administrative Spending as percent of Total Carrier Spending1:
Commercial Administrative Spending as percent of Commercial Spending:
MN Public Programs Administrative Spending as percent of MN Public Programs Spending:
Medicare Administrative Spending as percent of Medicare Spending (includes Medicare Advantage, Part D, and Medicare Supplement):1Self-insured expenses are not required to be reported, but are encouraged. When reported, these amounts are included in Total Administrative and Total Carrier Spending; thus, the Total Administrative percentage may not fall within the range reported for the Commercial, MN Public Program, and Medicare categories.
Indirect Health Care Expenses (Medical and Dental)
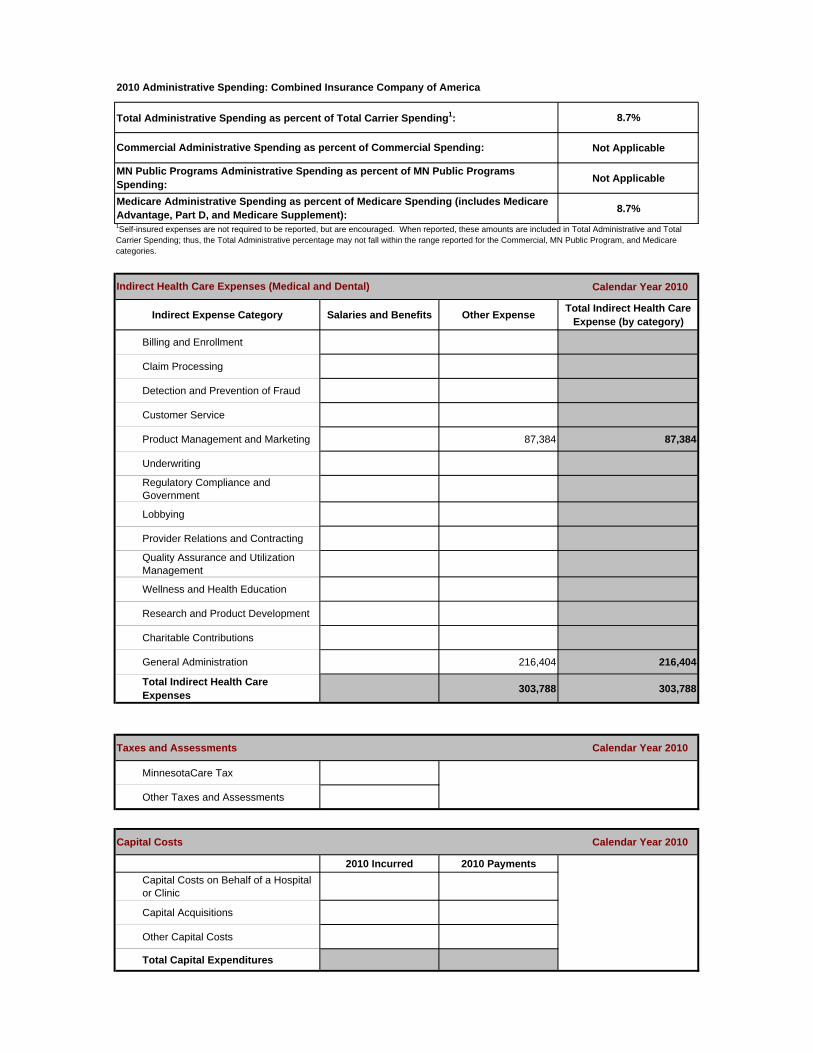
2010 Administrative Spending: Combined Insurance Company of America
8.7%
Not Applicable
Not Applicable
8.7%
Calendar Year 2010
Indirect Expense Category Salaries and Benefits Other ExpenseTotal Indirect Health Care
Expense (by category)
Billing and Enrollment
Claim Processing
Detection and Prevention of Fraud
Customer Service
Product Management and Marketing 87,384 87,384
Underwriting
Regulatory Compliance and Government
Lobbying
Provider Relations and Contracting
Quality Assurance and Utilization Management
Wellness and Health Education
Research and Product Development
Charitable Contributions
General Administration 216,404 216,404
Total Indirect Health Care Expenses
303,788 303,788
Taxes and Assessments Calendar Year 2010
MinnesotaCare Tax
Other Taxes and Assessments
Capital Costs Calendar Year 2010
2010 Incurred 2010 Payments
Capital Costs on Behalf of a Hospital or Clinic
Capital Acquisitions
Other Capital Costs
Total Capital Expenditures
Total Administrative Spending as percent of Total Carrier Spending1:
Commercial Administrative Spending as percent of Commercial Spending:
MN Public Programs Administrative Spending as percent of MN Public Programs Spending:
Medicare Administrative Spending as percent of Medicare Spending (includes Medicare Advantage, Part D, and Medicare Supplement):1Self-insured expenses are not required to be reported, but are encouraged. When reported, these amounts are included in Total Administrative and Total Carrier Spending; thus, the Total Administrative percentage may not fall within the range reported for the Commercial, MN Public Program, and Medicare categories.
Indirect Health Care Expenses (Medical and Dental)

2010 Administrative Spending: Companion Life Insurance Company
100.0%
Not Applicable
Not Applicable
Not Applicable
Calendar Year 2010
Indirect Expense Category Salaries and Benefits Other ExpenseTotal Indirect Health Care
Expense (by category)
Billing and Enrollment
Claim Processing
Detection and Prevention of Fraud
Customer Service
Product Management and Marketing 17,991 17,991
Underwriting 149 149
Regulatory Compliance and Government
2,866 2,866
Lobbying
Provider Relations and Contracting
Quality Assurance and Utilization Management
Wellness and Health Education
Research and Product Development
Charitable Contributions
General Administration 12,773 12,773
Total Indirect Health Care Expenses
20,857 12,922 33,779
Taxes and Assessments Calendar Year 2010
MinnesotaCare Tax 0
Other Taxes and Assessments 0
Capital Costs Calendar Year 2010
2010 Incurred 2010 Payments
Capital Costs on Behalf of a Hospital or Clinic
0 0
Capital Acquisitions 0 0
Other Capital Costs 0 0
Total Capital Expenditures
Total Administrative Spending as percent of Total Carrier Spending1:
Commercial Administrative Spending as percent of Commercial Spending:
MN Public Programs Administrative Spending as percent of MN Public Programs Spending:
Medicare Administrative Spending as percent of Medicare Spending (includes Medicare Advantage, Part D, and Medicare Supplement):1Self-insured expenses are not required to be reported, but are encouraged. When reported, these amounts are included in Total Administrative and Total Carrier Spending; thus, the Total Administrative percentage may not fall within the range reported for the Commercial, MN Public Program, and Medicare categories.
Indirect Health Care Expenses (Medical and Dental)

2010 Administrative Spending: Connecticut General Life Insurance Company
9.6%
50.5%
Not Applicable
48.1%
Calendar Year 2010
Indirect Expense Category Salaries and Benefits Other ExpenseTotal Indirect Health Care
Expense (by category)
Billing and Enrollment 3,191,125 4,200,070 7,391,195
Claim Processing 5,526,801 7,274,222 12,801,023
Detection and Prevention of Fraud 0 0
Customer Service 1,196,294 1,574,529 2,770,823
Product Management and Marketing 1,786,122 2,350,845 4,136,967
Underwriting 0 0
Regulatory Compliance and Government
15,124 19,906 35,030
Lobbying 0 0
Provider Relations and Contracting 589,829 776,316 1,366,145
Quality Assurance and Utilization Management
30,248 39,811 70,059
Wellness and Health Education 0 0
Research and Product Development 75,618 99,528 175,146
Charitable Contributions 0 0
General Administration 2,711,700 3,569,063 6,280,763
Total Indirect Health Care Expenses
15,122,861 19,904,290 35,027,151
Taxes and Assessments Calendar Year 2010
MinnesotaCare Tax 0
Other Taxes and Assessments 820,597
Capital Costs Calendar Year 2010
2010 Incurred 2010 Payments
Capital Costs on Behalf of a Hospital or Clinic
Capital Acquisitions
Other Capital Costs
Total Capital Expenditures
Total Administrative Spending as percent of Total Carrier Spending1:
Commercial Administrative Spending as percent of Commercial Spending:
MN Public Programs Administrative Spending as percent of MN Public Programs Spending:
Medicare Administrative Spending as percent of Medicare Spending (includes Medicare Advantage, Part D, and Medicare Supplement):1Self-insured expenses are not required to be reported, but are encouraged. When reported, these amounts are included in Total Administrative and Total Carrier Spending; thus, the Total Administrative percentage may not fall within the range reported for the Commercial, MN Public Program, and Medicare categories.
Indirect Health Care Expenses (Medical and Dental)

2010 Administrative Spending: Continental Life Insurance Company of Brentwood TN
9.9%
17.6%
Not Applicable
9.7%
Calendar Year 2010
Indirect Expense Category Salaries and Benefits Other ExpenseTotal Indirect Health Care
Expense (by category)
Billing and Enrollment 11,695 15,336 27,031
Claim Processing 21,753 39,255 61,008
Detection and Prevention of Fraud 0 0
Customer Service 10,088 4,141 14,229
Product Management and Marketing 16,875 11,051 27,926
Underwriting 11,695 15,336 27,031
Regulatory Compliance and Government
6,587 5,487 12,074
Lobbying 0 0
Provider Relations and Contracting 3,839 6,927 10,766
Quality Assurance and Utilization Management
0 0
Wellness and Health Education 0 0
Research and Product Development 4,219 2,763 6,982
Charitable Contributions 0 0
General Administration 87,738 138,395 226,133
Total Indirect Health Care Expenses
174,489 238,691 413,180
Taxes and Assessments Calendar Year 2010
MinnesotaCare Tax
Other Taxes and Assessments
Capital Costs Calendar Year 2010
2010 Incurred 2010 Payments
Capital Costs on Behalf of a Hospital or Clinic
Capital Acquisitions
Other Capital Costs 23,341 23,341
Total Capital Expenditures 23,341 23,341
Total Administrative Spending as percent of Total Carrier Spending1:
Commercial Administrative Spending as percent of Commercial Spending:
MN Public Programs Administrative Spending as percent of MN Public Programs Spending:
Medicare Administrative Spending as percent of Medicare Spending (includes Medicare Advantage, Part D, and Medicare Supplement):1Self-insured expenses are not required to be reported, but are encouraged. When reported, these amounts are included in Total Administrative and Total Carrier Spending; thus, the Total Administrative percentage may not fall within the range reported for the Commercial, MN Public Program, and Medicare categories.
Indirect Health Care Expenses (Medical and Dental)

2010 Administrative Spending: Delta Dental Plan of Minnesota
5.7%
9.0%
Not Applicable
Not Applicable
Calendar Year 2010
Indirect Expense Category Salaries and Benefits Other ExpenseTotal Indirect Health Care
Expense (by category)
Billing and Enrollment 4,804,142 4,804,142
Claim Processing 8,944,848 8,944,848
Detection and Prevention of Fraud 762,685 762,685
Customer Service 583,992 10,651,575 11,235,567
Product Management and Marketing 4,671,934 8,881,863 13,553,797
Underwriting 1,205,940 1,205,940
Regulatory Compliance and Government
2,633,195 2,633,195
Lobbying 129,281 129,281
Provider Relations and Contracting 2,875,919 2,875,919
Quality Assurance and Utilization Management
1,741,549 1,741,549
Wellness and Health Education 844,072 844,072
Research and Product Development 583,992 969,570 1,553,562
Charitable Contributions 531,131 531,131
General Administration 8,403,503 8,403,503
Total Indirect Health Care Expenses
5,839,918 53,379,273 59,219,191
Taxes and Assessments Calendar Year 2010
MinnesotaCare Tax 20,775,519
Other Taxes and Assessments 4,171
Capital Costs Calendar Year 2010
2010 Incurred 2010 Payments
Capital Costs on Behalf of a Hospital or Clinic
0 0
Capital Acquisitions 0 0
Other Capital Costs 0 0
Total Capital Expenditures
Total Administrative Spending as percent of Total Carrier Spending1:
Commercial Administrative Spending as percent of Commercial Spending:
MN Public Programs Administrative Spending as percent of MN Public Programs Spending:
Medicare Administrative Spending as percent of Medicare Spending (includes Medicare Advantage, Part D, and Medicare Supplement):1Self-insured expenses are not required to be reported, but are encouraged. When reported, these amounts are included in Total Administrative and Total Carrier Spending; thus, the Total Administrative percentage may not fall within the range reported for the Commercial, MN Public Program, and Medicare categories.
Indirect Health Care Expenses (Medical and Dental)

2010 Administrative Spending: Federated Mutual Insurance Company
14.6%
14.6%
Not Applicable
Not Applicable
Calendar Year 2010
Indirect Expense Category Salaries and Benefits Other ExpenseTotal Indirect Health Care
Expense (by category)
Billing and Enrollment 101,051 31,786 132,837
Claim Processing 1,255,303 1,539,014 2,794,317
Detection and Prevention of Fraud
Customer Service 53,898 9,508 63,406
Product Management and Marketing 1,617,311 422,901 2,040,212
Underwriting 439,810 84,473 524,283
Regulatory Compliance and Government
35,043 7,643 42,686
Lobbying
Provider Relations and Contracting
Quality Assurance and Utilization Management
14,316 3,418 17,734
Wellness and Health Education 3,147 887 4,034
Research and Product Development 109,351 13,953 123,304
Charitable Contributions
General Administration 1,248,995 843,063 2,092,058
Total Indirect Health Care Expenses
4,878,225 2,956,646 7,834,871
Taxes and Assessments Calendar Year 2010
MinnesotaCare Tax
Other Taxes and Assessments 1,311,139
Capital Costs Calendar Year 2010
2010 Incurred 2010 Payments
Capital Costs on Behalf of a Hospital or Clinic
Capital Acquisitions
Other Capital Costs
Total Capital Expenditures
Total Administrative Spending as percent of Total Carrier Spending1:
Commercial Administrative Spending as percent of Commercial Spending:
MN Public Programs Administrative Spending as percent of MN Public Programs Spending:
Medicare Administrative Spending as percent of Medicare Spending (includes Medicare Advantage, Part D, and Medicare Supplement):1Self-insured expenses are not required to be reported, but are encouraged. When reported, these amounts are included in Total Administrative and Total Carrier Spending; thus, the Total Administrative percentage may not fall within the range reported for the Commercial, MN Public Program, and Medicare categories.
Indirect Health Care Expenses (Medical and Dental)

2010 Administrative Spending: First Health Life & Health Insurance Company
1.7%
20.1%
Not Applicable
1.7%
Calendar Year 2010
Indirect Expense Category Salaries and Benefits Other ExpenseTotal Indirect Health Care
Expense (by category)
Billing and Enrollment
Claim Processing
Detection and Prevention of Fraud
Customer Service
Product Management and Marketing
Underwriting
Regulatory Compliance and Government
Lobbying
Provider Relations and Contracting
Quality Assurance and Utilization Management
Wellness and Health Education
Research and Product Development
Charitable Contributions
General Administration 81,602 278,970 360,572
Total Indirect Health Care Expenses
81,602 278,970 360,572
Taxes and Assessments Calendar Year 2010
MinnesotaCare Tax
Other Taxes and Assessments
Capital Costs Calendar Year 2010
2010 Incurred 2010 Payments
Capital Costs on Behalf of a Hospital or Clinic
Capital Acquisitions
Other Capital Costs
Total Capital Expenditures
Total Administrative Spending as percent of Total Carrier Spending1:
Commercial Administrative Spending as percent of Commercial Spending:
MN Public Programs Administrative Spending as percent of MN Public Programs Spending:
Medicare Administrative Spending as percent of Medicare Spending (includes Medicare Advantage, Part D, and Medicare Supplement):1Self-insured expenses are not required to be reported, but are encouraged. When reported, these amounts are included in Total Administrative and Total Carrier Spending; thus, the Total Administrative percentage may not fall within the range reported for the Commercial, MN Public Program, and Medicare categories.
Indirect Health Care Expenses (Medical and Dental)

2010 Administrative Spending: Guarantee Trust Life Insurance Company
16.0%
15.7%
Not Applicable
23.0%
Calendar Year 2010
Indirect Expense Category Salaries and Benefits Other ExpenseTotal Indirect Health Care
Expense (by category)
Billing and Enrollment 8,272 7,333 15,605
Claim Processing 114,864 595,981 710,845
Detection and Prevention of Fraud 0 0
Customer Service 485,155 160,306 645,461
Product Management and Marketing 35,459 44,474 79,933
Underwriting 46,977 21,991 68,968
Regulatory Compliance and Government
50,424 13,299 63,723
Lobbying 0 2,165 2,165
Provider Relations and Contracting 0 0
Quality Assurance and Utilization Management
0 0
Wellness and Health Education 0 0
Research and Product Development 0 0
Charitable Contributions 0 777 777
General Administration 262,484 162,999 425,483
Total Indirect Health Care Expenses
1,003,635 1,009,325 2,012,960
Taxes and Assessments Calendar Year 2010
MinnesotaCare Tax 0
Other Taxes and Assessments 0
Capital Costs Calendar Year 2010
2010 Incurred 2010 Payments
Capital Costs on Behalf of a Hospital or Clinic
0 0
Capital Acquisitions 0 0
Other Capital Costs 0 0
Total Capital Expenditures
Total Administrative Spending as percent of Total Carrier Spending1:
Commercial Administrative Spending as percent of Commercial Spending:
MN Public Programs Administrative Spending as percent of MN Public Programs Spending:
Medicare Administrative Spending as percent of Medicare Spending (includes Medicare Advantage, Part D, and Medicare Supplement):1Self-insured expenses are not required to be reported, but are encouraged. When reported, these amounts are included in Total Administrative and Total Carrier Spending; thus, the Total Administrative percentage may not fall within the range reported for the Commercial, MN Public Program, and Medicare categories.
Indirect Health Care Expenses (Medical and Dental)

2010 Administrative Spending: Guardian Life Insurance Company of America
0.2%
0.2%
Not Applicable
Not Applicable
Calendar Year 2010
Indirect Expense Category Salaries and Benefits Other ExpenseTotal Indirect Health Care
Expense (by category)
Billing and Enrollment 1,872 1,920 3,792
Claim Processing 1,055 1,214 2,269
Detection and Prevention of Fraud 59 16 75
Customer Service 1,120 415 1,535
Product Management and Marketing 2,859 17,720 20,579
Underwriting 0 0
Regulatory Compliance and Government
223 255 478
Lobbying 0 0
Provider Relations and Contracting 0 0
Quality Assurance and Utilization Management
0 395 395
Wellness and Health Education 0 0
Research and Product Development 0 0
Charitable Contributions 0 0
General Administration 1,877 2,637 4,514
Total Indirect Health Care Expenses
9,065 24,572 33,637
Taxes and Assessments Calendar Year 2010
MinnesotaCare Tax 70
Other Taxes and Assessments 10,895
Capital Costs Calendar Year 2010
2010 Incurred 2010 Payments
Capital Costs on Behalf of a Hospital or Clinic
Capital Acquisitions
Other Capital Costs
Total Capital Expenditures
Total Administrative Spending as percent of Total Carrier Spending1:
Commercial Administrative Spending as percent of Commercial Spending:
MN Public Programs Administrative Spending as percent of MN Public Programs Spending:
Medicare Administrative Spending as percent of Medicare Spending (includes Medicare Advantage, Part D, and Medicare Supplement):1Self-insured expenses are not required to be reported, but are encouraged. When reported, these amounts are included in Total Administrative and Total Carrier Spending; thus, the Total Administrative percentage may not fall within the range reported for the Commercial, MN Public Program, and Medicare categories.
Indirect Health Care Expenses (Medical and Dental)

2010 Administrative Spending: HCC Life Insurance Company
9.7%
Not Applicable
Not Applicable
Not Applicable
Calendar Year 2010
Indirect Expense Category Salaries and Benefits Other ExpenseTotal Indirect Health Care
Expense (by category)
Billing and Enrollment 118,657 35,275 153,932
Claim Processing 31,657 9,411 41,068
Detection and Prevention of Fraud
Customer Service
Product Management and Marketing 52,644 15,650 68,294
Underwriting 140,522 41,775 182,297
Regulatory Compliance and Government
Lobbying
Provider Relations and Contracting
Quality Assurance and Utilization Management
Wellness and Health Education
Research and Product Development
Charitable Contributions
General Administration 202,557 60,217 262,774
Total Indirect Health Care Expenses
546,037 162,328 708,365
Taxes and Assessments Calendar Year 2010
MinnesotaCare Tax
Other Taxes and Assessments 314,019
Capital Costs Calendar Year 2010
2010 Incurred 2010 Payments
Capital Costs on Behalf of a Hospital or Clinic
Capital Acquisitions
Other Capital Costs
Total Capital Expenditures
Total Administrative Spending as percent of Total Carrier Spending1:
Commercial Administrative Spending as percent of Commercial Spending:
MN Public Programs Administrative Spending as percent of MN Public Programs Spending:
Medicare Administrative Spending as percent of Medicare Spending (includes Medicare Advantage, Part D, and Medicare Supplement):1Self-insured expenses are not required to be reported, but are encouraged. When reported, these amounts are included in Total Administrative and Total Carrier Spending; thus, the Total Administrative percentage may not fall within the range reported for the Commercial, MN Public Program, and Medicare categories.
Indirect Health Care Expenses (Medical and Dental)

2010 Administrative Spending: HealthPartners, Inc.
6.7%
7.4%
6.2%
7.4%
Calendar Year 2010
Indirect Expense Category Salaries and Benefits Other ExpenseTotal Indirect Health Care
Expense (by category)
Billing and Enrollment 7,292,257 1,786,866 9,079,123
Claim Processing 18,359,140 3,958,659 22,317,799
Detection and Prevention of Fraud 574,508 158,195 732,703
Customer Service 10,819,172 71,534 10,890,706
Product Management and Marketing 19,972,407 10,755,145 30,727,552
Underwriting 5,070,361 292,737 5,363,098
Regulatory Compliance and Government
1,545,670 2,531,374 4,077,044
Lobbying 442,000 0 442,000
Provider Relations and Contracting 3,874,834 162,151 4,036,985
Quality Assurance and Utilization Management
28,984,410 15,622,054 44,606,464
Wellness and Health Education 3,580,411 6,752,313 10,332,724
Research and Product Development 1,591,007 44,021 1,635,028
Charitable Contributions 0 3,769,519 3,769,519
General Administration 54,765,416 42,397,862 97,163,278
Total Indirect Health Care Expenses
156,871,593 88,302,430 245,174,023
Taxes and Assessments Calendar Year 2010
MinnesotaCare Tax 24,766,515
Other Taxes and Assessments 95,117,000
Capital Costs Calendar Year 2010
2010 Incurred 2010 Payments
Capital Costs on Behalf of a Hospital or Clinic
8,021,026 8,451,690
Capital Acquisitions 23,926,736 24,440,439
Other Capital Costs 0 0
Total Capital Expenditures 31,947,762 32,892,129
Total Administrative Spending as percent of Total Carrier Spending1:
Commercial Administrative Spending as percent of Commercial Spending:
MN Public Programs Administrative Spending as percent of MN Public Programs Spending:
Medicare Administrative Spending as percent of Medicare Spending (includes Medicare Advantage, Part D, and Medicare Supplement):1Self-insured expenses are not required to be reported, but are encouraged. When reported, these amounts are included in Total Administrative and Total Carrier Spending; thus, the Total Administrative percentage may not fall within the range reported for the Commercial, MN Public Program, and Medicare categories.
Indirect Health Care Expenses (Medical and Dental)

2010 Administrative Spending: Healthspring Life & Health Insurance Company
9.6%
Not Applicable
Not Applicable
9.6%
Calendar Year 2010
Indirect Expense Category Salaries and Benefits Other ExpenseTotal Indirect Health Care
Expense (by category)
Billing and Enrollment
Claim Processing
Detection and Prevention of Fraud
Customer Service
Product Management and Marketing
Underwriting
Regulatory Compliance and Government
Lobbying
Provider Relations and Contracting
Quality Assurance and Utilization Management
Wellness and Health Education
Research and Product Development
Charitable Contributions
General Administration 747,218 747,218
Total Indirect Health Care Expenses
747,218 747,218
Taxes and Assessments Calendar Year 2010
MinnesotaCare Tax
Other Taxes and Assessments
Capital Costs Calendar Year 2010
2010 Incurred 2010 Payments
Capital Costs on Behalf of a Hospital or Clinic
Capital Acquisitions
Other Capital Costs
Total Capital Expenditures
Total Administrative Spending as percent of Total Carrier Spending1:
Commercial Administrative Spending as percent of Commercial Spending:
MN Public Programs Administrative Spending as percent of MN Public Programs Spending:
Medicare Administrative Spending as percent of Medicare Spending (includes Medicare Advantage, Part D, and Medicare Supplement):1Self-insured expenses are not required to be reported, but are encouraged. When reported, these amounts are included in Total Administrative and Total Carrier Spending; thus, the Total Administrative percentage may not fall within the range reported for the Commercial, MN Public Program, and Medicare categories.
Indirect Health Care Expenses (Medical and Dental)

2010 Administrative Spending: Humana Insurance Company
13.6%
25.2%
Not Applicable
13.6%
Calendar Year 2010
Indirect Expense Category Salaries and Benefits Other ExpenseTotal Indirect Health Care
Expense (by category)
Billing and Enrollment 390,064 4,897,754 5,287,818
Claim Processing 52,763 662,502 715,265
Detection and Prevention of Fraud
Customer Service 222,327 2,791,599 3,013,926
Product Management and Marketing 757,237 9,508,083 10,265,320
Underwriting 0 0
Regulatory Compliance and Government
176,803 2,219,989 2,396,792
Lobbying
Provider Relations and Contracting 236,243 2,966,331 3,202,574
Quality Assurance and Utilization Management
254,871 3,200,239 3,455,110
Wellness and Health Education
Research and Product Development 122,334 1,536,065 1,658,399
Charitable Contributions
General Administration 10,468 131,441 141,909
Total Indirect Health Care Expenses
2,223,110 27,914,003 30,137,113
Taxes and Assessments Calendar Year 2010
MinnesotaCare Tax
Other Taxes and Assessments
Capital Costs Calendar Year 2010
2010 Incurred 2010 Payments
Capital Costs on Behalf of a Hospital or Clinic
Capital Acquisitions
Other Capital Costs
Total Capital Expenditures
Total Administrative Spending as percent of Total Carrier Spending1:
Commercial Administrative Spending as percent of Commercial Spending:
MN Public Programs Administrative Spending as percent of MN Public Programs Spending:
Medicare Administrative Spending as percent of Medicare Spending (includes Medicare Advantage, Part D, and Medicare Supplement):1Self-insured expenses are not required to be reported, but are encouraged. When reported, these amounts are included in Total Administrative and Total Carrier Spending; thus, the Total Administrative percentage may not fall within the range reported for the Commercial, MN Public Program, and Medicare categories.
Indirect Health Care Expenses (Medical and Dental)

2010 Administrative Spending: Itasca Medical Care
8.0%
Not Applicable
8.0%
Not Applicable
Calendar Year 2010
Indirect Expense Category Salaries and Benefits Other ExpenseTotal Indirect Health Care
Expense (by category)
Billing and Enrollment 77,817 87,178 164,995
Claim Processing 207,871 370,504 578,375
Detection and Prevention of Fraud
Customer Service 59,467 87,178 146,645
Product Management and Marketing
Underwriting
Regulatory Compliance and Government
101,068 87,178 188,246
Lobbying
Provider Relations and Contracting 377,041 377,041
Quality Assurance and Utilization Management
250,413 1,176,897 1,427,310
Wellness and Health Education 87,178 87,178
Research and Product Development
Charitable Contributions 8,500 8,500
General Administration 284,128 283,325 567,453
Total Indirect Health Care Expenses
980,764 2,564,979 3,545,743
Taxes and Assessments Calendar Year 2010
MinnesotaCare Tax 105,383
Other Taxes and Assessments
Capital Costs Calendar Year 2010
2010 Incurred 2010 Payments
Capital Costs on Behalf of a Hospital or Clinic
Capital Acquisitions
Other Capital Costs
Total Capital Expenditures
Total Administrative Spending as percent of Total Carrier Spending1:
Commercial Administrative Spending as percent of Commercial Spending:
MN Public Programs Administrative Spending as percent of MN Public Programs Spending:
Medicare Administrative Spending as percent of Medicare Spending (includes Medicare Advantage, Part D, and Medicare Supplement):1Self-insured expenses are not required to be reported, but are encouraged. When reported, these amounts are included in Total Administrative and Total Carrier Spending; thus, the Total Administrative percentage may not fall within the range reported for the Commercial, MN Public Program, and Medicare categories.
Indirect Health Care Expenses (Medical and Dental)

2010 Administrative Spending: John Alden Life Insurance Company
14.6%
14.6%
Not Applicable
Not Applicable
Calendar Year 2010
Indirect Expense Category Salaries and Benefits Other ExpenseTotal Indirect Health Care
Expense (by category)
Billing and Enrollment 8,119 7,593 15,712
Claim Processing 15,051 27,364 42,415
Detection and Prevention of Fraud 0 0
Customer Service 28,498 11,587 40,085
Product Management and Marketing 115,895 104,227 220,122
Underwriting 40,653 13,642 54,295
Regulatory Compliance and Government
14,423 15,883 30,306
Lobbying 0 0
Provider Relations and Contracting 0 11 11
Quality Assurance and Utilization Management
9,442 2,561 12,003
Wellness and Health Education 0 0
Research and Product Development 3,258 694 3,952
Charitable Contributions 0 273 273
General Administration 89,726 270,906 360,632
Total Indirect Health Care Expenses
325,065 454,741 779,806
Taxes and Assessments Calendar Year 2010
MinnesotaCare Tax 360
Other Taxes and Assessments 106,503
Capital Costs Calendar Year 2010
2010 Incurred 2010 Payments
Capital Costs on Behalf of a Hospital or Clinic
Capital Acquisitions
Other Capital Costs
Total Capital Expenditures
Total Administrative Spending as percent of Total Carrier Spending1:
Commercial Administrative Spending as percent of Commercial Spending:
MN Public Programs Administrative Spending as percent of MN Public Programs Spending:
Medicare Administrative Spending as percent of Medicare Spending (includes Medicare Advantage, Part D, and Medicare Supplement):1Self-insured expenses are not required to be reported, but are encouraged. When reported, these amounts are included in Total Administrative and Total Carrier Spending; thus, the Total Administrative percentage may not fall within the range reported for the Commercial, MN Public Program, and Medicare categories.
Indirect Health Care Expenses (Medical and Dental)

2010 Administrative Spending: Lincoln National Life Insurance Company
7.9%
7.9%
Not Applicable
Not Applicable
Calendar Year 2010
Indirect Expense Category Salaries and Benefits Other ExpenseTotal Indirect Health Care
Expense (by category)
Billing and Enrollment
Claim Processing
Detection and Prevention of Fraud
Customer Service
Product Management and Marketing
Underwriting
Regulatory Compliance and Government
Lobbying
Provider Relations and Contracting
Quality Assurance and Utilization Management
Wellness and Health Education
Research and Product Development
Charitable Contributions
General Administration 351,988 150,852 502,840
Total Indirect Health Care Expenses
351,988 150,852 502,840
Taxes and Assessments Calendar Year 2010
MinnesotaCare Tax
Other Taxes and Assessments
Capital Costs Calendar Year 2010
2010 Incurred 2010 Payments
Capital Costs on Behalf of a Hospital or Clinic
Capital Acquisitions
Other Capital Costs
Total Capital Expenditures
Total Administrative Spending as percent of Total Carrier Spending1:
Commercial Administrative Spending as percent of Commercial Spending:
MN Public Programs Administrative Spending as percent of MN Public Programs Spending:
Medicare Administrative Spending as percent of Medicare Spending (includes Medicare Advantage, Part D, and Medicare Supplement):1Self-insured expenses are not required to be reported, but are encouraged. When reported, these amounts are included in Total Administrative and Total Carrier Spending; thus, the Total Administrative percentage may not fall within the range reported for the Commercial, MN Public Program, and Medicare categories.
Indirect Health Care Expenses (Medical and Dental)
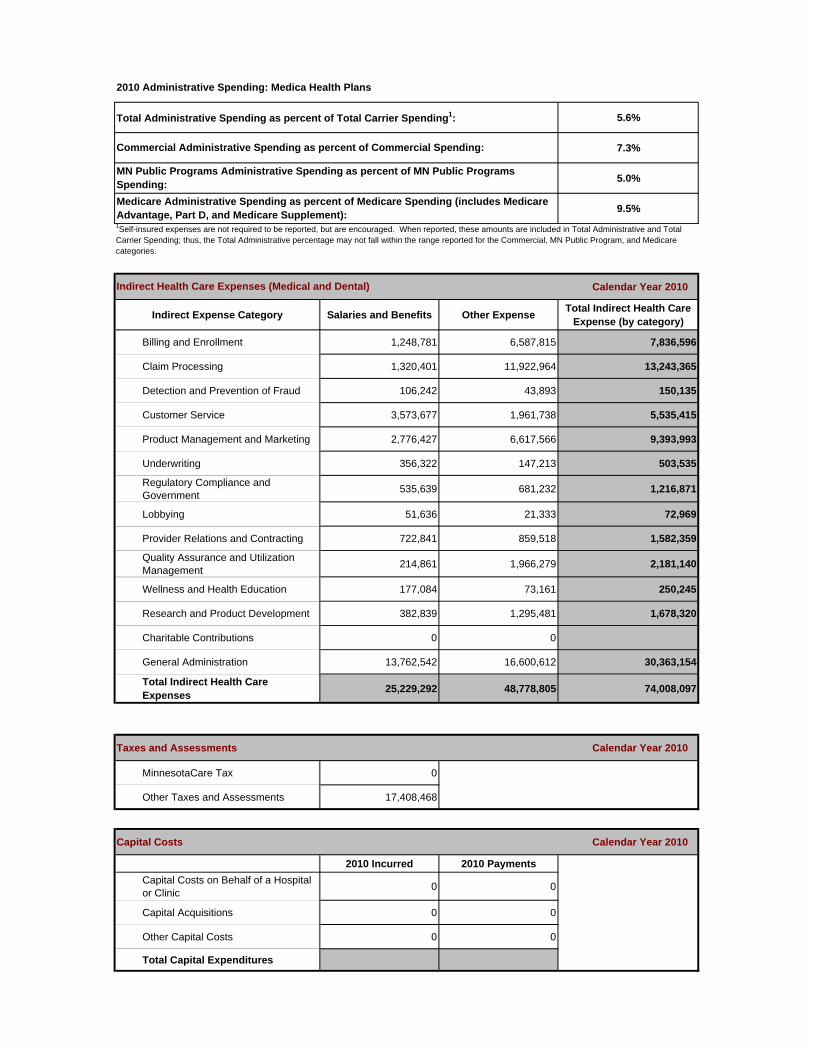
2010 Administrative Spending: Medica Health Plans
5.6%
7.3%
5.0%
9.5%
Calendar Year 2010
Indirect Expense Category Salaries and Benefits Other ExpenseTotal Indirect Health Care
Expense (by category)
Billing and Enrollment 1,248,781 6,587,815 7,836,596
Claim Processing 1,320,401 11,922,964 13,243,365
Detection and Prevention of Fraud 106,242 43,893 150,135
Customer Service 3,573,677 1,961,738 5,535,415
Product Management and Marketing 2,776,427 6,617,566 9,393,993
Underwriting 356,322 147,213 503,535
Regulatory Compliance and Government
535,639 681,232 1,216,871
Lobbying 51,636 21,333 72,969
Provider Relations and Contracting 722,841 859,518 1,582,359
Quality Assurance and Utilization Management
214,861 1,966,279 2,181,140
Wellness and Health Education 177,084 73,161 250,245
Research and Product Development 382,839 1,295,481 1,678,320
Charitable Contributions 0 0
General Administration 13,762,542 16,600,612 30,363,154
Total Indirect Health Care Expenses
25,229,292 48,778,805 74,008,097
Taxes and Assessments Calendar Year 2010
MinnesotaCare Tax 0
Other Taxes and Assessments 17,408,468
Capital Costs Calendar Year 2010
2010 Incurred 2010 Payments
Capital Costs on Behalf of a Hospital or Clinic
0 0
Capital Acquisitions 0 0
Other Capital Costs 0 0
Total Capital Expenditures
Total Administrative Spending as percent of Total Carrier Spending1:
Commercial Administrative Spending as percent of Commercial Spending:
MN Public Programs Administrative Spending as percent of MN Public Programs Spending:
Medicare Administrative Spending as percent of Medicare Spending (includes Medicare Advantage, Part D, and Medicare Supplement):1Self-insured expenses are not required to be reported, but are encouraged. When reported, these amounts are included in Total Administrative and Total Carrier Spending; thus, the Total Administrative percentage may not fall within the range reported for the Commercial, MN Public Program, and Medicare categories.
Indirect Health Care Expenses (Medical and Dental)

2010 Administrative Spending: Medica Insurance Company
10.5%
10.1%
Not Applicable
11.4%
Calendar Year 2010
Indirect Expense Category Salaries and Benefits Other ExpenseTotal Indirect Health Care
Expense (by category)
Billing and Enrollment 2,285,806 9,705,524 11,991,330
Claim Processing 2,416,903 17,415,103 19,832,006
Detection and Prevention of Fraud 194,468 80,344 274,812
Customer Service 6,541,368 3,402,764 9,944,132
Product Management and Marketing 5,082,058 41,820,672 46,902,730
Underwriting 652,222 269,463 921,685
Regulatory Compliance and Government
980,450 1,123,298 2,103,748
Lobbying 94,517 39,049 133,566
Provider Relations and Contracting 1,323,110 1,355,932 2,679,042
Quality Assurance and Utilization Management
393,288 669,333 1,062,621
Wellness and Health Education 324,140 133,917 458,057
Research and Product Development 700,761 1,930,549 2,631,310
Charitable Contributions 0 0
General Administration 25,191,392 10,962,322 36,153,714
Total Indirect Health Care Expenses
46,180,483 88,908,270 135,088,753
Taxes and Assessments Calendar Year 2010
MinnesotaCare Tax 0
Other Taxes and Assessments 54,400,938
Capital Costs Calendar Year 2010
2010 Incurred 2010 Payments
Capital Costs on Behalf of a Hospital or Clinic
0 0
Capital Acquisitions 0 0
Other Capital Costs 0 0
Total Capital Expenditures
Total Administrative Spending as percent of Total Carrier Spending1:
Commercial Administrative Spending as percent of Commercial Spending:
MN Public Programs Administrative Spending as percent of MN Public Programs Spending:
Medicare Administrative Spending as percent of Medicare Spending (includes Medicare Advantage, Part D, and Medicare Supplement):1Self-insured expenses are not required to be reported, but are encouraged. When reported, these amounts are included in Total Administrative and Total Carrier Spending; thus, the Total Administrative percentage may not fall within the range reported for the Commercial, MN Public Program, and Medicare categories.
Indirect Health Care Expenses (Medical and Dental)
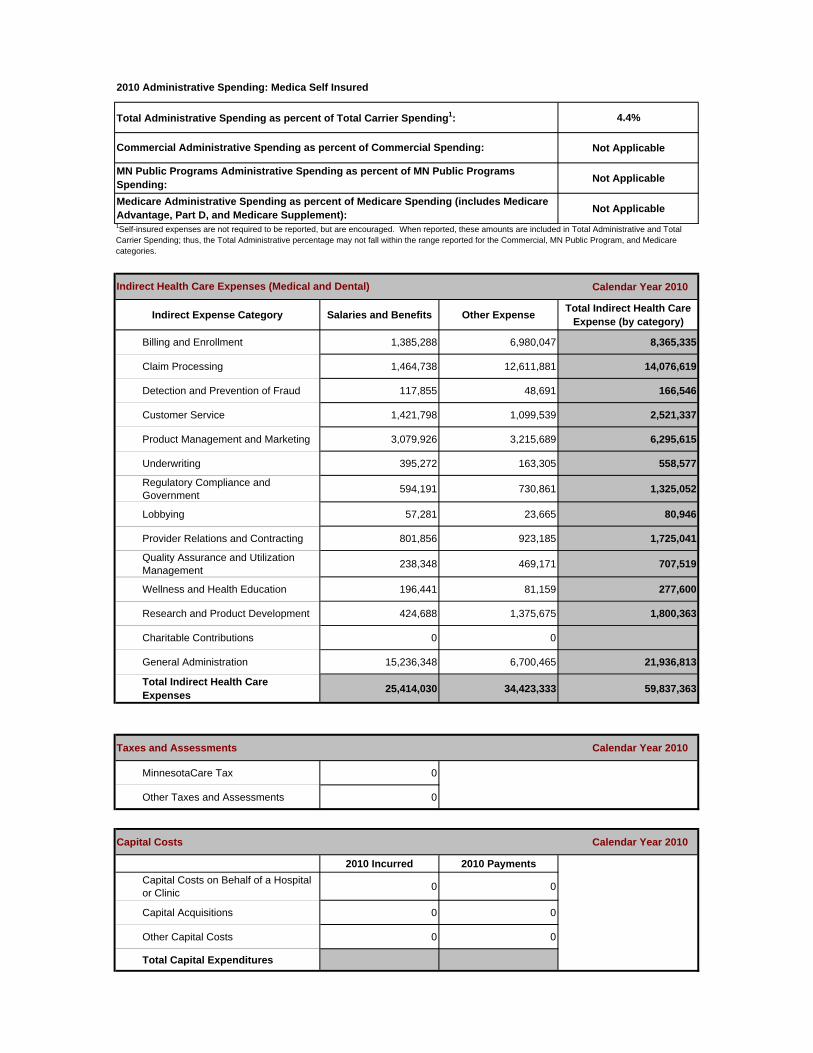
2010 Administrative Spending: Medica Self Insured
4.4%
Not Applicable
Not Applicable
Not Applicable
Calendar Year 2010
Indirect Expense Category Salaries and Benefits Other ExpenseTotal Indirect Health Care
Expense (by category)
Billing and Enrollment 1,385,288 6,980,047 8,365,335
Claim Processing 1,464,738 12,611,881 14,076,619
Detection and Prevention of Fraud 117,855 48,691 166,546
Customer Service 1,421,798 1,099,539 2,521,337
Product Management and Marketing 3,079,926 3,215,689 6,295,615
Underwriting 395,272 163,305 558,577
Regulatory Compliance and Government
594,191 730,861 1,325,052
Lobbying 57,281 23,665 80,946
Provider Relations and Contracting 801,856 923,185 1,725,041
Quality Assurance and Utilization Management
238,348 469,171 707,519
Wellness and Health Education 196,441 81,159 277,600
Research and Product Development 424,688 1,375,675 1,800,363
Charitable Contributions 0 0
General Administration 15,236,348 6,700,465 21,936,813
Total Indirect Health Care Expenses
25,414,030 34,423,333 59,837,363
Taxes and Assessments Calendar Year 2010
MinnesotaCare Tax 0
Other Taxes and Assessments 0
Capital Costs Calendar Year 2010
2010 Incurred 2010 Payments
Capital Costs on Behalf of a Hospital or Clinic
0 0
Capital Acquisitions 0 0
Other Capital Costs 0 0
Total Capital Expenditures
Total Administrative Spending as percent of Total Carrier Spending1:
Commercial Administrative Spending as percent of Commercial Spending:
MN Public Programs Administrative Spending as percent of MN Public Programs Spending:
Medicare Administrative Spending as percent of Medicare Spending (includes Medicare Advantage, Part D, and Medicare Supplement):1Self-insured expenses are not required to be reported, but are encouraged. When reported, these amounts are included in Total Administrative and Total Carrier Spending; thus, the Total Administrative percentage may not fall within the range reported for the Commercial, MN Public Program, and Medicare categories.
Indirect Health Care Expenses (Medical and Dental)

2010 Administrative Spending: Metropolitan HealthPlan (MHP)
14.1%
Not Applicable
14.1%
10.4%
Calendar Year 2010
Indirect Expense Category Salaries and Benefits Other ExpenseTotal Indirect Health Care
Expense (by category)
Billing and Enrollment 387,946 353,020 740,966
Claim Processing 2,771,539 1,616,780 4,388,319
Detection and Prevention of Fraud 233,050 38,792 271,842
Customer Service 1,524,491 581,964 2,106,455
Product Management and Marketing 481,000 441,726 922,726
Underwriting
Regulatory Compliance and Government
1,316,189 685,263 2,001,452
Lobbying
Provider Relations and Contracting 1,066,357 266,161 1,332,518
Quality Assurance and Utilization Management
2,732,356 831,655 3,564,011
Wellness and Health Education 152,947 38,792 191,739
Research and Product Development 0 34,988 34,988
Charitable Contributions 0 117,778 117,778
General Administration 568,103 3,545,017 4,113,120
Total Indirect Health Care Expenses
11,233,978 8,551,936 19,785,914
Taxes and Assessments Calendar Year 2010
MinnesotaCare Tax 649,598
Other Taxes and Assessments 1,873,584
Capital Costs Calendar Year 2010
2010 Incurred 2010 Payments
Capital Costs on Behalf of a Hospital or Clinic
Capital Acquisitions 0
Other Capital Costs
Total Capital Expenditures
Total Administrative Spending as percent of Total Carrier Spending1:
Commercial Administrative Spending as percent of Commercial Spending:
MN Public Programs Administrative Spending as percent of MN Public Programs Spending:
Medicare Administrative Spending as percent of Medicare Spending (includes Medicare Advantage, Part D, and Medicare Supplement):1Self-insured expenses are not required to be reported, but are encouraged. When reported, these amounts are included in Total Administrative and Total Carrier Spending; thus, the Total Administrative percentage may not fall within the range reported for the Commercial, MN Public Program, and Medicare categories.
Indirect Health Care Expenses (Medical and Dental)
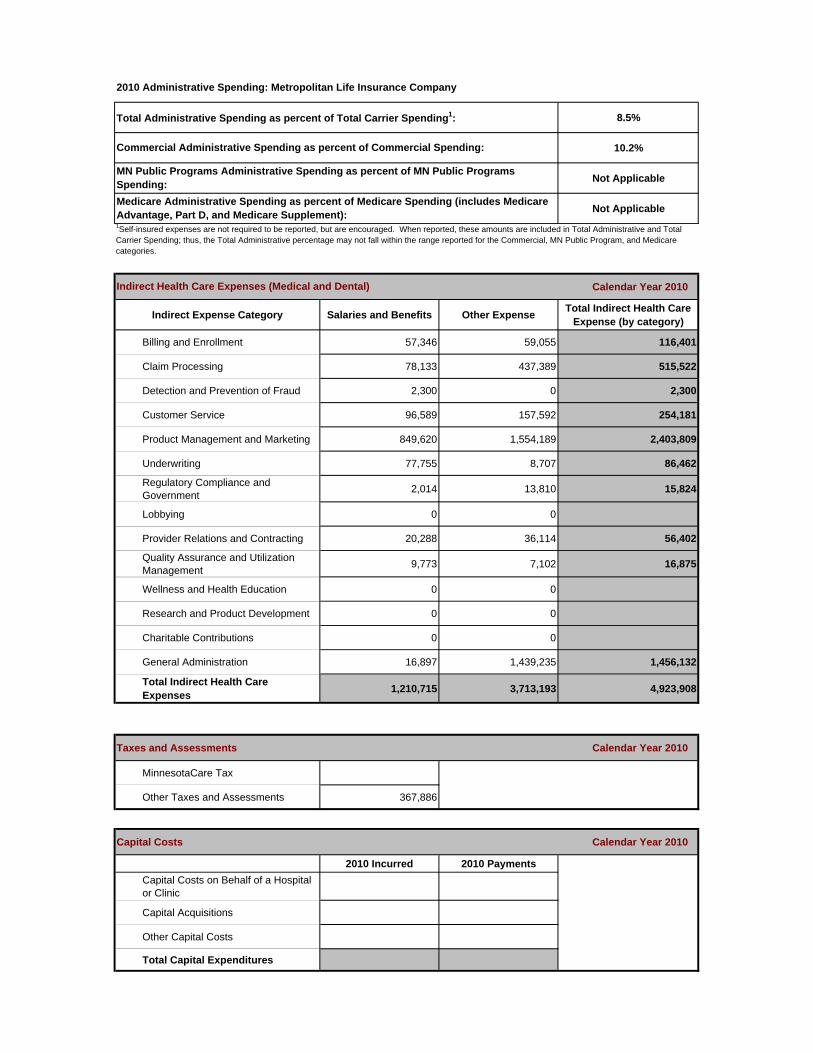
2010 Administrative Spending: Metropolitan Life Insurance Company
8.5%
10.2%
Not Applicable
Not Applicable
Calendar Year 2010
Indirect Expense Category Salaries and Benefits Other ExpenseTotal Indirect Health Care
Expense (by category)
Billing and Enrollment 57,346 59,055 116,401
Claim Processing 78,133 437,389 515,522
Detection and Prevention of Fraud 2,300 0 2,300
Customer Service 96,589 157,592 254,181
Product Management and Marketing 849,620 1,554,189 2,403,809
Underwriting 77,755 8,707 86,462
Regulatory Compliance and Government
2,014 13,810 15,824
Lobbying 0 0
Provider Relations and Contracting 20,288 36,114 56,402
Quality Assurance and Utilization Management
9,773 7,102 16,875
Wellness and Health Education 0 0
Research and Product Development 0 0
Charitable Contributions 0 0
General Administration 16,897 1,439,235 1,456,132
Total Indirect Health Care Expenses
1,210,715 3,713,193 4,923,908
Taxes and Assessments Calendar Year 2010
MinnesotaCare Tax
Other Taxes and Assessments 367,886
Capital Costs Calendar Year 2010
2010 Incurred 2010 Payments
Capital Costs on Behalf of a Hospital or Clinic
Capital Acquisitions
Other Capital Costs
Total Capital Expenditures
Total Administrative Spending as percent of Total Carrier Spending1:
Commercial Administrative Spending as percent of Commercial Spending:
MN Public Programs Administrative Spending as percent of MN Public Programs Spending:
Medicare Administrative Spending as percent of Medicare Spending (includes Medicare Advantage, Part D, and Medicare Supplement):1Self-insured expenses are not required to be reported, but are encouraged. When reported, these amounts are included in Total Administrative and Total Carrier Spending; thus, the Total Administrative percentage may not fall within the range reported for the Commercial, MN Public Program, and Medicare categories.
Indirect Health Care Expenses (Medical and Dental)

2010 Administrative Spending: Mutual of Omaha Insurance Company
12.8%
67.9%
Not Applicable
10.5%
Calendar Year 2010
Indirect Expense Category Salaries and Benefits Other ExpenseTotal Indirect Health Care
Expense (by category)
Billing and Enrollment 3,555 3,371 6,926
Claim Processing 66,947 117,940 184,887
Detection and Prevention of Fraud 1,817 452 2,269
Customer Service 29,663 10,469 40,132
Product Management and Marketing 23,997 452,601 476,598
Underwriting 3,525 2,269 5,794
Regulatory Compliance and Government
145 13,985 14,130
Lobbying
Provider Relations and Contracting
Quality Assurance and Utilization Management
1 1
Wellness and Health Education
Research and Product Development 4,197 1,092 5,289
Charitable Contributions
General Administration 52,416 25,305 77,721
Total Indirect Health Care Expenses
186,262 627,485 813,747
Taxes and Assessments Calendar Year 2010
MinnesotaCare Tax 16,958
Other Taxes and Assessments 194,679
Capital Costs Calendar Year 2010
2010 Incurred 2010 Payments
Capital Costs on Behalf of a Hospital or Clinic
Capital Acquisitions
Other Capital Costs
Total Capital Expenditures
Total Administrative Spending as percent of Total Carrier Spending1:
Commercial Administrative Spending as percent of Commercial Spending:
MN Public Programs Administrative Spending as percent of MN Public Programs Spending:
Medicare Administrative Spending as percent of Medicare Spending (includes Medicare Advantage, Part D, and Medicare Supplement):1Self-insured expenses are not required to be reported, but are encouraged. When reported, these amounts are included in Total Administrative and Total Carrier Spending; thus, the Total Administrative percentage may not fall within the range reported for the Commercial, MN Public Program, and Medicare categories.
Indirect Health Care Expenses (Medical and Dental)

2010 Administrative Spending: Pan-American Life
1.0%
0.9%
Not Applicable
Not Applicable
Calendar Year 2010
Indirect Expense Category Salaries and Benefits Other ExpenseTotal Indirect Health Care
Expense (by category)
Billing and Enrollment 8,707 11,214 19,921
Claim Processing 13,060 16,822 29,882
Detection and Prevention of Fraud
Customer Service
Product Management and Marketing
Underwriting
Regulatory Compliance and Government
Lobbying
Provider Relations and Contracting
Quality Assurance and Utilization Management
Wellness and Health Education
Research and Product Development
Charitable Contributions
General Administration
Total Indirect Health Care Expenses
21,767 28,036 49,803
Taxes and Assessments Calendar Year 2010
MinnesotaCare Tax
Other Taxes and Assessments 113,124
Capital Costs Calendar Year 2010
2010 Incurred 2010 Payments
Capital Costs on Behalf of a Hospital or Clinic
Capital Acquisitions
Other Capital Costs
Total Capital Expenditures
Total Administrative Spending as percent of Total Carrier Spending1:
Commercial Administrative Spending as percent of Commercial Spending:
MN Public Programs Administrative Spending as percent of MN Public Programs Spending:
Medicare Administrative Spending as percent of Medicare Spending (includes Medicare Advantage, Part D, and Medicare Supplement):1Self-insured expenses are not required to be reported, but are encouraged. When reported, these amounts are included in Total Administrative and Total Carrier Spending; thus, the Total Administrative percentage may not fall within the range reported for the Commercial, MN Public Program, and Medicare categories.
Indirect Health Care Expenses (Medical and Dental)

2010 Administrative Spending: Pennsylvania Life Insurance Company
10.4%
100.0%
Not Applicable
9.8%
Calendar Year 2010
Indirect Expense Category Salaries and Benefits Other ExpenseTotal Indirect Health Care
Expense (by category)
Billing and Enrollment 106,748 204,402 311,150
Claim Processing 383,407 734,154 1,117,561
Detection and Prevention of Fraud 116 223 339
Customer Service 79,777 152,757 232,534
Product Management and Marketing 38,906 74,498 113,404
Underwriting 0 0
Regulatory Compliance and Government
8,112 15,533 23,645
Lobbying 0 0
Provider Relations and Contracting 136 259 395
Quality Assurance and Utilization Management
6,970 13,346 20,316
Wellness and Health Education 3,719 7,120 10,839
Research and Product Development 8,205 15,711 23,916
Charitable Contributions 0 0
General Administration 245,553 470,188 715,741
Total Indirect Health Care Expenses
881,649 1,688,191 2,569,840
Taxes and Assessments Calendar Year 2010
MinnesotaCare Tax
Other Taxes and Assessments
Capital Costs Calendar Year 2010
2010 Incurred 2010 Payments
Capital Costs on Behalf of a Hospital or Clinic
Capital Acquisitions
Other Capital Costs
Total Capital Expenditures
Total Administrative Spending as percent of Total Carrier Spending1:
Commercial Administrative Spending as percent of Commercial Spending:
MN Public Programs Administrative Spending as percent of MN Public Programs Spending:
Medicare Administrative Spending as percent of Medicare Spending (includes Medicare Advantage, Part D, and Medicare Supplement):1Self-insured expenses are not required to be reported, but are encouraged. When reported, these amounts are included in Total Administrative and Total Carrier Spending; thus, the Total Administrative percentage may not fall within the range reported for the Commercial, MN Public Program, and Medicare categories.
Indirect Health Care Expenses (Medical and Dental)

2010 Administrative Spending: Physicians Mutual Ins. Co. & Physicians Life Ins. Co.
26.1%
46.0%
Not Applicable
21.8%
Calendar Year 2010
Indirect Expense Category Salaries and Benefits Other ExpenseTotal Indirect Health Care
Expense (by category)
Billing and Enrollment 22,029 43,935 65,964
Claim Processing 48,064 84,551 132,615
Detection and Prevention of Fraud 2,501 4,182 6,683
Customer Service 19,463 24,801 44,264
Product Management and Marketing 164,404 282,417 446,821
Underwriting 6,853 10,533 17,386
Regulatory Compliance and Government
5,049 6,924 11,973
Lobbying
Provider Relations and Contracting 9,841 17,278 27,119
Quality Assurance and Utilization Management
42,539 86,026 128,565
Wellness and Health Education
Research and Product Development 19,996 38,663 58,659
Charitable Contributions
General Administration 136,074 252,352 388,426
Total Indirect Health Care Expenses
476,813 851,662 1,328,475
Taxes and Assessments Calendar Year 2010
MinnesotaCare Tax
Other Taxes and Assessments 247,052
Capital Costs Calendar Year 2010
2010 Incurred 2010 Payments
Capital Costs on Behalf of a Hospital or Clinic
Capital Acquisitions
Other Capital Costs
Total Capital Expenditures
Total Administrative Spending as percent of Total Carrier Spending1:
Commercial Administrative Spending as percent of Commercial Spending:
MN Public Programs Administrative Spending as percent of MN Public Programs Spending:
Medicare Administrative Spending as percent of Medicare Spending (includes Medicare Advantage, Part D, and Medicare Supplement):1Self-insured expenses are not required to be reported, but are encouraged. When reported, these amounts are included in Total Administrative and Total Carrier Spending; thus, the Total Administrative percentage may not fall within the range reported for the Commercial, MN Public Program, and Medicare categories.
Indirect Health Care Expenses (Medical and Dental)

2010 Administrative Spending: PreferredOne Community Health Plan
10.5%
10.5%
Not Applicable
Not Applicable
Calendar Year 2010
Indirect Expense Category Salaries and Benefits Other ExpenseTotal Indirect Health Care
Expense (by category)
Billing and Enrollment 360,179 245,164 605,343
Claim Processing 583,291 397,030 980,321
Detection and Prevention of Fraud 84,345 57,411 141,756
Customer Service 531,632 361,867 893,499
Product Management and Marketing 1,237,905 5,260,368 6,498,273
Underwriting 451,379 307,241 758,620
Regulatory Compliance and Government
287,580 195,747 483,327
Lobbying 9,513 6,475 15,988
Provider Relations and Contracting 413,751 281,629 695,380
Quality Assurance and Utilization Management
327,600 222,988 550,588
Wellness and Health Education 104,434 444,947 549,381
Research and Product Development 201,906 137,432 339,338
Charitable Contributions 0 0
General Administration 721,208 793,361 1,514,569
Total Indirect Health Care Expenses
5,314,723 8,711,660 14,026,383
Taxes and Assessments Calendar Year 2010
MinnesotaCare Tax
Other Taxes and Assessments 5,237,732
Capital Costs Calendar Year 2010
2010 Incurred 2010 Payments
Capital Costs on Behalf of a Hospital or Clinic
Capital Acquisitions
Other Capital Costs
Total Capital Expenditures
Total Administrative Spending as percent of Total Carrier Spending1:
Commercial Administrative Spending as percent of Commercial Spending:
MN Public Programs Administrative Spending as percent of MN Public Programs Spending:
Medicare Administrative Spending as percent of Medicare Spending (includes Medicare Advantage, Part D, and Medicare Supplement):1Self-insured expenses are not required to be reported, but are encouraged. When reported, these amounts are included in Total Administrative and Total Carrier Spending; thus, the Total Administrative percentage may not fall within the range reported for the Commercial, MN Public Program, and Medicare categories.
Indirect Health Care Expenses (Medical and Dental)

2010 Administrative Spending: PreferredOne Insurance Company
10.9%
11.6%
Not Applicable
Not Applicable
Calendar Year 2010
Indirect Expense Category Salaries and Benefits Other ExpenseTotal Indirect Health Care
Expense (by category)
Billing and Enrollment 232,053 157,952 390,005
Claim Processing 375,798 255,796 631,594
Detection and Prevention of Fraud 54,341 36,988 91,329
Customer Service 342,516 233,141 575,657
Product Management and Marketing 797,549 5,116,803 5,914,352
Underwriting 290,811 197,947 488,758
Regulatory Compliance and Government
185,280 126,115 311,395
Lobbying 6,129 4,172 10,301
Provider Relations and Contracting 266,569 181,446 448,015
Quality Assurance and Utilization Management
211,063 143,665 354,728
Wellness and Health Education 67,284 308,580 375,864
Research and Product Development 130,083 88,544 218,627
Charitable Contributions
General Administration 464,655 446,891 911,546
Total Indirect Health Care Expenses
3,424,131 7,298,040 10,722,171
Taxes and Assessments Calendar Year 2010
MinnesotaCare Tax
Other Taxes and Assessments 4,542,266
Capital Costs Calendar Year 2010
2010 Incurred 2010 Payments
Capital Costs on Behalf of a Hospital or Clinic
Capital Acquisitions
Other Capital Costs
Total Capital Expenditures
Total Administrative Spending as percent of Total Carrier Spending1:
Commercial Administrative Spending as percent of Commercial Spending:
MN Public Programs Administrative Spending as percent of MN Public Programs Spending:
Medicare Administrative Spending as percent of Medicare Spending (includes Medicare Advantage, Part D, and Medicare Supplement):1Self-insured expenses are not required to be reported, but are encouraged. When reported, these amounts are included in Total Administrative and Total Carrier Spending; thus, the Total Administrative percentage may not fall within the range reported for the Commercial, MN Public Program, and Medicare categories.
Indirect Health Care Expenses (Medical and Dental)

2010 Administrative Spending: PrimeWest Health System
10.7%
Not Applicable
10.7%
Not Applicable
Calendar Year 2010
Indirect Expense Category Salaries and Benefits Other ExpenseTotal Indirect Health Care
Expense (by category)
Billing and Enrollment 282,828 132,178 415,006
Claim Processing 2,249,225 2,646,129 4,895,354
Detection and Prevention of Fraud 174,275 83,415 257,690
Customer Service 173,882 29,969 203,851
Product Management and Marketing 395,357 476,012 871,369
Underwriting 0 0
Regulatory Compliance and Government
550,871 677,921 1,228,792
Lobbying 0 27,542 27,542
Provider Relations and Contracting 552,032 179,861 731,893
Quality Assurance and Utilization Management
2,386,208 1,150,161 3,536,369
Wellness and Health Education 64,638 6,374 71,012
Research and Product Development 365,466 701,374 1,066,840
Charitable Contributions 0 0
General Administration 1,319,470 1,744,813 3,064,283
Total Indirect Health Care Expenses
8,514,252 7,855,749 16,370,001
Taxes and Assessments Calendar Year 2010
MinnesotaCare Tax 825,991
Other Taxes and Assessments
Capital Costs Calendar Year 2010
2010 Incurred 2010 Payments
Capital Costs on Behalf of a Hospital or Clinic
Capital Acquisitions 388,240 388,240
Other Capital Costs 14,488 14,488
Total Capital Expenditures 402,728 402,728
Total Administrative Spending as percent of Total Carrier Spending1:
Commercial Administrative Spending as percent of Commercial Spending:
MN Public Programs Administrative Spending as percent of MN Public Programs Spending:
Medicare Administrative Spending as percent of Medicare Spending (includes Medicare Advantage, Part D, and Medicare Supplement):1Self-insured expenses are not required to be reported, but are encouraged. When reported, these amounts are included in Total Administrative and Total Carrier Spending; thus, the Total Administrative percentage may not fall within the range reported for the Commercial, MN Public Program, and Medicare categories.
Indirect Health Care Expenses (Medical and Dental)

2010 Administrative Spending: Principal Life Insurance Company
5.5%
7.8%
Not Applicable
Not Applicable
Calendar Year 2010
Indirect Expense Category Salaries and Benefits Other ExpenseTotal Indirect Health Care
Expense (by category)
Billing and Enrollment 121,958 52,268 174,226
Claim Processing 687,463 294,627 982,090
Detection and Prevention of Fraud 0 0
Customer Service 15,875 6,804 22,679
Product Management and Marketing 120,579 51,677 172,256
Underwriting 0 0
Regulatory Compliance and Government
14,534 6,229 20,763
Lobbying 0 0
Provider Relations and Contracting 45,210 19,376 64,586
Quality Assurance and Utilization Management
52,603 22,544 75,147
Wellness and Health Education 0 0
Research and Product Development 18,763 8,041 26,804
Charitable Contributions 0 0
General Administration 340,055 145,738 485,793
Total Indirect Health Care Expenses
1,417,040 607,304 2,024,344
Taxes and Assessments Calendar Year 2010
MinnesotaCare Tax 101,622
Other Taxes and Assessments 1,727,151
Capital Costs Calendar Year 2010
2010 Incurred 2010 Payments
Capital Costs on Behalf of a Hospital or Clinic
0 0
Capital Acquisitions 0 0
Other Capital Costs 0 0
Total Capital Expenditures
Total Administrative Spending as percent of Total Carrier Spending1:
Commercial Administrative Spending as percent of Commercial Spending:
MN Public Programs Administrative Spending as percent of MN Public Programs Spending:
Medicare Administrative Spending as percent of Medicare Spending (includes Medicare Advantage, Part D, and Medicare Supplement):1Self-insured expenses are not required to be reported, but are encouraged. When reported, these amounts are included in Total Administrative and Total Carrier Spending; thus, the Total Administrative percentage may not fall within the range reported for the Commercial, MN Public Program, and Medicare categories.
Indirect Health Care Expenses (Medical and Dental)

2010 Administrative Spending: Pyramid Life Insurance Company
10.8%
100.0%
Not Applicable
10.8%
Calendar Year 2010
Indirect Expense Category Salaries and Benefits Other ExpenseTotal Indirect Health Care
Expense (by category)
Billing and Enrollment 30,460 46,744 77,204
Claim Processing 33,423 51,290 84,713
Detection and Prevention of Fraud 18,477 28,355 46,832
Customer Service 32,095 49,252 81,347
Product Management and Marketing 110,463 169,514 279,977
Underwriting 0 0
Regulatory Compliance and Government
6,224 9,551 15,775
Lobbying 0 0
Provider Relations and Contracting 19,691 30,218 49,909
Quality Assurance and Utilization Management
13,888 21,312 35,200
Wellness and Health Education 7,996 12,271 20,267
Research and Product Development 7,101 10,897 17,998
Charitable Contributions 0 0
General Administration 176,166 270,340 446,506
Total Indirect Health Care Expenses
455,984 699,744 1,155,728
Taxes and Assessments Calendar Year 2010
MinnesotaCare Tax
Other Taxes and Assessments
Capital Costs Calendar Year 2010
2010 Incurred 2010 Payments
Capital Costs on Behalf of a Hospital or Clinic
Capital Acquisitions
Other Capital Costs
Total Capital Expenditures
Total Administrative Spending as percent of Total Carrier Spending1:
Commercial Administrative Spending as percent of Commercial Spending:
MN Public Programs Administrative Spending as percent of MN Public Programs Spending:
Medicare Administrative Spending as percent of Medicare Spending (includes Medicare Advantage, Part D, and Medicare Supplement):1Self-insured expenses are not required to be reported, but are encouraged. When reported, these amounts are included in Total Administrative and Total Carrier Spending; thus, the Total Administrative percentage may not fall within the range reported for the Commercial, MN Public Program, and Medicare categories.
Indirect Health Care Expenses (Medical and Dental)

2010 Administrative Spending: ReliaStar Life Insurance Company
12.2%
57.3%
Not Applicable
0.0%
Calendar Year 2010
Indirect Expense Category Salaries and Benefits Other ExpenseTotal Indirect Health Care
Expense (by category)
Billing and Enrollment 23,769 9,244 33,013
Claim Processing 52,300 16,024 68,324
Detection and Prevention of Fraud
Customer Service 5,526 1,943 7,469
Product Management and Marketing 285,127 107,203 392,330
Underwriting 57,174 13,135 70,309
Regulatory Compliance and Government
8,815 1,674 10,489
Lobbying
Provider Relations and Contracting 23,166 11,102 34,268
Quality Assurance and Utilization Management
79,186 88,519 167,705
Wellness and Health Education
Research and Product Development 8,416 1,176 9,592
Charitable Contributions
General Administration 528,324 657,503 1,185,827
Total Indirect Health Care Expenses
1,071,803 907,523 1,979,326
Taxes and Assessments Calendar Year 2010
MinnesotaCare Tax
Other Taxes and Assessments 565,082
Capital Costs Calendar Year 2010
2010 Incurred 2010 Payments
Capital Costs on Behalf of a Hospital or Clinic
Capital Acquisitions
Other Capital Costs
Total Capital Expenditures
Total Administrative Spending as percent of Total Carrier Spending1:
Commercial Administrative Spending as percent of Commercial Spending:
MN Public Programs Administrative Spending as percent of MN Public Programs Spending:
Medicare Administrative Spending as percent of Medicare Spending (includes Medicare Advantage, Part D, and Medicare Supplement):1Self-insured expenses are not required to be reported, but are encouraged. When reported, these amounts are included in Total Administrative and Total Carrier Spending; thus, the Total Administrative percentage may not fall within the range reported for the Commercial, MN Public Program, and Medicare categories.
Indirect Health Care Expenses (Medical and Dental)

2010 Administrative Spending: Security Life Insurance Company of America
17.4%
17.4%
Not Applicable
Not Applicable
Calendar Year 2010
Indirect Expense Category Salaries and Benefits Other ExpenseTotal Indirect Health Care
Expense (by category)
Billing and Enrollment
Claim Processing
Detection and Prevention of Fraud
Customer Service
Product Management and Marketing 58,632 76,364 134,996
Underwriting 38,373 49,977 88,350
Regulatory Compliance and Government
3,497 4,554 8,051
Lobbying
Provider Relations and Contracting
Quality Assurance and Utilization Management
4,827 6,287 11,114
Wellness and Health Education
Research and Product Development
Charitable Contributions
General Administration 145,968 190,112 336,080
Total Indirect Health Care Expenses
251,297 327,294 578,591
Taxes and Assessments Calendar Year 2010
MinnesotaCare Tax 118,958
Other Taxes and Assessments
Capital Costs Calendar Year 2010
2010 Incurred 2010 Payments
Capital Costs on Behalf of a Hospital or Clinic
Capital Acquisitions
Other Capital Costs
Total Capital Expenditures
Total Administrative Spending as percent of Total Carrier Spending1:
Commercial Administrative Spending as percent of Commercial Spending:
MN Public Programs Administrative Spending as percent of MN Public Programs Spending:
Medicare Administrative Spending as percent of Medicare Spending (includes Medicare Advantage, Part D, and Medicare Supplement):1Self-insured expenses are not required to be reported, but are encouraged. When reported, these amounts are included in Total Administrative and Total Carrier Spending; thus, the Total Administrative percentage may not fall within the range reported for the Commercial, MN Public Program, and Medicare categories.
Indirect Health Care Expenses (Medical and Dental)

2010 Administrative Spending: SilverScript Insurance Company
12.0%
Not Applicable
Not Applicable
12.0%
Calendar Year 2010
Indirect Expense Category Salaries and Benefits Other ExpenseTotal Indirect Health Care
Expense (by category)
Billing and Enrollment 3,603 3,603
Claim Processing
Detection and Prevention of Fraud
Customer Service 35,638 3,275 38,913
Product Management and Marketing
Underwriting
Regulatory Compliance and Government
Lobbying
Provider Relations and Contracting
Quality Assurance and Utilization Management
Wellness and Health Education
Research and Product Development
Charitable Contributions
General Administration 1,997,918 1,997,918
Total Indirect Health Care Expenses
35,638 2,004,796 2,040,434
Taxes and Assessments Calendar Year 2010
MinnesotaCare Tax
Other Taxes and Assessments 373
Capital Costs Calendar Year 2010
2010 Incurred 2010 Payments
Capital Costs on Behalf of a Hospital or Clinic
Capital Acquisitions
Other Capital Costs
Total Capital Expenditures
Total Administrative Spending as percent of Total Carrier Spending1:
Commercial Administrative Spending as percent of Commercial Spending:
MN Public Programs Administrative Spending as percent of MN Public Programs Spending:
Medicare Administrative Spending as percent of Medicare Spending (includes Medicare Advantage, Part D, and Medicare Supplement):1Self-insured expenses are not required to be reported, but are encouraged. When reported, these amounts are included in Total Administrative and Total Carrier Spending; thus, the Total Administrative percentage may not fall within the range reported for the Commercial, MN Public Program, and Medicare categories.
Indirect Health Care Expenses (Medical and Dental)

2010 Administrative Spending: South Country Health Alliance
9.1%
Not Applicable
9.1%
Not Applicable
Calendar Year 2010
Indirect Expense Category Salaries and Benefits Other ExpenseTotal Indirect Health Care
Expense (by category)
Billing and Enrollment 145,524 558,857 704,381
Claim Processing 8,651,380 8,651,380
Detection and Prevention of Fraud 189,382 18,774 208,156
Customer Service 300,891 350,794 651,685
Product Management and Marketing 641,471 45,014 686,485
Underwriting
Regulatory Compliance and Government
285,805 584,417 870,222
Lobbying 23,520 23,520
Provider Relations and Contracting 394,405 500,255 894,660
Quality Assurance and Utilization Management
1,124,099 387,621 1,511,720
Wellness and Health Education 59,721 232,683 292,404
Research and Product Development
Charitable Contributions
General Administration 1,454,433 2,582,877 4,037,310
Total Indirect Health Care Expenses
4,595,731 13,936,192 18,531,923
Taxes and Assessments Calendar Year 2010
MinnesotaCare Tax
Other Taxes and Assessments 21,500
Capital Costs Calendar Year 2010
2010 Incurred 2010 Payments
Capital Costs on Behalf of a Hospital or Clinic
Capital Acquisitions 24,706 24,706
Other Capital Costs
Total Capital Expenditures 24,706 24,706
Total Administrative Spending as percent of Total Carrier Spending1:
Commercial Administrative Spending as percent of Commercial Spending:
MN Public Programs Administrative Spending as percent of MN Public Programs Spending:
Medicare Administrative Spending as percent of Medicare Spending (includes Medicare Advantage, Part D, and Medicare Supplement):1Self-insured expenses are not required to be reported, but are encouraged. When reported, these amounts are included in Total Administrative and Total Carrier Spending; thus, the Total Administrative percentage may not fall within the range reported for the Commercial, MN Public Program, and Medicare categories.
Indirect Health Care Expenses (Medical and Dental)

2010 Administrative Spending: State Farm Mutual Automobile Insurance Company
10.7%
8.0%
Not Applicable
16.7%
Calendar Year 2010
Indirect Expense Category Salaries and Benefits Other ExpenseTotal Indirect Health Care
Expense (by category)
Billing and Enrollment 12,597 1,298 13,895
Claim Processing 367,965 654,159 1,022,124
Detection and Prevention of Fraud 19,367 34,429 53,796
Customer Service 3,674 3 3,677
Product Management and Marketing 6,613 1,054,930 1,061,543
Underwriting 735 331 1,066
Regulatory Compliance and Government
7,348 2,458 9,806
Lobbying 0 2,669 2,669
Provider Relations and Contracting 1,575 1 1,576
Quality Assurance and Utilization Management
3,674 1,129 4,803
Wellness and Health Education 525 0 525
Research and Product Development 5,249 1,130 6,379
Charitable Contributions 0 5 5
General Administration 10,497 6,345 16,842
Total Indirect Health Care Expenses
439,819 1,758,887 2,198,706
Taxes and Assessments Calendar Year 2010
MinnesotaCare Tax
Other Taxes and Assessments 836,649
Capital Costs Calendar Year 2010
2010 Incurred 2010 Payments
Capital Costs on Behalf of a Hospital or Clinic
Capital Acquisitions
Other Capital Costs
Total Capital Expenditures
Total Administrative Spending as percent of Total Carrier Spending1:
Commercial Administrative Spending as percent of Commercial Spending:
MN Public Programs Administrative Spending as percent of MN Public Programs Spending:
Medicare Administrative Spending as percent of Medicare Spending (includes Medicare Advantage, Part D, and Medicare Supplement):1Self-insured expenses are not required to be reported, but are encouraged. When reported, these amounts are included in Total Administrative and Total Carrier Spending; thus, the Total Administrative percentage may not fall within the range reported for the Commercial, MN Public Program, and Medicare categories.
Indirect Health Care Expenses (Medical and Dental)

2010 Administrative Spending: Sterling Life Insurance Company
16.8%
Not Applicable
Not Applicable
16.8%
Calendar Year 2010
Indirect Expense Category Salaries and Benefits Other ExpenseTotal Indirect Health Care
Expense (by category)
Billing and Enrollment 10,708 8,669 19,377
Claim Processing 14,290 20,618 34,908
Detection and Prevention of Fraud 0 53 53
Customer Service 13,061 585 13,646
Product Management and Marketing 66,697 115,855 182,552
Underwriting 0 0
Regulatory Compliance and Government
5,486 3,934 9,420
Lobbying 0 1,067 1,067
Provider Relations and Contracting 12,667 19,438 32,105
Quality Assurance and Utilization Management
4,659 2,804 7,463
Wellness and Health Education 0 8,266 8,266
Research and Product Development 3,714 467 4,181
Charitable Contributions 0 118 118
General Administration 85,815 176,093 261,908
Total Indirect Health Care Expenses
217,097 357,967 575,064
Taxes and Assessments Calendar Year 2010
MinnesotaCare Tax 0
Other Taxes and Assessments 6,441
Capital Costs Calendar Year 2010
2010 Incurred 2010 Payments
Capital Costs on Behalf of a Hospital or Clinic
0 0
Capital Acquisitions 0 0
Other Capital Costs 0 0
Total Capital Expenditures
Total Administrative Spending as percent of Total Carrier Spending1:
Commercial Administrative Spending as percent of Commercial Spending:
MN Public Programs Administrative Spending as percent of MN Public Programs Spending:
Medicare Administrative Spending as percent of Medicare Spending (includes Medicare Advantage, Part D, and Medicare Supplement):1Self-insured expenses are not required to be reported, but are encouraged. When reported, these amounts are included in Total Administrative and Total Carrier Spending; thus, the Total Administrative percentage may not fall within the range reported for the Commercial, MN Public Program, and Medicare categories.
Indirect Health Care Expenses (Medical and Dental)

2010 Administrative Spending: Sun Life Assurance Company of Canada
14.7%
Not Applicable
Not Applicable
Not Applicable
Calendar Year 2010
Indirect Expense Category Salaries and Benefits Other ExpenseTotal Indirect Health Care
Expense (by category)
Billing and Enrollment 12,894 679 13,573
Claim Processing 41,025 3,377 44,402
Detection and Prevention of Fraud
Customer Service 13,904 732 14,636
Product Management and Marketing 23,858 11,316 35,174
Underwriting 56,871 4,224 61,095
Regulatory Compliance and Government
7,604 400 8,004
Lobbying
Provider Relations and Contracting
Quality Assurance and Utilization Management
Wellness and Health Education
Research and Product Development 5,965 314 6,279
Charitable Contributions
General Administration 503,992 52,970 556,962
Total Indirect Health Care Expenses
666,113 74,012 740,125
Taxes and Assessments Calendar Year 2010
MinnesotaCare Tax
Other Taxes and Assessments
Capital Costs Calendar Year 2010
2010 Incurred 2010 Payments
Capital Costs on Behalf of a Hospital or Clinic
Capital Acquisitions
Other Capital Costs
Total Capital Expenditures
Total Administrative Spending as percent of Total Carrier Spending1:
Commercial Administrative Spending as percent of Commercial Spending:
MN Public Programs Administrative Spending as percent of MN Public Programs Spending:
Medicare Administrative Spending as percent of Medicare Spending (includes Medicare Advantage, Part D, and Medicare Supplement):1Self-insured expenses are not required to be reported, but are encouraged. When reported, these amounts are included in Total Administrative and Total Carrier Spending; thus, the Total Administrative percentage may not fall within the range reported for the Commercial, MN Public Program, and Medicare categories.
Indirect Health Care Expenses (Medical and Dental)

2010 Administrative Spending: Time Insurance Company
24.0%
24.0%
Not Applicable
Not Applicable
Calendar Year 2010
Indirect Expense Category Salaries and Benefits Other ExpenseTotal Indirect Health Care
Expense (by category)
Billing and Enrollment 83,223 138,120 221,343
Claim Processing 157,353 363,855 521,208
Detection and Prevention of Fraud 0 0
Customer Service 519,323 200,322 719,645
Product Management and Marketing 1,183,530 1,319,044 2,502,574
Underwriting 734,433 366,795 1,101,228
Regulatory Compliance and Government
189,804 366,088 555,892
Lobbying 0 0
Provider Relations and Contracting 0 277 277
Quality Assurance and Utilization Management
183,398 44,686 228,084
Wellness and Health Education 0 0
Research and Product Development 36,584 11,909 48,493
Charitable Contributions 0 2,727 2,727
General Administration 934,701 3,758,048 4,692,749
Total Indirect Health Care Expenses
4,022,349 6,571,871 10,594,220
Taxes and Assessments Calendar Year 2010
MinnesotaCare Tax 493
Other Taxes and Assessments 1,474,328
Capital Costs Calendar Year 2010
2010 Incurred 2010 Payments
Capital Costs on Behalf of a Hospital or Clinic
Capital Acquisitions
Other Capital Costs
Total Capital Expenditures
Total Administrative Spending as percent of Total Carrier Spending1:
Commercial Administrative Spending as percent of Commercial Spending:
MN Public Programs Administrative Spending as percent of MN Public Programs Spending:
Medicare Administrative Spending as percent of Medicare Spending (includes Medicare Advantage, Part D, and Medicare Supplement):1Self-insured expenses are not required to be reported, but are encouraged. When reported, these amounts are included in Total Administrative and Total Carrier Spending; thus, the Total Administrative percentage may not fall within the range reported for the Commercial, MN Public Program, and Medicare categories.
Indirect Health Care Expenses (Medical and Dental)

2010 Administrative Spending: UCare Minnesota
6.9%
Not Applicable
7.3%
6.4%
Calendar Year 2010
Indirect Expense Category Salaries and Benefits Other ExpenseTotal Indirect Health Care
Expense (by category)
Billing and Enrollment 1,420,767 2,405,681 3,826,448
Claim Processing 6,344,934 7,151,792 13,496,726
Detection and Prevention of Fraud 262,311 180,632 442,943
Customer Service 3,718,278 2,381,125 6,099,403
Product Management and Marketing 4,543,465 12,792,936 17,336,401
Underwriting 0 0
Regulatory Compliance and Government
1,695,781 798,630 2,494,411
Lobbying 87,456 185,975 273,431
Provider Relations and Contracting 3,692,293 12,165,414 15,857,707
Quality Assurance and Utilization Management
9,498,695 8,607,807 18,106,502
Wellness and Health Education 1,090,659 1,629,189 2,719,848
Research and Product Development 182,065 152,532 334,597
Charitable Contributions 0 16,937,568 16,937,568
General Administration 4,755,434 3,999,807 8,755,241
Total Indirect Health Care Expenses
37,292,138 69,389,088 106,681,226
Taxes and Assessments Calendar Year 2010
MinnesotaCare Tax 7,723,798
Other Taxes and Assessments 5,693,612
Capital Costs Calendar Year 2010
2010 Incurred 2010 Payments
Capital Costs on Behalf of a Hospital or Clinic
Capital Acquisitions 4,316,143 4,330,251
Other Capital Costs
Total Capital Expenditures 4,316,143 4,330,251
Total Administrative Spending as percent of Total Carrier Spending1:
Commercial Administrative Spending as percent of Commercial Spending:
MN Public Programs Administrative Spending as percent of MN Public Programs Spending:
Medicare Administrative Spending as percent of Medicare Spending (includes Medicare Advantage, Part D, and Medicare Supplement):1Self-insured expenses are not required to be reported, but are encouraged. When reported, these amounts are included in Total Administrative and Total Carrier Spending; thus, the Total Administrative percentage may not fall within the range reported for the Commercial, MN Public Program, and Medicare categories.
Indirect Health Care Expenses (Medical and Dental)

2010 Administrative Spending: UniCare Life & Health Insurance Company
16.2%
33.1%
Not Applicable
15.6%
Calendar Year 2010
Indirect Expense Category Salaries and Benefits Other ExpenseTotal Indirect Health Care
Expense (by category)
Billing and Enrollment 249,929 197,242 447,171
Claim Processing 842,000 760,856 1,602,856
Detection and Prevention of Fraud 10,762 11,339 22,101
Customer Service 295,726 294,740 590,466
Product Management and Marketing 790,167 1,229,971 2,020,138
Underwriting 25,669 14,989 40,658
Regulatory Compliance and Government
131,473 182,041 313,514
Lobbying 6,018 22,626 28,644
Provider Relations and Contracting 162,562 97,519 260,081
Quality Assurance and Utilization Management
303,117 241,392 544,509
Wellness and Health Education 34,257 89,477 123,734
Research and Product Development 17,944 27,932 45,876
Charitable Contributions 0 854 854
General Administration 200,334 210,222 410,556
Total Indirect Health Care Expenses
3,069,958 3,381,200 6,451,158
Taxes and Assessments Calendar Year 2010
MinnesotaCare Tax 0
Other Taxes and Assessments 108,472
Capital Costs Calendar Year 2010
2010 Incurred 2010 Payments
Capital Costs on Behalf of a Hospital or Clinic
0 0
Capital Acquisitions 0 0
Other Capital Costs 0 0
Total Capital Expenditures
Total Administrative Spending as percent of Total Carrier Spending1:
Commercial Administrative Spending as percent of Commercial Spending:
MN Public Programs Administrative Spending as percent of MN Public Programs Spending:
Medicare Administrative Spending as percent of Medicare Spending (includes Medicare Advantage, Part D, and Medicare Supplement):1Self-insured expenses are not required to be reported, but are encouraged. When reported, these amounts are included in Total Administrative and Total Carrier Spending; thus, the Total Administrative percentage may not fall within the range reported for the Commercial, MN Public Program, and Medicare categories.
Indirect Health Care Expenses (Medical and Dental)

2010 Administrative Spending: Union Security Insurance Company
18.1%
18.1%
Not Applicable
Not Applicable
Calendar Year 2010
Indirect Expense Category Salaries and Benefits Other ExpenseTotal Indirect Health Care
Expense (by category)
Billing and Enrollment 808 1,867 2,675
Claim Processing 186,733 202,811 389,544
Detection and Prevention of Fraud 0 1,540 1,540
Customer Service 273,921 51,279 325,200
Product Management and Marketing 426,179 1,482,466 1,908,645
Underwriting 81,455 38,220 119,675
Regulatory Compliance and Government
28,585 0 28,585
Lobbying 0 0
Provider Relations and Contracting 0 2 2
Quality Assurance and Utilization Management
605 182 787
Wellness and Health Education 0 0
Research and Product Development 22,173 14,453 36,626
Charitable Contributions 0 19 19
General Administration 131,536 104,584 236,120
Total Indirect Health Care Expenses
1,151,995 1,897,423 3,049,418
Taxes and Assessments Calendar Year 2010
MinnesotaCare Tax 0
Other Taxes and Assessments 416,273
Capital Costs Calendar Year 2010
2010 Incurred 2010 Payments
Capital Costs on Behalf of a Hospital or Clinic
Capital Acquisitions
Other Capital Costs
Total Capital Expenditures
Total Administrative Spending as percent of Total Carrier Spending1:
Commercial Administrative Spending as percent of Commercial Spending:
MN Public Programs Administrative Spending as percent of MN Public Programs Spending:
Medicare Administrative Spending as percent of Medicare Spending (includes Medicare Advantage, Part D, and Medicare Supplement):1Self-insured expenses are not required to be reported, but are encouraged. When reported, these amounts are included in Total Administrative and Total Carrier Spending; thus, the Total Administrative percentage may not fall within the range reported for the Commercial, MN Public Program, and Medicare categories.
Indirect Health Care Expenses (Medical and Dental)

2010 Administrative Spending: United World Life Insurance Company
22.7%
Not Applicable
Not Applicable
22.7%
Calendar Year 2010
Indirect Expense Category Salaries and Benefits Other ExpenseTotal Indirect Health Care
Expense (by category)
Billing and Enrollment 3,022 2,302 5,324
Claim Processing 72,606 145,699 218,305
Detection and Prevention of Fraud 2,397 319 2,716
Customer Service 38,846 8,603 47,449
Product Management and Marketing 198,990 1,208,544 1,407,534
Underwriting 18,983 12,367 31,350
Regulatory Compliance and Government
23,793 18,004 41,797
Lobbying
Provider Relations and Contracting
Quality Assurance and Utilization Management
Wellness and Health Education
Research and Product Development 14,632 4,921 19,553
Charitable Contributions
General Administration 58,117 23,900 82,017
Total Indirect Health Care Expenses
431,386 1,424,659 1,856,045
Taxes and Assessments Calendar Year 2010
MinnesotaCare Tax 245,365
Other Taxes and Assessments 197,446
Capital Costs Calendar Year 2010
2010 Incurred 2010 Payments
Capital Costs on Behalf of a Hospital or Clinic
Capital Acquisitions
Other Capital Costs
Total Capital Expenditures
Total Administrative Spending as percent of Total Carrier Spending1:
Commercial Administrative Spending as percent of Commercial Spending:
MN Public Programs Administrative Spending as percent of MN Public Programs Spending:
Medicare Administrative Spending as percent of Medicare Spending (includes Medicare Advantage, Part D, and Medicare Supplement):1Self-insured expenses are not required to be reported, but are encouraged. When reported, these amounts are included in Total Administrative and Total Carrier Spending; thus, the Total Administrative percentage may not fall within the range reported for the Commercial, MN Public Program, and Medicare categories.
Indirect Health Care Expenses (Medical and Dental)

2010 Administrative Spending: UnitedHealthcare Insurance Company
7.0%
22.6%
Not Applicable
18.6%
Calendar Year 2010
Indirect Expense Category Salaries and Benefits Other ExpenseTotal Indirect Health Care
Expense (by category)
Billing and Enrollment 0 2,374,388 2,374,388
Claim Processing 0 6,071,220 6,071,220
Detection and Prevention of Fraud 0 210,389 210,389
Customer Service 0 4,899,054 4,899,054
Product Management and Marketing 0 1,562,888 1,562,888
Underwriting 0 330,611 330,611
Regulatory Compliance and Government
0 120,222 120,222
Lobbying 0 0
Provider Relations and Contracting 0 3,907,221 3,907,221
Quality Assurance and Utilization Management
0 5,409,998 5,409,998
Wellness and Health Education 0 0
Research and Product Development 0 270,500 270,500
Charitable Contributions 0 30,056 30,056
General Administration 0 1,442,665 1,442,665
Total Indirect Health Care Expenses
26,629,212 26,629,212
Taxes and Assessments Calendar Year 2010
MinnesotaCare Tax 0
Other Taxes and Assessments
Capital Costs Calendar Year 2010
2010 Incurred 2010 Payments
Capital Costs on Behalf of a Hospital or Clinic
Capital Acquisitions
Other Capital Costs
Total Capital Expenditures
Total Administrative Spending as percent of Total Carrier Spending1:
Commercial Administrative Spending as percent of Commercial Spending:
MN Public Programs Administrative Spending as percent of MN Public Programs Spending:
Medicare Administrative Spending as percent of Medicare Spending (includes Medicare Advantage, Part D, and Medicare Supplement):1Self-insured expenses are not required to be reported, but are encouraged. When reported, these amounts are included in Total Administrative and Total Carrier Spending; thus, the Total Administrative percentage may not fall within the range reported for the Commercial, MN Public Program, and Medicare categories.
Indirect Health Care Expenses (Medical and Dental)

2010 Administrative Spending: WellCare Health Insurance of Illinois, Inc.
16.9%
Not Applicable
Not Applicable
16.9%
Calendar Year 2010
Indirect Expense Category Salaries and Benefits Other ExpenseTotal Indirect Health Care
Expense (by category)
Billing and Enrollment
Claim Processing
Detection and Prevention of Fraud
Customer Service
Product Management and Marketing
Underwriting
Regulatory Compliance and Government
Lobbying
Provider Relations and Contracting
Quality Assurance and Utilization Management
Wellness and Health Education
Research and Product Development
Charitable Contributions
General Administration 558,233 558,233
Total Indirect Health Care Expenses
558,233 558,233
Taxes and Assessments Calendar Year 2010
MinnesotaCare Tax
Other Taxes and Assessments
Capital Costs Calendar Year 2010
2010 Incurred 2010 Payments
Capital Costs on Behalf of a Hospital or Clinic
Capital Acquisitions
Other Capital Costs
Total Capital Expenditures
Total Administrative Spending as percent of Total Carrier Spending1:
Commercial Administrative Spending as percent of Commercial Spending:
MN Public Programs Administrative Spending as percent of MN Public Programs Spending:
Medicare Administrative Spending as percent of Medicare Spending (includes Medicare Advantage, Part D, and Medicare Supplement):1Self-insured expenses are not required to be reported, but are encouraged. When reported, these amounts are included in Total Administrative and Total Carrier Spending; thus, the Total Administrative percentage may not fall within the range reported for the Commercial, MN Public Program, and Medicare categories.
Indirect Health Care Expenses (Medical and Dental)

2010 Administrative Spending: World Insurance Company
10.5%
10.2%
Not Applicable
12.7%
Calendar Year 2010
Indirect Expense Category Salaries and Benefits Other ExpenseTotal Indirect Health Care
Expense (by category)
Billing and Enrollment 83,817 83,241 167,058
Claim Processing 107,185 106,449 213,634
Detection and Prevention of Fraud
Customer Service 28,262 6,509 34,771
Product Management and Marketing 32,506 3,856 36,362
Underwriting 17,378 45,685 63,063
Regulatory Compliance and Government
38,923 38,655 77,578
Lobbying
Provider Relations and Contracting
Quality Assurance and Utilization Management
Wellness and Health Education
Research and Product Development
Charitable Contributions 29 29 58
General Administration 66,460 87,562 154,022
Total Indirect Health Care Expenses
374,560 371,986 746,546
Taxes and Assessments Calendar Year 2010
MinnesotaCare Tax
Other Taxes and Assessments 134,919
Capital Costs Calendar Year 2010
2010 Incurred 2010 Payments
Capital Costs on Behalf of a Hospital or Clinic
Capital Acquisitions
Other Capital Costs
Total Capital Expenditures
Total Administrative Spending as percent of Total Carrier Spending1:
Commercial Administrative Spending as percent of Commercial Spending:
MN Public Programs Administrative Spending as percent of MN Public Programs Spending:
Medicare Administrative Spending as percent of Medicare Spending (includes Medicare Advantage, Part D, and Medicare Supplement):1Self-insured expenses are not required to be reported, but are encouraged. When reported, these amounts are included in Total Administrative and Total Carrier Spending; thus, the Total Administrative percentage may not fall within the range reported for the Commercial, MN Public Program, and Medicare categories.
Indirect Health Care Expenses (Medical and Dental)

Appendix A: Definitions
Definitions for the 2010 MDH Health Plan Financial & Statistical Report (HPFSR)
Billing and Enrollment Expenses
These are all costs associated with group and individual billing, member enrollment and premium collection and reconciliation functions. This may include costs for the collection and reconciliation of cash, group and membership set-up and maintenance, contract, identification card, and directory preparation and issuance, electronic data interchange expenses pertaining to billing and enrollment, and enrollment materials. Traditional expense categories that your company might allocate in whole or in part to billing and enrollment expenses include finance and information systems.
Claim Processing Expenses These are all costs associated with the adjudication and adjustment of claims, coordination of benefits processing, maintenance of the claim system, printing of claim forms, claim audit function, electronic data interchange expenses pertaining to claim processing, and fraud investigation. Traditional expense categories that your company might allocate in whole or in part to claims processing expenses include information systems and legal.
Customer Service Expenses These are all costs associated with individual, group, or provider support relating to membership, open enrollment, grievance resolution, claim problems, and specialized phone services and equipment. Traditional expense categories which your company might allocate in whole or in part to customer service expenses include information systems, finance, legal, and sales and marketing.
Detection and Prevention Of Fraud
These are all carrier costs relating to detection and prevention of fraud.

Product Management and Marketing Expenses
These are all costs associated with the management and marketing of current products. This may include costs relating to product promotion and advertising, sales, pricing, broker fees and commissions, internal commissions and commissions processing, marketing materials, account reporting, changes or additions to current products, and enrollee education regarding coverage. Traditional expense categories that your company might allocate in whole or in part to product management and marketing expenses include information systems, underwriting, legal, finance, actuarial, public relations, and network management.
Underwriting These are all carrier costs relating to underwriting.
Regulatory Compliance and Government Relations Expenses
These are all costs associated with federal and state reporting, rate filing, state and federal audits, tax accounting, lobbying, licensing and filing fees, and costs associated with the preparation and filing of all financial, utilization, statistical, and quality reports, and administration of government programs. Traditional expense categories that your company might allocate in whole or in part to regulatory compliance and government relations expenses include information systems, finance, actuarial, sales and marketing, underwriting, contract, legal, utilization management, quality assurance, and compliance.
Lobbying These are all carrier costs relating to lobbying.
Provider Relations and Contracting Expenses
These are all costs associated with contract negotiation and preparation, monitoring of provider compliance, field training with providers, provider communication materials and bulletins, and administration of provider capitations and settlements. Traditional expense categories that your company might allocate in whole or in part to provider relations and contracting expenses include finance, legal, accounting, actuarial, and information systems.

Quality Assurance and Utilization Management Expenses
These are all costs associated with quality assurance, practice protocol development, utilization review, peer review, credentialing, outcomes analysis related to existing products, nurse triage and other medical care evaluation activities. Traditional expense categories that your company might allocate in whole or in part to quality assurance and utilization management expenses include information systems and legal.
Wellness and Health Education Expenses
These are all costs associated with wellness and health promotion, disease prevention, member education and materials, provider education, and outreach services. Traditional expense categories that your company might allocate in whole or in part to wellness and health education expenses include marketing, medical services, and printing.
Research and Product Development Expenses
These are all costs associated with outcomes research, medical research programs, product design and development for products and programs not currently offered, major systems development, and integrated service network development. Traditional expense categories that your company might allocate in whole or in part to research and product development expenses include actuarial, information systems, marketing, finance, underwriting, and wellness programs.
Charitable Contributions Expenses
These are all costs related to contributions made for charitable purposes.
General Administration Expenses
These are all costs not outlined or allocated to the other categories. Traditional expense categories that your company might allocate in whole or in part to general administration expenses include human resources, facility maintenance, payroll, general accounting, finance, executive, internal audit, treasury, actuarial, finance, information systems, office management and occupancy costs, general office supplies and equipment, legal, board, outside consulting services, membership fees in trade organizations, public relations, and mail room. Taxes and assessments are not included in these costs.

Total Indirect Health Care Expenses
This grand total should be equal to the sum across columns (product categories) for the indirect expenses line in section 7.
Minnesotacare Tax Expenses
These are all payments paid to providers under Minnesota Statutes, section 295.582 and payments made as a provider under Minnesota Statutes, section 295.52, for the MinnesotaCare tax.
Other Taxes and Assessments Expenses
These are all payments or amounts payable to government agencies except for the MinnesotaCare tax under Minnesota Statutes, section 295.52 and Minnesota Statutes, section 295.582. This category does not include fees or fines paid to government agencies.
Capital Costs on Behalf of a Hospital or Clinic
These are all expenditures for capital that are incurred and/or paid on behalf of a hospital or clinic (or part of a partnership, joint venture, integration, or affiliation agreement). Report payments made during the calendar year (including lease payments) along with any costs incurred during the year.
Capital Acquisitions These are all expenditures for the acquisition of capital assets. Report payments made during the calendar year (including lease payments) along with any costs incurred during the year.
Other Capital Costs These are expenditures for other costs, such as legal or administrative costs, that are directly associated with the incurring of capital costs. Report payments made during the calendar year (including lease payments) along with any costs incurred during the year.
Total Capital Expenditures This is the total of all the payments or incurred capital expenditures listed.