
Minnesota Combined Heat and Power Policies and Potentialmn.gov/commerce-stat/pdfs/CHP pdfs...CHP is...
210
COMM-20130522-67922 | July 2014 Minnesota Combined Heat and Power Policies and Potential Conservation Applied Research & Development (CARD) FINAL REPORT Prepared for: Minnesota Department of Commerce Division of Energy Resources Prepared by: FVB Energy Inc.
Transcript of Minnesota Combined Heat and Power Policies and Potentialmn.gov/commerce-stat/pdfs/CHP pdfs...CHP is...
COMM-20130522-67922 | July 2014
Minnesota Combined Heat and Power Policies and Potential
Conservation Applied Research & Development (CARD) FINAL REPORT
Prepared for: Minnesota Department of Commerce Division of Energy Resources
Prepared by: FVB Energy Inc.
Prepared by:
Mark Spurr
FVB Energy Inc.
222 South Ninth Street
Minneapolis, MN 55402
Phone 612-607-4544
Email [email protected]
Website www.fvbenergy.com
Contract Number: 67922
Prepared for Minnesota Department of Commerce, Division of Energy Resources
Mike Rothman, Commissioner, Department of Commerce
Bill Grant, Deputy Commissioner, Department of Commerce, Division of Energy Resources
Adam Zoet, Project Manager
651-539-1798
ACKNOWLEDGEMENTS This project was supported in part (or in whole) by a grant from the Minnesota Department of
Commerce, Division of Energy Resources, through the Conservation Applied Research and
Development (CARD) program, which is funded by Minnesota ratepayers.
Special thanks to Anna Chittum, Neil Elliott, and Ethan Rogers of the American Council for an Energy-
Efficient Economy (ACEEE) for contributions on best practices in other states and review and
comment on early drafts. I also wish to acknowledge the contributions of Anne Sampson and James
Wang of ICF International (ICF), co-authors of a companion report “Assessment of the Technical and
Economic Potential for CHP in Minnesota,” which has helped inform the analysis and conclusions of
this report.
DISCLAIMER This report does not necessarily represent the view(s), opinion(s), or position(s) of the Minnesota
Department of Commerce (Commerce), its employees or the State of Minnesota (State). When
applicable, the State will evaluate the results of this research for inclusion in Conservation
Improvement Program (CIP) portfolios and communicate its recommendations in separate
document(s).
Commerce, the State, its employees, contractors, subcontractors, project participants, the
organizations listed herein, or any person on behalf of any of the organizations mentioned herein
make no warranty, express or implied, with respect to the use of any information, apparatus,
method, or process disclosed in this document. Furthermore, the aforementioned parties assume no
liability for the information in this report with respect to the use of, or damages resulting from the
use of, any information, apparatus, method, or process disclosed in this document; nor does any
party represent that the use of this information will not infringe upon privately owned rights.
iii | P a g e COMM-20130522-67922 | July 2014
Table of Contents
Preface .................................................................................................................................................. ix
Abbreviations ......................................................................................................................................... xi
Executive Summary .............................................................................................................................. xiii
Introduction ............................................................................................................................................ 1
Methodology ............................................................................................................................................. 1
Why CHP is Important .............................................................................................................................. 2
Overview of CHP Technologies ................................................................................................................ 5
Basic Statistics ...................................................................................................................................... 13
CHP Potential......................................................................................................................................... 14
Key Challenges .................................................................................................................................... 15
Unfavorable Spark Spread ................................................................................................................... 15
Lack of Market for Excess Power ......................................................................................................... 17
Cost of Capital and Internal Investment Priorities .............................................................................. 18
Economic Uncertainty ........................................................................................................................... 21
Lack of a Utility Value Proposition ........................................................................................................ 22
Challenging Interconnection Standards .............................................................................................. 23
Unfavorable Standby Rates .................................................................................................................. 23
Lack of Recognition of Resiliency Benefits ......................................................................................... 24
Lack of Recognition of Other Grid Benefits ......................................................................................... 25
Lack of Expertise ................................................................................................................................... 25
Natural Gas Pipeline Capacity .............................................................................................................. 26
Environmental Permitting ..................................................................................................................... 26
Current Minnesota Policies and Programs .......................................................................................... 27
Energy and GHG Goals.......................................................................................................................... 27
Portfolio Standards ............................................................................................................................... 29
Integrated Resource Planning .............................................................................................................. 34
Cost Allocation for Cogeneration Plants .............................................................................................. 34
Interconnection Standards ................................................................................................................... 35
Standby Rates ....................................................................................................................................... 35
Net Metering .......................................................................................................................................... 38
Incentives and Financing Assistance ................................................................................................... 39

iv | P a g e COMM-20130522-67922 | July 2014
Development of Policy Options ........................................................................................................... 41
Comparative Economic Significance of Major Barriers ...................................................................... 41
Implications for Policy Options ............................................................................................................. 48
Federal Policy Context .......................................................................................................................... 52
Straw Man Report and Stakeholder Consultation .............................................................................. 57
Policy Options ........................................................................................................................................ 58
Policy Analysis ..................................................................................................................................... 65
Separate Tier ......................................................................................................................................... 65
Demand Side or Supply Side ................................................................................................................ 65
Crediting Mechanisms .......................................................................................................................... 69
Incentive Levels ..................................................................................................................................... 70
Potential Impacts .................................................................................................................................. 70
Conclusions ........................................................................................................................................... 75
Recommendations .............................................................................................................................. 79
Near-term Steps .................................................................................................................................... 79
Minnesota Combined Heat and Power Policy Act ............................................................................... 79
Implementation and Rulemaking ......................................................................................................... 86
Appendix A: Best Practices in Other States ......................................................................................... 87
Portfolio Standards ............................................................................................................................... 87
Interconnection rules ............................................................................................................................ 90
CHP-friendly stand-by rates .................................................................................................................. 91
Utility Programs, Policies, and Planning .............................................................................................. 92
CHP financial incentives ....................................................................................................................... 94
Net metering regulations ...................................................................................................................... 96
Output-based air emission rules .......................................................................................................... 97
Critical Facilities Rules .......................................................................................................................... 97
Emerging Opportunities ........................................................................................................................ 98
Appendix B: Federal Policy Context ................................................................................................... 101
Existing policies and programs .......................................................................................................... 101
Proposed Legislation, Policies and Regulations ............................................................................... 109
Appendix C: Straw Man Options for Minnesota CHP Policy ............................................................... 115
Appendix D: Results of Stakeholder Consultation ............................................................................. 159
Electric Utilities .................................................................................................................................... 159
Gas utilities .......................................................................................................................................... 160
Thermal Utilities .................................................................................................................................. 161
v | P a g e COMM-20130522-67922 | July 2014
Equipment Suppliers ........................................................................................................................... 162
Customers ........................................................................................................................................... 162
Advocacy Groups ................................................................................................................................. 162
Consultants ......................................................................................................................................... 163
Appendix E: Methodology .................................................................................................................. 165
Overview .............................................................................................................................................. 165
CHP Crediting Mechanisms ................................................................................................................ 166
Cost-Benefit Tests ............................................................................................................................... 169
Avoided Costs of Power Generation ................................................................................................... 171
References ........................................................................................................................................ 175
Tables
Table 1. Overview of CHP Technologies Analyzed.....................................................................................xv
Table 2. Technical Potential (Natural Gas CHP) .......................................................................................xv
Table 3. Overview of Policy Options ......................................................................................................... xvii
Table 4. Overview of Advantages and Disadvantages of CIP and APS as Major CHP Policy Vehicles . xxi
Table 5. Recommended Efficiency Standards and Crediting Tiers for Non-Renewable CHP ............ xxiv
Table 6. Recommended Efficiency Standards and Crediting Tiers for Renewable CHP ...................... xxv
Table 7. Selected CHP Technologies for Analysis ................................................................................... 11
Table 8. CHP Technology Efficiencies ...................................................................................................... 12
Table 9. Existing Minnesota CHP Applications ....................................................................................... 13
Table 10. Minnesota CHP Technical Potential by Electric Utility .......................................................... 14
Table 11. Minnesota CHP Technical Potential by Sector ...................................................................... 14
Table 12. Minnesota Natural Gas and Electricity Prices Compared with U.S. Average Prices (2011)16
Table 13. ACEEE Scoring of Minnesota CHP Policies ............................................................................ 27
Table 14. Total Electric CIP Savings and Expenditures by Year, 2006-2011 ....................................... 33
Table 15. Total Natural Gas CIP Savings and Expenditures by Year, 2006-2011 ............................... 33
Table 16. Electric Utility Savings as percent in 2010 and 2011 ........................................................... 34
Table 17. Natural Gas Utility Savings as percent in 2010 and 2011 ................................................... 34
vi | P a g e COMM-20130522-67922 | July 2014
Table 18. Avoided Rates of Minnesota IOUs .......................................................................................... 37
Table 19. Economic Potential of CHP in IOU Service Territories with Current and Assumed 100
Percent Avoided Rates.............................................................................................................................. 37
Table 20. Basic Elements in CHP Financial Viability Equation............................................................... 42
Table 21. Base Case Fuel and Electricity Price Assumptions ................................................................ 43
Table 22. Economic Characteristics of CHP Technologies ..................................................................... 43
Table 23. Key to CHP Technology Abbreviations ................................................................................... 45
Table 24. Sensitivity Annual Percentage Cost Savings to Weighted Average Cost of Capital (Capacity
Factor 0.80 and Base Case Fuel and Electricity Prices, WACC Ranging from 50.0 percent to 4.0
percent ....................................................................................................................................................... 46
Table 25. Sensitivity to Fuel Price (Capacity Factor 0.80, WACC 15.8 percent and Base Case
Electricity Prices) ....................................................................................................................................... 47
Table 26. Sensitivity to Electricity Price (Capacity Factor 0.80, WACC 15.8 percent and Base Case
Fuel Prices) ................................................................................................................................................ 47
Table 27. Sensitivity to Capacity Factor (WACC 15.8 percent and Base Case Fuel and Electricity
Prices) ........................................................................................................................................................ 48
Table 28. Overview of Policy Options ....................................................................................................... 59
Table 29. Policy Option 1.1 -- Capital Incentive Based on Thermal Energy Production Capacity (% of
total capital cost) ...................................................................................................................................... 62
Table 30. Policy Option 2.1 -- Capital Incentive Based on Electricity Production Capacity (% of total
capital cost) ............................................................................................................................................... 63
Table 31. Simplified Approach to Crediting Natural Gas CHP Electricity Production .......................... 69
Table 32. Cumulative Impact of Potential CIP CHP Goals ..................................................................... 72
Table 33. Detailed Calculation of Potential CIP CHP Goals ................................................................... 73
Table 34. Cumulative Impact of Potential APS .............................................Goals ................................ 74
Table 35. Summary of Cost-Benefit Test Results for Selected CHP Project Types (Both Participants
and Society Cost Tests are Positive) ........................................................................................................ 75
Table 36. Overview of Advantages and Disadvantages of CIP and APS as Major CHP Policy Vehicles
................................................................................................................................................................... 77
Table 37. Recommended Efficiency Standards and Crediting Tiers for Non-Renewable CHP ........... 81
Table 38. Recommended Efficiency Standards and Crediting Tiers for Renewable CHP .................... 81
vii | P a g e COMM-20130522-67922 | July 2014
Table 39. Parameters for CHP Crediting Calculations ......................................................................... 166
Table 40. Formulas for CHP Crediting Methods .................................................................................. 166
Table 41. NRDC/OEC Tiers ..................................................................................................................... 167
Table 42. Conversion of NRDC/OEC Tiers to Higher Heating Value .................................................... 167
Table 43. Simplified Approach to Crediting CHP Electricity Production ............................................. 169
Table 44. Elements for Cost-Benefit Tests with Customer-Owned CHP ............................................. 170
Table 45. Elements for Cost-Benefit Tests with Utility-Owned CHP .................................................... 170
Table 46. Parameter Values for Cost-Benefit .............................................Tests ................................ 171
Table 47. Avoided Costs Provided by Xcel and Minnesota Power ....................................................... 172
Table 48. Xcel Generation Capital Cost for Proxy Combustion Turbine Plant Source: Xcel Response to
Information Request 2012 ..................................................................................................................... 172
Table 49. Assumed Characteristics of Offset Grid Electricity .............................................................. 174
Figures
Figure 1. Summary of Estimated 2030 CHP Market Penetration with Policy Options ........................ xviii
Figure 2. Minnesota Energy Supply and Use.............................................................................................. 3
Figure 3. Minnesota Non-Transportation Energy Consumption 2012 (total 1.227 Trillion Btu) ............ 4
Figure 4. Comparative Efficiency of CHP and Power-Only Plants.............................................................. 5
Figure 5. Topping Cycle CHP ....................................................................................................................... 6
Figure 6. Bottoming Cycle CHP ................................................................................................................... 7
Figure 7. Combustion Turbine CHP ............................................................................................................. 8
Figure 8. Internal Combustion Engine CHP ................................................................................................ 8
Figure 9. Organic Rankine Cycle Process ................................................................................................ 10
Figure 10. Average Retail Electricity Rates by State ............................................................................... 16
Figure 11. Relationship Between Weighted Average Cost of Capital (WACC) and Simple Payback (SP)
................................................................................................................................................................... 19
Figure 12. Municipal General Obligation Bond Yields By Bond Rating and Term (July 29, 2014) ...... 20
viii | P a g e COMM-20130522-67922 | July 2014
Figure 13. Results of Market Survey on Acceptable CHP Payback Periods ......................................... 21
Figure 14. 50-State Comparison of Per Capita Energy Use ................................................................... 28
Figure 15. Spark Spreads (Base Case Fuel and Electricity Prices)....................................................... 44
Figure 16. Proposed State Goals for Carbon Dioxide Emissions Reduction by 2030, Clean Power
Plan ............................................................................................................................................................ 55
Figure 17. Comparison of Carbon Dioxide Emissions From Power-Only and CHP Plants ................... 56
Figure 18. Net Change in Customer Natural Gas Use as Percent of Offset Boiler Fuel Use ............... 66
Figure 19. Net Change in Customer and Electric Utility Natural Gas Use as Percent of Offset Boiler
Fuel Use ..................................................................................................................................................... 67
Figure 20. Projected 2030 CHP Market Penetration Without New Policies Under 3 Acceptance Curves
................................................................................................................................................................... 71
Figure 21. Summary of Estimated 2030 CHP Market Penetration with Policy Options ...................... 72
Figure 22. States with Portfolio Standards and how CHP qualifies (under RPS or APS) ...................... 88
Figure 23. Proposed State Goals for Carbon Dioxide Emissions Reduction by 2030, Clean Power
Plan .......................................................................................................................................................... 112
Figure 24. Comparison of Carbon Dioxide Emissions From Power-Only and CHP Plants ................. 113
Figure 25. Credited CHP Power Generation as a Percentage of Total CHP Power Generation for 12
Technologies Under 4 Calculation Methods ......................................................................................... 168

ix | P a g e COMM-20130522-67922 | July 2014
Preface
This study was funded by the Conservation and Applied Research & Development (CARD) program of
the Minnesota Department of Commerce to assess alternative approaches to potential changes in
Minnesota policies and programs to increase implementation of combined heat and power (CHP).
This report incorporates key results from a related CARD-funded study (Assessment of the Technical
and Economic Potential for CHP in Minnesota, FVB Energy and ICF International, July 2014) to help
inform recommendations for potential goals for CHP growth. The recommendations in this report are
those of FVB Energy.
The report is organized as follows.
Introduction summarizes the methodology used in this study, provides an overview of why
CHP is important, describes CHP technologies, quantifies the current implementation of CHP
in Minnesota and provides an overview of the technical potential for CHP growth.
Key Barriers describes and analyzes the challenges which constrain CHP growth.
Current Minnesota Policies and Programs describes existing Minnesota laws, policies and
programs relevant to CHP.
Development of Policy Options provides an analysis of the economic significance of key
barriers, briefly notes major findings from research on best practices for CHP policy in other
states, briefly notes major findings from research on federal policies relevant to CHP and
describes potential Policy Options that were introduced in draft form in a “Straw Man” report
that was the basis for informal stakeholder feedback.
Policy Analysis analyzes program design issues in light of stakeholder input, summarizes the
estimated impact of Policy Options on implementation of CHP, calculates the impact of Policy
Options on Participants and Society for example CHP projects, and draws conclusions
regarding the suitability of the policy options for Minnesota.
Recommendations describes FVB’s recommendations for Minnesota CHP policies.
Appendices provide additional detailed information as follows.
Appendix A describes best practices in other states relative to CHP policies and programs.
Appendix B describes existing and proposed federal policies and programs relevant to CHP.
Appendix C is a draft report (“Straw Man Options for Minnesota CHP Policies”) which was
used to elicit informal stakeholder feedback.
Appendix D summarizes the comments received during informal stakeholder consultations
conducted by FVB, including electric utilities, gas utilities, thermal utilities, equipment
suppliers, customers, advocacy groups and consultants.
Appendix E describes key elements in the analysis methodology, focusing on aspects of the
methodology that are not described in the body of the report or which are only briefly
mentioned.
References used in the development of this report are listed at the conclusion of the report. These
references are noted throughout the report in parentheses in the body of the report or after figure or
table captions. Footnotes are used only where additional explanation was deemed appropriate.

x | P a g e COMM-20130522-67922 | July 2014
This page intentionally left blank.

xi | P a g e COMM-20130522-67922 | July 2014
AEO -- Annual Energy Outlook
Btu -- British thermal unit
NGCC – natural gas combined cycle
CHP – combined heat and power
CIP – Conservation Improvement Program
CO2 -- carbon dioxide
DE – district energy
DHC – district heating and cooling
DOE -- U.S. Department of Energy
DSM -- demand-side management
EERS – Energy Efficiency Portfolio Standard
EIA – U.S. Energy Information Administration
EPA -- U.S. Environmental Protection Agency
GHG -- greenhouse gas
HP – high pressure
IOU -- investor-owned utility
IRP -- integrated resource planning
kW -- kiloWatt
kWh -- kiloWatt-hour
LP – low pressure
MMBtu -- million Btu
MMBtu/hr – million Btu per hour
MPUC – Minnesota Public Utility Commission
MW -- MegaWatt
MWh -- MegaWatt-hour
Abbreviations
xii | P a g e COMM-20130522-67922 | July 2014
NG – natural gas
PCT -- participant cost test
ROE -- return on equity
RPS -- renewable portfolio standard
SCT -- societal cost test
T&D -- transmission and distribution
UCT – utility cost test
WACC -- weighted average cost of capital
xiii | P a g e COMM-20130522-67922 | July 2014
Executive Summary
This study was funded by the Conservation and Applied Research & Development (CARD) program of
the Minnesota Department of Commerce to assess alternative approaches to potential changes in
Minnesota policies and programs to increase implementation of combined heat and power (CHP).
This report incorporates key results from a related CARD-funded study (FVB Energy and ICF
International, Assessment of the Technical and Economic Potential for CHP in Minnesota) to help
inform recommendations for potential goals for CHP growth. The recommendations in this report are
those of the author.
Methodology
This study began with research on current Minnesota laws, policies and programs relevant to CHP. A
review of literature on CHP barriers and policies was then undertaken, including an analysis of best
practices for CHP policies in other states. Existing and proposed federal policies relevant to CHP
were identified. The economics of a broad range of CHP technologies were analyzed, including
sensitivity to key variables that could be affected by new policies and programs, including capital
cost, weighted average cost of capital1, CHP fuel price and avoided price of electricity.
Draft Policy Options for increasing CHP in Minnesota were developed based on the analysis of the
economic significance of key barriers as well as review of best practices in other states. A “Straw
Man” draft report was prepared. Informal stakeholder consultations were conducted by FVB
following distribution of the Straw Man report.
Following the stakeholder consultations, detailed analysis of the Policy Options was undertaken and
modifications were made to the Policy Options based on the feedback and analysis. The impact of
each Policy Option on CHP implementation was projected.
Recommendations were then developed for consideration by the Department of Commerce and
stakeholders in stakeholder workshops to be implemented in fall of 2014.
Why CHP is Important
Of the total 1,706 trillion Btu (TBtu) of energy used in Minnesota in 2012, 350 TBtu was lost in
electricity generation, transmission and distribution, resulting in an average power sector efficiency
of less than 33 percent. Power generation waste heat in Minnesota is equal to 83 percent of the
total requirement for heat energy in buildings and industry.
CHP systems reduce fossil fuel use and greenhouse gas (GHG) emissions by recovering heat that is
usually wasted as rejected heat in power plants. This heat can then be used for heating (space
heating in buildings, domestic hot water or industrial process heat) or it can be used to produce
1 Weighted Average Cost of Capital (WACC) is the weighted average cost of repaying the capital invested or
borrowed to build a CHP project. There are two main ways to fund a project: 1) equity investment, in which a
company invests its own funds and then requires a return on that equity investment through payments made
throughout the life of the project from the project revenues; and 2) debt, in which funds are borrowed and
principal and interest payments are made each year based on the debt interest rate. WACC is calculated
based on the relative portions of debt and equity. For example, if the funds raised are 60 percent debt and 40
percent equity, the debt interest rate is 6 percent and the return on equity is 12 percent, the WACC is
calculated as follows: (60% X 6%) + (40% X 12%) = 8.4%.
xiv | P a g e COMM-20130522-67922 | July 2014
chiller water for air conditioning or industrial cooling energy by using absorption chillers or steam
turbine chillers.
The reductions in fossil fuel use made possible by CHP reduce emissions of air pollutants and GHG,
and increase energy security and sustainability by reducing dependence on fossil fuels. Further,
reduced consumption of fossil fuels can result in fewer energy dollars leaving the state, potentially
strengthening the Minnesota economy.
CHP can help Minnesota achieve goals relative to per capita energy consumption, GHG reduction
and renewable energy. Federal environmental regulations, including GHG standards for existing and
new power plants, and potentially regional haze regulatory action, are likely to enhance the
economics of CHP by increasing the economic value of fossil fuel and GHG reductions.
CHP also has the potential to enhance grid resiliency, reduce power line losses and strengthen peak
power demand management. CHP systems are typically located much closer to the end user than
more traditional centralized power plants; close proximity to end-users can reduce the losses of
power along transmission and distribution lines. Additionally, many CHP systems are capable of
ramping up to full output very quickly, and are more nimble electric system assets than many
traditional generation resources.
CHP Barriers
CHP faces a range of economic, regulatory and institutional challenges:
Relatively low electricity prices in Minnesota make CHP economic viability more challenging
in comparison with other states.
Most potential industrial or commercial entities require a very short payback on efficiency
investments including CHP.
Most industrial and commercial entities do not have the experience, skills and time for the
difficult task of developing a CHP project.
Decades of energy supply and price volatility inhibits CHP investment.
There is no market value established for the GHG, power grid resiliency or other benefits of
CHP.
Historically, CHP projects have been discouraged by unfavorable interconnection
requirements and standby rates.
Technical Potential
CHP is best applied at facilities that have significant and concurrent electric and thermal demands.
In the industrial sector, CHP thermal output has traditionally been in the form of steam used for
process heating and for space heating. For commercial and institutional users, thermal output has
traditionally been steam or hot water for space heating and potable hot water heating. More recently,
CHP has included the provision of space cooling through the use of absorption chillers or steam
turbine chillers.
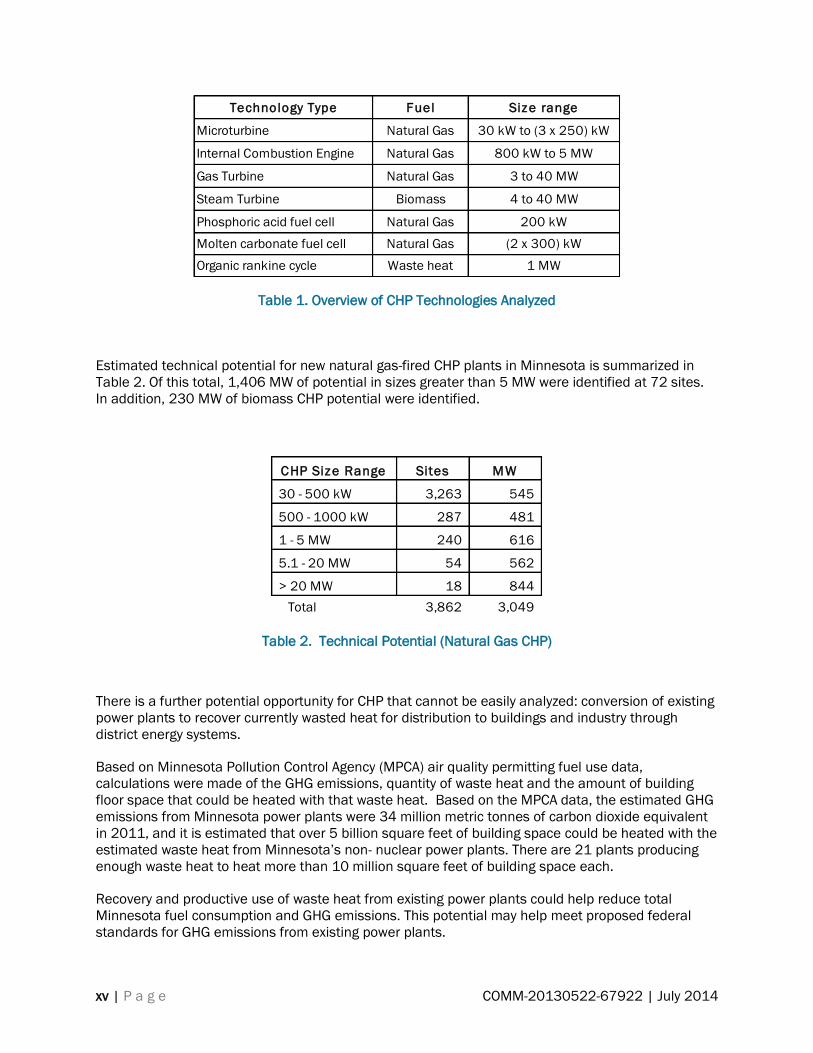
A wide range of CHP technology types and sizes were evaluated, as summarized in Table 1.
xv | P a g e COMM-20130522-67922 | July 2014
Table 1. Overview of CHP Technologies Analyzed
Estimated technical potential for new natural gas-fired CHP plants in Minnesota is summarized in
Table 2. Of this total, 1,406 MW of potential in sizes greater than 5 MW were identified at 72 sites.
In addition, 230 MW of biomass CHP potential were identified.
Table 2. Technical Potential (Natural Gas CHP)
There is a further potential opportunity for CHP that cannot be easily analyzed: conversion of existing
power plants to recover currently wasted heat for distribution to buildings and industry through
district energy systems.
Based on Minnesota Pollution Control Agency (MPCA) air quality permitting fuel use data,
calculations were made of the GHG emissions, quantity of waste heat and the amount of building
floor space that could be heated with that waste heat. Based on the MPCA data, the estimated GHG
emissions from Minnesota power plants were 34 million metric tonnes of carbon dioxide equivalent
in 2011, and it is estimated that over 5 billion square feet of building space could be heated with the
estimated waste heat from Minnesota’s non- nuclear power plants. There are 21 plants producing
enough waste heat to heat more than 10 million square feet of building space each.
Recovery and productive use of waste heat from existing power plants could help reduce total
Minnesota fuel consumption and GHG emissions. This potential may help meet proposed federal
standards for GHG emissions from existing power plants.
Technology Type Fuel Size range
Microturbine Natural Gas 30 kW to (3 x 250) kW
Internal Combustion Engine Natural Gas 800 kW to 5 MW
Gas Turbine Natural Gas 3 to 40 MW
Steam Turbine Biomass 4 to 40 MW
Phosphoric acid fuel cell Natural Gas 200 kW
Molten carbonate fuel cell Natural Gas (2 x 300) kW
Organic rankine cycle Waste heat 1 MW
CHP Size Range Sites MW
30 - 500 kW 3,263 545
500 - 1000 kW 287 481
1 - 5 MW 240 616
5.1 - 20 MW 54 562
> 20 MW 18 844
Total 3,862 3,049
xvi | P a g e COMM-20130522-67922 | July 2014
Business as Usual
There are currently 961.5 MegaWatts (MW) of CHP at 52 sites in Minnesota. Of this total, 83 percent
resides in large systems with capacities greater than 20 MW.
Of the 3,049 MW of existing CHP/WHP technical potential in Minnesota, 984 MW has economic
potential with a payback of less than 10 years. The 984 MW of economic potential is located mostly
in the high load factor markets in Xcel and Minnesota Power territories, with smaller amounts
present in Alliant and municipal/cooperative territory. Generally, calculated payback is shorter for
larger customers, stemming from lower CHP system costs as a result of economies of scale, better
CHP system performance characteristics, and lower natural gas prices typically characterizing larger
customers.
The 984 MW of CHP economic potential with a payback of less than 10 years was then pared down
to CHP market penetration. Additional CHP of about 210 MW and 250 MW are projected to be
implemented by 2030 and 2040, respectively, without new policies (“Business As Usual” or “Base
Case”). In addition, a Base Case market penetration of 50 MW is estimated for Waste Heat to Power.
This capacity is almost all in Xcel service territory with some in Minnesota Power and Alliant territory.
Policy Options
Table 3 provides an overview of the Policy Options analyzed in this study. The options are
summarized as follows:
Policy Option groups 1 and 2 are based on natural gas and electric utility Conservation
Improvement Program (CIP) incentives targeted at end-users. Specific Policy Options were
modeled with either capital incentives, operating incentives, or a combination of both capital
and operating incentives.
Policy Option group 3 was based on CIP operating incentives for customer- or third party-
owned CHP as well as significant utility ownership of CHP where the utility would receive an
operating incentive, with the utility using its low weighted average cost of capital (WACC) to
fund CHP systems.
In Policy Option 4 it is assumed that a specific carve-out2 is made for bioenergy CHP3 in
either the existing Renewable Portfolio Standard (RPS) or an expanded RPS.
2 Under Minnesota’s Renewable Portfolio Standard (RPS), Xcel Energy is required to generate or procure 31.5
percent of its electricity from renewable resources by 2020, and all other utilities are required to generate or
procure 26.5 percent of their electricity from renewable resources by 2025. CHP fueled with biomass, landfill
gas or other bioenergy is an eligible technology, Most of the RPS requirement must be met with specific “carve-
outs” for wind and solar. Of the 31.5 percent renewables required of Xcel Energy in 2020, 1.5 percent must be
met with solar PV (10 percent of which must be met with systems of 20 kW or less) , at least 25 percent must
be generated by wind-energy or solar energy systems, with solar limited to no more than 1 percent of the
requirement. In effect, this means that the wind standard is at least 24 percent, 1.5 percent must be met with
solar, and solar may contribute up to another 1 percent, and the "remaining" 5 percent may be generated
using other eligible technologies.
3 Bioenergy is an inclusive term that encompasses: 1) biomass combustion CHP (in which wood or other
biomass is combusted to produce steam that is used to spin a steam turbine-generator or to vaporize an
organic chemical such as isopentane for organic rankine cycle turbine-generation; 2) internal combustion
engine or combustion turbine CHP using gaseous or liquid fuel produced from biomass such as manure,
agricultural residues, sewage sludge, etc.

xvii | P a g e COMM-20130522-67922 | July 2014
Policy Option group 5 addresses the potential to create a new Alternative Portfolio Standard
(APS), which would require electric utilities to obtain a specified percentage of sales from
CHP (regardless of fuel) by a given year.
Table 3. Overview of Policy Options
Economic Potential with New Policies
Estimated 2030 CHP market penetration under the Base Case (Business as Usual) and with the
Policy Options is summarized in Figure 1. The following discussion summarizes the results of market
penetration estimates and the cost-effectiveness analysis of the Policy Options using two cost-
benefit tests: participant cost test (PCT) and the societal cost test (SCT).
Conservation Improvement Program
Renewable
Portfolio
Standard
Alternative
Portfolio
Standard
CHP requirements in
separate new CIP tier (% of
sales each year)
Bioenergy CHP
requirement (% of
sales by 2030)
CHP requirement
(% of sales by
2030)
Policy Option SummaryOption
#
Natural
Gas
Electric
IOUs
Electric
Munis &
Coops
Electric
IOUs
Electric
Munis &
Coops
Electric
IOUs
Electric
Munis &
Coops
1.1Capital Incentive ($100 per
1000 Btu/hr)N/A 0.10% N/A N/A N/A N/A N/A N/A
1.2Operating Gas Rate Discount
($0.75/MMBtu, 15 yrs)N/A 0.10% N/A N/A N/A N/A N/A N/A
1.3Capital and Operating Incentives
in Options 1.1 and 1.2N/A 0.15% N/A N/A N/A N/A N/A N/A
2.1 Capital Incentive ($500 per kW) N/A N/A 0.20% 0.08% N/A N/A N/A N/A
2.2Operating Electric Rate Discount
($10 per MWh, 15 yrs)N/A N/A 0.20% 0.08% N/A N/A N/A N/A
2.3Capital and Operating Incentives
in Options 2.1 and 2.2N/A N/A 0.30% 0.12% N/A N/A N/A N/A
Gas Utility with Customer
Incentives Plus CIP Credit for
Utility Owned CHP
3.1 Same as Option 1.2$0.75 per MMBtu gas
supplied to CHP, 15 yrs0.23% N/A N/A N/A N/A N/A N/A
Electric Utility with Customer
Incentives Plus CIP Credit for
Utility Owned CHP
3.2 Same as Option 2.2$10 per MWh of CHP
electricity produced, 15 yrsN/A 0.45% 0.18% N/A N/A N/A N/A
RPS carve-out for bioenergy CHP
in existing or expanded RPS4 N/A N/A N/A N/A N/A 1.50% 0.60% N/A N/A
5.1 N/A N/A N/A N/A N/A N/A N/A 8.00% 3.20%
5.2 N/A N/A N/A N/A N/A N/A N/A 12.00% 4.80%
Notes:
CIP = Conservation Improvement Program MWh =MegaWatt-hour
IOU = Investor-Owned Utility kW = kiloWatts
Muni = Municipal Utility RPS = Renewable Portfolio Standard
Coop = Cooperative APS = Alternative Portfolio Standard
MMBtu = milion British Thermal Units IRP = Integrated Resource Planning
CIP Incentives for Customer-
or Third Party-Owned CHP
CIP Credit to Util ities
for Util ity-Implemented
CHP
Gas Utility CIP with Incentives for
Customer- or Third Party-
Implemented CHP
Electric Utility CIP with Incentives
for Customer- or Third Party-
Implemented CHP
New Alternative Portfolio
Standard for CHP

xviii | P a g e COMM-20130522-67922 | July 2014
Figure 1. Summary of Estimated 2030 CHP Market Penetration with Policy Options
Policy Option 3.2 (a separate new CIP tier for CHP in electric utility CIP, with an emphasis on utility
investment in CHP) and Policy Option 4.2 (APS high goal) are each projected to result in about 1,000
MW of new CHP by 2030. This magnitude of new CHP capacity represents approximately a doubling
of current CHP.4
The impact of each policy option on projected CHP growth is discussed below.
Conservation Improvement Program (CIP)
In Policy Options 1.1, 1.2, 2.1 and 2.2, CIP incentives for customer investment in CHP, at levels
approximately consistent with recent levels of CIP expenditures per unit of electricity or natural gas
saved, are estimated to result in approximately 100 to 240 MW of additional CHP beyond the Base
Case. However, most CHP installations do not meet both the PCT and SCT.
Policy Options 1.3 and 2.3, which provide more substantial CIP incentives (combining capital and
operating incentives) for customer investment in CHP, are estimated to result in approximately 250
4 Policy Option 3.1 (a separate new CIP tier for CHP in gas utility CIP, with an emphasis on gas utility investment
in CHP) is projected to result in about 850 MW of new CHP by 2030. This also represents significant growth
but is lower than in Policy Option 3.2 because the historical value of natural gas reductions in CIP (which were
used to establish natural gas utility CIP credits in the policy options) are less beneficial than the historical value
of electricity reductions in CIP (which were used to establish electric utility CIP credits in the policy options).
-
200
400
600
800
1,000
1,200
1.1
Ca
p I
nc
1.2
Op
In
c
1.3
Ca
p &
Op
In
c
2.1
Ca
p I
nc
2.2
Op
In
c
2.3
Ca
p &
Op
In
c
3.1
Ga
s U
tility
3.2
Ele
c U
tility
4 B
ioe
ne
rgy
go
al
5.1
AP
S L
ow
Go
al
5.2
AP
S H
igh
Go
al
Base
Case
Natural Gas CIP Electric CIP CIP with Utility
WACC
RPS Alternative
Portfolio
Standard
CH
P C
ap
acit
y b
y 2
03
0 (
MW
)
Biomass
Natural Gas

xix | P a g e COMM-20130522-67922 | July 2014
to 500 MW of additional CHP beyond the Base Case. However, while these policy options improve
PCT results, most CHP installations not meet both the PCT and the SCT.
In Policy Option group 3, deploying the relatively low Weighted Average Cost of Capital (WACC) of
utilities to build CHP significantly enhances CHP economics. Utility investment in CHP is estimated to
result in approximately 630 to 840 MW of additional CHP beyond the Base Case, with positive
results for both cost-benefit tests for a wide range of CHP installations.
Renewable Portfolio Standard
With Policy Option 4, establishing a specific “carve-out” for bioenergy CHP in the RPS is estimated to
result in about 125 MW of new biomass CHP by 2030. The RPS was not analyzed for the Cost-
Benefit tests.
Alternative Portfolio Standard
In Policy Option group 5, an Alternative Portfolio Standard is estimated to result in approximately 440
to 770 MW of additional CHP beyond the Base Case (for Low and High APS targets). At the high end
of this range, CHP would more than double by 2030.
Although the APS was not directly analyzed for the Cost-Benefit tests, it was indirectly analyzed5 and
is projected to result in positive results for both Cost-Benefit tests for wide range of CHP installations.
Conclusions
Conservation Improvement Program
As a mechanism for advancing CHP, the CIP has a significant advantage because it is an established
program for reductions in electricity and natural gas consumption that is familiar to utilities,
stakeholders and state agencies. Further, CIP provides opportunities for incentives (“carrots”) for
utility adoption of CHP, in contrast to the APS, which relies solely on a “stick” approach. However,
there are a range of issues surrounding use of CIP as a mechanism to advance CHP.
There are disparities in CHP opportunities between utilities, particularly limitations in the service
territories of municipal utilities and cooperatives. A system of tradable credits would provide a way to
address this issue and promote economic efficiency (i.e., result in the lowest costs to society by
promoting implementation of CHP at the most cost-effective sites regardless of location).
One concern regarding the CIP is the high level of opt-out and the fact that the opt-outs tend to be
the larger energy users who are generally the best candidates for CHP. To the extent that CHP is
implemented within CIP primarily through utility ratebase investments, this issue is largely mitigated.
However, at least as envisioned in the policy analysis, a CIP credit ($/MWh) would also flow to the
CHP project even with utility ownership in order to provide an economic advantage to CHP in
competing for dispatch of utility resources.
Legislation to establish a CHP tier in CIP would have to resolve the current lack of clarity regarding
the potential role of CHP in CIP. Further, the legislation would require resolution of issues of
5 The impacts of the APS were indirectly analyzed by assessing the impacts of CIP operating credits as a proxy
for a tradable APS credits.
xx | P a g e COMM-20130522-67922 | July 2014
interaction between electric utility CIP and gas utility CIP. For example, if natural gas utilities could
include CHP in their CIP, there would be a shift in revenue from the electric utility to the gas utility.
This would engender resistance from electric utilities out of concern for impacts on rates. On the
other hand, including CHP in both gas and electric utility CIP may increase the interest of electric
utilities in CHP in order to retain revenues.
Decoupling of both gas and electric utility revenues from sales would in concept address concerns
related to potential shifts in revenue from one utility to another. (Decoupling is a complex issue that
extends far beyond CHP, and was not part of the scope of this study.)
An argument in favor of focusing responsibility for CHP implementation on electric utilities is that it
can better facilitate timely and positive resolution of barriers relating to interconnection and standby
rates. Further, setting goals for CHP in both electric and gas utility CIP would result in the potential
for electric and gas utilities to be competing for the same pool of prospective CHP projects.
Renewable Portfolio Standard
Establishing a specific “carve-out” for bioenergy CHP in the RPS (Policy Option 4) is projected to
provide relatively little additional CHP and ignores the largest CHP potential (natural gas CHP). Either
the CIP or an APS would be a more effective mechanism for promoting CHP because either approach
would not only address renewable CHP but also natural gas CHP, which constitutes the vast majority
of the potential.
Alternative Portfolio Standard
Minnesota currently has no Alternative Portfolio Standard (APS), so new legislation would be required
to create a new program and related implementation mechanisms. Creation of a new program will
likely face greater political and implementation challenges in comparison to expanding an existing
program such as CIP.
On the other hand, because the APS would be a new program it may be able to avoid some of the
complexities discussed above relative to adapting the CIP to include CHP. An APS can be structured
from the beginning as an enforceable standard with clear cost penalties for non-compliance.
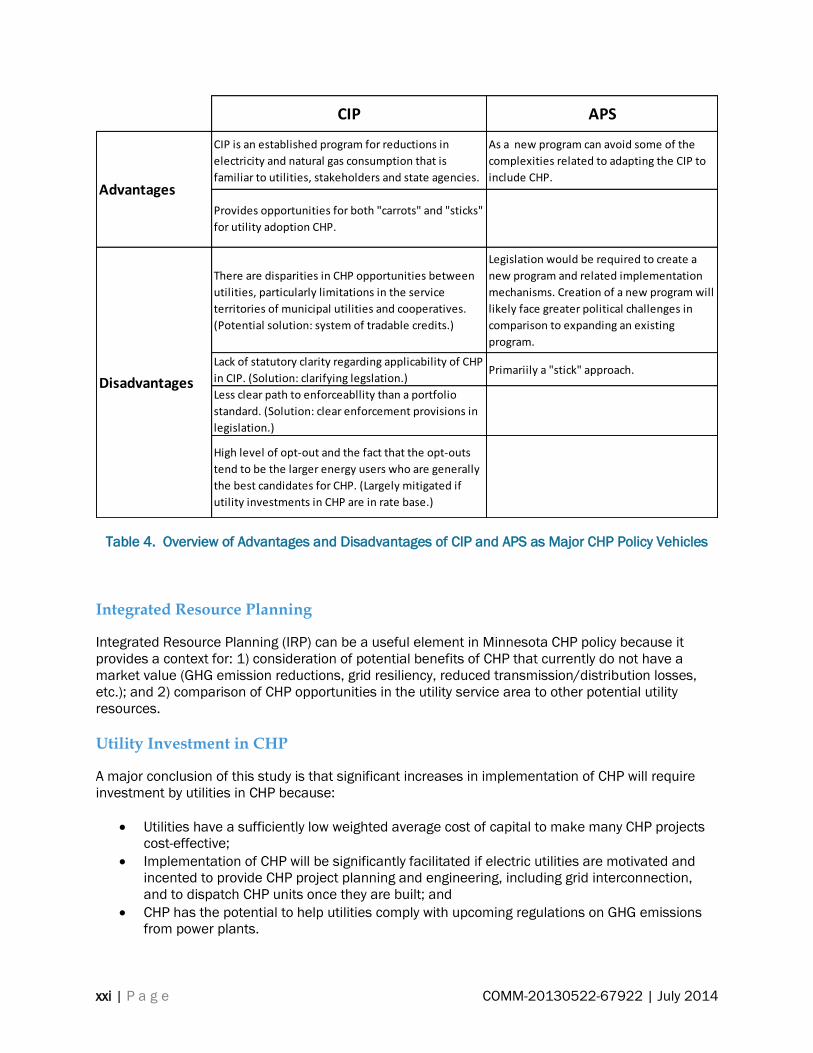
Table 4 provides a summary of the major advantages and disadvantage of CIP compared with APS
as the major CHP policy mechanism.
xxi | P a g e COMM-20130522-67922 | July 2014
Table 4. Overview of Advantages and Disadvantages of CIP and APS as Major CHP Policy Vehicles
Integrated Resource Planning
Integrated Resource Planning (IRP) can be a useful element in Minnesota CHP policy because it
provides a context for: 1) consideration of potential benefits of CHP that currently do not have a
market value (GHG emission reductions, grid resiliency, reduced transmission/distribution losses,
etc.); and 2) comparison of CHP opportunities in the utility service area to other potential utility
resources.
Utility Investment in CHP
A major conclusion of this study is that significant increases in implementation of CHP will require
investment by utilities in CHP because:
Utilities have a sufficiently low weighted average cost of capital to make many CHP projects
cost-effective;
Implementation of CHP will be significantly facilitated if electric utilities are motivated and
incented to provide CHP project planning and engineering, including grid interconnection,
and to dispatch CHP units once they are built; and
CHP has the potential to help utilities comply with upcoming regulations on GHG emissions
from power plants.
CIP APS
CIP is an established program for reductions in
electricity and natural gas consumption that is
familiar to utilities, stakeholders and state agencies.
As a new program can avoid some of the
complexities related to adapting the CIP to
include CHP.
Provides opportunities for both "carrots" and "sticks"
for utility adoption CHP.
There are disparities in CHP opportunities between
utilities, particularly limitations in the service
territories of municipal utilities and cooperatives.
(Potential solution: system of tradable credits.)
Legislation would be required to create a
new program and related implementation
mechanisms. Creation of a new program will
likely face greater political challenges in
comparison to expanding an existing
program.
Lack of statutory clarity regarding applicability of CHP
in CIP. (Solution: clarifying legslation.)Primariily a "stick" approach.
Less clear path to enforceabllity than a portfolio
standard. (Solution: clear enforcement provisions in
legislation.)
High level of opt-out and the fact that the opt-outs
tend to be the larger energy users who are generally
the best candidates for CHP. (Largely mitigated if
utility investments in CHP are in rate base.)
Disadvantages
Advantages

xxii | P a g e COMM-20130522-67922 | July 2014
A number of issues relating to utility investment in CHP must be more closely examined. Such
investment at customer sites could result in ratepayer risk in the event that the thermal host goes
out of business. The risk profiles of potential thermal hosts vary dramatically, with industrial plants
competing internationally at the high end of the risk continuum, and institutional customers (e.g.,
district energy systems, colleges, universities, hospitals) at the low end. Risks related to CHP should
be considered in the context of existing risks to ratepayers, such as cost overruns for refurbishment
of conventional power plants, and risks associated with environmental regulations. Potential
ratepayer risks associated with utility investment in CHP could be addressed through range of
mechanisms, including a return on equity risk premium, a state-funded loss reserve, or other
mechanisms.
Recommendations
Near-term Steps
During the balance of 2014, we recommend the following steps:
1. Initiate a robust stakeholder discussion of this report including feedback on policy options for
increasing implementation of CHP. (Note: planning for this is already well underway by the
Department of Commerce.)
2. Initiate an interagency working group to integrate potential CHP policy with Minnesota’s plan
to comply with the EPA’s Clean Power Plan.
3. Develop a draft “Minnesota CHP Policy Act” for consideration by the legislature in 2015.
Either the CIP or an APS can be an effective centerpiece in Minnesota policies to significantly
increase CHP, with the focus on facilitating use of the low WACC of utilities to finance CHP projects.
On balance, the CIP appears to be a stronger vehicle for increasing CHP if the legislation effectively
addresses the disadvantages outlined above. A priority should be placed on successfully adapting
the CIP to include CHP, with the APS considered as a back-up approach.
Regardless of whether the CIP or an APS is the primary CHP program, a system of tradable credits
will be important to promote economic efficiency (i.e., result in the lowest costs to society by
promoting implementation of CHP at the most cost-effective sites regardless of location).
An achievable and readily understood goal for the State of Minnesota is doubling CHP capacity
by 2030.
Key provisions for the “Minnesota CHP Policy Act” are recommended below. In addition to the CIP as
the centerpiece, additional recommendations are provided relative to integrated resource planning
and standby rates.
Minnesota Combined Heat and Power Policy Act
ARTICLE 1. FINDINGS AND GOAL
Subd. 1. FINDINGS. The legislature finds that combined heat and power (CHP) systems should be
encouraged because such systems:
xxiii | P a g e COMM-20130522-67922 | July 2014
a) Reduce fossil fuel use by recovering heat that is usually wasted as rejected heat in power
generation;
b) Reduce emissions of air pollutants and greenhouse gases;
c) Increase energy security and sustainability by reducing dependence on fossil fuels; and
d) Enhance grid resiliency, reduce power line losses and strengthen peak power demand
management.
Subd. 2. GOAL. The State of Minnesota establishes a goal of doubling CHP capacity from the current
962 MegaWatts (MW) by the year 2030.
ARTICLE 2. CONSERVATION IMPROVEMENT PROGRAM.
Subd. 1. ENERGY CONSERVATION IMPROVEMENT. Minnesota Statutes Section 216B.241 Subd. 1(e)
is modified by adding:
Energy conservation improvement also includes combined heat and power as defined in
Subd. 11.
Subd. 2. COMBINED HEAT AND POWER REQUIREMENTS. Minnesota Statutes Section 216B.241
Subd. 1c. is modified by adding the following new paragraphs (c) and (d) and renumbering
subsequent paragraphs:
(c) Each individual investor owned electric utility shall have an annual CHP energy savings
requirement equivalent to 0.45 percent of gross annual retail energy sales unless modified
by the commissioner under paragraph (e). This CHP requirement shall be shall be tracked in
a category that is separate and distinct from other energy savings goals in this section. The
CHP requirements must be calculated based on the most recent three-year weather-
normalized average. A utility may elect to carry forward energy savings in excess of 0.45
percent for a year to the succeeding three calendar years. A particular energy savings can
be used only for one year's requirement.
(d) Each individual municipal electric utility, electric cooperative or association shall have an
annual CHP energy savings requirement equivalent to 0.18 percent of gross annual retail
energy sales unless modified by the commissioner under paragraph (e). These CHP
requirements shall be shall be tracked in a category that is separate and distinct from other
energy savings goals in this section. The CHP requirements must be calculated based on the
most recent three-year weather-normalized average. A utility may elect to carry forward
energy savings in excess of 0.18 percent for a year to the succeeding three calendar years.
A particular energy savings can be used only for one year's requirement.
Subd. 3. OWNERSHIP OF COMBINED HEAT AND POWER. Minnesota Statutes 216B.241 Subd. 3 is
modified with the italicized insertion as follows:
Subd. 3.Ownership of energy conservation improvement.
An energy conservation improvement made to or installed in a building in accordance with
this section, except combined heat and power systems or other systems owned by the utility
and designed to turn off, limit, or vary the delivery of energy, are the exclusive property of the
owner of the building except to the extent that the improvement is subjected to a security
interest in favor of the utility in case of a loan to the building owner. The utility has no liability
for loss, damage or injury caused directly or indirectly by an energy conservation

xxiv | P a g e COMM-20130522-67922 | July 2014
improvement except for negligence by the utility in purchase, installation, or modification of
the product.
Subd. 4. DEFINITIONS. Minnesota Statutes 216B.241 is modified by adding the following new
subdivision:
Subd. 11.Combined heat and power.
(a) Eligibility. CHP Credits from combined heat and power are eligible to be counted towards an
electric utility's CHP energy savings requirements, as established in Subd. 1c. (c) and Subd. 1c.
(d), subject to department approval.
(b) Definitions.
1. Combined Heat and Power (CHP). A process which uses the same energy source for the
simultaneous or sequential generation of electrical power, mechanical shaft power, or
both, in combination with the generation of steam or other forms of useful thermal
energy (including heating and cooling applications).
2. CHP Credits. CHP Credits are defined as follows for each category of CHP opportunity:
a) CHP Credit for New Non-Renewable CHP Plant. A Qualifying CHP plant using a
non-renewable fuel, which produced neither electrical nor Useful Thermal
Energy before January 1, 2016, shall generate CHP Credits, measured in
MegaWatt-hours, equal to the values shown in Table 5 based on the total energy
efficiency (thermal and electric) measured on a Higher Heating Value (HHV)
basis.
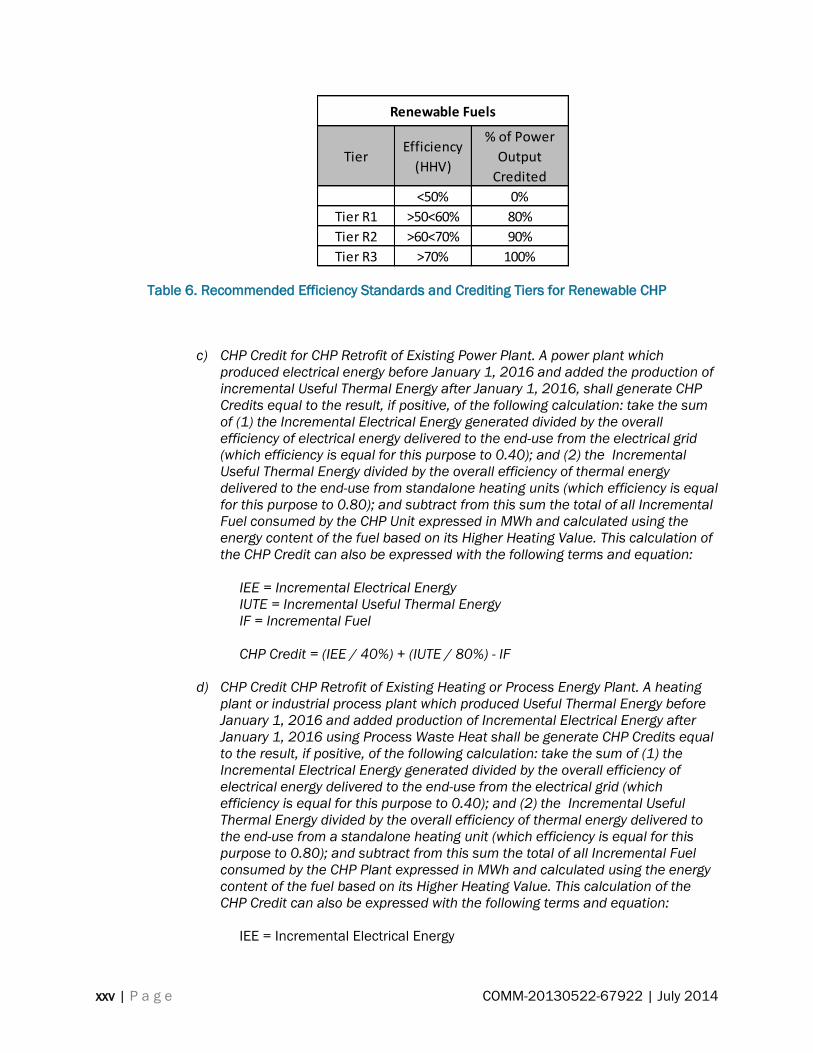
b) CHP Credit for New Renewable CHP Plant. A Qualifying CHP plant using
renewable fuel, which produced neither electrical nor Useful Thermal Energy
before January 1, 2016, shall generate CHP Credits, measured in MegaWatt-
hours, equal to the values shown in Table 6 based on the total energy efficiency
(thermal and electric) measured on a Higher Heating Value (HHV) basis.
Table 5. Recommended Efficiency Standards and Crediting Tiers for Non-Renewable CHP
Non-Renewable Fuels
TierEfficiency
(HHV)
% of Power
Output
Credited
<60% 0%
Tier 1 >60<70% 80%
Tier 2 >70<80% 90%
Tier 3 >80% 100%
xxv | P a g e COMM-20130522-67922 | July 2014
Table 6. Recommended Efficiency Standards and Crediting Tiers for Renewable CHP
c) CHP Credit for CHP Retrofit of Existing Power Plant. A power plant which
produced electrical energy before January 1, 2016 and added the production of
incremental Useful Thermal Energy after January 1, 2016, shall generate CHP
Credits equal to the result, if positive, of the following calculation: take the sum
of (1) the Incremental Electrical Energy generated divided by the overall
efficiency of electrical energy delivered to the end-use from the electrical grid
(which efficiency is equal for this purpose to 0.40); and (2) the Incremental
Useful Thermal Energy divided by the overall efficiency of thermal energy
delivered to the end-use from standalone heating units (which efficiency is equal
for this purpose to 0.80); and subtract from this sum the total of all Incremental
Fuel consumed by the CHP Unit expressed in MWh and calculated using the
energy content of the fuel based on its Higher Heating Value. This calculation of
the CHP Credit can also be expressed with the following terms and equation:
IEE = Incremental Electrical Energy
IUTE = Incremental Useful Thermal Energy
IF = Incremental Fuel
CHP Credit = (IEE / 40%) + (IUTE / 80%) - IF
d) CHP Credit CHP Retrofit of Existing Heating or Process Energy Plant. A heating
plant or industrial process plant which produced Useful Thermal Energy before
January 1, 2016 and added production of Incremental Electrical Energy after
January 1, 2016 using Process Waste Heat shall be generate CHP Credits equal
to the result, if positive, of the following calculation: take the sum of (1) the
Incremental Electrical Energy generated divided by the overall efficiency of
electrical energy delivered to the end-use from the electrical grid (which
efficiency is equal for this purpose to 0.40); and (2) the Incremental Useful
Thermal Energy divided by the overall efficiency of thermal energy delivered to
the end-use from a standalone heating unit (which efficiency is equal for this
purpose to 0.80); and subtract from this sum the total of all Incremental Fuel
consumed by the CHP Plant expressed in MWh and calculated using the energy
content of the fuel based on its Higher Heating Value. This calculation of the
CHP Credit can also be expressed with the following terms and equation:
IEE = Incremental Electrical Energy
Renewable Fuels
TierEfficiency
(HHV)
% of Power
Output
Credited
<50% 0%
Tier R1 >50<60% 80%
Tier R2 >60<70% 90%
Tier R3 >70% 100%
xxvi | P a g e COMM-20130522-67922 | July 2014
IUTE = Incremental Useful Thermal Energy
IF = Incremental Fuel
CHP Credit = (IEE / 40%) + (IUTE / 80%) - IF
3. CHP Plant. Facilities and equipment used for combined heat and power.
4. Incremental Electrical Energy. Electrical energy generated by a Qualifying CHP Plant that
is either greater than (expressed as a positive amount) or less than (expressed as a
negative amount) the electrical energy generated by the CHP Plant prior to the addition
of new electric generation nameplate capacity, Useful Thermal Energy, or Incremental
Useful Thermal Energy.
5. Incremental Fuel. The amount of additional fuel used by a Qualifying CHP Plant which is
attributable to the production of Incremental Useful Thermal Energy or Incremental
Electrical Energy.
6. Incremental Useful Thermal Energy. Useful Thermal Energy produced by a Qualifying CHP
Plant that is distinct in its final distribution, beneficial measure, and metering from
Useful Thermal Energy previously produced by the CHP Plant, but only to the extent that
the Incremental Useful Thermal Energy does not reduce the Useful Thermal Energy
previously produced.
7. Non Renewable CHP. A Qualifying CHP Plant for which more than 10 percent of the
annual fuel input is composed of natural gas, coal, oil, propane, other fossil fuels, or
nuclear energy.
8. Process Waste Heat. Heat contained in gases or liquids exhausted from a boiler plant,
industrial process or municipal process (such as sewage sludge incineration) that is
currently and/or conventionally not recovered for useful purposes.
9. Qualifying CHP Plant. Any CHP Retrofit of Existing Power Plant, any CHP Plant CHP
Retrofit of Existing Heating or Process Energy Plant, or any new CHP Plant which: 1)
which has a minimum annual energy efficiency on a higher heating value basis of 60
percent (if using non-renewable fuels) or 50 percent (if using renewable fuels); and 2)
which produces at least 20 percent of its total useful energy in the form of thermal
energy which is not used to produce electrical or mechanical power (or combination
thereof), and at least 20 percent of its total useful energy in the form of electrical or
mechanical power (or combination thereof).
10. Renewable CHP Plant. A Qualifying CHP Plant for which at least 90 percent of the annual
fuel input is composed of energy sources other than natural gas, coal, oil, propane, other
fossil fuels, or nuclear energy.
11. Useful Thermal Energy. Energy 1) in the form of direct heat, steam, hot water, or other
thermal form that is used in production and beneficial measures for heating, cooling,
humidity control, process use, or other valid thermal end use energy requirements and
(2) for which fuel or electricity would otherwise be consumed.
12. Utility Customer. A Utility Customer is an entity who purchases retail electricity from the
utility.

xxvii | P a g e COMM-20130522-67922 | July 2014
(c) Incentives.
1. Incentives for Utility Customer- or Third Party-Owned CHP. Utilities shall provide an
operating incentive to customers who finance a CHP plant, or third parties who finance a
CHP plant to serve a customer or group of customers.
2. Duration of Incentives. Operating incentives shall be provided for a period of fifteen (15)
years.
3. Level of Incentive. The operating incentive shall be calculated as follows:
CIPE = Statewide average total CIP expenditures by electric utilities for non-CHP
incentives and programs over the three (3) calendar years prior to the initiation of
commercial operation of the CHP plant, inclusive of administrative costs
CIPS = Statewide average total first year CIP savings (MWh) by electric utilities for non-
CHP incentives and programs over the three (3) calendar years prior to the initiation of
commercial operation of the CHP plant
Level of Incentive = CIPE / (CIPS x 15 years)
4. Utility-Owned CHP. If the electric utility finances a CHP plant, it may include as a CIP
expenditure the amount which would otherwise be provided to a CHP Plant financed by a
customer or third party.
(d) Alternative Compliance.
1. Alternative Compliance Payment. A utility may discharge its obligations, in whole or in
part, for any Compliance Year by making an Alternative Compliance Payment (ACP) to
the Minnesota Department of Commerce. The ACP Rate, in $ per MWh CHPC, and
provisions for modifying the rate, shall be established in rulemaking.
2. Use of Funds. The Department of Commerce shall oversee the use of ACP funds so as to
further the implementation of CHP, district energy systems and other energy efficiency
and renewable energy systems.
(e) Tradable Credits. A system of tradable CHP credits (CHPCs) will be established so that a
customer, third party or natural gas utility can generate CHP Credits for sale to electric
utilities.
1. Lifetime. CHPS Credits will have a trading lifetime of 4 years according to the year of
generation (e.g., all credits generated during 2017, regardless of the month, expire at
the end of 2021).
2. Whole Credits. CHPCs must remain "whole" and may not be disaggregated into separate
environmental commodities (e.g., carbon emission credits)
ARTICLE 3. INTEGRATED RESOURCE PLANNING
Subd. 1. Minnesota Statutes 216B.2422 Subd. 4 is modified with the italicized insertion as follows:

xxviii | P a g e COMM-20130522-67922 | July 2014
Subd. 4.Preference for renewable energy facility.
The commission shall not approve a new or refurbished nonrenewable energy facility which
generates only electricity in an integrated resource plan or a certificate of need, pursuant to
section 216B.243, nor shall the commission allow rate recovery pursuant to section 216B.16 for
such a nonrenewable energy facility, unless the utility has demonstrated that a renewable energy
facility is not in the public interest. The public interest determination must include whether the
resource plan helps the utility achieve the greenhouse gas reduction goals under section
216H.02, the renewable energy standard under section 216B.1691, or the solar energy
standard under section 216B.1691, subdivision 2f. Electric utilities are required to demonstrate
that, before power-only capacity is proposed in Integrated Resource Plans, CHP opportunities
within their service territory have been thoroughly assessed to determine the GHG, grid resiliency
and other benefits of CHP.
Subd. 2. Minnesota Statutes 216B.2422 is modified by adding the following new Subdivision and
renumbering subsequent subdivisions:
Subd. 5. Preference for combined heat and power.
The commission shall not approve a new or refurbished nonrenewable energy facility which
generates only electricity in an integrated resource plan or a certificate of need, pursuant to
section 216B.243, nor shall the commission allow rate recovery pursuant to section 216B.16
for such a nonrenewable energy facility, unless the utility has demonstrated that: 1)
opportunities for new combined heat and power plants within their service territory have been
thoroughly assessed to determine the greenhouse gas, grid resiliency and other benefits; 2) the
potential for converting existing power plants to combined heat and power, with distribution of
recovered energy through district energy systems, has been thoroughly assessed to determine
the greenhouse gas, grid resiliency and other benefits; and 3) a combined heat and power
facility is not in the public interest, which public interest determination shall include whether the
resource plan helps the utility achieve the combined heat and power requirements in Minnesota
Statutes 216B.241
ARTICLE 4. STANDBY RATES
Minnesota Statutes 216B.164 is modified by adding the following new subdivision and renumbering
subsequent subdivisions:
Subd. 3. STANDBY RATES. Standby rates charged by public utilities must conform to the
following principles:
1. Standby rates should be transparent, concise and easily understandable. Potential CHP
customers should be able to accurately predict future standby charges in order to assess
their financial impacts on CHP feasibility.
2. Standby energy usage fee should reflect both demand and time-of-use cost drivers.
Time-of-use energy rates send clear price signals as to the cost for the utility to generate
needed energy. This would further incentivize the use of off-peak standby services.
3. The Forced Outage Rate should be used in the calculation of a customer’s reservation
charge. The inclusion of a customer’s forced outage rate directly incentivizes standby
customers to limit their use of backup service. This further ties the use of standby to the

xxix | P a g e COMM-20130522-67922 | July 2014
price paid to reserve such service, creating a strong price signal for customers to run
most efficiently.
4. The standby demand usage fees should only apply during on-peak hours and be charged
on a daily basis. This rate design would encourage CHP customers to shift their use of
standby service to off-peak periods when the marginal cost to provide service is
generally much lower. Furthermore, this design would allow customers to save money by
reducing the duration of outages.
5. Grace periods exempting demand usage fees should be removed where they exist.
Exempting an arbitrary number of hours against demand usage charges sends
inaccurate prices signals about the cost to provide this service. Standby demand usage
should be priced as-used on a daily and preferably an on-peak basis. This method
directly ties the standby customer to the costs associated with providing standby service.
Implementation and Rulemaking
Following passage of legislation, the following steps are recommended:
1. Conduct a study to quantify the “Value of CHP” relative to total primary energy efficiency,
GHG emissions, power grid resiliency, peak demand management, risk management and
other potential values of CHP. Further, the study should assess potential constraints to
increased implementation of CHP, such as natural gas pipeline capacity limitations.
2. Establish clear policies regarding inclusion of CHP costs in electric utility rates, including
mechanisms for addressing ratepayer risks associated with utility investment in CHP through
a return on equity risk premium, a state-funded loss reserve or other mechanism.
3. Initiate a high-level dialog with the Midwest Independent System Operator to create rules
that encourage maximum dispatch of CHP units.

xxx | P a g e COMM-20130522-67922 | July 2014
This page intentionally left blank.
1 | P a g e COMM-20130522-67922 | July 2014
Introduction
Methodology
This study began with research on current Minnesota laws, policies and programs relevant to CHP. A
review of literature on CHP barriers and policies was then undertaken, including an analysis by the
American Council for an Energy-Efficient Economy (ACEEE) of best practices for CHP policies in other
states. Existing and proposed federal policies relevant to CHP were identified. The economics of a
broad range of CHP technologies were analyzed, including sensitivity to key variables that could be
affected by new policies and programs, including capital cost, weighted average cost of capital6, CHP
fuel price and avoided price of electricity.
Draft Policy Options for increasing CHP in Minnesota were developed based on the analysis of the
economic significance of key barriers as well as review of best practices in other states. A “Straw
Man” draft report was prepared which summarized existing Minnesota policies, described CHP
barriers and the analysis of the economic significance of key variables, outlined draft Policy Options,
and addressed issues associated with the Policy Options. Informal stakeholder consultations were
conducted by the author following distribution of the Straw Man report, including discussions with
electric utilities, gas utilities, thermal utilities, equipment suppliers, customers, advocacy groups and
consultants.
Following the stakeholder consultation, detailed analysis of the Policy Options was undertaken and
modifications were made to the Policy Options based on the feedback and analysis. Additional
analysis of potential issues relating to the Policy Options was undertaken, including specific
questions relating to program design as well as potential cost-benefit impacts on program
participants, utility ratepayers and society. The impact of each Policy Option on CHP implementation
was projected, primarily using ICF International’s model for estimating natural-gas fired CHP market
penetration. In addition, analysis of Minnesota Pollution Control Agency fuel consumption data was
used to check and augment the ICF model on gas-fired CHP and to estimate the potential market
penetration of biomass CHP.
Recommendations were then developed for consideration by the Department of Commerce and
stakeholders in stakeholder workshops to be implemented in fall of 2014.
Appendix E provides additional information on the analysis methodology, focusing on aspects of the
methodology that are not described in the body of the report or which are only briefly mentioned.
6 Weighted Average Cost of Capital (WACC) is the weighted average cost of repaying the capital invested or
borrowed to build a CHP project. There are two main ways to fund a project: 1) equity investment, in which a
company invests its own funds and then requires a return on that equity investment through payments made
throughout the life of the project from the project revenues; and 2) debt, in which funds are borrowed and
principal and interest payments are made each year based on the debt interest rate. WACC is calculated
based on the relative portions of debt and equity. For example, if the funds raised are 60 percent debt and 40
percent equity, the debt interest rate is 6 percent and the return on equity is 12 percent, the WACC is
calculated as follows: (60% X 6%) + (40% X 12%) = 8.4%.
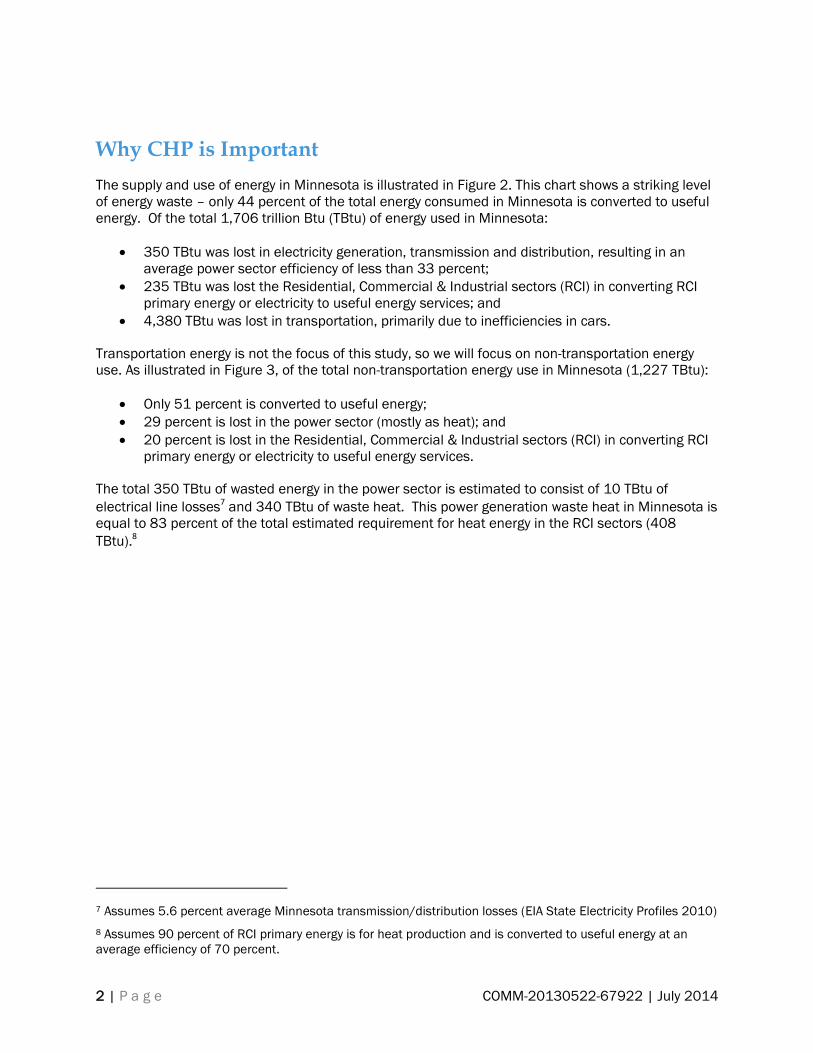
2 | P a g e COMM-20130522-67922 | July 2014
Why CHP is Important
The supply and use of energy in Minnesota is illustrated in Figure 2. This chart shows a striking level
of energy waste – only 44 percent of the total energy consumed in Minnesota is converted to useful
energy. Of the total 1,706 trillion Btu (TBtu) of energy used in Minnesota:
350 TBtu was lost in electricity generation, transmission and distribution, resulting in an
average power sector efficiency of less than 33 percent;
235 TBtu was lost the Residential, Commercial & Industrial sectors (RCI) in converting RCI
primary energy or electricity to useful energy services; and
4,380 TBtu was lost in transportation, primarily due to inefficiencies in cars.
Transportation energy is not the focus of this study, so we will focus on non-transportation energy
use. As illustrated in Figure 3, of the total non-transportation energy use in Minnesota (1,227 TBtu):
Only 51 percent is converted to useful energy;
29 percent is lost in the power sector (mostly as heat); and
20 percent is lost in the Residential, Commercial & Industrial sectors (RCI) in converting RCI
primary energy or electricity to useful energy services.
The total 350 TBtu of wasted energy in the power sector is estimated to consist of 10 TBtu of 7
electrical line losses and 340 TBtu of waste heat. This power generation waste heat in Minnesota is
equal to 83 percent of the total estimated requirement for heat energy in the RCI sectors (408 8
TBtu).
7 Assumes 5.6 percent average Minnesota transmission/distribution losses (EIA State Electricity Profiles 2010)
8 Assumes 90 percent of RCI primary energy is for heat production and is converted to useful energy at an
average efficiency of 70 percent.
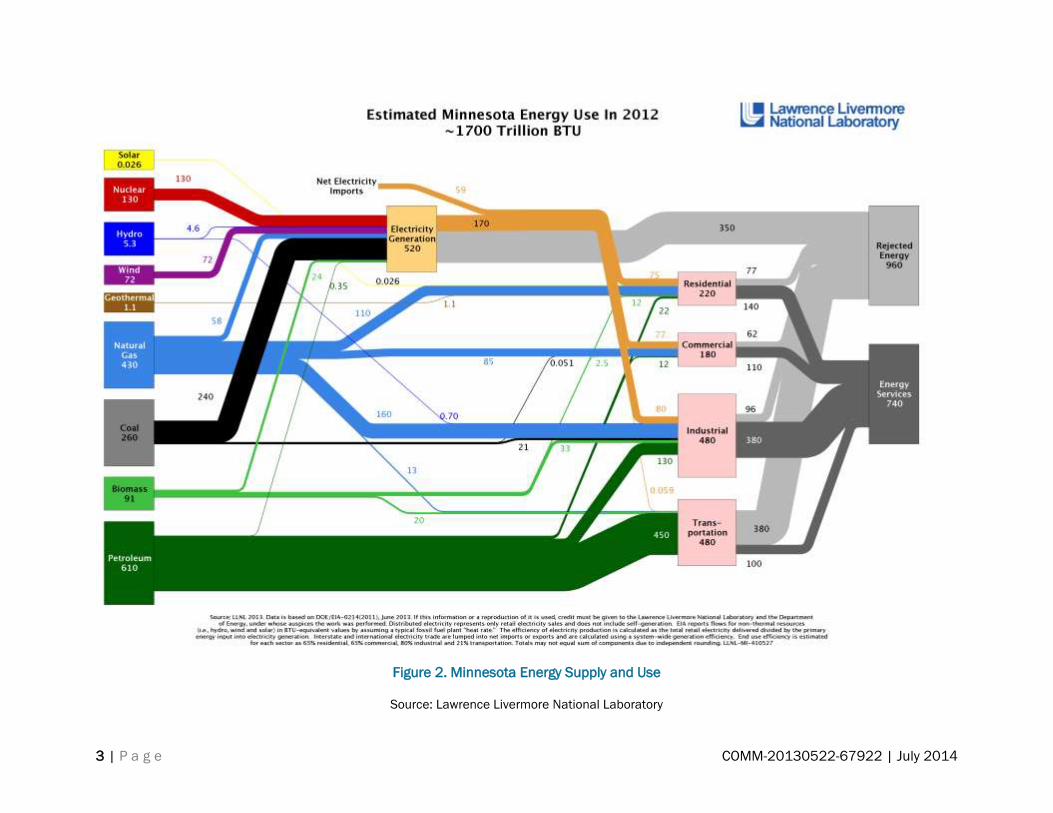
3 | P a g e COMM-20130522-67922 | July 2014
Figure 2. Minnesota Energy Supply and Use
Source: Lawrence Livermore National Laboratory
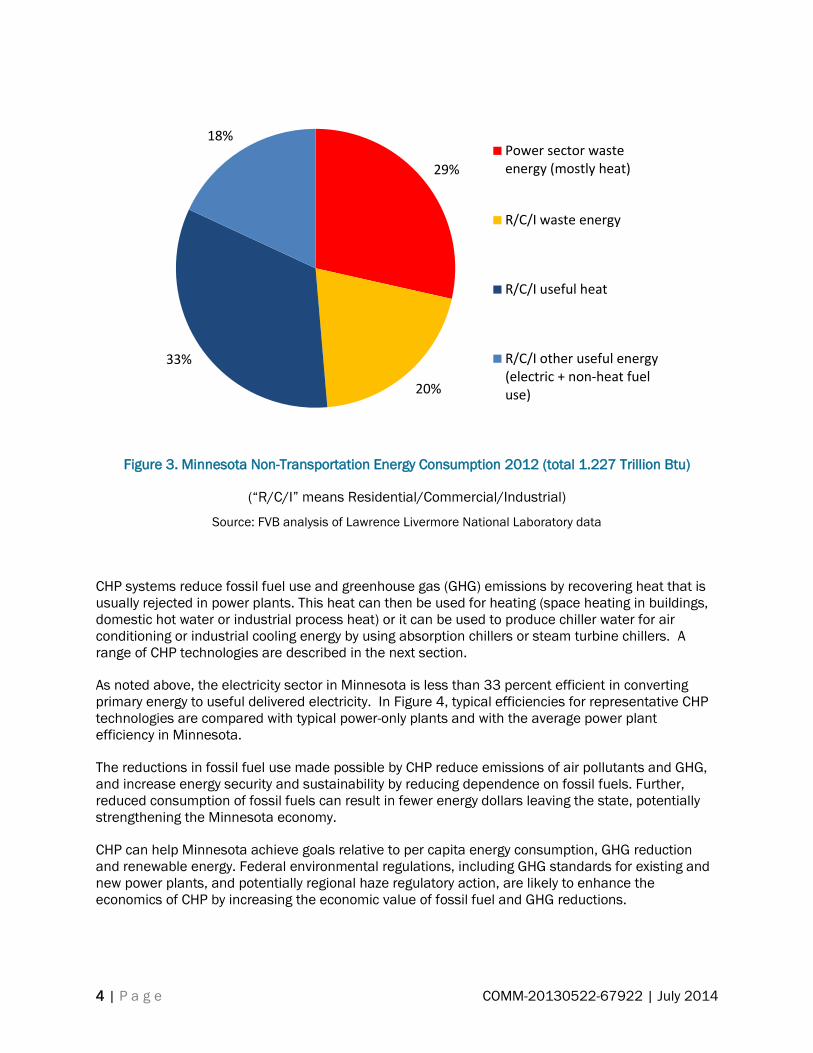
4 | P a g e COMM-20130522-67922 | July 2014
Figure 3. Minnesota Non-Transportation Energy Consumption 2012 (total 1.227 Trillion Btu)
(“R/C/I” means Residential/Commercial/Industrial)
Source: FVB analysis of Lawrence Livermore National Laboratory data
CHP systems reduce fossil fuel use and greenhouse gas (GHG) emissions by recovering heat that is
usually rejected in power plants. This heat can then be used for heating (space heating in buildings,
domestic hot water or industrial process heat) or it can be used to produce chiller water for air
conditioning or industrial cooling energy by using absorption chillers or steam turbine chillers. A
range of CHP technologies are described in the next section.
As noted above, the electricity sector in Minnesota is less than 33 percent efficient in converting
primary energy to useful delivered electricity. In Figure 4, typical efficiencies for representative CHP
technologies are compared with typical power-only plants and with the average power plant
efficiency in Minnesota.
The reductions in fossil fuel use made possible by CHP reduce emissions of air pollutants and GHG,
and increase energy security and sustainability by reducing dependence on fossil fuels. Further,
reduced consumption of fossil fuels can result in fewer energy dollars leaving the state, potentially
strengthening the Minnesota economy.
CHP can help Minnesota achieve goals relative to per capita energy consumption, GHG reduction
and renewable energy. Federal environmental regulations, including GHG standards for existing and
new power plants, and potentially regional haze regulatory action, are likely to enhance the
economics of CHP by increasing the economic value of fossil fuel and GHG reductions.
29%
20%
33%
18%Power sector wasteenergy (mostly heat)
R/C/I waste energy
R/C/I useful heat
R/C/I other useful energy(electric + non-heat fueluse)

5 | P a g e COMM-20130522-67922 | July 2014
Figure 4. Comparative Efficiency of CHP and Power-Only Plants
Source: FVB Energy
CHP also has the potential to enhance grid resiliency, reduce power line losses and strengthen peak
power demand management. CHP systems are typically located much closer to the end user than
more traditional centralized power plants; close proximity to end-users can reduce the losses of
power along transmission and distribution lines. Additionally, many CHP systems are capable of
ramping up to full output very quickly, providing more nimble electric system assets than many
traditional generation resources.
Overview of CHP Technologies
In electric-only power plants, most of the energy input to the plant ends up as waste heat. Power
plants using a steam turbine (either steam turbine or gas turbine combined cycle plants) condense
the steam exiting from the turbine. This creates a vacuum on the exit end of the steam cycle, thus
increasing the torque and power output of the steam turbine. However, most of the energy then
ends up in the condenser cooling system (using cooling towers which put the heat into the air, or
dissipating the heat in a body of water such as a river). In combustion turbines all of the energy in
the exhaust gases is wasted, unless it is used to produce steam to drive a steam turbine to generate
electricity (this configuration is called a combined cycle plant). Reciprocating engines lose heat
through the exhaust gas, engine cooling jacket, lubricating oil and other systems.
When one of these power generation technologies is adapted for CHP, much of the waste heat can
be recovered for heating or for conversion to cooling using steam-driven chillers. CHP is defined in
0%
10%
20%
30%
40%
50%
60%
70%
80%
90%
Minnesota
Average
Coal 400
MW
Natural Gas
Combined
Cycle 400
MW
Gas Engine
5 MW
Gas Turbine
10 MW
Gas
Combined
Cycle CHP
40 MW
Biomass
Steam
Turbine 10
MW
Power-only Plants CHP
Eff
icie
ncy
(Use
ful E
ne
rgy
pe
r u
nit
of
Fu
el C
on
su
me
ed
)
Thermal
Power

6 | P a g e COMM-20130522-67922 | July 2014
U.S. statutes [26 USC § 48 (c) (3)] as a system “which uses the same energy source for the
simultaneous or sequential generation of electrical power, mechanical shaft power, or both, in
combination with the generation of steam or other forms of useful thermal energy (including heating
and cooling applications), and which produces—
at least 20 percent of its total useful energy in the form of thermal energy which is not used
to produce electrical or mechanical power (or combination thereof), and
at least 20 percent of its total useful energy in the form of electrical or mechanical power (or
combination thereof), and
the energy efficiency percentage of which exceeds 60 percent.”
As discussed below, most CHP systems have typical efficiencies of 65-80 percent.
There are two major classifications of CHP systems:
Topping-cycle systems produce electricity first, then recover the excess thermal energy for
heating or cooling applications (See Figure 5). A topping cycle may use an internal
combustion engine, gas turbine, steam turbine, microturbine or fuel cell.
Bottoming-cycle systems, also known as “waste heat to power,” use waste heat from an
existing process to produce electricity (See Figure 6). A bottoming cycle may use the heat
source to produce electricity using an organic rankine cycle or backpressure steam turbine.
Figure 5. Topping Cycle CHP
Source: Center for Sustainable Energy website
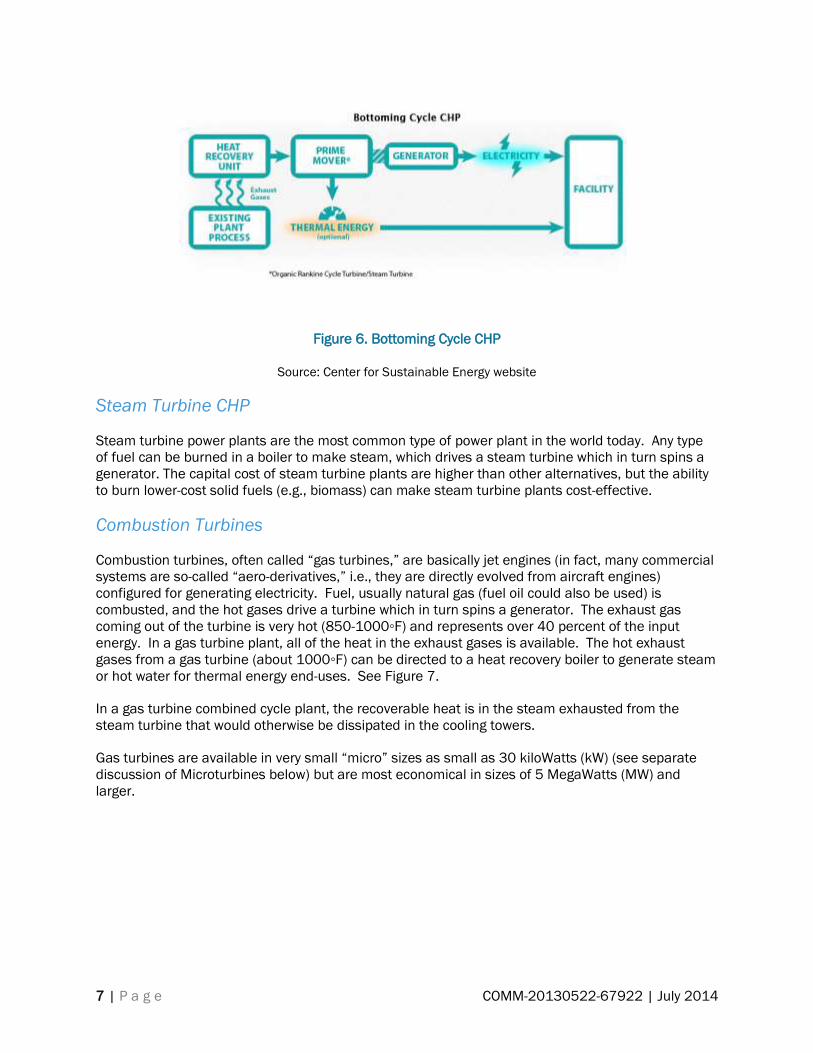
7 | P a g e COMM-20130522-67922 | July 2014
Figure 6. Bottoming Cycle CHP
Source: Center for Sustainable Energy website
Steam Turbine CHP
Steam turbine power plants are the most common type of power plant in the world today. Any type
of fuel can be burned in a boiler to make steam, which drives a steam turbine which in turn spins a
generator. The capital cost of steam turbine plants are higher than other alternatives, but the ability
to burn lower-cost solid fuels (e.g., biomass) can make steam turbine plants cost-effective.
Combustion Turbines
Combustion turbines, often called “gas turbines,” are basically jet engines (in fact, many commercial
systems are so-called “aero-derivatives,” i.e., they are directly evolved from aircraft engines)
configured for generating electricity. Fuel, usually natural gas (fuel oil could also be used) is
combusted, and the hot gases drive a turbine which in turn spins a generator. The exhaust gas
coming out of the turbine is very hot (850-1000◦F) and represents over 40 percent of the input
energy. In a gas turbine plant, all of the heat in the exhaust gases is available. The hot exhaust
gases from a gas turbine (about 1000◦F) can be directed to a heat recovery boiler to generate steam
or hot water for thermal energy end-uses. See Figure 7.
In a gas turbine combined cycle plant, the recoverable heat is in the steam exhausted from the
steam turbine that would otherwise be dissipated in the cooling towers.
Gas turbines are available in very small “micro” sizes as small as 30 kiloWatts (kW) (see separate
discussion of Microturbines below) but are most economical in sizes of 5 MegaWatts (MW) and
larger.

8 | P a g e COMM-20130522-67922 | July 2014
Figure 7. Combustion Turbine CHP
Internal Combustion Engines
Internal combustion engines (ICE), sometimes called “reciprocating engines”, can be designed for
CHP. In an ICE, a generator is attached to the shaft of an internal combustion engine. Heat is
recovered when the hot exhaust gas is cooled in a heat recovery boiler. Heat can also be recovered
from the engine cooling water and oil lubrication system. In addition, heat can be recovered from
other devices (turbocharger and intercooler). Both gaseous and liquid fuels can be used in
reciprocating engines. See Figure 8.
Figure 8. Internal Combustion Engine CHP
Compressor Turbine
Combustor
Air
Fuel
Exhaust gas
Heat recoveryboiler
Process heating supply
Process heating return
Generator
Exhaust stack
~
ReciprocatingHeat recovery
boiler engine
Exhaust gas
water
cooler
Process heatingreturn
Process heatingsupply
Jacket Oil
Inter

9 | P a g e COMM-20130522-67922 | July 2014
There are two types of ICEs based on the relative “richness” of the combustion air:
Rich burn engines operate with a relatively high fuel to air ratio, are typically used in smaller
sizes and commercial CHP systems, and are offered around 100 kW. Rich burn engines are
marketed with integrated emissions control systems, usually a three way catalyst and an
engine control module. Thermal energy is typically available as hot water.
Lean burn engines operate with excess air to limit nitrogen oxide (NOx) formation, are
typically used in larger sizes. These systems are economical in sizes from 800‐5,000 kW.
Larger engines are also available. Thermal energy is usually available as hot water, but
steam recovery is also an option.
Organic Rankine Cycle
Organic rankine cycle (ORC) is a technology for generating power that is similar to a steam turbine
except that the working fluid is a volatile organic fluid, such as isopentane, rather than steam. ORC
uses a low-temperature (about 200°F and greater), low-pressure energy source to heat a thermal oil.
The heat source could be any of a range of heat sources, e.g., biomass combustion, industrial waste
heat, solar collectors, geothermal hot water, etc. The heat is then used to boil a compressed working
fluid that has a lower boiling point than water (such as pentane or other volatile organic compound).
The pressurized vapor then drives a turbine-generator to produce electricity.
Figure 9 illustrates the ORC process:
A heat source heats thermal oil in a closed circuit. Although this graphic indicates the heat
source as gas turbine exhaust, as noted above it could be any of a range of low temperature
heat sources.
The thermal oil evaporates an organic working fluid in a heat exchanger system (pre-heater
and evaporator).
Organic vapor expands in the turbine, producing mechanical energy, which is used to
produce electric energy through a generator.
The vapor is then cooled and condensed in a closed condenser loop. The condenser water
warms to about 175 - 195°F and can be used for different applications requiring heat.
The condensed organic fluid is pumped back into the regenerator to close the circuit and
restart the cycle.
When ORC is driven by waste heat, it is classified as “bottoming cycle” CHP. When driven with heat
from biomass combustion, it is considered “topping cycle” CHP.
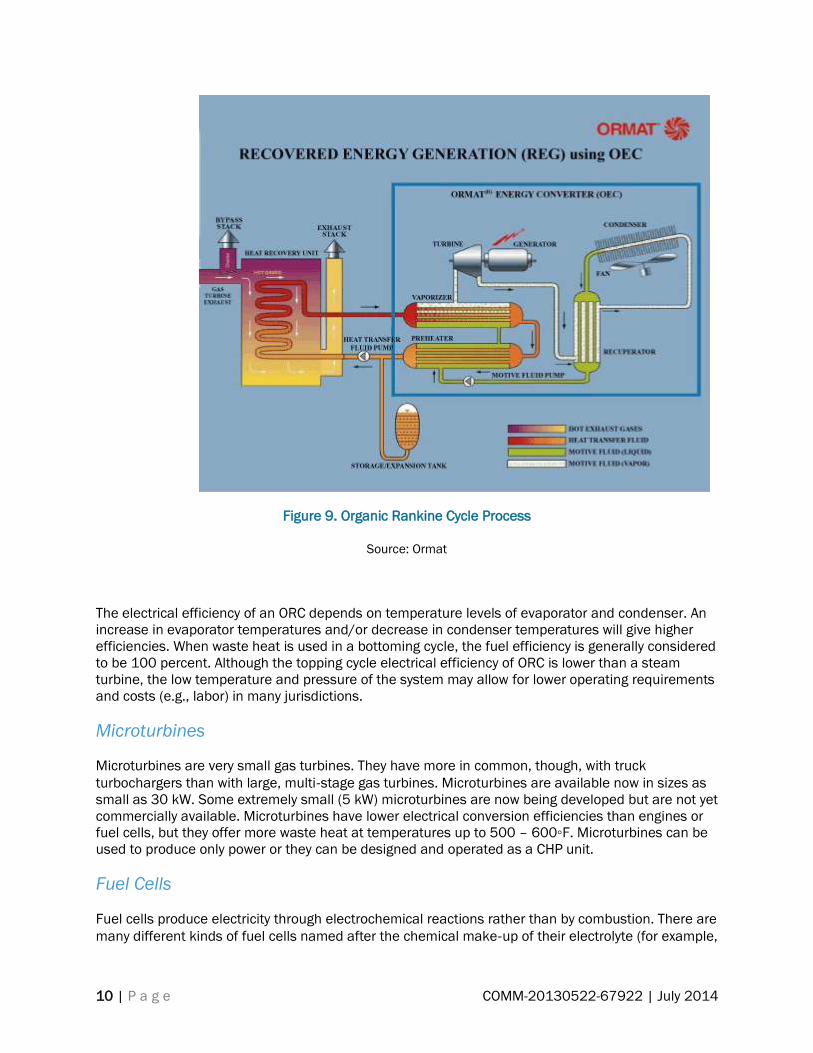
10 | P a g e COMM-20130522-67922 | July 2014
Figure 9. Organic Rankine Cycle Process
Source: Ormat
The electrical efficiency of an ORC depends on temperature levels of evaporator and condenser. An
increase in evaporator temperatures and/or decrease in condenser temperatures will give higher
efficiencies. When waste heat is used in a bottoming cycle, the fuel efficiency is generally considered
to be 100 percent. Although the topping cycle electrical efficiency of ORC is lower than a steam
turbine, the low temperature and pressure of the system may allow for lower operating requirements
and costs (e.g., labor) in many jurisdictions.
Microturbines
Microturbines are very small gas turbines. They have more in common, though, with truck
turbochargers than with large, multi‐stage gas turbines. Microturbines are available now in sizes as
small as 30 kW. Some extremely small (5 kW) microturbines are now being developed but are not yet
commercially available. Microturbines have lower electrical conversion efficiencies than engines or
fuel cells, but they offer more waste heat at temperatures up to 500 – 600◦F. Microturbines can be
used to produce only power or they can be designed and operated as a CHP unit.
Fuel Cells
Fuel cells produce electricity through electrochemical reactions rather than by combustion. There are
many different kinds of fuel cells named after the chemical make‐up of their electrolyte (for example,

11 | P a g e COMM-20130522-67922 | July 2014
phosphoric acid, molten carbonate, solid oxide, and solid polymer electrolyte). Phosphoric acid and
molten carbonate are two types of fuel cells which are commercially available.
CHP System Analysis
A representative sample of commercially available systems was selected to profile performance and
cost characteristics in CHP applications. CHP technologies to be evaluated in this study range in
capacity from approximately 30 to 40,000 kW and are summarized in Table 7.
Table 7. Selected CHP Technologies for Analysis
Category FuelMarket
Sectors
Range
(electric)CHP Technologies
30 kW MT
100 kW ICE
200 kW PAFC
800 kW ICE
250 kW MT x 3
300 kW MCFC x 2
3 MW ICE
3 MW GT
1.5 MW MCFC
5 MW ICE
10 MW GT
NG.5 NG C, I, DE > 20 MW 40 MW GT
WH.1 WH I < 5 MW 1 MW ORC
B.1 B C, I, DE 1-5 MW 3 MW ST
B.2 B C, I, DE 5-20 MW 10 MW ST
B.3 B C, I, DE > 20 MW 40 MW ST
Abbreviations
Market Sectors Technologies
C = Commercial MT = Microturbine
I = Industrial ICE = Internal combustion engine
DE = District Energy PAFC = phosphoric acid fuel cell
Fuels MCFC = molten carbonate fuel cell
NG = Natural Gas GT = gas turbine
B = Biomass ST = steam turbine
WH = Waste Heat ORC = organic rankine cycle
NG.1 NG C, I 30-500 kW
NG.2 NG C, I 500-1,000 kW
NG.3 NG C, I, DE 1-5 MW
NG.4 NG C, I, DE 5-20 MW
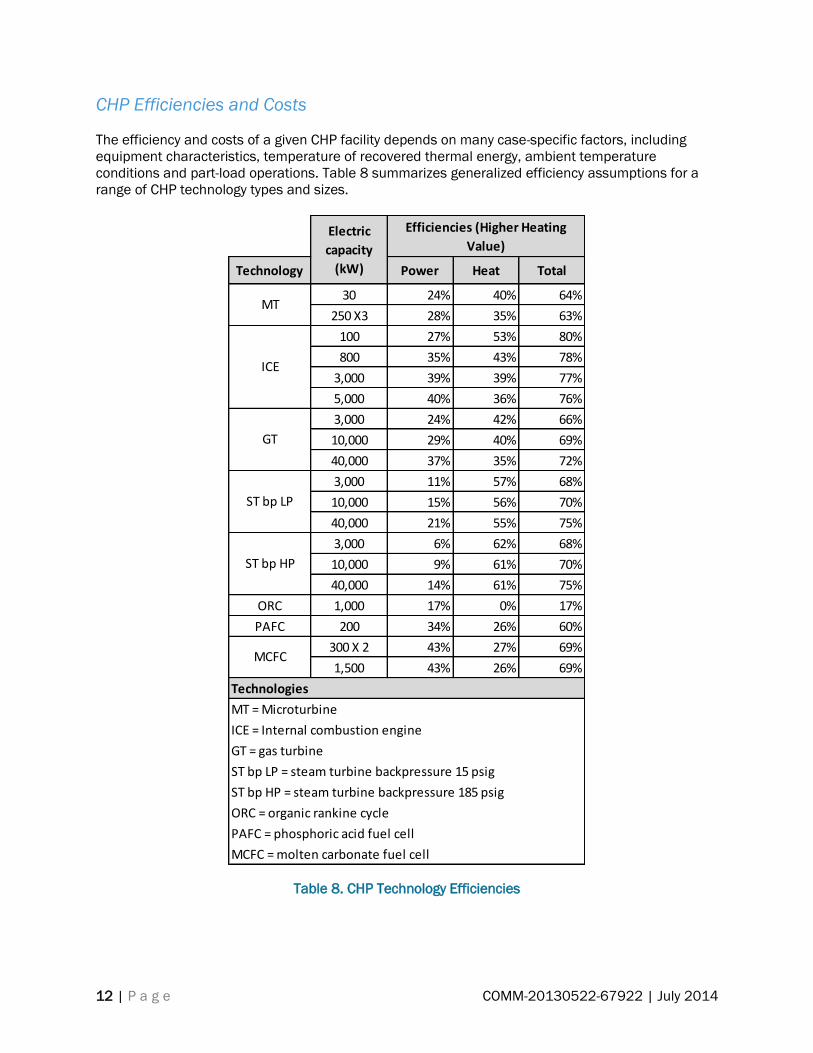
12 | P a g e COMM-20130522-67922 | July 2014
CHP Efficiencies and Costs
The efficiency and costs of a given CHP facility depends on many case-specific factors, including
equipment characteristics, temperature of recovered thermal energy, ambient temperature
conditions and part-load operations. Table 8 summarizes generalized efficiency assumptions for a
range of CHP technology types and sizes.
Table 8. CHP Technology Efficiencies
Efficiencies (Higher Heating
Value)
Technology Power Heat Total
30 24% 40% 64%
250 X3 28% 35% 63%
100 27% 53% 80%
800 35% 43% 78%
3,000 39% 39% 77%
5,000 40% 36% 76%
3,000 24% 42% 66%
10,000 29% 40% 69%
40,000 37% 35% 72%
3,000 11% 57% 68%
10,000 15% 56% 70%
40,000 21% 55% 75%
3,000 6% 62% 68%
10,000 9% 61% 70%
40,000 14% 61% 75%
ORC 1,000 17% 0% 17%
PAFC 200 34% 26% 60%
300 X 2 43% 27% 69%
1,500 43% 26% 69%
Technologies
MT = Microturbine
ICE = Internal combustion engine
GT = gas turbine
ST bp LP = steam turbine backpressure 15 psig
ST bp HP = steam turbine backpressure 185 psig
ORC = organic rankine cycle
PAFC = phosphoric acid fuel cell
MCFC = molten carbonate fuel cell
ST bp HP
MCFC
Electric
capacity
(kW)
MT
ICE
GT
ST bp LP

13 | P a g e COMM-20130522-67922 | July 2014
Basic Statistics
Compared to all other U.S. states, Minnesota is slightly above average when it comes to number of
CHP sites and total installed capacity. Minnesota has a total of 52 CHP sites and about 962 MW
in installed capacity (ICF CHP Database). Total electric generation capacity in Minnesota in 2012
was 15,447 MW (EIA Electricity Data). There have not been any new installations in Minnesota
over the past few years—the most recent CHP installations were in 2010.
CHP facilities in Minnesota are used in a variety of applications, as summarized in Table 9. Perhaps
unsurprisingly, the largest portion of CHP capacity resides in energy-intensive industrial settings, with
district energy systems also representing a significant share. There are also a significant number of
smaller CHP facilities installed in a variety of applications across the state, including institutional
uses at hospitals, universities, and waste treatment plants. Further information on existing CHP
facilities in Minnesota is provided in a companion report (FVB Energy and ICF International 2014).
Table 9. Existing Minnesota CHP Applications
Source: ICF CHP Database
Application # Sites Capacity (MW)
Chemicals 2 252.0
Paper 8 247.0
District Energy 7 182.9
Mining 1 105.0
Food Processing 8 58.9
Utilities 1 48.6
Hospitals 4 30.1
College/Universities 2 16.2
Wastewater Treatment 4 7.2
Solid Waste 2 5.0
Agriculture 7 4.9
Military 2 2.2
Misc. Manufacturing 2 1.3
Amusement/Recreation 1 0.1
Courts/Prisons 1 0.1
Total 52 961.5

14 | P a g e COMM-20130522-67922 | July 2014
CHP Potential
The potential market for CHP is much larger than what is currently installed. As described in a
companion report (Assessment of the Technical and Economic Potential for CHP in Minnesota), the
estimated technical potential9 for additional CHP exceeds 3,000 MW, as summarized in Table 10.
Of the total technical potential, 1,720 MW is in the industrial sector, 561 MW in the institutional
sector and 769 MW in the commercial sector. See Table 11.
Table 10. Minnesota CHP Technical Potential by Electric Utility
Source: ICF International
Table 11. Minnesota CHP Technical Potential by Sector
Source: ICF International
The technical potential estimates consider only what is technologically possible rather than what is
economically feasible. There are many facilities that could, in theory, make use of CHP, but due to a
variety of factors the economic potential for CHP is less than the technical potential. As further
described below under “Policy Analysis,” the economic potential10 for additional CHP with no
changes in policy is estimated to be about 250 MW by the year 2040. Further information on CHP
technical and economic potential in Minnesota is provided in a companion report (FVB Energy and
ICF International 2014).
9 The technical potential is an estimation of market size constrained only by technological limits — the ability of
CHP technologies to fit customer energy needs. CHP technical potential is calculated in terms of CHP electrical
capacity that could be installed at existing and new industrial and commercial facilities based on the estimated
electric and thermal needs of the site. The technical market potential does not consider screening for
economic rate of return, or other factors such as ability to retrofit, owner interest in applying CHP, capital
availability, natural gas availability, or variation of energy consumption within customer application/size class.
10 The economic potential for CHP is quantified using simple payback for CHP systems. Payback is defined as
the amount of time (i.e. number of years) before a system can recoup its initial investment. For each site
included in the technical potential analysis, an economic payback is calculated based on the appropriate CHP
system cost and performance characteristics and energy rates for that system size and application.
Current Technical Potential (MW)
Utility 50-500 kW 500-1 MW 1-5 MW 5-20 MW >20 MW Total
Northern States (Xcel) 409 354 431 389 483 2,067
MN Power 50 33 51 70 267 470
Alliant 12 11 46 52 25 146
Otter Tail 24 34 29 20 0 106
Muni/Co-op 50 49 60 31 69 259
Total 545 481 616 562 844 3,049
50-500 kW 500-1 MW 1-5 MW 5-20 MW >20 MW Total
Industrial 146 97 317 430 730 1,720
Institutional 118 62 155 112 114 561
Commercial 282 323 144 21 - 769
Total 545 481 616 562 844 3,049

15 | P a g e COMM-20130522-67922 | July 2014
Key Challenges
This section describes the challenges facing CHP including technical, economic, financial and
institutional barriers.
Unfavorable Spark Spread
A fundamental economic test for CHP is “spark spread” – the difference between the value to the
generator of the electricity and thermal energy produced and the cost of the fuel needed to produce
that electricity. In general, higher grid-provided electricity prices and lower natural gas prices make
CHP projects more economic.
Spark spreads are usually calculated with the following equation:
SS = APP + (ATFP / E / PHR / 3.413 MMBtu/MWH) – (FP x HR)
Where: SS = Spark spread ($/MWh)
APP = Avoided power price ($/MWh)
ATFP = Avoided thermal production fuel price ($/MMBtu)
E = Thermal boiler efficiency (percent)
PHR = Power to Heat Ratio
FP = CHP fuel price ($/MMBtu)
HR = CHP heat rate (MMBtu/MWh)
The value of the electricity generated may be a weighted average of avoided purchased power and
sales of excess power. Minnesota has relatively low electricity costs, with an average retail (all
consumers) rate lower than the national average, as illustrated in Figure 10.
Minnesota natural gas and electricity prices are lower than the national averages for each end use
sector. Table 12 shows the comparative Minnesota and USA average prices for natural gas and
electricity for each end use sector and for power generation in 2011.
Spark spread is affected by both the particular CHP technology and sector in which the CHP facility
would be located. The heat rate (BTU’s of fuel required to produce a kWh of electricity) varies among
CHP technologies, with lower heat rates (higher electric generation efficiencies) helping to increase
the spark spread and make the economics of the CHP system more attractive. Industrial power
prices are generally lower, thus reducing the spread. (On the other hand, economies of scale in
larger industrial CHP projects can enhance the economics of CHP compared with smaller commercial
sector projects.)
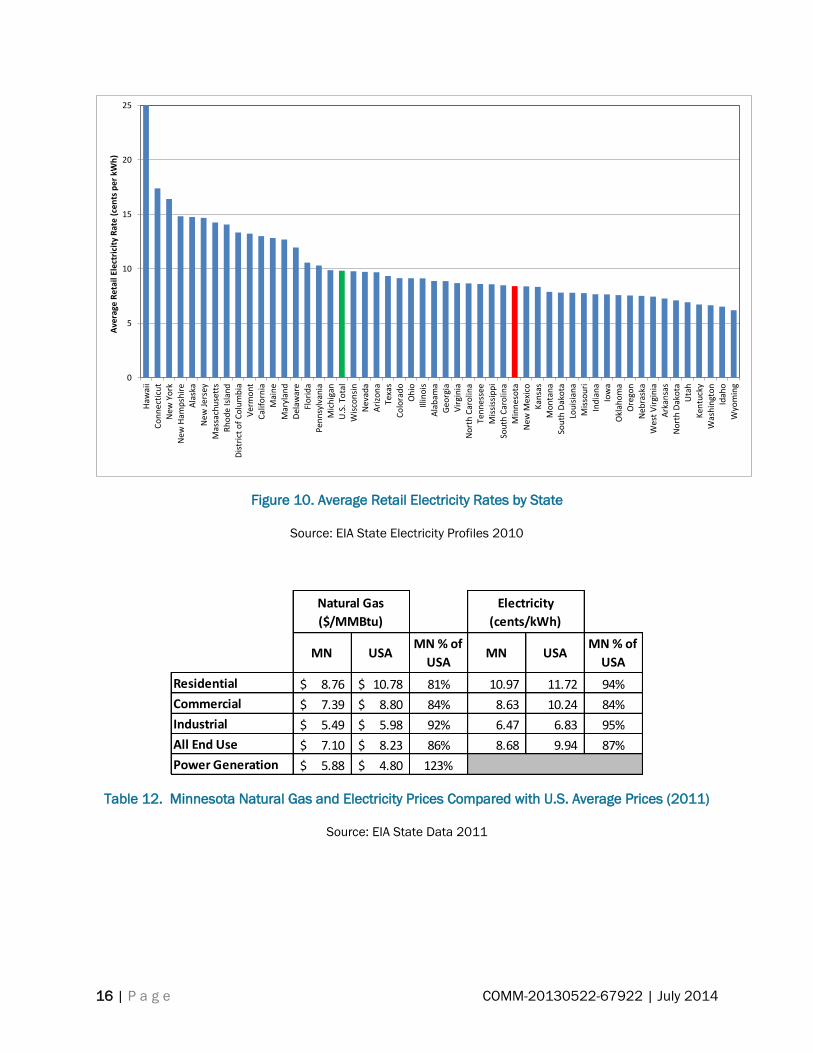
16 | P a g e COMM-20130522-67922 | July 2014
Figure 10. Average Retail Electricity Rates by State
Source: EIA State Electricity Profiles 2010
Table 12. Minnesota Natural Gas and Electricity Prices Compared with U.S. Average Prices (2011)
Source: EIA State Data 2011
0
5
10
15
20
25
Haw
aii
Co
nn
ecti
cut
New
Yo
rkN
ew H
amp
shir
eA
lask
aN
ew J
erse
yM
assa
chu
sett
sR
ho
de
Isla
nd
Dis
tric
t o
f C
olu
mb
iaV
erm
on
tC
alif
orn
iaM
ain
eM
aryl
and
Del
awar
eFl
ori
da
Pen
nsy
lvan
iaM
ich
igan
U.S
. To
tal
Wis
con
sin
Nev
ada
Ari
zon
aTe
xas
Co
lora
do
Oh
ioIll
ino
isA
lab
ama
Geo
rgia
Vir
gin
iaN
ort
h C
aro
lina
Ten
nes
see
Mis
siss
ipp
iSo
uth
Car
olin
aM
inn
eso
taN
ew M
exic
oK
ansa
sM
on
tan
aSo
uth
Dak
ota
Lou
isia
na
Mis
sou
riIn
dia
na
Iow
aO
klah
om
aO
rego
nN
ebra
ska
Wes
t V
irgi
nia
Ark
ansa
sN
ort
h D
ako
taU
tah
Ken
tuck
yW
ash
ingt
on
Idah
oW
yom
ing
Ave
rage
Ret
ail E
lect
rici
ty R
ate
(cen
ts p
er k
Wh
)
Natural Gas
($/MMBtu)
Electricity
(cents/kWh)
MN USAMN % of
USAMN USA
MN % of
USA
Residential 8.76$ 10.78$ 81% 10.97 11.72 94%
Commercial 7.39$ 8.80$ 84% 8.63 10.24 84%
Industrial 5.49$ 5.98$ 92% 6.47 6.83 95%
All End Use 7.10$ 8.23$ 86% 8.68 9.94 87%
Power Generation 5.88$ 4.80$ 123%

17 | P a g e COMM-20130522-67922 | July 2014
The effective spark spread for any given CHP system is one of the basic assessments conducted in a
feasibility assessment. If the spark spread is not significant enough, and the total benefits of
generating power onsite are thus not larger than the cost of fuel required to generate that power, the
project will likely not go further. Tools such as discounts on natural gas or additional revenue
streams for excess power production may improve the spark spreads of CHP systems.
Lack of Market for Excess Power
To maximize CHP efficiency it is necessary to size and operate the CHP system to follow the thermal
load of the thermal energy user. However, in many facilities this can result in significant production
of power in excess of the host site’s needs, and the power will only be produced if a suitable buyer
for the power is identified. Consequently, the price to be received for sale of the excess power is
often a crucial factor in the financial feasibility of a CHP project. Unless owned by the electric utility,
CHP systems in Minnesota cannot sell electricity on a retail basis, so the revenue for excess CHP
power sales is limited to the price the electric utility is willing to pay.
Absent an opportunity to sell excess power, the size of a CHP system at a large industrial facility with
high thermal demand will likely be constrained by the onsite power needs. The facility will not be
incentivized to build a CHP system that produces any more power than it needs onsite. This can
effectively reduce the system’s efficiency, because the system will not be properly matched and
sized to the facility’s thermal needs.
One policy approach to increasing the value of excess power is net metering. Net metering was
originally implemented in order to encourage investment in renewable energy resources such as
solar and wind. However, in some states it is also applied to smaller CHP projects. The following
discussion of key concepts is adapted from Energy Resources Center 2014.
Net metering allows for the flow of electricity both to and from the customer – typically through a
single, bi-directional meter – allowing qualified distributed generation customers to export electricity
to the grid during times when their generation exceeds their on-site consumption. In the instances
during a billing cycle when a customer’s generation exceeds their electric purchases the net excess
generation (NEG) in the form of a kiloWatt-hour (kWh) is stored in a bank to be credited against
future kWh purchases. In effect, the customer uses excess generation to offset electricity that the
customer otherwise would have to purchase at the utility’s full retail rate. Some states require
utilities to monetarily credit all NEG that’s been stored for a specific period of time, other states
expire NEG credits after a set amount of time while some allow for indefinite rollover. The monetary
rate at which NEG is credited can vary depending on state regulations and utility policy from the
average retail rate to the much lower PURPA avoided rate.
While net metering rates allow customers to reduce the energy potion of their bill, there is no
mechanism by which billing demand is similarly reduced. A net metered customer must still pay for
their maximum level of demand imposed on the grid through the demand charge in their full-
requirements rate. Because net metering eligible technologies have historically been either quite
small or limited to low load factor (renewable) applications, the use of the demand charge was an
appropriate method for recovering incurred capacity costs. However, difficulties in recovering
incurred capacity costs arise when net metering laws include technologies with high load factors –
like CHP systems – that are able to reliably remove load from the grid for great durations but that
also need utility service for planned maintenance or unplanned outages. Standby rates have
sometimes been used to recover incurred capacity costs that could otherwise not be recovered
through regular demand charges, but this practice varies by state.

18 | P a g e COMM-20130522-67922 | July 2014
Cost of Capital and Internal Investment Priorities
CHP requires a significant capital investment, and the equipment has a long life – generally over 15
years. The investment required for CHP will generally come from some combination of debt and
equity. Access to debt capital, and the associated interest rate, will vary significantly from one
organization to another. Further, credit availability will vary depending on broader economic
conditions. Access to internal equity funding is affected by a company’s financial condition and
internal competition with other potential investments. CHP is not regarded as part of most end-users’
core business focus and, as such, is sometimes subject to a high internal investment “hurdle rate”,
i.e. the rate of return a project is required to meet in order to get capital funding. Another way to
express this is that for many organizations the payback period required to “green light” a CHP project
is very short.
Simple payback is a commonly understood measure of financial viability. It is calculated by dividing
the initial capital investment by the annual operating savings.
Another way to quantify investment return thresholds, for private sector businesses, is Return on
Equity (ROE). This is the return to equity investors on a discounted cash flow basis. ROE cannot be
compared directly with simple payback, because typically companies do not fund 100 percent with
equity; instead they “lever” the equity return by borrowing some of the funds. The ratio between debt
and equity varies depending on the company and the project. A typical capital structure for the
electric utility industry is 45 percent debt and 55 percent equity (EIA NEMS Model 2013).
The appropriate comparison with simple payback is Weighted Average Cost of Capital (WACC), which
takes into account not only ROE but also the after-tax cost of debt. WACC is the weighted average
cost of repaying the capital invested or borrowed to build a CHP project. WACC is calculated based
on the relative portions of debt and equity, as follows:
Debt interest rate = IR
Return on Equity = ROE
Debt as percent of total capital = DR
Corporate tax rate = T
Weighted average cost of capital = [(IR x DR) x (1 – T)] + [ROE x (1 - DR)]
Figure 11 shows the relationship between simple payback and WACC.
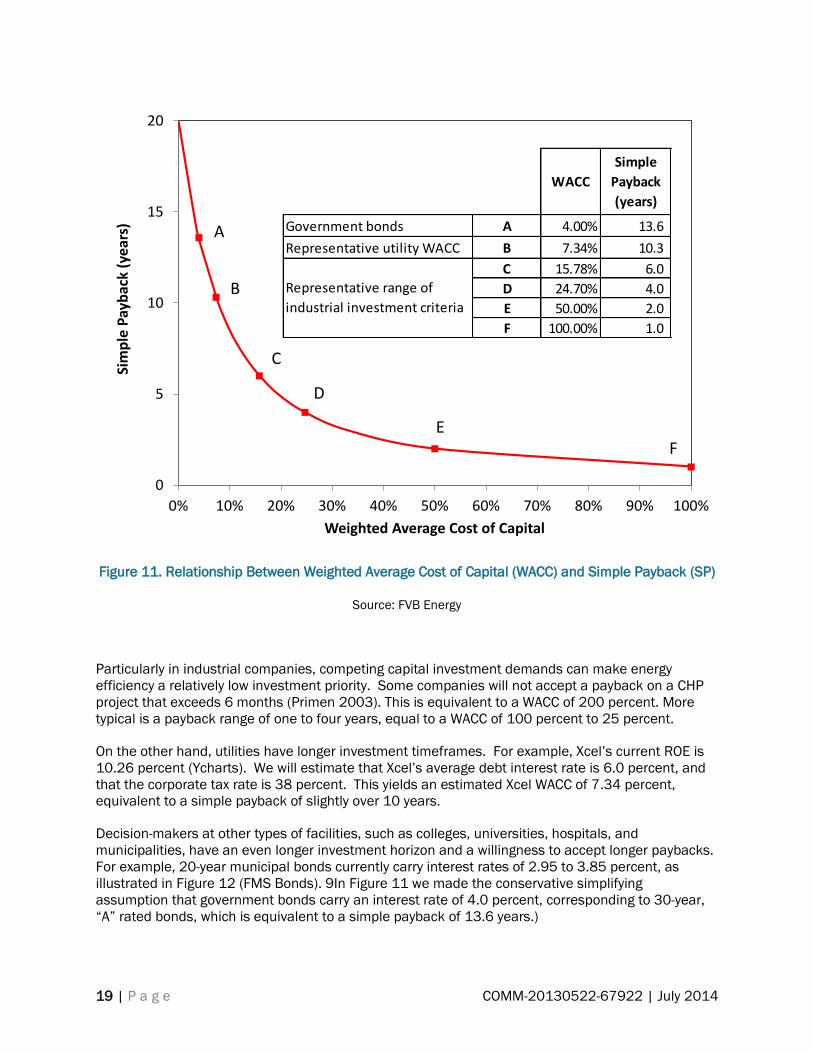
19 | P a g e COMM-20130522-67922 | July 2014
Figure 11. Relationship Between Weighted Average Cost of Capital (WACC) and Simple Payback (SP)
Source: FVB Energy
Particularly in industrial companies, competing capital investment demands can make energy
efficiency a relatively low investment priority. Some companies will not accept a payback on a CHP
project that exceeds 6 months (Primen 2003). This is equivalent to a WACC of 200 percent. More
typical is a payback range of one to four years, equal to a WACC of 100 percent to 25 percent.
On the other hand, utilities have longer investment timeframes. For example, Xcel’s current ROE is
10.26 percent (Ycharts). We will estimate that Xcel’s average debt interest rate is 6.0 percent, and
that the corporate tax rate is 38 percent. This yields an estimated Xcel WACC of 7.34 percent,
equivalent to a simple payback of slightly over 10 years.
Decision-makers at other types of facilities, such as colleges, universities, hospitals, and
municipalities, have an even longer investment horizon and a willingness to accept longer paybacks.
For example, 20-year municipal bonds currently carry interest rates of 2.95 to 3.85 percent, as
illustrated in Figure 12 (FMS Bonds). 9In Figure 11 we made the conservative simplifying
assumption that government bonds carry an interest rate of 4.0 percent, corresponding to 30-year,
“A” rated bonds, which is equivalent to a simple payback of 13.6 years.)
0
5
10
15
20
0% 10% 20% 30% 40% 50% 60% 70% 80% 90% 100%
Sim
ple
Pay
bac
k (y
ear
s)
Weighted Average Cost of Capital
B
C
D
E
A
F
WACC
Simple
Payback
(years)
Government bonds A 4.00% 13.6
Representative utility WACC B 7.34% 10.3
C 15.78% 6.0
D 24.70% 4.0
E 50.00% 2.0
F 100.00% 1.0
Representative range of
industrial investment criteria

20 | P a g e COMM-20130522-67922 | July 2014
Figure 12. Municipal General Obligation Bond Yields By Bond Rating and Term (July 29, 2014)
Source: FMS Bonds
Figure 13 shows the percentage share of potential users that would be willing to implement CHP
based on a given simple payback period, based on a 2003 survey (Primen 2003). This survey data
is now a decade old, and post-recession attitudes are likely further reducing payback thresholds. To
our knowledge no more recent surveys of this nature have been undertaken. In 2012, ACEEE
engaged a broad group of industrial decision-makers in an evaluation of a broad range of issues
associated with energy efficiency decision-making, although it did not address payback period
thresholds (Russell and Young 2012).
CHP systems have recently reported payback periods from 3.5 to 10 years, depending on the facility,
technology, local spark spreads, and other variables. It is very common for CHP systems to have
simple payback periods of four to six years. It is important to remember, however, that CHP systems
may be in place for decades (Chittum and Farley 2013).
2.0
2.5
3.0
3.5
4.0
4.5
AAA AA A
Bb
on
d in
tere
st r
ate
(pe
rce
nt)
Bond Rating
20 year
30 year

21 | P a g e COMM-20130522-67922 | July 2014
Figure 13. Results of Market Survey on Acceptable CHP Payback Periods
Source: Primen 2003
Economic Uncertainty
Analysis of the economic feasibility of CHP must be based on assumptions regarding future values of
a wide range of factors, including:
Price of fuel used for CHP;
Prices of fuels otherwise used for heat production, and/or value of heat sold to other users;
Prices of electricity otherwise purchased to meet power requirements;
Prices of electricity sold to the grid or to other users;
Projected growth in requirements for electricity and thermal energy, which in turn is based on
assumptions about future economic conditions;
Changes in utility regulation; and
Changes in environmental regulations, including criteria air pollutants and greenhouse gases
(GHG).
The uncertainties associated with these variables make decision-making challenging and, coupled
with the other barriers discussed here, tend to discourage investment in CHP. To the extent that the
decision criterion is a very short payback, as discussed above, the economic feasibility analysis is
simplified because in essence it is based only on current values for key economic parameters.
0%
10%
20%
30%
40%
50%
60%
70%
80%
90%
100%
6 mos. 1 yr. 2 yrs. 3 yrs. 4 yrs. 5 yrs. 6 to 10yrs.
11+yrs.
Ave
rage
% A
ccep
tin
g G
iven
Pay
bac
k
Simple Payback (years)
California
National

22 | P a g e COMM-20130522-67922 | July 2014
Lack of a Utility Value Proposition
Many investor-owned electric utilities tend to view CHP as an economic threat because traditional
utility business models link electricity sales to cost recovery and revenues, and a CHP-using facility
will typically require much less utility-provided electricity than it did prior to CHP system installation.
Most facilities that install CHP remain connected to the grid and do need to rely on the local power
utility for supplemental power and/or for standby and back-up service during CHP system outages or
planned maintenance. Consequently, utility attitudes, policies, requirements and tariffs related to
this backup and supplemental power can make or break a CHP project’s economics. The following
discussion summarizes the potential value proposition that CHP represents for utilities, drawing on a
recent report by ACEEE (Chittum and Farley 2013):
“Recognizing the substantial remaining potential for CHP and the substantial challenges
facing its increased deployment, President Obama issued an Executive Order in 2012 calling
for 40 GW of new CHP by 2020. As a result of the order, the U.S. Department of Energy is
supporting regional and state efforts to identify CHP opportunities and address existing
barriers. One of the major barriers identified is the fact that while utilities could play an
important role in CHP deployment, they are often not economically incentivized to do so.
Utilities are well-versed in making long-term investments, and they are well-positioned to
encourage strategically sited CHP that can provide major benefits to the grid. Utilities have
existing relationships with most of the customers that would be good candidates for CHP,
and they can enjoy many of the benefits of CHP much more directly than individual CHP
users might be able. Utilities also have the ability to use ratepayer funds to support projects
that will provide system-wide benefits, and their CHP programs can help accelerate market
adoption of the technology, all while providing economic and environmental benefits to all
energy system users.
Despite these capabilities, utilities — especially electric utilities — are structured and
regulated in a manner that often discourages them from fully monetizing the benefits of
CHP. They are also often encouraged to make investments in centralized generation
resources rather than distributed generation, realizing greater rates of return on the
centralized investments.
CHP offers tremendous direct and indirect benefits to utilities. Most of these benefits are not
fully valued today. These include:
CHP’s low cost and more efficient power relative to more traditional centralized
power plant resources and related transmission investments;
CHP’s ability to adapt to different fuels depending on availability;
The speed with which CHP can be deployed relative to other generation and
transmission resources;
CHP’s ability to avoid significant line losses on transmission and distribution lines;
The reduced emissions compliance costs resulting from CHP’s increased efficiency
and avoided line losses;
A reduced strain on distribution and transmission systems and a reduced need for
distribution and transmission infrastructure and reserve margins;
CHP’s ability to function as a capacity resource;
CHP’s ability to balance system power fluctuations and provide ancillary services;
The increased and higher load natural gas sales benefits to natural gas utilities; and

23 | P a g e COMM-20130522-67922 | July 2014
The ability to use CHP to supplement and support greater renewable energy
deployment”.
ACEEE has also published two associated reports, one focusing on CHP benefits for electric utilities
(Chittum 2013a) and the other focusing on benefits for natural gas utilities (Chittum 2013b).
Frequently, utilities are generally unable to take advantage of these benefits. Changes in policies
and regulations would enable utilities to better monetize these benefits, increasing the likelihood
that utilities could begin to view CHP systems as true economic opportunities rather than threats.
Challenging Interconnection Standards
The technical requirements, procedures, and agreements for interconnection of CHP and other
distributed generation are commonly referred to as interconnection standards. Policies, regulations,
and rules governing the interconnection of distributed generation may be established by state law
and, for regulated utilities, may be established and enforced by the state public utility commission
(PUC). The Federal Energy Regulatory Commission (FERC), however, may have jurisdiction over
distributed generation interconnected at the distribution or transmission level if it involves sales for
resale of electric energy in interstate commerce by public utilities.
Some states lack interconnection standards entirely, or have very general interconnection standards
that do not allow for a clear path for certain technologies and applications. This, as well as size and
fuel limitations, can make interconnection of a CHP system very challenging. Fortunately, as
discussed below under “Current Minnesota Policies and Programs,” Minnesota’s interconnection
standards do not have many of these issues, though there is room for improvement.
The most effective interconnection standards have different tiers with different requirements for CHP
systems of different sizes, reflecting the fact that smaller systems are often less complex technically
to interconnect. Connecting a 25 MW system to the grid might involve significant technical and
safety challenges, and it would not necessarily be appropriate for a 50 kW system to be subject to
the same oversight procedures. Allowing different tiers essentially provides a “fast track” for smaller
systems, and longer, more detailed analysis of the more complex interconnection of larger systems.
Unfavorable Standby Rates
Most facilities with CHP require service from the local utility for:
Supplementary power when load is greater than the CHP output;
Back-up supply during planned scheduled maintenance of the CHP system; and
Back-up supply in case of unexpected, unscheduled outages of the CHP system.
The set of tariffs applying to customers with CHP or other distributed generation are sometimes
called “standby rates” or “partial requirements tariff.” High standby rates can discourage
implementation of CHP by reducing the net savings on electricity costs. Standby rates are further
discussed below under “Current Minnesota Policies and Programs”.

24 | P a g e COMM-20130522-67922 | July 2014
Lack of Recognition of Resiliency Benefits
Hurricanes Sandy (2012), Irene (2011), Gustav (2008), Ike (2008), Katrina (2005) and Wilma
(2005) brought power grids down, causing huge economic losses in output, income and
employment. The Northeastern blackout in 2003 was not caused by severe weather but by
transmission system failures, but also resulted in substantial economic losses as data centers,
factories, hospitals, offices and other employers shut down.
The economic losses from energy supply disruption from interruption of business operations are
enormous. For instance, economic research firm Moody’s Analytics attributed nearly $20 billion in
losses from suspended business activity just due to Superstorm Sandy (CNN Money 2012). Rutgers
recently published a report that estimates economic losses, not including damages to physical
structures, of approximately $11.7 billion in state Gross Domestic Product (Rutgers 2013). The study
found that overall GDP losses could have been reduced in New Jersey if there had been additional
backup sources of power such as CHP, which would have lessened the economic losses associated
with power outages.
The Electric Power Research Institute evaluated industrial and digital economy businesses to
determine the economic costs of power outages and power quality disturbances (EPRI 2001),
focusing on 3 sectors:
Digital Economy (DE) sector: comprised mainly of data storage and retrieval, data processing,
or research and development operations such as the telecommunications, data storage,
biotechnology, electronics manufacturing, and the financial industry.
Continuous Process Manufacturing (CPM) sector: comprised of manufacturing facilities that
continuously feed raw materials through an industrial process such as the paper, chemical,
petroleum, rubber and plastics, stone, clay, glass, and primary metals industries.
Fabrication and Essential Services (F&ES) sector: all other manufacturing industries, plus
utilities and transportation facilities, water and wastewater treatment, and gas utilities and
pipelines.
Although these three sectors only accounted for 17 percent of all U.S. businesses, they amounted to
40 percent of U.S. GDP. The study found that industrial and digital economy firms are losing about
$45.7 billion per year due to power outages, with an additional $6.7 billion in costs resulted from
power quality disturbances other than outages. The EPRI study concluded that the cost of power
outages for all industry combined is an estimated at $120 to $190 billion per year.
The total cost of business interruptions from the 2003 Northeastern blackout, which lasted 2 days,
have been estimated as follows: 1) Anderson Economic Group (Anderson and Geckil 2013) -- $4.5 to
$8.2 billion; 2) U.S. Department of Energy (Parks 2003) -- $6 billion; and 3) ICF Consulting (ICF
2003) -- $7 to $10 billion.
CHP and other local energy sources are inherently more resilient to disruption from natural disasters
or other events that interrupt electric energy supply from complex and interconnected grids.
Additionally, CHP systems can be designed to operate in “island” mode during a grid outage. CHP
and district energy systems have demonstrated that they can keep the power on, keep factories and
business running, and continue to keep people warm in the winter and cool in the summer even
when the power grid is down.
A recent report for Oak Ridge National Laboratory (ORNL 2013) notes, “When Superstorm Sandy
made landfall on the eastern coast of the United States –New Jersey, New York and Connecticut

25 | P a g e COMM-20130522-67922 | July 2014
were the most heavily hit areas. Extended power outages affected the region for days. However,
some commercial and industrial facilities in the area were able to power through Superstorm Sandy
due to onsite CHP.” CHP can also help key infrastructure such as water treatment facilities continue
functioning during a power outage. It is also important to note that hospitals and places of refuge
such as universities were also able to keep running due to CHP systems, which helped protect the
most vulnerable in the population.
These resiliency benefits are typically lacking from most cost-benefit analyses employed by the
individual facilities using CHP and the utilities in whose service territory a CHP system would be
deployed. So while the anecdotal evidence has been clear that CHP can provide highly critical
resiliency and reliability benefits during times of grid power outages, there is no mechanism in which
those benefits are specifically delineated. In contrast, the potential of the CHP system to fail is
embedded in every utility’s standby and backup power rates.
Lack of Recognition of Other Grid Benefits
CHP systems are typically located much closer to the end user than more traditional centralized
power plants. Additionally, many CHP systems are capable of ramping up to full output very quickly,
and are more nimble electric system assets than many traditional generation resources.
These two aspects of CHP systems provide numerous benefits to the grid at large. For instance, the
close proximity to end-users can dramatically reduce the losses of power along transmission and
distribution lines. On average, line losses in the U.S. are about 7 percent (EIA 2012), but research
suggests that losses are much higher during times of peak grid demand (Chittum and Farley 2013).
One analysis suggested that total losses during peak grid demand could rise to over 20 percent,
representing a startling loss for utilities (Lazar 2011). By siting CHP systems in the most constrained
areas of the grid, such dramatic losses could be reduced or avoided.
CHP systems are also well positioned to provide ancillary and capacity services to the grid. Ancillary
services are those that help stabilize grid voltage, and they must be capable of providing these
services in a timely manner – some as quickly as within one minute of the request. Each power
market has its own market for ancillary services, and CHP systems are selling their ancillary services
to these markets in some parts of the country (Chittum and Farley 2013). At present, however, the
use of CHP for such ancillary services is not at all widespread.
CHP can also operate as a critical capacity resource, providing cost-effective system capacity in
smaller increments than a single large centralized power plant. The efficiency benefits of increased
CHP deployment can also be bid into forward capacity markets that currently treat energy efficiency
as a capacity resource, such as PJM. CHP is not regularly assessed for its potential as a capacity
resource, but it could indeed provide such services around the country.
Lack of Expertise
Many potential adopters of CHP lack the information and expertise to:
Identify and assess the costs and benefits of CHP;
Develop a CHP project, including navigation of the institutional, technical, legal and financial
issues associated with these projects; and
Operate and maintain a CHP system.

26 | P a g e COMM-20130522-67922 | July 2014
These barriers can be overcome through the participation of third party CHP developers and
operators, but some organizations are reluctant to take on such a third party relationship, reducing
the amount of CHP deployed.
Natural Gas Pipeline Capacity
An issue that was raised by several people in the stakeholder discussions was the potential
constraint on CHP growth due to limited natural gas pipeline capacity in some areas. This issue was
not envisioned in the work plan for this study and there was no time for analysis of the extent to
which this might pose a significant issue for CHP growth.
Environmental Permitting
CHP may increase emissions on-site while reducing emissions regionally; CHP projects benefit from
policies that recognize and account for these savings. Air quality regulatory issues are discussed in
detail in Appendix B.
CHP installations must comply with a host of local and state zoning, environmental, health and safety
requirements at the site. These include rules on water quality, fire prevention, fuel storage,
hazardous waste disposal, worker safety and building construction standards. This requires
interaction with various local agencies including fire districts, air districts, and water districts and
planning commissions, many of which may have no previous experience with a CHP project and are unfamiliar with the technologies and systems (DOE 2013).
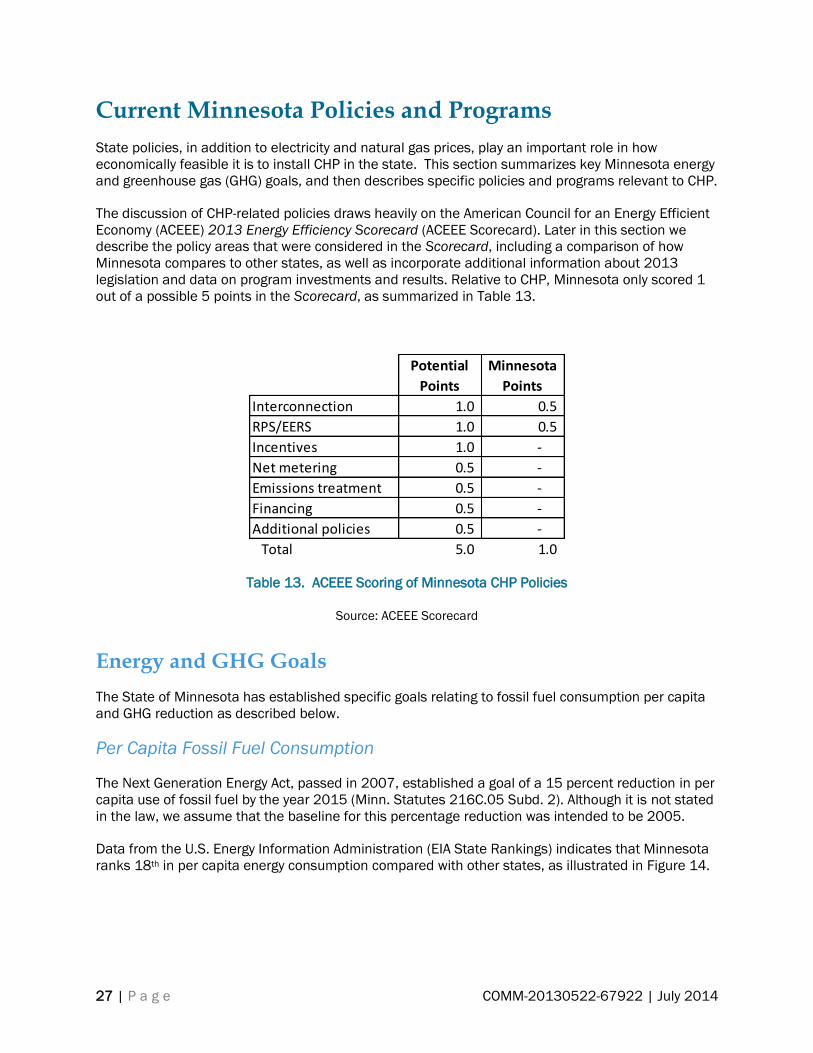
27 | P a g e COMM-20130522-67922 | July 2014
Current Minnesota Policies and Programs
State policies, in addition to electricity and natural gas prices, play an important role in how
economically feasible it is to install CHP in the state. This section summarizes key Minnesota energy
and greenhouse gas (GHG) goals, and then describes specific policies and programs relevant to CHP.
The discussion of CHP-related policies draws heavily on the American Council for an Energy Efficient
Economy (ACEEE) 2013 Energy Efficiency Scorecard (ACEEE Scorecard). Later in this section we
describe the policy areas that were considered in the Scorecard, including a comparison of how
Minnesota compares to other states, as well as incorporate additional information about 2013
legislation and data on program investments and results. Relative to CHP, Minnesota only scored 1
out of a possible 5 points in the Scorecard, as summarized in Table 13.
Table 13. ACEEE Scoring of Minnesota CHP Policies
Source: ACEEE Scorecard
Energy and GHG Goals
The State of Minnesota has established specific goals relating to fossil fuel consumption per capita
and GHG reduction as described below.
Per Capita Fossil Fuel Consumption
The Next Generation Energy Act, passed in 2007, established a goal of a 15 percent reduction in per
capita use of fossil fuel by the year 2015 (Minn. Statutes 216C.05 Subd. 2). Although it is not stated
in the law, we assume that the baseline for this percentage reduction was intended to be 2005.
Data from the U.S. Energy Information Administration (EIA State Rankings) indicates that Minnesota
ranks 18th in per capita energy consumption compared with other states, as illustrated in Figure 14.
Potential
Points
Minnesota
Points
Interconnection 1.0 0.5
RPS/EERS 1.0 0.5
Incentives 1.0 -
Net metering 0.5 -
Emissions treatment 0.5 -
Financing 0.5 -
Additional policies 0.5 -
Total 5.0 1.0
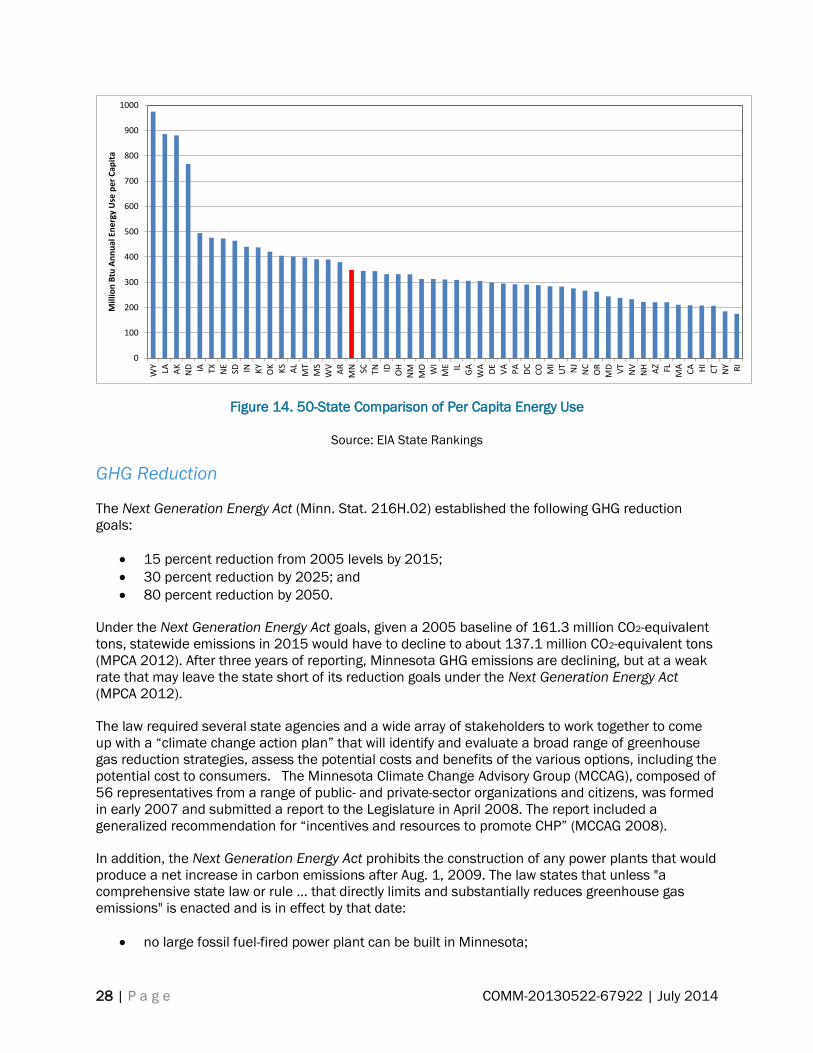
28 | P a g e COMM-20130522-67922 | July 2014
Figure 14. 50-State Comparison of Per Capita Energy Use
Source: EIA State Rankings
GHG Reduction
The Next Generation Energy Act (Minn. Stat. 216H.02) established the following GHG reduction
goals:
15 percent reduction from 2005 levels by 2015;
30 percent reduction by 2025; and
80 percent reduction by 2050.
Under the Next Generation Energy Act goals, given a 2005 baseline of 161.3 million CO2-equivalent
tons, statewide emissions in 2015 would have to decline to about 137.1 million CO2-equivalent tons
(MPCA 2012). After three years of reporting, Minnesota GHG emissions are declining, but at a weak
rate that may leave the state short of its reduction goals under the Next Generation Energy Act
(MPCA 2012).
The law required several state agencies and a wide array of stakeholders to work together to come
up with a “climate change action plan” that will identify and evaluate a broad range of greenhouse
gas reduction strategies, assess the potential costs and benefits of the various options, including the
potential cost to consumers. The Minnesota Climate Change Advisory Group (MCCAG), composed of
56 representatives from a range of public- and private-sector organizations and citizens, was formed
in early 2007 and submitted a report to the Legislature in April 2008. The report included a
generalized recommendation for “incentives and resources to promote CHP” (MCCAG 2008).
In addition, the Next Generation Energy Act prohibits the construction of any power plants that would
produce a net increase in carbon emissions after Aug. 1, 2009. The law states that unless "a
comprehensive state law or rule … that directly limits and substantially reduces greenhouse gas
emissions" is enacted and is in effect by that date:
no large fossil fuel-fired power plant can be built in Minnesota;
0
100
200
300
400
500
600
700
800
900
1000
WY
LA AK
ND IA TX NE
SD IN KY
OK KS
AL
MT
MS
WV
AR
MN SC TN ID OH
NM
MO WI
ME IL
GA
WA
DE
VA
PA
DC
CO MI
UT NJ
NC
OR
MD VT
NV
NH AZ FL
MA
CA HI
CT
NY RI
Mill
ion
Btu
An
nu
al E
ner
gy U
se p
er C
apit
a

29 | P a g e COMM-20130522-67922 | July 2014
no utility can import electricity from a large fossil fuel-fired power plant built in another state
that was not operating on Jan. 1, 2007; and
no Minnesota utility can purchase electricity from an outstate utility under a contract that
exceeds 50 megawatts for a term of five years.
Portfolio Standards
Portfolio standards are tools states can use to increase the adoption of renewable energy and
energy efficiency technologies, including CHP, by requiring electric utilities and other retail utility
providers to meet a specified amount of load through eligible clean energy sources. Sometimes such
standards are called “clean energy portfolio standards.” 11 Renewable portfolio standards (RPS)
define a particular percentage of electric resources that must be derived from renewable energy.
Energy efficiency resource standards (EERS) define how much of the projected electricity or natural
gas requirement should be provided by energy efficiency. The applicability of such standards is often
limited to Investor-Owned Utilities (IOUs) regulated by the state, leaving electric coops and municipal
utilities more leeway.
Minnesota Renewable Portfolio Standards
The Next Generation Energy Act established a goal of deriving 25 percent of the total energy used in
the state from renewable energy resources by the year 2025 (Minn. Statute 216C.05 Subd. 2). This
legislation created an RPS for Xcel Energy, created a separate RPS for other electric utilities,12 and
modified the state's existing non-mandated renewable-energy objective. In 2013, further legislation
(H.F 729) was enacted to create a 1.5 percent solar standard for public utilities, a distributed
generation carve-out, and a solar goal for the state. For the purpose of calculating the solar
requirement, the following types of customers are not included: mining extraction and processing
facilities; paper mills; wood products and oriented strand board manufacturers (House Research
2013).
CHP that is powered by renewable fuels such as biomass or landfill gas is an eligible technology, but
natural gas CHP is not. Because not all types of CHP are covered under this RPS, Minnesota earned
only a half point in the RPS/EERS Scorecard category for the most recent report. However, as
discussed below, legislation passed in 2013 enhanced the potential for Minnesota’s EERS to
stimulate implementation of CHP.
Eligible Technologies
Electricity generated by solar, wind, hydroelectric facilities less than 100 megawatts (MW), hydrogen
and biomass -- which includes landfill gas, anaerobic digestion, and municipal solid waste -- is
eligible for the standards and the objective. The definition of eligible biomass was refined slightly in
2008 by S.F. 2996 to include the organic components of wastewater effluent and sludge from public
11 State policymakers, project developers, advocates, utilities, and others have various definitions of “clean”
energy. The SEEAction Guide does not attempt to create one definition, but rather recognizes that the primary
audience for the guide is state regulators, and that they define it as they see fit.
12 Other electric utilities that must comply with Minnesota's RPS are: public utilities providing electric service;
generation and transmission cooperative electric associations; municipal power agencies; and power districts
operating in the state.

30 | P a g e COMM-20130522-67922 | July 2014
treatment plants, with the exception of waste sludge incineration. After January 1, 2010, hydrogen
must be generated by other eligible renewables in order to be eligible.
Xcel Energy Standard
The standard for Xcel Energy requires that eligible renewable electricity account for 31.5 percent of
total retail electricity sales (including sales to retail customers of a distribution utility to which Xcel
Energy provides wholesale service) in Minnesota by 2020. Of the 31.5 percent renewables required
of Xcel Energy in 2020, 1.5 percent must be met with solar PV (10 percent of which must be met
with systems of 20 kW or less) , at least 25 percent must be generated by wind-energy or solar
energy systems, with solar limited to no more than 1 percent of the requirement. In effect, this
means that the wind standard is at least 24 percent, 1.5 percent must be met with solar, and solar
may contribute up to another 1 percent, and the "remaining" 5 percent may be generated using
other eligible technologies.
Wind energy and biomass energy contracted for or purchased by Xcel Energy pursuant to Minn. Stat.
§ 216B.2423 et seq. is eligible under the RPS. The RPS schedule for Xcel Energy is as follows:
15 percent by 12/31/2010
18 percent by 12/31/2012
25 percent by 12/31/2016
31.5 percent by 12/31/2020 (including 1.5 percent solar)
Standard for Non-Xcel Public Utilities
The standard for other public utilities requires that eligible renewable electricity account for 26.5
percent of retail electricity sales to retail customers in Minnesota by 2025. Of this electricity, 1.5
percent must be solar photovoltaics by 2020, and 10 percent of the solar standard must be met with
systems of 20 kW or less.
12 percent by 12/31/2012
17 percent by 12/31/2016
21.5 percent by 12/31/2020 (including 1.5 percent solar)
26.5 percent by 12/31/2025 (including 1.5 percent solar)
Standard for Non-Public Utilities
The standard for other Minnesota utilities requires that eligible renewable electricity account for 25
percent of retail electricity sales to retail customers (and to retail customers of a distribution utility to
which the one or more of the utilities provides wholesale service) in Minnesota by 2025. The RPS
schedule for other Minnesota utilities is as follows:
12 percent by 12/31/2012
17 percent by 12/31/2016
20 percent by 12/31/2020
25 percent by 12/31/2025
31 | P a g e COMM-20130522-67922 | July 2014
Renewable Energy Certificates (RECs)
The 2007 legislation required the Minnesota Public Utilities Commission (PUC) to establish a
program for tradable RECs by January 1, 2008. The PUC approved the Midwest Renewable Energy
Tracking System (M-RETS) for this purpose and required all utilities to register renewable generation
assets by March 1, 2008. The program treats all eligible renewables equally and may not ascribe
more or less credit to energy based on the state in which the energy was generated or the technology
used to generate the energy. Only RECs recorded and tracked through the M-RETS can be used for
compliance. Notably, Xcel Energy may not sell RECs to other Minnesota utilities for RPS-compliance
purposes until 2021. For the purposes of the solar standard, only RECs associated with solar
installed and generating in Minnesota on or after May 24, 2013 but before 2020 are eligible.
In December 2007, the PUC made certain additional determinations for the operation of the REC
trading system, listed below:
RECs will have a trading lifetime of 4 years according to the year of generation (i.e., all credits
generated during 2008, regardless of the month, expired at the end of 2012).
The purchase of RECs through M-RETS may be used in utility green pricing programs, subject
to the shelf life described above.
Consistent with M-RETS operating procedures, RECs must remain "whole" and may not be
disaggregated into separate environmental commodities (e.g., carbon emission credits)
The PUC declined to issue a directive ascribing ownership of RECs where ownership is not
addressed in power purchase agreements (PPAs), instead requiring utilities to pursue
negotiations and settlements with the owners of generation units.
Compliance and Reporting
Utilities are required to file annual compliance reports with the PUC detailing their retail sales, REC
retirements, and REC trading activities. If the PUC finds a utility is non-compliant, the commission
may order the utility to construct facilities, purchase eligible renewable electricity, purchase RECs or
engage in other activities to achieve compliance. If a utility fails to comply, the PUC may impose a
financial penalty on the utility in an amount not to exceed the estimated cost of achieving
compliance. The penalty may not exceed the lesser of the cost of constructing facilities or purchasing
credits and proceeds must be deposited into a special account reserved for energy and conservation
improvements.
In 2013, the Division of Energy Resources published a compliance progress report for compliance
through 2011, stating that utilities are on track to comply with 2012 goals.
Conservation Improvement Program (Energy Efficiency Resource Standard)
Statutory Requirements
The Next Generation Energy Act (NGEA) established an annual energy savings goal of 1.5 percent of
average retail sales for each electric and gas utility beginning in 2010. Utilities may petition the
Director of the Division of Energy Resources at the Minnesota Department of Commerce to adjust
their savings goals to a minimum of 1 percent based on a conservation potential study, a utility's
historic conservation improvement program (CIP) experience, or other factors at the discretion of the
Director. Legislation passed in 2009 established an interim savings goal of 0.75 percent over 2010-
2012 for qualifying natural gas utilities (Minnesota Department of Commerce website).
32 | P a g e COMM-20130522-67922 | July 2014
The NGEA further established the potential for electric utilities to count the savings that result from
qualified improvements to its generation, transmission, or distribution infrastructure, or conservation
measures in its own facilities toward the 1.5 percent savings goal, once plans are in place to achieve
at least 1 percent savings through conservation improvements. Further legislation passed in 2009
also allowed natural gas utilities to count biomethane purchases toward their savings goal in a
similar fashion.
The CIP statutes contain important stipulations regarding how utilities spend CIP funds:
Electric utilities, except for Xcel Energy, must spend a minimum of 1.5 percent of annual
gross operating revenues (GOR) on CIP programs. As an owner of nuclear generation
facilities, Xcel Energy must spend at least 2 percent of annual GOR.
Natural gas utilities must spend a minimum of 0.5 percent of annual GOR on CIP programs.
Up to 10 percent of the overall minimum spending requirement may be spent on R&D
projects.
Up to 10 percent of the overall minimum spending requirement may be spent on qualifying
solar energy projects. Up to 5 percent of the overall minimum spending requirement may be
spent on other renewable and distributed generation projects.
Each electric utility must include in its CIP plan programs intended to encourage the use of
energy efficient lighting by its customers and recycling of spent lamps.
Investor owned utilities must file their CIP plans with the energy division at least every three years.
Municipal utilities and cooperatives must file annually. Utilities report their actual CIP spending and
savings achieved on an annual basis.
Certain large facilities may petition to have their revenues excluded from calculations determining
investment and expenditure requirements (Minnesota Statutes 216B.241, Subd. 1a.). The petition
must include a discussion of the competitive or economic pressures facing the owner of the facility
and the efforts taken by the owner to identify, evaluate and implement energy efficiency
improvements.
Program Results
The Department of Commerce must provide reports on the annual energy savings achieved through
the CIPs, and related costs. Data from the latest report (Minnesota Department of Commerce 2013)
are summarized in Table 14 and Table 15.
The electric utility sector as a whole met the 1.5 percent savings goal in 2010, and investor-owned
utilities nearly met the goal, as summarized in Table 16. The natural gas utility sector as a whole
met the reduced goal of 0.75 percent approved by the legislature as described above (see Table 17).
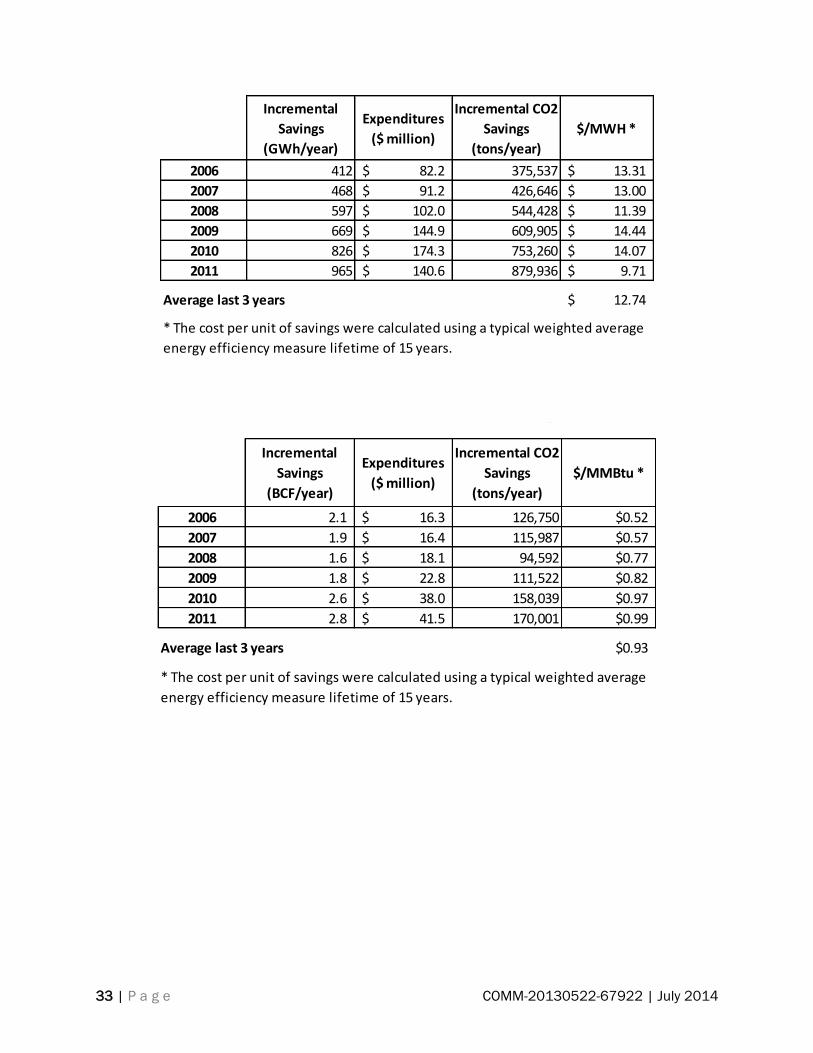
33 | P a g e COMM-20130522-67922 | July 2014
Incremental
Savings
(GWh/year)
Expenditures
($ million)
Incremental CO2
Savings
(tons/year)
$/MWH *
2006 412 82.2$ 375,537 13.31$
2007 468 91.2$ 426,646 13.00$
2008 597 102.0$ 544,428 11.39$
2009 669 144.9$ 609,905 14.44$
2010 826 174.3$ 753,260 14.07$
2011 965 140.6$ 879,936 9.71$
Average last 3 years 12.74$
* The cost per unit of savings were calculated using a typical weighted average
energy efficiency measure lifetime of 15 years.
Table 14. Total Electric CIP Savings and Expenditures by Year, 2006-2011
Source: Minnesota Department of Commerce 2013
Incremental
Savings
(BCF/year)
Expenditures
($ million)
Incremental CO2
Savings
(tons/year)
$/MMBtu *
2006 2.1 16.3$ 126,750 $0.52
2007 1.9 16.4$ 115,987 $0.57
2008 1.6 18.1$ 94,592 $0.77
2009 1.8 22.8$ 111,522 $0.82
2010 2.6 38.0$ 158,039 $0.97
2011 2.8 41.5$ 170,001 $0.99
Average last 3 years $0.93
* The cost per unit of savings were calculated using a typical weighted average
energy efficiency measure lifetime of 15 years.
Table 15. Total Natural Gas CIP Savings and Expenditures by Year, 2006-2011
Source: Minnesota Department of Commerce 2013
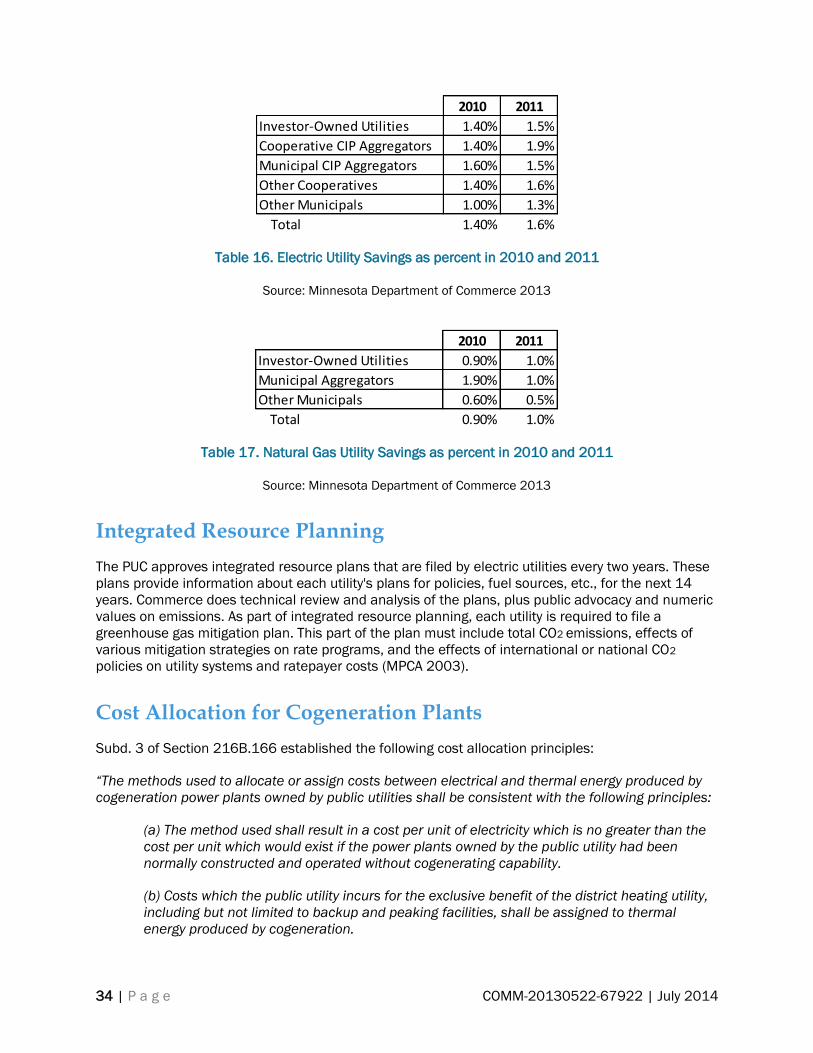
34 | P a g e COMM-20130522-67922 | July 2014
Table 16. Electric Utility Savings as percent in 2010 and 2011
Source: Minnesota Department of Commerce 2013
Table 17. Natural Gas Utility Savings as percent in 2010 and 2011
Source: Minnesota Department of Commerce 2013
Integrated Resource Planning
The PUC approves integrated resource plans that are filed by electric utilities every two years. These
plans provide information about each utility's plans for policies, fuel sources, etc., for the next 14
years. Commerce does technical review and analysis of the plans, plus public advocacy and numeric
values on emissions. As part of integrated resource planning, each utility is required to file a
greenhouse gas mitigation plan. This part of the plan must include total CO2 emissions, effects of
various mitigation strategies on rate programs, and the effects of international or national CO2
policies on utility systems and ratepayer costs (MPCA 2003).
Cost Allocation for Cogeneration Plants
Subd. 3 of Section 216B.166 established the following cost allocation principles:
“The methods used to allocate or assign costs between electrical and thermal energy produced by
cogeneration power plants owned by public utilities shall be consistent with the following principles:
(a) The method used shall result in a cost per unit of electricity which is no greater than the
cost per unit which would exist if the power plants owned by the public utility had been
normally constructed and operated without cogenerating capability.
(b) Costs which the public utility incurs for the exclusive benefit of the district heating utility,
including but not limited to backup and peaking facilities, shall be assigned to thermal
energy produced by cogeneration.
2010 2011
Investor-Owned Utilities 1.40% 1.5%
Cooperative CIP Aggregators 1.40% 1.9%
Municipal CIP Aggregators 1.60% 1.5%
Other Cooperatives 1.40% 1.6%
Other Municipals 1.00% 1.3%
Total 1.40% 1.6%
2010 2011
Investor-Owned Utilities 0.90% 1.0%
Municipal Aggregators 1.90% 1.0%
Other Municipals 0.60% 0.5%
Total 0.90% 1.0%

35 | P a g e COMM-20130522-67922 | July 2014
(c) The methods and procedures may be different for retrofitted than for new cogeneration
power plants.
(d) The methods should encourage cogeneration while preventing subsidization by electric
consumers so that both heating and electricity consumers are treated fairly and equitably
with respect to the costs and benefits of cogeneration.”
Interconnection Standards
In response to state legislation enacted in 2001, in September 2004 the Minnesota Public Utilities
Commission (PUC) adopted an order establishing generic standards for utility tariffs for
interconnection and the operation of distributed-generation facilities up to 10 megawatts (MW) in
capacity. The PUC standards contain technical requirements related to engineering studies,
mandatory minimum insurance requirements for different sized systems, equipment certification
definitions, a dispute resolution process, and standard application fees. The PUC has approved
compliance tariffs filed by the state's investor-owned utilities. Municipal utilities and electric
cooperatives were required to adopt a tariff that addresses the issues included in the PUC's order.
All utilities must report annually on the number of interconnected systems. The PUC has developed
streamlined uniform interconnection applications and a process that addresses safety, economics
and reliability issues.
In 2011, the Minnesota Department of Commerce, Division of Energy Resources started a review
process of all distributed generation procedures, conducting stakeholder meetings and workshops
and accepting comments (DSIRE).
In the 2013 ACEEE Scorecard, Minnesota received half a point in the Interconnection section. More
than 50 percent of states received no points at all in the Interconnection section, so Minnesota
performs better than average in this policy area. Minnesota does not have a tiered interconnection
standard for CHP. As noted in the following chapter, the Minnesota Public Utilities Commission has
established uniform interconnection standards that apply to all CHP systems up to 10 MW including
fossil fuel-fired facilities. Although Minnesota performs better than the average state in this policy
area, Minnesota interconnection standards could be improved by raising the cap on system size
covered by the interconnection standard and implementing a tiered or “fast-track” system for smaller
units. An explicitly tiered structure would allow the smallest systems, for instance, to benefit from a
“fast-track” interconnection approach, reducing time and paperwork associated with the
interconnection application.
Standby Rates
The EPA CHP Partnership developed the concept of the “avoided rate” as a metric for evaluating the
barriers of standby rates (EPA 2009). This metric compares the projected average electricity cost, for
an assumed set of monthly electricity demand and energy consumption data, under “full
requirements” tariffs (assuming no CHP) to projected costs under “partial requirements” tariffs
(assuming CHP).

36 | P a g e COMM-20130522-67922 | July 2014
Avoided rate can be calculated as follows:
Definitions
Full Requirements Cost (FRC) = projected annual utility bill under the full
requirements tariff
Partial Requirements Cost (PRC) = projected annual utility bill under the partial
requirements tariff
Full Requirements Use (FRU) = projected annual kWh purchased under the full
requirements tariff
Partial Requirements Use (PRU) = projected annual kWh purchased under the partial
requirements tariff
Calculations
Full Requirements Average Cost per kWh (FRA) = FRC / FRU
Partial Requirements Average Cost (PRA) = PRC / PRU
Avoided Average Cost (AAC) = (FRC – PRC) / (FRU – PRU)
Avoided Rate = ACC /FRA
The higher the Avoided Rate, i.e., the ratio of avoided costs to the full retail average price, the higher
the user’s savings. According to the EPA study, Avoided Rates above 90 percent generally provide
adequate savings to support onsite generation.
Stand-by services are provided under a range of tariff structures and rates in Minnesota utilities. The
Energy Resources Center (ERC) has completed a study of standby and net metering rates for
Minnesota Department of Commerce (Energy Resources Center 2014). This study focused on:
Assessing the existing standby rates and net metering policies and how they affect the
market acceptance of CHP projects today;
Determining what recommendations, if any, should be considered to reduce the barriers the
above factors impose on CHP development in Minnesota; and
Modeling the economic potential of CHP projects in Minnesota investor owned utility (IOU)
service territories based on analyzing the impact of existing and varied standby rates for CHP
projects.
Table 18 shares the results of the Energy Resources Study analyzing the avoided rate metric for
each Investor-Owned Utility in Minnesota. The results shown range between 77 percent and 97
percent. In general, when analyzing the avoided rate metric, the closer the values are to 100 percent
the lower the economic barrier standby rates impose on CHP projects.

37 | P a g e COMM-20130522-67922 | July 2014
Table 18. Avoided Rates of Minnesota IOUs
Source Energy Resources Center 2014
As the ERC report notes: “It should be noted that, though simple to calculate and communicate, the
avoided rate metric is a blunt tool that may over simplify situations. The economic effect of standby
rates is largely related to the specific attributes and operating schedules of a customer’s generator.
While the avoided rate can give a general overview of economic barriers, the actual effects on
standby customers may vary greatly depending on actual circumstances. Because of the limitations
in the avoided rate analysis, we also included the three criteria of transparency, flexibility and
economic efficiency in the analysis of standby rates.”
For the ERC study, ICF International modeled the potential impact on the economic potential for CHP
in the service territories of the four IOUs if avoided rates were increased in the model from their
current standing to a hypothetical value of 100 percent. The results are summarized in Table 19.
Table 19. Economic Potential of CHP in IOU Service Territories with Current and Assumed 100
Percent Avoided Rates
Source: Energy Resources Center 2014
The ERC report concluded that this “indicates opportunities for improvement within the existing
standby rate structures can positively impact the overall economic potential of new CHP generating
capacity within Minnesota.” However, the author concludes, based on the analysis discussed below
under “Policy Analysis,” that changing published standby rates is not likely to have a large impact on
investments in CHP by utility customers. This conclusion is based on the analysis regarding the
economic importance of key variables. Note that the hypothetical change to 100 percent Avoided
Rates does not move any potential to simple paybacks under 5 years, which is the likely payback
range for most potential implementers of CHP.
500 3,000 10,000
Secondary Primary Transmission
Xcel Energy 87% 90% 96%
Alliant Energy 77% 77% 78%
Minnesota Power 90% 95% 97%
Otter Tail Power 97% 96% 97%
Generating Capacity (kW)
Voltage
Simple Payback
>10 years 5-10 years 0-5 years
With current standby rates 1,019 779 -
If Avoided Rate = 100% 682 1,116 -
38 | P a g e COMM-20130522-67922 | July 2014
Although standby rates are not a major constraint, there are still modifications that can be made to
standby rates that would further encourage CHP generators to operate more efficiently to avoid a
greater portion of their full requirements rates. The ERC study suggests consideration of the
following standby modifications for IOUs in Minnesota as follows:
1. Standby rates should be transparent, concise and easily understandable. Potential CHP
customers should be able to accurately predict future standby charges in order to assess
their financial impacts on CHP feasibility.
2. Standby energy usage fee should reflect both demand and time-of-use cost drivers. Time-of-
use energy rates send clear price signals as to the cost for the utility to generate needed
energy. This would further incentivize the use of off-peak standby services.
3. The Forced Outage Rate should be used in the calculation of a customer’s reservation
charge. The inclusion of a customer’s forced outage rate directly incentivizes standby
customers to limit their use of backup service. This further ties the use of standby to the
price paid to reserve such service, creating a strong price signal for customers to run most
efficiently.
4. The standby demand usage fees should only apply during on-peak hours and be charged on
a daily basis. This rate design would encourage CHP customers to shift their use of standby
service to off-peak periods when the marginal cost to provide service is generally much
lower. Furthermore, this design would allow customers to save money by reducing the
duration of outages.
5. Grace periods exempting demand usage fees should be removed where they exist.
Exempting an arbitrary number of hours against demand usage charges sends inaccurate
prices signals about the cost to provide this service. Standby demand usage should be
priced as-used on a daily and preferably an on-peak basis. This method directly ties the
standby customer to the costs associated with providing standby service.
Net Metering
Minnesota did not receive any points in the ACEEE scorecard because at the time the scorecard was
completed, Minnesota’s net metering standards only applied to systems of 40kW or less. However,
new Minnesota legislation has substantially strengthened Minnesota’s net metering policy.
Minnesota’s net metering standard applies to all investor-owned utilities, municipal utilities, and
electric cooperatives, and mandates that utilities must compensate customers at the utility’s retail
rate. Until the passage of H.F. 729, the Minnesota net metering standard only applied to facilities
under 40 kW in capacity. H.F. 729 made extensive changes to Minn. Statutes 216B.164, which
applies cogeneration (CHP) and small power production. These changes included:
Definition of “distributed generation” as a facility with less than 10 MW.
Facilities under 40 kW served by public utilities can opt for net metering based on the
average retail utility energy rate.
In setting rates for facilities over 40 kW but less than 1,000 kW served by public utilities, the
Public Utilities Commission (PUC) “shall consider the fixed distribution costs to the utility not
otherwise accounted for in the basic monthly charge and shall ensure that the costs charged
to the qualifying facility are not discriminatory in relation to the costs charged to other
customers of the utility.”
A public utility may not impose a standby charge on a net metered or qualifying facility: of
100 kilowatts or less capacity; or of more than 100 kilowatts capacity, except in accordance
39 | P a g e COMM-20130522-67922 | July 2014
with an order of the commission establishing the allowable costs to be recovered through
standby charges.
Additionally, an aggregate system cap can be requested by a utility after net metered generation
represents 4 percent of a utility’s annual retail sales (DSIRE 2013).
A concern with Minnesota’s new net metering law is that it may allow utilities to impose standby
charges on net metering customers whose generating capacity is greater than 100 kW (Energy
Resources Center 2014). According to the statute, utilities may petition the public utility commission
to establish standby charges for larger net metering customers in order to recover allowable costs.
Currently, all Minnesota utilities have included systems greater than 100 kW under standby
provisions.
For low load factor customers with CHP systems larger than 40 kW but under 100 kW, imposition of
standby rates will be onerous for net metering customers that might otherwise pay for their capacity
through demand charges built into their electric rate. Standby rates for net metering customers with
higher load factor generators may be an appropriate method to recover capacity costs (Energy
Resources Center 2014).
Relative to net metering, the Energy Resources Center report had two recommendations:
1. Standby rates should not be issued when utilities can recover capacity costs through regular
rates. Net Metering rates already include provisions to recuperate the full demand related
costs from net metering customers. While net metering rates bill energy consumed or credit
energy generated on a net basis they contain no such provision for calculating demand
charges; like full-requirement rates, these rates bill customers for their maximum demand
placed on the grid. However, not all net metering customers go offline the same amount for
time. For those customers with little or infrequent downtime, standby rates might be an
appropriate method to recover capacity related costs. In granting utilities the ability to
impose standby charges on net metering customers above 100 kW, the Minnesota Public
Utility Commission should be careful not to allow utilities to double charge for capacity cost
recovery.
2. The Net Excess Generation Credit should be the average retail electric rate for all net
metering customers. All net metering customers should be treated equally and be provided
the same Net Excess Generation Credit.
Incentives and Financing Assistance
The upfront cost of a CHP system is often a significant barrier for businesses, particularly if the
payback period is longer than for other investments. Incentives for CHP installations can take a
variety of forms, including capacity (kW) or production (kWh) incentives, project-based grants, or tax
credits. For states to receive a full point on the Scorecard for incentives, the incentives must apply to
all forms of CHP and apply to systems in both the commercial and industrial sectors.
Financing assistance for CHP can be in the form of low-interest loan programs, loan guarantees, and
bonding authorities. To receive a top score in ACEEE’s scorecard, key programs must be available to
all forms of CHP and be substantial enough to be able to truly be used by a CHP project.
Currently, Minnesota has no financial incentives or financing assistance in place that give credit to
CHP system production or reduce the direct cost of investment. In contrast, over 50 percent of the
states earned at least partial credit in the Incentives category of the Scorecard, reflecting the fact
40 | P a g e COMM-20130522-67922 | July 2014
that most states have an incentive or grant program that can be used by CHP in some
circumstances. In states with more aggressive CHP goals, incentive and financing programs are
specifically designed around CHP opportunities.
According to the Property Tax Administrator’s Manual, Minnesota Statutes 272.02, subd. 29,
attached machinery and other personal property which is part of a facility containing a cogeneration
system may be exempt if the cogeneration system meets the following criteria:
The system utilizes natural gas as a primary fuel and the cogenerated steam initially
replaces steam generated from existing thermal boilers utilizing coal;
The facility developer is selected as a result of a procurement process ordered by the
Public Utilities Commission; and
Construction of the facility is commenced after July 1, 1994 and before July 1, 1997.
This tax exemption’s criteria render it ineffective in encouraging new CHP in the state today.
Additionally, current CHP opportunities can include other fuels such as biomass or biofuel, and they
may not always be replacing a coal boiler. Property tax exemptions are useful tools to encourage
distributed generation, but they are more supportive of new developments if their criteria are less
restrictive.

41 | P a g e COMM-20130522-67922 | July 2014
Development of Policy Options
This section: 1) analyzes the economic significance of key factors in CHP economic feasibility; 2)
summarizes the implications of the economic analysis for policy options and briefly notes major
findings from research on best practices for CHP policy in other states (with detailed information
provided in Appendix A); 3) briefly notes major findings from research on federal policies relevant to
CHP (with detailed information provided in Appendix B); and 4) describes potential Policy Options
that were introduced in draft form in a “Straw Man” report that was the basis for informal
stakeholder feedback (with the “Straw Man” draft report provided in Appendix C and notes from the
stakeholder discussions provided in Appendix D).
Comparative Economic Significance of Major Barriers
Introduction
A range of barriers to increased implementation of CHP were described above under “Key
Challenges.” The purpose of the following analysis is to characterize the relative economic
importance of each major element in the CHP financial feasibility equation in order to inform
development of draft recommendations for policies and programs.
In simplified terms, CHP is financially viable if CHP savings exceed costs. Key elements in the CHP
financial viability equation are summarized in Table 20. Major factors that influence each element
are summarized, and potential areas for policy action are noted. Notably, both costs and revenues
are affected by the capacity factor (annual output of the CHP facility compared with output at full
capacity over 8,760 hours).

42 | P a g e COMM-20130522-67922 | July 2014
Table 20. Basic Elements in CHP Financial Viability Equation
Source: FVB Energy
In the following analysis we analyze the sensitivity of CHP viability to the following four major
variables and discuss the policy implications of that sensitivity:
Weighted Average Cost of Capital (WACC)
Fuel costs
Electricity costs
Capacity factor
First we will characterize the capital and operating cost characteristics of the CHP technologies and
address the calculation of spark spread.
Spark Spread
The concept of “spark spread” was defined and discussed above under “Key Challenges.” Basic
technical characteristics of the modeled CHP technologies were summarized in Table 8. Base case
electricity and fuel price assumptions are provided in Table 21. Economic characteristics of the
modeled CHP technologies are summarized in Table 22.
Element in CHP Finacial
EquationMajor Influencing Factors Potential Policy Measures
Capital amortization costs Capital cost, WACC
Conservation Improvement Program,
Renewable Portfolio Standard,
Integrated Resource Planning, Grant
and Loan Programs
CHP fuel costsUtility tariff, future trends,
capacity factor
Gas utility fuel discount due to better
load factor
CHP non-fuel O&M costs Based on technology
Avoided cost of purchased
electricity
Utility tariff, future trends,
capacity factor
Favorable standby rates, Feed-In
Tariff, payment for value-added grid
benefits, Integrated Resource
Planning
Avoided cost of boiler fuelUtility tariff, future trends,
capacity factor
Export power revenue Power purchase agreement
Payment for value-added grid
benefits, Integrated Resource
Planning
Export thermal revenue Thermal energy purchase
agreement
Funding support for thermal
infrastructure
Costs
Savings
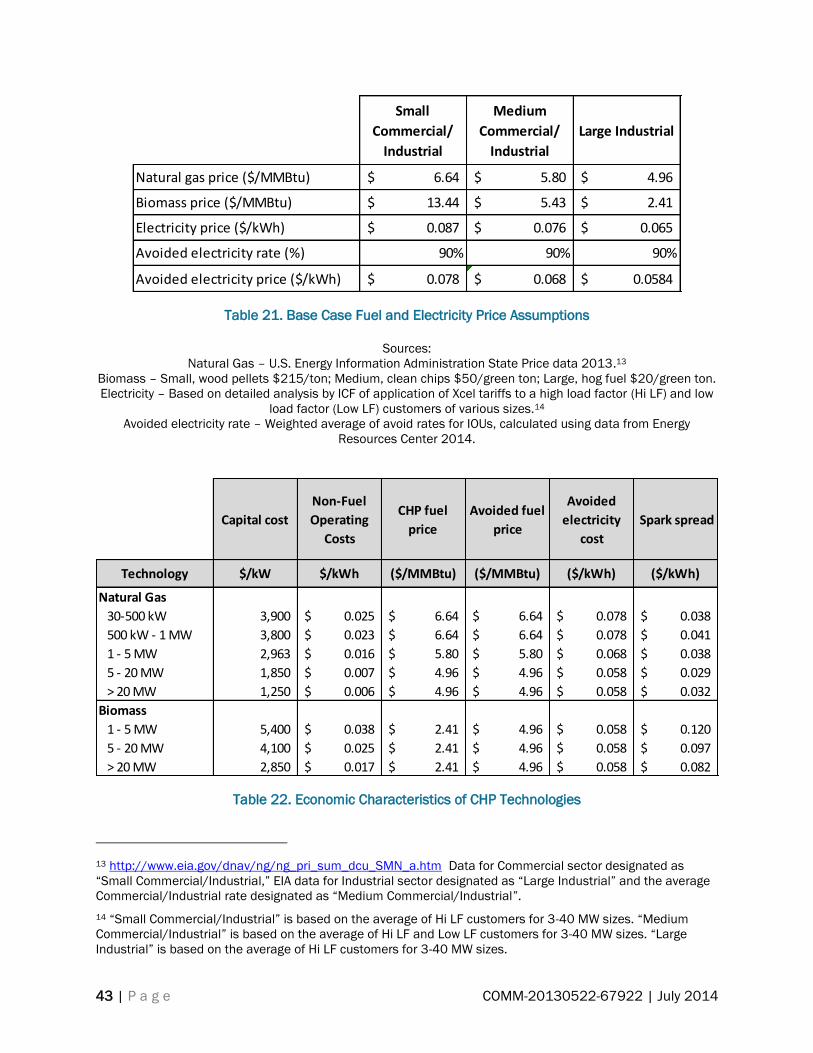
43 | P a g e COMM-20130522-67922 | July 2014
Table 21. Base Case Fuel and Electricity Price Assumptions
Sources:
Natural Gas – U.S. Energy Information Administration State Price data 2013.13
Biomass – Small, wood pellets $215/ton; Medium, clean chips $50/green ton; Large, hog fuel $20/green ton.
Electricity – Based on detailed analysis by ICF of application of Xcel tariffs to a high load factor (Hi LF) and low
load factor (Low LF) customers of various sizes.14
Avoided electricity rate – Weighted average of avoid rates for IOUs, calculated using data from Energy
Resources Center 2014.
Table 22. Economic Characteristics of CHP Technologies
13 http://www.eia.gov/dnav/ng/ng_pri_sum_dcu_SMN_a.htm Data for Commercial sector designated as
“Small Commercial/Industrial,” EIA data for Industrial sector designated as “Large Industrial” and the average
Commercial/Industrial rate designated as “Medium Commercial/Industrial”.
14 “Small Commercial/Industrial” is based on the average of Hi LF customers for 3-40 MW sizes. “Medium
Commercial/Industrial” is based on the average of Hi LF and Low LF customers for 3-40 MW sizes. “Large
Industrial” is based on the average of Hi LF customers for 3-40 MW sizes.
Small
Commercial/
Industrial
Medium
Commercial/
Industrial
Large Industrial
Natural gas price ($/MMBtu) 6.64$ 5.80$ 4.96$
Biomass price ($/MMBtu) 13.44$ 5.43$ 2.41$
Electricity price ($/kWh) 0.087$ 0.076$ 0.065$
Avoided electricity rate (%) 90% 90% 90%
Avoided electricity price ($/kWh) 0.078$ 0.068$ 0.0584$
Capital cost
Non-Fuel
Operating
Costs
CHP fuel
price
Avoided fuel
price
Avoided
electricity
cost
Spark spread
Technology $/kW $/kWh ($/MMBtu) ($/MMBtu) ($/kWh) ($/kWh)
Natural Gas
30-500 kW 3,900 0.025$ 6.64$ 6.64$ 0.078$ 0.038$
500 kW - 1 MW 3,800 0.023$ 6.64$ 6.64$ 0.078$ 0.041$
1 - 5 MW 2,963 0.016$ 5.80$ 5.80$ 0.068$ 0.038$
5 - 20 MW 1,850 0.007$ 4.96$ 4.96$ 0.058$ 0.029$
> 20 MW 1,250 0.006$ 4.96$ 4.96$ 0.058$ 0.032$
Biomass
1 - 5 MW 5,400 0.038$ 2.41$ 4.96$ 0.058$ 0.120$
5 - 20 MW 4,100 0.025$ 2.41$ 4.96$ 0.058$ 0.097$
> 20 MW 2,850 0.017$ 2.41$ 4.96$ 0.058$ 0.082$
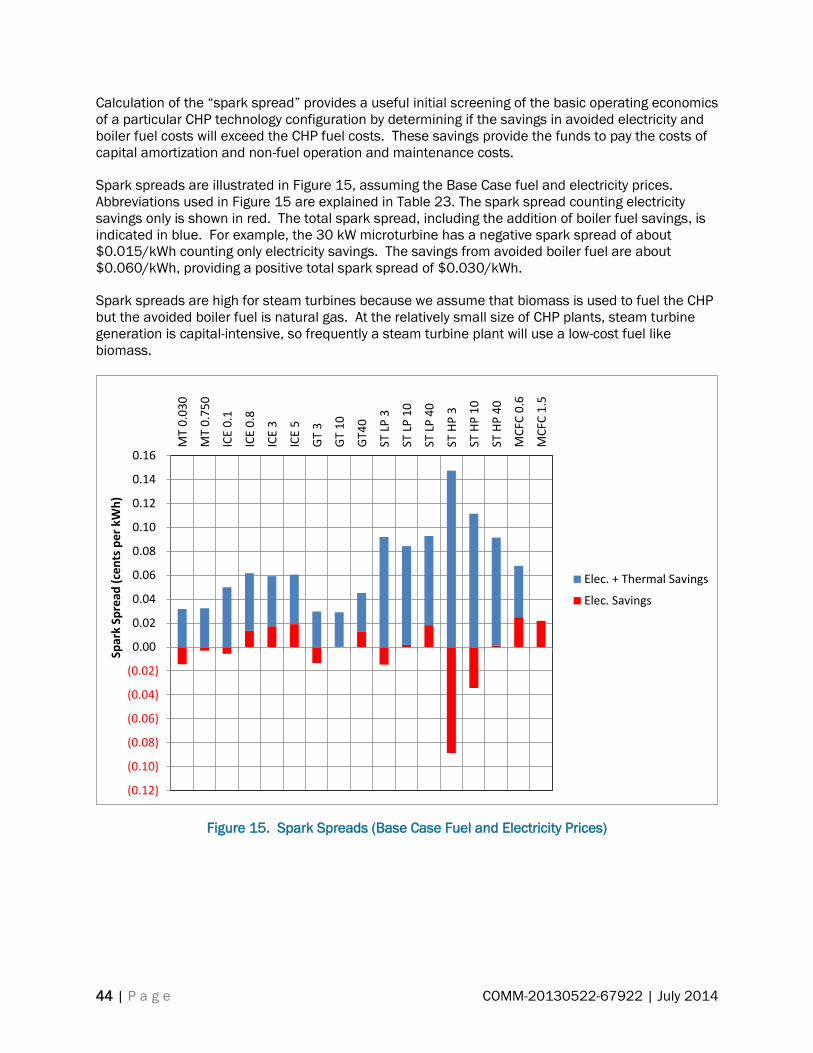
44 | P a g e COMM-20130522-67922 | July 2014
Calculation of the “spark spread” provides a useful initial screening of the basic operating economics
of a particular CHP technology configuration by determining if the savings in avoided electricity and
boiler fuel costs will exceed the CHP fuel costs. These savings provide the funds to pay the costs of
capital amortization and non-fuel operation and maintenance costs.
Spark spreads are illustrated in Figure 15, assuming the Base Case fuel and electricity prices.
Abbreviations used in Figure 15 are explained in Table 23. The spark spread counting electricity
savings only is shown in red. The total spark spread, including the addition of boiler fuel savings, is
indicated in blue. For example, the 30 kW microturbine has a negative spark spread of about
$0.015/kWh counting only electricity savings. The savings from avoided boiler fuel are about
$0.060/kWh, providing a positive total spark spread of $0.030/kWh.
Spark spreads are high for steam turbines because we assume that biomass is used to fuel the CHP
but the avoided boiler fuel is natural gas. At the relatively small size of CHP plants, steam turbine
generation is capital-intensive, so frequently a steam turbine plant will use a low-cost fuel like
biomass.
Figure 15. Spark Spreads (Base Case Fuel and Electricity Prices)
(0.12)
(0.10)
(0.08)
(0.06)
(0.04)
(0.02)
0.00
0.02
0.04
0.06
0.08
0.10
0.12
0.14
0.16
MT
0.0
30
MT
0.7
50
ICE
0.1
ICE
0.8
ICE
3
ICE
5
GT
3
GT
10
GT4
0
ST L
P 3
ST L
P 1
0
ST L
P 4
0
ST H
P 3
ST H
P 1
0
ST H
P 4
0
MC
FC 0
.6
MC
FC 1
.5
Spar
k Sp
read
(ce
nts
pe
r kW
h)
Elec. + Thermal Savings
Elec. Savings
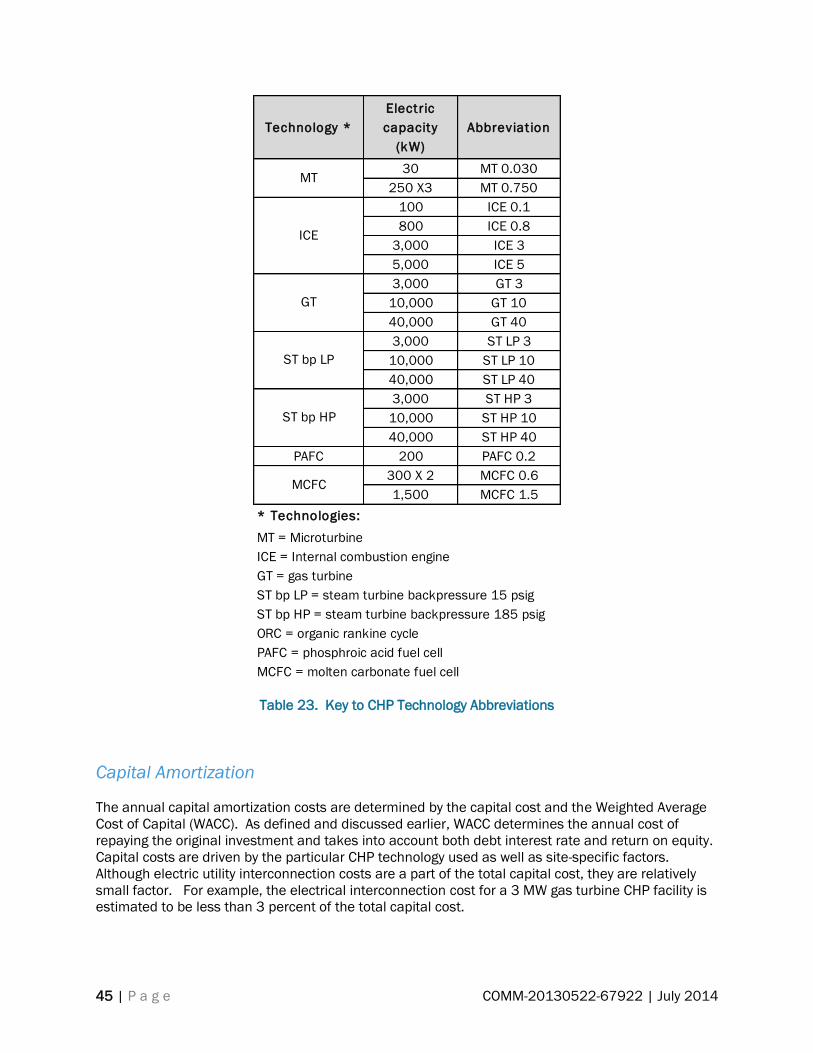
45 | P a g e COMM-20130522-67922 | July 2014
Table 23. Key to CHP Technology Abbreviations
Capital Amortization
The annual capital amortization costs are determined by the capital cost and the Weighted Average
Cost of Capital (WACC). As defined and discussed earlier, WACC determines the annual cost of
repaying the original investment and takes into account both debt interest rate and return on equity.
Capital costs are driven by the particular CHP technology used as well as site-specific factors.
Although electric utility interconnection costs are a part of the total capital cost, they are relatively
small factor. For example, the electrical interconnection cost for a 3 MW gas turbine CHP facility is
estimated to be less than 3 percent of the total capital cost.
Technology *
Electric
capacity
(kW)
Abbreviat ion
30 MT 0.030
250 X3 MT 0.750
100 ICE 0.1
800 ICE 0.8
3,000 ICE 3
5,000 ICE 5
3,000 GT 3
10,000 GT 10
40,000 GT 40
3,000 ST LP 3
10,000 ST LP 10
40,000 ST LP 40
3,000 ST HP 3
10,000 ST HP 10
40,000 ST HP 40
PAFC 200 PAFC 0.2
300 X 2 MCFC 0.6
1,500 MCFC 1.5
* Technologies:
MT = Microturbine
ICE = Internal combustion engine
GT = gas turbine
ST bp LP = steam turbine backpressure 15 psig
ST bp HP = steam turbine backpressure 185 psig
ORC = organic rankine cycle
PAFC = phosphroic acid fuel cell
MCFC = molten carbonate fuel cell
MCFC
MT
ICE
GT
ST bp LP
ST bp HP
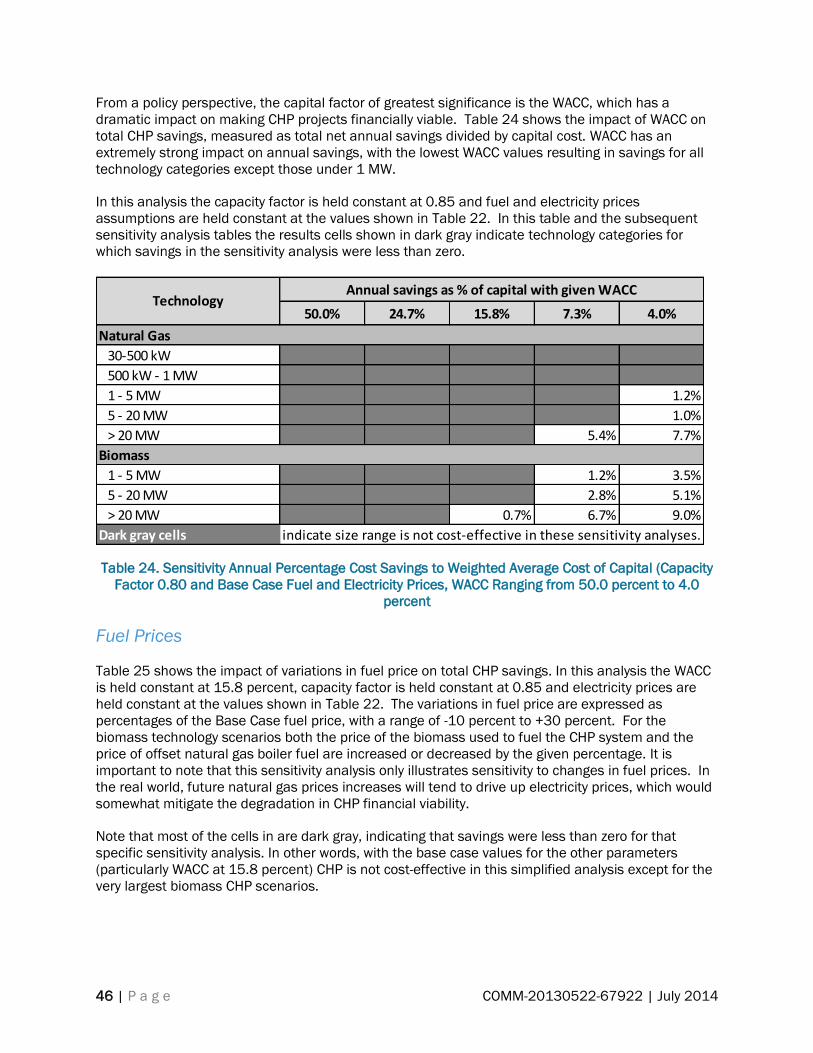
46 | P a g e COMM-20130522-67922 | July 2014
From a policy perspective, the capital factor of greatest significance is the WACC, which has a
dramatic impact on making CHP projects financially viable. Table 24 shows the impact of WACC on
total CHP savings, measured as total net annual savings divided by capital cost. WACC has an
extremely strong impact on annual savings, with the lowest WACC values resulting in savings for all
technology categories except those under 1 MW.
In this analysis the capacity factor is held constant at 0.85 and fuel and electricity prices
assumptions are held constant at the values shown in Table 22. In this table and the subsequent
sensitivity analysis tables the results cells shown in dark gray indicate technology categories for
which savings in the sensitivity analysis were less than zero.
Table 24. Sensitivity Annual Percentage Cost Savings to Weighted Average Cost of Capital (Capacity
Factor 0.80 and Base Case Fuel and Electricity Prices, WACC Ranging from 50.0 percent to 4.0
percent
Fuel Prices
Table 25 shows the impact of variations in fuel price on total CHP savings. In this analysis the WACC
is held constant at 15.8 percent, capacity factor is held constant at 0.85 and electricity prices are
held constant at the values shown in Table 22. The variations in fuel price are expressed as
percentages of the Base Case fuel price, with a range of -10 percent to +30 percent. For the
biomass technology scenarios both the price of the biomass used to fuel the CHP system and the
price of offset natural gas boiler fuel are increased or decreased by the given percentage. It is
important to note that this sensitivity analysis only illustrates sensitivity to changes in fuel prices. In
the real world, future natural gas prices increases will tend to drive up electricity prices, which would
somewhat mitigate the degradation in CHP financial viability.
Note that most of the cells in are dark gray, indicating that savings were less than zero for that
specific sensitivity analysis. In other words, with the base case values for the other parameters
(particularly WACC at 15.8 percent) CHP is not cost-effective in this simplified analysis except for the
very largest biomass CHP scenarios.
Annual savings as % of capital with given WACC
50.0% 24.7% 15.8% 7.3% 4.0%
Natural Gas
30-500 kW
500 kW - 1 MW
1 - 5 MW 1.2%
5 - 20 MW 1.0%
> 20 MW 5.4% 7.7%
Biomass
1 - 5 MW 1.2% 3.5%
5 - 20 MW 2.8% 5.1%
> 20 MW 0.7% 6.7% 9.0%
Dark gray cells indicate size range is not cost-effective in these sensitivity analyses.
Technology
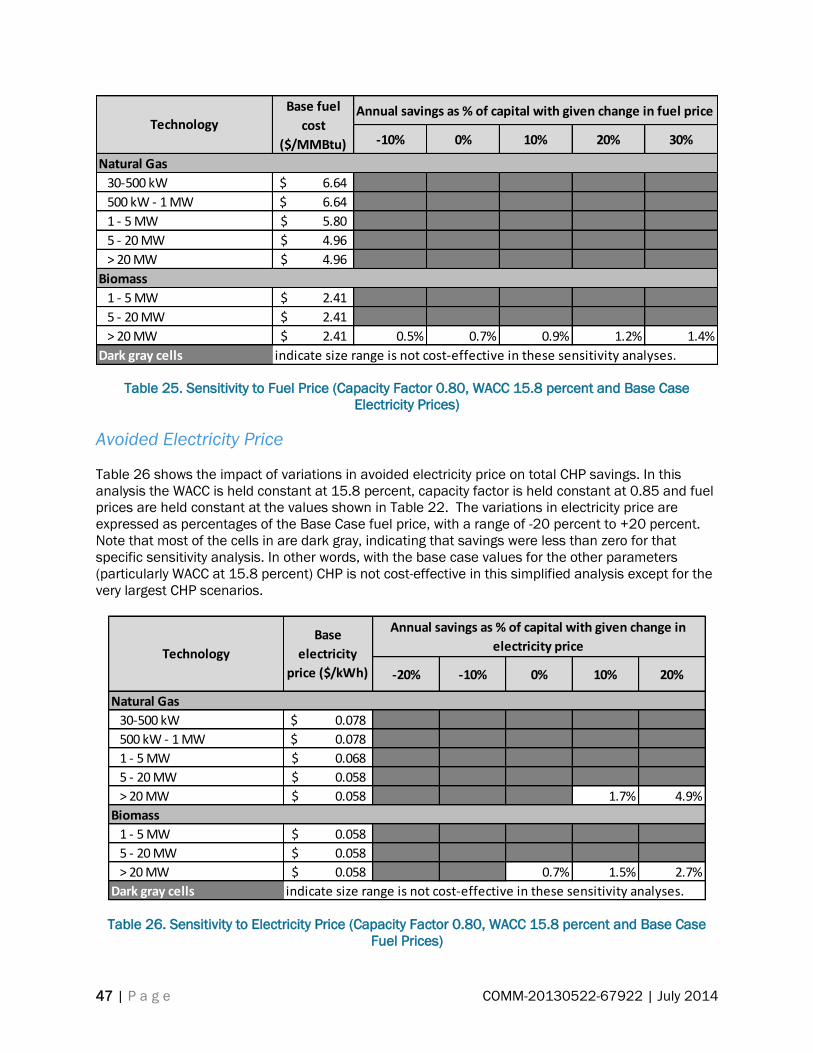
47 | P a g e COMM-20130522-67922 | July 2014
Table 25. Sensitivity to Fuel Price (Capacity Factor 0.80, WACC 15.8 percent and Base Case
Electricity Prices)
Avoided Electricity Price
Table 26 shows the impact of variations in avoided electricity price on total CHP savings. In this
analysis the WACC is held constant at 15.8 percent, capacity factor is held constant at 0.85 and fuel
prices are held constant at the values shown in Table 22. The variations in electricity price are
expressed as percentages of the Base Case fuel price, with a range of -20 percent to +20 percent.
Note that most of the cells in are dark gray, indicating that savings were less than zero for that
specific sensitivity analysis. In other words, with the base case values for the other parameters
(particularly WACC at 15.8 percent) CHP is not cost-effective in this simplified analysis except for the
very largest CHP scenarios.
Table 26. Sensitivity to Electricity Price (Capacity Factor 0.80, WACC 15.8 percent and Base Case
Fuel Prices)
Annual savings as % of capital with given change in fuel price
-10% 0% 10% 20% 30%
Natural Gas
30-500 kW 6.64$
500 kW - 1 MW 6.64$
1 - 5 MW 5.80$
5 - 20 MW 4.96$
> 20 MW 4.96$
Biomass
1 - 5 MW 2.41$
5 - 20 MW 2.41$
> 20 MW 2.41$ 0.5% 0.7% 0.9% 1.2% 1.4%
Dark gray cells indicate size range is not cost-effective in these sensitivity analyses.
Technology
Base fuel
cost
($/MMBtu)
Annual savings as % of capital with given change in
electricity price
-20% -10% 0% 10% 20%
Natural Gas
30-500 kW 0.078$
500 kW - 1 MW 0.078$
1 - 5 MW 0.068$
5 - 20 MW 0.058$
> 20 MW 0.058$ 1.7% 4.9%
Biomass
1 - 5 MW 0.058$
5 - 20 MW 0.058$
> 20 MW 0.058$ 0.7% 1.5% 2.7%
Dark gray cells indicate size range is not cost-effective in these sensitivity analyses.
Base
electricity
price ($/kWh)
Technology
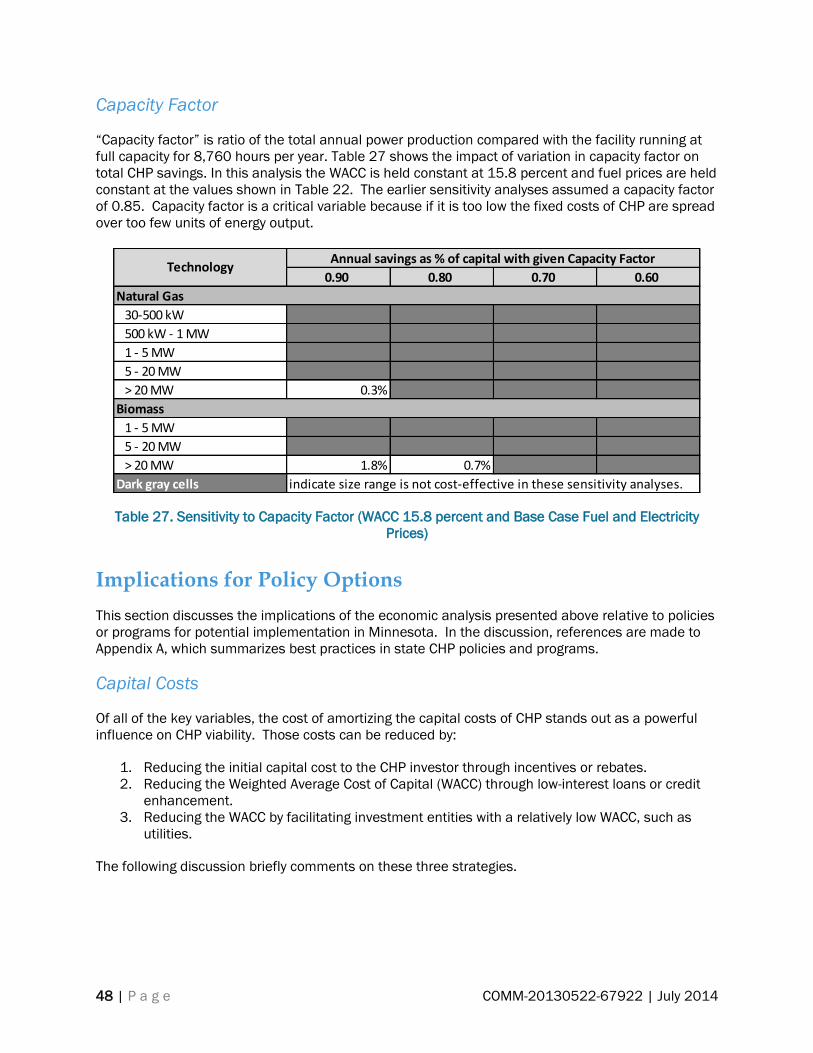
48 | P a g e COMM-20130522-67922 | July 2014
Capacity Factor
“Capacity factor” is ratio of the total annual power production compared with the facility running at
full capacity for 8,760 hours per year. Table 27 shows the impact of variation in capacity factor on
total CHP savings. In this analysis the WACC is held constant at 15.8 percent and fuel prices are held
constant at the values shown in Table 22. The earlier sensitivity analyses assumed a capacity factor
of 0.85. Capacity factor is a critical variable because if it is too low the fixed costs of CHP are spread
over too few units of energy output.
Table 27. Sensitivity to Capacity Factor (WACC 15.8 percent and Base Case Fuel and Electricity
Prices)
Implications for Policy Options
This section discusses the implications of the economic analysis presented above relative to policies
or programs for potential implementation in Minnesota. In the discussion, references are made to
Appendix A, which summarizes best practices in state CHP policies and programs.
Capital Costs
Of all of the key variables, the cost of amortizing the capital costs of CHP stands out as a powerful
influence on CHP viability. Those costs can be reduced by:
1. Reducing the initial capital cost to the CHP investor through incentives or rebates.
2. Reducing the Weighted Average Cost of Capital (WACC) through low-interest loans or credit
enhancement.
3. Reducing the WACC by facilitating investment entities with a relatively low WACC, such as
utilities.
The following discussion briefly comments on these three strategies.
Annual savings as % of capital with given Capacity Factor
0.90 0.80 0.70 0.60
Natural Gas
30-500 kW
500 kW - 1 MW
1 - 5 MW
5 - 20 MW
> 20 MW 0.3%
Biomass
1 - 5 MW
5 - 20 MW
> 20 MW 1.8% 0.7%
Dark gray cells indicate size range is not cost-effective in these sensitivity analyses.
Technology
49 | P a g e COMM-20130522-67922 | July 2014
Incentives
As described in detail in Appendix A, incentive programs have been implemented in other states,
generally through electric utility rebate programs. This is a policy approach worthy of further
investigation for Minnesota.
Some successful electric utility programs combine capital and operating incentives. For example,
Maryland’s successful Baltimore Gas and Electric (BG&E)’s Smart Energy Savers Program. The
incentive program is structured as follows:
$75/kW after the system has been designed and a commitment letter has been signed;
$175/kW after the system has been installed and commissioned and undergone an
inspection; and
$0.07/kWh for the first 18 months of system performance, after metered data has been
reviewed.
This incentive program is applicable to systems that are at least 65 percent efficient and do not
export excess power to the grid. The maximum incentive offered by BG&E is $2 million for a single
project, and is available to almost all non-residential customer classes.
In New York, NYSERDA’s Combined Heat and Power (CHP) Performance Program provides the
following incentives:
Systems may earn up to $0.10/kWh generation;
Systems may earn an additional $600/kW or $750/kW of summer demand reduction,
depending on location in the state; and
Systems may earn additional bonus incentives if they do any of the following:
o Serve critical infrastructure;
o Serve an area determined to be a challenged area of the grid of particular interest to
the local utility; and
o Exemplify “superior” efficiency.
These incentives are performance-based and correspond to the summer-peak demand reduction
(kW), energy generation (kWh) achieved by the CHP System on an annual basis over a two-year
measurement and verification period.
The recently announced Illinois Department of Commerce and Economic Opportunity (DCEO) public
sector CHP incentive program includes performance based incentives to provide financial assistance
during various stages of a project, including after the design phase, commissioning, and after 12
months of measured operational performance:
Design Incentive: $75/kW capacity (following completion of the design phase).
Constructive Incentive: $175/kW capacity (following successful commissioning of the
system).
Production Incentive: $0.08/kWh (with efficiency ≥ 70 percent HHV) OR $0.06/kWh
(efficiency ≥ 60 percent but < 70 percent HHV) of “useful electric energy” produced (after 12
months of operation based on meeting the measured operating requirements of the system).
The total incentive (Design + Construction + Production) is capped at $2 million or 50 percent of the
project cost, whichever is less. The design incentive is capped at $195,000 or 50 percent of design

50 | P a g e COMM-20130522-67922 | July 2014
cost, whichever is less. The construction incentive is capped at $650,000 or 50 percent of the
construction cost, whichever is less.
The Illinois program was designed to deliver a total incentive value of about $750 per kW when all
incentives are combined (Cuttica 2014).
A common constraint in existing state incentive programs is that they are limited to relatively small
projects. For example, in both Maryland and Illinois, the maximum incentive is $2 million. In New
York the maximum is $2.6 million. Such limitations significantly limit the benefit of incentive
programs because the greatest potential MW of CHP are in the larger projects (5 MW and above).
Low-Interest Loans
No examples of state low-interest loans and/or credit enhancement programs were found. Given the
generally high WACC of most potential CHP investors, marginal decreases in interest rates are
unlikely to trigger significant investment by industrial or commercial businesses. However,
institutional entities, such as universities or hospitals, generally have lower WACCs and could
potentially benefit from a low interest loan fund or credit enhancement program.
Utility Investment in CHP
Facilitating investment in CHP by entities with low WACC could have a significant positive impact on
CHP implementation. Given that electric and gas utilities have relatively low WACCs, this is a highly
promising direction for Minnesota policy development. Although there are some current examples of
utility ownership of CHP, there is no current goal or set of policies designed to encourage utilities to
own and operate CHP plants.
Value of Electricity
The value of CHP-generated electricity is a significant variable. This value is the sum of:
Avoided purchases of electricity (less the net impact of standby charges);
Renewable Energy Credits (RECs) or potentially Alternative Portfolio Standard Credits;
Production incentives incorporated into a Conservation Improvement Program;
Value of carbon emission reductions;
Payments for value-added grid services; and
Revenue from sale of excess generation, if any.
Standby Rates. Based on the Energy Resources Center study (Energy Resources Center 2014), as
discussed above under “Key Challenges,” standby rates do not appear to be a relatively significant
barrier in most utility service areas. While further progress can be made, action on standby rates
alone will not result in significant increases in CHP.
Portfolio Standard Credits. For renewably-fueled CHP, RECs could be an important help in achieving
financial viability. However, with significant carve-outs for wind and solar in the Xcel RPS, only 5% of
the 2020 goal of 31.5% could be met with biomass.
As discussed in Appendix A, states such as Massachusetts and Pennsylvania have implemented
Alternative Energy Portfolio Standards (APS) which set targets for a certain percentage of a supplier’s
capacity or generation to come from alternative energy sources such as CHP or municipal solid
waste projects. These standards can market-based and credit eligible projects with alternative
51 | P a g e COMM-20130522-67922 | July 2014
energy credits or some other form of credit, which can then be purchased by electricity suppliers to
meet compliance obligations.
Electricity Production Incentives. An operating incentive tied to production of electricity from CHP is
one approach to incentive programs as discussed above under “Incentives.” Operating incentives in
other states are relatively short-term, e.g. 12-18 months. A longer-term operating incentive is worthy
of consideration in Minnesota because it would provide a predictable and stable cash flow.
Carbon Emission Value. As discussed below under “Federal Policy Context,” proposed U.S.
Environmental Protection Agency regulations for new and existing power plants will create pressure
to reduce Minnesota power generation carbon emissions. Although the policy mechanisms have not
yet been determined, it is highly likely that some form of direct or indirect economic value of carbon
emission reductions will result. It is worthwhile considering how to encourage Minnesota utilities in
their Integrated Resource Planning to proactively assess CHP opportunities in their service territory
and compare those opportunities to other generation resources with an economic value given to
carbon dioxide emission reductions.
Value-Added Services. From a policy perspective, it is worthwhile examining the potential for CHP
generation to be given additional value in recognition of value-added services that are not currently
priced in the marketplace, such as locational value (reduced transmission/distribution losses) and
voltage support. Recognition of these benefits, as well as potential energy supply resiliency benefits
of CHP, could help stimulate increased implementation of CHP. However, this is a complex and
case-specific issue, and developing an appropriate policy direction would require further study.
Sale of Excess Power. To the extent that policy-makers desire to achieve high gains in efficiency and
carbon reduction through CHP, it is important to address the value of excess CHP power generation.
This issue is tied to capacity factor. Sizing the CHP system to meet the facility's heating load normally
results in the highest efficiency, carbon emission reductions and cost savings. However, in some
cases, sizing and operating the system to meet the heating load would result in more electricity
being produced than could be used on site. In these cases, the system would need to be operated
below capacity to avoid producing excess electricity. As shown in the above analysis, capacity factor
has a strong impact on CHP viability. Alternatively, instead of sizing the CHP facility for optimal
efficiency and carbon benefits, a CHP facility might be undersized to avoid the institutional and
regulatory constraints associated with selling excess power.
If sized and operated at the optimal capacity factor, many CHP systems would have to sell the excess
electricity production. However, in such cases, low market values for excess power generation will
significantly affect CHP economic viability.
Historically, electric utilities have generally not encouraged CHP because they have lacked incentives
to promote and/or implement CHP. Customer self-generation reduces electric utility sales and
profits. One solution is to “decouple” utility sales from profits, and some gas and electric utilities are
exploring decoupling.15
15 Centerpoint, a gas utility, has implemented a pilot program and is now expanding the program. Xcel, an
electric utility, has proposed a decoupling pilot in their current rate case. See Minnesota Public Utilities
Commission, Docket No. G-008/GR-13-316, June 9, 2014.

52 | P a g e COMM-20130522-67922 | July 2014
CHP Fuel Cost
In the context of incentives that natural gas utilities could provide to encourage CHP, a gas rate
discount could improve the economic feasibility of CHP. However, with natural gas CHP, the impact
of the natural gas price on CHP economics is somewhat diminished because although increased gas
prices increase the costs of CHP they also increase the savings from reduced gas use for heat
production.
Federal Policy Context
This section very briefly describes existing federal policies and programs that are relevant to future
implementation of CHP in Minnesota, including investment tax credits, production tax credits,
Department of Energy and Environmental Protection Agency program. See Appendix B for detailed
information about existing federal policies as well as descriptions of relevant proposed federal
legislation.
Tax Incentives
Investment tax credits for CHP were established by the Energy Improvement and Extension Act of
2008. The CHP credit is equal to 10 percent of expenditures, with no maximum limit stated, for the
first 15 MW of CHP property (United States Code 26 USC 48). The total CHP capacity must be equal
to or less than 50 MW. Except for CHP fueled with biomass, the total efficiency must exceed 60
percent. In addition, at least 20 percent of the total useful energy must be in the form of thermal
energy, and at least 20 percent must be in the form of electrical or mechanical energy. The CHP
credit applies to eligible property placed in service after October 3, 2008. Tax credits are available
for owners paying taxes on eligible systems placed in service on or before December 31, 2016.
The federal renewable electricity production tax credit (PTC) is a per-kilowatt-hour tax credit for
electricity generated by qualified energy resources and sold by the taxpayer to an unrelated person
during the taxable year (United States Code 26 USC 45). This credit is relevant to CHP systems fuels
with renewable energy. Current credit amounts relevant for CHP are:
Closed-Loop Biomass: $0.023/kWh.
Open-Loop Biomass: $0.011/kWh.
Landfill Gas: $0.011/kWh.
Municipal Solid Waste: $0.011/kWh.
The duration of the credit is generally 10 years after the date the facility is placed in service. Under
current law, construction must begin by December 31, 2013. While this expiration makes the PTC
moot for the future we include this information in the report because legislative efforts are being
made to extend the PTCs.
Interconnection Standards
A range of required or recommended interconnection standards have been developed by federal
agencies and other entities. Federal Energy Regulatory Commission (FERC) has established
standards for distributed generation connected at the transmission level. The Department of Energy
has recommended “best practices” for standards for state adoption. The National Association of
Regulatory Utility Commissioners (NARUC) has also recommended model state standards. The
Interstate Renewable Energy Council (IREC) has developed model rules for interconnection of small

53 | P a g e COMM-20130522-67922 | July 2014
distributed generation. These standards and model rules are described below, drawing on
information prepared by the U.S. Environmental Protection Agency (EPA dCHPP database).
Information/Education/Technical Assistance Programs
In August 2012, President Obama issued an Executive Order to facilitate investments in energy
efficiency at industrial facilities, with a strong emphasis on CHP as an efficiency strategy. The Order
seeks to support these investments through a variety of approaches, including encouraging private
sector investment by setting goals and highlighting the benefits of investment, improving
coordination at the Federal level, partnering with and supporting States, and identifying investment
models beneficial to the multiple stakeholders involved.
DOE's CHP Technical Assistance Partnerships (CHP TAPs), formerly called the Clean Energy
Application Centers (CEACs), promote and assist in transforming the market for CHP, waste heat to
power, and district energy technologies and concepts throughout the United States.
The Environmental Protection Agency’s CHP Partnership is a voluntary program seeking to reduce
the environmental impact of power generation by promoting the use of CHP. The Partnership works
closely with energy users, the CHP industry, state and local governments, and other clean energy
stakeholders to facilitate the development of new projects and to promote their environmental and
economic benefits.
Financing
Section 1703 of Title XVII of the Energy Policy Act of 2005 authorizes the U.S. Department of Energy
(DOE) to issue more than $10 billion in loan guarantees for energy efficiency, renewable energy and
advanced transmission and distribution projects. Projects must "avoid, reduce or sequester air
pollutants or anthropogenic emissions of greenhouse gases; and employ new or significantly
improved technologies as compared to commercial technologies in service in the United States at
the time the guarantee is issued."
CHP technologies are potentially eligible if a project meets the "new/improved" technology criteria.
In fact, in 2013 the DOE released a draft loan guarantee solicitation that explicitly mentioned CHP as
illustrative types of projects eligible for the program. However, this loan guarantee program will not
be useful for combined heat and power (CHP) for two reasons:
The majority of opportunities for saving energy are in deployment of commercial CHP
technologies, which do not appear to be eligible for this program; and
For CHP projects the proposed fees are onerous, especially in view of the relatively small size
of CHP projects.
Air Quality Standards
In December 2012, the U.S. Environmental Protection Agency issued a set of final adjustments to
Clean Air Act standards for major source and area source boilers as well as certain solid waste
incinerators. These rules are commonly called the “Boiler MACT” (maximum achievable control
technology) rule. The rule presents an opportunity for major source sites with coal- and oil-fired
boilers to consider switching to natural gas and/or natural gas-fired CHP instead of installing costly
emissions controls to achieve compliance. Significant opportunity exists in Minnesota to replace
some of the affected boilers with new CHP. Over 55 facilities in Minnesota will be impacted by the
new boiler rules, and while CHP may not be an appropriate measure for every affected facility, it

54 | P a g e COMM-20130522-67922 | July 2014
represents a potentially attractive opportunity to satisfy the new rules while establishing a long-term
onsite energy generation solution.
GHG Regulation of Power Plants
New Source Performance Standards
On September 20, 2013, the Environmental Protection Agency (EPA) issued a proposed new rule
pursuant to section 111 of the Clean Air Act (CAA), which would establish new source performance
standards (NSPS) for carbon dioxide (CO2) emissions from new fossil fuel-fired electric utility steam
generating units (EGUs) and natural gas-fired stationary combustion turbines.
The proposed rule would establish separate standards for certain types of natural gas-fired
combustion turbines and for coal-fired electric utility boilers, including integrated gasification
combined cycle (IGCC) units.
Notably for CHP, the proposed standard of performance for each subcategory is in the form of a
gross energy output-based CO2 emission limit expressed in units of emissions mass per unit of total
useful recovered energy, specifically, in pounds per megawatt-hour (lb/MWh). EPA proposes that
useful recovered energy include the gross electric output plus 75 percent of the useful thermal
output.
In addition, to recognize the environmental benefit of reduced electric transmission and distribution
losses of CHP, EPA has proposed that for CHP facilities meeting certain efficiency criteria the
measured electric output would be divided by 0.95 to account for a 5 percent avoided energy loss in
the transmission of electricity. The efficiency criteria require that at least 20 percent of the total
gross useful energy output consists of electric or direct mechanical output and that least 20 percent
of the total gross useful energy output consists of useful thermal output on a rolling three calendar
year basis,
Clean Power Plan (Existing Power Plants)
On June 18, 2014, the U.S. Environmental Protection Agency proposed rules for reducing
greenhouse gas (GHG) emissions in existing power plants through section 111 (d) of the Clean Air
Act. In general,16 the rule defines an “affected source” as a fossil fuel power plant designed to sell
more than 219,000 MWh of electricity per year and more than one-third of the potential electric
output to the grid.
The EPA has provided great flexibility to states in meeting GHG reduction goals by taking a “systems
approach” – allowing states to consider a wide range of actions that can be taken “beyond the fence
line” of the affected electric generating units (EGUs) to more cost-effectively reduce carbon dioxide
emissions. It is important to note that the Clean Power Plan sets out different goals for each state,
based on their ability to reduce emissions with these four “building blocks”:
heat rate17 improvements at coal-fired EGUs;
16 There are some inconsistencies in the proposed rule that suggest that gas-fired plants must be both
designed to and actually sell those threshold amounts on a three-year rolling average.
17 “Heat rate” means the amount of fuel required to produce one kilowatt-hour of useful energy (usually
expressed as Btu per kilowatt-hour of electricity).
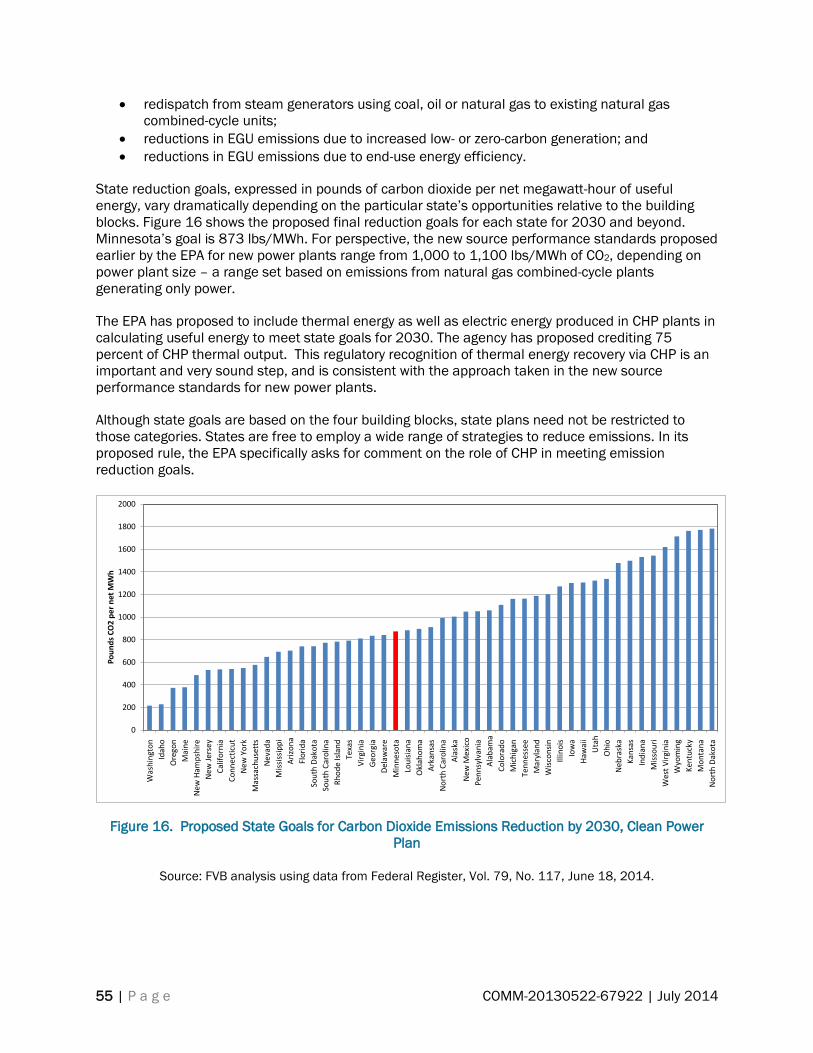
55 | P a g e COMM-20130522-67922 | July 2014
redispatch from steam generators using coal, oil or natural gas to existing natural gas
combined-cycle units;
reductions in EGU emissions due to increased low- or zero-carbon generation; and
reductions in EGU emissions due to end-use energy efficiency.
State reduction goals, expressed in pounds of carbon dioxide per net megawatt-hour of useful
energy, vary dramatically depending on the particular state’s opportunities relative to the building
blocks. Figure 16 shows the proposed final reduction goals for each state for 2030 and beyond.
Minnesota’s goal is 873 lbs/MWh. For perspective, the new source performance standards proposed
earlier by the EPA for new power plants range from 1,000 to 1,100 lbs/MWh of CO2, depending on
power plant size – a range set based on emissions from natural gas combined-cycle plants
generating only power.
The EPA has proposed to include thermal energy as well as electric energy produced in CHP plants in
calculating useful energy to meet state goals for 2030. The agency has proposed crediting 75
percent of CHP thermal output. This regulatory recognition of thermal energy recovery via CHP is an
important and very sound step, and is consistent with the approach taken in the new source
performance standards for new power plants.
Although state goals are based on the four building blocks, state plans need not be restricted to
those categories. States are free to employ a wide range of strategies to reduce emissions. In its
proposed rule, the EPA specifically asks for comment on the role of CHP in meeting emission
reduction goals.
Figure 16. Proposed State Goals for Carbon Dioxide Emissions Reduction by 2030, Clean Power
Plan
Source: FVB analysis using data from Federal Register, Vol. 79, No. 117, June 18, 2014.
0
200
400
600
800
1000
1200
1400
1600
1800
2000
Was
hin
gto
n
Idah
o
Ore
gon
Mai
ne
New
Ham
psh
ire
New
Jer
sey
Cal
ifo
rnia
Co
nn
ecti
cut
New
Yo
rk
Mas
sach
use
tts
Nev
ada
Mis
siss
ipp
i
Ari
zon
a
Flo
rid
a
So
uth
Dak
ota
So
uth
Car
olin
a
Rh
od
e Is
lan
d
Tex
as
Vir
gin
ia
Geo
rgia
Del
awar
e
Min
nes
ota
Lo
uis
ian
a
Okl
aho
ma
Ark
ansa
s
No
rth
Car
olin
a
Ala
ska
New
Mex
ico
Pen
nsy
lvan
ia
Ala
bam
a
Co
lora
do
Mic
hig
an
Ten
nes
see
Mar
ylan
d
Wis
con
sin
Illin
ois
Iow
a
Haw
aii
Uta
h
Oh
io
Neb
rask
a
Kan
sas
Ind
ian
a
Mis
sou
ri
Wes
t V
irgi
nia
Wyo
min
g
Ken
tuck
y
Mo
nta
na
No
rth
Dak
ota
Po
un
ds
CO
2 p
er
net
MW
h
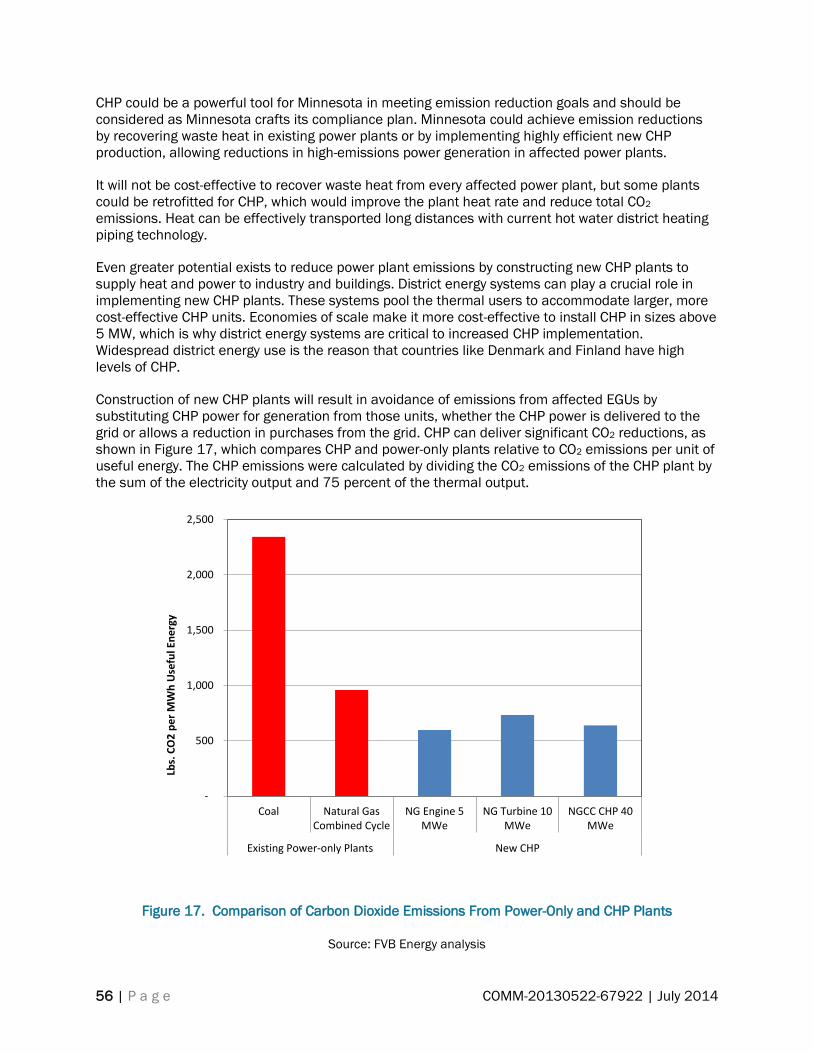
56 | P a g e COMM-20130522-67922 | July 2014
CHP could be a powerful tool for Minnesota in meeting emission reduction goals and should be
considered as Minnesota crafts its compliance plan. Minnesota could achieve emission reductions
by recovering waste heat in existing power plants or by implementing highly efficient new CHP
production, allowing reductions in high-emissions power generation in affected power plants.
It will not be cost-effective to recover waste heat from every affected power plant, but some plants
could be retrofitted for CHP, which would improve the plant heat rate and reduce total CO2
emissions. Heat can be effectively transported long distances with current hot water district heating
piping technology.
Even greater potential exists to reduce power plant emissions by constructing new CHP plants to
supply heat and power to industry and buildings. District energy systems can play a crucial role in
implementing new CHP plants. These systems pool the thermal users to accommodate larger, more
cost-effective CHP units. Economies of scale make it more cost-effective to install CHP in sizes above
5 MW, which is why district energy systems are critical to increased CHP implementation.
Widespread district energy use is the reason that countries like Denmark and Finland have high
levels of CHP.
Construction of new CHP plants will result in avoidance of emissions from affected EGUs by
substituting CHP power for generation from those units, whether the CHP power is delivered to the
grid or allows a reduction in purchases from the grid. CHP can deliver significant CO2 reductions, as
shown in Figure 17, which compares CHP and power-only plants relative to CO2 emissions per unit of
useful energy. The CHP emissions were calculated by dividing the CO2 emissions of the CHP plant by
the sum of the electricity output and 75 percent of the thermal output.
Figure 17. Comparison of Carbon Dioxide Emissions From Power-Only and CHP Plants
Source: FVB Energy analysis
-
500
1,000
1,500
2,000
2,500
Coal Natural GasCombined Cycle
NG Engine 5MWe
NG Turbine 10MWe
NGCC CHP 40MWe
Existing Power-only Plants New CHP
Lbs.
CO
2 p
er
MW
h U
sefu
l En
erg
y

57 | P a g e COMM-20130522-67922 | July 2014
Straw Man Report and Stakeholder Consultation
A “Straw Man” draft report was prepared which: 1) summarized existing Minnesota policies; 2)
described CHP barriers and the analysis of the economic significance of key variables; 3) outlined
draft Policy Options; and 4) addressed issues associated with the Policy Options.
Informal stakeholder consultations were conducted following distribution of the Straw Man report,
including discussions with electric utilities, gas utilities, thermal utilities, equipment suppliers,
customers, advocacy groups and consultants.
See Appendix C for the Straw Man report and Appendix D for notes from the stakeholder
consultations.
The informal stakeholder discussion provided a wide range of input but a number of common
themes. Both electric and gas utilities, and other stakeholders, noted the relatively weak customer
interest in CHP, and the barriers posed by limited expertise, resources and time available to
customers to develop CHP projects. Disparities in CHP opportunities between utility service territories
were noted multiple times.
Utilities were generally unenthusiastic about new goals or mandates.
Many stakeholders recognized the benefits of using low utility WACC to finance CHP systems, as well
as the benefits of creating incentives for electric utilities to promote and implement CHP rather than
discourage it. Utility/ratepayer risks related to utility ownership of CHP were frequently discussed.
There was almost universal recognition of the potential synergy between state CHP policy and
planning for compliance with Clean Power Plan.
Multiple stakeholders noted the opportunity to recover waste heat from existing power plants, and
the essential role that district energy system play in distributing the heat (or cooling produced using
the recovered heat).
There was strong support for a requirement that electric utilities evaluate CHP in Integrated
Resource Planning.
Utilities noted the high level of opt-outs as a potential barrier to using the CIP as a major policy for
driving CHP. Utilities and others noted the lack of clarity in current statutes relative to the role of CHP
in CIP, including potential confusion regarding whether CHP is a supply side or demand side option.
Multiple stakeholders noted the challenges of funding capital incentives for CHP within CIP given the
“lumpiness” of CHP projects, i.e., there may be no projects for a number of years, and then a large
project may finally reach fruition.

58 | P a g e COMM-20130522-67922 | July 2014
Policy Options
Following the stakeholder consultation, modifications were made to the Policy Options based on
stakeholder feedback and additional analysis. Table 28 provides an overview of the revised Policy
Options on which further analysis was undertaken in this study. The section describes the revised
Policy Options. The subsequent section addresses detailed analysis of potential issues relating to the
Policy Options.
Policy Option groups 1 and 2 are based on natural gas and electric utility Conservation Improvement
Program (CIP) incentives targeted at end-users. Specific Policy Options were modeled with either
capital incentives, operational incentives, or a combination of both capital and operating incentives.
Policy Option group 3 focused on CIP incentives for utility ownership of CHP, with the utility using its
low WACC to fund CHP systems and would be able to gain CIP credit for the CHP operations, This
option also provides for operating incentives for CHP implemented by customers or third parties.
In Policy Option 4 it is assumed that a specific carve-out is made for bioenergy CHP18 in either the
existing Renewable Portfolio Standard (RPS) or an expanded RPS.
Policy Option group 5 addresses the potential to create a new Alternative Portfolio Standard (APS)
which would require electric utilities to obtain a specified percentage of sales from CHP by a given
year.
18 Bioenergy is an inclusive term that encompasses: 1) biomass combustion CHP (in which wood or other
biomass is combusted to produce steam that is used to spin a steam turbine-generator or an organic rankine
cycle turbine-generator; 2) internal combustion engine or combustion turbine CHP using gaseous or liquid fuel
produced from biomass such as manure, agricultural residues, sewage sludge, etc.

59 | P a g e COMM-20130522-67922 | July 2014
Table 28. Overview of Policy Options
Conservation Improvement Program
Current Law
Minnesota’s Conservation Improvement Program (CIP), in effect an Energy Efficiency Resource
Standard without tradable certificates, is a potential mechanism for encouraging implementation of
CHP. H.F.729, passed in 2013, modified the definition of “energy conservation improvement” in
Minnesota Statutes 2012, section 216B.241 to include “waste heat recovered and used as thermal
energy," which is then defined as “capturing heat energy that would otherwise be exhausted or
dissipated to the environment from machinery, buildings, or industrial processes and productively
using such recovered thermal energy where it was captured or distributing it as thermal energy to
other locations where it is used to reduce demand side consumption of natural gas, electric energy,
or both.” (H.F. 729)
H.F. 729 also includes Subd. 10 as follows:
‘(Waste heat recovery; thermal energy distribution). Demand side natural gas or electric
energy displaced by use of waste heat recovered and used as thermal energy, including the
recovered thermal energy from a cogeneration or combined heat and power facility, is
Conservation Improvement Program
Renewable
Portfolio
Standard
Alternative
Portfolio
Standard
CHP requirements in
separate new CIP tier (% of
sales each year)
Bioenergy CHP
requirement (% of
sales by 2030)
CHP requirement
(% of sales by
2030)
Policy Option SummaryOption
#
Natural
Gas
Electric
IOUs
Electric
Munis &
Coops
Electric
IOUs
Electric
Munis &
Coops
Electric
IOUs
Electric
Munis &
Coops
1.1Capital Incentive ($100 per
1000 Btu/hr)N/A 0.10% N/A N/A N/A N/A N/A N/A
1.2Operating Gas Rate Discount
($0.75/MMBtu, 15 yrs)N/A 0.10% N/A N/A N/A N/A N/A N/A
1.3Capital and Operating Incentives
in Options 1.1 and 1.2N/A 0.15% N/A N/A N/A N/A N/A N/A
2.1 Capital Incentive ($500 per kW) N/A N/A 0.20% 0.08% N/A N/A N/A N/A
2.2Operating Electric Rate Discount
($10 per MWh, 15 yrs)N/A N/A 0.20% 0.08% N/A N/A N/A N/A
2.3Capital and Operating Incentives
in Options 2.1 and 2.2N/A N/A 0.30% 0.12% N/A N/A N/A N/A
Gas Utility with Customer
Incentives Plus CIP Credit for
Utility Owned CHP
3.1 Same as Option 1.2$0.75 per MMBtu gas
supplied to CHP, 15 yrs0.23% N/A N/A N/A N/A N/A N/A
Electric Utility with Customer
Incentives Plus CIP Credit for
Utility Owned CHP
3.2 Same as Option 2.2$10 per MWh of CHP
electricity produced, 15 yrsN/A 0.45% 0.18% N/A N/A N/A N/A
RPS carve-out for bioenergy CHP
in existing or expanded RPS4 N/A N/A N/A N/A N/A 1.50% 0.60% N/A N/A
5.1 N/A N/A N/A N/A N/A N/A N/A 8.00% 3.20%
5.2 N/A N/A N/A N/A N/A N/A N/A 12.00% 4.80%
Notes:
CIP = Conservation Improvement Program MWh =MegaWatt-hour
IOU = Investor-Owned Utility kW = kiloWatts
Muni = Municipal Utility RPS = Renewable Portfolio Standard
Coop = Cooperative APS = Alternative Portfolio Standard
MMBtu = milion British Thermal Units IRP = Integrated Resource Planning
CIP Incentives for Customer-
or Third Party-Owned CHP
CIP Credit to Util ities
for Util ity-Implemented
CHP
Gas Utility CIP with Incentives for
Customer- or Third Party-
Implemented CHP
Electric Utility CIP with Incentives
for Customer- or Third Party-
Implemented CHP
New Alternative Portfolio
Standard for CHP
60 | P a g e COMM-20130522-67922 | July 2014
eligible to be counted towards a utility's natural gas or electric energy savings goals, subject
to department approval.’
The following discussion addresses the question: Does Minnesota Statute 216B.241, as modified by
H.F.729, includes CHP as an energy conservation measure that could be incorporated into natural
gas or electric utility Conservation Improvement Programs?
1. Prior to H.F. 729, CHP bottoming cycles19 appear to already be included in Minnesota Statute
216B.241Subd. 1 (“Energy conservation improvement may include waste heat that is recovered
and converted into electricity…).
2. CHP topping cycles20 were added in H.F.729. Article 13, Section 2, Subd. 1, part (e) states
“Energy conservation improvement also includes waste heat recovered and used as thermal
energy.” The definition of “waste heat recovered and used as thermal energy” in Subd. 1, part
(n) describes topping cycle CHP, although the phrasing is unconventional. CHP does indeed
capture heat energy for useful purposes that would otherwise be exhausted or dissipated to the
environment from buildings or industrial processes.
3. One could debate whether there might be an implied condition or caveat, e.g. “….from ‘normal’
or ‘basic’ building systems or industrial processes. However, it is clear that if, for example, a
building installs an internal combustion engine to generate power and it recovers and uses the
waste heat:
Such an installation is CHP; and
It meets the definition of “waste heat recovered and used as thermal energy”.
4. Subd. 10 states that demand side natural gas or electricity savings can be counted toward a
utility’s natural gas or electricity reduction goal. This could be interpreted to mean that such
savings can be counted toward the utility’s goal but that CIP funds should not be expended on
such projects. However, it is uncertain whether the legislature intended to give “credit” to a
utility for something that utility did nothing to implement. Further, the rationale articulated in
point 2 above would make CHP an “energy conservation measure” and in Minnesota Statutes
216B.241, utilities can invest in energy conservation measures.
5. The law lacks clarity regarding how electric utilities should count the energy savings. While the
construction of Subd. 10 suggests a (logical) parallel – reduced demand side natural gas or
electric energy can be counted by the respective utility type (natural gas or electric), the logic
breaks down when we come to in the phrase “natural gas or electricity displaced by the use of
waste heat recovered and used as thermal energy… (Emphasis added.)
6. Certainly, recovery and use of waste heat will displace boiler fuel consumption to produce the
heat required by the end user, and in most cases that fuel would be natural gas (although in
some instances it could be residual fuel oil, distillate fuel oil, propane or other fuel). Thus,
relative to natural gas utilities it is reasonably clear how to count the savings.
7. Waste heat can be used to produce cooling using absorption chillers or steam turbine chillers,
but the magnitude of the economically practical potential is limited.
19 A bottoming cycle converts waste heat to electricity through, for example, organic rankine cycle technology.
20 A topping cycle recovers waste heat from electricity generation for use as thermal energy.
61 | P a g e COMM-20130522-67922 | July 2014
8. Technically, an electric utility could displace electricity consumption through recovery and
distribution of waste heat. Practically, however, this is not a realistic scenario because CHP heat
must be delivered in the form of hot water or steam and would require expensive building
conversion investments to convert from electric heat.
9. Based on the reasoning articulated in point 2, CHP is an energy conservation measure. Relative
to Subd. 10, CHP will reduce demand side consumption of boiler fuel, usually natural gas, in the
process of generating electricity. CHP would reduce demand side electric energy, in the process
of generating thermal energy, because the CHP host would displace electricity purchased from
the utility with electricity generated through CHP.
10. Methodological questions remain regarding the appropriate calculation of savings in either
situation (fuel savings when power generation is considered the base activity, and electricity
savings when thermal production is considered the base activity), but these are solvable
questions of implementation.
11. Conclusion: There is a reasonable argument that, in sum, Minnesota Statutes 216B.241 as
modified by H.F.729 includes CHP as an energy conservation measure, and that either natural
gas or electric utilities could count the respective natural gas or electricity consumption
reductions in their CIP resulting from: incentives provided by the utility to encourage customer- or
third party-financed CHP; or from direct utility investment in CHP at customer sites.
CIP Policy Options for Minnesota
CIP Policy Options and related potential CIP goals are outlined below, following by an analysis of the
implications of the potential CIP goals relative to levels of CHP implementation achieved in
MegaWatts (MW) of CHP capacity.
Natural Gas Utility CIP
Policy Options 1.1 and 1.2 would establish a new, separate CHP tier in natural gas utility CIP goals
equal to 0.10 percent of annual sales.
Policy Option 1.1 would provide a natural gas utility capital incentive following successful
commissioning of the system, equal to $100 per thousand Btu of CHP thermal energy output. The
impact of this type of incentive on reduction of capital costs for each size category of CHP is shown in
Table 29. This table shows that Policy Option 1.1 would provide capital incentives that equate to
relatively higher percentages for larger CHP plants than smaller ones. This is due primarily to the
fact that larger facilities generally have lower capital costs per unit of thermal output capacity.
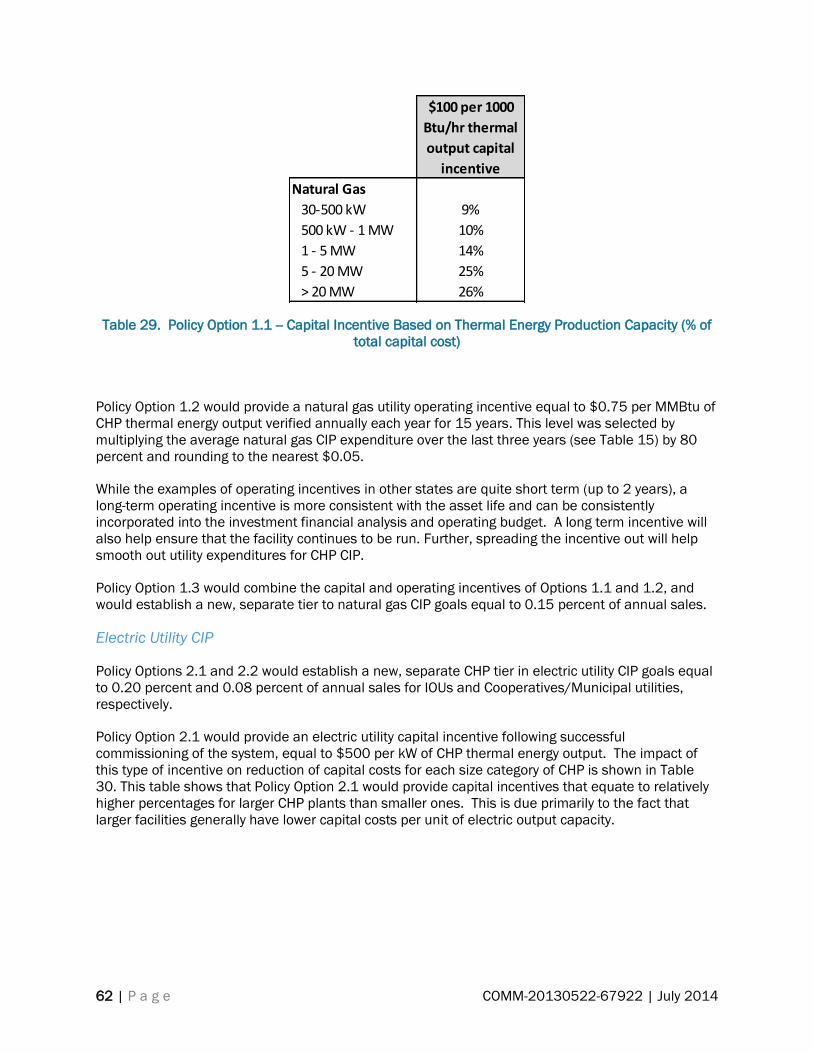
62 | P a g e COMM-20130522-67922 | July 2014
Table 29. Policy Option 1.1 -- Capital Incentive Based on Thermal Energy Production Capacity (% of
total capital cost)
Policy Option 1.2 would provide a natural gas utility operating incentive equal to $0.75 per MMBtu of
CHP thermal energy output verified annually each year for 15 years. This level was selected by
multiplying the average natural gas CIP expenditure over the last three years (see Table 15) by 80
percent and rounding to the nearest $0.05.
While the examples of operating incentives in other states are quite short term (up to 2 years), a
long-term operating incentive is more consistent with the asset life and can be consistently
incorporated into the investment financial analysis and operating budget. A long term incentive will
also help ensure that the facility continues to be run. Further, spreading the incentive out will help
smooth out utility expenditures for CHP CIP.
Policy Option 1.3 would combine the capital and operating incentives of Options 1.1 and 1.2, and
would establish a new, separate tier to natural gas CIP goals equal to 0.15 percent of annual sales.
Electric Utility CIP
Policy Options 2.1 and 2.2 would establish a new, separate CHP tier in electric utility CIP goals equal
to 0.20 percent and 0.08 percent of annual sales for IOUs and Cooperatives/Municipal utilities,
respectively.
Policy Option 2.1 would provide an electric utility capital incentive following successful
commissioning of the system, equal to $500 per kW of CHP thermal energy output. The impact of
this type of incentive on reduction of capital costs for each size category of CHP is shown in Table
30. This table shows that Policy Option 2.1 would provide capital incentives that equate to relatively
higher percentages for larger CHP plants than smaller ones. This is due primarily to the fact that
larger facilities generally have lower capital costs per unit of electric output capacity.
$100 per 1000
Btu/hr thermal
output capital
incentive
Natural Gas
30-500 kW 9%
500 kW - 1 MW 10%
1 - 5 MW 14%
5 - 20 MW 25%
> 20 MW 26%
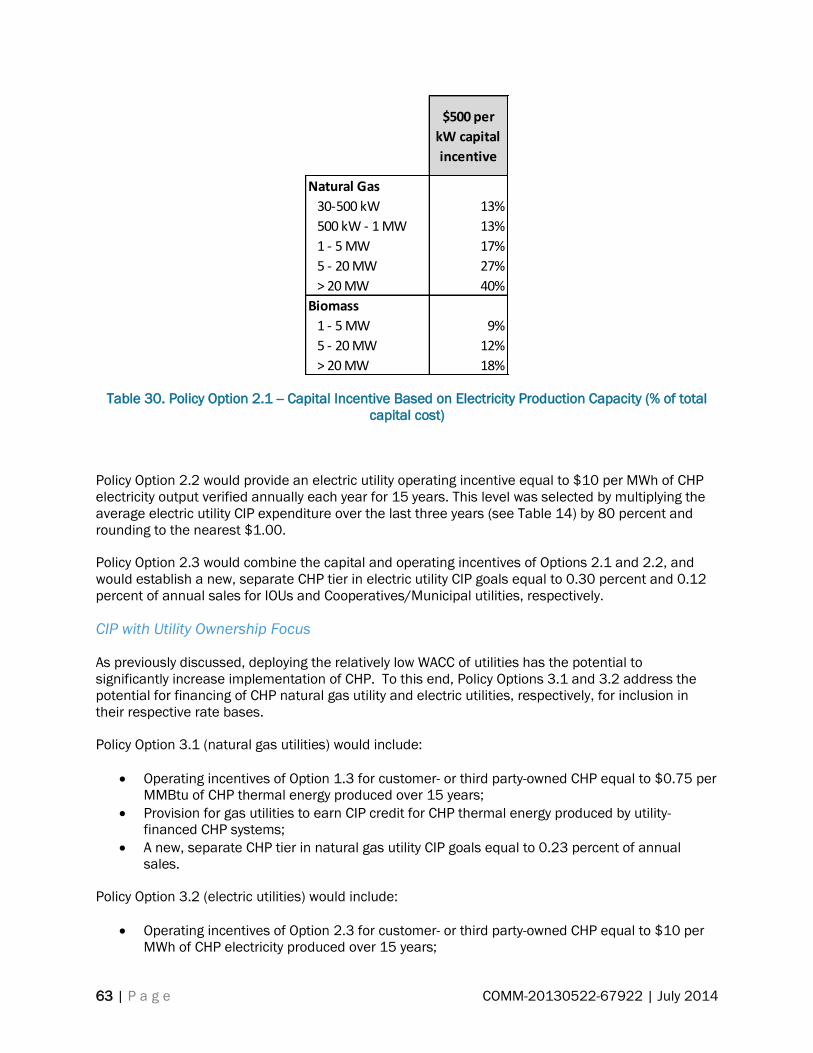
63 | P a g e COMM-20130522-67922 | July 2014
Table 30. Policy Option 2.1 -- Capital Incentive Based on Electricity Production Capacity (% of total
capital cost)
Policy Option 2.2 would provide an electric utility operating incentive equal to $10 per MWh of CHP
electricity output verified annually each year for 15 years. This level was selected by multiplying the
average electric utility CIP expenditure over the last three years (see Table 14) by 80 percent and
rounding to the nearest $1.00.
Policy Option 2.3 would combine the capital and operating incentives of Options 2.1 and 2.2, and
would establish a new, separate CHP tier in electric utility CIP goals equal to 0.30 percent and 0.12
percent of annual sales for IOUs and Cooperatives/Municipal utilities, respectively.
CIP with Utility Ownership Focus
As previously discussed, deploying the relatively low WACC of utilities has the potential to
significantly increase implementation of CHP. To this end, Policy Options 3.1 and 3.2 address the
potential for financing of CHP natural gas utility and electric utilities, respectively, for inclusion in
their respective rate bases.
Policy Option 3.1 (natural gas utilities) would include:
Operating incentives of Option 1.3 for customer- or third party-owned CHP equal to $0.75 per
MMBtu of CHP thermal energy produced over 15 years;
Provision for gas utilities to earn CIP credit for CHP thermal energy produced by utility-
financed CHP systems;
A new, separate CHP tier in natural gas utility CIP goals equal to 0.23 percent of annual
sales.
Policy Option 3.2 (electric utilities) would include:
Operating incentives of Option 2.3 for customer- or third party-owned CHP equal to $10 per
MWh of CHP electricity produced over 15 years;
$500 per
kW capital
incentive
Natural Gas
30-500 kW 13%
500 kW - 1 MW 13%
1 - 5 MW 17%
5 - 20 MW 27%
> 20 MW 40%
Biomass
1 - 5 MW 9%
5 - 20 MW 12%
> 20 MW 18%

64 | P a g e COMM-20130522-67922 | July 2014
Provision for electric utilities to earn CIP credit for CHP electricity produced by utility-financed
CHP systems;
A new, separate CHP tier in electric utility CIP goals equal to 0.45 percent and 0.18 percent
of annual sales for IOUs and Cooperatives/Municipal utilities, respectively.
Renewable Portfolio Standard
Policy Option 4 would establish, within the existing or an expanded RPS, specific carve-outs for
bioenergy CHP as follows:
IOUs would have to achieve 0.30 percent and 1.35 percent of sales by 2020 and 2030,
respectively.
Cooperatives and municipal utilities would have to achieve 0.12 percent and 0.54 percent of
sales by 2020 and 2030, respectively.
Alternative Portfolio Standard
Policy Options 5.1 and 5.2 would establish a new Alternative Energy Portfolio Standard, with Option
5.1 setting lower goals and Option 5.2 setting higher goals.
Option 5.1 would require that:
IOUs would have to achieve 2.0 percent and 8.0 percent of sales by 2020 and 2030,
respectively.
Cooperatives and municipal utilities would have to achieve 0.8 percent and 3.2 percent of
sales by 2020 and 2030, respectively.
Option 5.2 would require that:
IOUs would have to achieve 3.0 percent and 12.0 percent of sales by 2020 and 2030,
respectively.
Cooperatives and municipal utilities would have to achieve 1.2 percent and 4.8 percent of
sales by 2020 and 2030, respectively.
Requirements for cooperatives and municipal utilities were set at lower levels than for IOUs to
account for the relatively fewer CHP opportunities in the more rural areas served by coops/munis.
Integrated Resource Planning
One additional option was analyzed that should be considered a complement to, rather than a
substitute for, other options. This option would require electric utilities to demonstrate that, before
power-only capacity is proposed, CHP opportunities within their service territory have been
thoroughly assessed to determine the benefits of CHP relative to total primary energy efficiency, GHG
emissions, power grid resiliency, peak demand management and risk management. Analysis was
performed with assumed GHG values of $20, $40 and $60 per metric tonne CO2 equivalent.

65 | P a g e COMM-20130522-67922 | July 2014
Policy Analysis
This section: 1) analyzes program design issues in light of stakeholder input; 2) summarizes the
estimated impact of Policy Options on implementation of CHP (with further detail provided in the
companion report “Assessment of the Technical and Economic Potential for CHP in Minnesota”); 3)
calculates the impact of Policy Options on participants and society for example CHP projects; and 4)
draws conclusions regarding the suitability of the policy options for Minnesota.
Separate Tier
Minnesota electric and gas utilities have largely met the CIP savings goals established for them, as
discussed under “Current Minnesota Policies and Program.” In stakeholder discussions, both gas
and electric utilities have noted that, having previously addressed the “lowest hanging fruit” relative
to efficiency opportunities, the next increments of efficiency will be harder and more expensive to
find. In that context, the incorporation of CHP into CIP under the existing goals might be attractive to
utilities. On the other hand, based on stakeholder feedback, some stakeholders believe there
remain significant opportunities for further end-use efficiency investments. On balance, we believe
that if CIP is to be a key vehicle for Minnesota CHP policy, the best way forward would be to establish
an additional, separate tier for CHP within CIP programs.
Demand Side or Supply Side
Classification of CHP as a demand-side or supply-side resource is challenging because CHP produces
two forms of energy (electricity and heat), thereby affecting customer demand of both electricity and
boiler fuel. Topping cycle CHP decreases customer consumption of boiler fuel for thermal production,
but this is more than offset by the increase in fuel consumed for CHP. Bottoming cycle CHP
decreases customer consumption of electricity, but generally will not decrease customer
consumption of natural gas because the temperature of the thermal output from ORC is usually too
low to be usable as a substitute for heat produced from a boiler.
The net impact of various CHP technologies on customer natural gas consumption is illustrated in
Figure 18, expressed as a percentage of the offset fuel consumption for thermal production. The
abbreviations used in this figure for the technologies are explained in Table 23 above.
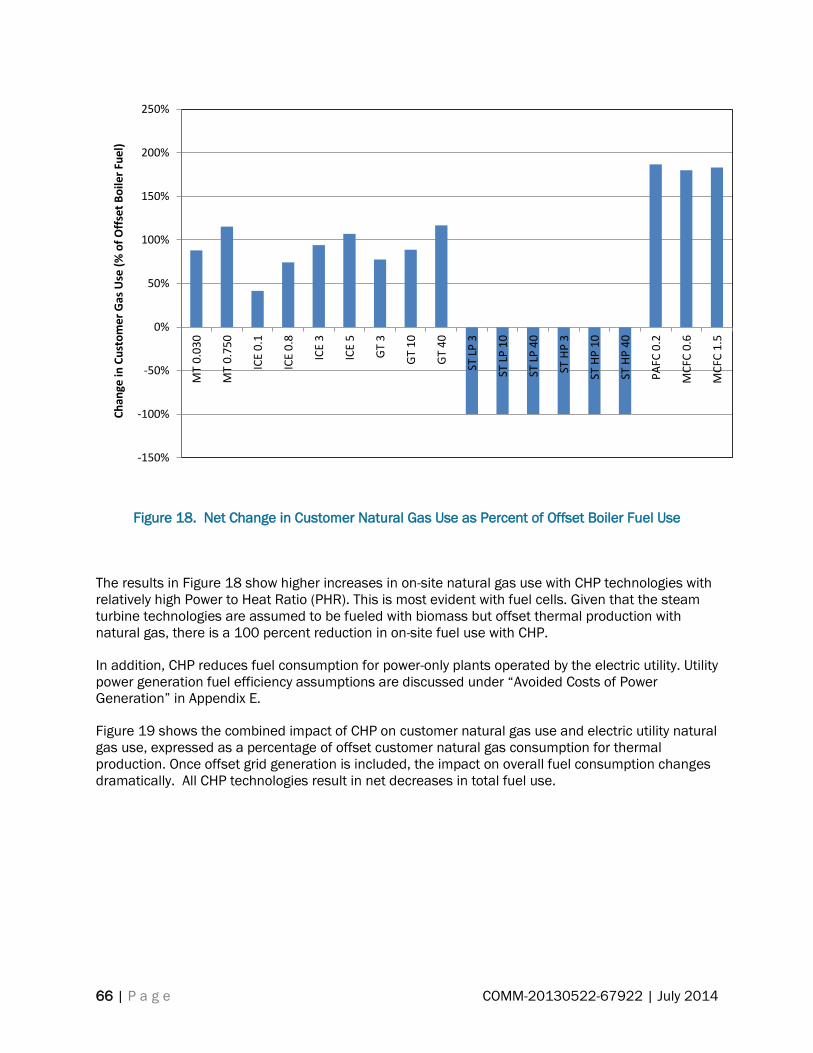
66 | P a g e COMM-20130522-67922 | July 2014
Figure 18. Net Change in Customer Natural Gas Use as Percent of Offset Boiler Fuel Use
The results in Figure 18 show higher increases in on-site natural gas use with CHP technologies with
relatively high Power to Heat Ratio (PHR). This is most evident with fuel cells. Given that the steam
turbine technologies are assumed to be fueled with biomass but offset thermal production with
natural gas, there is a 100 percent reduction in on-site fuel use with CHP.
In addition, CHP reduces fuel consumption for power-only plants operated by the electric utility. Utility
power generation fuel efficiency assumptions are discussed under “Avoided Costs of Power
Generation” in Appendix E.
Figure 19 shows the combined impact of CHP on customer natural gas use and electric utility natural
gas use, expressed as a percentage of offset customer natural gas consumption for thermal
production. Once offset grid generation is included, the impact on overall fuel consumption changes
dramatically. All CHP technologies result in net decreases in total fuel use.
-150%
-100%
-50%
0%
50%
100%
150%
200%
250%
MT
0.0
30
MT
0.7
50
ICE
0.1
ICE
0.8
ICE
3
ICE
5
GT
3
GT
10
GT
40
ST L
P 3
ST L
P 1
0
ST L
P 4
0
ST H
P 3
ST H
P 1
0
ST H
P 4
0
PA
FC 0
.2
MC
FC 0
.6
MC
FC 1
.5
Ch
ange
in C
ust
om
er G
as U
se (
% o
f O
ffse
t B
oile
r Fu
el)

67 | P a g e COMM-20130522-67922 | July 2014
Figure 19. Net Change in Customer and Electric Utility Natural Gas Use as Percent of Offset Boiler
Fuel Use
Assessing the energy impact of CHP is also made more difficult because CHP-produced electricity
and heat can be used directly or can be converted to meet a range of end-use energy requirements.
For example, CHP electricity output can be used to produce chilled water for air conditioning or
process cooling. CHP heat output can also be used to produce chilled water for air conditioning or
process cooling through absorption chillers or steam turbine drive chillers.
“Demand-side” is often defined as decreases in end-use energy consumption. Natural gas and
electricity are not end-use energy needs. They are a means to an end, and are used to meet end-use
needs as such as space heating, domestic hot water, air conditioning, process heating, process
cooling and a whole range of electrical plug loads including lights, computers, etc. The CIP law does
not address end-use energy consumption, but rather energy supplied to customers to meet end-use
energy needs.
Uncertainty about whether CHP is demand-side or supply-side stems from a lack of clarity in
Minnesota Statutes 216B.241 (hereinafter “the CIP law”) relative to definitions, including a lack of
clarity relative to boundaries between utilities, customers and potential third parties. For example:
Minnesota Statutes 216B.241 Subd. 1(e) defines "Energy conservation improvement" as “a
project that results in energy efficiency or energy conservation.”
Minnesota Statutes 216B.241 Subd. 1 (f) defines "Energy efficiency" as “measures or
programs, including energy conservation measures or programs, that target consumer
behavior, equipment, processes, or devices designed to produce either an absolute decrease
-300%
-250%
-200%
-150%
-100%
-50%
0%
50%
100%
150%
200%
MT
0.0
30
MT
0.7
50
ICE
0.1
ICE
0.8
ICE
3
ICE
5
GT
3
GT
10
GT
40
ST L
P 3
ST L
P 1
0
ST L
P 4
0
ST H
P 3
ST H
P 1
0
ST H
P 4
0
PA
FC 0
.2
MC
FC 0
.6
MC
FC 1
.5
% o
f o
ffse
t Th
erm
al B
oile
r Fu
el
Change in Gas UseIncluding offset Utility use
Change in Customer GasUse

68 | P a g e COMM-20130522-67922 | July 2014
in consumption of electric energy or natural gas or a decrease in consumption of electric
energy or natural gas on a per unit of production basis without a reduction in the quality or
level of service provided to the energy consumer.” (Emphasis added.)
The word “consumption” in Subd. 1(f) could refer to end-use needs or to consumption of
utility-supplied electricity. However, we conclude that “consumption” refers to consumption
of utility-supplied electricity because:
Subd. 1(e) states “Energy conservation improvement may include waste heat that is
recovered and converted into electricity.....” This provision allows a new energy supply
(conversion of heat to electricity) to be considered an energy conservation
improvement. Such a scenario does not reduce end-use consumption of electricity,
but it does reduce consumption of grid-supplied electricity.
Subd. 1(e) also states “Energy conservation improvement also includes waste heat
recovered and used as thermal energy.” This provision allows a new end-use energy
supply (recovered waste heat) to be considered an energy conservation
improvement. That supply of recovered waste heat may occur within the boundaries
of utility customer facilities, or it may originate from a third party, such as a district
heating provider.
One entity’s demand is another’s supply. The impact of CHP-produced electricity and heat can be
characterized as demand-side or supply-side depending on where the boundaries between
“demand” and “supply” are drawn relative to five types of entities:
Electric utility;
Electric utility customer;
Natural gas utility;
Gas utility customer; and
Third party CHP plant operator that distributes thermal energy to other utility customers.
Extending the boundaries further, the electric utilities and the gas utilities obtain their natural gas
supply from a nationwide gas supply network. This further complicates the distinction between
supply and demand.
On balance, we conclude that the Minnesota CIP law fundamentally approaches “demand” and
“supply” as referring to energy commodities (natural gas or electricity) crossing the boundary
between the utility and the customer, and that CHP can appropriately be viewed as a demand-side
resource for both natural gas and electric utilities. This conclusion is based on the following
reasoning:
Relative to natural gas utilities --
CHP is clearly a demand-side resource where CHP heat displaces natural gas. Recovery
and use of waste heat through CHP will displace boiler fuel consumption to produce the
heat required by the end user, and in most cases that fuel would be natural gas.
However, as noted in the analysis presented above—
o CHP also generally results in increased customer demand for gas due to the
additional fuel required to produce electricity as well as heat;
o CHP reduces electric utility fuel consumption, which we assume will likely be
natural gas; and
o CHP reduces total fuel consumption.

69 | P a g e COMM-20130522-67922 | July 2014
Relative to electric utilities --
An initial reading of the CIP law suggests that CHP is not a demand-side resource based
on the definition of demand-side as reduction in end-use consumption of electricity. For
example:
o CHP can displace electricity consumption through recovery of waste heat through
use of CHP heat to drive absorption or steam turbine chillers. However, CHP-heat-
driven cooling will not be a major element in implementing a CHP project in
Minnesota.
o It is also technically possible to displace electricity through use of heat produced
from CHP; however, practically this is not a realistic scenario. Heat produced
from CHP is almost never an economically feasible replacement for electric heat
because CHP heat must be delivered through hot water or steam.
However, the CIP law as a whole indicates that the “decrease in consumption of electric
energy” that is the objective of the CIP law for electric utilities should be viewed as
consumption of electricity supplied from the utility grid. CHP reduces demand side
electric energy, in the process of generating thermal energy, because the CHP host would
displace electricity purchased from the utility with electricity generated through CHP.
Crediting Mechanisms
CHP Power
One of the challenges faced by states considering CHP within portfolio standards is the method by
which the CHP savings is calculated and credited. No standard accounting approach has emerged.
Appendix E describes and analyzes a range of alternative crediting methods to calculate the number
of credited MWh of CHP electricity generation.
As discussed in Appendix E, of the existing methodologies analyzed, the NRDC/OEC methodology is
the most promising approach for crediting CHP electricity generation, because it: 1) incentivizes all
prime mover technologies and does not pick technology winners; 2) encourages project developers
to design higher-efficiency installations, regardless of the prime mover technology; 3) is relatively
simple to administer and implement, as it requires only a simple calculation of overall system
efficiency based on readily available inputs (and minimizes issues surrounding heat-rates).
However, a simpler and more stringent approach with higher thresholds and fewer tiers would create
more incentive for high-efficiency systems and would be even less complex to administer. A
recommended approach for gas-fired CHP is shown in Table 31.
Table 31. Simplified Approach to Crediting Natural Gas CHP Electricity Production
TierEfficiency
(HHV)
Portion of
kWh output
credited
<60% 0%
Tier 1 >60<70% 80%
Tier 2 >70<80% 90%
Tier 3 >80% 100%
70 | P a g e COMM-20130522-67922 | July 2014
CHP Thermal
If CHP becomes a part of natural gas utility CIP, the author recommends calculating natural gas
savings for CIP credit as equal to total fossil fuel savings. Note that some of the fuel savings from
offset grid power production may come from fuels other than natural gas (primarily coal). Note also
that in some relatively limited cases the fuel savings from offset thermal boiler operations may come
from fuels other than natural gas (primarily fuel oil). However, given the public policy benefits of
reducing use of such non-natural-gas fuels, the author recommends that all such fuel savings count
toward natural gas reduction goals.
Incentive Levels
Over the last three years, average electric utility CIP expenditures have been $12.74 per lifetime
MWh saved (see Table 14). Over the last three years, average natural gas utility CIP expenditures
have been $0.93 per lifetime MMBtu of natural gas saved (see Table 15). For the operating
incentives in the policy options:
Average electric utility CIP expenditure levels have been multiplied by 80 percent (to provide
an allowance for program overhead) and rounded to the nearest $/MWh.
Average gas utility CIP expenditure levels have been multiplied by 80 percent (to provide an
allowance for program overhead) and rounded to the nearest $0.05 per MMBtu.
For the capital incentives in the policy options:
The electric utility capital incentive was set to be equivalent to the operating incentive at a
12 percent WACC;
The gas utility capital incentive was set to be equivalent to the operating incentive for 3-5
MW reciprocating engine CHP at a 12 percent WACC.
Potential Impacts
Effectiveness in Achieving Growth of CHP
In this report we summarize the results presented in detail in the companion report “Assessment of
the Technical and Economic Potential for CHP in Minnesota,” focusing on projected CHP
implementation by the year 2030.
Prior to estimating the impact of Policy Options on CHP market penetration, ICF modeled Base Case
market penetration for gas-fired CHP (i.e., additional gas-fired CHP that would be expected to occur
in the absence of new policies). The Base Case modeling assumed the Average Acceptance curve21
that has been found to represent typical investment behavior based on payback criteria. In addition,
ICF was asked to run the Base Case a second time, with no new policies but substituting a Strong
Acceptance curve that represents payback thresholds of strongly motivated and informed decision-
makers. Further, FVB provided an estimated Utility Acceptance curve that was designed to be
consistent with utility cost of capital. The results of these three estimates, quantified in MW of gas-
21 The acceptance curves are fully described in the companion report “Assessment of the Technical and
Economic Potential for CHP in Minnesota,” FVB Energy and ICF International, 2014.

71 | P a g e COMM-20130522-67922 | July 2014
fired CHP by 2030, are shown in Figure 20. These results clearly demonstrate the critical impact of
WACC.
Figure 20. Projected 2030 CHP Market Penetration Without New Policies Under 3 Acceptance
Curves
Modeling of the Policy Options was then undertaken, with the Average Acceptance curve assumed in
all scenarios except 3.1 and 3.2. Only natural gas CHP was included in gas utility program scenarios.
In addition to ICF’s estimates of gas-fired CHP, FVB projected bioenergy CHP for scenarios other than
gas utility program scenarios. The results are summarized in Figure 21.
The raw results from the ICF model using the Utility Acceptance curve resulted in very high numbers
(up to 2,000 MW by 2030). This magnitude of CHP is unlikely to be achievable with the high capacity
factors needed for sound CHP economics. Further, Policy Options 3.1 and 3.2 were developed with
the idea that incentives would be offered to customers or third parties to build CHP, but that utilities
would also be encouraged and incented to use their capital to build CHP. The model was not
structured to address this diversity of potential decision-makers. Therefore, as discussed in the
companion report (FVB Energy and ICF International 2014), the estimates for Policy Options 3.1 and
3.2 were revised downward, with the resulting revised estimates shown in Figure 21.
-
200
400
600
800
1,000
1,200
Average Acceptance Strong Acceptance Utility Acceptance
Base Case
CH
P C
apac
ity
by
20
30
(M
W)
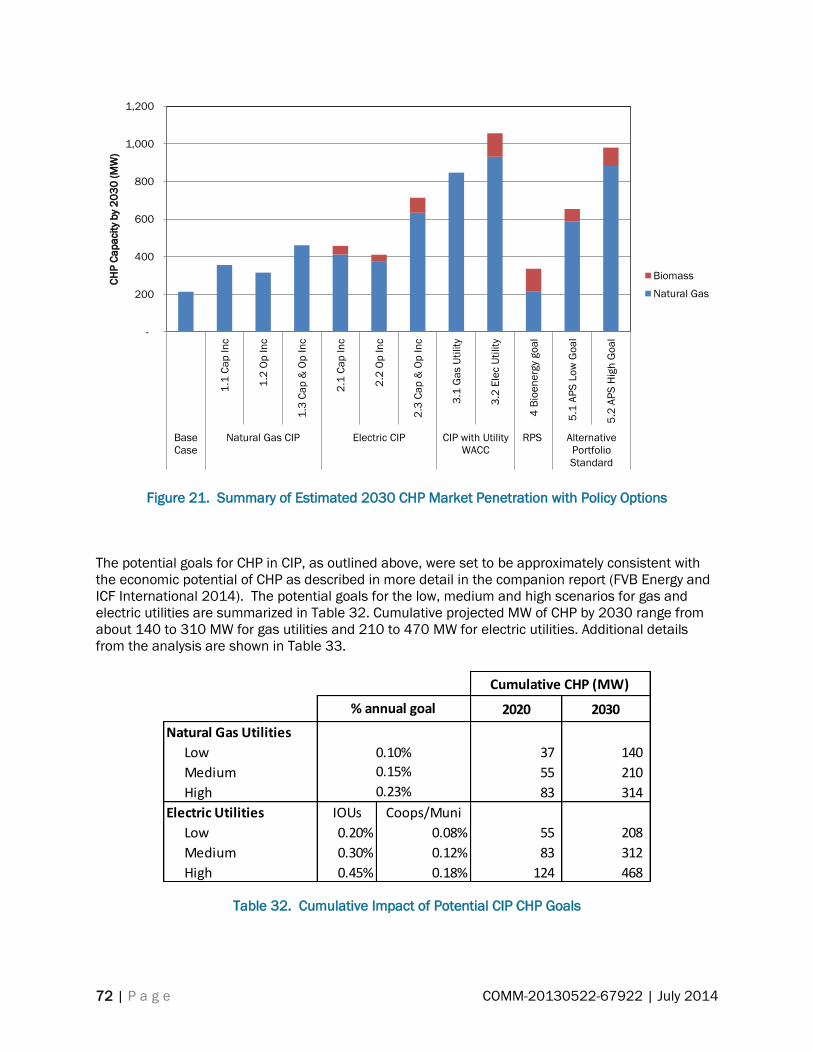
72 | P a g e COMM-20130522-67922 | July 2014
Figure 21. Summary of Estimated 2030 CHP Market Penetration with Policy Options
The potential goals for CHP in CIP, as outlined above, were set to be approximately consistent with
the economic potential of CHP as described in more detail in the companion report (FVB Energy and
ICF International 2014). The potential goals for the low, medium and high scenarios for gas and
electric utilities are summarized in Table 32. Cumulative projected MW of CHP by 2030 range from
about 140 to 310 MW for gas utilities and 210 to 470 MW for electric utilities. Additional details
from the analysis are shown in Table 33.
Table 32. Cumulative Impact of Potential CIP CHP Goals
-
200
400
600
800
1,000
1,200
1.1
Ca
p In
c
1.2
Op
In
c
1.3
Ca
p &
Op
In
c
2.1
Ca
p In
c
2.2
Op
In
c
2.3
Ca
p &
Op
In
c
3.1
Ga
s U
tility
3.2
Ele
c U
tility
4 B
ioe
ne
rgy
go
al
5.1
AP
S L
ow
Go
al
5.2
AP
S H
igh
Go
al
Base
Case
Natural Gas CIP Electric CIP CIP with Utility
WACC
RPS Alternative
Portfolio
Standard
CH
P C
ap
acit
y b
y 2
03
0 (
MW
)
Biomass
Natural Gas
Cumulative CHP (MW)
2020 2030
Natural Gas Utilities
Low 37 140
Medium 55 210
High 83 314
Electric Utilities IOUs Coops/Muni
Low 0.20% 0.08% 55 208
Medium 0.30% 0.12% 83 312
High 0.45% 0.18% 124 468
% annual goal
0.10%
0.15%
0.23%
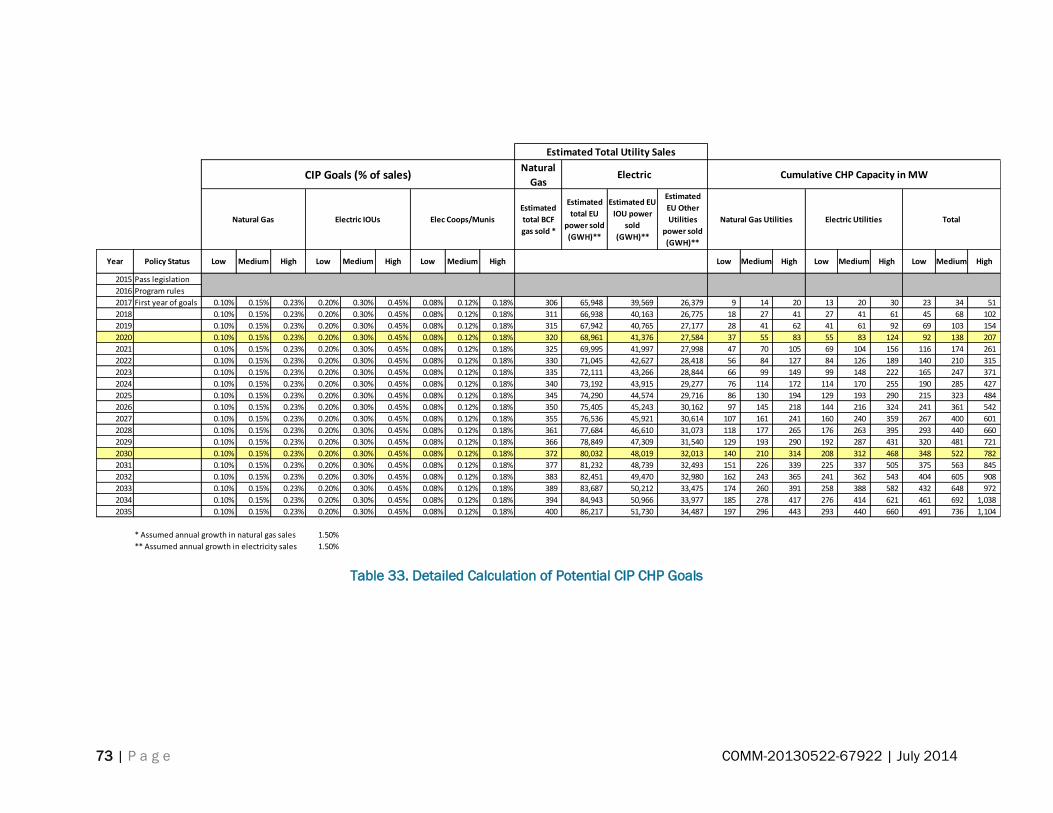
73 | P a g e COMM-20130522-67922 | July 2014
Table 33. Detailed Calculation of Potential CIP CHP Goals
Estimated Total Utility Sales
CIP Goals (% of sales)Natural
GasElectric Cumulative CHP Capacity in MW
Natural Gas Electric IOUs Elec Coops/Munis
Estimated
total BCF
gas sold *
Estimated
total EU
power sold
(GWH)**
Estimated EU
IOU power
sold
(GWH)**
Estimated
EU Other
Utilities
power sold
(GWH)**
Natural Gas Utilities Electric Utilities Total
Year Policy Status Low Medium High Low Medium High Low Medium High Low Medium High Low Medium High Low Medium High
2015 Pass legislation
2016 Program rules
2017 First year of goals 0.10% 0.15% 0.23% 0.20% 0.30% 0.45% 0.08% 0.12% 0.18% 306 65,948 39,569 26,379 9 14 20 13 20 30 23 34 51
2018 0.10% 0.15% 0.23% 0.20% 0.30% 0.45% 0.08% 0.12% 0.18% 311 66,938 40,163 26,775 18 27 41 27 41 61 45 68 102
2019 0.10% 0.15% 0.23% 0.20% 0.30% 0.45% 0.08% 0.12% 0.18% 315 67,942 40,765 27,177 28 41 62 41 61 92 69 103 154
2020 0.10% 0.15% 0.23% 0.20% 0.30% 0.45% 0.08% 0.12% 0.18% 320 68,961 41,376 27,584 37 55 83 55 83 124 92 138 207
2021 0.10% 0.15% 0.23% 0.20% 0.30% 0.45% 0.08% 0.12% 0.18% 325 69,995 41,997 27,998 47 70 105 69 104 156 116 174 261
2022 0.10% 0.15% 0.23% 0.20% 0.30% 0.45% 0.08% 0.12% 0.18% 330 71,045 42,627 28,418 56 84 127 84 126 189 140 210 315
2023 0.10% 0.15% 0.23% 0.20% 0.30% 0.45% 0.08% 0.12% 0.18% 335 72,111 43,266 28,844 66 99 149 99 148 222 165 247 371
2024 0.10% 0.15% 0.23% 0.20% 0.30% 0.45% 0.08% 0.12% 0.18% 340 73,192 43,915 29,277 76 114 172 114 170 255 190 285 427
2025 0.10% 0.15% 0.23% 0.20% 0.30% 0.45% 0.08% 0.12% 0.18% 345 74,290 44,574 29,716 86 130 194 129 193 290 215 323 484
2026 0.10% 0.15% 0.23% 0.20% 0.30% 0.45% 0.08% 0.12% 0.18% 350 75,405 45,243 30,162 97 145 218 144 216 324 241 361 542
2027 0.10% 0.15% 0.23% 0.20% 0.30% 0.45% 0.08% 0.12% 0.18% 355 76,536 45,921 30,614 107 161 241 160 240 359 267 400 601
2028 0.10% 0.15% 0.23% 0.20% 0.30% 0.45% 0.08% 0.12% 0.18% 361 77,684 46,610 31,073 118 177 265 176 263 395 293 440 660
2029 0.10% 0.15% 0.23% 0.20% 0.30% 0.45% 0.08% 0.12% 0.18% 366 78,849 47,309 31,540 129 193 290 192 287 431 320 481 721
2030 0.10% 0.15% 0.23% 0.20% 0.30% 0.45% 0.08% 0.12% 0.18% 372 80,032 48,019 32,013 140 210 314 208 312 468 348 522 782
2031 0.10% 0.15% 0.23% 0.20% 0.30% 0.45% 0.08% 0.12% 0.18% 377 81,232 48,739 32,493 151 226 339 225 337 505 375 563 845
2032 0.10% 0.15% 0.23% 0.20% 0.30% 0.45% 0.08% 0.12% 0.18% 383 82,451 49,470 32,980 162 243 365 241 362 543 404 605 908
2033 0.10% 0.15% 0.23% 0.20% 0.30% 0.45% 0.08% 0.12% 0.18% 389 83,687 50,212 33,475 174 260 391 258 388 582 432 648 972
2034 0.10% 0.15% 0.23% 0.20% 0.30% 0.45% 0.08% 0.12% 0.18% 394 84,943 50,966 33,977 185 278 417 276 414 621 461 692 1,038
2035 0.10% 0.15% 0.23% 0.20% 0.30% 0.45% 0.08% 0.12% 0.18% 400 86,217 51,730 34,487 197 296 443 293 440 660 491 736 1,104
* Assumed annual growth in natural gas sales 1.50%
** Assumed annual growth in electricity sales 1.50%

74 | P a g e COMM-20130522-67922 | July 2014
In Policy Options 1.1, 1.2, 2.1 and 2.2, CIP incentives for customer investment in CHP, at levels
approximately consistent with recent levels of CIP expenditures per unit of electricity or natural gas
saved, are estimated to result in approximately 100 to 240 MW of additional CHP beyond the Base
Case. However, most CHP installations do not meet both the PCT and SCT. (See discussion of “Cost-
Benefit Tests” below.)
Policy Options 1.3 and 2.3, which provide more substantial CIP incentives (combining capital and
operating incentives) for customer investment in CHP, are estimated to result in approximately 250
to 500 MW of additional CHP beyond the Base Case. However, with these policy options improve PCT
results, most CHP installations not meet both cost-benefit tests.
In Policy Option group 3, deploying the relatively low Weighted Average Cost of Capital (WACC) of
utilities to build CHP significantly enhances CHP economics. These options are estimated to result in
approximately 630 to 840 MW of additional CHP beyond the Base Case, with positive results for both
cost-benefit tests for a wide range of CHP installations.
With Policy Option 4, establishing a specific “carve-out” for bioenergy CHP in the RPS is estimated to
result in about 125 MW of new biomass CHP by 2030. The RPS was not analyzed for the Cost-
Benefit tests.
In Policy Option group 5, an Alternative Portfolio Standard is estimated to result in approximately 440
to 770 MW of additional CHP beyond the Base Case (for Low and High APS targets). At the high end
of this range, CHP would more than double by 2030.
Although the APS was not directly analyzed for the Cost-Benefit tests, it was indirectly analyzed22 and
is projected to result in positive results for all three major Cost-Benefit tests for wide range of CHP
installations.
Table 34 shows the estimated levels of CHP achieved by the years 2020 and 2030 consistent with
the Low and High APS scenarios.
Table 34. Cumulative Impact of Potential APS Goals
22 The impacts of the APS were indirectly analyzed by assessing the impacts of CIP operating credits as a proxy
for a tradable APS credit.
APS Goals MW CHP
Year IOUs Coops/Muni Total
Additional
above Base
Case
2020 2.00% 0.80% 141 66
2030 8.00% 3.20% 653 440
2020 3.00% 1.20% 211 137
2030 12.00% 4.80% 980 767 APS High
APS Low
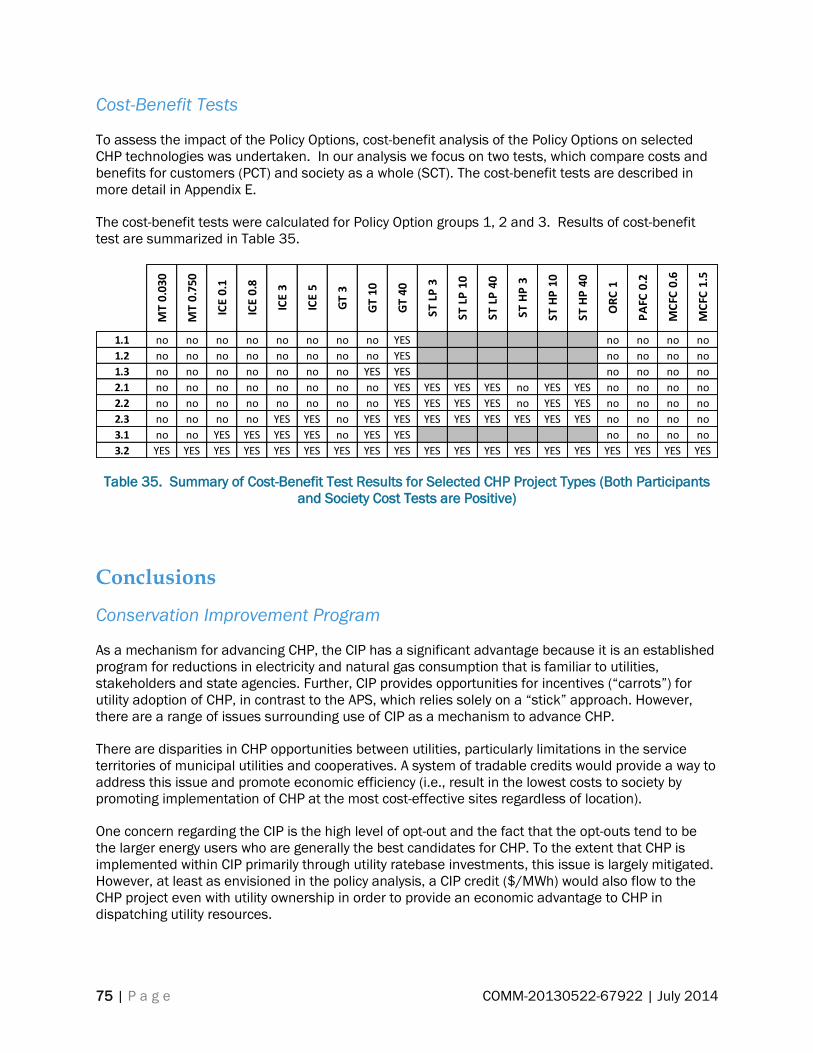
75 | P a g e COMM-20130522-67922 | July 2014
Cost-Benefit Tests
To assess the impact of the Policy Options, cost-benefit analysis of the Policy Options on selected
CHP technologies was undertaken. In our analysis we focus on two tests, which compare costs and
benefits for customers (PCT) and society as a whole (SCT). The cost-benefit tests are described in
more detail in Appendix E.
The cost-benefit tests were calculated for Policy Option groups 1, 2 and 3. Results of cost-benefit
test are summarized in Table 35.
Table 35. Summary of Cost-Benefit Test Results for Selected CHP Project Types (Both Participants
and Society Cost Tests are Positive)
Conclusions
Conservation Improvement Program
As a mechanism for advancing CHP, the CIP has a significant advantage because it is an established
program for reductions in electricity and natural gas consumption that is familiar to utilities,
stakeholders and state agencies. Further, CIP provides opportunities for incentives (“carrots”) for
utility adoption of CHP, in contrast to the APS, which relies solely on a “stick” approach. However,
there are a range of issues surrounding use of CIP as a mechanism to advance CHP.
There are disparities in CHP opportunities between utilities, particularly limitations in the service
territories of municipal utilities and cooperatives. A system of tradable credits would provide a way to
address this issue and promote economic efficiency (i.e., result in the lowest costs to society by
promoting implementation of CHP at the most cost-effective sites regardless of location).
One concern regarding the CIP is the high level of opt-out and the fact that the opt-outs tend to be
the larger energy users who are generally the best candidates for CHP. To the extent that CHP is
implemented within CIP primarily through utility ratebase investments, this issue is largely mitigated.
However, at least as envisioned in the policy analysis, a CIP credit ($/MWh) would also flow to the
CHP project even with utility ownership in order to provide an economic advantage to CHP in
dispatching utility resources.
MT
0.03
0
MT
0.75
0
ICE
0.1
ICE
0.8
ICE
3
ICE
5
GT
3
GT
10
GT
40
ST L
P 3
ST L
P 1
0
ST L
P 4
0
ST H
P 3
ST H
P 1
0
ST H
P 4
0
OR
C 1
PA
FC 0
.2
MC
FC 0
.6
MC
FC 1
.5
1.1 no no no no no no no no YES no no no no
1.2 no no no no no no no no YES no no no no
1.3 no no no no no no no YES YES no no no no
2.1 no no no no no no no no YES YES YES YES no YES YES no no no no
2.2 no no no no no no no no YES YES YES YES no YES YES no no no no
2.3 no no no no YES YES no YES YES YES YES YES YES YES YES no no no no
3.1 no no YES YES YES YES no YES YES no no no no
3.2 YES YES YES YES YES YES YES YES YES YES YES YES YES YES YES YES YES YES YES

76 | P a g e COMM-20130522-67922 | July 2014
Legislation to establish a CHP tier in CIP would have to resolve the current lack of clarity regarding
the potential role of CHP in CIP. Further, the legislation would require resolution of issues of
interaction between electric utility CIP and gas utility CIP. For example, if natural gas utilities could
include CHP in their CIP, there would be a shift in revenue from the electric utility to the gas utility.
This would engender resistance from electric utilities out of concern for impacts on rates. On the
other hand, including CHP in both gas and electric utility CIP may result increase the interest of
electric utilities in CHP in order to retain revenues.
Decoupling of both gas and electric utility revenues from sales would in concept address concerns
related to potential shifts in revenue from one utility to another. (Decoupling is a complex issue that
extends far beyond CHP, and was not part of the scope of this study.)
An argument in favor of focusing responsibility for CHP implementation on electric utilities is that it
can better facilitate timely and positive resolution of barriers relating to interconnection and standby
rates. Further, setting goals for CHP in both electric and gas utility CIP would result in the potential
for electric and gas utilities to be competing for the same pool of prospective CHP projects.
Renewable Portfolio Standard
Establishing a specific “carve-out” for bioenergy CHP in the RPS (Policy Option 4) is projected to
provide relatively little additional CHP and ignores the largest CHP potential (natural gas CHP). Either
the CIP or an APS would be a more effective mechanism for promoting CHP because either approach
would not only address renewable CHP but also natural gas CHP, which constitutes the vast majority
of the potential.
Alternative Portfolio Standard
Minnesota currently has no Alternative Portfolio Standard (APS), so new legislation would be required
to create a new program and related implementation mechanisms. Creation of a new program will
likely face greater political and implementation challenges in comparison to expanding an existing
program such as CIP.
On the other hand, because the APS would be a new program it may be able to avoid some of the
complexities discussed above relative to adapting the CIP to include CHP. An APS can be structured
from the beginning as an enforceable standard with clear cost penalties for non-compliance.
Table 4 provides an overview of the major advantages and disadvantage of CIP compared with APS
as the major CHP policy mechanism.
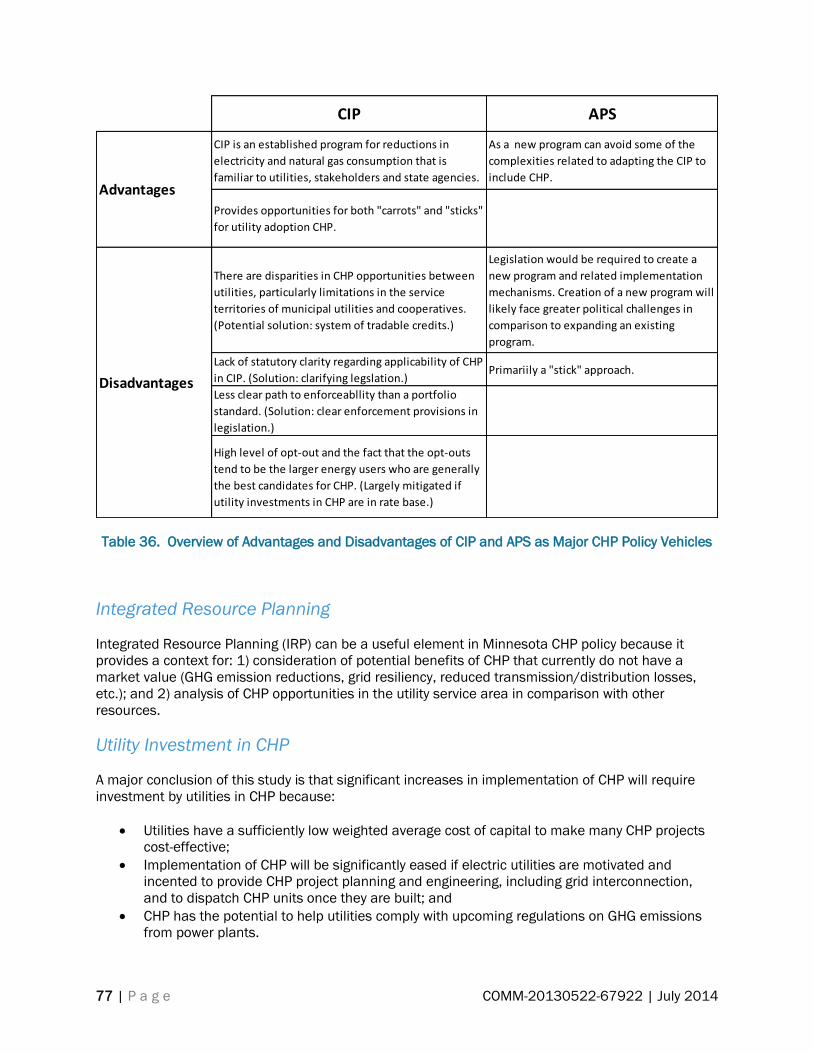
77 | P a g e COMM-20130522-67922 | July 2014
Table 36. Overview of Advantages and Disadvantages of CIP and APS as Major CHP Policy Vehicles
Integrated Resource Planning
Integrated Resource Planning (IRP) can be a useful element in Minnesota CHP policy because it
provides a context for: 1) consideration of potential benefits of CHP that currently do not have a
market value (GHG emission reductions, grid resiliency, reduced transmission/distribution losses,
etc.); and 2) analysis of CHP opportunities in the utility service area in comparison with other
resources.
Utility Investment in CHP
A major conclusion of this study is that significant increases in implementation of CHP will require
investment by utilities in CHP because:
Utilities have a sufficiently low weighted average cost of capital to make many CHP projects
cost-effective;
Implementation of CHP will be significantly eased if electric utilities are motivated and
incented to provide CHP project planning and engineering, including grid interconnection,
and to dispatch CHP units once they are built; and
CHP has the potential to help utilities comply with upcoming regulations on GHG emissions
from power plants.
CIP APS
CIP is an established program for reductions in
electricity and natural gas consumption that is
familiar to utilities, stakeholders and state agencies.
As a new program can avoid some of the
complexities related to adapting the CIP to
include CHP.
Provides opportunities for both "carrots" and "sticks"
for utility adoption CHP.
There are disparities in CHP opportunities between
utilities, particularly limitations in the service
territories of municipal utilities and cooperatives.
(Potential solution: system of tradable credits.)
Legislation would be required to create a
new program and related implementation
mechanisms. Creation of a new program will
likely face greater political challenges in
comparison to expanding an existing
program.
Lack of statutory clarity regarding applicability of CHP
in CIP. (Solution: clarifying legslation.)Primariily a "stick" approach.
Less clear path to enforceabllity than a portfolio
standard. (Solution: clear enforcement provisions in
legislation.)
High level of opt-out and the fact that the opt-outs
tend to be the larger energy users who are generally
the best candidates for CHP. (Largely mitigated if
utility investments in CHP are in rate base.)
Disadvantages
Advantages

78 | P a g e COMM-20130522-67922 | July 2014
A number of issues relating to utility investment in CHP must be more closely examined. Such
investment at customer sites could result in ratepayer risk in the event that the thermal host goes
out of business. The risk profiles of potential thermal hosts vary dramatically, with industrial plants
competing internationally at the high end of the risk continuum, and institutional customers (e.g.,
district energy systems, colleges, universities, hospitals) at the low end. Risks related to CHP should
be considered in the context of existing risks to ratepayers, such as cost overruns for refurbishment
of conventional power plants, and risks associated with environmental regulations. Potential
ratepayer risks associated with utility investment in CHP could be addressed through range of
mechanisms, including a return on equity risk premium, a state-funded loss reserve, or other
mechanisms.

79 | P a g e COMM-20130522-67922 | July 2014
Recommendations
Near-term Steps
During the balance of 2014, we recommend the following steps:
1. Initiate a robust stakeholder discussion of this report including feedback on policy options for
increasing implementation of CHP. (Note: planning for this is already well underway by the
Department of Commerce.)
2. Initiate an interagency working group to integrate potential CHP policy with Minnesota’s plan
to comply with the Clean Power Plan.
3. Develop a draft “Minnesota CHP Policy Act” for consideration by the legislature in 2015.
Either the CIP or an APS can be an effective centerpiece in Minnesota policies to significantly
increase CHP, with the focus on facilitating use of the low WACC of utilities to finance CHP projects.
On balance, the CIP appears to be a stronger vehicle for increasing CHP if the legislation effectively
addresses the disadvantages outlined above. A priority should be placed on successfully adapting
the CIP to include CHP, with the APS considered as a back-up approach.
Regardless of whether the CIP or an APS is the primary CHP program, a system of tradable credits
will be important to promote economic efficiency (i.e., result in the lowest costs to society by
promoting implementation of CHP at the most cost-effective sites regardless of location).
An achievable and readily understood goal for the State of Minnesota is doubling CHP capacity
by 2030.
Key provisions for the “Minnesota CHP Policy Act” are recommended below. In addition to the CIP as
the centerpiece, additional recommendations are provided relative to integrated resource planning
and standby rates.
Minnesota Combined Heat and Power Policy Act
ARTICLE 1. FINDINGS AND GOAL
Subd. 1. FINDINGS. The legislature finds that combined heat and power systems should be
encouraged because such systems:
a) Reduce fossil fuel use by recovering heat that is usually wasted as rejected heat in power
generation;
b) Reduce emissions of air pollutants and greenhouse gases;
c) Increase energy security and sustainability by reducing dependence on fossil fuels; and
d) Enhance grid resiliency, reduce power line losses and strengthen peak power demand
management.
Subd. 2. GOAL. The State of Minnesota establishes a goal of doubling combined heat and power
(CHP) capacity from the current 962 MegaWatts (MW) by the year 2030.

80 | P a g e COMM-20130522-67922 | July 2014
ARTICLE 2. CONSERVATION IMPROVEMENT PROGRAM.
Subd. 1. ENERGY CONSERVATION IMPROVEMENT. Minnesota Statutes section 216B.241 Subd. 1(e)
is modified by adding:
Energy conservation improvement also includes combined heat and power as defined in
Subd. 11.
Subd. 2. COMBINED HEAT AND POWER REQUIREMENTS. Minnesota Statutes section 216B.241
Subd. 1c. is modified by adding the following new paragraphs (c) and (d) and renumbering
subsequent paragraphs:
(c) Each individual investor owned electric utility shall have an annual CHP energy savings
requirement equivalent to 0.45 percent of gross annual retail energy sales unless modified
by the commissioner under paragraph (e). This CHP requirement shall be shall be tracked in
a category that is separate and distinct from other energy savings goals in this section. The
CHP requirements must be calculated based on the most recent three-year weather-
normalized average. A utility may elect to carry forward energy savings in excess of 0.45
percent for a year to the succeeding three calendar years. A particular energy savings can
be used only for one year's requirement.
(d) Each individual municipal electric utility, electric cooperative or association shall have an
annual CHP energy savings requirement equivalent to 0.18 percent of gross annual retail
energy sales unless modified by the commissioner under paragraph (e). These CHP
requirements shall be shall be tracked in a category that is separate and distinct from other
energy savings goals in this section. The CHP requirements must be calculated based on the
most recent three-year weather-normalized average. A utility may elect to carry forward
energy savings in excess of 0.18 percent for a year to the succeeding three calendar years.
A particular energy savings can be used only for one year's requirement.
Subd. 3. OWNERSHIP OF COMBINED HEAT AND POWER. Minnesota Statutes 216B.241 Subd. 3 is
modified with the italicized insertion as follows:
Subd. 3. Ownership of energy conservation improvement.
An energy conservation improvement made to or installed in a building in accordance with
this section, except combined heat and power systems or other systems owned by the utility
and designed to turn off, limit, or vary the delivery of energy, are the exclusive property of the
owner of the building except to the extent that the improvement is subjected to a security
interest in favor of the utility in case of a loan to the building owner. The utility has no liability
for loss, damage or injury caused directly or indirectly by an energy conservation
improvement except for negligence by the utility in purchase, installation, or modification of
the product.
Subd. 4. DEFINITIONS. Minnesota Statutes 216B.241 is modified by adding the following new
subdivision:
Subd. 11.Combined heat and power.
(a) Eligibility. CHP Credits from combined heat and power are eligible to be counted towards an
electric utility's CHP energy savings requirements, as established in Subd. 1c. (c) and Subd. 1c.
(d), subject to department approval.

81 | P a g e COMM-20130522-67922 | July 2014
(b) Definitions.
1. Combined Heat and Power. Combined heat and power (“CHP”) is a process which uses
the same energy source for the simultaneous or sequential generation of electrical
power, mechanical shaft power, or both, in combination with the generation of steam or
other forms of useful thermal energy (including heating and cooling applications).
2. CHP Credits. CHP Credits shall be defined as follows for each category of CHP
opportunity:
a) CHP Credit for New Non-Renewable CHP Plant. A Qualifying CHP plant using a
non-renewable fuel, which produced neither electrical nor Useful Thermal
Energy before January 1, 2016, shall generate CHP Credits, measured in
MegaWatt-hours, equal to the values shown in Table 5 based on the total energy
efficiency (thermal and electric) measured on a Higher Heating Value (HHV)
basis.
b) CHP Credit for New Renewable CHP Plant. A Qualifying CHP plant using
renewable fuel, which produced neither electrical nor Useful Thermal Energy
before January 1, 2016, shall generate CHP Credits, measured in MegaWatt-
hours, equal to the values shown in Table 6 based on the total energy efficiency
(thermal and electric) measured on a Higher Heating Value (HHV) basis.
Table 37. Recommended Efficiency Standards and Crediting Tiers for Non-Renewable CHP
Table 38. Recommended Efficiency Standards and Crediting Tiers for Renewable CHP
Non-Renewable Fuels
TierEfficiency
(HHV)
% of Power
Output
Credited
<60% 0%
Tier 1 >60<70% 80%
Tier 2 >70<80% 90%
Tier 3 >80% 100%
Renewable Fuels
TierEfficiency
(HHV)
% of Power
Output
Credited
<50% 0%
Tier R1 >50<60% 80%
Tier R2 >60<70% 90%
Tier R3 >70% 100%

82 | P a g e COMM-20130522-67922 | July 2014
e) CHP Credit for CHP Retrofit of Existing Power Plant. A power plant which
produced electrical energy before January 1, 2016 and added the production of
incremental Useful Thermal Energy after January 1, 2016, shall generate CHP
Credits equal to the result, if positive, of the following calculation: take the sum
of (1) the Incremental Electrical Energy generated divided by the overall
efficiency of electrical energy delivered to the end-use from the electrical grid
(which efficiency is equal for this purpose to 0.40); and (2) the Incremental
Useful Thermal Energy divided by the overall efficiency of thermal energy
delivered to the end-use from standalone heating units (which efficiency is equal
for this purpose to 0.80); and subtract from this sum the total of all Incremental
Fuel consumed by the CHP Unit expressed in MWh and calculated using the
energy content of the fuel based on its Higher Heating Value. This calculation of
the CHP Credit can also be expressed with the following terms and equation:
IEE = Incremental Electrical Energy
IUTE = Incremental Useful Thermal Energy
IF = Incremental Fuel
CHP Credit = (IEE / 40%) + (IUTE / 80%) - IF
f) CHP Credit CHP Retrofit of Existing Heating or Process Energy Plant. A heating
plant or industrial process plant which produced Useful Thermal Energy before
January 1, 2016 and added production of Incremental Electrical Energy after
January 1, 2016 using Process Waste Heat shall be generate CHP Credits equal
to the result, if positive, of the following calculation: take the sum of (1) the
Incremental Electrical Energy generated divided by the overall efficiency of
electrical energy delivered to the end-use from the electrical grid (which
efficiency is equal for this purpose to 0.40); and (2) the Incremental Useful
Thermal Energy divided by the overall efficiency of thermal energy delivered to
the end-use from a standalone heating unit (which efficiency is equal for this
purpose to 0.80); and subtract from this sum the total of all Incremental Fuel
consumed by the CHP Plant expressed in MWh and calculated using the energy
content of the fuel based on its Higher Heating Value. This calculation of the
CHP Credit can also be expressed with the following terms and equation:
IEE = Incremental Electrical Energy
IUTE = Incremental Useful Thermal Energy
IF = Incremental Fuel
CHP Credit = (IEE / 40%) + (IUTE / 80%) - IF
3. CHP Plant. Facilities and equipment used for combined heat and power.
4. Incremental Electrical Energy. Electrical energy generated by a Qualifying CHP Plant that
is either greater than (expressed as a positive amount) or less than (expressed as a
negative amount) the electrical energy generated by the CHP Plant prior to the addition
of new electric generation nameplate capacity, Useful Thermal Energy, or Incremental
Useful Thermal Energy.
83 | P a g e COMM-20130522-67922 | July 2014
5. Incremental Fuel. The amount of additional fuel used by a Qualifying CHP Plant which is
attributable to the production of Incremental Useful Thermal Energy or Incremental
Electrical Energy.
6. Incremental Useful Thermal Energy. Useful Thermal Energy produced by a Qualifying CHP
Plant that is distinct in its final distribution, beneficial measure, and metering from
Useful Thermal Energy previously produced by the CHP Plant, but only to the extent that
the Incremental Useful Thermal Energy does not reduce the Useful Thermal Energy
previously produced.
7. Non Renewable CHP. A Qualifying CHP Plant for which more than 10 percent of the
annual fuel input is composed of natural gas, coal, oil, propane, other fossil fuels, or
nuclear energy.
8. Process Waste Heat. Heat contained in gases or liquids exhausted from a boiler plant,
industrial process or municipal process (such as sewage sludge incineration) that is
currently and/or conventionally not recovered for useful purposes.
9. Qualifying CHP Plant. Any CHP Retrofit of Existing Power Plant, any CHP Plant CHP
Retrofit of Existing Heating or Process Energy Plant, or any new CHP Plant which: 1)
which has a minimum annual energy efficiency on a higher heating value basis of 60
percent (if using non-renewable fuels) or 50 percent (if using renewable fuels); and 2)
which produces at least 20 percent of its total useful energy in the form of thermal
energy which is not used to produce electrical or mechanical power (or combination
thereof), and at least 20 percent of its total useful energy in the form of electrical or
mechanical power (or combination thereof).
10. Renewable CHP Plant. A Qualifying CHP Plant for which at least 90 percent of the annual
fuel input is composed of energy sources other than natural gas, coal, oil, propane, other
fossil fuels, or nuclear energy.
11. Useful Thermal Energy. Energy 1) in the form of direct heat, steam, hot water, or other
thermal form that is used in production and beneficial measures for heating, cooling,
humidity control, process use, or other valid thermal end use energy requirements and
(2) for which fuel or electricity would otherwise be consumed.
12. Utility Customer. A Utility Customer is an entity who purchases retail electricity from the
utility.
(c) Incentives.
1. Incentives for Utility Customer- or Third Party-Owned CHP. Utilities shall provide an
operating incentive to customers who finance a CHP plant, or third parties who finance a
CHP plant to serve a customer or group of customers.
2. Duration of Incentives. Operating incentives shall be provided for a period of fifteen (15)
years.
3. Level of Incentive. The operating incentive shall be calculated as follows:

84 | P a g e COMM-20130522-67922 | July 2014
CIPE = Statewide average total CIP expenditures by electric utilities for non-CHP
incentives and programs over the three (3) calendar years prior to the initiation of
commercial operation of the CHP plant, inclusive of administrative costs
CIPS = Statewide average total first year CIP savings (MWh) by electric utilities for non-
CHP incentives and programs over the three (3) calendar years prior to the initiation of
commercial operation of the CHP plant
Level of Incentive = CIPE / (CIPS x 15 years)
4. Utility-Owned CHP. If the electric utility finances a CHP plant, it may include as a CIP
expenditure the amount which would otherwise be provided to a CHP Plant financed by a
customer or third party.
(d) Alternative Compliance.
1. Alternative Compliance Payment. A utility may discharge its obligations, in whole or in
part, for any Compliance Year by making an Alternative Compliance Payment (ACP) to
the Minnesota Department of Commerce. The ACP Rate, in $ per MWh CHPC, and
provisions for modifying the rate, shall be established in rulemaking.
2. Use of Funds. The Department of Commerce shall oversee the use of ACP funds so as to
further the implementation of CHP, district energy systems and other energy efficiency
and renewable energy systems.
(e) Tradable Credits. A system of tradable CHP credits (CHPCs), similar to Renewable Energy
Credits (RECs), will be established so that a customer, third party or natural gas utility can
generate CHP Credits for sale to electric utilities.
1. Lifetime. CHPS Credits will have a trading lifetime of 4 years according to the year of
generation (e.g., all credits generated during 2017, regardless of the month, expire at the
end of 2021).
2. Whole Credits. CHPCs must remain "whole" and may not be disaggregated into separate
environmental commodities (e.g., carbon emission credits)
ARTICLE 3. INTEGRATED RESOURCE PLANNING
Subd. 1. Minnesota Statutes 216B.2422 Subd. 4 is modified with the italicized insertion as
follows:
Subd. 4.Preference for renewable energy facility.
The commission shall not approve a new or refurbished nonrenewable energy facility which
generates only electricity in an integrated resource plan or a certificate of need, pursuant to
section 216B.243, nor shall the commission allow rate recovery pursuant to section
216B.16 for such a nonrenewable energy facility, unless the utility has demonstrated that a
renewable energy facility is not in the public interest. The public interest determination must
include whether the resource plan helps the utility achieve the greenhouse gas reduction
goals under section 216H.02, the renewable energy standard under section 216B.1691, or
the solar energy standard under section 216B.1691, subdivision 2f. Electric utilities are
85 | P a g e COMM-20130522-67922 | July 2014
required to demonstrate that, before power-only capacity is proposed in Integrated Resource
Plans, CHP opportunities within their service territory have been thoroughly assessed to
determine the GHG, grid resiliency and other benefits of CHP.
Subd. 2. Minnesota Statutes 216B.2422 is modified by adding the following new Subdivision
and renumbering subsequent subdivisions:
Subd. 5. Preference for combined heat and power.
The commission shall not approve a new or refurbished nonrenewable energy facility which
generates only electricity in an integrated resource plan or a certificate of need, pursuant to
section 216B.243, nor shall the commission allow rate recovery pursuant to section
216B.16 for such a nonrenewable energy facility, unless the utility has demonstrated that:
1) opportunities for new combined heat and power plants within their service territory have
been thoroughly assessed to determine the greenhouse gas, grid resiliency and other
benefits; 2) the potential for converting existing power plants to combined heat and power,
with distribution of recovered energy through district energy systems, has been thoroughly
assessed to determine the greenhouse gas, grid resiliency and other benefits; and 3) a
combined heat and power facility is not in the public interest, which public interest
determination shall include whether the resource plan helps the utility achieve the combined
heat and power requirements in Minnesota Statutes 216B.241
ARTICLE 4. STANDBY RATES
Minnesota Statutes 216B.164 is modified by adding the following new subdivision and renumbering
subsequent subdivisions:
Subd. 3. STANDBY RATES. Standby rates charged by public utilities must conform to the
following principles:
6. Standby rates should be transparent, concise and easily understandable. Potential CHP
customers should be able to accurately predict future standby charges in order to assess
their financial impacts on CHP feasibility.
7. Standby energy usage fee should reflect both demand and time-of-use cost drivers.
Time-of-use energy rates send clear price signals as to the cost for the utility to generate
needed energy. This would further incentivize the use of off-peak standby services.
8. The Forced Outage Rate should be used in the calculation of a customer’s reservation
charge. The inclusion of a customer’s forced outage rate directly incentivizes standby
customers to limit their use of backup service. This further ties the use of standby to the
price paid to reserve such service, creating a strong price signal for customers to run
most efficiently.
9. The standby demand usage fees should only apply during on-peak hours and be charged
on a daily basis. This rate design would encourage CHP customers to shift their use of
standby service to off-peak periods when the marginal cost to provide service is
generally much lower. Furthermore, this design would allow customers to save money by
reducing the duration of outages.
86 | P a g e COMM-20130522-67922 | July 2014
10. Grace periods exempting demand usage fees should be removed where they exist.
Exempting an arbitrary number of hours against demand usage charges sends
inaccurate prices signals about the cost to provide this service. Standby demand usage
should be priced as-used on a daily and preferably an on-peak basis. This method
directly ties the standby customer to the costs associated with providing standby service.
Implementation and Rulemaking
Following passage of legislation, the following steps are recommended:
1. Conduct a study to quantify the “Value of CHP” relative to total primary energy efficiency,
GHG emissions, power grid resiliency, peak demand management and risk management.
Further, the study should assess potential constraints to increased implementation of CHP,
such as natural gas pipeline capacity limitations.
2. Establish clear policies regarding inclusion of CHP costs in electric utility rates, including
mechanisms for addressing ratepayer risks associated with utility investment in CHP through
a return on equity risk premium, a state-funded loss reserve or other mechanism.
3. Initiate a high-level dialog with the Midwest Independent System Operator to create rules
that encourage maximum dispatch of CHP units.
87 | P a g e COMM-20130522-67922 | July 2014
Appendix A: Best Practices in Other States
This section describes CHP policies and programs in other states, including portfolio standards,
interconnection rules, stand-by rates, financial incentives, net metering regulations and other
policies.
Portfolio Standards
A number of states have explicitly included some form of CHP as an eligible resource in portfolio
standards. CHP can be incorporated into all three of the portfolio standards types described below.
Renewable portfolio standard (RPS) is the most common form of a portfolio standard and is
usually focused on traditional renewable energy such as wind, solar, and biomass projects.
This type of portfolio standard may incorporate other technologies and fuel types in addition
to renewable energy and may have separate tiers or target mandates based on the form of
generation. RPS are often market-based— qualifying projects receive tradable credits,
typically referred to as renewable energy credits (RECs), which can then be sold for
compliance purposes. Connecticut is an example of a state with CHP included in an RPS.
Energy efficiency resource standards (EERS) require utilities to save a certain amount of
energy every year. To do this, utilities implement energy efficiency programs to help their
customers save energy in their homes and businesses. EERS can be market-based and have
a trading system of credits, although this is not as common as in RPS. EERS are typically
defined as including end-use energy savings. Some states include other types of efficiency,
including distribution system savings and CHP and other efficient distributed generation
technologies. Many states have an EERS and a separate RPS, but some combine an RPS and
EERS into one comprehensive portfolio standard program. Michigan is an example of a state
that passed legislation creating a renewable energy standard (RES). In addition to
renewables, the standard requires that both electric and natural gas utilities meet certain
energy savings requirements (i.e., EERS targets).
Alternative energy portfolio standards (APS) often set targets for a certain percentage of a
supplier’s capacity or generation to come from alternative or advanced energy sources such
as CHP, coal with carbon capture and storage (CCS), coal co-fired with biomass, or municipal
solid waste projects. These standards are often market-based and credit eligible projects
with alternative energy credits or some other form of credit, which can then be purchased by
electricity suppliers to meet compliance obligations. Examples of states with APS include
Massachusetts and Pennsylvania.
According to the EPA (EPA CHP Program website), as of February 2013, some form of portfolio
standard has been established in 42 states plus the District of Columbia (see Figure 22). Of these
states, 24—Arizona, Connecticut, Colorado, Delaware, Hawaii, Indiana, Louisiana, Maine,
Massachusetts, Michigan, Minnesota, Nevada, New York, North Carolina, North Dakota, Ohio,
Oklahoma, Pennsylvania, Rhode Island, South Dakota, Utah, Vermont, Washington and West
Virginia—specifically call out a form of CHP and/or waste heat to power as an eligible resource in
some portion of their CEPS program guidelines (RPS, APS, or EERS). While a number of states have
recognized CHP in RPS or EERS programs, many of the RPS programs limit qualified CHP systems to
waste heat to power CHP (CHP bottoming cycles), and most EERS programs do not set separate
targets for CHP, thereby reducing the effectiveness of these programs in promoting CHP
development.
Seventeen states have mandatory portfolio standards that include CHP:
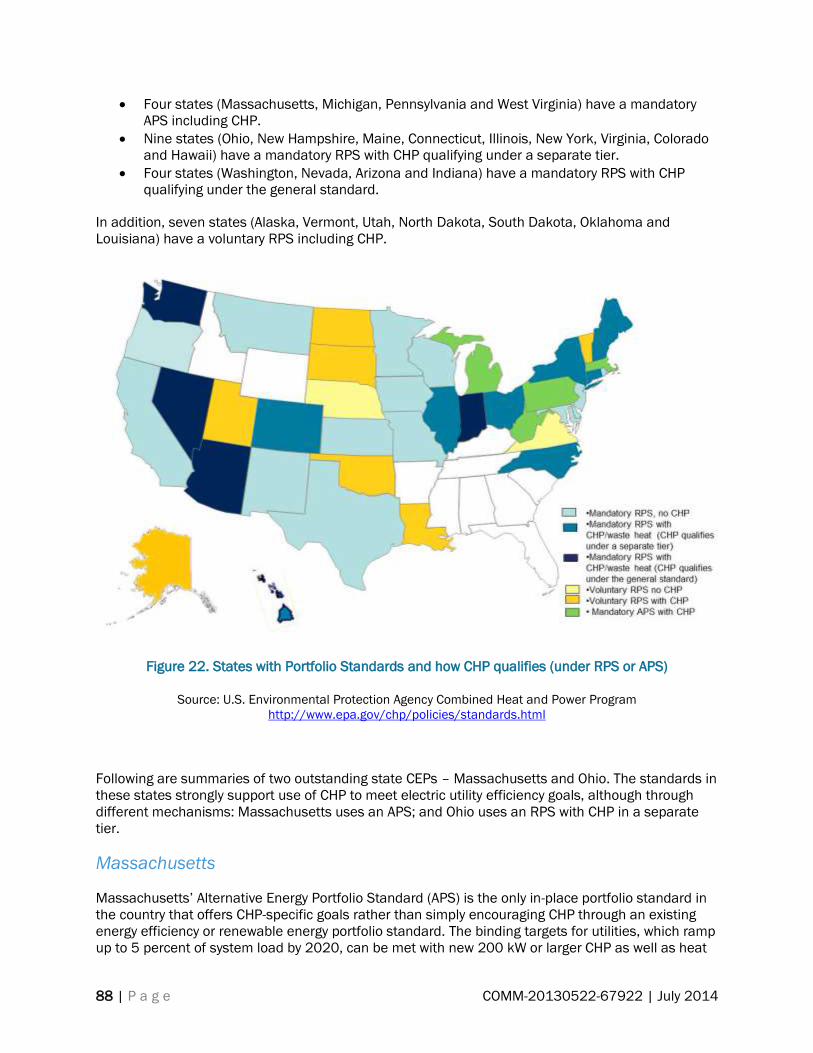
88 | P a g e COMM-20130522-67922 | July 2014
Four states (Massachusetts, Michigan, Pennsylvania and West Virginia) have a mandatory
APS including CHP.
Nine states (Ohio, New Hampshire, Maine, Connecticut, Illinois, New York, Virginia, Colorad
and Hawaii) have a mandatory RPS with CHP qualifying under a separate tier.
Four states (Washington, Nevada, Arizona and Indiana) have a mandatory RPS with CHP
qualifying under the general standard.
In addition, seven states (Alaska, Vermont, Utah, North Dakota, South Dakota, Oklahoma and
Louisiana) have a voluntary RPS including CHP.
o
Figure 22. States with Portfolio Standards and how CHP qualifies (under RPS or APS)
Source: U.S. Environmental Protection Agency Combined Heat and Power Program
http://www.epa.gov/chp/policies/standards.html
Following are summaries of two outstanding state CEPs – Massachusetts and Ohio. The standards in
these states strongly support use of CHP to meet electric utility efficiency goals, although through
different mechanisms: Massachusetts uses an APS; and Ohio uses an RPS with CHP in a separate
tier.
Massachusetts
Massachusetts’ Alternative Energy Portfolio Standard (APS) is the only in-place portfolio standard in
the country that offers CHP-specific goals rather than simply encouraging CHP through an existing
energy efficiency or renewable energy portfolio standard. The binding targets for utilities, which ramp
up to 5 percent of system load by 2020, can be met with new 200 kW or larger CHP as well as heat

89 | P a g e COMM-20130522-67922 | July 2014
recovery or electricity generation added onto existing generation systems. The standard also includes
other technologies such as flywheel storage, but CHP dominates, representing 99.1 percent of the
technologies acquired for compliance with the standard.
To satisfy the requirements of the APS, utilities purchase tradable credits from qualifying CHP
systems. The cost to acquire these credits is recovered in rate cases, and an alternative compliance
payment is made by utilities that fail to acquire sufficient resources. The credits carry the
environmental benefits of the CHP systems, and while there is no existing strong market in which to
monetize all of these benefits, there could be in the future. Additionally, the utilities that can claim
CHP savings are able to claim the efficiency savings towards their efficiency targets, and
Massachusetts utilities have recently found CHP to help significantly in bringing down the overall
cost of their efficiency portfolios (Chittum and Farley, 2013). In fact, CHP was the lowest cost energy
efficiency resource reported by Massachusetts utilities in 2011, and the tremendous amount of CHP
acquired as efficiency savings helped utilities earn performance incentives (Chittum and Farley
2013).
Ohio
In 2008 Ohio enacted broad electric industry restructuring legislation (S.B. 221) containing
advanced energy and renewable energy generation and procurement requirements for the state's
electric distribution utilities and electric service companies (hereafter referred to as utilities). This
definition encompasses all retail electricity providers except municipal utilities and electric
cooperatives. Under the standard, utilities must provide 25 percent of their retail electricity supply
from alternative energy resources by 2025, with specific annual benchmarks for renewable and
solar energy resources. Half of the standard can be met with “any new, retrofitted, refueled, or
repowered generating facility located in Ohio,” including fossil fuels, making the renewables portion
of the standard 12.5 percent renewables by 2025 (DSIRE).
In 2012 Ohio enacted new legislation, Senate Bill 315, which explicitly establishes CHP as an eligible
technology within the state’s existing energy efficiency resource standard (DSIRE). SB 315 promotes
cogeneration projects by qualifying them for use by the state’s investor-owned utilities to meet
certain requirements under SB 221, Ohio’s landmark energy law enacted in 2008. SB 315 classifies
cogeneration technology as both “renewable energy” and “energy efficiency.” That classification
qualifies cogeneration for inclusion in Ohio’s renewable portfolio standard (RPS) or as an eligible
technology under SB 221’s energy efficiency provisions, which require utilities to achieve certain
annual benchmarks for energy savings from energy efficiency projects.
SB 315 allowed project owners to choose which treatment — renewable energy or energy efficiency,
but not both — to apply to a particular project. Specifically, the bill:
States that the energy policy of the State includes encouraging “innovation and market
access for cost-effective supply- and demand-side retail electric service including . . . waste
energy recovery systems.” R.C. 4928.02(D).
Creates the term “waste energy recovery system” and defines it as “a facility that generates
electricity through the conversion of energy from either of the following:
o Exhaust heat from engines or manufacturing, industrial, commercial, or institutional
sites, except for exhaust heat from a facility whose primary purpose is the generation
of electricity.
o Reduction of pressure in gas pipelines before gas is distributed through the pipeline,
provided that the conversion of energy to electricity is achieved without using
additional fossil fuels.” R.C. 4928.01(36).

90 | P a g e COMM-20130522-67922 | July 2014
Includes “waste energy recovery system” in the term “renewable energy resource” unless a
waste energy recovery system “is, or has been, included in an energy efficiency program of
an electric distribution utility.” R.C. 4928.01(35).
Clarifies that an electric distribution utility’s energy efficiency programs may include waste
energy recovery systems placed in service or retrofitted on or after January 1, 2006. R.C.
4928.66(A)(1)(a) & (A)(2)(d).
Clarifies that a utility can meet its energy efficiency requirements by counting the effects of
waste energy recovery systems, including customer-sited waste energy recovery systems.
R.C. 4928.66(A)(2)(c).
Unfortunately, in 2014 Ohio Senate Bill 310 was passed by the legislative and signed by Gov. John
Kasich. This legislation essentially put a two-year freeze on Ohio’s renewable and energy-efficiency
standards.
Crediting CHP
One of the challenges faced by Ohio and other states considering CHP within existing portfolio
standards is the method by which the CHP savings is calculated and credited. As opposed to other
efficiency measures, CHP offers overall energy savings but also generally increases on-site fuel
usage, which must be considered when calculating overall savings. Several states have developed
their own approaches, but no standard accounting approach has emerged.23 This issue is explored in
Chapter 6.
Interconnection rules
Minnesota’s existing interconnection rules have many features of the best interconnection standards
in the country, including clear time lines for particular processes, reasonable fees for interconnection
and engineering studies, and fees scaled to system size.
Minnesota does not currently offer a fully tiered interconnection standard, however, which would
allow smaller systems the option of a “fast-track” process. For qualifying systems that could take
advantage of such an option, reduced paperwork, fees, and wait times could yield significant
economic benefit.
California
Many states feature tiered interconnection standards with clear benefits to certain generators that
satisfy specific requirements. For instance, California’s recently updated Rule 21 interconnection
standards vary from utility to utility, but generally offer distributed generators a “fast-track” option. In
the case of PG&E, the utility is required to indicate to the applicant whether they are eligible for the
fast-track process within 15 business days of the interconnection request.24 If an application does
23 See Kowley 2012 for a discussion of several of the existing methodological approaches to counting CHP
savings within a portfolio standard.
24 See http://www.pge.com/tariffs/tm2/pdf/ELEC_RULES_21.pdf for complete interconnection rules for PG&E.
PG&E also offers a clear list of frequently asked questions regarding interconnection, available here:
http://www.pge.com/b2b/newgenerator/faq/

91 | P a g e COMM-20130522-67922 | July 2014
not require equipment upgrades, the utility must provide the applicant with an interconnection
agreement within another 15 business days.
Connecticut
While Minnesota’s existing interconnection standard applies to systems up to 10MW, the leading
states offer interconnection standards for systems up to 20MW in size. For instance, Connecticut’s
interconnection standard offers three distinct tiers of interconnection up to 20MW, each with its own
fee:
Systems less than 10kW, which incur a $100 application fee;
Systems between 10kW and 2MW, which incur a $500 fee; and
Systems between 2MW and 20MW, which incur a $1,000 fee and fees for additional studies
deemed necessary (013 Connecticut Department of Public Utility Control 2007).
These fees are generally in line with Minnesota’s fees for different system sizes.
Maine
Maine’s relatively recent interconnection standards are viewed as model standards. They feature
four distinct tiers of interconnection, with corresponding fees and studies. 25 Maine’s tiers are:
Systems of 10kW or fewer, which incur a $40 fee;
Systems between 10kW and 2MW, which incur a $50 + $1/kW fee;
Systems less than 10MW which will not export, which incur a $100 + $1.50/kW fee; and
Systems that do not meet any of the above tier definitions, which incur a $100 + $2/kW fee
at a maximum, as well as fees associated with necessary studies and utility upgrades
(DSIRE).
CHP-friendly stand-by rates
Some of the country’s utilities have taken an active approach to devising standby-rates that reflect
some of the benefits and features of CHP systems.
Con Edison
Con Edison of New York’s offers CHP system owners an Offset Tariff, which applies to campuses with
multiple buildings and a CHP system onsite. The CHP system output is applied to the total demand
from all the campus’ meters, allowing the CHP system output to be credited against the entire
campus’ peak demand. This can help blunt the impact of demand charges from certain meters by
evening out the benefit of CHP output over multiple meters. Individual meter peaks are somewhat
minimized, and demand charges are reduced for the customer as a whole (Chittum and Farley
2013).
25 See http://www.dsireusa.org/documents/Incentives/ME15R.pdf for the related order from the Maine Public
Utilities Commission

92 | P a g e COMM-20130522-67922 | July 2014
Pacific Power
Pacific Power’s backup power tariff for partial service customers offers benefits to customers for
reducing reliance on grid-provided power during peak grid demand periods.26 Separate line-items
charges per capacity required during the system peak are built into these rates, and customers are
only charged for transmission and ancillary services for the power they require during system peak
periods. Additionally, the variable distribution charges are much more heavily weighted toward what
is demanded during system peak periods than what is demanded during other time periods.
New Jersey
A 2012 bill directing the New Jersey Board of Public Utilities (BPU) to undertake studies into the
benefits and issues associated with distributed generation. The BPU concluded that “the rates that
distributed generators pay [for] standby service should reflect the costs that they place on the
[distribution utility]’s distribution system, to ensure there is equity between Distributed Generators
and other utility ratepayers to avoid subsidies.” Utilities were required to file exhibits in support of
existing rate schedules, or file requests for new standby rates. The BPU asked that these rates
consider the impact of CHP systems on the distribution systems during times of peak demand, and
calculate such grid benefits accordingly (NJBPU 2012).
Utility Programs, Policies, and Planning
Utilities are an under-utilized partner in the quest for greater deployment of CHP. Without properly
aligned economic incentives, however, utilities have little economic interest in seeing increased CHP
deployment. Since utilities are so well-suited to support greater CHP deployment – they have many
issues that CHP systems can help cost-effectively address; they are used to making long-term
investments; and they are better aware of their customers’ unique energy needs and opportunities
than anybody else – it is critical to understand how they could become more involved in CHP project
deployment.
Several examples of both electric and natural gas utilities working to support new CHP projects can
be found around the country. In other cases, policies that would help utilities better view CHP as an
economic opportunity are in place and could be leveraged to develop strong CHP programming.
Pennsylvania
Philadelphia Gas Works (PGW) is the natural gas utility serving Philadelphia. In order to encourage
greater CHP deployment, they offer a unique financing mechanism for CHP systems in their service
territory. PGW pays all the initial equipment, installation, and engineering costs of a new CHP system
on behalf of the customer, leaving the customer to retain ownership of the system. The customer
then pays PGW back for the investment over a five year period, paying a flat monthly fee that
typically is less than what the customer was paying previously for grid-provided power and the
thermal energy now provided by the CHP system (Chittum and Farley 2013). This program is
26 Pacific Power’s Schedule 47 and 48 can be viewed in greater detail here:
http://www.pacificpower.net/content/dam/pacific_power/doc/About_Us/Rates_Regulation/Oregon/Approved
_Tariffs/Rate_Schedules/Large_General_Service_Partial_Requirements_1_000_KW_and_Over_Delivery_Servi
ce.pdf
93 | P a g e COMM-20130522-67922 | July 2014
structured to help energy or facility managers gain support internally for a CHP system by reducing
the risk and perceived risk associated with making the large up-front investment CHP systems
typically require.
Connecticut
Connecticut requires all affected utilities to include CHP in their long-term resource plans
(Connecticut Public Act 2007):
“The electric distribution companies, in consultation with the Connecticut Energy Advisory
Board, established pursuant to section 16a-3 of the general statutes, as amended by this
act, shall review the state's energy and capacity resource assessment and develop a
comprehensive plan for the procurement of energy resources, including, but not limited to,
conventional and renewable generating facilities, energy efficiency, load management,
demand response, combined heat and power facilities, distributed generation and other
emerging energy technologies to meet the projected requirements of their customers in a
manner that minimizes the cost of such resources to customers over time and maximizes
consumer benefits consistent with the state's environmental goals and standards.
These procurement plans consider customers’ “energy and capacity requirements” at three, five,
and ten years forward. Funded through the state’s systems benefits charge, they are updated
annually (Connecticut Public Act 2007).
One utility in Connecticut, United Illuminating, explored the option of partnering with third-party
entities to encourage new CHP project development. The program was run as a test to gauge interest
and has since been cancelled, but it was well-received by potential CHP hosts. The utility understood
that it would be able to reap the rewards of increased CHP on its distribution system, while reducing
the energy usage of their customers and acquiring cost-effective efficiency resources.
Oregon
Oregon legislation established a voluntary emissions reduction program in which the state’s natural
gas utilities may participate. Utilities can offer energy efficiency programs that yield emissions
reductions, and may recover the costs of those programs from the ratepayers that will benefit from
the projects. Projects may thus increase the on-site natural gas use if they reduce overall emissions
by avoiding centralized generation, such as with CHP (Oregon Legislative Assembly 2013). One
natural gas utility has expressed interest in such a model.
Alabama
In Alabama the investor-owned Alabama Power owns several CHP plants located and industrial
facilities around the state. These plants’ costs have been integrated into the rate base, allowing the
utility to earn a rate of return on their investment akin to that which it receives on other investments.
Missouri
In Missouri two ethanol plants host CHP systems that serve their immediate facilities with thermal
energy and their local utilities with electricity. These CHP systems are both owned and maintained by
the municipal utilities, with the heat recovery equipment owned by the two ethanol plants. These
plants are 10MW and 15MW in size, and were developed with specific one-off agreements between
the ethanol plants and the municipal utilities.

94 | P a g e COMM-20130522-67922 | July 2014
California
In California several policies encourage regulated utilities to acquire and support greater CHP
deployment. An agreement between CHP developers and the regulated utilities of the state yielded
utility-specific acquisition targets for CHP capacity, which can be satisfied by the development of
power purchase agreements (PPAs) with CHP facilities. The cost of these PPAs is embedded in
customer rates, while the emissions reductions benefits associated with the CHP capacity is
creditable to the utility in the state’s cap and trade program.
California also established a feed-in-tariff (FIT) program, which pays CHP facilities for excess capacity
beyond that which they consume onsite. Ten year contracts for the power are developed, with the
price indexed to the short-run avoided cost of power. These costs to the utility are then recovered in
customer rates as well.
Massachusetts
As part of the state’s 2008 Green Communities Act, Massachusetts requires utilities to consider CHP
within their three-year efficiency plans. All cost-effective CHP must be acquired, and utilities are given
the clarity and assurance that the costs associated with acquiring this CHP capacity is recoverable
within customer rates, and is creditable within their energy efficiency programs (Massachusetts
Session Laws 2008).
CHP financial incentives
There are a number of excellent models for financial incentives and financing assistance specific to
CHP. Minnesota currently does not offer any incentives specific to CHP, thus leaving much room for
improvement.
Maryland
Maryland’s Baltimore Gas and Electric (BG&E)’s Smart Energy Savers Program offers a robust
incentive program designed to encourage high-performing CHP systems. The incentive program is
structured as follows:
$75/kW after the system has been designed and a commitment letter has been signed;
$175/kW after the system has been installed and commissioned and undergone an
inspection; and
$0.07/kWh for the first 18 months of system performance, after metered data has been
reviewed.
This incentive program is applicable to systems that are at least 65 percent efficient and do not
export excess power to the grid. The maximum incentive offered by BG&E is $2 million for a single
project, and is available to almost all non-residential customer classes. See
http://www.bgesmartenergy.com/chp for further details on this program.
To date the program has been very well received by industrial and commercial customers, and due to
interest exceeding available funding, BG&E requested and received an additional $10 million in
program funding in 2013. The first round of funding yielded about 20 project applications, and BG&E
can claim these savings towards their established energy efficiency goals.

95 | P a g e COMM-20130522-67922 | July 2014
Illinois
In July 2014, the Illinois Department of Commerce and Economic Opportunity (DCEO) announced a
new public sector CHP incentive program. The CHP Pilot Program provides cash incentives for CHP
projects that increase energy efficiency of local governments, municipal corporations, public school
districts, community college districts, public universities, and state/federal facilities located in the
service territories of specific IOUs.
The Pilot Program is structured with performance based incentives to provide financial assistance
during various stages of a project, including after the design phase, commissioning, and after 12
months of measured operational performance (DCO website):
Design Incentive: $75/kW capacity (following completion of the design phase).
Constructive Incentive: $175/kW capacity (following successful commissioning of the
system).
Production Incentive: $0.08/kWh (with efficiency ≥ 70 percent HHV) OR $0.06/kWh
(efficiency ≥ 60 percent but < 70 percent HHV) of “useful electric energy” produced (after 12
months of operation based on meeting the measured operating requirements of the system).
The total incentive (Design + Construction + Production) is capped at $2 million or 50 percent of the
project cost, whichever is less. The design incentive is capped at $195,000 or 50 percent of design
cost, whichever is less. The construction incentive is capped at $650,000 or 50 percent of the
construction cost, whichever is less.
New York
The New York State Energy Research and Development Authority (NYSERDA) offers several CHP-
focused programs that dynamically respond to market needs. For instance, two existing incentive
programs target separate areas of the CHP market.
The Combined Heat and Power (CHP) Performance Program27 targets larger (over 1.3MW) systems
that use well-established technology and are designed to offer summertime peak demand reduction
benefits to the grid. Incentives are scaled depending on whether a system is located in upstate New
York or downstate New York, where the grid is more congested. Incentives are as follows:
Systems may earn up to $0.10/kWh generation;
Systems may earn an additional $750/kW of summer demand reduction; and
Systems may earn additional bonus incentives if they do any of the following:
o Serve critical infrastructure;
o Serve an area determined to be a challenged area of the grid of particular interest to
the local utility; and
o Exemplify “superior” efficiency.
27 For more details on NYSERDA’s CHP Performance Program, see:
http://www.nyserda.ny.gov/BusinessAreas/Energy-Efficiency-and-Renewable-Programs/Commercial-and-
Industrial/CI-Programs/Combined-Heat-and-Power-Program.aspx.
96 | P a g e COMM-20130522-67922 | July 2014
The CHP Performance Program offers a maximum incentive of $2.6 million or 50 percent of the
project cost, whichever is less. Systems are subject to a two-year measurement and verification
period, and incentives can be reduced for non-performance.
NYSERDA’s CHP Acceleration Program28 is specifically designed to accelerate the market for pre-
qualified smaller (less than 1.3MW) CHP systems that can be grid-independent and are also installed
by pre-approved vendors. These vendors are then required to take full responsibility for the
installation and performance of the CHP system, and offer a full warranty or service agreement for at
least five years.
Incentives are equipment- and design-based, with the base incentive depending on the specific CHP
system selected. Incentives range from $82,500 to $1.5 million per system.29 Additional bonus
incentives are also available for systems that offer additional benefits like those outlined above in
the Performance Program.
The maximum incentive under this program is $1.5 million per project. Similar to the above-
mentioned Performance Program, the Acceleration Program offers different incentive levels for
upstate and downstate installations, reflecting the important benefits to a stressed grid that CHP can
provide.
Net metering regulations
Net metering is defined and key issues are discussed above in section 2. Ten states include CHP in
net metering policy and exempt net metered customers from standby rates. Most of these states
exempt only very small (< 100 kW) CHP systems. However, some states offer net metering to
systems larger than 1 MW.
Pennsylvania
Pennsylvania’s net metering standards apply to systems up to 3 MW, and to systems between 3 MW
and 5 MW if they can be counted on to provide electricity to the grid in emergency situations (DSIRE
2013).30
Arizona31
Arizona’s net metering standard limits system size to “125 percent of a customer’s total connected
load” (DSIRE 2013), allowing for net metered systems to meet the entirety of a customer’s load.
28 See http://www.nyserda.ny.gov/Funding-Opportunities/Current-Funding-Opportunities/PON-2568-CHP-
Acceleration-Program.aspx for details on the CHP Acceleration Program
29 See http://www.nyserda.ny.gov/-
/media/Files/FO/Currentpercent20Fundingpercent20Opportunities/PONpercent202568/2568attc.pdf for the
complete catalog of pre-qualified equipment and their related incentive levels.
30 See http://www.dsireusa.org/documents/Incentives/PA03R.htm and
http://www.pacode.com/secure/data/052/chapter75/subchapBtoc.html for the 2004 statutes and the 2006
state code, respectively, that delineate Pennsylvania’s net metering rules
31 See http://www.azsos.gov/public_services/Title_14/14-02.htm#ARTICLE_23 for the applicable
administrative code.
http://www.nyserda.ny.gov/-/media/Files/FO/Current%20Funding%20Opportunities/PON%202568/2568attc.pdf

97 | P a g e COMM-20130522-67922 | July 2014
Output-based air emission rules
Although CHP systems are much more energy efficient than conventional generation on a system-
wide basis, some air quality regulations create a disincentive for CHP. Traditionally, emissions
regulations define limits on emissions per unit of fuel input (such as pound of SO2 per million BTU of
coal). Facilities that use CHP maybe penalized for producing more emissions individually because
they are generating electricity on-site rather than purchasing from the grid, even though they are
more efficient overall.
Output-based emissions standards define emissions limits based on the amount of emissions per
unit of useful energy output (such as pounds of SO2 per MWh). Output-based standards encourage
more efficient processes, including CHP. Some states have output-based air permits that are
explicitly designed to encourage CHP.32 Some states have taken this a step further by developing
“permit by rule” standards for CHP, which means that CHP systems can take advantage of a fast-
track permitting process if they satisfy particular requirements.
Texas
In 2012 the Texas Commission on Environmental Quality (TCEQ) adopted a new Permit-by-Rule for
CHP systems up to 15MW. This permit is a streamlined, more expedited permitting process to meet
various pollutant standards. The permits are administered on an output basis, meaning that
emission limits are set as pounds of pollutant per MWh of system output.33 The streamlined process
ensures that qualifying facilities can obtain their permits much faster than prior to the Permit-by-
Rule, greatly reducing the cost associated with acquiring necessary air permits.
Connecticut
Like Texas, Connecticut developed parameters that, if satisfied, allow a CHP system to be permitted
to operate without obtaining an individual permit.34 Connecticut’s Permit-by-Rule applies to CHP
systems up to 10MW, which must be 55 percent efficient per annual period.
Critical Facilities Rules
Several states have recently developed specific requirements that CHP be strongly considered for
resiliency reasons in facilities that are critical to maintain during times of natural and other disasters.
Texas
Texas adopted House Bills 183135 and 4409 that, beginning in 2009, required that facilities deemed
critical to maintain in emergency situations acquire a CHP feasibility study prior to construction or
32 A good recent example can be found in Texas, as summarized here:
http://www.texaschpi.org/Assets/downloads/executive-summary_chp-pbr_20120725.pdf
33 To see the TCEQ’s Permit by Rule, visit: http://www.texaschpi.org/Assets/downloads/tceq_chapter-
106_chp-pbr-ruling_20120725.pdf.
34 See http://www.ct.gov/deep/lib/deep/air/regulations/mainregs/sec3d.pdf for the full text of the permit by
rule.
98 | P a g e COMM-20130522-67922 | July 2014
significant renovations. This feasibility study should consider both the technical and the economic
potential for CHP to meet a facility’s energy needs, and is designed to encourage facilities to
implement CHP in order to be a critical functional resource when other facilities are without power
during emergency situations.
Louisiana
Similar to Texas, Louisiana adopted new legislation in 2012 that asks the state’s Department of
Natural Resources to develop policies that prompt certain government and other facilities to
consider the feasibility of CHP at the point of development or renovation.36
New York
The New York Research and Development Authority (NYSERDA) currently offers multiple incentives
for CHP. Some of these programs offer additional “bonus” incentives to CHP systems that serve
“critical infrastructure, including facilities of refuge.” For these purposes, critical infrastructure
includes facilities such as hospitals, data centers, energy infrastructure, financial services, food
distribution, transportation, and water infrastructure, among many others. Facilities of refuge are
those deemed critical to the maintenance of citizen safety and health, by entities such as the
American Red Cross or the emergency management office (NYSERDA 2013). At present these
additional incentives are offered as a 10 percent bonus on top of the base incentive earned.
Emerging Opportunities
A number of benefits and characteristics of CHP are recognized and leveraged in other countries and
some states, but are not at all widespread in the U.S. These benefits could accrue to the citizens of
Minnesota with increased CHP deployment, complementing the following opportunities.
Location-Specific Benefits
As discussed previously, strategically sited CHP systems can offer greater benefits to the grid at large
by meeting location-specific needs. In addition to incentives scaling to provide greater financial
incentive to systems sited at critical facilities, efforts to specifically target CHP to stressed areas of
the grid can be viewed as cost-effective alternatives to more expensive infrastructure investments. In
Vermont, a Geo-Targeting program encourages energy efficiency projects in areas of the distribution
grid deemed most congested. Every time energy efficiency programs are renewed, geo-targeting
areas are updated and news ones are added as needed. These areas are selected by committee
members, who focus on the areas of the grid that are known to require near-term investment.
Efficiency Vermont, which administers the energy efficiency programming, is informed of these areas
and is given flexibility to offer richer incentives or greater administrative support to facilities in these
areas. The program has already proven to be yielding both energy and demand reductions in the
targeted areas (Eaton 2013, Navigant 2011).
35 See http://www.capitol.state.tx.us/tlodocs/81R/billtext/pdf/HB01831F.pdf for full text of House Bill 1831,
and http://www.capitol.state.tx.us/tlodocs/81R/billtext/pdf/HB04409F.pdf for full text of House Bill 4409.
36 See http://legiscan.com/LA/text/HR167/id/651999 for the full text of the House Resolution.
99 | P a g e COMM-20130522-67922 | July 2014
California’s feed-in-tariff program also scales its tariffs to support greater deployment of CHP in
areas where particular substations are close to reaching their maximum capacity. Lists of such
substations are made publicly available and the per-kWh payment is increased for systems deployed
in these areas (Lipman 2013).
Support for Greater Renewable Energy Deployment
CHP systems’ abilities to provide ancillary and capacity services to the grid are being underutilized
for their ability to help balance intermittent renewable resources such as wind and solar. CHP
located strategically in areas that are subject to the vagaries of wind or solar power can help mitigate
the need for additional and more expensive capacity and ancillary resources. Additionally, CHP helps
reduce the overall load on the distribution and transmission systems, freeing up space for
renewable-fueled electricity to travel to its final destination (Casten 2012). CHP’s ability to rapidly
increase or decrease output in response to market signals leaves it well-positioned to help support
greater renewable energy deployment as well as reducing the costs associated with renewable
energy’s increased transmission needs (Andersen and Sorknæs 2011).
Reliable Natural Gas Revenue Stream
Natural gas-powered CHP systems represent a reliable and high-quality natural gas customer for
local gas distribution utilities. As such, they are highly desirable, as their high load factors help
improve the stability of gas demand and their long contracts help gas utilities better forecast and
address their future investment needs. Natural gas utilities in several states have developed CHP
programs and offer CHP systems rebates on their gas purchases. In some cases, such as
Connecticut and New Jersey, the reduction comes in the form of a credit towards all or part of their
gas delivery charge. New York and California both also offer preferential rates for gas to natural gas-
fueled CHP systems. For instance, California requires that natural gas utilities charge CHP systems
the same rates for natural gas as they do electric utilities. These types of discounts reflect the fact
that CHP systems can offer long-term certainty to natural gas utilities, and ultimately reduce the
amount of emissions in power production (Chittum and Farley 2013).
Involving natural gas utilities is one way to greatly expand the marketing of the CHP opportunity to
appropriate facilities. Natural gas utilities have existing relationships with their customers, and are
very aware of which larger customers might be well-suited to CHP, or might be planning to replace a
boiler or other piece of equipment in the near future. These are the exact opportunities in which CHP
can be introduced and explained to potential users, and natural gas utilities with a vested interest in
increasing CHP deployment within their service territory could be critical partners in such an effort.
Development of Robust CHP Supply Chain
There are a handful of major CHP equipment manufacturers in the United States. There are more
equipment distributors, and many more individual local CHP project developers, which sometimes
are the exact same entities that offer buildings customized energy engineering services. There are
also many different project financers, as well as other contractors that are involved in the
construction and operation and maintenance of the CHP systems. For seamless CHP project
installation and operations, these players must be comfortable working with the technology and with
each other. It takes many years for a true CHP market to develop, and with it the improving
economies of scale of working with partners that have ample experience in these areas.
New York State offers the best example of the benefits of supporting and hastening the development
of this CHP supply chain. For years the New York State Energy Research and Development Authority

100 | P a g e COMM-20130522-67922 | July 2014
(NYSERDA) has worked with CHP vendors and engineering firms to understand the challenges they
face in their efforts to deploy CHP systems. These exchanges have been two-sided: NYSERDA learns
about the market opportunities and market frustrations, which helps them build better programs and
suggest improved policies; the vendors learn about the opportunities for NYSERDA support and enjoy
opportunities to showcase their services and expertise, which NYSERDA then relies on in future
projects. These constant dialogues have yielded a situation in which NYSERDA programs are
regularly evolving, responding to changing market conditions and trying to remain as relevant and
useful to the market as possible. As a consequence, New York State has seen a tremendous
increase in CHP project development in recent years, and public agencies and utilities that previously
were uncomfortable working with CHP projects have now grown accustomed to them, reducing
project barriers and cost.
Most recently, NYSERDA developed an incentive program, mentioned above, that relies on a list of
approved CHP vendors. Potential customers can browse the list of vendors, and know that they have
been thoroughly vetted by NYSERDA, which reduces real and perceived project risk. The vendors, for
their part, benefit from an additional marketing arm via the NYSERDA website and associated events
and publications, and can rely on NYSERDA as well as involved utilities and public agencies for
project leads.
Valuation of Ancillary Services
At present Minnesota utilities do not have a clear way to value the ancillary or capacity services
provided by CHP. The Midcontinent Independent System Operator (MISO) operates an ancillary
services market, and CHP plants within MISO do sell ancillary services to the market, such as the
very large Midland Cogeneration Venture in Midland, Michigan. Utility-owned or supported CHP
projects could also contract to sell ancillary or capacity services, but the mechanism by which such
benefits would accrue directly to a utility and be incorporated into its cost-benefit analyses and
energy efficiency goals is unclear. Additionally, the value and importance of ancillary services and
capacity services provided by CHP facilities would need to be incorporated into IRPs as well in order
to allow a more comprehensive assessment of the value of CHP to CHP owners.
Importantly, CHP systems designed to provide ancillary services and capacity resources may
sometimes run in a less efficient manner than those that are designed just to follow the onsite
thermal load and ignore the realities of the electric market. It is important that policymakers weigh
the benefits and drawbacks of all scenarios when multiple scenarios are potentialities.
Support for Heat Networks
CHP systems produce thermal energy as one of their products, and have, in the U.S., typically been
sited next to the end-user. These industrial sites, campuses, hospitals, and other types of buildings
have onsite process heat and domestic heating needs. Some CHP systems in the U.S., and many in
other countries, generate their heat specifically to sell to district heating systems, which provide
space heating and hot water to an aggregation of buildings. These additional thermal demands
would represent a significant increase in CHP potential, since CHP systems are most often limited in
size by the existing thermal demand.

101 | P a g e COMM-20130522-67922 | July 2014
Appendix B: Federal Policy Context
This section describes existing federal policies and programs that are relevant to future
implementation of CHP in Minnesota, including investment tax credits, production tax credits,
Department of Energy and Environmental Protection Agency program. In addition, pending relevant
federal legislation is summarized.
Existing policies and programs
Tax Incentives
Investment Tax Credit (ITC)
Investment tax credits for CHP were established by the Energy Improvement and Extension Act of
2008.
The CHP credit is equal to 10 percent of expenditures, with no maximum limit stated, for the first 15
MW of CHP property (United States Code 26 USC 48). The total CHP capacity must be equal to or
less than 50 MW. Except for CHP fueled with biomass, the total efficiency must exceed 60 percent.
In addition, at least 20 percent of the total useful energy must be in the form of thermal energy, and
at least 20 percent must be in the form of electrical or mechanical energy. The efficiency
requirement does not apply to CHP systems that use biomass for at least 90 percent of the system's
energy source, but the credit may be reduced for less efficient systems.
The CHP credit applies to eligible property placed in service after October 3, 2008. Tax credits are
available for owners paying taxes on eligible systems placed in service on or before December 31,
2016. In general, the original use of the equipment must begin with the taxpayer, or the system must
be constructed by the taxpayer. The equipment must also meet any performance and quality
standards in effect at the time the equipment is acquired. The energy property must be operational
in the year in which the credit is first taken.
Renewable Electricity Production Tax Credit (PTC)
The federal renewable electricity production tax credit (PTC) is a per-kilowatt-hour tax credit for
electricity generated by qualified energy resources and sold by the taxpayer to an unrelated person
during the taxable year (United States Code 26 USC 45). This credit is relevant to CHP systems fuels
with renewable energy. Current credit amounts relevant for CHP are:
Closed-Loop Biomass: $0.023/kWh.
Open-Loop Biomass: $0.011/kWh.
Landfill Gas: $0.011/kWh.
Municipal Solid Waste: $0.011/kWh.
The duration of the credit is generally 10 years after the date the facility is placed in service. Under
current law, construction must begin by December 31, 2013. While this expiration makes the PTC
moot for the future we include this information in the report because legislative efforts are being
made to extend the PTCs.
102 | P a g e COMM-20130522-67922 | July 2014
Modified Accelerated Cost-Recovery System (MACRS) Plus Bonus Depreciation
Under the federal Modified Accelerated Cost-Recovery System (MACRS), businesses may recover
investments in certain property through depreciation deductions. The MACRS establishes a set of
class lives for various types of property, ranging from 3 to 50 years, over which the property may be
depreciated. CHP, fuel cells and microturbines are classified as 5-year properties.
Interconnection Standards
A range of required or recommended interconnection standards have been developed by federal
agencies and other entities. Federal Energy Regulatory Commission (FERC) has established
standards for distributed generation connected at the transmission level. The Department of Energy
has recommended “best practices” for standards for state adoption. The National Association of
Regulatory Utility Commissioners (NARUC) has also recommended model state standards. The
Interstate Renewable Energy Council (IREC) has developed model rules for interconnection of small
distributed generation. These standards and model rules are described below, drawing on
information prepared by the U.S. Environmental Protection Agency (EPA dCHPP database).
FERC Small Generator Interconnection Procedures (SGIP) and Agreement (SGIA)
The Federal Energy Regulatory Commission (FERC) has established standard terms and conditions
for public utilities to interconnect new sources of distributed generation with generating capacity of
20 MW or less. These requirements are developed based on requirements in FERC Orders 2006,
2006-A and 2006-B. Though the procedures and agreement do not directly reference CHP, they can
affect CHP. More specifically, they apply to FERC-jurisdictional interconnections that interconnect at
the transmission level. The FERC standards generally do not apply to distribution-level
interconnection, which is regulated by state public utilities commissions.
The SGIP contain technical procedures as well as standard contractual provisions. They provide
three ways to evaluate an interconnection request:
Level 1 - 10 kW Inverter Process: applies to certified, inverter-based systems 10 kW or less.
There is a $100 processing fee.
Level 2 - Fast Track Process: applies to certified systems 2 MW or less. There is a $500
processing fee.
Level 3 - Study Process: applies to systems greater than 2 MW but less than or equal to 20
MW. There is a $1,000 processing fee.
The procedures lay out specific timelines for utility responses, interconnection charges and standard
study fees. The review processes for Levels 1 and 2 include technical screens. If the screens are not
met, the application would go to the Level 3 review process. The procedures provide guidelines for
dispute resolution and require liability insurance "sufficient to insure against all reasonably
foreseeable direct liabilities given the size and nature of the generating equipment being
interconnected, the interconnection itself, and the characteristics of the system to which the
interconnection is made."
The SGIP require interconnection equipment to be certified according to IEEE Standards 1547 and
UL 1741. The SGIP address interconnection to spot networks for inverter-based distribution
generation. They do not address other interconnections to spot and area networks. The SGIP also do
not cover any external disconnect switch requirements.

103 | P a g e COMM-20130522-67922 | July 2014
The SGIA was developed for all interconnection requests submitted under the SGIP and governs the
terms and conditions under which the Interconnection Customer's Small Generating Facility will
interconnect with, and operate in parallel with, the Transmission Provider's Transmission System.
The SGIA is the agreement used for Levels 2 and 3. There is no standardized form for Level 1. The
SGIP apply to all distributed generation technologies including CHP.
Distributed Energy Interconnection Procedures, Best Practices For Consideration
Section 1254 of the Energy Policy Act of 2005 (EPAct) requires each State regulatory authority to
determine whether to require interconnection service to any consumer the utility serves who has on-
site generation by August 8, 2007. The Distributed Energy Interconnection Procedures were
developed as an outcome of this requirement. In the Procedures, DOE's Offices of Energy Efficiency
and Renewable Energy (EERE) and of Electricity Delivery and Energy Reliability (OE) encourage State
and non-State jurisdictional utilities to consider the following best practices in establishing
interconnection procedures:
EPAct requires that agreements and procedures for interconnection service "shall be just and
reasonable, and not unduly discriminatory or preferential." As such, generators and utilities
should be treated similarly in terms of State requirements.
Create simple, transparent (1- or 2-page) interconnection applications for "small generators"
(equal to or less than 2 MW), as noted in the FERC Order 2006.
Standardize and simplify the interconnection agreement for "small generators" and, if
possible, combine the agreement with the interconnection application.
Set minimum response and review times for interconnection applications. Provide expedited
procedures for certified interconnection systems that pass technical impact screens.
Establish small processing fees for "small generators", otherwise the interconnection request
must be accompanied by a deposit that goes toward the cost of the feasibility study, per
FERC Order 2006.
Set liability insurance requirements commensurate with levels typically carried by the
respective customer class.
Require compliance with IEEE 1547 and UL 1741 for safe interconnection.
Avoid overly burdensome administrative requirements, such as obtaining signatures from
local code officials, unless such requirements are standard practice in a jurisdiction for
similar electrical work.
Develop administrative procedures for implementing interconnection requirements on a
statewide basis through a rulemaking or other appropriate regulatory mechanism for state-
jurisdictional utilities to apply uniformly to all regulated electric distribution companies in the
State. Where practical, State interconnection administrative procedures should reflect
regional best practices and be comprehensive in scope. Administrative procedures should
also be transparent to both small generators and electric distribution utilities.
NARUC Model Interconnection Procedures and Agreement for Small DG Resources
The National Association of Regulatory Utility Commissioners (NARUC) represents the state public
service commissions that regulate electric utilities by helping to ensure that utility services are
provided at rates and conditions that are fair, reasonable and nondiscriminatory for all consumers. In
2003, NARUC released its Model Interconnection Procedures and Agreement for Small Distributed
Generation Resources, which can apply to CHP. The procedures are intended to be resources for
state commissions and industry stakeholders in their own DG efforts with the hope that they will
serve as a catalyst for state DG interconnection proceedings.
104 | P a g e COMM-20130522-67922 | July 2014
The guidelines lay out a process for expedited approval of interconnection for small resources. Under
this procedure the applicant would fill out one of two possible applications:
"Short Form Application for Single Phase Attachment of Parallel Generation Equipment 20 kV
or Smaller to the Electric System".
"Standard Application for the Attachment of Parallel Generation Equipment to the Electric
System for single phase equipment larger than 20 kV."
The applications would go through a primary and secondary screening process, after which they
would be able to execute an interconnection agreement with the utility. The guidelines provide for
general information about the need for interconnection agreements that address study fees,
timelines for utility responses, insurance levels, technical requirements, and dispute resolution
procedures. However the guidelines do not take a position on what these requirements should be,
leaving these issues up to the state utility commissions.
IREC Model Interconnection Rules
The Interstate Renewable Energy Council (IREC) is a non-profit organization that focuses on issues
that have an impact on expanded renewable energy use such as rules that support renewable
energy and distributed resources in a restructured market and connecting small-scale renewables to
the utility grid. IREC developed model interconnection rules that have been used as a template by
several state utility commissions and utilities in developing their interconnection standards.
The Interconnection Procedures are applicable for all state-jurisdictional interconnections of
Generating Facilities and outline four review paths:
Level 1 - For inverter-based Generating Facilities that pass specified screens and have a
Generating Capacity of 25 kilowatts (kW) or less.
Level 2 - For Generating Facilities that pass specified screens and have a Generating
Capacity of 2 megawatts (MW) or less.
Level 3 - For Generating Facilities that: (a) pass specified screens; (b) do not export power to
the Utility; and (c) have a Generating Capacity of 10 MW or less.
Level 4 - For all Generating Facilities that do not qualify for Level 1, Level 2 or Level 3
interconnection review processes.
Each path identifies steps towards an interconnection agreement, including the type of form, the
process by which an applicant submits an application and the process by which a utility can review
an application. Unless waived by the Utility, a Generating Facility must comply with the following
standards, as applicable:
IEEE Standard 1547 for Interconnecting Distributed Resources with Electric Power Systems
for Generating Facilities up to 10 MW in size.
IEEE Standard 1547.1 for Conformance Test Procedures for Equipment Interconnecting
Distributed Resources with Electric Power Systems.
UL 1741 Standard for Inverters, Converters and Controllers for Use in Independent Power
Systems. UL 1741 compliance must be recognized or Certified by a Nationally Recognized
Testing Laboratory as designated by the U.S. Occupational Safety and Health Administration.
Certification of a particular model or a specific piece of equipment is sufficient. It is also
sufficient for an inverter built into a Generating Facility to be recognized as being UL 1741
compliant by a Nationally Recognized Testing Laboratory.
105 | P a g e COMM-20130522-67922 | July 2014
NARUC Model Interconnection Procedures and Agreement for Small DG Resources
The National Association of Regulatory Utility Commissioners (NARUC) represents the state public
service commissions that regulate electric utilities by helping to ensure that utility services are
provided at rates and conditions that are fair, reasonable and nondiscriminatory for all consumers. In
2003, NARUC released its Model Interconnection Procedures and Agreement for Small Distributed
Generation Resources, which can apply to CHP. The procedures are intended to be resources for
state commissions and industry stakeholders in their own DG efforts with the hope that they will
serve as a catalyst for state DG interconnection proceedings.
The guidelines lay out a process for expedited approval of interconnection for small resources. Under
this procedure the applicant would fill out one of two possible applications:
"Short Form Application for Single Phase Attachment of Parallel Generation Equipment 20 kV
or Smaller to the Electric System".
"Standard Application for the Attachment of Parallel Generation Equipment to the Electric
System for single phase equipment larger than 20 kV."
The applications would go through a primary and secondary screening process, after which they
would be able to execute an interconnection agreement with the utility. The guidelines provide for
general information about the need for interconnection agreements that address study fees,
timelines for utility responses, insurance levels, technical requirements, and dispute resolution
procedures. However the guidelines do not take a position on what these requirements should be,
leaving these issues up to the state utility commissions.
Information/Education/Technical Assistance Programs
Executive Order -- Accelerating Investment in Industrial Energy Efficiency
In August 2012, President Obama issued an Executive Order to facilitate investments in energy
efficiency at industrial facilities, with a strong emphasis on CHP as an efficiency strategy.
The Order seeks to support these investments through a variety of approaches, including
encouraging private sector investment by setting goals and highlighting the benefits of investment,
improving coordination at the Federal level, partnering with and supporting States, and identifying
investment models beneficial to the multiple stakeholders involved.
The Order directed executive departments and agencies to:
1. Coordinate and strongly encourage efforts to achieve a national goal of deploying 40
GigaWatts (GW) of new, cost effective industrial CHP in the United States by the end of 2020.
2. Convene stakeholders, through a series of public workshops, to develop and encourage the
use of best practice State policies and investment models that address the multiple barriers
to investment in industrial energy efficiency and CHP.
3. Utilize their respective relevant authorities and resources to encourage investment in
industrial energy efficiency and CHP, such as by:
(i) providing assistance to States on accounting for the potential emission reduction
benefits of CHP and other energy efficiency policies when developing State
Implementation Plans (SIPs) to achieve national ambient air quality standards;
106 | P a g e COMM-20130522-67922 | July 2014
(ii) providing incentives for the deployment of CHP and other types of clean energy,
such as set asides under emissions allowance trading program state
implementation plans, grants, and loans;
(iii) employing output based approaches as compliance options in power and
industrial sector regulations, as appropriate, to recognize the emissions benefits
of highly efficient energy generation technologies like CHP; and
(iv) seeking to expand participation in and create additional tools to support the
Better Buildings, Better Plants program at the Department of Energy.
4. Support and encourage efforts to accelerate investment in industrial energy efficiency and
CHP by:
(i) providing general guidance, technical analysis and information, and financial
analysis on the value of investment in industrial energy efficiency and CHP to
States, utilities, and owners and operators of industrial facilities;
(ii) improving the usefulness of Federal data collection and analysis; and
(iii) assisting States in developing and implementing State specific best practice
policies that can accelerate investment in industrial energy efficiency and CHP.
CHP Technical Assistance Partnerships
DOE's CHP Technical Assistance Partnerships (CHP TAPs), formerly called the Clean Energy
Application Centers (CEACs), promote and assist in transforming the market for CHP, waste heat to
power, and district energy technologies and concepts throughout the United States.
Key services of the CHP Technical Assistance Partnerships include:
Market Opportunity Analyses – Supporting analyses of CHP market opportunities in diverse
markets including industrial, federal, institutional, and commercial sectors.
Education and Outreach – Providing information on the energy and non-energy benefits and
applications of CHP to state and local policy makers, regulators, energy end-users, trade
associations and others.
Technical Assistance – Providing technical assistance to end-users and stakeholders to help
them consider CHP, waste heat to power, and/or district energy with CHP in their facility and
to help them through the project development process from initial CHP screening to
installation.
The CHP Technical Assistance Partnerships are offering technical assistance to the more than 550
major source facilities impacted by the Boiler MACT regulation.
EPA CHP Partnership
The CHP Partnership is a voluntary program seeking to reduce the environmental impact of power
generation by promoting the use of CHP. The Partnership works closely with energy users, the CHP
industry, state and local governments, and other clean energy stakeholders to facilitate the
development of new projects and to promote their environmental and economic benefits.
Federal Energy Management Program (FEMP)
In July 2013 the U.S. Department of Energy Office of Energy Efficiency and Renewable Energy (EERE)
released a Notice of Intent to make U.S. Federal agencies aware that EERE intends to issue, on
behalf of FEMP, a funding opportunity called Assisting Federal Facilities with Energy Conservation
Technologies (AFFECT). AFFECT will provide direct funding to U.S. Federal agencies for the

107 | P a g e COMM-20130522-67922 | July 2014
development of capital projects and other initiatives to increase the energy efficiency and renewable
energy investments at agency facilities. FEMP will provide technical assistance to all Federal
agencies prior to and in anticipation of the funding opportunity.
It is anticipated that AFFECT will include CHP as well as renewable energy sources such as solar,
wind, biomass, landfill gas, ocean, geothermal and waste to energy.
Financing
U.S. Department of Energy - Loan Guarantee Program
Section 1703 of Title XVII of the Energy Policy Act of 2005 authorizes the U.S. Department of Energy
(DOE) to issue more than $10 billion in loan guarantees for energy efficiency, renewable energy and
advanced transmission and distribution projects. Projects must "avoid, reduce or sequester air
pollutants or anthropogenic emissions of greenhouse gases; and employ new or significantly
improved technologies as compared to commercial technologies in service in the United States at
the time the guarantee is issued."
CHP technologies are potentially eligible if a project meets the "new/improved" technology criteria.
In fact, in 2013 the DOE released a draft loan guarantee solicitation that explicitly mentioned CHP as
illustrative types of projects eligible for the program. However, this loan guarantee program will not
be useful for combined heat and power (CHP) for two reasons:
The majority of opportunities for saving energy are in deployment of commercial CHP
technologies, which do not appear to be eligible for this program; and
For CHP projects the proposed fees are onerous, especially in view of the relatively small size
of CHP projects.
American Recovery and Reinvestment Act (ARRA)
In 2009, following the passage of the ARRA, the DOE issued $156 million grants for DHC/ CHP/
Waste Energy /Industrial Efficiency to be used in “shovel ready” projects on both institutional and
public sectors. After the solicitation was closed on July 14, 2009, in total 359 proposals were
submitted to DOE with the total value of $9.2 billion. Out of that the federal share would have had
been $3.4 billion compared to the offered $156 million. Therefore, the rate 25:1 from the need to
the available grant funds emphasizes the strong interest in the energy market in DHC and CHP.
USDA Rural Utility Service
The Rural Utility Service (RUS) was originally created as the Rural Electrification Administration
during the Great Depression. In the 1930s, many rural regions lacked basic utilities that we take for
granted today, like electricity, telephone access, and indoor plumbing. One of the goals of the New
Deal was to bring these services to rural areas. Today, RUS works to improve rural access to
electricity, water and waste services, and telecommunications, including high-speed Internet access.
A new program is going through the USDA rulemaking process to implement the Energy Efficiency
and Conservation Loan Program, which may be available to fund CHP projects in rural areas.
Generally, RUS funding is made available through rural electric service providers (such as Rural
Electric Cooperatives) rather than directly to individual farmers or business owners.
The Rural Utility Service Electric Program makes loans to support retail electric service in rural areas
or the power supply needs of distribution borrowers. Eligible projects include demand side
108 | P a g e COMM-20130522-67922 | July 2014
management, energy conservation, and renewable energy systems, all of which could apply to
energy efficiency projects.37 However, this program does not seem to be frequently used for energy
efficiency projects. According to USDA’s Energy Investment Report38, the RUS Rural Electric Program
funded a loan guarantee for an energy efficiency project in Bismarck, North Dakota for about $50
million in 2003, but no energy efficiency programs since. More recently this program has funded
direct loans and loan guarantees for solar, wind, renewable biomass, and anaerobic digester
projects, some of which have included CHP. This suggests that this program is an underutilized
resource for CHP projects.
Air Quality Standards
Boiler MACT
In December 2012, the U.S. Environmental Protection Agency issued a set of final adjustments to
Clean Air Act standards for major source and area source boilers as well as certain solid waste
incinerators. These rules are commonly called the “Boiler MACT” (maximum achievable control
technology) rule.
Of particular interest to facilities with coal- and oil-fired boilers are the National Emission Standards
for Hazardous Air Pollutants for Major Sources: Industrial, Commercial, and Institutional Boilers and
Process Heaters. “Major sources” of toxic air emissions are defined as large boilers and process
heaters at industrial, commercial and institutional facilities that have the potential to emit 10 tons
per year (tpy) or more of any single hazardous air pollutant (HAP) or a combination of such pollutants
in excess of 25 tpy. (A companion rule to the major source regulation imposes requirements on area
sources, which emit less than 10 tpy of any single air toxin and less than 25 tpy of any combination
of them.) The covered pollutants include carbon monoxide as a surrogate for organic HAPs, hydrogen
chloride, mercury, filterable particulate matter and total selected metals.
Existing sources must comply with the standards by Jan. 31, 2016; however, if needed, they may
request from their permitting authority an additional year to comply.
Under the rule, all boiler sites must follow work practice standards that include boiler tuneups and
energy assessments. These work practice standards complete the compliance obligation for natural
gas-fired boilers and existing small (i.e., under 10 million Btu/hr heat input) coal- and oil-fired boilers;
however, larger coal- and oil-fired boilers must also meet the emissions limits specified in the rule.
The rule presents an opportunity for major source sites with coal- and oil-fired boilers to consider
switching to natural gas and/or natural gas-fired CHP instead of installing costly emissions controls
to achieve compliance. The U.S. Department of Energy supports the use of natural gas CHP as a
compliance strategy by offering technical and other assistance to affected boiler sites through its
regional CHP Technical Assistance Partnerships, or CHP TAPs (prior to Oct. 1, 2013, the DOE’s Clean
Energy Application Centers). For more on key major source and area source requirements, see the
DOE Advanced Manufacturing Office’s “Summary of EPA Final Rules for Air Toxic Standards for
Industrial, Commercial, and Institutional (ICI) Boilers and Process Heaters” (Pielli and Wickwire
2013).
37 See 7 CFR 1710; http://www.law.cornell.edu/cfr/text/7/1710.
38 USDA. "Energy Investment Report." http://www.usda.gov/energy/maps/report.htm. Accessed June 18,
2013. U.S. Department of Agriculture.

109 | P a g e COMM-20130522-67922 | July 2014
Significant opportunity exists in Minnesota to replace some of the affected boilers with new CHP.
Over 55 facilities in Minnesota will be impacted by the new boiler rules, and while CHP may not be an
appropriate measure for every affected facility, it represents a potentially attractive opportunity to
satisfy the new rules while establishing a long-term onsite energy generation solution (Zoet 2013).
Proposed Legislation, Policies and Regulations
Energy Sustainability and Efficiency Grants and Loans (Energy Independence
and Security Act)
Although this legislation remains in the statutes, its authorization for appropriations has expired. It is
included in this section because some of these provisions may be proposed again in the future. The
Energy Security and Independence Act (EISA) of 2007, passed by the Congress and signed by the
President, included two provisions relevant to CHP, as described below.
Energy Sustainability and Efficiency Grants and Loans for Institutions
Section 471 authorized appropriations of $750 million annually for 5 years was authorized for
implementing or improving sustainable energy infrastructure, including district energy systems,
facilities for production of energy from renewable sources, CHP, waste heat recycling or natural
sources of thermal energy. Eligible public sector entities include institutions of higher education,
local governments, municipal utilities, public school districts or designees of these institutions.
Waste Energy Recovery Incentives
Sections 451-453 of EISA authorize a program to encourage the recovery of industrial waste heat
and recycling it into useable heat and electricity. This provision establishes a program to provide
waste energy recovery grants at the rate of $10/MWh of electricity or $2.92/MMBtu of useful
thermal energy.
Local Energy Supply and Resiliency Act of 2013
The Local Energy Supply and Resiliency Act (LESRA) was introduced by Sen. Al Franken (D-MN) in
June 2013. In Sept. 2013 a bipartisan revised version of LESRA was introduced by Sen. Franken
and Sen. Lisa Murkowski (R-AK) as an amendment to S. 1392 -- the “Energy Savings and Industrial
Competitiveness Act of 2013″, co-sponsored by Senator Jeanne Shaheen (D-NH) and Senator Rob
Portman (R-OH). As of Oct. 2013 further consideration of energy legislation in this Congress is
questionable.
LESRA is designed to help industry, universities, hospitals and others capture waste heat and use
renewable resources for heating, cooling, and power generation. It will also strengthen our ability to
keep the lights on, keep buildings comfortable and enable uninterrupted business operations. This
is possible through combined heat and power (CHP) and district energy systems, which have proven
to be resilient during times of natural disasters.
Reducing interest costs is the key to implementing highly efficient and resilient energy infrastructure.
As described below, LESRA would 1) establish a program to provide cost-shared funding for technical
assistance for feasibility studies and engineering; and 2) enable qualifying energy infrastructure
projects to access lower-interest debt financing through a loan guarantee program.

110 | P a g e COMM-20130522-67922 | July 2014
Technical Assistance Program. The bill establishes a grant program in the Department of Energy to
provide technical assistance for identifying, evaluating, planning and designing waste heat recovery
systems for the purposes of heating, cooling, and power generation. This program helps for-profit
and nonprofit entities identify opportunities, assess feasibility, overcome barriers to project
implementation, conduct financial assessments and perform the required engineering. Authorized
appropriations: $150 million over the period 2014 to 2018.
Local Energy Infrastructure Loan Guarantee Program. The bill authorizes the Department of Energy
to provide loan guarantees to projects that: 1) recover waste heat or use local renewable energy for
heating or cooling: 2) generate power locally with CHP or renewable energy; 3) distribute power in
microgrids, or 4) distribute heating or cooling energy to buildings. Unlike past DOE loan guarantees
for innovative technologies, this program would focus on proven, commercial technologies, with the
goal of reducing interest costs for local energy infrastructure. Funds to carry out this program will
come from user fees.
Master Limited Partnerships Parity Act
The Master Limited Partnerships Parity Act (MLPPA) was introduced in both the Senate (S. 795, by
Sen. Chris Coons, D-DE and others) and the House (H.R. 1696, by Rep. Ted Poe, R-TX and others).
A Master Limited Partnership (MLP) is a business structure that is taxed as a partnership, but whose
ownership interests are traded like corporate stock on a market. The liquidity of such a vehicle
makes it very attractive to investors. Double taxation (corporate and individual) is avoided because
income from an MLP is taxed only at the individual level, thereby significantly reducing the cost of
capital.
MLPs have been used for decades but by law have only been available to investors in energy
portfolios for oil, natural gas, coal extraction, and pipeline projects. The MLPPA is an elegantly brief
bill that simply extends the definition of “qualified” sources to include clean energy resources and
infrastructure projects. Specifically included are those energy resources and technologies that
qualify under Internal Revenue Code Sections 45 (production tax credits) and 48 (investment tax
credits) of the tax code, including biomass, geothermal, solar, municipal solid waste and CHP.
GHG Regulation of Power Plants
New Source Performance Standards
On September 20, 2013, the Environmental Protection Agency (EPA) issued a proposed new rule
pursuant to section 111 of the Clean Air Act (CAA), which would establish new source performance
standards (NSPS) for carbon dioxide (CO2) emissions from new fossil fuel-fired electric utility steam
generating units (EGUs) and natural gas-fired stationary combustion turbines.
The proposed rule would establish separate standards for certain types of natural gas-fired
combustion turbines and for coal-fired electric utility boilers, including integrated gasification
combined cycle (IGCC) units. By statute, each NSPS is required to reflect the application of the “best
system of emission reduction” (BSER) that EPA has determined to be “adequately demonstrated”
taking into account costs, environmental impacts, and energy requirements. The proposed rule
would set a standard of performance for coal fired electric utility boilers and IGCC units based on the
partial application of carbon capture and storage (CCS) technology as the BSER. For natural gas-
fired stationary combustion turbines, EPA proposes to establish standards based on the application

111 | P a g e COMM-20130522-67922 | July 2014
of natural gas combined cycle (NGCC) technology as the BSER. Citing lack of data, EPA has not
proposed standards of performance for modified or reconstructed EGUs.
Notably for CHP, the proposed standard of performance for each subcategory is in the form of a
gross energy output-based CO2 emission limit expressed in units of emissions mass per unit of total
useful recovered energy, specifically, in pounds per megawatt-hour (lb/MWh). EPA proposes that
useful recovered energy include the gross electric output plus 75 percent of the useful thermal
output.
The proposed rule would set an emissions limit for new coal fired EGUs of 1,100 lb CO2/MWh over a
rolling 12-month operating period. This level will require the units to install at least “partial”
application of CCS. Alternatively, coal plants could accept a more stringent limit of 1,000-1,050 lb
CO2/MWh averaged over an 84-month operating period. EPA asserts that these limits correspond to
a reduction in CO2 emissions of approximately 40 percent as compared to CO2 emissions from a
new, highly efficient coal-fired power plant without CCS technology.
The proposed rule sets two emissions limit standards for new natural gas-fired stationary
combustion units depending on size. Units with a heat rate in excess of 850 MMBtu/hr will be
subject to a 1,000 lb CO2/MWh, while smaller units (less than or equal to 850 MMBtu/hr) must
meet a standard of 1,100 lb CO2/MWh. Both standards are based on the performance of modern
NGCC units without CCS.
In addition, to recognize the environmental benefit of reduced electric transmission and distribution
losses of CHP, EPA has proposed that for CHP facilities meeting certain efficiency criteria the
measured electric output would be divided by 0.95 to account for a 5 percent avoided energy loss in
the transmission of electricity. The efficiency criteria require that at least 20 percent of the total
gross useful energy output consists of electric or direct mechanical output and that least 20 percent
of the total gross useful energy output consists of useful thermal output on a rolling three calendar
year basis,
Clean Power Plan (Existing Power Plants)
On June 18, 2014, the U.S. Environmental Protection Agency has proposed rules for reducing
greenhouse gas (GHG) emissions in existing power plants through section 111 (d) of the Clean Air
Act. In general,39 the rule defines an “affected source” as a fossil fuel power plant designed to sell
more than 219,000 MWh of electricity per year and more than one-third of the potential electric
output to the grid.
The EPA has provided great flexibility to states in meeting GHG reduction goals by taking a “systems
approach” – allowing states to consider a wide range of actions that can be taken “beyond the fence
line” of the affected electric generating units (EGUs) to more cost-effectively reduce carbon dioxide
emissions. It is important to note that the Clean Power Plan sets out different goals for each state,
based on their ability to reduce emissions with these four “building blocks”:
heat rate40 improvements at coal-fired EGUs;
39 There are some inconsistencies in the proposed rule that suggest that gas-fired plants must be both
designed to and actually sell those threshold amounts on a three-year rolling average.
40 “Heat rate” means the amount of fuel required to produce one kilowatt-hour of useful energy (usually
expressed as Btu per kilowatt-hour of electricity).
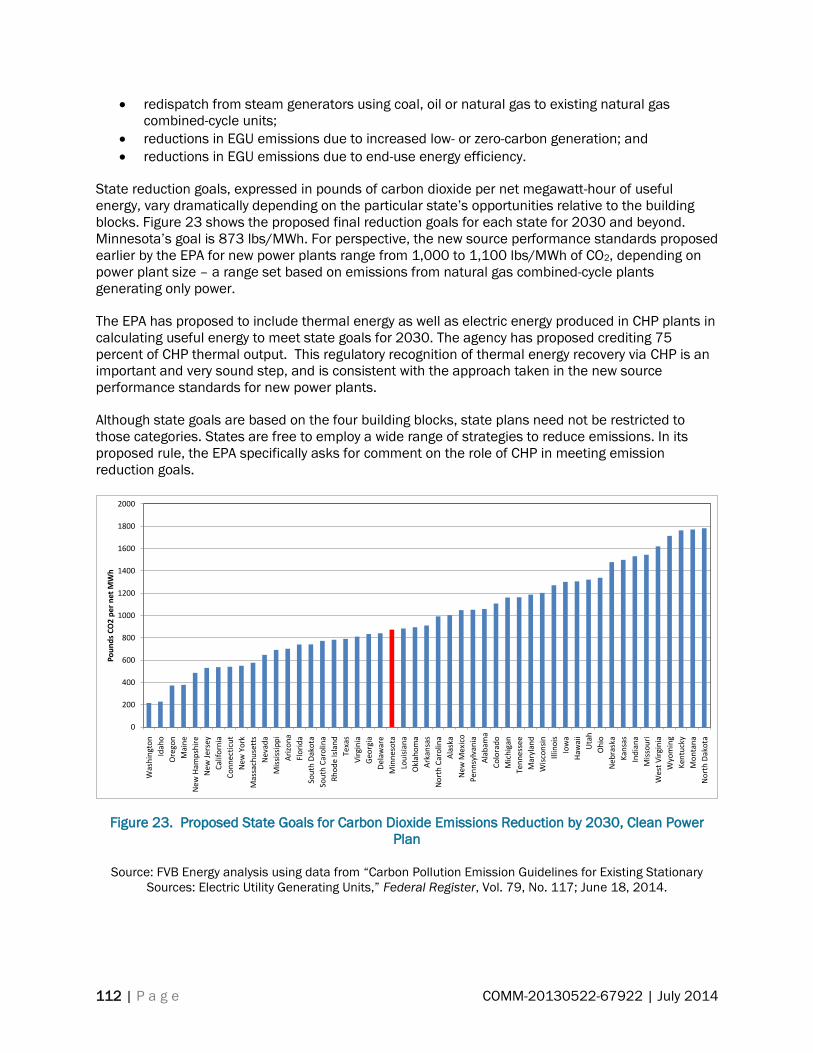
112 | P a g e COMM-20130522-67922 | July 2014
redispatch from steam generators using coal, oil or natural gas to existing natural gas
combined-cycle units;
reductions in EGU emissions due to increased low- or zero-carbon generation; and
reductions in EGU emissions due to end-use energy efficiency.
State reduction goals, expressed in pounds of carbon dioxide per net megawatt-hour of useful
energy, vary dramatically depending on the particular state’s opportunities relative to the building
blocks. Figure 23 shows the proposed final reduction goals for each state for 2030 and beyond.
Minnesota’s goal is 873 lbs/MWh. For perspective, the new source performance standards proposed
earlier by the EPA for new power plants range from 1,000 to 1,100 lbs/MWh of CO2, depending on
power plant size – a range set based on emissions from natural gas combined-cycle plants
generating only power.
The EPA has proposed to include thermal energy as well as electric energy produced in CHP plants in
calculating useful energy to meet state goals for 2030. The agency has proposed crediting 75
percent of CHP thermal output. This regulatory recognition of thermal energy recovery via CHP is an
important and very sound step, and is consistent with the approach taken in the new source
performance standards for new power plants.
Although state goals are based on the four building blocks, state plans need not be restricted to
those categories. States are free to employ a wide range of strategies to reduce emissions. In its
proposed rule, the EPA specifically asks for comment on the role of CHP in meeting emission
reduction goals.
Figure 23. Proposed State Goals for Carbon Dioxide Emissions Reduction by 2030, Clean Power
Plan
Source: FVB Energy analysis using data from “Carbon Pollution Emission Guidelines for Existing Stationary
Sources: Electric Utility Generating Units,” Federal Register, Vol. 79, No. 117; June 18, 2014.
0
200
400
600
800
1000
1200
1400
1600
1800
2000
Was
hin
gto
n
Idah
o
Ore
gon
Mai
ne
New
Ham
psh
ire
New
Jer
sey
Cal
ifo
rnia
Co
nn
ecti
cut
New
Yo
rk
Mas
sach
use
tts
Nev
ada
Mis
siss
ipp
i
Ari
zon
a
Flo
rid
a
So
uth
Dak
ota
So
uth
Car
olin
a
Rh
od
e Is
lan
d
Tex
as
Vir
gin
ia
Geo
rgia
Del
awar
e
Min
nes
ota
Lo
uis
ian
a
Okl
aho
ma
Ark
ansa
s
No
rth
Car
olin
a
Ala
ska
New
Mex
ico
Pen
nsy
lvan
ia
Ala
bam
a
Co
lora
do
Mic
hig
an
Ten
nes
see
Mar
ylan
d
Wis
con
sin
Illin
ois
Iow
a
Haw
aii
Uta
h
Oh
io
Neb
rask
a
Kan
sas
Ind
ian
a
Mis
sou
ri
Wes
t V
irgi
nia
Wyo
min
g
Ken
tuck
y
Mo
nta
na
No
rth
Dak
ota
Po
un
ds
CO
2 p
er
net
MW
h

113 | P a g e COMM-20130522-67922 | July 2014
CHP could be a powerful tool for Minnesota in meeting emission reduction goals and should be
considered as Minnesota crafts its compliance plan. Minnesota could achieve emission reductions
by recovering waste heat in existing power plants or by implementing highly efficient new CHP
production, allowing reductions in high-emissions power generation in affected power plants.
It will not be cost-effective to recover waste heat from every affected power plant, but some plants
could be retrofitted for CHP, which would improve the plant heat rate and reduce total CO2
emissions. Heat can be effectively transported long distances with current hot water district heating
piping technology.
Even greater potential exists to reduce power plant emissions by constructing new CHP plants to
supply heat and power to industry and buildings. District energy systems can play a crucial role in
implementing new CHP plants. These systems pool the thermal users to accommodate larger, more
cost-effective CHP units. Economies of scale make it more cost-effective to install CHP in sizes above
5 MW, which is why district energy systems are critical to increased CHP implementation.
Widespread district energy use is the reason that countries like Denmark and Finland have high
levels of CHP.
Construction of new CHP plants will result in avoidance of emissions from affected EGUs by
substituting CHP power for generation from those units, whether the CHP power is delivered to the
grid or allows a reduction in purchases from the grid. CHP can deliver significant CO2 reductions, as
shown in Figure 17, which compares CHP and power-only plants relative to CO2 emissions per unit of
useful energy. The CHP emissions were calculated by dividing the CO2 emissions of the CHP plant by
the sum of the electricity output and 75 percent of the thermal output.
Figure 24. Comparison of Carbon Dioxide Emissions From Power-Only and CHP Plants
Source: FVB Energy analysis
-
500
1,000
1,500
2,000
2,500
Coal Natural GasCombined Cycle
NG Engine 5MWe
NG Turbine 10MWe
NGCC CHP 40MWe
Existing Power-only Plants New CHP
Lbs.
CO
2 p
er
MW
h U
sefu
l En
erg
y

114 | P a g e COMM-20130522-67922 | July 2014
This page intentionally left blank.

115 | P a g e COMM-20130522-67922 | July 2014
Appendix C: Straw Man Options for Minnesota CHP Policy

i
222 South Ninth Street
Minneapolis MN, 55402
Phone 612-338-4489
www.fvbenergy.com
Straw Man Options for
Minnesota CHP Policies
Summary Document Derived from Work in Progress on
Minnesota CHP Regulatory Issues and Policies Evaluation
June 20, 2014

Table of Contents 1. Executive Summary .............................................................................................................................. 1
2. Introduction ........................................................................................................................................... 4
3. Why CHP is Important .......................................................................................................................... 4
4. Key Challenges Constraining Increased Use of CHP ........................................................................... 5
Spark Spread ............................................................................................................................................. 5
Market for Excess Power .......................................................................................................................... 7
Cost of Capital and Internal Investment Priorities .................................................................................... 7
Economic Uncertainty .............................................................................................................................. 9
Interconnection Standards ......................................................................................................................... 9
Standby Rates............................................................................................................................................ 9
Recognition of Resiliency Benefits......................................................................................................... 11
Recognition of Other Grid Benefits ........................................................................................................ 12
Utility Value Proposition ........................................................................................................................ 12
Lack of Expertise .................................................................................................................................... 13
Air Quality and Other Permitting............................................................................................................ 13
5. Comparative Economic Significance of Major Barriers ..................................................................... 14
CHP Capital Amortization Costs ............................................................................................................ 16
CHP Fuel Cost ........................................................................................................................................ 16
CHP Non-Fuel O&M Cost ...................................................................................................................... 16
Avoided Cost of Purchased Electricity ................................................................................................... 16
Avoided Cost of Boiler Fuel ................................................................................................................... 16
Export Power Revenue ........................................................................................................................... 16
6. Current Minnesota Policies and Programs .......................................................................................... 17
Energy and Environmental Goals ........................................................................................................... 17
Minnesota Renewable Portfolio Standards ............................................................................................. 17
Conservation Improvement Program (Energy Efficiency Resource Standard) ...................................... 17
Statutory Requirements ....................................................................................................................... 17
Program Results .................................................................................................................................. 18
Role of CHP in CIP ............................................................................................................................. 19
Cost Allocation for Cogeneration Plants ................................................................................................ 20
7. Straw Man Options for Minnesota Policies ........................................................................................ 21
Description of Options ............................................................................................................................ 21
Key Issues -- Conservation Improvement Program ................................................................................ 24
Calculating CIP Credit ........................................................................................................................ 24
ii

iii
Demand Side or Supply Side .......................................................................................................... 24
Crediting CHP in Electric Utility CIP ............................................................................................. 27
Crediting CHP in Natural Gas Utility CIP ...................................................................................... 31
Separate Tiers .................................................................................................................................. 31
Minimum Efficiency Standards ...................................................................................................... 31
Utility Ownership of CHP............................................................................................................... 31
Financial Incentives for Non-Utility CHP Investments .................................................................. 33
CHP Credit Trading ........................................................................................................................ 34
8. Potential Impacts ................................................................................................................................. 34
Utility Portfolios and Ratepayers ........................................................................................................ 34
Fuel Switching .................................................................................................................................... 34
9. Stakeholder Feedback Sought ............................................................................................................. 36
References ................................................................................................................................................... 37
Tables Table 4-1. Minnesota Natural Gas and Electricity Prices Compared with U.S. Average Prices (2011) ..... 6 Table 4-2. Avoided Rates of Minnesota IOUs ........................................................................................... 10 Table 4-3. Standby Rate Policy Recommendations from UIC Study ........................................................ 11 Table 5-1. CHP Technologies Analyzed in the FVB Study....................................................................... 14 Table 5-2. Basic Elements in CHP Financial Viability Equation ............................................................... 15 Table 6-1. Total Electric CIP Savings and Expenditures by Year, 2006-2011 ........................................... 18 Table 6-2. Total Natural Gas CIP Savings and Expenditures by Year, 2006-2011 .................................... 18 Table 7-1. Assumed Characteristics of Offset Grid Electricity .................................................................. 24 Table 7-2. Parameters for CHP Crediting Calculations ............................................................................. 28 Table 7-3. Formulas for CHP Crediting Methods ...................................................................................... 28 Table 7-4. NRDC/OEC Tiers ...................................................................................................................... 29 Table 7-5. Conversion of NRDC/OEC Tiers to Higher Heating Value ...................................................... 29 Table 8-1. Cost Tests for Analysis of Policy Options ................................................................................ 35
Figures Figure 3-1. Efficiency of Non-Transportation Energy Consumption in Minnesota .................................... 5 Figure 4-1. Average Retail Electricity Rates by State ................................................................................. 6 Figure 4-2. Relationship Between Weighted Average Cost of Capital (WACC) and Simple Payback (SP)
and Capital Recovery Factor (CRF).............................................................................................................. 8 Figure 7-1. Net Change in Customer Natural Gas Use as % of Offset Boiler Fuel Use ............................ 25 Figure 7-2. Net Change in Customer and Electric Utility Natural Gas Use as % of Offset Boiler Fuel Use
.................................................................................................................................................................... 25 Figure 7-3. Credited CHP Power Generation as a Percentage of Total CHP Power Generation for 12
Technologies Under 4 Calculation Methods ............................................................................................... 30
1
1. Executive Summary
This document was prepared to elicit stakeholder comments on draft “Straw Man” options emerging from
a study being undertaken for the Minnesota Department of Commerce. That study (“Minnesota CHP
Regulatory Issues and Policies Evaluation”) is assessing alternative approaches and developing
recommendations for potential changes in Minnesota policies and programs for including CHP. This
document incorporates data and material from that study but much of the ultimate final report has been
omitted to focus this document on the evaluation of Straw Man policy options. A related study
(“Minnesota CHP Potential Study”) is also being undertaken to help inform potential quantitative goals
for CHP growth.
Comment is sought on the following key “Straw Man” options, which are described briefly below and
summarized in the subsequent table.
1. Natural Gas CIP – Natural gas utilities would have CHP goals
1.1. Low CHP goal with capital incentive for CHP implemented by customers (or third parties on
behalf of customers)
1.2. Low CHP goal with 15-year operating incentive for CHP implemented by customers (or third
parties on behalf of customers)
1.3. Medium CHP goal with both capital and operating incentives
2. Electric and Natural Gas CIP – Both electric and natural gas utilities would have CHP goals
2.1. Low CHP goal with capital incentives for CHP implemented by customers (or third parties on
behalf of customers)
2.2. Low CHP goal with 15-year operating incentives for CHP implemented by customers (or third
parties on behalf of customers)
2.3. Medium CHP goal with both capital and operating incentives
Customers would have the option of applying for either electric utility or natural gas utility
incentives, but could not receive both.
3. Utility Investments in CHP – In addition to the customer incentives under Option 2, utilities
would be encouraged to invest in CHP as ratebase investments and be credited in the CIP
program based on CHP output
3.1. Medium CHP goal with capital incentives for CHP implemented by customers (or third parties
on behalf of customers)
3.2. Medium CHP goal with 15-year operating incentives for CHP implemented by customers (or
third parties on behalf of customers)
3.3. High CHP goal with both capital and operating incentives
A system of tradable credits would be created to promote economic efficiency within the CHP tiers of
the CIP program.
Electric and gas utilities would be allowed and encouraged to cooperate to implement CHP projects,
with the CIP credit split based on the total financial contribution made by each utility.
4. Renewable Energy Standard – Expand the Renewable Energy Standard (RES) to include a
specific goal within the RES for currently eligible renewable CHP technologies

2
4.1. Consistent with current law, include only renewable CHP.
4.2. Incorporate additional provisions for RES credit to encourage use of biomass for thermal energy
production without power production in areas of the state without access to natural gas service.
5. Alternative Portfolio Standard – Establish a new portfolio standard similar to the RES that
would provide requirements for non-renewable or renewable CHP
5.1. Low APS goals
5.2. High APS goals
6. Integrated Resource Planning – Require electric utilities to demonstrate that, before power-
only capacity is proposed, CHP opportunities within their service territory have been
thoroughly assessed to determine the benefits of CHP relative to total primary energy
efficiency, GHG emissions, power grid resiliency, peak demand management and risk
management, with the following options for assumed GHG value per metric tonne CO2
equivalent
6.1. $25
6.2. $50
Stakeholder feedback is sought on any aspect of these draft options. In particular, we pose the
following questions:
1. Which options will be most effective in encouraging CHP? Why?
2. Which options will be least effective? Why?
3. What concerns do you have regarding each option, relative to:
3.1. Consistency with current statutes?
3.2. Administrative practicality?
3.3. Unintended impacts on other efficiency efforts?
3.4. Other concerns?
4. How could the concerns you raise be mitigated?
5. Are the incentive levels appropriate?
6. Are the calculation methodologies discussed in this paper appropriate? If not, why not? What
changes would you suggest?
7. Do the low, medium and high draft goals for CHP in the CIP present a reasonable range of goals?
8. Do the low and high APS goals present a reasonable range of goals?
Feedback can be provided to Mark Spurr at [email protected].

3
Option ---> 1 2 3 5 6
Sub-Option ---> 1.1 1.2 1.3 2.1 2.2 2.3 3.1 3.2 3.3 4 5.1 5.2 6.1 6.2
Conservation Improvement
Program
Separate new CHP goals in CIP (% of
sales)
CIP
Low
CIP
Low
CIP
Med
CIP
Low
CIP
Low
CIP
Med
CIP
Med
CIP
Med
CIP
High
Natural Gas 0.10% 0.10% 0.15% 0.10% 0.10% 0.15% 0.15% 0.15% 0.23%
Electric IOUs 0.20% 0.20% 0.30% 0.30% 0.30% 0.45%
Elec Coops/Munis 0.10% 0.10% 0.15% 0.15% 0.15% 0.23%
Customer incentives from Utility (include
as CIP expenditures)
Natural Gas Utilities
Capital incentive $/1000 Btu-hr 100$ $ 100 $ 100 $ 100 $ 100 $ 100
Operating gas rate discount ($/MMBtu
over 15 years)$0.93 0.93$ $ 0.93 $ 0.93 $ 0.93 $ 0.93
Electric Utilities
Capital incentive ($/kW) 500$ $ 500 $ 500 $ 500
Operating credit ($/MWh over 15 years) 12.74$ $12.74 $12.74 $12.74
CIP Credits to Utilities for Utility-Owned
CHP
Natural Gas Utilities
CIP credit ($/MMBtu over 15 years) 0.93$ $ 0.93
Electric Utilities
CIP credit ($/MWH over 15 years) $12.74 $12.74
Renewable Portfolio Standard
Additional CHP (Renewable Only) Tier in
Expanded RPS (% of sales)
By 2020
Electric IOUs 0.25%
Elec Coops/Munis 0.17%
By 2030
Electric IOUs 1.20%
Elec Coops/Munis 0.83%
Alternative Portfolio Standard
CHP goals in new APS (all CHP including
gas-fired) (% of sales)
APS
Low
APS
High
By 2020
Electric IOUs 1.25% 4.00%
Elec Coops/Munis 0.85% 2.75%
By 2030
Electric IOUs 4.00% 13.50%
Elec Coops/Munis 2.75% 9.00%
Integrated Resource Planning
EU IRP requirement to look at CHP first, with
CO2 value per metric tonne:25$ 50$
4
2. Introduction This document was prepared to elicit stakeholder comments on draft “Straw Man” options emerging from
a study being undertaken for the Minnesota Department of Commerce. That study (“Minnesota CHP
Regulatory Issues and Policies Evaluation”) is assessing alternative approaches and developing
recommendations for potential changes in Minnesota policies and programs for including CHP. This
document incorporates data and material from that study but much of the ultimate final report has been
omitted to focus this document on the evaluation of Straw Man policy options.
A related study (“Minnesota CHP Potential Study”) is also being undertaken to help inform potential
quantitative goals for CHP growth.
3. Why CHP is Important Combined heat and power (CHP) systems reduce fossil fuel use and GHG emissions by recovering heat
that is usually wasted as reject heat in power plants for useful purposes (heating buildings, domestic hot
water, industrial process heat, or conversion to cooling energy for air conditioning or industrial cooling
energy).
The electricity sector in Minnesota is only 32% efficiency in converting primary energy to useful
delivered electricity. Most of the losses consist of heat rejected in power plant cooling towers and stacks,
with additional losses occurring in transmission and distribution of power. As illustrated in Figure 3-1, of
the total non-transportation energy use in Minnesota (1,238 trillion Btu or TBtu):
Only 50% if converted to useful energy;
31% is lost in the power sector (mostly as heat); and
19% is lost in the Residential, Commercial & Industrial sectors (RCI) in converting RCI primary
energy or electricity to useful energy services.
In 2008, the total 384 TBtu of wasted energy in the power sector are estimated to consist of 12 TBtu of
electrical line losses and 372 TBtu of waste heat. This power generation waste heat in Minnesota is
nearly equal to the total requirement for heat energy in the RCI sectors (390 quads, assuming 90% of RCI
primary energy is for heat production, and is converted to useful energy at an average efficiency of 70%).
As discussed in section 4, CHP also has the potential to provide a range of benefits relative to grid
resiliency, reduce power line losses and peak power demand management.

5
Figure 3-1. Efficiency of Non-Transportation Energy Consumption in Minnesota
4. Key Challenges Constraining Increased Use of CHP
Spark Spread A fundamental economic test for CHP is “spark spread” – the difference between the value to the
generator of the electricity and thermal energy produced and the cost of the fuel needed to produce that
electricity. In general, higher grid-provided electricity prices and lower natural gas prices make CHP
projects more economic.
The value of the electricity generated may be a weighted average of avoided purchased power and sales
of excess power. Minnesota has relatively low electricity costs, with an average retail (all consumers)
rate lower than the national average, as illustrated in Figure 4-1.
Both natural gas and electricity prices in Minnesota are lower than the national averages for each end use
sector. Table 4-1 shows the comparative Minnesota and USA average prices for natural gas and
electricity for each end use sector and for power generation in 2011. For the commercial and industrial
sectors, natural gas prices are lower than national averages by about the corresponding percentage for
electricity prices by sector.
Spark spread is affected by both the particular CHP technology and sector in which the CHP facility
would be located. The heat rate (BTU’s of fuel required to produce a kWh of electricity) varies among
CHP technologies, with lower heat rates (higher electric generation efficiencies) helping to increase the
spark spread and make the economics of the CHP system more attractive. Industrial power prices are
generally lower, thus reducing the spread. (On the other hand, economies of scale in larger industrial
CHP projects can enhance the economics of CHP compared with smaller commercial sector projects.)
50%
31%
19%
Efficiency of Non-Transportation Energy
Consumption, Minnesota 2008 (total 1,238 quads)
R/C/I useful energy
Power sector wasted
energy (mostly heat)
R/C/I wasted energy
(heat plus inefficiencies
in converting electricity
to useful energy)

6
The spark spread for any given CHP system is one of the basic assessments conducted in a feasibility
assessment. If the spark spread is not significant enough, and the total benefits of generating power onsite
are thus not larger than the cost of fuel required to generate that power, the project will likely not go
further. Tools such as discounts on natural gas or additional revenue streams for excess power production
may improve the spark spreads of CHP systems.
Figure 4-1. Average Retail Electricity Rates by State
Table 4-1. Minnesota Natural Gas and Electricity Prices Compared with U.S. Average Prices (2011)
Source: EIA State Data 2011
0
5
10
15
20
25
Haw
aii
Co
nn
ecti
cut
New
Yo
rkN
ew H
amp
shir
eA
lask
aN
ew J
erse
yM
assa
chu
sett
sR
ho
de
Isla
nd
Dis
tric
t o
f C
olu
mb
iaV
erm
on
tC
alif
orn
iaM
ain
eM
aryl
and
Del
awar
eFl
ori
da
Pen
nsy
lvan
iaM
ich
igan
U.S
. To
tal
Wis
con
sin
Nev
ada
Ari
zon
aTe
xas
Co
lora
do
Oh
ioIll
ino
isA
lab
ama
Geo
rgia
Vir
gin
iaN
ort
h C
aro
lina
Ten
nes
see
Mis
siss
ipp
iSo
uth
Car
olin
aM
inn
eso
taN
ew M
exic
oK
ansa
sM
on
tan
aSo
uth
Dak
ota
Lou
isia
na
Mis
sou
riIn
dia
na
Iow
aO
klah
om
aO
rego
nN
ebra
ska
Wes
t V
irgi
nia
Ark
ansa
sN
ort
h D
ako
taU
tah
Ken
tuck
yW
ash
ingt
on
Idah
oW
yom
ing
Ave
rage
Ret
ail E
lect
rici
ty R
ate
(cen
ts p
er k
Wh
)
Natural Gas
($/MMBtu)
Electricity
(cents/kWh)
MN USAMN %
of USAMN USA
MN %
of USA
Residential 8.76$ 10.78$ 81% 10.97 11.72 94%
Commercial 7.39$ 8.80$ 84% 8.63 10.24 84%
Industrial 5.49$ 5.98$ 92% 6.47 6.83 95%
All End Use 7.10$ 8.23$ 86% 8.68 9.94 87%
Power Generation 5.88$ 4.80$ 123%

7
Market for Excess Power To maximize CHP efficiency it is necessary to size and operate the CHP system to follow the thermal
load of the thermal energy user. However, in many facilities this can result in significant production of
power in excess of the host site’s needs, and the power will only be produced if a suitable buyer for the
power is identified. Consequently, the price to be received for sale of the excess power is often a crucial
factor in the financial feasibility of a CHP project. Unless owned by the electric utility, CHP systems in
Minnesota cannot sell electricity on a retail basis, so the revenue for excess CHP power sales is limited to
the price the electric utility is willing to pay.
Absent an opportunity to sell excess power, the size of a CHP system at a large industrial facility with
high thermal demand will likely be constrained by the onsite power needs. The facility will not be
incentivized to build a CHP system that produces any more power than it needs onsite. This can
effectively reduce the system’s efficiency, because the system will not be properly matched and sized to
the facility’s thermal needs. This scenario leaves very low cost energy efficiency resources “on the table,”
since the system could have been sized larger had a market for excess power been identified.
Cost of Capital and Internal Investment Priorities CHP requires a significant capital investment, and the equipment has a long life – generally over 15 years.
The investment required for CHP will generally come from some combination of debt and equity. Access
to debt capital, and the associated interest rate, will vary significantly from one organization to another.
Further, credit availability will vary depending on broader economic conditions. Access to internal equity
funding is affected by a company’s financial condition and internal competition with other potential
investments. CHP is not regarded as part of most end-users’ core business focus and, as such, is
sometimes subject to a high internal investment “hurdle rate”, i.e. the rate of return a project is required
to meet in order to get capital funding. Another way to express this is that for many organizations the
payback period required to “green light” a CHP project is very short.
Simple payback is a commonly understood measure of financial viability. It is calculated by dividing the
initial capital investment by the annual operating savings.
Another way to quantify investment return thresholds, for private sector businesses, is Return on Equity
(ROE). This is the return to equity investors on a discounted cash flow basis. ROE can’t be compared
directly with simple payback, because typically companies don’t fund 100 percent with equity; instead
they “leverage” the equity return by borrowing some of the funds. The ratio between debt and equity
varies depending on the company and the project. A typical capital structure for the electric utility
industry is 45 percent debt and 55 percent equity (EIA NEMS Model 2013).
The appropriate comparison with simple payback is Weighted Average Cost of Capital (WACC), which
takes into account not only ROE but also the after-tax cost of debt, and is calculated as follows:
Debt interest rate = IR
Return on Equity = ROE
Debt as % of total capital = DR
Corporate tax rate = T
Weighted average cost of capital = [(IR x DR) x (1 – T)] + [ROE x (1 - DR)]
The Capital Recovery Factor (CRF) is calculated as follows, with Y = term of financing in years:

8
CRF = [IR x (1 + IR)^Y] / [(1 + IR)^Y - 1]
The annual average cost of both debt and equity can then be calculated by multiplying initial capital
investment by the CRF.
Figure 4-2 shows the relationship between simple payback , WACC and CRF, assuming a 20-year
amortization period.
Figure 4-2. Relationship Between Weighted Average Cost of Capital (WACC) and Simple Payback (SP) and
Capital Recovery Factor (CRF)
Particularly in industrial companies, competing capital investment demands can make energy efficiency a
relatively low investment priority. A 2003 survey of potential CHP implementers of CHP indicated that
47% required simple paybacks less than 2 years, and only 35% would accept a payback as long as 4
years. A 4-year payback is equal to a WACC of 25 percent.
On the other hand, utilities have longer investment timeframes. For example, Xcel’s ROE was reported
to be 10.26 percent in 2013 (Ycharts). If we estimate that Xcel’s average debt interest rate is 6.0 percent,
0
5
10
15
20
0% 10% 20% 30% 40% 50% 60% 70% 80% 90% 100%
Sim
ple
Pa
yb
ack
(y
ears
)
Weighted Average Cost of Capital
Weighted Average Cost of Capital (WACC) vs. Simple Payback (SP)
B
C
D
E
A
F
WACCSP
(years)CRF
Government bonds A 4.00% 13.6 0.074
Representative utility WACC B 7.34% 10.3 0.097
C 15.78% 6.0 0.167
D 24.70% 4.0 0.250
E 50.00% 2.0 0.500
F 100.00% 1.0 1.000
Representative range of
industrial investment criteria

9
and that the corporate tax rate is 38 percent, the estimated Xcel WACC of 7.34 percent, equivalent to a
simple payback of over 10 years.
Decision-makers at other types of facilities, such as colleges, universities, hospitals, and municipalities,
have an even longer investment horizon and a willingness to accept longer paybacks. For example, 20-
year municipal bonds currently carry interest rates of 3.75 to 4.85 percent. In Figure 4-2 we assume
government bonds carry an interest rate of 4.0 percent, corresponding to a 13.6 year simple payback.
Economic Uncertainty Analysis of the economic feasibility of CHP must be based on assumptions regarding future values of a
wide range of factors, including:
Price of fuel used for CHP;
Prices of fuels otherwise used for heat production, and/or value of heat sold to other users;
Prices of electricity otherwise purchased to meet power requirements;
Prices of electricity sold to the grid or to other users;
Projected growth in requirements for electricity and thermal energy, which in turn is based on
assumptions about future economic conditions;
General economic uncertainty;
Changes in utility regulation; and
Changes in environmental regulations, including criteria air pollutants and greenhouse gases
(GHG).
The uncertainties associated with these variables make decision-making challenging and, coupled with
the other barriers discussed here, tend to discourage investment in CHP. To the extent that the decision
criterion is a very short payback, as discussed above, the economic feasibility analysis is simplified
because in essence it is based only on current values for key economic parameters.
Interconnection Standards The most effective interconnection standards have different tiers with different requirements for CHP
systems of different sizes, reflecting the fact that smaller systems are often less complex technically to
interconnect. Connecting a 25 MW system to the grid might involve significant technical and safety
challenges, and it would not necessarily be appropriate for a 50 kW system to be subject to the same
oversight procedures. Allowing different tiers essentially provides a “fast track” for smaller systems, and
longer, more detailed analysis of the more complex interconnection of larger systems.
Minnesota does not have a tiered interconnection standard for CHP. The Minnesota Public Utilities
Commission has established uniform interconnection standards that apply to all CHP systems up to 10
MW including fossil fuel-fired facilities. Although Minnesota performs better than the average state in
this policy area, Minnesota interconnection standards could be improved by raising the cap on system size
covered by the interconnection standard and implementing a tiered or “fast-track” system for smaller
units.
Standby Rates Most facilities with CHP require service from the local utility for:
Supplementary power when load is greater than the CHP output;
Back-up supply during planned scheduled maintenance of the CHP system; and
Back-up supply in case of unexpected, unscheduled outages of the CHP system.
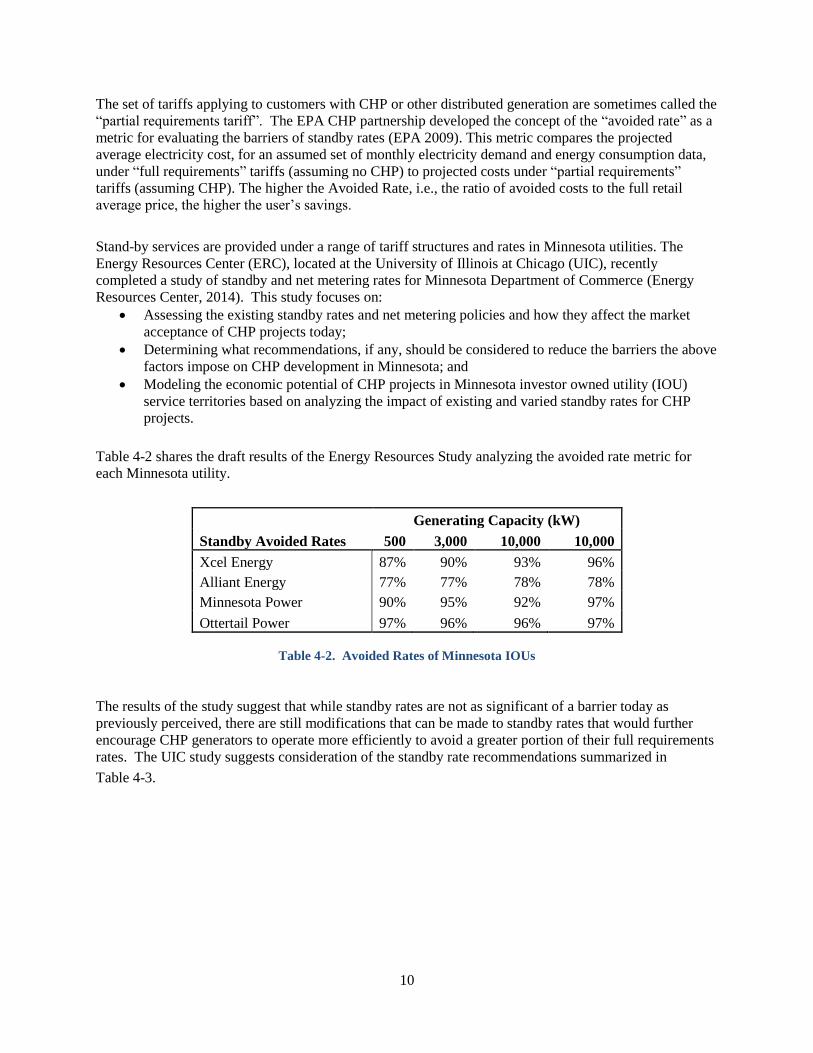
10
The set of tariffs applying to customers with CHP or other distributed generation are sometimes called the
“partial requirements tariff”. The EPA CHP partnership developed the concept of the “avoided rate” as a
metric for evaluating the barriers of standby rates (EPA 2009). This metric compares the projected
average electricity cost, for an assumed set of monthly electricity demand and energy consumption data,
under “full requirements” tariffs (assuming no CHP) to projected costs under “partial requirements”
tariffs (assuming CHP). The higher the Avoided Rate, i.e., the ratio of avoided costs to the full retail
average price, the higher the user’s savings.
Stand-by services are provided under a range of tariff structures and rates in Minnesota utilities. The
Energy Resources Center (ERC), located at the University of Illinois at Chicago (UIC), recently
completed a study of standby and net metering rates for Minnesota Department of Commerce (Energy
Resources Center, 2014). This study focuses on:
Assessing the existing standby rates and net metering policies and how they affect the market
acceptance of CHP projects today;
Determining what recommendations, if any, should be considered to reduce the barriers the above
factors impose on CHP development in Minnesota; and
Modeling the economic potential of CHP projects in Minnesota investor owned utility (IOU)
service territories based on analyzing the impact of existing and varied standby rates for CHP
projects.
Table 4-2 shares the draft results of the Energy Resources Study analyzing the avoided rate metric for
each Minnesota utility.
Generating Capacity (kW)
Standby Avoided Rates 500 3,000 10,000 10,000
Xcel Energy 87% 90% 93% 96%
Alliant Energy 77% 77% 78% 78%
Minnesota Power 90% 95% 92% 97%
Ottertail Power 97% 96% 96% 97%
Table 4-2. Avoided Rates of Minnesota IOUs
The results of the study suggest that while standby rates are not as significant of a barrier today as
previously perceived, there are still modifications that can be made to standby rates that would further
encourage CHP generators to operate more efficiently to avoid a greater portion of their full requirements
rates. The UIC study suggests consideration of the standby rate recommendations summarized in
Table 4-3.
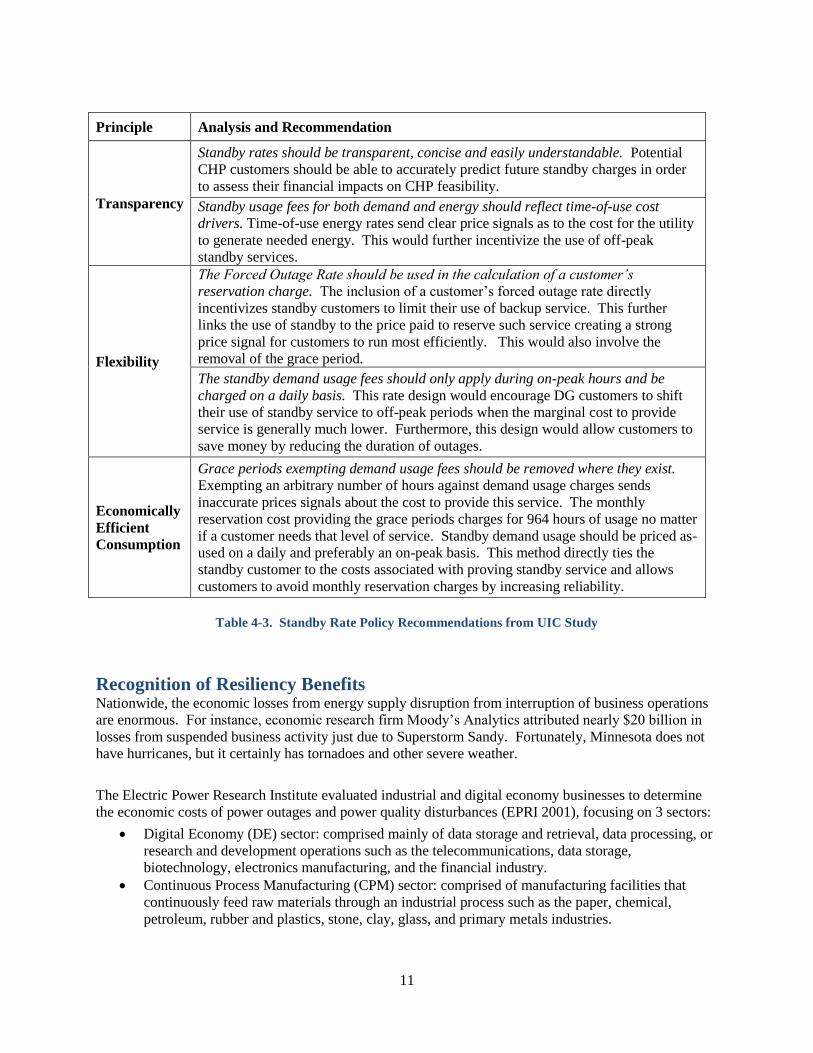
11
Principle Analysis and Recommendation
Transparency
Standby rates should be transparent, concise and easily understandable. Potential
CHP customers should be able to accurately predict future standby charges in order
to assess their financial impacts on CHP feasibility.
Standby usage fees for both demand and energy should reflect time-of-use cost
drivers. Time-of-use energy rates send clear price signals as to the cost for the utility
to generate needed energy. This would further incentivize the use of off-peak
standby services.
Flexibility
The Forced Outage Rate should be used in the calculation of a customer’s
reservation charge. The inclusion of a customer’s forced outage rate directly
incentivizes standby customers to limit their use of backup service. This further
links the use of standby to the price paid to reserve such service creating a strong
price signal for customers to run most efficiently. This would also involve the
removal of the grace period.
The standby demand usage fees should only apply during on-peak hours and be
charged on a daily basis. This rate design would encourage DG customers to shift
their use of standby service to off-peak periods when the marginal cost to provide
service is generally much lower. Furthermore, this design would allow customers to
save money by reducing the duration of outages.
Economically
Efficient
Consumption
Grace periods exempting demand usage fees should be removed where they exist.
Exempting an arbitrary number of hours against demand usage charges sends
inaccurate prices signals about the cost to provide this service. The monthly
reservation cost providing the grace periods charges for 964 hours of usage no matter
if a customer needs that level of service. Standby demand usage should be priced as-
used on a daily and preferably an on-peak basis. This method directly ties the
standby customer to the costs associated with proving standby service and allows
customers to avoid monthly reservation charges by increasing reliability.
Table 4-3. Standby Rate Policy Recommendations from UIC Study
Recognition of Resiliency Benefits Nationwide, the economic losses from energy supply disruption from interruption of business operations
are enormous. For instance, economic research firm Moody’s Analytics attributed nearly $20 billion in
losses from suspended business activity just due to Superstorm Sandy. Fortunately, Minnesota does not
have hurricanes, but it certainly has tornadoes and other severe weather.
The Electric Power Research Institute evaluated industrial and digital economy businesses to determine
the economic costs of power outages and power quality disturbances (EPRI 2001), focusing on 3 sectors:
Digital Economy (DE) sector: comprised mainly of data storage and retrieval, data processing, or
research and development operations such as the telecommunications, data storage,
biotechnology, electronics manufacturing, and the financial industry.
Continuous Process Manufacturing (CPM) sector: comprised of manufacturing facilities that
continuously feed raw materials through an industrial process such as the paper, chemical,
petroleum, rubber and plastics, stone, clay, glass, and primary metals industries.
Fabrication and Essential Services (F&ES) sector: all other manufacturing industries, plus utilities
and transportation facilities, water and wastewater treatment, and gas utilities and pipelines.
Although these three sectors only accounted for 17% of all U.S. businesses, they amounted to 40% of
U.S. GDP. The study found that industrial and digital economy firms are losing about $45.7 billion per
year due to power outages, with an additional $6.7 billion in costs resulted from power quality
disturbances other than outages. The EPRI study concluded that the cost of power outages for all industry
combined is an estimated at $120 to $190 billion per year.
CHP and other local energy sources are inherently more resilient to disruption from natural disasters or
other events that interrupt electric energy supply from complex and interconnected grids. Additionally,
CHP systems can be designed to operate in “island” mode during a grid outage. CHP and district energy
systems have demonstrated that they can keep the power on, keep factories and business running, and
continue to keep people warm in the winter and cool in the summer even when the power grid is down.
These resiliency benefits are typically lacking from most cost-benefit analyses employed by the
individual facilities using CHP and the utilities in whose service territory a CHP system would be
deployed. So while the anecdotal evidence has been clear that CHP can provide highly critical resiliency
and reliability benefits during times of grid power outages, there is no mechanism in which those benefits
are specifically delineated. In contrast, the potential of the CHP system to fail is embedded in every
utility’s standby and backup power rates.
Recognition of Other Grid Benefits CHP systems are typically located much closer to the end user than more traditional centralized power
plants. Additionally, many CHP systems are capable of ramping up to full output very quickly, and can be
more nimble electric system assets than many traditional generation resources. These two aspects of CHP
systems provide numerous benefits to the grid at large. For instance, the close proximity to end-users can
dramatically reduce the losses of power along transmission and distribution lines. On average, line losses
are about 7% (EIA 2012), but research suggests that losses are much higher during times of peak grid
demand (Chittum and Farley 2013).
CHP systems are also well positioned to provide ancillary and capacity services to the grid. Ancillary
services are those that help stabilize grid voltage, and they must be capable of providing these services in
a timely manner – some as quickly as within one minute of the request. Each power market has its own
market for ancillary services, and CHP systems are selling their ancillary services to these markets in
some parts of the country (Chittum and Farley 2013). At present, however, the use of CHP for such
ancillary services is not at all widespread.
Utility Value Proposition Many electric utilities tend to view CHP as an economic threat because traditional utility business models,
and associated regulatory structures, link electricity sales to cost recovery and revenues. A CHP facility
owned by a customer or third party will typically require much less utility-provided electricity than it did
prior to CHP system installation. Further, electric utilities are structured and regulated in a manner that
often discourages them from fully monetizing the benefits of CHP. Concern about cross-subsidization
may lead state regulators to discourage electric utilities from implementing or encouraging CHP systems.
12
13
On the other hand, utilities are used to making long-term investments, and as discussed above have a
relatively low cost of capital. CHP can offer tremendous direct and indirect benefits to utilities. Most of
these benefits are not fully valued today. These include:
The additional economic value of a second revenue stream for CHP thermal output;
The speed with which CHP can be deployed relative to other generation and transmission
resources;
CHP’s potential to reduce infrastructure investments and line losses associated with transmission
and distribution lines;
The potential for reduced emissions compliance costs;
CHP’s ability to function as a capacity resource; and
CHP’s potential for helping balance system power fluctuations and providing ancillary services.
Unfortunately, utilities are generally unable to take advantage of these benefits. Changes in policies and
regulations would enable utilities to better monetize these benefits, increasing the likelihood that utilities
could begin to view CHP systems as true economic opportunities rather than threats.
Lack of Expertise Potential adopters of CHP may lack the information and expertise to:
Identify and assess the costs and benefits of CHP;
Develop a CHP project, including navigation of the institutional, technical, legal and financial
issues associated with these projects; and
Operate and maintain a CHP system.
These barriers can be overcome through the participation of third party CHP developers and operators,
but some organizations are reluctant to take on such a third party relationship, reducing the amount of
CHP deployed.
Air Quality and Other Permitting CHP may increase emissions on-site while reducing emissions regionally. The U.S. Environmental
Protection Agency (EPA) has increasingly recognized the total emissions benefits of CHP in its
rulemaking. In recently proposed rules for greenhouse gas emissions from new power plants (EPA
Proposed 111 (b) Rule), EPA has proposed that the rules would not apply to:
facilities with design heat input less than 250 MMBtu/hr;
facilities that supply less than 219,000 MWh of net electric generation to the utility
distribution system; and
facilities that supply less than one-third of their potential electric output to the utility
distribution system.
CHP also has the potential to be part of a compliance strategy in meeting new GHG emission rules for
existing power plants in the 111 (d) rules now being finalized by the EPA.
14
5. Comparative Economic Significance of Major Barriers
A range of barriers to increased implementation of CHP are described above. An extensive analysis was
undertaken to assess the relative economic importance of each major element in the CHP financial
feasibility equation in order to inform development of draft recommendations for policies and programs.
That analysis was applied to a wide range of CHP technologies, which are listed in Table 5-1, and will be
presented in the final report. In this Straw Man document we have omitted the analysis for the sake of
brevity.
Table 5-1. CHP Technologies Analyzed in the FVB Study
Category FuelMarket
Sectors
Range
(electric)CHP Technologies
30 kW MT
100 kW ICE
200 kW PAFC
800 kW ICE
250 kW MT x 3
300 kW MCFC x 2
3 MW ICE
3 MW GT
1.5 MW MCFC
5 MW ICE
10 MW GT
G.5 G C, I, DE > 20 MW 40 MW GT
WH.1 WH I < 5 MW 1 MW ORC
B.1 B C, I, DE 1-5 MW 3 MW ST
B.2 B C, I, DE 5-20 MW 10 MW ST
B.3 B C, I, DE > 20 MW 40 MW ST
Abbreviations
Market Sectors Technologies
C = Commercial MT = Microturbine
I = Industrial ICE = Internal combustion engine
DE = District Energy PAFC = phosphoric acid fuel cell
Fuels MCFC = molten carbonate fuel cell
NG = Natural Gas GT = gas turbine
B = Biomass ST = steam turbine
WH = Waste Heat ORC = organic rankine cycle
G.3 G C, I, DE 1-5 MW
G.4 G C, I, DE 5-20 MW
G.1 G C, I 30-500 kW
G.2 G C, I 500-1,000 kW
15
Key elements in the CHP financial viability equation are summarized in Table 5-2. Major factors that
influence each element are summarized, and potential areas for policy action are noted. Each major
element is briefly discussed.
A key factor influencing multiple elements is Capacity Factor, which is the annual output of the CHP
facility compared with output at full capacity over 8,760 hours, and commonly expressed as a percentage.
Capacity factor is a critical variable because a higher capacity factor allows the fixed costs of CHP to be
spread over more units of energy output, thereby increasing economic competitiveness.
Sizing the CHP system to meet the facility's heating load normally results in the highest efficiency,
carbon emission reductions and cost savings. However, in some cases, sizing the system to meet the
heating load would result in more electricity being produced than could be used on site. In these cases, the
system would need to be operated below capacity to avoid producing excess electricity. Consequently,
instead of sizing the CHP facility for optimal efficiency and carbon benefits, the CHP facility may be
undersized to avoid the institutional and regulatory constraints associated with selling excess power.
If a CHP facility was sized and operated at the optimal capacity factor it would have to sell the excess
electricity production. However, in such cases, low market values for excess power generation will
significantly affect CHP economic viability as discussed below.
Table 5-2. Basic Elements in CHP Financial Viability Equation
Element in CHP Finacial
EquationMajor Influencing Factors Potential Policy Measures
Capital amortization costs Capital cost, WACC
Renewable Portfolio Standard, Energy
Efficiency Resource Standard,
Conservation Improvement Program,
Integrated Resource Planning, Grant
and Loan Programs
CHP fuel costsUtility tariff, future trends,
capacity factor
Gas utility fuel discount due to better
load factor
CHP non-fuel O&M costs Based on technology
Avoided cost of purchased
electricity
Utility tariff, future trends,
capacity factor
Favorable standby rates, Feed-In Tariff,
payment for value-added grid benefits,
Integrated Resource Planning
Avoided cost of boiler fuel Utility tariff, future trends
Export power revenuePower purchase agreement,
future trends
Payment for value-added grid benefits,
Integrated Resource Planning
Costs
Savings

16
CHP Capital Amortization Costs CHP capital costs vary significantly depending on the size and type of CHP technology. From a policy
perspective, the capital factor of greatest significance is the WACC, which has a dramatic impact on the
financial viability of CHP projects. Of all of the key variables, WACC stands out as a powerful influence
on CHP viability. Low WACC can catalyze a broad range of CHP technologies. Given that electric and
gas utilities have relatively low WACCs, a high priority should be placed on determining how low-cost
utility capital can be directed toward CHP.
CHP Fuel Cost CHP fuel cost is a significant variable with complex impacts on CHP financial viability. Most CHP
installations would use natural gas fuel, so higher natural gas prices would increase the annual cost of
CHP but would also increase the value of offset thermal boiler production since natural gas would in most
cases be the offset boiler fuel. Higher natural gas prices will also tend to drive up electricity prices since
power is increasingly generated with natural gas. The impact of the CHP fuel price is highly dependent
on particular CHP application, and generally cannot be influenced by State CHP policies, with the
potential exception of allowing or encouraging discounted CHP fuel prices to reflect high gas supply load
factor.
CHP Non-Fuel O&M Cost Non-fuel operation and maintenance (O&M) costs are highly technology-specific. There are no practical
policy mechanisms that address this cost variable.
Avoided Cost of Purchased Electricity The avoided cost of offset electricity purchases is dependent on the particular electricity utility tariff and
the operating pattern and capacity factor of the CHP facility. This variable could be influenced by policies
on standby rates, feed-in tariffs or other payments per unit of CHP electricity produced, or recognition of
CHP in Integrated Resource Planning assessments. Based on the study currently being finalized by the
Energy Resources Center, standby rates are not a significant barrier in most utility service areas, but some
improvements have been recommended.
Avoided Cost of Boiler Fuel This variable is influenced by the natural gas tariff and or other contractual arrangement for fuel, and
cannot be influenced by State Policy.
Export Power Revenue To the extent that policy-makers desire to achieve high gains in efficiency and carbon reduction through
CHP, it is important to address the value of excess CHP power generation. As noted above, low values
for excess power sales often lead to CHP configurations that are sub-optimal from the standpoint of
energy and environmental benefit.
Further, from a policy perspective, it is worthwhile examining the potential for CHP generation to be
given additional value in recognition of value-added services that are not currently priced in the
marketplace, such as locational value (reduced transmission/distribution losses) and voltage support.
Recognition of these benefits, as well as potential energy supply resiliency benefits of CHP, could help
stimulate increased implementation of CHP.
17
6. Current Minnesota Policies and Programs
Energy and Environmental Goals The State of Minnesota has established specific goals relating to:
fossil fuel consumption per capita;
renewable energy use;
GHG reduction; and
energy savings by electric and natural gas utilities.
The Next Generation Energy Act, passed in 2007, established the following goals:
15 percent reduction in per capita use of fossil fuel by the year 2015 (Minn. Statutes 216C.05
Subd. 2);
25 percent of the total energy used in the state from renewable energy resources by the year 2025
(Minn. Statute 216C.05 Subd. 2); and
GHG reduction goals as follows --
15 percent reduction from 2005 levels by 2015,
30 percent reduction by 2025, and
80 percent reduction by 2050.
In addition, the Next Generation Energy Act prohibits the construction of any power plants that would
produce a net increase in carbon emissions after Aug. 1, 2009. The law states that unless "a
comprehensive state law or rule … that directly limits and substantially reduces greenhouse gas
emissions" is enacted and is in effect by that date:
no large fossil fuel-fired power plant can be built in Minnesota;
no utility can import electricity from a large fossil fuel-fired power plant built in another state that
was not operating on Jan. 1, 2007; and
no Minnesota utility can purchase electricity from an outstate utility under a contract that exceeds
50 megawatts for a term of five years.
Minnesota Renewable Portfolio Standards The 2007 legislation also created an RPS for Xcel Energy, created a separate RPS for other electric
utilities,1 and modified the state's existing non-mandated renewable-energy objective. In 2013, further
legislation (H.F 729) was enacted to create a 1.5% solar standard for public utilities, a distributed
generation carve-out, and a solar goal for the state. CHP that is powered by renewable fuels such as
biomass or landfill gas is an eligible technology, but natural gas CHP is not.
Conservation Improvement Program (Energy Efficiency Resource Standard)
Statutory Requirements The Next Generation Energy Act (NGEA) established an annual energy savings goal of 1.5 percent of
average retail sales for each electric and gas utility beginning in 2010. Legislation passed in 2009
established an interim savings goal of 0.75 percent over 2010-2012 for qualifying natural gas utilities.
1 Other electric utilities that must comply with Minnesota's RPS are: public utilities providing electric service;
generation and transmission cooperative electric associations; municipal power agencies; and power districts
operating in the state.
18
Utilities must file their CIP plans with the energy division at least every three years. Utilities report their
actual CIP spending and savings achieved on an annual basis.
Certain large facilities may petition to have their revenues excluded from calculations determining
investment and expenditure requirements (Minnesota Statutes 216B.241, Subd. 1a.). The petition must
include a discussion of the competitive or economic pressures facing the owner of the facility and the
efforts taken by the owner to identify, evaluate and implement energy efficiency improvements.
Program Results The Department of Commerce must provide reports on the annual energy savings achieved through the
CIPs. Data from that report are summarized in Table 6-1 and Table 6-2.
Incremental
Savings
(GWh/year)
Expenditures
($ million)
Incremental
CO2 Savings
(tons/year)
$/MWH *
2006 412 82.2$ 375,537 13.31$
2007 468 91.2$ 426,646 13.00$
2008 597 102.0$ 544,428 11.39$
2009 669 144.9$ 609,905 14.44$
2010 826 174.3$ 753,260 14.07$
2011 965 140.6$ 879,936 9.71$
Average last 3 years 12.74$
* The cost per unit of savings were calculated using a typical weighted average
energy efficiency measure lifetime of 15 years.
Incremental
Savings
(BCF/year)
Expenditures
($ million)
Incremental
CO2 Savings
(tons/year)
$/MMBtu *
2006 2.1 16.3$ 126,750 $0.52
2007 1.9 16.4$ 115,987 $0.57
2008 1.6 18.1$ 94,592 $0.77
2009 1.8 22.8$ 111,522 $0.82
2010 2.6 38.0$ 158,039 $0.97
2011 2.8 41.5$ 170,001 $0.99
Average last 3 years $0.93
* The cost per unit of savings were calculated using a typical weighted average
energy efficiency measure lifetime of 15 years.
Table 6-2. Total Natural Gas CIP Savings and Expenditures by Year, 2006-2011 Table 6-1. Total Electric CIP Savings and Expenditures by Year, 2006-2011
19
The electric utility sector as a whole met the 1.5% savings goal in 2010, and investor-owned utilities
nearly met the goal, as summarized in Table 6-1. The natural gas utility sector as a whole met the
reduced goal of 0.75% approved by the legislature as described above.
Role of CHP in CIP H.F.729, passed in 2013, modified the definition of “energy conservation improvement” in Minnesota
Statutes 2012, section 216B.241 to include “waste heat recovered and used as thermal energy," which is
then defined as “capturing heat energy that would otherwise be exhausted or dissipated to the
environment from machinery, buildings, or industrial processes and productively using such recovered
thermal energy where it was captured or distributing it as thermal energy to other locations where it is
used to reduce demand side consumption of natural gas, electric energy, or both.”
H.F. 729 also includes Subd. 10 as follows:
‘(Waste heat recovery; thermal energy distribution). Demand side natural gas or electric energy
displaced by use of waste heat recovered and used as thermal energy, including the recovered
thermal energy from a cogeneration or combined heat and power facility, is eligible to be
counted towards a utility's natural gas or electric energy savings goals, subject to department
approval.’
There is a reasonable case, as presented below, to conclude that Minnesota Statute 216B.241, as modified
by H.F.729, includes CHP as an energy conservation measure that could be incorporated into natural gas
or electric utility Conservation Improvement Programs.
1. Prior to H.F. 729, CHP bottoming cycles2 were already included in Minnesota Statute 216B.241Subd.
1 (“Energy conservation improvement may include waste heat that is recovered and converted into
electricity…). Although H.F. 729 modified the wording slightly, the content was already there.
2. CHP topping cycles3 were added in H.F.729. Article 13, Section 2, Subd. 1, part (e) clearly states
“Energy conservation improvement also includes waste heat recovered and used as thermal energy.”
The definition of “waste heat recovered and used as thermal energy” in Subd. 1, part (n) describes
topping cycle CHP, although the phrasing is unconventional. CHP does indeed capture heat energy
for useful purposes that would otherwise be exhausted or dissipated to the environment from
buildings or industrial processes.
3. One could debate whether there might be an implied condition or caveat, e.g. “….from ‘normal’ or
‘basic’ building systems or industrial processes. However, it is clear that if, for example, a building
installs an internal combustion engine to generate power and it recovers and uses the waste heat:
Such an installation is CHP; and
It meets the definition of “waste heat recovered and used as thermal energy”.
4. Subd. 10 clarifies that demand side natural gas or electricity savings can be counted toward a utility’s
natural gas or electricity reduction goal. Some people believe that this means such savings can be
counted toward the utility’s goal but that CIP funds should not be expended on such projects. This
position doesn’t make policy sense – why would the state give “credit” to a utility for something that
utility did nothing to implement? Besides, the rationale articulated in point 2 above would make CHP
2 A bottoming cycle converts waste heat to electricity through, for example, organic rankine cycle technology.
3 A topping cycle recovers waste heat from electricity generation for use as thermal energy.

20
an “energy conservation measure” and in Minnesota Statutes 216B.241, utilities can invest in energy
conservation measures.
5. The law lacks clarity regarding how electric utilities should count the energy savings. While the
construction of Subd. 10 suggests a (logical) parallel – reduced demand side natural gas or electric
energy can be counted by the respective utility type (natural gas or electric), the logic breaks down
when we come to in the phrase “natural gas or electricity displaced by the use of waste heat recovered
and used as thermal energy… (Emphasis added.)
Certainly, recovery and use of waste heat will displace boiler fuel consumption to produce the
heat required by the end user, and in most cases that fuel would be natural gas (although in
some instances it could be residual fuel oil, distillate fuel oil, propane or other fuel). Thus,
relative to natural gas utilities it seems pretty clear how to count the savings.
Technically, an electric utility could displace electricity consumption through recovery and
distribution of waste heat. Practically, however, this is not a realistic scenario. The majority
of the CHP potential is in industry, where electricity is not an economical or practical energy
source for heating. In institutional or commercial settings, conversion from electric heating
to CHP heat requires investment in entirely new hydronic piping systems, making such
conversions uneconomical.
6. Based on the reasoning articulated in point 2, CHP is an energy conservation measure. Relative to
Subd. 10, CHP will reduce demand side consumption of boiler fuel, usually natural gas, in the process
of generating electricity. CHP would reduce demand side electric energy, in the process of generating
thermal energy, because the CHP host would displace electricity purchased from the utility with
electricity generated through CHP.
7. Methodological questions remain regarding the appropriate calculation of savings in either situation
(fuel savings when power generation is considered the base activity, and electricity savings when
thermal production is considered the base activity), but these are solvable questions of
implementation.
8. Conclusion: There is a reasonable argument that, in sum, Minnesota Statutes 216B.241 as modified
by H.F.729 includes CHP as an energy conservation measure, and that either natural gas or electric
utilities could invest in CHP and count the respective natural gas or electricity consumption
reductions in their CIP.
Cost Allocation for Cogeneration Plants Subd. 3 of Section 216B.166 establishes the following cost allocation principles:
“The methods used to allocate or assign costs between electrical and thermal energy produced by
cogeneration power plants owned by public utilities shall be consistent with the following principles:
(a) The method used shall result in a cost per unit of electricity which is no greater than the cost
per unit which would exist if the power plants owned by the public utility had been normally
constructed and operated without cogenerating capability.
(b) Costs which the public utility incurs for the exclusive benefit of the district heating utility,
including but not limited to backup and peaking facilities, shall be assigned to thermal energy
produced by cogeneration.
(c) The methods and procedures may be different for retrofitted than for new cogeneration power
plants.
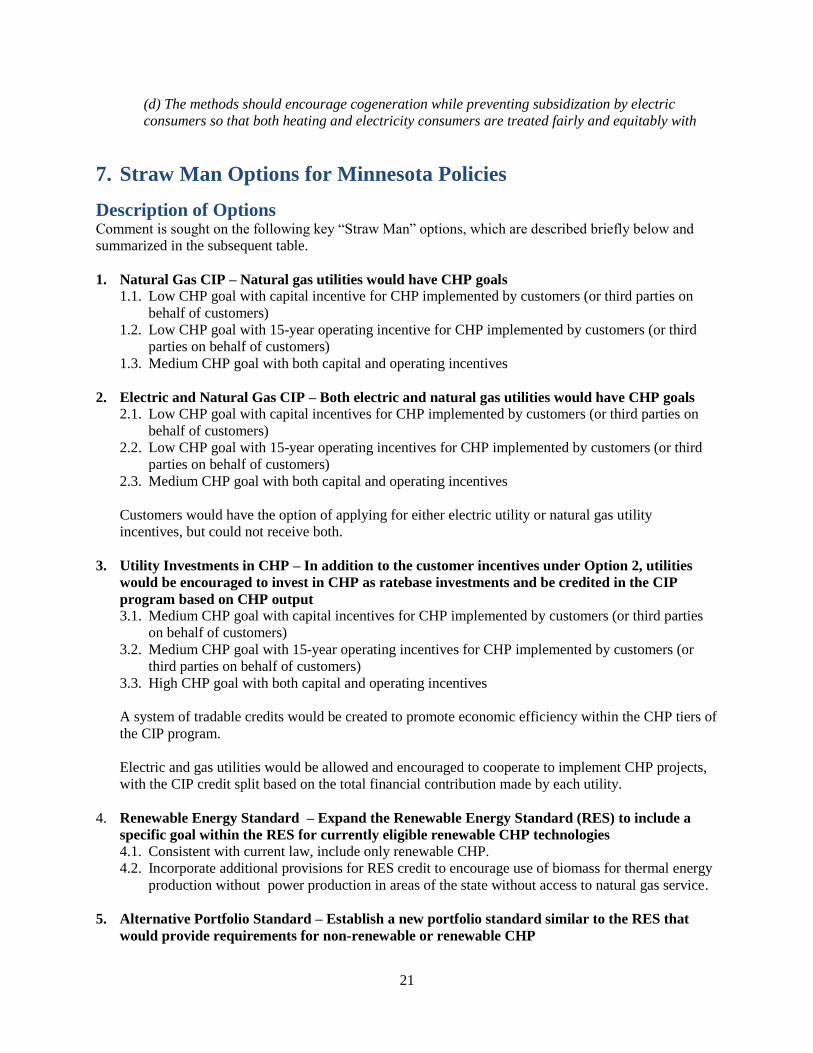
21
(d) The methods should encourage cogeneration while preventing subsidization by electric
consumers so that both heating and electricity consumers are treated fairly and equitably with
7. Straw Man Options for Minnesota Policies
Description of Options Comment is sought on the following key “Straw Man” options, which are described briefly below and
summarized in the subsequent table.
1. Natural Gas CIP – Natural gas utilities would have CHP goals
1.1. Low CHP goal with capital incentive for CHP implemented by customers (or third parties on
behalf of customers)
1.2. Low CHP goal with 15-year operating incentive for CHP implemented by customers (or third
parties on behalf of customers)
1.3. Medium CHP goal with both capital and operating incentives
2. Electric and Natural Gas CIP – Both electric and natural gas utilities would have CHP goals
2.1. Low CHP goal with capital incentives for CHP implemented by customers (or third parties on
behalf of customers)
2.2. Low CHP goal with 15-year operating incentives for CHP implemented by customers (or third
parties on behalf of customers)
2.3. Medium CHP goal with both capital and operating incentives
Customers would have the option of applying for either electric utility or natural gas utility
incentives, but could not receive both.
3. Utility Investments in CHP – In addition to the customer incentives under Option 2, utilities
would be encouraged to invest in CHP as ratebase investments and be credited in the CIP
program based on CHP output
3.1. Medium CHP goal with capital incentives for CHP implemented by customers (or third parties
on behalf of customers)
3.2. Medium CHP goal with 15-year operating incentives for CHP implemented by customers (or
third parties on behalf of customers)
3.3. High CHP goal with both capital and operating incentives
A system of tradable credits would be created to promote economic efficiency within the CHP tiers of
the CIP program.
Electric and gas utilities would be allowed and encouraged to cooperate to implement CHP projects,
with the CIP credit split based on the total financial contribution made by each utility.
4. Renewable Energy Standard – Expand the Renewable Energy Standard (RES) to include a
specific goal within the RES for currently eligible renewable CHP technologies 4.1. Consistent with current law, include only renewable CHP.
4.2. Incorporate additional provisions for RES credit to encourage use of biomass for thermal energy
production without power production in areas of the state without access to natural gas service.
5. Alternative Portfolio Standard – Establish a new portfolio standard similar to the RES that
would provide requirements for non-renewable or renewable CHP

22
5.1. Low APS goals
5.2. High APS goals
6. Integrated Resource Planning – Require electric utilities to demonstrate that, before power-
only capacity is proposed, CHP opportunities within their service territory have been
thoroughly assessed to determine the benefits of CHP relative to total primary energy
efficiency, GHG emissions, power grid resiliency, peak demand management and risk
management, with the following options for assumed GHG value per metric tonne CO2
equivalent
6.1. $25
6.2. $50
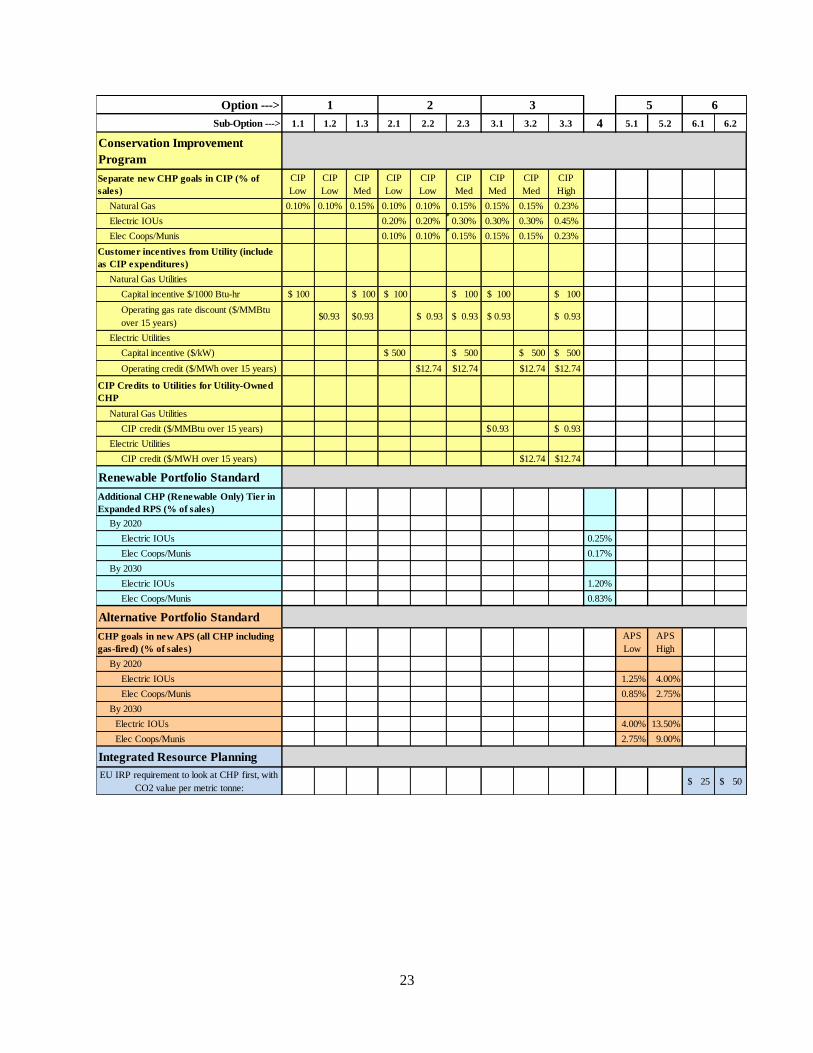
23
Option ---> 1 2 3 5 6
Sub-Option ---> 1.1 1.2 1.3 2.1 2.2 2.3 3.1 3.2 3.3 4 5.1 5.2 6.1 6.2
Conservation Improvement
Program
Separate new CHP goals in CIP (% of
sales)
CIP
Low
CIP
Low
CIP
Med
CIP
Low
CIP
Low
CIP
Med
CIP
Med
CIP
Med
CIP
High
Natural Gas 0.10% 0.10% 0.15% 0.10% 0.10% 0.15% 0.15% 0.15% 0.23%
Electric IOUs 0.20% 0.20% 0.30% 0.30% 0.30% 0.45%
Elec Coops/Munis 0.10% 0.10% 0.15% 0.15% 0.15% 0.23%
Customer incentives from Utility (include
as CIP expenditures)
Natural Gas Utilities
Capital incentive $/1000 Btu-hr 100$ $ 100 $ 100 $ 100 $ 100 $ 100
Operating gas rate discount ($/MMBtu
over 15 years)$0.93 0.93$ $ 0.93 $ 0.93 $ 0.93 $ 0.93
Electric Utilities
Capital incentive ($/kW) 500$ $ 500 $ 500 $ 500
Operating credit ($/MWh over 15 years) 12.74$ $12.74 $12.74 $12.74
CIP Credits to Utilities for Utility-Owned
CHP
Natural Gas Utilities
CIP credit ($/MMBtu over 15 years) 0.93$ $ 0.93
Electric Utilities
CIP credit ($/MWH over 15 years) $12.74 $12.74
Renewable Portfolio Standard
Additional CHP (Renewable Only) Tier in
Expanded RPS (% of sales)
By 2020
Electric IOUs 0.25%
Elec Coops/Munis 0.17%
By 2030
Electric IOUs 1.20%
Elec Coops/Munis 0.83%
Alternative Portfolio Standard
CHP goals in new APS (all CHP including
gas-fired) (% of sales)
APS
Low
APS
High
By 2020
Electric IOUs 1.25% 4.00%
Elec Coops/Munis 0.85% 2.75%
By 2030
Electric IOUs 4.00% 13.50%
Elec Coops/Munis 2.75% 9.00%
Integrated Resource Planning
EU IRP requirement to look at CHP first, with
CO2 value per metric tonne:25$ 50$

24
Key Issues -- Conservation Improvement Program
Calculating CIP Credit
Demand Side or Supply Side
Classification of CHP as a demand-side or supply-side resource is challenging because CHP produces
two forms of energy (electricity and heat), thereby affecting customer demand of both electricity and
boiler fuel. Topping cycle CHP decreases customer consumption of boiler fuel for thermal production, but
this is generally more than offset by the increase in fuel consumed for CHP. Bottoming cycle CHP
decreases customer consumption of electricity, but generally will not decrease customer consumption of
natural gas because the temperature of the thermal output from ORC is usually too low to be usable.
The net impact of various CHP technologies on customer natural gas consumption is illustrated in Figure
7-1, expressed as a percentage of the offset fuel consumption for thermal production (in the analysis we
assumed 80% boiler fuel efficiency). In addition, CHP reduces fuel consumption for power-only plants
operated by the electric utility (EU). In this analysis we assume that the marginal EU generation that
would be offset by CHP is summarized in Table 7-1.
Figure 7-2 shows the combined impact of CHP on customer natural gas use and EU natural gas use,
expressed as a percentage of offset customer natural gas consumption for thermal production.
Table 7-1. Assumed Characteristics of Offset Grid Electricity
Coal Steam
Cycle
Natural Gas
Combined
Cycle
Weighted
Average *
Plant heat rate (Btu/Kwh) 9,357 6,713 8,710
Transmission/Distribution losses 7.5% 7.5% 7.5%
Delivered heat rate (Btu/kWh) 10,116 7,257 9,416
Fuel cost ($/MMBtu) 2.41$ 4.62$ 2.82$
Fuel cost ($/MWH) 24.36$ 33.52$ 26.60$
Non-fuel O&M cost ($/MWH) 9.53$ 5.63$ 8.58$
Total marginal variable cost ($/MWH) 33.89$ 39.15$ 35.18$
Emissions CO2 emissions (Metric ton/MWH) 0.97 0.39 0.83
* Weighting 76% 24% 100%
Eff
icie
ncy
Marg
inal
co
sts

25
Figure 7-1. Net Change in Customer Natural Gas Use as % of Offset Boiler Fuel Use
Figure 7-2. Net Change in Customer and Electric Utility Natural Gas Use as % of Offset Boiler Fuel Use
-150%
-100%
-50%
0%
50%
100%
150%
200%
250%
MT
0.0
65
MT
0.7
50
ICE
0.1
ICE
0.8
ICE
3
ICE
5
GT
3
GT
10
GT
40
ST
LP
3
ST
LP
10
ST
LP
40
ST
HP
3
ST
HP
10
ST
HP
40
OR
C 1
PA
FC
0.2
MC
FC
0.6
MC
FC
1.5
Ch
an
ge
in C
ust
om
er G
as
Use
(%
of
off
set
boil
er f
uel
)
-300%
-200%
-100%
0%
100%
200%
300%
MT
0.0
65
MT
0.7
50
ICE
0.1
ICE
0.8
ICE
3
ICE
5
GT
3
GT
10
GT
40
ST
LP
3
ST
LP
10
ST
LP
40
ST
HP
3
ST
HP
10
ST
HP
40
OR
C 1
PA
FC
0.2
MC
FC
0.6
MC
FC
1.5
% o
f o
ffse
t T
her
ma
l B
oil
er C
on
sum
pti
on
Change in Gas Use
Including offset Utility use
Change in Customer Gas
Use

26
Many people think of “demand-side” as referring to decreases in end-use energy consumption. Natural
gas and electricity are not end-use energy needs. They are a means to an end, and are used to meet end-
use needs as such as space heating, domestic hot water, air conditioning, process heating, process cooling
and a whole range of electrical plug loads including lights, computers, etc. The CIP law does not address
end-use energy consumption, but rather energy supplied to customers to meet end-use energy needs.
Uncertainty about whether CHP is demand-side or supply-side stems from a lack of clarity in Minnesota
Statutes 216B.241 (hereinafter “the CIP law”) relative to definitions, including a lack of clarity relative to
boundaries between utilities, customers and potential third parties. For example:
Minnesota Statutes 216B.241 Subd. 1(e) defines "Energy conservation improvement" as “a
project that results in energy efficiency or energy conservation.”
Minnesota Statutes 216B.241 Subd. 1 (f) defines "Energy efficiency" as “measures or programs,
including energy conservation measures or programs, that target consumer behavior, equipment,
processes, or devices designed to produce either an absolute decrease in consumption of electric
energy or natural gas or a decrease in consumption of electric energy or natural gas on a per unit
of production basis without a reduction in the quality or level of service provided to the energy
consumer.” (Emphasis added.)
The word “consumption” in Subd. 1(f) could refer to end-use needs or to consumption of utility-
supplied electricity. However, we conclude that “consumption” refers to consumption of utility-
supplied electricity because:
Subd. 1(e) states “Energy conservation improvement may include waste heat that is
recovered and converted into electricity.....” This provision allows a new energy supply
(conversion of heat to electricity) to be considered an energy conservation improvement.
Such a scenario does not reduce end-use consumption of electricity, but it does reduce
consumption of grid-supplied electricity.
Subd. 1(e) also states “Energy conservation improvement also includes waste heat
recovered and used as thermal energy.” This provision allows a new end-use energy
supply (recovered waste heat) to be considered an energy conservation improvement.
That supply of recovered waste heat may occur within the boundaries of utility customer
facilities, or it may originate from a third party, such as a district heating provider.
One entity’s demand is another’s supply. The impact of CHP-produced electricity and heat can be
characterized as demand-side or supply-side depending on where the boundaries between “demand” and
“supply” are drawn relative to five types of entities:
Electric utility;
Electric utility customer;
Natural gas utility;
Gas utility customer; and
Third party CHP plant operator that distributes thermal energy to other utility customers.
Extending the boundaries further, the electric utilities and the gas utilities obtain their natural gas supply
from a nationwide gas supply network. This further complicates the distinction between supply and
demand.
On balance, we conclude that the Minnesota CIP law fundamentally approaches “demand” and “supply”
as referring to energy commodities (natural gas or electricity) crossing the boundary between the utility
and the customer, and that CHP can appropriately be viewed as a demand-side resource for both natural
gas and electric utilities. This conclusion is based on the following reasoning:
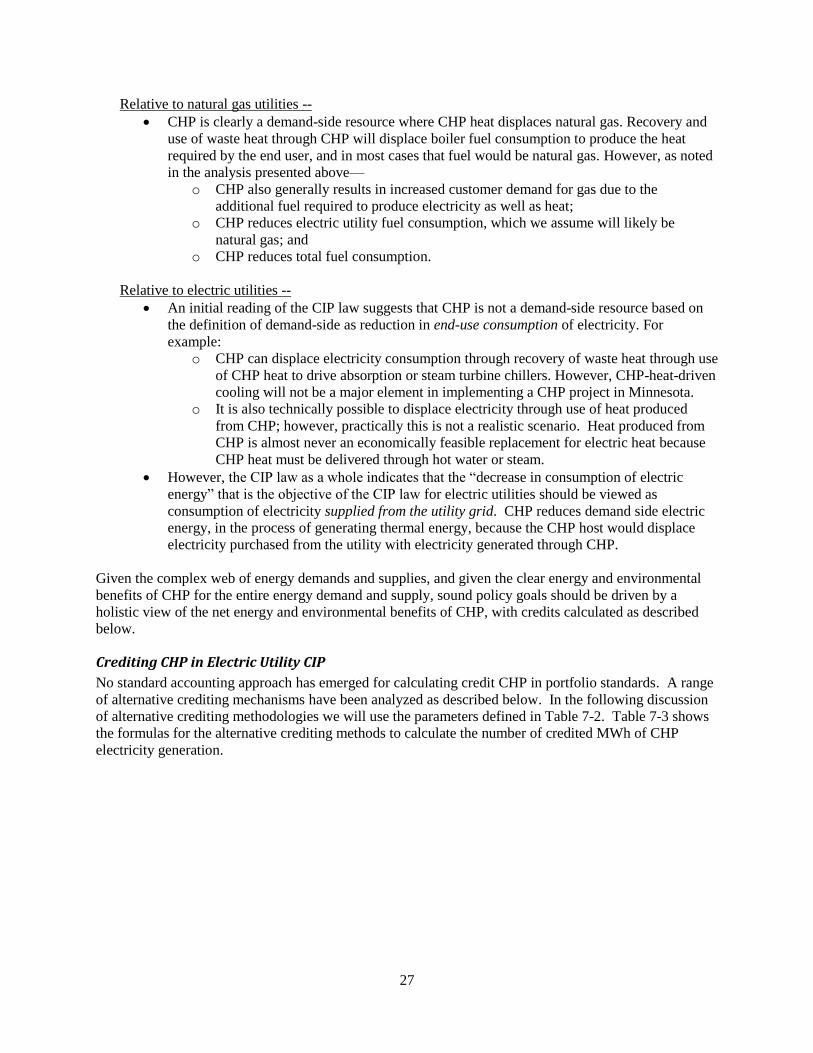
27
Relative to natural gas utilities --
CHP is clearly a demand-side resource where CHP heat displaces natural gas. Recovery and
use of waste heat through CHP will displace boiler fuel consumption to produce the heat
required by the end user, and in most cases that fuel would be natural gas. However, as noted
in the analysis presented above—
o CHP also generally results in increased customer demand for gas due to the
additional fuel required to produce electricity as well as heat;
o CHP reduces electric utility fuel consumption, which we assume will likely be
natural gas; and
o CHP reduces total fuel consumption.
Relative to electric utilities --
An initial reading of the CIP law suggests that CHP is not a demand-side resource based on
the definition of demand-side as reduction in end-use consumption of electricity. For
example:
o CHP can displace electricity consumption through recovery of waste heat through use
of CHP heat to drive absorption or steam turbine chillers. However, CHP-heat-driven
cooling will not be a major element in implementing a CHP project in Minnesota.
o It is also technically possible to displace electricity through use of heat produced
from CHP; however, practically this is not a realistic scenario. Heat produced from
CHP is almost never an economically feasible replacement for electric heat because
CHP heat must be delivered through hot water or steam.
However, the CIP law as a whole indicates that the “decrease in consumption of electric
energy” that is the objective of the CIP law for electric utilities should be viewed as
consumption of electricity supplied from the utility grid. CHP reduces demand side electric
energy, in the process of generating thermal energy, because the CHP host would displace
electricity purchased from the utility with electricity generated through CHP.
Given the complex web of energy demands and supplies, and given the clear energy and environmental
benefits of CHP for the entire energy demand and supply, sound policy goals should be driven by a
holistic view of the net energy and environmental benefits of CHP, with credits calculated as described
below.
Crediting CHP in Electric Utility CIP
No standard accounting approach has emerged for calculating credit CHP in portfolio standards. A range
of alternative crediting mechanisms have been analyzed as described below. In the following discussion
of alternative crediting methodologies we will use the parameters defined in Table 7-2. Table 7-3 shows
the formulas for the alternative crediting methods to calculate the number of credited MWh of CHP
electricity generation.

28
Table 7-2. Parameters for CHP Crediting Calculations
Table 7-3. Formulas for CHP Crediting Methods
The method recommended by the Natural Resources Defense Council (NRDC) and Ohio Environmental
Council (OEC) emphasizes incentivizing maximum efficiency and simplifying implementation
(NRDC/OEC 2012). They recommend a tiered approach as shown in Table 7-4, with efficiency measured
on Lower Heating Value (LHV) basis. Although the NRDC/OEC White Paper indicates that Ohio law
requires a 60% minimum efficiency on an LHV basis, we see no evidence that either LHV or Higher
Heating Value (HHV) is addressed in the law. See “Minimum Efficiency Standards” below for
definitions and discussion of LHV and HHV. The efficiency data used in this report are HHV basis.
Converting the NRDC/OEC tiers to HHV yields the values shown in Table 7-5.
Symbol Units Formula
Heat rate (conventional) HRchp MMBtu/MWhe Fchp / E chp
Marginal heat rate (SWEEP) HRSWchp MMBtu/MWhe (Fchp - Fb) / E chp
Total efficiency EFFchp % Project-specific
Fuel consumption Fchp MMBtu Project-specific
Annual electricity production Echp MWhe Project-specific
Annual heat production Tchp MMBtu Project-specific
Boiler efficiency for offset thermal production EFFb % 80%
Reduction in fuel consumption for thermal production Fb MMBtu Tchp / EFFchp
Heat rate including T/D losses HReut MMBtu/MWhe HReug / (1 - TDeu)
Reduction in fuel consumption due to CHP Feu MMBtu Echp * HReut
Total reduction in fuel consumption Ftot MMBtu Feu - Fb - Fchp
CH
PO
ffse
t
therm
al
Off
set
ele
ctr
ic
Methodology Formula
NRDC/OEC See Table 6-11.
SWEEP Lesser of Echp and Ftot / HRSWchp.
Massachusetts APS Lesser of Echp and (Echp / 33%) + (Tchp / 3.412 / 80%) - (Fchp /3.412)
ACEEE Ftot /HReut

29
Table 7-4. NRDC/OEC Tiers
Table 7-5. Conversion of NRDC/OEC Tiers to Higher Heating Value
The NRDC/OEC approach is endorsed by the Environmental Law and Policy Center and the Heat is
Power Association. The NRDC/OEC White Paper states:
“This approach has multiple advantages, as it:
Incentivizes all prime mover technologies and does not pick technology winners
Encourages project developers to design higher-efficiency installations, regardless of the
prime mover technology
Is based on the performance of real CHP systems, of various sizes, configurations and
technologies
Is simple to administer and implement, as it requires only a simple calculation of overall
system efficiency based on readily available inputs (and minimizes issues surrounding heat-
rates) neither underestimates or overestimates savings.”
The SWEEP approach divides the total fuel savings due to CHP by a heat rate that we will term a
“marginal heat rate.” This heat rate is calculated by subtracting the offset boiler fuel from the total CHP
fuel use and dividing the result by the CHP electricity output. The creditable MWh of electricity are the
lesser of the calculation or the actual CHP electricity output.
TierEfficiency
(LHV)
Portion of
kWh output
considered
<60% 0%
Tier 1 60-65% 60%
Tier 2 65-70% 70%
Tier 3 70-74% 80%
Tier 4 74-77.5% 90%
Tier 5 >77.5% 100%
TierEfficiency
(LHV)
Efficiency
(HHV)
Portion of
kWh output
considered
<60% <54% 0%
Tier 1 60-65% 54-59% 60%
Tier 2 65-70% 59-63% 70%
Tier 3 70-74% 63-67% 80%
Tier 4 74-77.5% 67-70% 90%
Tier 5 >77.5% >70% 100%

30
The Massachusetts APS law is the most generous method for crediting CHP. It states that the creditable
CHP power output is:
“.. equal to the result, if positive, of the following calculation: take the sum of (1) the electrical
energy generated divided by the overall efficiency of electrical energy delivered to the end-use
from the electrical grid (which efficiency is equal for this purpose to 0.33); and (2) the Useful
Thermal Energy divided by the overall efficiency of thermal energy delivered to the end-use from
a standalone heating unit (which efficiency is equal for this purpose to 0.80); and subtract from
this sum the total of all fuel and any other energy consumed by the CHP Unit in that quarter
expressed in MWh and calculated using the energy content of the fuel based on its higher heating
value.”
ACEEE’s recommended method (Elliott, Chittum, Trombley and Watson) divides the total fuel savings
(fuel for separate heat and power – CHP fuel) by the grid heat rate. This approach results in the lowest
credit to CHP.
The results of all four calculation methods for each CHP technology configuration is illustrated in Figure
7-3. We have omitted the biomass-fired CHP configurations because they will qualify for the RPS. We
have omitted the waste heat to power technology (using ORC) because this scenario is not addressed
except in the NRDC/OEC method.
Figure 7-3. Credited CHP Power Generation as a Percentage of Total CHP Power Generation for 12
Technologies Under 4 Calculation Methods
We recommend the NRDC/OEC methodology for crediting CHP electricity generation for the reasons
discussed above.
0%
10%
20%
30%
40%
50%
60%
70%
80%
90%
100%
MT
0.0
65
MT
0.7
50
ICE
0.1
ICE
0.8
ICE
3
ICE
5
GT
3
GT
10
GT
40
PA
FC 0
.2
MC
FC 0
.6
MC
FC 1
.5NRDC
SWEEP
Mass APS
ACEEE
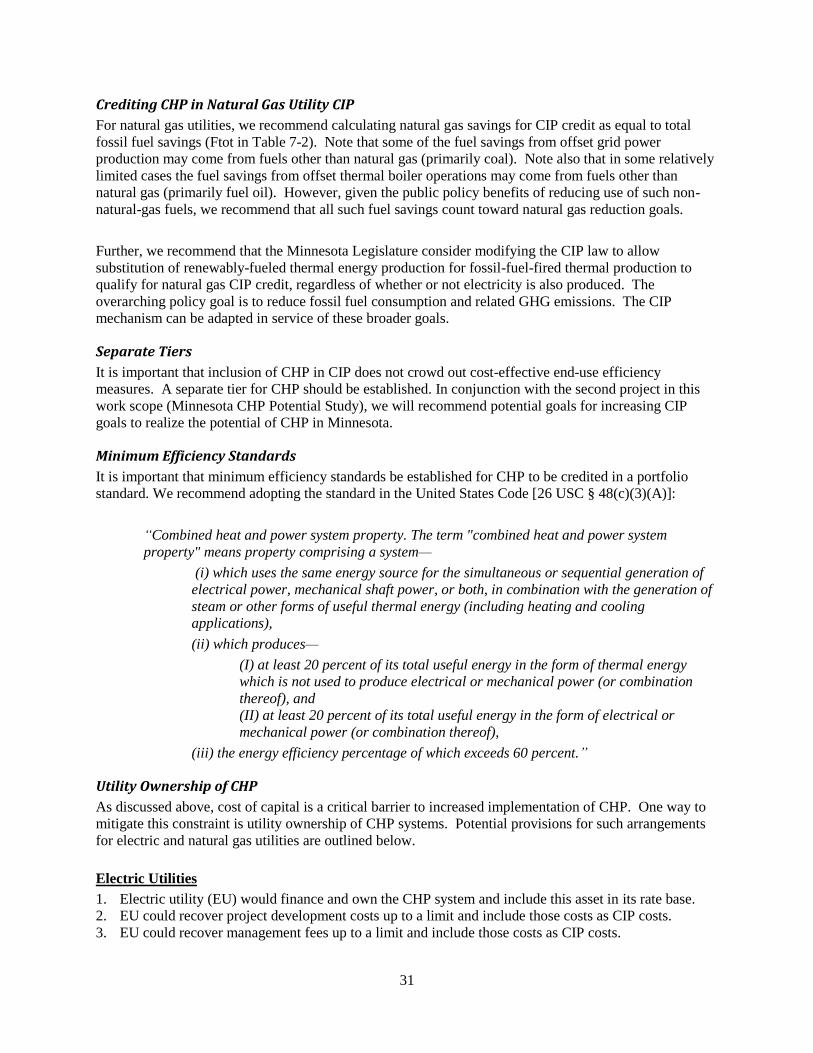
31
Crediting CHP in Natural Gas Utility CIP
For natural gas utilities, we recommend calculating natural gas savings for CIP credit as equal to total
fossil fuel savings (Ftot in Table 7-2). Note that some of the fuel savings from offset grid power
production may come from fuels other than natural gas (primarily coal). Note also that in some relatively
limited cases the fuel savings from offset thermal boiler operations may come from fuels other than
natural gas (primarily fuel oil). However, given the public policy benefits of reducing use of such non-
natural-gas fuels, we recommend that all such fuel savings count toward natural gas reduction goals.
Further, we recommend that the Minnesota Legislature consider modifying the CIP law to allow
substitution of renewably-fueled thermal energy production for fossil-fuel-fired thermal production to
qualify for natural gas CIP credit, regardless of whether or not electricity is also produced. The
overarching policy goal is to reduce fossil fuel consumption and related GHG emissions. The CIP
mechanism can be adapted in service of these broader goals.
Separate Tiers
It is important that inclusion of CHP in CIP does not crowd out cost-effective end-use efficiency
measures. A separate tier for CHP should be established. In conjunction with the second project in this
work scope (Minnesota CHP Potential Study), we will recommend potential goals for increasing CIP
goals to realize the potential of CHP in Minnesota.
Minimum Efficiency Standards
It is important that minimum efficiency standards be established for CHP to be credited in a portfolio
standard. We recommend adopting the standard in the United States Code [26 USC § 48(c)(3)(A)]:
“Combined heat and power system property. The term "combined heat and power system
property" means property comprising a system—
(i) which uses the same energy source for the simultaneous or sequential generation of
electrical power, mechanical shaft power, or both, in combination with the generation of
steam or other forms of useful thermal energy (including heating and cooling
applications),
(ii) which produces—
(I) at least 20 percent of its total useful energy in the form of thermal energy
which is not used to produce electrical or mechanical power (or combination
thereof), and
(II) at least 20 percent of its total useful energy in the form of electrical or
mechanical power (or combination thereof),
(iii) the energy efficiency percentage of which exceeds 60 percent.”
Utility Ownership of CHP
As discussed above, cost of capital is a critical barrier to increased implementation of CHP. One way to
mitigate this constraint is utility ownership of CHP systems. Potential provisions for such arrangements
for electric and natural gas utilities are outlined below.
Electric Utilities
1. Electric utility (EU) would finance and own the CHP system and include this asset in its rate base.
2. EU could recover project development costs up to a limit and include those costs as CIP costs.
3. EU could recover management fees up to a limit and include those costs as CIP costs.

32
4. EU would own the asset for 15 years, at which time the customer has the option to buy the asset at
depreciated book value.
5. EU could contract with the customer for operation and routine maintenance under the management of
the EU.
6. EU would pay the costs of major maintenance and equipment replacement, which will add to the rate
base investment and the depreciable basis of the plant.
7. The CHP system would be dispatched by the EU.
8. CHP power generation would be sold to the customer at the avoided rate of normal electric utility
service.
9. CHP thermal production would be sold to the customer a given percentage of the avoided cost of heat
production using customer boilers.
10. Excess generation would be dispatched to the grid by the EU.
Gas Utilities
1. Gas utility (GU) would finance and own the CHP system and include this asset in its rate base.
2. GU could recover project development costs up to a limit and include those costs as CIP costs.
3. GU could recover management fees up to a limit and include those costs as CIP costs.
4. GU would own the asset for 15 years, at which time the customer has the option to buy the asset at
depreciated book value.
5. GU could contract with the customer for operation and routine maintenance under the management of
the GU.
6. GU would pay the costs of major maintenance and equipment replacement, which will add to the rate
base investment and the depreciable basis of the plant.
7. CHP system would be operated based on thermal load.
8. CHP power generation would be sold to the customer at the avoided rate of normal electric utility
service.
9. Customer would contract with the EU for standby service.
10. CHP thermal production will be sold to the customer at a given percentage of the avoided cost of heat
production using customer boilers.
11. Excess generation would be dispatched to the grid in cooperation with the EU at a price equal to the
marginal variable cost of CHP electricity generation. To the extent that the marginal electricity
generation cost from CHP exceeds the marginal cost of the EU’s fossil fuel plants, the excess cost
will be considered an EU CIP cost, up to a limit set by the average cost of CIP electricity savings for
a benchmark period.
Joint EU/GU Projects
If both the EU and GU participate in financing a CHP facility, the total value of CIP credit for each can be
determined as follows:
PVFtot = Present Value of total financial contribution of both utilities over 20 years at a discount
rate equal to the average of the two WACCs
PVFeu = Present Value of the EU financial contribution over 20 years at a discount rate equal to
the average of the two WACCs
PVFgu = Present Value of the GU financial contribution over 20 years at a discount rate equal to
the average of the two WACCs
EUcip = Average EU CIP expenditure per MWH for a benchmark period
GUcip = Average GU CIP expenditure per MMBtu for a benchmark period
MWH CHP electricity creditable to the EU = (PVFeu/PVFtot) / EUcip
MMBtu CHP natural gas creditable to the GU = (PVFgu/PVFtot) / GUcip

33
Financial Incentives for Non-Utility CHP Investments
Currently Minnesota has no financial incentives or financing assistance in place that give credit to CHP
system production or reduce the direct cost of investment. We believe that such incentives for non-
utility-owned should be considered within the context of the CIP. The availability of such incentives may
discourage opt-out from CIP.
Incentives for CHP installations can take a variety of forms, including:
1. Project-based grants;
2. Low-interest loans or loan guarantees;
3. Short-term (up to 2 years) performance incentives tied to demonstrated—
a. CHP power production;
b. Peak CHP capacity installed; or
c. Peak demand reduction.
4. Ongoing incentive payments tied to demonstrated CHP power production.
Programs in Other States
Most successful programs combine Incentive 3.a with Incentives 3.b or 3.c. because they address both
capacity and energy values. For example, Maryland’s successful Baltimore Gas and Electric (BG&E)’s
Smart Energy Savers Program. The incentive program is structured as follows:
$75/kW after the system has been designed and a commitment letter has been signed;
$175/kW after the system has been installed and commissioned and undergone an inspection; and
$0.07/kWh for the first 18 months of system performance, after metered data has been reviewed.
This incentive program is applicable to systems that are at least 65% efficient and do not export excess
power to the grid. The maximum incentive offered by BG&E is $2 million for a single project, and is
available to almost all non-residential customer classes.
In New York, NYSERDA’s Combined Heat and Power (CHP) Performance Program provides the
following incentives:
Systems may earn up to $0.10/kWh generation;
Systems may earn an additional $600/kW or $750/kW of summer demand reduction, depending
on location in the state; and
Systems may earn additional bonus incentives if they do any of the following:
o Serve critical infrastructure;
o Serve an area determined to be a challenged area of the grid of particular interest to the
local utility; and
o Exemplify “superior” efficiency.
These incentives are performance-based and correspond to the summer-peak demand reduction (kW),
energy generation (kWh) achieved by the CHP System on an annual basis over a two-year measurement
and verification period. CHP systems must:
Have a minimum 60% total efficiency;
Have a NOx emission rate ≤ 1.6 lbs/MWhr; and
Have the ability to operate during a grid outage.
The CHP Performance Program offers a maximum incentive of $2.6 million or 50% of the project cost,
whichever is less.
34
CHP Credit Trading
Economic efficiency is achieved when the lowest-cost measures are undertaken to obtain the desired
result. A system of tradable CHP credits within the CIP program is recommended to promote economic
efficiency. These credits could be sold between different electric and natural utilities.
8. Potential Impacts
Utility Portfolios and Ratepayers
Five key cost-effectiveness tests have, with minor updates, been used for more than 20 years as the
principle approaches for energy efficiency program evaluation. These five cost-effectiveness tests are the
participant cost test (PCT), the utility/program administrator cost test (PACT), the ratepayer impact
measure test (RIM), the total resource cost test (TRC) and the societal cost test (SCT) (National Action
Plan for Energy Efficiency 2008).
The basic structure of each test involves a calculation of the total benefits and the total costs in dollar
terms from a certain vantage point to determine whether or not the overall benefits exceed the costs. A
test is positive if the benefit-to-cost ratio is greater than 1.0, and negative if it is less than 1.0.
In the final report, the impacts of policy options for example CHP projects will be evaluated using the
cost tests outlined in Table 8-1.
Fuel Switching Concerns have been raised that implementation of CHP through the CIP may lead to a utility customer of
a specific fuel type (electric) subsidizing the cost of CHP project incentives or utility load building that
may be provided to another utility customer for a different fuel type (natural gas). Note that CIP already
leads to some level of cross-subsidization between customers within a utility customer base. The issue
here is potential subsidization between customers of different utilities.
This issue must be further explored with the stakeholders, in the context of the guiding public policy
goals of reducing fossil fuel use and related environmental impacts. Potential cross-subsidization issues
between the electric and gas utilities can be mitigated by giving both types of utilities the opportunity for
involvement in CHP development and creation of related CIP credits.
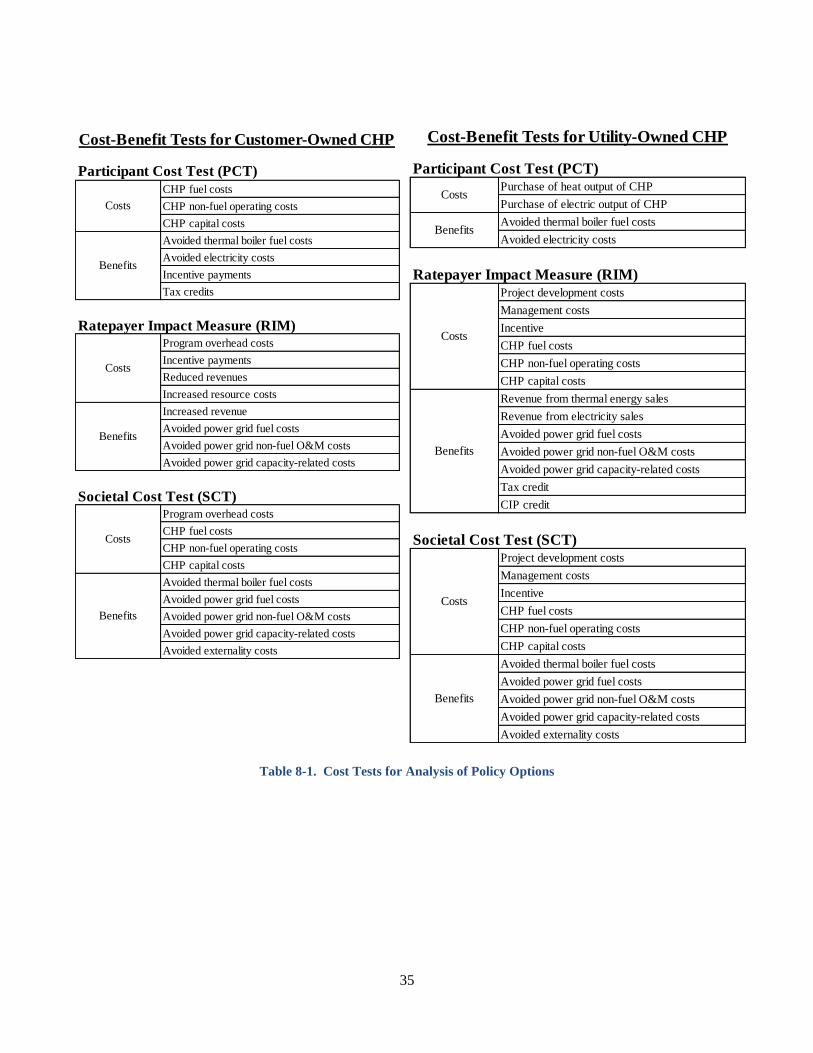
35
Table 8-1. Cost Tests for Analysis of Policy Options
Cost-Benefit Tests for Customer-Owned CHP
Participant Cost Test (PCT)
CHP fuel costs
CHP non-fuel operating costs
CHP capital costs
Avoided thermal boiler fuel costs
Avoided electricity costs
Incentive payments
Tax credits
Ratepayer Impact Measure (RIM)Program overhead costs
Incentive payments
Reduced revenues
Increased resource costs
Increased revenue
Avoided power grid fuel costs
Avoided power grid non-fuel O&M costs
Avoided power grid capacity-related costs
Societal Cost Test (SCT)Program overhead costs
CHP fuel costs
CHP non-fuel operating costs
CHP capital costs
Avoided thermal boiler fuel costs
Avoided power grid fuel costs
Avoided power grid non-fuel O&M costs
Avoided power grid capacity-related costs
Avoided externality costs
Benefits
Costs
Benefits
Costs
Benefits
Costs
Participant Cost Test (PCT)Purchase of heat output of CHP
Purchase of electric output of CHP
Avoided thermal boiler fuel costs
Avoided electricity costs
Ratepayer Impact Measure (RIM)Project development costs
Management costs
Incentive
CHP fuel costs
CHP non-fuel operating costs
CHP capital costs
Revenue from thermal energy sales
Revenue from electricity sales
Avoided power grid fuel costs
Avoided power grid non-fuel O&M costs
Avoided power grid capacity-related costs
Tax credit
CIP credit
Societal Cost Test (SCT)Project development costs
Management costs
Incentive
CHP fuel costs
CHP non-fuel operating costs
CHP capital costs
Avoided thermal boiler fuel costs
Avoided power grid fuel costs
Avoided power grid non-fuel O&M costs
Avoided power grid capacity-related costs
Avoided externality costs
Costs
Benefits
Costs
Benefits
Costs
Benefits
Cost-Benefit Tests for Utility-Owned CHP

9. Stakeholder Feedback Sought
Stakeholder feedback is sought on any aspect of these draft options. In particular, we pose the
following questions:
1. Which options will be most effective in encouraging CHP? Why?
2. Which options will be least effective? Why?
3. What concerns do you have regarding each option, relative to:
3.1. Consistency with current statutes?
3.2. Administrative practicality?
3.3. Unintended impacts on other efficiency efforts?
3.4. Other concerns?
4. How could the concerns you raise be mitigated?
5. Are the incentive levels appropriate?
6. Are the calculation methodologies discussed in this paper appropriate? If not, why not? What
changes would you suggest?
7. Do the low, medium and high draft goals for CHP in the CIP present a reasonable range of goals?
8. Do the low and high APS goals present a reasonable range of goals?
Feedback can be provided to Mark Spurr at [email protected].
36
37
References ACEEE Scorecard. “The 2013 State Energy Efficiency Scorecard.” American Council for an Energy-
Efficient Economy. 2013.
Andersen, Anders N. and Peter Sorknæs. 2011. “Next generation CHP to balance intermittent
production from renewables.” Cogeneration & On-site Power Production. January 7.
http://www.cospp.com/articles/print/volume-12/issue-4/features/next-generation-chp-to-balance-
intermittent-production-from-renewables.html.
Anderson and Geckil, 2003. Anderson, Patrick L. and Ilhan K, Geckil, “Northeast Blackout Likely to
Reduce US Earnings by $6.4 Billion,” AEG Working Paper 2003-2, August 19, 2003.
Breger, Dwayne. 2011. “Massachusetts Policies for Combined Heat and Power (CHP),”
Massachusetts Department of Energy Resources. Presentation to the U.S. Clean Heat and Power
Association Spring CHP Forum. May 5.
Casten, Thomas. 2012. “Not all megawatts are created equal,” Cogeneration and On-site Power
Production. January 7. http://www.cospp.com/articles/print/volume-13/issue-4/features/not-all-
megawatts-are-created-equal.html.
Chittum, Anna and Kate Farley. 2013. Utilities and the CHP Value Proposition. American Council
for an Energy-Efficient Economy. Report IE134, Washington, DC: July. http://aceee.org/research-
report/ie134.
Chittum 2013a. “How Electric Utilities Can Find Value in CHP.” American Council for an Energy-
Efficient Economy. July 2013.
Chittum 2013b. “How Natural Gas Utilities Can Find Value in CHP.” American Council for an
Energy-Efficient Economy. July 2013.
CNN Money. “Sandy's hit to the economy” by Chris Isidore @CNNMoney October 29, 2012.
http://money.cnn.com/2012/10/29/news/economy/hurricane-sandy-business/index.html
Connecticut Public Act, 2007. No. 07-242, An Act Concerning Electricity and Energy Efficiency.
House Bill No. 7432. State of Connecticut. June 4. http://www.cga.ct.gov/2007/act/pa/2007pa-00242-
r00hb-07432-pa.htm.
DOE 2012. “Combined Heat and Power, A Clean Energy Solution.” U.S. Department of Energy and
U.S. Environmental Protection Agency. August 2012.
DSIRE. “Database of State Incentives for Renewables & Efficiency.” Accessed September 2013.
http://www.dsireusa.org/.
Eaton, Gillian. 2013. (Vermont Energy Investment Corporation). Personal communication with Anna
Chittum, ACEEE. April 11, 2013.
EIA AEO 2014. Annual Energy Outlook 2014, Early Release. U.S. Energy Information
Administration, Dec. 2013.

38
EIA 2012. “How much electricity is lost in transmission and distribution in the United States?” U.S.
Energy Information Administration. http://www.eia.gov/tools/faqs/faq.cfm?id=105&t=3.
EIA Electricity Data. U.S. Energy Information Administration.
http://www.eia.gov/electricity/capacity/
EIA NEMS Model 2013. “The Electricity Market Module of the National Energy Modeling System
Model Documentation 2013.” U.S. Energy Information Administration. July 2013.
EIA State Data 2011. “State Energy Data 2011: Prices and Expenditures.” U.S. Energy Information
Administration.
EIA State Rankings. .” U.S. Energy Information Administration.
http://www.eia.gov/state/rankings/?sid=MN#series/12
Elliott, Chittum, Trombley and Watson. “CHP Savings and Avoided Emissions in Portfolio
Standards.” American Council for an Energy-Efficient Economy, 2009.
Energy Resources Center (draft), Sept. 2013. “Increasing Viable Combined Heat and Power (CHP)
Opportunities to Aid Minnesota Meeting State Energy Savings Goals: Analyzing Net Metering and
Standby Rates, Prepared For Minnesota Department of Commerce Division of Energy Resources.”
CARD Grant 55796, September 20, 2013.
EPA CHPP database. “dCHPP (CHP Policies and Incentives database).” U.S. Environmental
Protection Agency. http://www.epa.gov/chp/policies/database.html.
EPA 2009. “Standby Rates for Customer-Sited Resources: Issues, Considerations and the Elements of
Model Tariffs.” U.S. Environmental Protection Agency. Dec. 2009.
EPA Proposed 111 (b) Rule. 79 Fed. Reg. 1430 (Jan. 8, 2014).
EPRI 2001. “The Cost of Power Disturbances to Industrial & Digital Economy Companies.”
Consortium for Electric Infrastructure to Support a Digital Society (CEIDS), An Initiative by EPRI
and the Electricity Innovation Institute. June 2001.
FMS Bonds. http://www.fmsbonds.com/Market_Yields/index.asp
H.F. 729. Minnesota House File 729 Fourth Engrossment, Article 12, Section 8.
House Research 2013. House Research Bill Summary, File Number H.F. 729, May 15, 2013.
ICF CHP database, http://www.eea-inc.com/chpdata/States/OH.html
ICF 2003. “The Economic Cost of the Blackout: An Issue Paper on the Northeastern Blackout.” ICF
Consulting. August 14, 2003.
ICF, 2010. “Effect of a 30 Percent Investment Tax Credit on the Economic Market Potential for
Combined Heat and Power.” ICF International. 2010.
http://www.uschpa.org/files/public/USCHPA%20WADE_ITC_Report_FINAL%20v4.pdf

39
ICF, 2012. “Combined Heat and Power: Policy Analysis and 2011-2030 Market Assessment.” ICF
International. Prepared for California Energy Commission. Feb. 2012.
ICF 2013. “Combined Heat and Power: Enabling Resilient Energy Infrastructure for Critical
Facilities.” ICF International. Prepared for Oak Ridge National Laboratory. March 2013.
Kolwey, Neil. 2012. “Calculating Net Electricity Savings from Utility-Supported CHP Projects.”
Southwest Energy Efficiency Project. August 2012.
Lazar, Jim. 2011. “Line Losses and Reserves: Often Undervalued Benefits of Energy Efficiency
Investments.” ACEEE Energy Efficiency as a Resource Conference. September 27, 2011.
Lipman, Tim. 2013. Pacific Clean Energy Application Center. Personal communication with Anna
Chittum of ACEEE. March 15, 2013.
Massachusetts Session Laws 2008.
http://www.malegislature.gov/Laws/SessionLaws/Acts/2008/Chapter169
MPCA 2012. “Greenhouse Gas Emissions in Minnesota: 1970 – 2008 Second Biennial Progress
Report - Technical Support Document.” Minnesota Pollution Control Agency. January, 2012.
MPCA 2003. “Minnesota Climate Change Action Plan: A Framework for Climate Change Action.”
Minnesota Pollution Control Agency. February 2003.
Minnesota Department of Commerce website.
http://mn.gov/commerce/energy/topics/conservation/How-CIP-Works.jsp
Minnesota Department of Commerce 2012. “Minnesota Conservation Improvement Program Energy
and Carbon Dioxide Savings Report for 2009-2010.” Prepared pursuant to Minnesota Statutes
§216B.241, subd. 1c(g). Minnesota Department of Commerce, Division of Energy Resources. June
28, 2012.
National Action Plan for Energy Efficiency 2008. Understanding Cost-Effectiveness of Energy
Efficiency Programs: Best Practices, Technical Methods, and Emerging Issues for Policy-Makers.
Energy and Environmental Economics Inc. and Regulatory Assistance Project.
(www.epa.gov/eeactionplan)
Navigant 2011. “Process and Impact Evaluation of Efficiency Vermont’s 2007-2009 Geotargeting
Program.” Navigant Consulting, Inc. January 7, 2011.
http://publicservice.vermont.gov/sites/psd/files/Topics/Energy_Efficiency/EVT_Performance_Eval/N
avigant_Vermont%20GeoTargeting%202010%20Process%20%20Impact%20Evaluation%20FINAL
%20.pdf.
NJBPU 2012. New Jersey Board of Public Utilities. Docket No. GO12070600. July 18.
http://www.njcleanenergy.com/files/file/Board%20Orders/Board%20Order%20-
%20Standby%20Charges%207-18-12-2F.pdf.
NRDC/OEC 2012. “White Paper on Implementing the Combined Heat and Power and Waste Heat
Recovery Provisions of Revised Code Sections 4928.64 & 4928.66.” Dylan Sullivan (NRDC) and
Trish Demeter (OEC), April 2012.

40
NYSERDA 2013. “Combined Heat and Power Performance Program. Program Opportunity Notice
2701.” New York State Energy Research and Development Authority. http://www.nyserda.ny.gov/-
/media/Files/FO/Current%20Funding%20Opportunities/PON%202701/2701alldoc.pdf. Accessed
September 22.
ORNL 2013. “Combined Heat and Power: Enabling Resilient Energy Infrastructure for Critical
Facilities.” ICF International, Prepared for Oak Ridge National Laboratory. March 2013.
Oregon Legislative Assembly. 2013. Senate Bill 844.
http://landru.leg.state.or.us/13reg/measures/sb0800.dir/sb0844.en.html.
Parks 2003. “Transforming the Grid to Revolutionize Electric Power in North America.” Edison
Electric Institute’s Fall 2003 Transmission, Distribution and Metering Conference, Bill Parks, U.S.
Department of Energy. October 13, 2003.
Pielli and Wickwire, 2013. “Boiler MACT Update: Final Major Source Rule and Opportunities for
CHP.” Katrina Pielli, U.S. Department of Energy, and Susan Wickwire, U.S. Environmental
Protection Agency. District Energy magazine. Fourth Quarter 2013.
Primen. “Primen’s 2003 Distributed Energy Market Survey.”
Property Tax Administrator’s Manual. “Minnesota Property Tax Administrator’s Manual, Exempt
Property, Module #5.”
Russell and Young, 2012. “Understanding Industrial Investment Decision-Making, American Council
for an Energy-Efficient Economy.” American Council for an Energy-Efficient Economy, Report
IE124. Oct. 2012, http://aceee.org/research-report/ie124.
Rutgers 2013. “Rutgers Regional Report, The Economic and Fiscal Impacts of Hurricane Sandy in
New Jersey.” January 2013.
Spurr and Larsson 1996. “Integrating District Cooling with Combined Heat and Power.” International
Energy Agency Programme of Research, Development and Demonstration on District Heating and
Cooling including the integration of CHP, Report 1996:N1, ISBN 90-72130-87-1.
Ycharts. http://ycharts.com/companies/XEL/return_on_equity
159 | P a g e COMM-20130522-67922 | July 2014
Appendix D: Results of Stakeholder Consultation
“Straw Man Options for Minnesota CHP Policies” (Appendix C) was prepared and distributed to a
wide range of stakeholders. The document provided background information and analysis
developed during this study, and presented “straw man” policy options for the purpose of gathering
stakeholder input during informal meetings and conference calls.
The document was provided to Xcel Energy, Minnesota Power, Great River Energy, Otter Tail Power,
Minnesota Power Cooperative, Southern Minnesota Municipal Power Agency (SMMPA), Minnesota
Municipal Utilities Association (MMUA), CenterPoint Energy, Great Plains Gas, MERC (MERC), Ever-
Green Energy, University of Minnesota, Franklin Energy, Cummins, Energy Systems Consulting,
Energy Resources Center, Fresh Energy, Center for Energy and Environment, Great Plains Institute,
Blue Green Alliance and the Metropolitan Council. Meeting or calls took place with all except
Minnesota Power, SMMPA, Minnesota Power Cooperative and Blue Green Alliance. Written
comments were received from the Metropolitan Council.
This section lists comments received by entity category.
Electric Utilities
Electric utilities see weak customer interest in CHP as a key issue.
CHP can be seen as customer-intrusive.
The fact that a lot of the largest customers are CIP opt-outs is problematic.
Most of their work on CHP has been concentrated on bottoming cycles.
It was suggested that the policy discussion is premature until the potential for CHP is
quantified.
Queries were made regarding how the straw man operating incentive level was set (answer:
average statewide electric utility CIP expenditures over the last three years divided by 15
year lifetime kWh savings, per Department of Commerce data).
It was noted that such expenditures include administrative overhead.
Concern was expressed that inclusion of CHP in CIP is problematic because it is a supply
technology rather than end-use efficiency.
Relative to utility implementation of CHP, there are risks related to the longevity of the CHP
host facility/thermal user.
Potential solutions include regulatory recovery for losses associated with a CHP customer
going out of business, or a higher rate of return in recognition of the risks.
Xcel noted that they have a partial decoupling in their current rate case.
One utility has a CHP plant in S. Dakota that is coal-fired, and they may stop dispatching that
due to the EPA Clean Power Plan.
There is competition within the company for funding, so efficiency expenditures compete with
other needs.
They try to cover a range of sectors (residential, commercial, industrial) in their CIP program.
70 percent of their expenditures are incentives, and the rest are administration, promotion,
etc.
CHP opportunities in the service territory have not been comprehensively analyzed.
They did evaluate potential CHP at a wood processing plant, but found it to be too expensive.

160 | P a g e COMM-20130522-67922 | July 2014
The best potential CHP sites in rural areas are ethanol plants, but most of those have opted
out of CIP.
Concern is long-term stability of gas prices.
CHP opportunities in the service territory have not been comprehensively analyzed.
Some customers have really cheap gas, because they are supplied directly from interstate
pipelines.
With new solar incentives, some GRE customers are thinking solar is an easier way to do
sustainable energy.
Relative to the Clean Power Plan, it may be possible to convert some simple cycle peaking
plants to combined cycle.
CHP may be more attractive if a customer has high electric reliability needs.
There are 12 ethanol plants on the system now, about 5 MW per site. There might be
another 6 industrial sites that could be CHP candidates. Perhaps a total of 80-100 MW
additional, including mid-sized commercial sites?
Would argue that non-fuel O&M costs won’t really be avoided if they reduce their power
output from other capacity – it won’t change the way they dispatch.
MISO is an economic dispatch model – what gets pulled off is the least economic plant.
Capital incentive is more effective than operating incentive because typically customer
capital is tight.
Funding capital incentives within CIP is difficult.
Fundamental differences between IOUs and coops relative to CIP.
See challenges in fitting CHP into CIP, but like the idea of having some funding for CHP.
Hard to shift funding from other resources.
Better to address CHP within the RES, rather than a separate APS.
Hard to meet air permitting with biomass CHP.
Do not have enough gas pipeline capacity for much more CHP. Some of their gas peaking
plants have been curtailed (even before last year).
Potential problems with public entities financing projects for private entities. Requires
taxable debt. Usually can do it with hospitals (non-profits). Their bond counsel doesn’t like to
see munis financing customer projects.
If you finance CHP, you constrain a small utility from being able to take on other debt. With
more debt the next financing becomes more expensive.
Hard to get subordinated debt.
Gas utilities
Do not like the idea of more targets or goals. An “aspirational goal” is OK, but not something
as firm as a regular CIP target.
CHP is attractive because it boosts sales, but in a decoupled environment the additional
sales may not be valuable.
CHP projects may take years to implement, so the flow of MW is lumpy. Set multi-year goals
for CHP?
If a gas utility implements a CHP project it raises additional complications relative to standby
rates.
Electric utilities seem to have a lot of discretion in how they apply standby rates.
Utilities can afford to have CHP expertise available, but this is more challenging for
customers.
Barrier in capitalizing heat distribution infrastructure within CIP?
161 | P a g e COMM-20130522-67922 | July 2014
Do we need to have ratebased CHP in CIP? OK to have this as an option, not a mandate.
Need certainty regarding how CHP fits into CIP.
Should only be able to claim CIP credit for CHP if you have already met your end-use
efficiency goal.
CenterPoint will apply for CIP credit for the U of MN project.
If we approach the energy calculation on a net Btu basis for CHP, will other want to apply this
to other CIP measures?
In latest rate case, got a “full decoupling of rates from sales”
MERC is fully decoupled.
50 percent of CIP expenditures are overhead.
93 cents per MMBtu is more than their delivery cost in most cases. A lot of customers are
paying 70 cents for delivery.
Delivery costs: $1.70 firm residential; $0.47 large industrial interruptible; $1.00 firm
commercial.
For customer projects, the maximum rebate they can give is $7.00/mcf. Mostly $3-5.
Regarding renewable thermal – do not restrict it to areas without natural gas.
Fuel switching – no formal policy or rule. Difference between burning your own waste and
buying it from someone else, relative to losing a gas customer. (I do not understand this.)
Want to make sure that the gas and electric incentives are about the same.
Noted potential gas pipeline constraints.
Most large companies are on interruptible gas. Last year there were lots of interruptions, but
there hadn’t been for the prior 4-5 years.
What criteria would have to be met to put CHP in the rate base?
Noted regulatory lag – takes time for costs to be addressed in a rate case. Perhaps cover
the costs in the CIP rider until the next rate case?
They do not have the expertise to develop CHP projects. Would need third party help.
Just hired a manager of distributed generation (for GPG and associated companies).
Intrigued with Option 3 (utility development of CHP).
Key issue is shifting risks to ratepayers (stranded asset issue).
WACC is tied to risk profile.
Look at financing options more broadly – not just utility financing. Establish a loan loss
reserve to reduce interest costs?
Systems benefits charge to provide credit enhancement for energy efficiency investments.
Get input from PUC staff.
Regulators value diversity, prudent investment.
In the “MUSH” market (Municipal, Universities, Schools and Hospitals), performance
contracting can be effective.
Bigger financing challenges on the private side.
Thermal Utilities
Should also address CHP retrofit of existing power plants, e.g. Riverside and High Bridge.
Provide incentives to install thermal distribution infrastructure to link power plants with
thermal users.
Perhaps add a small rider to electric rates to help fund thermal infrastructure investments.
Need to highlight potential for integration of CHP with existing or new district energy systems.
Need to consider potential for shutdown of Sherco 1 and 2.
Too much emphasis on utility ownership of CHP.
162 | P a g e COMM-20130522-67922 | July 2014
If the CHP is dispatched by the electric utility, what assurance does the host have that their
thermal loads will be met?
There should be more emphasis on the constraints placed on potential CHP projects by
delays and uncertainties surrounding electric utility treatment of interconnection and standby
rates. Perhaps there should be an authority (DoC or PUC) to whom a CHP project developer
can appeal to prevent utilities from unduly holding up projects.
If a utility develops CHP on a customer site, perhaps there should be a provision for the host
to use the power in times of utility outages.
Cooling is also a potential service from CHP.
Data centers present a strong CHP opportunity.
Not in favor of gas utility investment in CHP.
Need to ensure that other utilities do not cannibalize a thermal utility by installing CHP at a
site served by a district heating system.
Regarding CHP efficiency standards, we may need to provide some flexibility depending on
the seasonality of the thermal host.
Another policy alternative would be a state production tax credit to pay the CHP host for
electricity produced, with a variable credit based on CHP efficiency.
Minnesota should determine the value of CHP similar to the value of solar studies, and that
value should be incorporated into rates paid for CHP electricity.
Equipment Suppliers
Option 3 is the best, then Option 5, then Option 2, then Option 1.
Gas utilities already have incentive to do CHP.
Biggest challenges are with small to medium CHP.
Biomass CHP already qualifies in RES. Not getting traction. Feedstock constrained.
Like the APS idea.
Option 6 is not sufficient. Needs to be combined with another option.
Typically need 2-3 year payback in projects being built in other states.
Stressed the importance of establishing a business case for any incentives.
Do PUC regulations allow business-to-business transfer of power?
Customers
CHP will help the meet carbon reduction goal.
Major modification permit required from MPCA.
Key business need is reliable steam supply.
CHP would be helped if there was a wheeling law like in New Jersey. If U was able to wheel to
other U loads this project would be less expensive.
Likes the option of including CHP in gas utility CIP.
Advocacy Groups
Would like to see some of the currently wasted heat in power plants used, e.g. High Bridge,
Riverside.
The fact that (unless Sherco is shut down) there is little or no need for new power capacity is
a constraint on developing new CHP.

163 | P a g e COMM-20130522-67922 | July 2014
C
With slowing load growth, utilities will be looking for new sources of revenue.
See incorporation of CHP in CIP as potentially workable.
CHP should meet a minimum efficiency standard.
The fact that the biggest customers tend to opt out of CIP is a problem.
Getting utilities on board is key.
Like the idea of requiring evaluation of CHP in IRP as a condition of getting Certificate of
Need.
There are statutory barriers to third party ownership of CHP. Third parties can own up to 24
projects but after that you are considered a public utility.
Including utility owned assets in CIP would be breaking new ground.
Will clarifying legislation be needed to fully address CHP in CIP?
Advantage of using CIP is that it has a well-established measurement and verification (M&V)
process.
The fact that 5 percent of CIP can be spent on solar (which generates, not saves, electricity)
provides a precedent for the argument that CHP can be included in CIP because it reduces
the use of electricity purchased from the utility.
Bioenergy CHP raises issues of “what is the best use of bio resources?”
Biomass feasibility is very site-specific.
Should investigate whether CHP can help facilitate higher levels of renewables by relieving
transmission/distribution constraints.
Most of RES has to be met with wind (and some solar), so there isn’t much room for biomass.
Support a carve-out for biomass CHP.
Some renewables advocacy groups do not like biomass, primarily out of concern regarding
particulates emissions.
Support credit for renewable thermal-only. Fuel switching issues?
Like the APS – on balance, that is the best option.
Should do value of CHP study, just like value of solar.
Not worried about including CHP in CIP.
Like having both electric and gas utilities involved in CHP, not just gas.
Support the emphasis on utility implementation of CHP.
Would like to see incentives for CHP retrofit of existing power plants.
Strongly support of requirement to evaluate CHP in IRP.
Recommend strong role for CHP as Minnesota develops its Clean Power Plan.
onsultants
Recommend discussion of new Illinois CHP program in report.
Include waste heat to power under RES?
Important that an APS “have teeth”.
Recommend a limited number of tiers for calculating CHP credit (NRDC approach has too
many -- too complex)
Can a third party get CIP credit?
Agree that utility involvement in developing CHP would help a lot.
Developing and operating CHP is a distraction for most companies. Requires extra (and
specialized) expertise and labor.
Technical support in project development is very important.
Uncertainty regarding gas prices is a constraint.

164 | P a g e COMM-20130522-67922 | July 2014
This page intentionally left blank.
165 | P a g e COMM-20130522-67922 | July 2014
Appendix E: Methodology
This Appendix describes key elements in the analysis methodology, focusing on aspects of the
methodology that are not described in the body of the report or which are only briefly mentioned.
Overview
This study began with research on current Minnesota laws, policies and programs relevant to CHP. A
review of literature on CHP barriers and policies was then undertaken, including an analysis by the
American Council for an Energy-Efficient Economy (ACEEE) of best practices for CHP policies in other
states. Existing and proposed federal policies relevant to CHP were identified. The economics of a
broad range of CHP technologies was analyzed, including sensitivity to key variables that could be
affected by new policies and programs, including capital cost, weighted average cost of capital41,
CHP fuel price and avoided price of electricity.
Draft Policy Options for increasing CHP in Minnesota were developed based on the analysis of the
economic significance of key barriers as well as review of best practices in other states. A “Straw
Man” draft report was prepared which: summarized existing Minnesota policies; described CHP
barriers and the analysis of the economic significance of key variables; outlined draft Policy Options;
and addressed issues associated with the Policy Options. Informal stakeholder consultations were
conducted following distribution of the Straw Man report, including discussions with electric utilities,
gas utilities, thermal utilities, equipment suppliers, customers, advocacy groups and consultants.
Following the stakeholder consultation, detailed analysis of the Policy Options was undertaken and
modifications were made to the Policy Options based on the feedback and analysis. Additional
analysis of potential issues relating to the Policy Options was undertaken, including specific
questions relating to program design as well as potential cost-benefit impacts on program
participants and society. The impact of each Policy Option on CHP implementation was projected,
primarily using ICF International’s model for estimating natural-gas fired CHP market penetration. In
addition, analysis of Minnesota Pollution Control Agency fuel consumption data was used to check
and augment the ICF model on gas-fired CHP and to estimate the potential market penetration of
biomass CHP.
Recommendations were then developed for consideration by the Department of Commerce and
stakeholders in stakeholder workshops to be implemented in fall of 2014.
41 Weighted Average Cost of Capital (WACC) is the weighted average cost of repaying the capital invested or
borrowed to build a CHP project. There are two main ways to fund a project: 1) equity investment, in which a
company invests its own funds and then requires a return on that equity investment through payments made
throughout the life of the project from the project revenues; and 2) debt, in which funds are borrowed and
principal and interest payments are made each year based on the debt interest rate. WACC is calculated
based on the relative portions of debt and equity. For example, if the funds raised are 60 percent debt and 40
percent equity, the debt interest rate is 6 percent and the return on equity is 12 percent, the WACC is
calculated as follows: (60% X 6%) + (40% X 12%) = 8.4%.
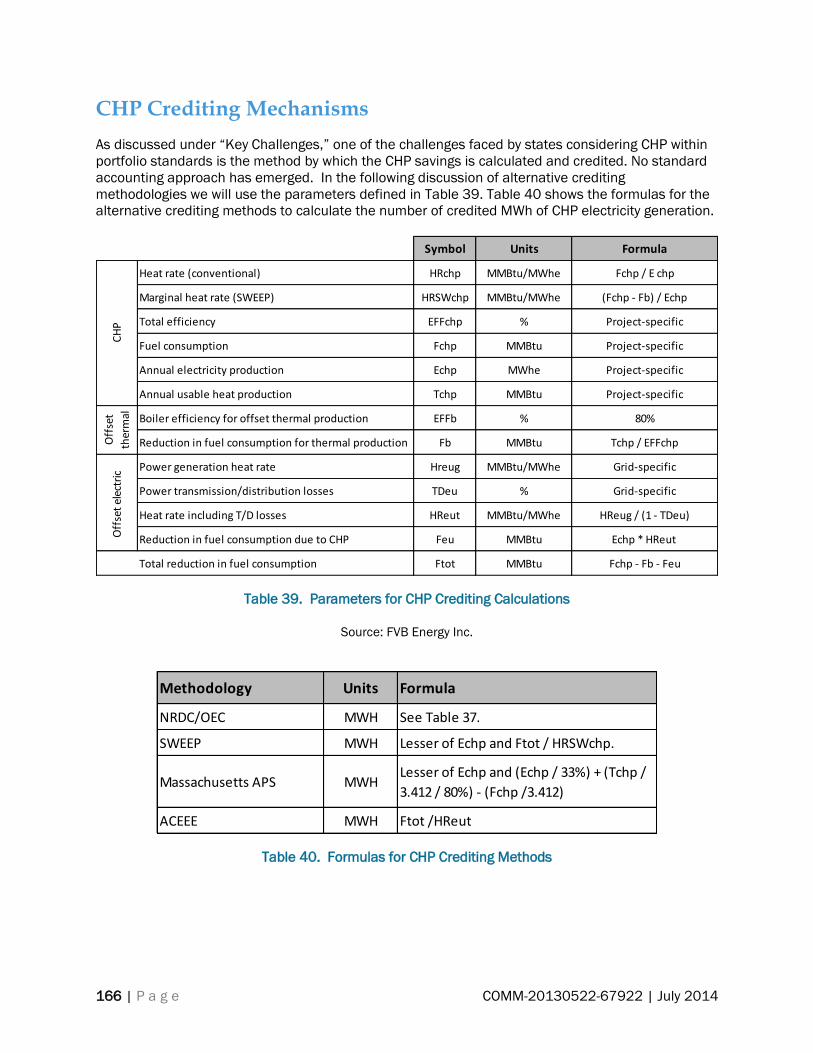
166 | P a g e COMM-20130522-67922 | July 2014
CHP Crediting Mechanisms
As discussed under “Key Challenges,” one of the challenges faced by states considering CHP within
portfolio standards is the method by which the CHP savings is calculated and credited. No standard
accounting approach has emerged. In the following discussion of alternative crediting
methodologies we will use the parameters defined in Table 39. Table 40 shows the formulas for the
alternative crediting methods to calculate the number of credited MWh of CHP electricity generation.
Table 39. Parameters for CHP Crediting Calculations
Source: FVB Energy Inc.
Table 40. Formulas for CHP Crediting Methods
Symbol Units Formula
Heat rate (conventional) HRchp MMBtu/MWhe Fchp / E chp
Marginal heat rate (SWEEP) HRSWchp MMBtu/MWhe (Fchp - Fb) / Echp
Total efficiency EFFchp % Project-specific
Fuel consumption Fchp MMBtu Project-specific
Annual electricity production Echp MWhe Project-specific
Annual usable heat production Tchp MMBtu Project-specific
Boiler efficiency for offset thermal production EFFb % 80%
Reduction in fuel consumption for thermal production Fb MMBtu Tchp / EFFchp
Power generation heat rate Hreug MMBtu/MWhe Grid-specific
Power transmission/distribution losses TDeu % Grid-specific
Heat rate including T/D losses HReut MMBtu/MWhe HReug / (1 - TDeu)
Reduction in fuel consumption due to CHP Feu MMBtu Echp * HReut
Total reduction in fuel consumption Ftot MMBtu Fchp - Fb - Feu
CH
PO
ffse
t
ther
mal
Off
set
elec
tric
Methodology Units Formula
NRDC/OEC MWH See Table 37.
SWEEP MWH Lesser of Echp and Ftot / HRSWchp.
Massachusetts APS MWHLesser of Echp and (Echp / 33%) + (Tchp /
3.412 / 80%) - (Fchp /3.412)
ACEEE MWH Ftot /HReut

167 | P a g e COMM-20130522-67922 | July 2014
The method recommended by the Natural Resources Defense Council (NRDC) and Ohio
Environmental Council (OEC) emphasizes incentivizing maximum efficiency and simplifying
implementation (NRDC/OEC 2012). They recommend a tiered approach as shown in Table 41, with
efficiency measured on Lower Heating Value (LHV) basis. The NRDC/OEC White Paper indicates that
Ohio law requires a 60 percent minimum efficiency on an LHV basis. See “Minimum Efficiency
Standards” below for definitions and discussion of LHV and HHV.
The efficiency data used in this report are HHV basis. Converting the NRDC/OEC tiers to HHV yields
the values shown in Table 42.
Table 41. NRDC/OEC Tiers
Table 42. Conversion of NRDC/OEC Tiers to Higher Heating Value
The SWEEP (Southwest Energy Efficiency Project) approach divides the total fuel savings due to CHP
by a heat rate that we will term a “marginal heat rate” (Kowley 2012).This heat rate is calculated by
subtracting the offset boiler fuel from the total CHP fuel use and dividing the result by the CHP
electricity output. The creditable MWh of electricity are the lesser of the calculation or the actual
CHP electricity output.
TierEfficiency
(LHV)
Portion of
kWh output
credited
<60% 0%
Tier 1 60-65% 60%
Tier 2 65-70% 70%
Tier 3 70-74% 80%
Tier 4 74-77.5% 90%
Tier 5 >77.5% 100%
TierEfficiency
(LHV)
Efficiency
(HHV)
Portion of
kWh
output
credited
<60% <54% 0%
Tier 1 60-65% 54-59% 60%
Tier 2 65-70% 59-63% 70%
Tier 3 70-74% 63-67% 80%
Tier 4 74-77.5% 67-70% 90%
Tier 5 >77.5% >70% 100%

168 | P a g e COMM-20130522-67922 | July 2014
The Massachusetts APS law is the most generous method for crediting CHP. It states that the
creditable CHP power output is:
“.. equal to the result, if positive, of the following calculation: take the sum of (1) the
electrical energy generated divided by the overall efficiency of electrical energy delivered to
the end-use from the electrical grid (which efficiency is equal for this purpose to 0.33); and
(2) the Useful Thermal Energy divided by the overall efficiency of thermal energy delivered to
the end-use from a standalone heating unit (which efficiency is equal for this purpose to
0.80); and subtract from this sum the total of all fuel and any other energy consumed by the
CHP Unit in that quarter expressed in MWh and calculated using the energy content of the
fuel based on its higher heating value.”
ACEEE’s recommended method (Elliott, Chittum, Trombley and Watson) divides the total fuel savings
(fuel for separate heat and power – CHP fuel) by the grid heat rate. This approach results in the
lowest credit to CHP.
The results of all four calculation methods for each CHP technology configuration is illustrated in
Figure 25. We have omitted the biomass-fired CHP configurations because they will qualify for the
RPS. We have omitted the waste heat to power technology (using ORC) because this scenario is not
addressed except in the NRDC/OEC method.
Figure 25. Credited CHP Power Generation as a Percentage of Total CHP Power Generation for 12
Technologies Under 4 Calculation Methods
Of the methodologies analyzed, the NRDC/OEC methodology is the most promising approach for
crediting CHP electricity generation, because it: 1) incentivizes all prime mover technologies and
does not pick technology winners; 2) encourages project developers to design higher-efficiency
installations, regardless of the prime mover technology; 3) is relatively simple to administer and
0%
10%
20%
30%
40%
50%
60%
70%
80%
90%
100%
MT
0.0
65
MT
0.7
50
ICE
0.1
ICE
0.8
ICE
3
ICE
5
GT
3
GT
10
GT
40
PA
FC 0
.2
MC
FC 0
.6
MC
FC 1
.5
NRDC
SWEEP
Mass APS
ACEEE
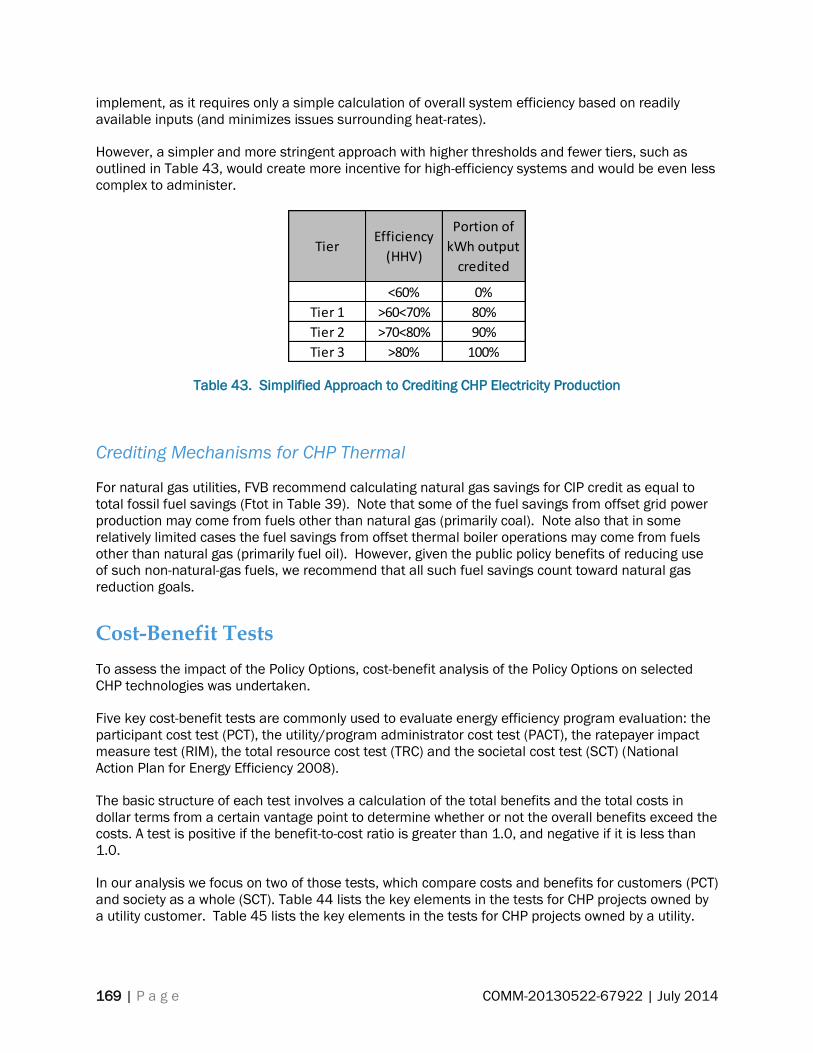
169 | P a g e COMM-20130522-67922 | July 2014
implement, as it requires only a simple calculation of overall system efficiency based on readily
available inputs (and minimizes issues surrounding heat-rates).
However, a simpler and more stringent approach with higher thresholds and fewer tiers, such as
outlined in Table 43, would create more incentive for high-efficiency systems and would be even less
complex to administer.
Table 43. Simplified Approach to Crediting CHP Electricity Production
Crediting Mechanisms for CHP Thermal
For natural gas utilities, FVB recommend calculating natural gas savings for CIP credit as equal to
total fossil fuel savings (Ftot in Table 39). Note that some of the fuel savings from offset grid power
production may come from fuels other than natural gas (primarily coal). Note also that in some
relatively limited cases the fuel savings from offset thermal boiler operations may come from fuels
other than natural gas (primarily fuel oil). However, given the public policy benefits of reducing use
of such non-natural-gas fuels, we recommend that all such fuel savings count toward natural gas
reduction goals.
Cost-Benefit Tests
To assess the impact of the Policy Options, cost-benefit analysis of the Policy Options on selected
CHP technologies was undertaken.
Five key cost-benefit tests are commonly used to evaluate energy efficiency program evaluation: the
participant cost test (PCT), the utility/program administrator cost test (PACT), the ratepayer impact
measure test (RIM), the total resource cost test (TRC) and the societal cost test (SCT) (National
Action Plan for Energy Efficiency 2008).
The basic structure of each test involves a calculation of the total benefits and the total costs in
dollar terms from a certain vantage point to determine whether or not the overall benefits exceed the
costs. A test is positive if the benefit-to-cost ratio is greater than 1.0, and negative if it is less than
1.0.
In our analysis we focus on two of those tests, which compare costs and benefits for customers (PCT)
and society as a whole (SCT). Table 44 lists the key elements in the tests for CHP projects owned by
a utility customer. Table 45 lists the key elements in the tests for CHP projects owned by a utility.
TierEfficiency
(HHV)
Portion of
kWh output
credited
<60% 0%
Tier 1 >60<70% 80%
Tier 2 >70<80% 90%
Tier 3 >80% 100%
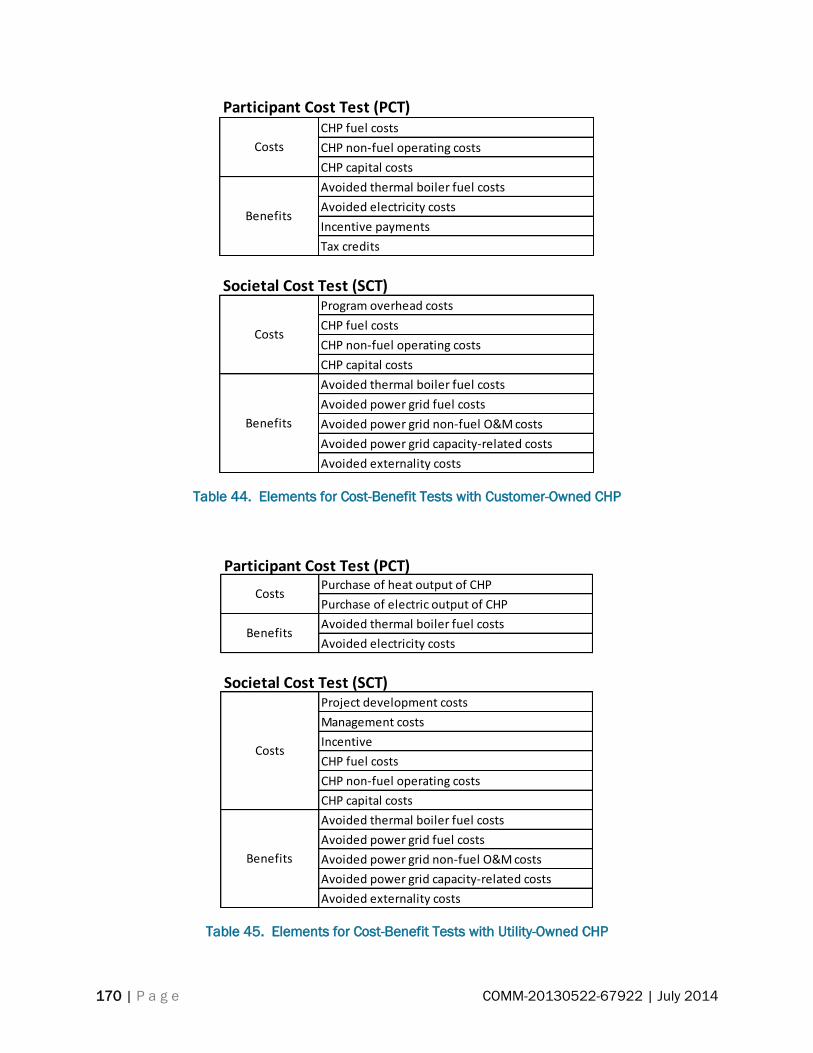
170 | P a g e COMM-20130522-67922 | July 2014
Table 44. Elements for Cost-Benefit Tests with Customer-Owned CHP
Table 45. Elements for Cost-Benefit Tests with Utility-Owned CHP
Participant Cost Test (PCT)CHP fuel costs
CHP non-fuel operating costs
CHP capital costs
Avoided thermal boiler fuel costs
Avoided electricity costs
Incentive payments
Tax credits
Societal Cost Test (SCT)Program overhead costs
CHP fuel costs
CHP non-fuel operating costs
CHP capital costs
Avoided thermal boiler fuel costs
Avoided power grid fuel costs
Avoided power grid non-fuel O&M costs
Avoided power grid capacity-related costs
Avoided externality costs
Costs
Benefits
Costs
Benefits
Participant Cost Test (PCT)Purchase of heat output of CHP
Purchase of electric output of CHP
Avoided thermal boiler fuel costs
Avoided electricity costs
Societal Cost Test (SCT)Project development costs
Management costs
Incentive
CHP fuel costs
CHP non-fuel operating costs
CHP capital costs
Avoided thermal boiler fuel costs
Avoided power grid fuel costs
Avoided power grid non-fuel O&M costs
Avoided power grid capacity-related costs
Avoided externality costs
Benefits
Costs
Benefits
Costs

171 | P a g e COMM-20130522-67922 | July 2014
Each cost-effectiveness test compares the Net Present Value (NPV) of the annual costs and benefits
over the life of an efficiency measure or program. In NPV analysis, a long-term stream of annual
costs and benefits are discounted based on a discount rate. The discount rate indicates the time
value of money, which can be different for the various stakeholders (participant and society). The
discount rate is necessary because a dollar today is worth more than a dollar one year from now,
depending on an entity’s Weighted Average Cost of Capital. Further, each category of costs and
benefits may be projected to escalate at different rates over the analysis period. Values for key
parameters used in the cost-benefit tests are provided in Table 46 .
Table 46. Parameter Values for Cost-Benefit Tests
Sources:
Discount rates: PCT = 6 year simple payback, RIM = utility WACC; SCT = Average 20 year AA rated municipal
general obligation bond interest rate as of July 29, 2014
Escalation rates: Natural gas and electricity -- EIA AEO 2013 West Central region projections for nominal prices
of natural gas and electricity (average of commercial and industrial); Non-fuel operating costs -- difference
between nominal and constant dollar projections for EIA AEO 2013 West Central region price projections; GHG
-- twice the natural gas rate
The Cost-Benefit analyses did not account for CIP performance incentives42 that utilities might earn
by exceeding CIP goals. We have made the simplifying assumption that effective policy action on CHP
in CIP will require new legislation and that the issue of bonus incentives can be addressed at that
time.
Avoided Costs of Power Generation
In response to information requests from the Minnesota Department of Commerce regarding
avoided costs of electricity generation, Xcel and Minnesota Power submitted the data summarized in
Table 47.
42 See Minnesota Statutes 216B.241 Subdv. 2c.
Discount Rates (nominal)
PCT 15.78%
SCT 3.45%
Escalation Rates (nominal)
Natural Gas 3.75%
Electricity 2.20%
Non-fuel operating costs 1.76%
GHG emission reduction value 7.50%
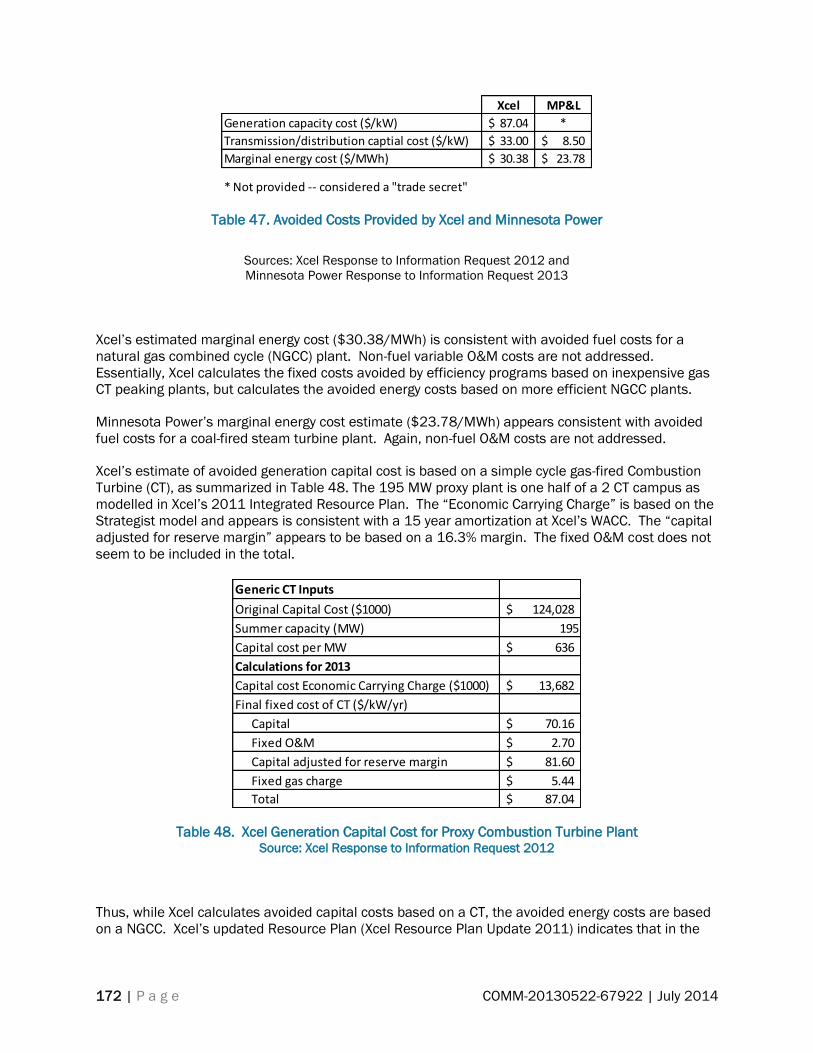
172 | P a g e COMM-20130522-67922 | July 2014
Table 47. Avoided Costs Provided by Xcel and Minnesota Power
Sources: Xcel Response to Information Request 2012 and
Minnesota Power Response to Information Request 2013
Xcel’s estimated marginal energy cost ($30.38/MWh) is consistent with avoided fuel costs for a
natural gas combined cycle (NGCC) plant. Non-fuel variable O&M costs are not addressed.
Essentially, Xcel calculates the fixed costs avoided by efficiency programs based on inexpensive gas
CT peaking plants, but calculates the avoided energy costs based on more efficient NGCC plants.
Minnesota Power’s marginal energy cost estimate ($23.78/MWh) appears consistent with avoided
fuel costs for a coal-fired steam turbine plant. Again, non-fuel O&M costs are not addressed.
Xcel’s estimate of avoided generation capital cost is based on a simple cycle gas-fired Combustion
Turbine (CT), as summarized in Table 48. The 195 MW proxy plant is one half of a 2 CT campus as
modelled in Xcel’s 2011 Integrated Resource Plan. The “Economic Carrying Charge” is based on the
Strategist model and appears is consistent with a 15 year amortization at Xcel’s WACC. The “capital
adjusted for reserve margin” appears to be based on a 16.3% margin. The fixed O&M cost does not
seem to be included in the total.
Table 48. Xcel Generation Capital Cost for Proxy Combustion Turbine Plant Source: Xcel Response to Information Request 2012
Thus, while Xcel calculates avoided capital costs based on a CT, the avoided energy costs are based
on a NGCC. Xcel’s updated Resource Plan (Xcel Resource Plan Update 2011) indicates that in the
Xcel MP&L
Generation capacity cost ($/kW) 87.04$ *
Transmission/distribution captial cost ($/kW) 33.00$ 8.50$
Marginal energy cost ($/MWh) 30.38$ 23.78$
* Not provided -- considered a "trade secret"
Generic CT Inputs
Original Capital Cost ($1000) 124,028$
Summer capacity (MW) 195
Capital cost per MW 636$
Calculations for 2013
Capital cost Economic Carrying Charge ($1000) 13,682$
Final fixed cost of CT ($/kW/yr)
Capital 70.16$
Fixed O&M 2.70$
Capital adjusted for reserve margin 81.60$
Fixed gas charge 5.44$
Total 87.04$

173 | P a g e COMM-20130522-67922 | July 2014
2018-2025 period, 1,829 MW of additional generation capacity will be required, of which 53 percent
will be CT, 40 percent will be NGCC and the remainder purchased capacity from Manitoba Hydro.
What are the avoided electricity costs resulting from CHP generation? This is a complex question
due to the range of utilities and the related issues:
Current mix of power plant fuels and efficiencies;
Potential changes in the power plant mix due to –
o Additional capacity needed to meet future demand,
o Impact of air quality regulations, particularly regional haze impacts on Sherco, and
o Impact of EPA regulations on GHG emissions; and
Future changes in fuel costs.
For the purpose of this statewide study, the avoided cost assumptions summarized in Table 49 will
be used to estimate the potential benefits from new CHP capacity which can be operated at a high
capacity factor. These calculations are based on the following assumptions:
EPA GHG regulations and air quality regulatory impacts will result in reduced capacity and
production by coal-fired plants in Minnesota;
Additional capacity will be required which will be a mix of NGCC and CT;
CHP will be competing more with NGCC than with CT relative to dispatch;
Not all CHP will be dispatchable at full capacity at under peak grid demand conditions, and
thus the capacity credit for CHP will be less than the full avoided capacity cost of NGCC.
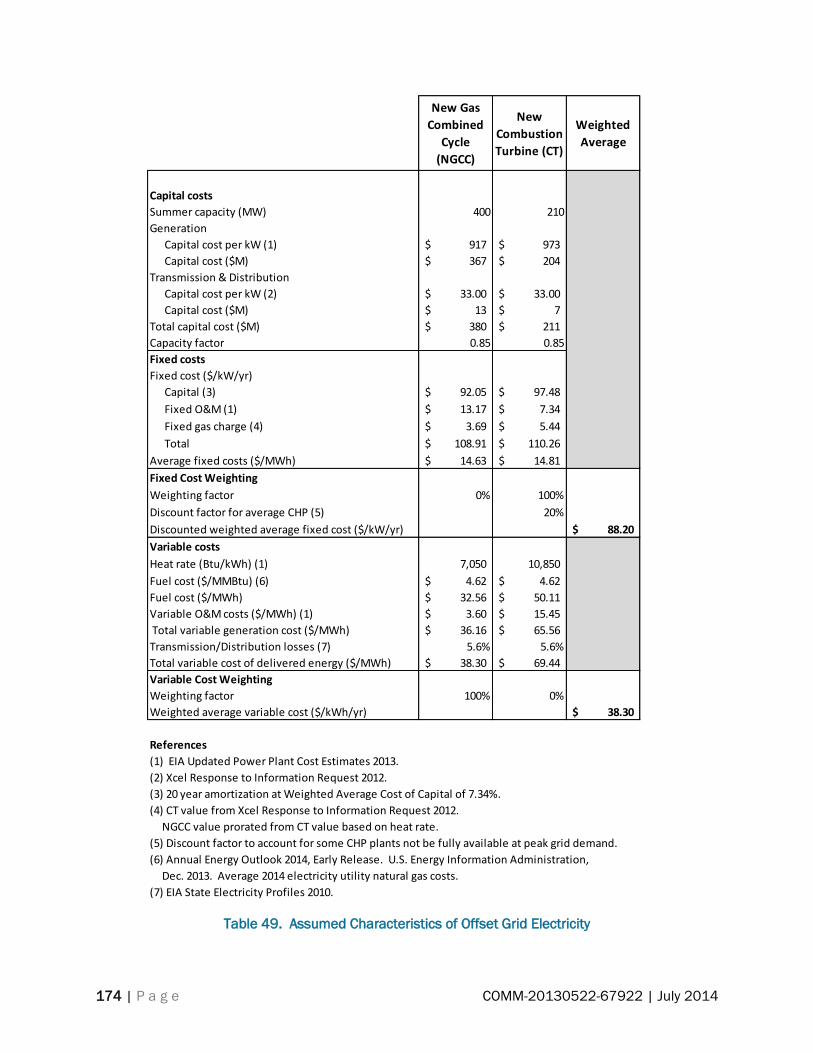
174 | P a g e COMM-20130522-67922 | July 2014
Table 49. Assumed Characteristics of Offset Grid Electricity
New Gas
Combined
Cycle
(NGCC)
New
Combustion
Turbine (CT)
Weighted
Average
Capital costs
Summer capacity (MW) 400 210
Generation
Capital cost per kW (1) 917$ 973$
Capital cost ($M) 367$ 204$
Transmission & Distribution
Capital cost per kW (2) 33.00$ 33.00$
Capital cost ($M) 13$ 7$
Total capital cost ($M) 380$ 211$
Capacity factor 0.85 0.85
Fixed costs
Fixed cost ($/kW/yr)
Capital (3) 92.05$ 97.48$
Fixed O&M (1) 13.17$ 7.34$
Fixed gas charge (4) 3.69$ 5.44$
Total 108.91$ 110.26$
Average fixed costs ($/MWh) 14.63$ 14.81$
Fixed Cost Weighting
Weighting factor 0% 100%
Discount factor for average CHP (5) 20%
Discounted weighted average fixed cost ($/kW/yr) 88.20$
Variable costs
Heat rate (Btu/kWh) (1) 7,050 10,850
Fuel cost ($/MMBtu) (6) 4.62$ 4.62$
Fuel cost ($/MWh) 32.56$ 50.11$
Variable O&M costs ($/MWh) (1) 3.60$ 15.45$
Total variable generation cost ($/MWh) 36.16$ 65.56$
Transmission/Distribution losses (7) 5.6% 5.6%
Total variable cost of delivered energy ($/MWh) 38.30$ 69.44$
Variable Cost Weighting
Weighting factor 100% 0%
Weighted average variable cost ($/kWh/yr) 38.30$
References
(1) EIA Updated Power Plant Cost Estimates 2013.
(2) Xcel Response to Information Request 2012.
(3) 20 year amortization at Weighted Average Cost of Capital of 7.34%.
(4) CT value from Xcel Response to Information Request 2012.
NGCC value prorated from CT value based on heat rate.
(5) Discount factor to account for some CHP plants not be fully available at peak grid demand.
(6) Annual Energy Outlook 2014, Early Release. U.S. Energy Information Administration,
Dec. 2013. Average 2014 electricity utility natural gas costs.
(7) EIA State Electricity Profiles 2010.

175 | P a g e COMM-20130522-67922 | July 2014
References ACEEE Scorecard. “The 2013 State Energy Efficiency Scorecard.” American Council for an
Energy-Efficient Economy. 2013.
Andersen, Anders N. and Peter Sorknæs. 2011. “Next generation CHP to balance intermittent
production from renewables.” Cogeneration & On-site Power Production. January 7.
http://www.cospp.com/articles/print/volume-12/issue-4/features/next-generation-chp-to-
balance-intermittent-production-from-renewables.html.
Anderson and Geckil, 2003. Anderson, Patrick L. and Ilhan K, Geckil, “Northeast Blackout Likely
to Reduce US Earnings by $6.4 Billion,” AEG Working Paper 2003-2, August 19, 2003.
Breger, Dwayne. 2011. “Massachusetts Policies for Combined Heat and Power (CHP),”
Massachusetts Department of Energy Resources. Presentation to the U.S. Clean Heat and Power
Association Spring CHP Forum. May 5.
Casten, Thomas. 2012. “Not all megawatts are created equal,” Cogeneration and On-site Power
Production. January 7. http://www.cospp.com/articles/print/volume-13/issue-4/features/not-
all-megawatts-are-created-equal.html.
Center for Sustainable Energy website. http://energycenter.org/self-generation-incentive-
program/business/technologies/chp
Chittum and Farley 2013. Utilities and the CHP Value Proposition. American Council for an
Energy-Efficient Economy. Report IE134, Washington, DC: July. http://aceee.org/research-
report/ie134.
Chittum 2013a. “How Electric Utilities Can Find Value in CHP.” American Council for an Energy-
Efficient Economy. July 2013.
Chittum 2013b. “How Natural Gas Utilities Can Find Value in CHP.” American Council for an
Energy-Efficient Economy. July 2013.
CNN Money 2012. “Sandy's hit to the economy” by Chris Isidore @CNNMoney October 29, 2012.
http://money.cnn.com/2012/10/29/news/economy/hurricane-sandy-business/index.html
Connecticut Department of Public Utility Control 2007. Department of Public Utility Control
Investigation into the Need for Interconnection Standards for Distributed Generation – 2007
Revisions, Docket No. 03-01-15RE01, December 5, 2007.
http://www.dpuc.state.ct.us/FINALDEC.NSF/0d1e102026cb64d98525644800691cfe/a6ac34
c9193a8f99852573a8006f661b/$FILE/030115RE01-120507.doc
Connecticut Public Act 2007. No. 07-242, An Act Concerning Electricity and Energy Efficiency.
House Bill No. 7432. State of Connecticut. June 4. http://www.cga.ct.gov/2007/act/pa/2007pa-
00242-r00hb-07432-pa.htm.
Cuttica 2014. Personal communication with John Cuttica of the Energy Resources Center, July
18, 2014.
DOE 2012. “Combined Heat and Power, A Clean Energy Solution.” U.S. Department of Energy
and U.S. Environmental Protection Agency. August 2012.

176 | P a g e COMM-20130522-67922 | July 2014
DSIRE. “Database of State Incentives for Renewables & Efficiency.” Accessed September 2013.
http://www.dsireusa.org/.
Eaton, Gillian. 2013. (Vermont Energy Investment Corporation). Personal communication with
Anna Chittum, ACEEE. April 11, 2013.
EIA AEO 2014. Annual Energy Outlook 2014, Early Release. U.S. Energy Information
Administration, Dec. 2013.
EIA AEO 2013 West Central. Annual Energy Outlook 2013, U.S. Energy Information
Administration. Detailed real and nominal price projections for West Central region.
EIA 2012. “How much electricity is lost in transmission and distribution in the United States?”
U.S. Energy Information Administration. http://www.eia.gov/tools/faqs/faq.cfm?id=105&t=3.
EIA Electricity Data. U.S. Energy Information Administration.
http://www.eia.gov/electricity/capacity/
EIA NEMS Model 2013. “The Electricity Market Module of the National Energy Modeling System
Model Documentation 2013.” U.S. Energy Information Administration. July 2013.
EIA State Data 2011. “State Energy Data 2011: Prices and Expenditures.” U.S. Energy
Information Administration.
EIA State Rankings. U.S. Energy Information Administration.
http://www.eia.gov/state/rankings/?sid=MN#series/12
EIA State Electricity Profiles 2010. “State Electricity Profiles 2010.” U.S. Energy Information
Administration, DOE/EIA-0348(01)/2, January 27, 2012.
http://www.eia.gov/electricity/state/pdf/sep2010.pdf
EIA Updated Power Plant Cost Estimates 2013. “Updated Capital Cost Estimates for Utility Scale
Electricity Generating Plants.” U.S. Energy Information Administration, April 2013.
Elliott, Chittum, Trombley and Watson. “CHP Savings and Avoided Emissions in Portfolio
Standards.” American Council for an Energy-Efficient Economy, 2009.
Energy Resources Center 2014. “Analysis of Standby Rates and Net Metering Policy Effects on
Combined Heat and Power (CHP) Opportunities in Minnesota.” Prepared For Minnesota
Department of Commerce Division of Energy Resources.” COMM-03192012-59974, April 2014.
EPA CHPP database. “dCHPP (CHP Policies and Incentives database).” U.S. Environmental
Protection Agency. http://www.epa.gov/chp/policies/database.html.
EPA CHP Program website. U.S. Environmental Protection Agency Combined Heat and Power
Program http://www.epa.gov/chp/policies/standards.html
EPA 2009. “Standby Rates for Customer-Sited Resources: Issues, Considerations and the
Elements of Model Tariffs.” U.S. Environmental Protection Agency. Dec. 2009.
EPRI 2001. “The Cost of Power Disturbances to Industrial & Digital Economy Companies.”
Consortium for Electric Infrastructure to Support a Digital Society (CEIDS), An Initiative by EPRI

177 | P a g e COMM-20130522-67922 | July 2014
and the Electricity Innovation Institute. June 2001.
Federal Register April 13, 2012. Federal Register, Vol. 77, No. 72, April 13, 2012. U.S.
Environmental Protection Agency, Standards of Performance for Greenhouse Gas Emissions for
New Stationary Sources: Electric Utility Generating Units, Proposed Rule. 40 CFR Part 60, EPA–
HQ–OAR–2011–0660; FRL–9654–7, RIN 2060–AQ91.
Federal Register June 18, 2014. Federal Register, Vol. 79, No. 117, June 18, 2014. U.S.
Environmental Protection Agency, Carbon Pollution Emission Guidelines for Existing Stationary
Sources: Electric Utility Generating Units, Proposed Rule. 40 CFR Part 60, EPA–HQ–OAR–2011–
0660; FRL–9654–7, RIN 2060–AQ91.
FMS Bonds. http://www.fmsbonds.com/Market_Yields/index.asp
FVB Energy and ICF International 2014. Assessment of the Technical and Economic Potential for
CHP in Minnesota, for the Minnesota Department of Commerce, COMM-20130522-67922. July
2014.
H.F. 729. Minnesota House File 729 Fourth Engrossment, Article 12, Section 8.
House Research 2013. House Research Bill Summary, File Number H.F. 729, May 15, 2013.
ICF CHP Database. Data maintained and periodically updated by ICF International.
ICF 2003. “The Economic Cost of the Blackout: An Issue Paper on the Northeastern Blackout.”
ICF Consulting. August 14, 2003.
ICF, 2010. “Effect of a 30 Percent Investment Tax Credit on the Economic Market Potential for
Combined Heat and Power.” ICF International. 2010.
http://www.uschpa.org/files/public/USCHPA%20WADE_ITC_Report_FINAL%20v4.pdf
ICF, 2012. “Combined Heat and Power: Policy Analysis and 2011-2030 Market Assessment.” ICF
International. Prepared for California Energy Commission. Feb. 2012.
ICF 2013. “Combined Heat and Power: Enabling Resilient Energy Infrastructure for Critical
Facilities.” ICF International. Prepared for Oak Ridge National Laboratory. March 2013.
DCEO website. Illinois Department of Commerce and Economic Opportunity website
http://www.illinois.gov/dceo/whyillinois/KeyIndustries/Energy/Pages/CHPprogram.aspx
Kolwey 2012. “Calculating Net Electricity Savings from Utility-Supported CHP Projects.”
Southwest Energy Efficiency Project. Neil Kowley. August 2012.
Lawrence Livermore Laboratory. https://flowcharts.llnl.gov/
Lazar, Jim. 2011. “Line Losses and Reserves: Often Undervalued Benefits of Energy Efficiency
Investments.” ACEEE Energy Efficiency as a Resource Conference. September 27, 2011.
Lipman, Tim. 2013. Pacific Clean Energy Application Center. Personal communication with Anna
Chittum of ACEEE. March 15, 2013.
Massachusetts Session Laws 2008.
178 | P a g e COMM-20130522-67922 | July 2014
http://www.malegislature.gov/Laws/SessionLaws/Acts/2008/Chapter169
MCCAG 2012. “Minnesota Climate Change Advisory Group, A Report to the Minnesota
Legislature.” Minnesota Climate Change Advisory Group, April 2008.
MPCA 2012. “Greenhouse Gas Emissions in Minnesota: 1970 – 2008 Second Biennial Progress
Report - Technical Support Document.” Minnesota Pollution Control Agency. January, 2012.
MPCA 2003. “Minnesota Climate Change Action Plan: A Framework for Climate Change Action.”
Minnesota Pollution Control Agency. February 2003.
Minnesota Department of Commerce website.
http://mn.gov/commerce/energy/topics/conservation/How-CIP-Works.jsp
Minnesota Department of Commerce 2013. “Minnesota Conservation Improvement Program
Energy and Carbon Dioxide Savings Report for 2010-2011.” Prepared pursuant to Minnesota
Statutes §216B.241, subd. 1c(g). Minnesota Department of Commerce, Division of Energy
Resources. Oct. 1, 2013.
Minnesota Energy Savings Goal Study. “Energy Savings Goal Study, Post Date Oct. 8, 2013.”
Minnesota Department of Commerce, Division of Energy Resources.
(http://mn.gov/commerce/energy/images/CHP-Outline_version%207_Burdette_Final.pdf
Minnesota Power Response to Information Request 2013. Electronic Filing in response to
Department of Commerce Information Request, Docket No. E015/CIP-13-409. Minnesota
Power, July 17, 2013.
Minnesota Public Utilities Commission 2014. Minnesota Public Utilities Commission, Findings of
Fact, Conclusions, and Order, Docket No. G-008/GR-13-316, June 9, 2014.
National Action Plan for Energy Efficiency (2008). Understanding Cost-Effectiveness of Energy
Efficiency Programs: Best Practices, Technical Methods, and Emerging Issues for Policy-Makers.
Energy and Environmental Economics Inc. and Regulatory Assistance Project.
(www.epa.gov/eeactionplan)
Navigant 2011. “Process and Impact Evaluation of Efficiency Vermont’s 2007-2009
Geotargeting Program.” Navigant Consulting, Inc. January 7, 2011.
http://publicservice.vermont.gov/sites/psd/files/Topics/Energy_Efficiency/EVT_Performance_Ev
al/Navigant_Vermontpercent20GeoTargeting%202010%20Process%20%20Impact%20Evaluati
on%20FINAL%20.pdf.
NJBPU 2012. New Jersey Board of Public Utilities. Docket No. GO12070600. July 18.
http://www.njcleanenergy.com/files/file/Board%20Orders/Board%20Order%20-
%20Standby%20Charges%207-18-12-2F.pdf.
NRDC/OEC 2012. “White Paper on Implementing the Combined Heat and Power and Waste Heat
Recovery Provisions of Revised Code Sections 4928.64 & 4928.66.” Dylan Sullivan (NRDC) and
Trish Demeter (OEC), April 2012.
NYSERDA 2013. “Combined Heat and Power Performance Program. Program Opportunity Notice
2701.” New York State Energy Research and Development Authority.
http://www.nyserda.ny.gov/-
179 | P a g e COMM-20130522-67922 | July 2014
/media/Files/FO/Current%20Funding%20Opportunities/PON%202701/2701alldoc.pdf.
Accessed September 22.
Ormat. http://www.ormat.com/organic-rankine-cycle
ORNL 2013. “Combined Heat and Power: Enabling Resilient Energy Infrastructure for Critical
Facilities.” ICF International, Prepared for Oak Ridge National Laboratory. March 2013.
Oregon Legislative Assembly. 2013. Senate Bill 844.
http://landru.leg.state.or.us/13reg/measures/sb0800.dir/sb0844.en.html.
Parks 2003. “Transforming the Grid to Revolutionize Electric Power in North America.” Edison
Electric Institute’s Fall 2003 Transmission, Distribution and Metering Conference, Bill Parks, U.S.
Department of Energy. October 13, 2003.
Pielli and Wickwire, 2013. “Boiler MACT Update: Final Major Source Rule and Opportunities for
CHP.” Katrina Pielli, U.S. Department of Energy, and Susan Wickwire, U.S. Environmental
Protection Agency. District Energy magazine. Fourth Quarter 2013.
Primen 2003. “Primen’s 2003 Distributed Energy Market Survey.”
Property Tax Administrator’s Manual. “Minnesota Property Tax Administrator’s Manual, Exempt
Property, Module #5.”
Russell and Young, 2012. “Understanding Industrial Investment Decision-Making, American
Council for an Energy-Efficient Economy.” American Council for an Energy-Efficient Economy,
Report IE124. Oct. 2012, http://aceee.org/research-report/ie124.
Rutgers 2013. “Rutgers Regional Report, The Economic and Fiscal Impacts of Hurricane Sandy in
New Jersey.” January 2013.
Spurr and Larsson 1996. “Integrating District Cooling with Combined Heat and Power.”
International Energy Agency Programme of Research, Development and Demonstration on
District Heating and Cooling including the integration of CHP, Report 1996:N1, ISBN 90-72130-
87-1.
United States Code 26 USC 45. United States Code, Title 26, Subtitle A, Chapter 1, Subchapter
A, Part IV, Subpart D, Section 45.
United States Code 26 USC 48. United States Code, Title 26, Subtitle A, Chapter 1, Subchapter
A, Part IV, Subpart D, Section 48.
Williams 2012. “Considerations for Incorporating CHP and WER into Utility Energy Efficiency
Programs in Ohio.” Jon Williams. American Electric Power. Presentation to Ohio CHP/Waste
Energy Recovery Coalition. July 18, 2012.
Xcel Resource Plan 2010. “Application for Resource Plan Approval 2011 – 2025, Application
Docket Number: E002/RP-10-___.” Northern States Power Company-Minnesota, an Xcel Energy
Company. Aug. 2, 2010.
Xcel Resource Plan Update 2011. “Resource Plan Update, Docket Number: EOO2/RP-10-825.”
Northern States Power Company-Minnesota, an Xcel Energy Company. Dec. 1, 2011.

180 | P a g e COMM-20130522-67922 | July 2014
Xcel Response to Information Request 2012. Electronic Filing in response to Division of Energy
Resource Information Request, Docket No. E, G002/CIP-12-447. Northern States Power
Company-Minnesota, an Xcel Energy Company. July 23, 2012.
Ycharts. http://ycharts.com/companies/XEL/return_on_equity