T H E I N T E R C O N N E C T I O N B E T W E E N T H E M ...

E N H A N C E D O I L R E C O V E R Y I N S T I T U T E
Minnelusa
Core Analysis and Evaluation Project
07/26/2012 Laramie, Wyoming
Reza Barati
Collaborative work of EORI with the Minnelusa Consortium and C&PE faculty members, Professors:
Alvarado, Morrow and Piri
Prepared for The EOR Commission and Technical Advisory Board Meeting
E N H A N C E D O I L R E C O V E R Y I N S T I T U T E
Outline
• Introduction
• Objectives
• Core protocol
• Thin section analysis
• Water and oil properties
• Wettability index measurement, low salinity and sequential water flooding
• Relative permeability measurements
• Capillary pressure measurements
• Summary
• Future work
• Acknowledgements
2
E N H A N C E D O I L R E C O V E R Y I N S T I T U T E
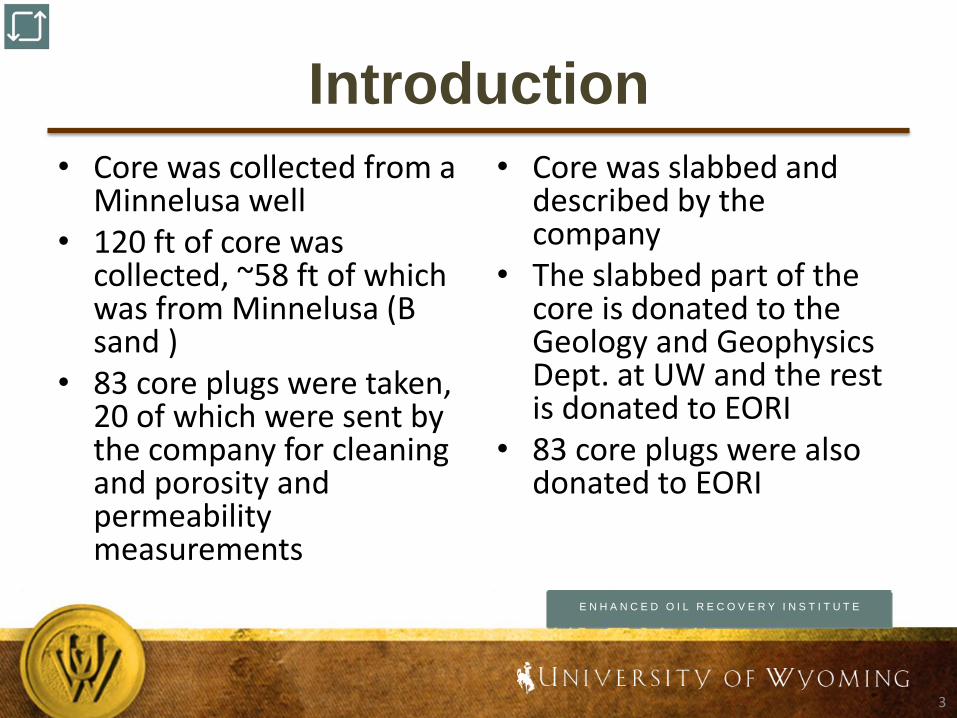
Introduction
• Core was collected from a Minnelusa well
• 120 ft of core was collected, ~58 ft of which was from Minnelusa (B sand )
• 83 core plugs were taken, 20 of which were sent by the company for cleaning and porosity and permeability measurements
• Core was slabbed and described by the company
• The slabbed part of the core is donated to the Geology and Geophysics Dept. at UW and the rest is donated to EORI
• 83 core plugs were also donated to EORI
3

E N H A N C E D O I L R E C O V E R Y I N S T I T U T E
Objectives
• Improve the geological model of this field by measuring rock properties like porosity and permeability
• Generate Special Core Analysis (SCAL) for core plugs representative of different observed lithological-facies for this well to improve reservoir descriptions and simulations for this field and other Minnelusa fields
• Evaluate future application of EOR/IOR in this field and other Minnelusa fields
• Provide consortium with a valuable set of data for Minnelusa
4

E N H A N C E D O I L R E C O V E R Y I N S T I T U T E
Core Analysis Protocol
• Core plugs scanned
• Thin section analysis
• Cleaning the plugs:
– 6 plugs were flushed and extraction was used for the rest
• Selection of core plug triplicates for different lithofacies (three)
• Core plugs representative of each zone distributed between the groups
• Core plugs saturated and aged in brine for 10 days
• Oil flood to establish irreducible water saturation
• Age at 94 °C for 30 days
5

E N H A N C E D O I L R E C O V E R Y I N S T I T U T E
Core Analysis Protocol, cont’d
6
Pore network modeling
Pc for law salinity and
high salinity floods
AP, ASP and A blends for
EOR core flooding tests
Optimize the use of alkali
to reduce precipitation of
scales
Anhydrite dissolution
effect on water
flooding
Unsteady-state
relative permeability

E N H A N C E D O I L R E C O V E R Y I N S T I T U T E
Thin Section Analysis
Anhydrite cemented SS (#1-110, kHe=0.225 mD, f=7.7 %)
Anhydrite nodules (#1-83)
Fig.1 Thin section analysis done by Peigui Yin: The LHS image shows the anhydrite cemented SS and the RHS image shows the anhydrite nodules observed in some core plugs. Black spots are oil stained dolomite cement.
7

E N H A N C E D O I L R E C O V E R Y I N S T I T U T E
Thin Section Analysis, cont’d
Dolomite cement (#1-64, kHe=0.069 mD, f=3.5%)
Sandy dolomite (#1-63)
Fig.2 Thin section analysis done by Peigui Yin: The LHS image shows the sandstone with dolomite cement and the RHS image shows the sandy dolomite observed in some core plugs
8

E N H A N C E D O I L R E C O V E R Y I N S T I T U T E
Thin Section Analysis, cont’d
Permeable SS (#1-74, kHe=280.5 mD, f=23.7%)
Fig.3 Thin section analysis done by Peigui Yin: A permeable SS observed in some of the core plugs
9

E N H A N C E D O I L R E C O V E R Y I N S T I T U T E
Thin Section Analysis, cont’d

E N H A N C E D O I L R E C O V E R Y I N S T I T U T E
Porosity and Permeability Measurements
11 Fig.5 Gas porosity and permeability (Morrow’s group) and
shifter sonic log vs. depth
Fig.6 a) Porosity-average CT# correlations for 20 cleaned core plugs (red squares) and 53 uncleaned core plugs (green
triangles). b) Core porosity vs. sonic transit time.

E N H A N C E D O I L R E C O V E R Y I N S T I T U T E
Water Properties
12
Cations and anions
Water analysis report (mg/L)
Used in the experiments (mg/L)
Na 17646 20805.9 K 756.1 756.1
Ca 626.8 626.8
Mg 162.2 162.2 Ba 0.22 0 Sr 19.2 19.2 Fe 32.3 0
Mn 0.13 0 Si 44.6 0
SO4 2876.1 2876.1
Cl 34769 32244.9 HCO3 558.8 0 TDS 57491.2 57491.2 pH 7 7.42
Density (g/cm3) 1.0244
Viscosity, cP 0.55
Surface tension, mN/m 70.2
IFT against crude oil, mN/m 20.3
Table 1 Water composition of the produced brine and the brine used in the experiments .
Table 2 Brine density, viscosity and surface tension measured at 60 °C (Morrow’s group)

E N H A N C E D O I L R E C O V E R Y I N S T I T U T E
Crude Oil Properties
13
0.008
0.08
1 10 100
Vis
cosi
ty,
Pa.
s
Shear rate, s-1
25 C
35 C
45 C
55 C
65 C
75 C
85 C
95 C
Sample
No.
Crude oil
(gr)
n-heptane
(cc)
Asphaltene content of
crude oil (%)
1 1.00 40 6.57
2 1.00 40 6.43
Average 6.50
Density (g/cm3) 0.8787
Surface tension, mN/m 26
Table 3 Asphaltene content of the crude oil (Piri’s group) Table 4 Crude oil density and surface tension measured at 60 °C (Morrow’s group)
Fig.7 Crude oil viscosity versus shear rate at 25-95 C (Alvarado’s group)

E N H A N C E D O I L R E C O V E R Y I N S T I T U T E
Wettability Index Measurements
14
Core 86b Core 84b Core 79b
received solvent-cleaned core
received uncleaned/as is
measure dry properties
saturate with brine;pressurize to 1000 psi with brine for 2+ hours;
soak in brine for 10 days @95°C & 15 psig;cool to room temperature;
measure brine-saturated properties;
saturate with oil;pressurize to 1000 psi with oil for 12+
hours
measure oil permeability;age with crude oil at 95°C & 1000 psig for 30+ days;
cooled to 60°C then set for imbibition;heated to 95°C for imbibition (2 months);
cooled to 60°C then waterflood for about 90cm3 at 2 cm3/min
solvent-clean with alternating toluene and methanol flooding until effluent is clear (very light yellow tint is possible after 20 PV flooding but
accepted as clear enough)
measure dry properties
core 86B core 84b Core 79b
Initial condition cleaned uncleaned uncleaned
Dry properties :
porosity (by helium)
Klinkenberg permeability @20°C
18.6%
117.4 mD
12.3%
n/a
12.3%
n/a
Brine-saturated properties:
porosity
permeability @20°C
16.2%
111.5 mD
10.5%
2.0 mD
Oil-saturated properties:
porosity
permeability @20°C
12.6%
~6.5-7.9 mD
Initial-water properties:
Swi
oil permeability @20°C
oil permeability @60°C
20.5%
~20-42 mD
~65-85 mD
18.8% (?)
5.8 mD
~6.0-7.2
~0% (?)
~6.5-7.9 mD
~17-25 mD
Imbibition test:
oil produced during imbibition
oil produced during waterflood
index (Iw)
2.05 cm3
5.65 cm3
0.27
2.00 cm3
2.55 cm3
0.44
2.35 cm3
6.30 cm3
0.27
Dry properties :
porosity (by helium)
Klinkenberg permeability @20°C
18.3%
124.1 mD
17.2%
154.2 mD
17.5%
108.0 mD
Fig.8 Wettability index measurement procedure (Morrow’s group) Table 5 Wettability index measurement results (Morrow’s group)

E N H A N C E D O I L R E C O V E R Y I N S T I T U T E
Wettability Index Measurements,
cont’d
15
𝑡𝐷 =2
𝐿𝑐2𝐾
𝜑
𝜎
𝜇𝑤 1 +𝜇𝑜
𝜇𝑤
Fig.9 Oil recovery caused by spontaneous imbibition versus dimensionless time (Morrow’s group)
Fig.10 Oil recovery caused by forced imbibition and pressure drop versus PV of injected brine (Morrow’s group)

E N H A N C E D O I L R E C O V E R Y I N S T I T U T E
Core 86b Core 84b Core 79b
measure dry properties
saturate with brine;pressurize to 1000 psi with brine for 2+ hours;
soak in brine for 10 days @95°C & 15 psig;cool to room temperature;
measure brine-saturated properties;
saturate with oil;pressurize to 1000 psi with oil for 12+
hours
cooled to 60°C then set for imbibition;heated to 95°C for imbibition (2 months);
cooled to 60°C then waterflood for about 90 cm3 at 2 cm3/min
solvent-clean with alternating toluene and methanol flooding until effluent is clear (very light yellow tint is possible after 20 PV flooding but
accepted as clear enough)
measure dry properties
measure oil permeability;age with crude oil at 95°C & 1000 psig for 30+ days;
secondary waterflood with brine; tertiary
waterflood with 20x diluted brine;re-establish Swi by oil flooding and re-
waterflood with diluted brine (5
consecutive times)
core 86B core 84b Core 79b
Initial condition: re-cleaned cleaned cleaned
Dry properties:
porosity (by helium)
Klinkenberg permeability @20°C
18.3%
124.1 mD
17.2%
154.2 mD
17.5%
108.0 mD
Brine-saturated properties:
porosity
permeability @20°C
17.2%
105.0 mD
15.0%
92.4 mD
Oil-saturated properties:
porosity
permeability @20°C
17.4%
~15.4-18.4 mD
Initial-water properties:
Swi
oil permeability @20°C
oil permeability @60°C
30.0%
~19-20 mD
~31-53 mD
23.2%
~25-29 mD
~72-82
0%
~15.4-18.4 mD
~32-33 mD
Waterflood test:
oil produced during secondary WF
oil produced during tertiary WF
Sor,SWF1Swi,SWF2
oil produced during SWF2
Sor,SWF2Swi,SWF3
oil produced during SWF3
Sor,SWF3Swi,SWF4
oil produced during SWF4
Sor,SWF4Swi,SWF5
oil produced during SWF5
Sor,SWF5Swi,SWF6
oil produced during SWF6
Sor,SWF6
7.85 cm3
0.125 cm3
15.5%51.9%
4.975 cm3
14.2%54.8%
4.825 cm3
12.3%59.2%
4.8 cm3
8.0%62.1%
4.8 cm3
5.1%62.6%
4.85 cm3
4.3%
Imbibition test
oil produced during imbibition
oil produced during waterflood
index (Iw)
0.55 cm3
5.60 cm3
0.09
1.02 cm3
6.05 cm3
0.14
Low Salinity and Sequential Water-Flooding Results
Fig.11 Low salinity and sequential waterflooding procedures (Morrow’s group)
Table 5 Low salinity and sequential waterflooding results (Morrow’s group)

E N H A N C E D O I L R E C O V E R Y I N S T I T U T E
Low Salinity and Sequential
Water-Flooding, cont’d
17
Fig.12 Residual oil saturation after different cycles of sequential waterflooding (Morrow’s group)
Fig.13 Initial water saturation after different cycles of sequential waterflooding (Morrow’s group)

E N H A N C E D O I L R E C O V E R Y I N S T I T U T E
Relative Permeability Measurement Setup
18
Fig.14 HPHT relative permeability measurement setup. L) HT ovens. M) 2-liter accumulators. R) HT cells and Qizix pumps. (Piri’s
group)

E N H A N C E D O I L R E C O V E R Y I N S T I T U T E
Relative Permeability Measurement Setup, cont’d
19
Fig.15 HPHT relative permeability measurement setup. L) core flooding setup. M) HT cells and Qizix pumps. R) Back pressure
regulator. (Piri’s group)

E N H A N C E D O I L R E C O V E R Y I N S T I T U T E
Relative Permeability Measurements
• Core# 1-100b:
– Kair= 112 mD
– Near zero pressure drop after saturating and aging with brine
20
• Core#1-98b:
– Kbrine=95.39 mD
– Kair=69.5 mD
Fig.16 CT scan image of core#1-100b (Piri’s group)
Fig.17 Water permeability measurement for core#98b (Piri’s group)

E N H A N C E D O I L R E C O V E R Y I N S T I T U T E
Capillary Pressure Measurements-
Setup • The CPCS -355Z Reservoir
Condition Capillary Pressure system measures drainage and imbibition capillary pressure in conjunction with electrical resistivity measurements using 2T and 4T electrode configurations at 5 different frequencies
• The system uses a membrane technique with an upstream oil-wet membrane and a downstream water-wet membrane
21
Fig.18 CPCS -355Z Reservoir Condition Capillary Pressure system (Alvarado’s group)

E N H A N C E D O I L R E C O V E R Y I N S T I T U T E
Capillary Pressure Measurements- Procedure
• Pump B is connected to the upstream end to drive oil injection during drainage and pump A controls the downstream pressure
• During imbibition, pump B acts as back-pressure control and pump A injects water from the reservoir
• Resistivity is measured at 100 Hz, 1 kHz, 10 kHz, 20 kHz and 100 kHz and manually collected due to instrumentation problem, so the data will show gaps
• All the pressure and volume data are collected automatically and as frequently as several times a minute
22

E N H A N C E D O I L R E C O V E R Y I N S T I T U T E
Capillary Pressure Measurements- Primary Drainage
• Core#1-115: – L: 36.68mm
– D: 37.86mm
– Absolute Permeability: 66.95mD
– Porosity: 15.61%
– Pore Volume: 6.45cc
23
Fig.19 CT scan image of core#1-115 (Piri’s group)
Fig.20 Primary drainage capillary pressure and resistance measurement for core#1-115 at reservoir pressure and
temperature (Alvarado’s group)

E N H A N C E D O I L R E C O V E R Y I N S T I T U T E
Capillary Pressure Measurements- Primary Drainage, cont’d
24
Sw Pc, psi
0.392 1.35
0.321 1.65
0.271 1.93
0.194 2.53
0.131 4.04
0.110 5.84
0.072 10.05
Sw 2T-100Hz 2T-1K Hz 2T-10K Hz 2T-20K Hz 2T-100K Hz
0.392 116.65 92.432 87.358 87.169 87.768
0.321 138.26 112.21 106.81 106.6 107.47
0.271 155.25 128.38 122.84 122.67 123.73
0.194 189.71 161.12 155.15 155 156.33
0.131 231.63 200.48 193.83 193.64 194.88
0.11 274.8 240.07 232.53 232.32 233.54
0.072 343.02 303.6 294.84 294.62 294.45
Table 6 Primary drainage capillary pressure versus water saturation for core#1-115 at reservoir pressure and temperature (Alvarado’s group)
Table 7 2T resistance of the core#1-115 at reservoir pressure and temperature versus water saturation (Alvarado’s group)

E N H A N C E D O I L R E C O V E R Y I N S T I T U T E
Capillary Pressure Measurements-
Primary Drainage and Secondary Imbibition
• The entry pressure was overestimated and as a result, the shoulder was not obtained. This is being resolved in the second test.
• A power outage occurred as the negative capillary pressure was about to obtain
25
Fig.21 Primary drainage and secondary imbibition capillary pressure for core#1-115 at reservoir pressure and temperature
(Alvarado’s group)

E N H A N C E D O I L R E C O V E R Y I N S T I T U T E
Summary
• Thin section analysis showed three main features: – High quality sand
– Anhydrite cementation
– Dolomite cementation
• Wettability indexes were measured for a cleaned core and two uncleaned cores and showed weakly water-wet properties
• Low salinity waterfooding on a core plug did not show incremental oil
• Sequential waterfloowing showed significant reduction in the residual oil and increase in initial water saturation
26

E N H A N C E D O I L R E C O V E R Y I N S T I T U T E
Summary, cont’d
• HPHT relative permeability measurement setup was installed and tested
• Aging and primary drainage was performed for one core but not finished – One core showed very
high permeability after water saturation
• Primary drainage and the positive part of the secondary imbibition capillary pressure curves were measured for one core
• Capillary pressure for a similar core but with low salinity brine is being measured
27

E N H A N C E D O I L R E C O V E R Y I N S T I T U T E
Future Work
• Morrow’s group:
– Anhydrite dissolution studies
– Wettability index for oil
– Oil and water Amott indexes for two other core plugs representative of different lithologies
• Piri’s group:
– Relative permeability measurement for three representative core plugs
– Relative permeability measurement for a core plug using low salinity brine
28

E N H A N C E D O I L R E C O V E R Y I N S T I T U T E
Future Work, cont’d
• Alvarado’s group:
– Capillary pressure and electrical properties measurement for two other representative core plugs
– Capillary pressure and electrical properties measurement for a core plug using low salinity brine
29

E N H A N C E D O I L R E C O V E R Y I N S T I T U T E
Acknowledgements
• C&PE faculty members: – Norman Morrow – Mohammad Piri – Vladimir Alvarado
• C&PE researchers and students: – Amirhossein Alizadeh – Mortaza Akbarabadi – Mahdi KazemPour – Nina Loahardjo – Winoto Winoto – Xiao Wang
• EORI – Peigui Yin
• Minnelusa Consortium
30