Ministry of Petroleum and Energy Macroeconomic indicators ...
30
Ministry of Petroleum and Energy Macroeconomic indicators for the petroleum sector 0 10 20 30 40 50 1970 1975 1980 1985 1990 1995 2000* percent Share of GDP Share of investments Share of export Share of governmental revenues *estimate Facts 2001 figure 1.1 Source: Statistics Norway
Transcript of Ministry of Petroleum and Energy Macroeconomic indicators ...
Ministry of Petroleum and Energy
Macroeconomic indicators for the petroleum sector
0
10
20
30
40
50
1970 1975 1980 1985 1990 1995 2000*
perc
ent
Share of GDP Share of investments Share of export Share of governmental revenues
*estimate
Facts 2001 figure 1.1 Source: Statistics Norway

Ministry of Petroleum and Energy
Investment
0
10
20
30
40
50
60
70
80
90
1985 1986 1987 1988 1989 1990 1991 1992 1993 1994 1995 1996 1997 1998 1999 2000*
NO
K b
illio
n (m
oney
of t
he d
ay)
ExplorationOnshorePipelinesFields
*estimates
Source: Statistics NorwayFacts 2001 figure 1.2

Ministry of Petroleum and Energy
Net cash flow to the state from petroleum operations
-20
20
60
100
140
180
1972
1974
1976
1978
1980
1982
1984
1986
1988
1990
1992
1994
1996
1998
2000
*
NO
K b
n (
2001
val
ue)
Taxes Royalty and area fee CO2 tax Statoil dividend SDFI State revenues
*estimates
Facts 2001 figure 1.3 Source: National account and state budget

Ministry of Petroleum and Energy
Total petroleum production
0
40
80
120
160
200
240
280
1982 1984 1986 1988 1990 1992 1994 1996 1998 2000*
mill
scm
oe
Oil (incl. NGL/condensate) Gas
*estimate
Facts 2001 figure 1.4 Source: NPD
Ministry of Petroleum and Energy
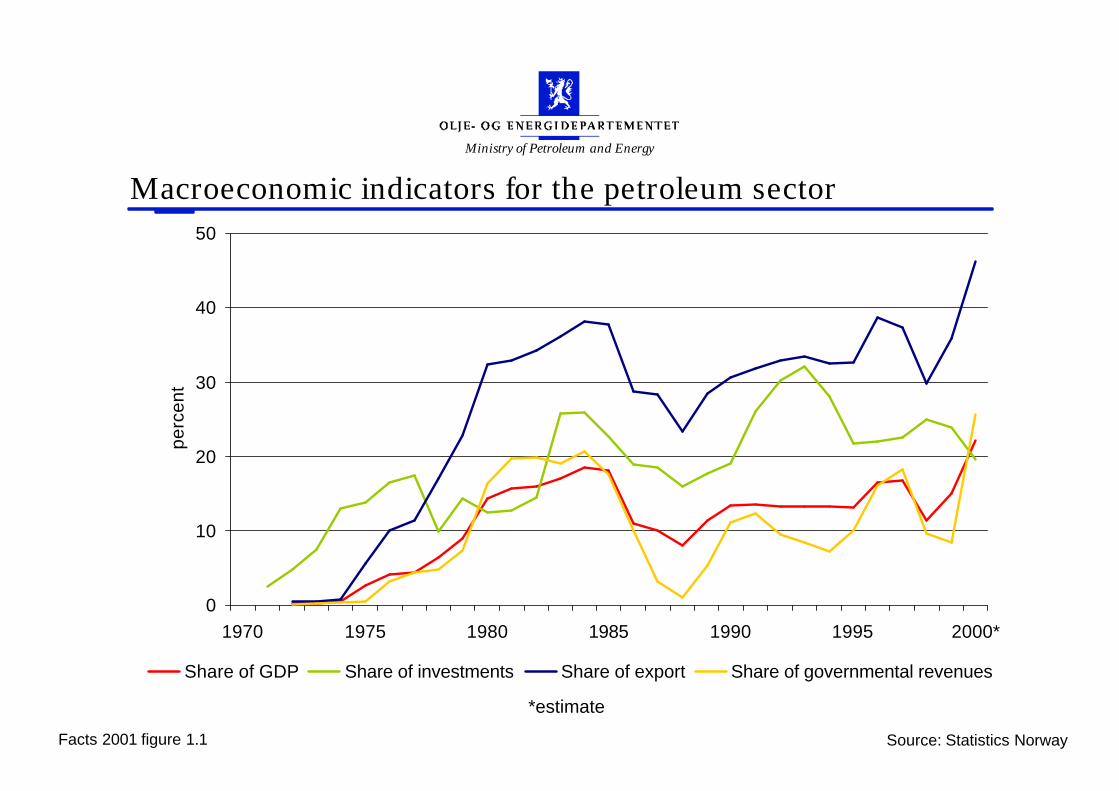
The state organisation of petroleum operations
The NorwegianPetroleum Directorate
Ministry of Finance Ministry ofPetroleum and Energy
Ministry of LocalGovernment and
Regional Development
Government
Stortinget(Parliament)
Facts 2001 figure 3.1

Ministry of Petroleum and Energy
The organisation of petroleum operations
Political Adviser
Information section
Adm. budget and accountingdepartment
Explor-ation
section
Oilsection
Gassection
Industrysection
Environ-mentalaffairssection
Sectionfor statepartici-pation
Petroleumlaw and
legal affairssection
Economicssection
Oil and gas department Energy and waterresources department
Secretary General
State Secretary
Minister
Facts 2001 figure 3.2
Ministry of Petroleum and Energy
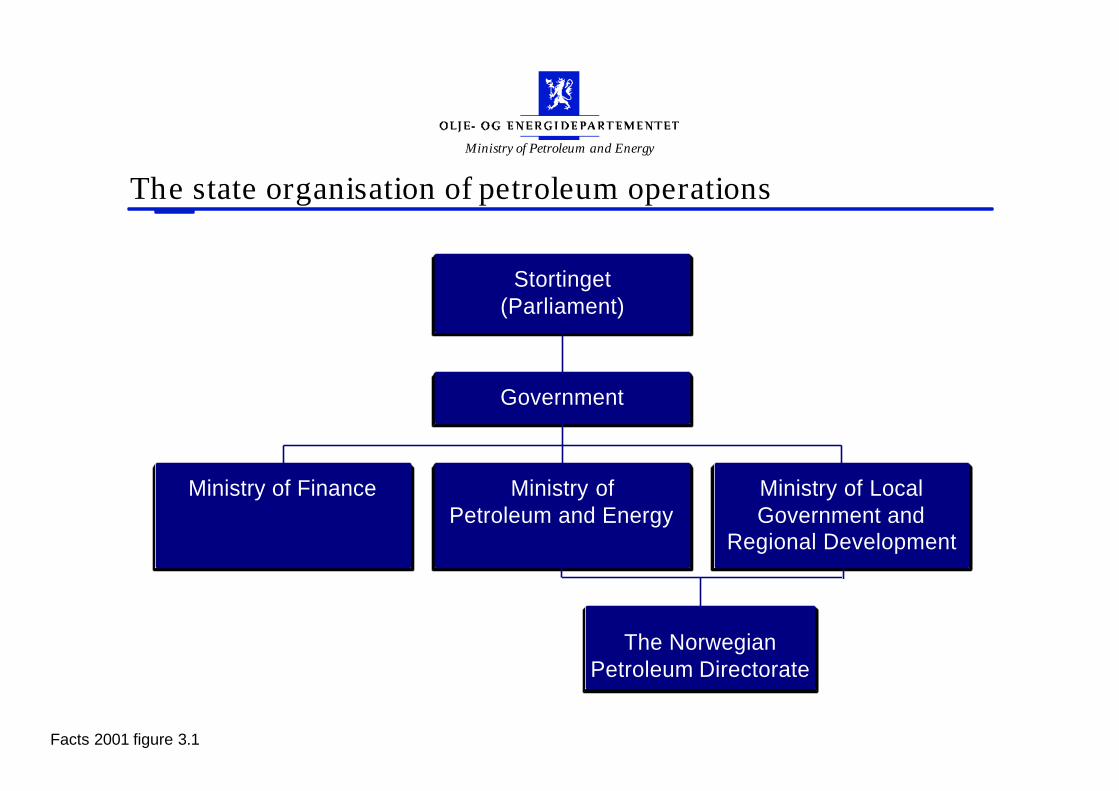
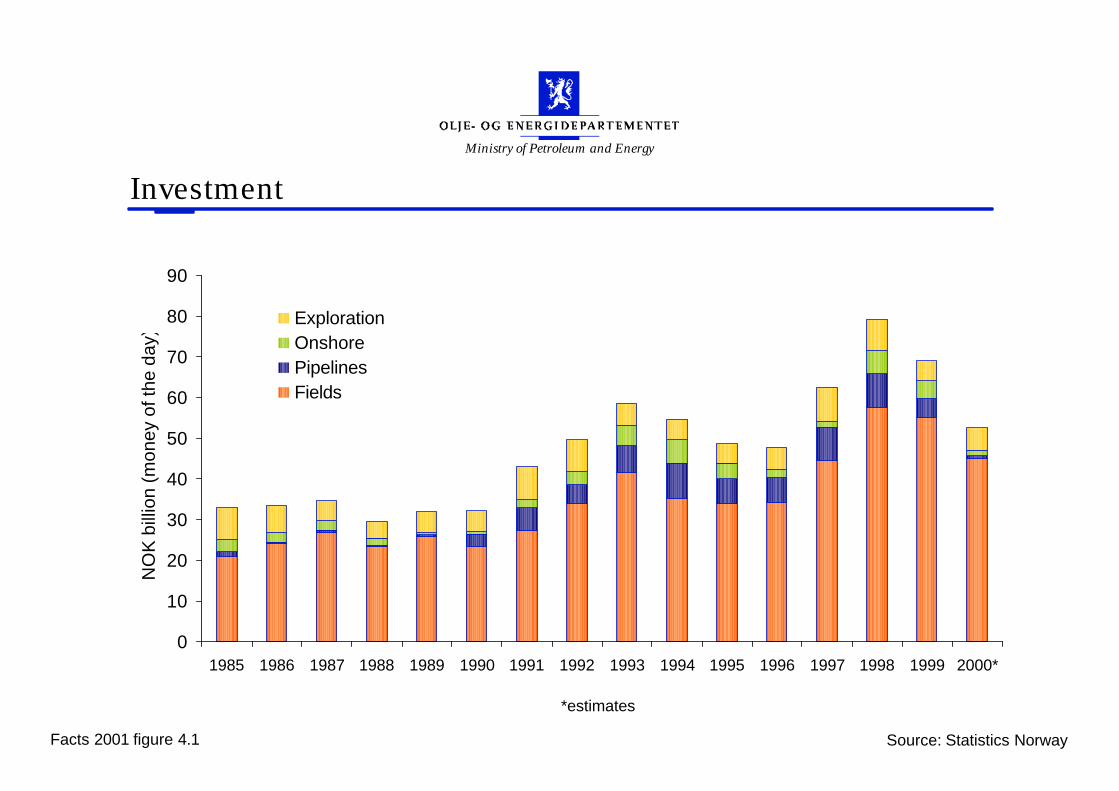
Investment
0
10
20
30
40
50
60
70
80
90
1985 1986 1987 1988 1989 1990 1991 1992 1993 1994 1995 1996 1997 1998 1999 2000*
NO
K b
illio
n (m
oney
of t
he d
ay)
ExplorationOnshorePipelinesFields
*estimates
Source: Statistics NorwayFacts 2001 figure 4.1

Ministry of Petroleum and Energy
Estimates for future investments in fields and pipelines 2001-2010
0
10
20
30
40
50
60
2001 2002 2003 2004 2005 2006 2007 2008 2009 2010
NO
K b
illio
n ( 2
000
valu
e)
Fields in production or under development Specific measures on producing fieldsPipelines/onshore Finds under evaluationPossible improved recovery measures Undiscovered resources
Source: MPE/NPDFacts 2001 figure 4.2
Ministry of Petroleum and Energy
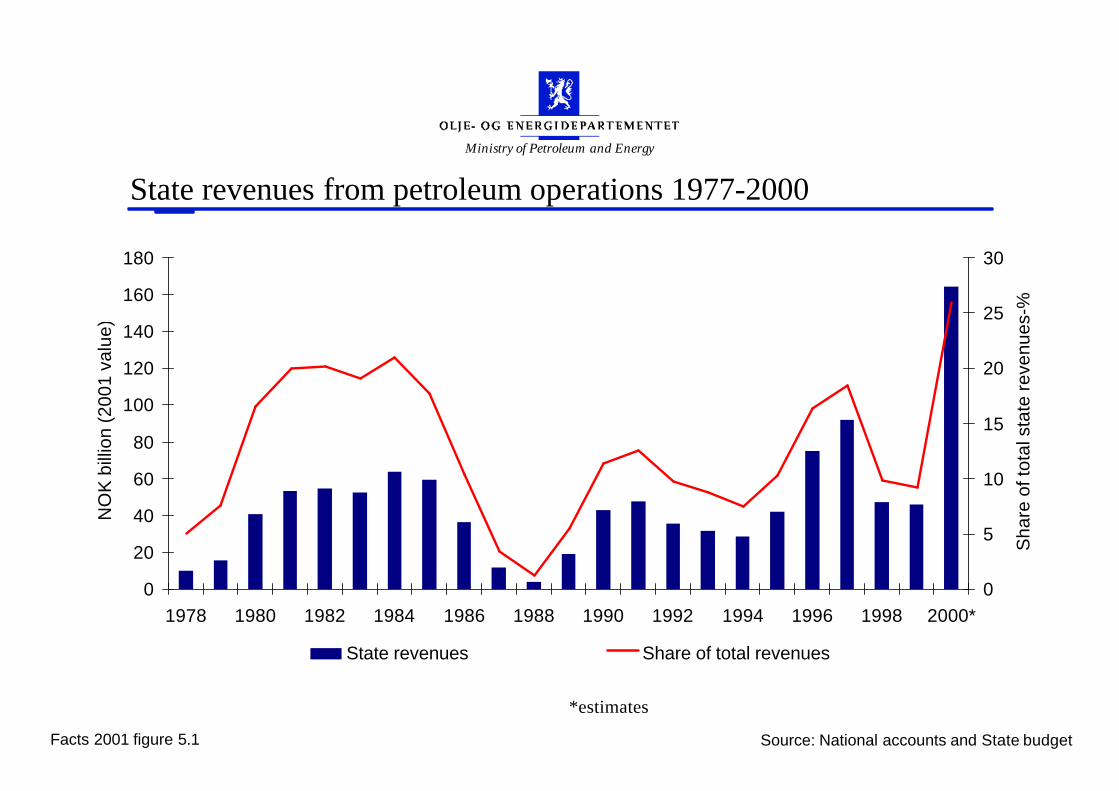
State revenues from petroleum operations 1977-2000
0
20
40
60
80
100
120
140
160
180
1978 1980 1982 1984 1986 1988 1990 1992 1994 1996 1998 2000*
NO
K b
illio
n (2
001
valu
e)
0
5
10
15
20
25
30
Sha
re o
f tot
al s
tate
reve
nues
-%
State revenues Share of total revenues
Source: National accounts and State budgetFacts 2001 figure 5.1
*estimates
Ministry of Petroleum and Energy
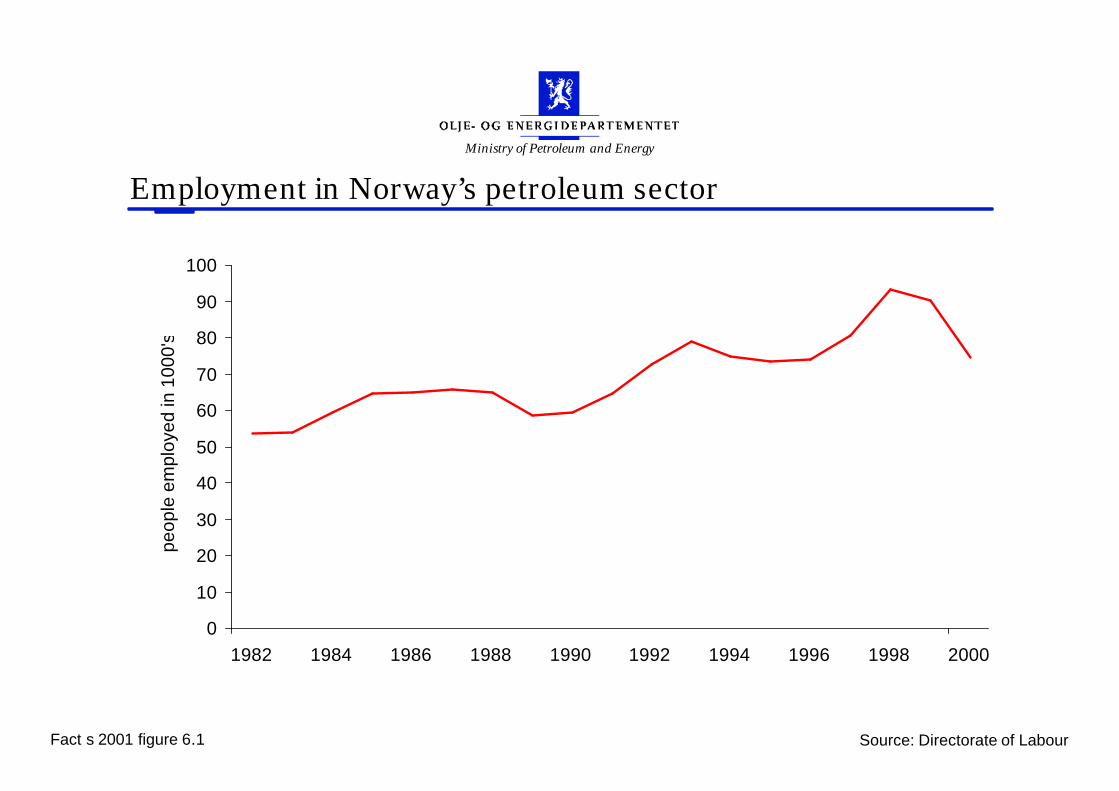
Employment in Norway’s petroleum sector
0
10
20
30
40
50
60
70
80
90
100
1982 1984 1986 1988 1990 1992 1994 1996 1998 2000
peop
le e
mpl
oyed
in 1
000'
s
Fact s 2001 figure 6.1 Source: Directorate of Labour

Ministry of Petroleum and Energy
Possible value creation from improved oil recovery
0
250
500
750
NO
K b
n
OSE* IOR**
Facts 2001 figure 6.2 Source: OG21
*Oslo Stock Exchange, february 2001** Gross present value, size dependant on timing and volumes
Recov factor
from 44% - 57%
635 bn
470 bn

Ministry of Petroleum and Energy
Source: Reve / Jacobsen ”Et verdiskapende Norge”Facts 2001 Figure 6.3,
20
15
10
5
0
1,5
4
9
12
Saudi Arabia Malaysia Gulf of Mexico Norway
9.2 mil b/d3.1
Mill b/d0.7
Mill b/d3.5
Mill b/d
Volume
Bre
ak-e
ven
pric
e U
SD
/bbl
UK
2.8Mill b/d
13
Daily production and break-even prices for various upstream provinces

Ministry of Petroleum and Energy
Total resource estimate
Gas
Oil Total resources NCS, 13 797 mill o.e
Undiscovered resourcesPossible measuresResources in discoveriesResources in fieldsRemaining reservesProduced reserves
Bn
scm
oe
Fact s 2001 figure 7.1 Source: Norwegian Petroleum Directorate

Ministry of Petroleum and Energy
Total petroleum production 1982-2000
0
50
100
150
200
250
300
1982 1984 1986 1988 1990 1992 1994 1996 1998 2000*
mill
scm
oe
Oil/NGL Gas
Fact s 2001 figure 8.1 Source: NPD
*estimate

Ministry of Petroleum and Energy
Oil production (incl. NGL/condensate) 1981-2000
0
20
40
60
80
100
120
140
160
180
200
1982 1984 1986 1988 1990 1992 1994 1996 1998 2000
mill
scm
oe
0
0,5
1
1,5
2
2,5
3
3,5
mill
bbl
oe/
day
Fact s 2001 figure 8.2 Source: NPD
Ministry of Petroleum and Energy
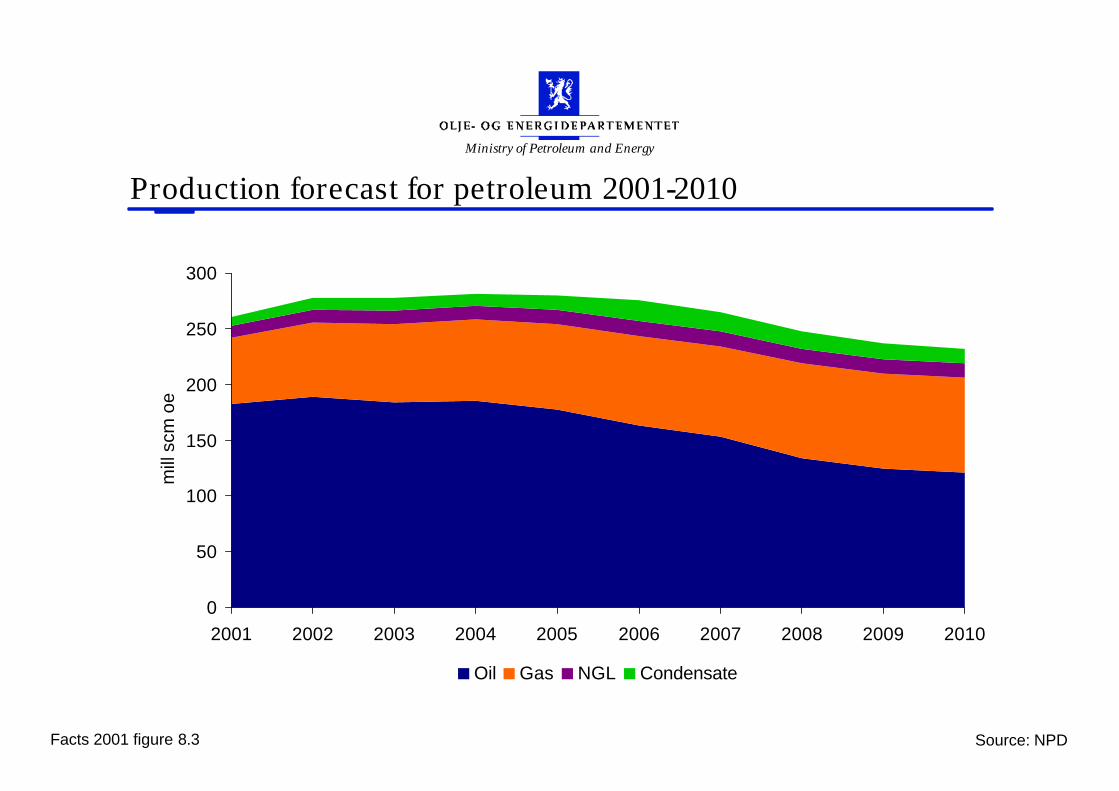
Production forecast for petroleum 2001-2010
0
50
100
150
200
250
300
2001 2002 2003 2004 2005 2006 2007 2008 2009 2010
mill
scm
oe
Oil Gas NGL Condensate
Facts 2001 figure 8.3 Source: NPD
Ministry of Petroleum and Energy
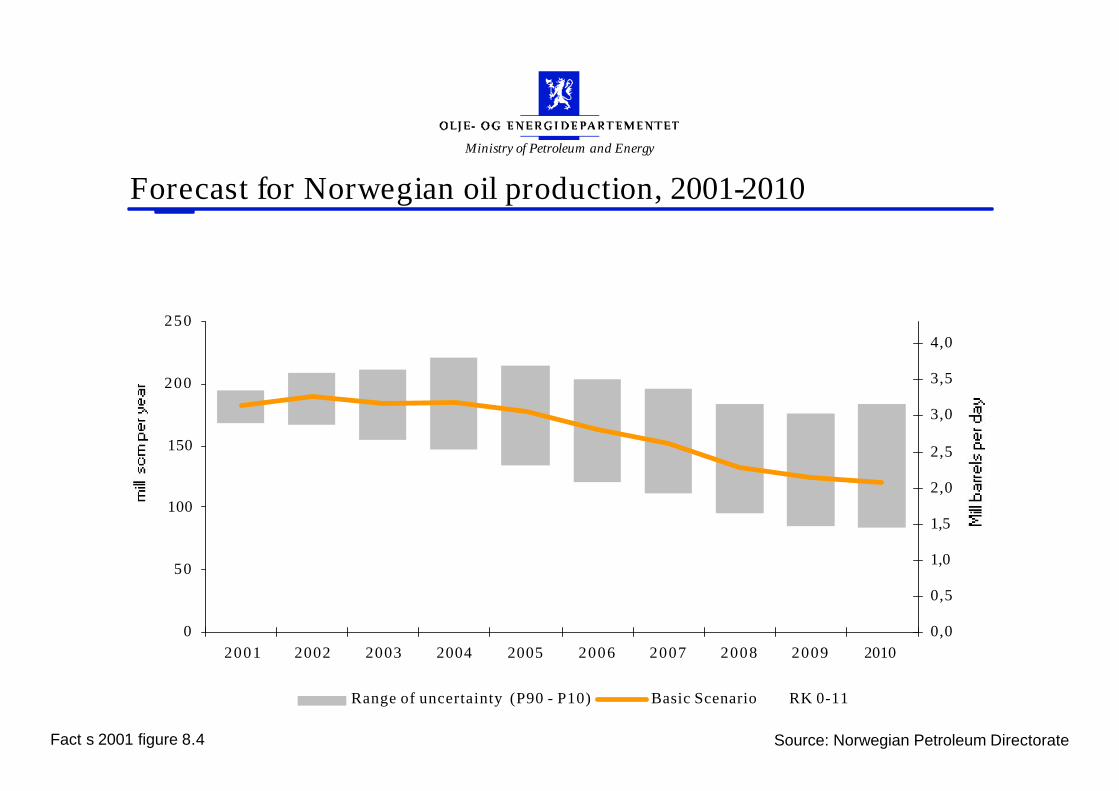
Forecast for Norwegian oil production, 2001-2010
0
50
100
150
200
250
2001 2002 2003 2004 2005 2006 2007 2008 2009 20100,0
0,5
1,0
1,5
2,0
2,5
3,0
3,5
4,0
Range of uncertainty (P90 - P10) Basic Scenario RK 0-11
Fact s 2001 figure 8.4 Source: Norwegian Petroleum Directorate

Ministry of Petroleum and Energy
Delivery obligations for natural gas
0
20
40
60
80
2001 2002 2003 2004 2005 2006 2007 2008 2009 2010
bn s
cm
Field contracts Delivery contracts
Facts 2001 figure 8.3 Source: MPE

Ministry of Petroleum and Energy
Price of Norwegian crude oil, 1975-2000
0
20
40
60
80
1975 1980 1985 1990 1995 2000
US
D/b
arre
l
Nominal 2000 USD
Fact s 2001 figure 9.1 Source: MPE
Ministry of Petroleum and Energy
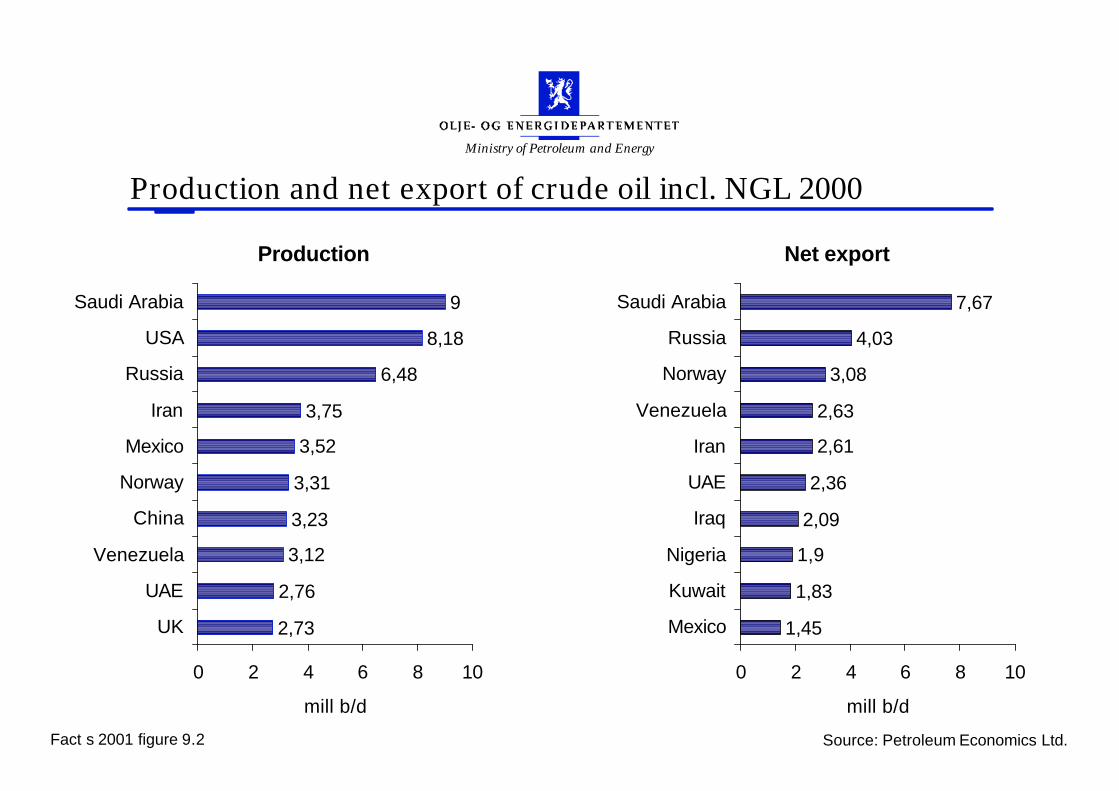
Production and net export of crude oil incl. NGL 2000
2,73
2,76
3,12
3,23
3,31
3,52
3,75
6,48
8,18
9
0 2 4 6 8 10
UK
UAE
Venezuela
China
Norway
Mexico
Iran
Russia
USA
Saudi Arabia
mill b/d
1,45
1,83
1,9
2,09
2,36
2,61
2,63
3,08
4,03
7,67
0 2 4 6 8 10
Mexico
Kuwait
Nigeria
Iraq
UAE
Iran
Venezuela
Norway
Russia
Saudi Arabia
mill b/d
Production Net export
Fact s 2001 figure 9.2 Source: Petroleum Economics Ltd.

Ministry of Petroleum and Energy
Shipments of Norwegian crude oil 2000*
Canada5 %
France13 %
Netherlands15 %
Norway16 %
Great Britain22 %
Sweden6 %
Germany6 %
USA6 %
Other11 %
Fact s 2001 figure 9.3
Total 178,5 mill scm oe
Source: Norwegian Petroleum Directorate*to first recipient
Ministry of Petroleum and Energy
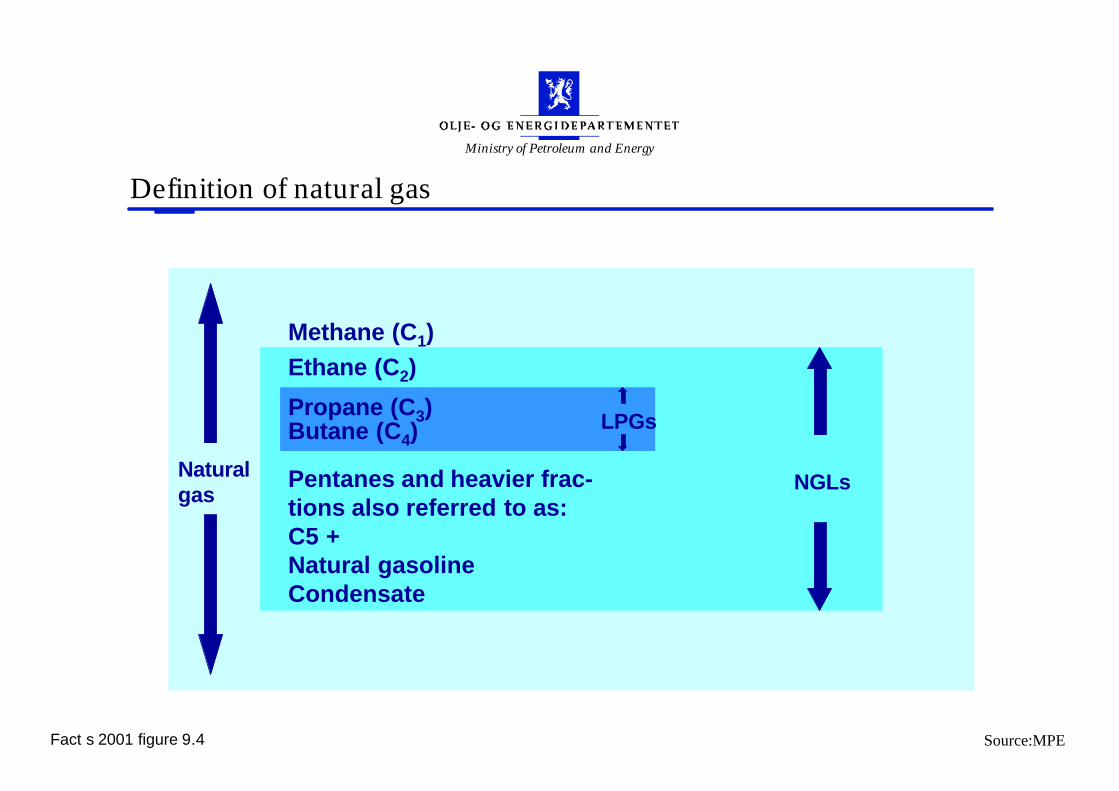
Definition of natural gas
Naturalgas NGLs
Methane (C1)Ethane (C2)
Propane (C3)Butane (C4)
Pentanes and heavier frac-tions also referred to as:C5 +Natural gasolineCondensate
LPGs
Fact s 2001 figure 9.4 Source:MPE

Ministry of Petroleum and Energy
Shipment of NGL / condensate 2000*
Facts 2001 figure 9.5 Source: NPD* to first recipient
Belgium10 %
Denmark15 %
Finland1 %
France4 %
Netherlands14 %
Norway12 %
Poland5 %
Great Britain7 %
Sweden5 %
Germany7 %
USA12 %
Other6 %
Spain2 %
Ministry of Petroleum and Energy
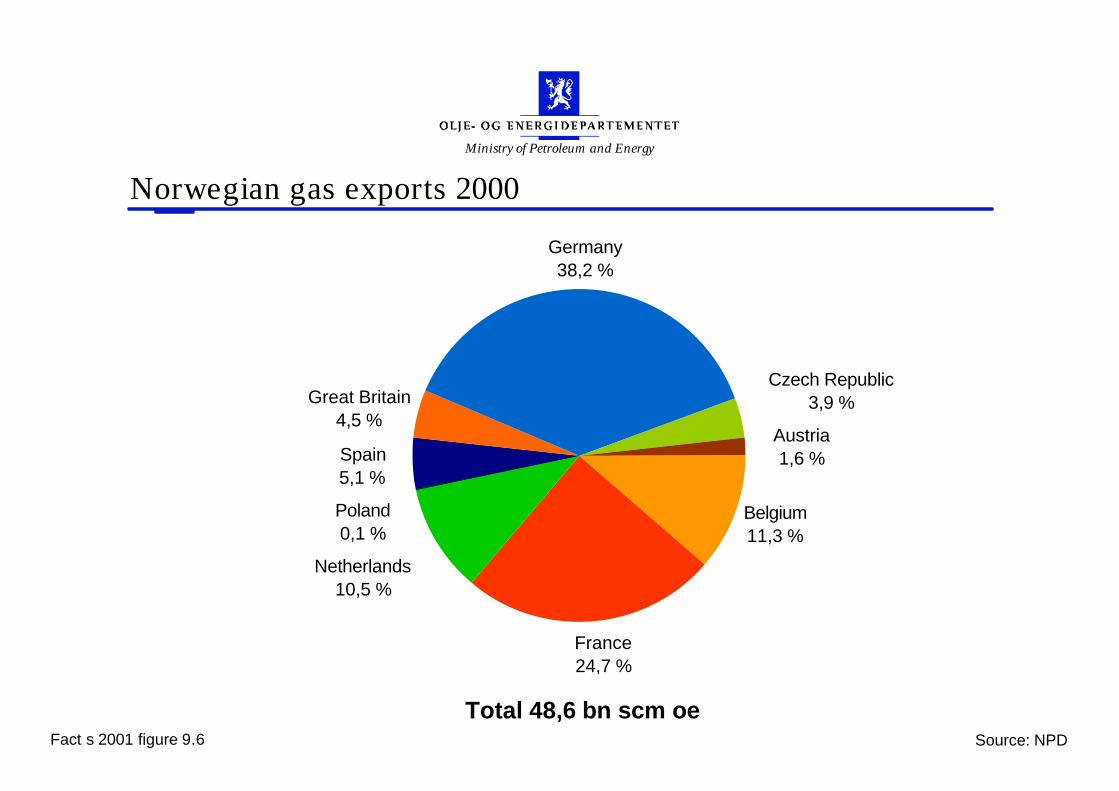
Norwegian gas exports 2000
Belgium11,3 %
France24,7 %
Netherlands10,5 %
Poland0,1 %
Spain5,1 %
Great Britain4,5 %
Germany38,2 %
Czech Republic3,9 %
Austria1,6 %
Total 48,6 bn scm oeFact s 2001 figure 9.6 Source: NPD

Ministry of Petroleum and Energy
Market shares 2000
Esso22,2 %
JET1,1 %
Hydro/Texaco12,5 %
Shell28,6 %
Statoil32,5 %
Other3,1 %
Fact s 2001 figure 9.7 Source: Norwegian Petroleum Institute

Ministry of Petroleum and Energy
Emissions to the air
Facts 2001 figure 10.1
Diffusive emissionsGas turbine
exhaust
Well testing
Gas flaring
Diesel fuelexhaust
Gas venting
Ministry of Petroleum and Energy
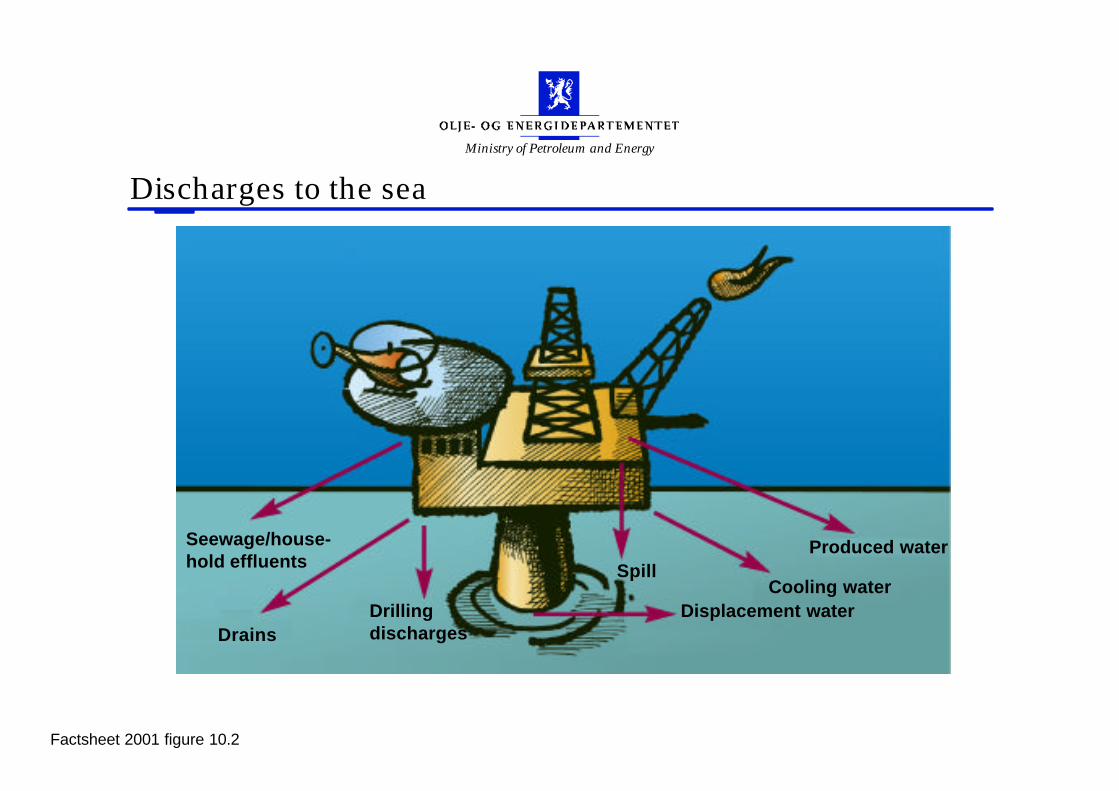
Discharges to the sea
Factsheet 2001 figure 10.2
Seewage/house-hold effluents
DrainsDrillingdischarges
Displacement water
SpillCooling water
Produced water

Ministry of Petroleum and Energy
Licensing round
Nomination Announcement Application Award
Negotiation
Facts 2001 figure 11.1

Ministry of Petroleum and Energy
Awards per year
0
10
20
30
40
50
60
70
80
90
1965 1968 1971 1974 1977 1980 1983 1986 1989 1992 1995 1998
Num
ber o
f blo
cks/
prod
uctio
n lic
ence
s
0
5000
10000
15000
20000
25000
30000
35000
40000
45000
Are
a aw
arde
d sq
. km
Number of production licences Number of blocks awarded Area awarded sq. km.
Fact s 2001 figure 12.1 Source: NPD

Ministry of Petroleum and Energy
Exploration wells completed per year
0
10
20
30
40
50
60
1967 1969 1971 1973 1975 1977 1979 1981 1983 1985 1987 1989 1991 1993 1995 1997 1999
Wel
ls
Wildcats Appraisals
Facts 2001 figure 13.1 Kilde: NPD