MINISTRY OF HEALTH NUTRITIONAL ANTHROPOMETRIC & … · MINISTRY OF HEALTH NUTRITIONAL...
33
MINISTRY OF HEALTH NUTRITIONAL ANTHROPOMETRIC & MORTALITY SURVEY CHILDREN 6-59 MONTHS ERUTE, MOROTO AND OTUKE COUNTIES, LIRA DISTRICT 10 th - 25 th AUGUST 2009
Transcript of MINISTRY OF HEALTH NUTRITIONAL ANTHROPOMETRIC & … · MINISTRY OF HEALTH NUTRITIONAL...

MINISTRY OF HEALTH
NUTRITIONAL ANTHROPOMETRIC & MORTALITY SURVEY
CHILDREN 6-59 MONTHS
ERUTE, MOROTO AND OTUKE COUNTIES, LIRA DISTRICT
10th
- 25th
AUGUST 2009

2
ACKNOWLEDGEMENTS
Action Against Hunger (ACF) -Uganda Mission would like to sincerely acknowledge:
• Ministry of Health (MOH) in Kampala, District Health Officers (DHOs) in the Northern Region
and county offices for their collaboration with ACF that led to the success of SMART project;
• United Nations Children’s Fund (UNICEF) for offering financial support to undertake the
regional training and survey in Lira;
• Action against Hunger – Uganda Mission management, administration and logistics team for
their support during trainings and surveys. Special thanks goes to Kutondo Edward for further
broadening our understanding of SMART Methodology, coordination and ensuring training
and survey objectives were met;
• SMART training facilitators and participants: Namulumba Eva Rose, Nakitto Peace, Opule
Nicholas, Esther Wamono, Muhumuza Richard, Egwar Charles, Awino Sarah Constance,
Eceny Denis, Lajul Joyce, Epiangu Francis, Apili Anna Mary, Omara Florence, Okech
Emmanuel, Akullo Beatrice, Ekong Jolly Joe, Okwiri James, Oloya Santo, Topiny Geoffrey,
Loum Bishop Janani, Otim G.G, Amal Milly Grace, Kawunye Peter, Teko Timothy, Okullo
Paul Peter, Oming Joseph, Okot Denis, Okeny Francis Owiny, Akello Racheal and Komakech
Denis for ensuring successful training and survey field work.
• The parents and other caretakers for providing useful information and patiently taking their
time to be interviewed as well as allowing their children to be measured;
• The local leaders within the surveyed areas. Sincere gratitude is extended to them for their
guidance during planning and the actual field work which made the whole process mush
easier.
3
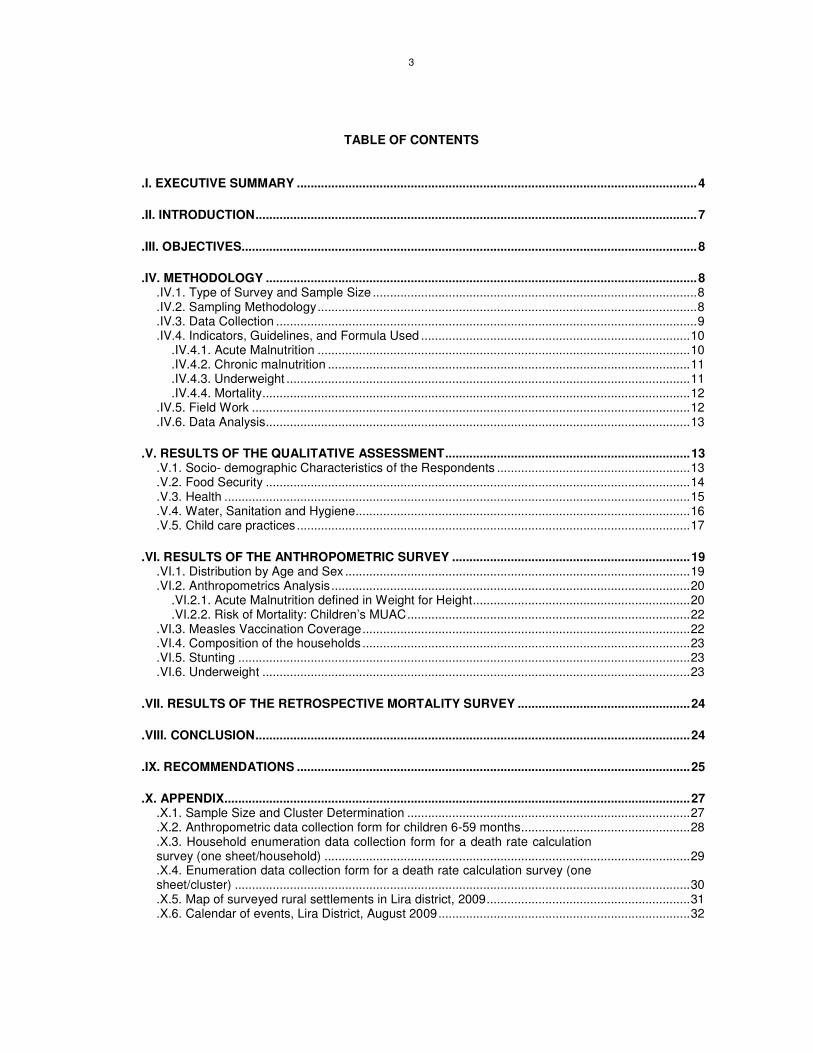
TABLE OF CONTENTS
.I. EXECUTIVE SUMMARY ....................................................................................................................4
.II. INTRODUCTION................................................................................................................................7
.III. OBJECTIVES....................................................................................................................................8
.IV. METHODOLOGY .............................................................................................................................8
.IV.1. Type of Survey and Sample Size ..............................................................................................8
.IV.2. Sampling Methodology..............................................................................................................8
.IV.3. Data Collection ..........................................................................................................................9
.IV.4. Indicators, Guidelines, and Formula Used ..............................................................................10 .IV.4.1. Acute Malnutrition ............................................................................................................10 .IV.4.2. Chronic malnutrition .........................................................................................................11 .IV.4.3. Underweight .....................................................................................................................11 .IV.4.4. Mortality............................................................................................................................12
.IV.5. Field Work ...............................................................................................................................12
.IV.6. Data Analysis...........................................................................................................................13
.V. RESULTS OF THE QUALITATIVE ASSESSMENT.......................................................................13
.V.1. Socio- demographic Characteristics of the Respondents ........................................................13
.V.2. Food Security ...........................................................................................................................14
.V.3. Health .......................................................................................................................................15
.V.4. Water, Sanitation and Hygiene.................................................................................................16
.V.5. Child care practices ..................................................................................................................17
.VI. RESULTS OF THE ANTHROPOMETRIC SURVEY .....................................................................19
.VI.1. Distribution by Age and Sex ....................................................................................................19
.VI.2. Anthropometrics Analysis........................................................................................................20 .VI.2.1. Acute Malnutrition defined in Weight for Height...............................................................20 .VI.2.2. Risk of Mortality: Children’s MUAC..................................................................................22
.VI.3. Measles Vaccination Coverage...............................................................................................22
.VI.4. Composition of the households ...............................................................................................23
.VI.5. Stunting ...................................................................................................................................23
.VI.6. Underweight ............................................................................................................................23
.VII. RESULTS OF THE RETROSPECTIVE MORTALITY SURVEY ..................................................24
.VIII. CONCLUSION..............................................................................................................................24
.IX. RECOMMENDATIONS ..................................................................................................................25
.X. APPENDIX.......................................................................................................................................27
.X.1. Sample Size and Cluster Determination ..................................................................................27
.X.2. Anthropometric data collection form for children 6-59 months.................................................28
.X.3. Household enumeration data collection form for a death rate calculation survey (one sheet/household) ..........................................................................................................29 .X.4. Enumeration data collection form for a death rate calculation survey (one sheet/cluster) ....................................................................................................................................30 .X.5. Map of surveyed rural settlements in Lira district, 2009...........................................................31 .X.6. Calendar of events, Lira District, August 2009.........................................................................32

4
.I. EXECUTIVE SUMMARY
Nutrition is a key element of a child’s right to health as stipulated in the Convention on the Rights
of the Child (CRC, 1989). All children have a right to adequate nutrition and access to safe and
nutritious food as this is fundamental for their nutrition, health, survival, growth and development.
According to Uganda Demographic Health Survey (UDHS 2006), severe malnutrition rates in the
northern region of Uganda stood at 1.9% for wasting, 17.3% for stunting and 6.8% for
underweight. Furthermore, the last nutritional survey conducted in Lira District by ACF-USA in
April 2008 revealed rates of Global Acute Malnutrition (GAM) and Severe Acute Malnutrition
(SAM) of 4.4% (CI: 3.0 - 5.9%) and 0.0% (CI: 0.0% - 0.0%) respectively based on WHO
references.
Following a five days training on National Nutritional Survey Guidelines based on Standardized
Monitoring and Assessment of Relief and Transitions (SMART) methodology, participants needed
hands on practice to appreciate and obtain skills on data collection, analysis and reporting.
Furthermore, the survey was aimed at routine monitoring of the health and nutrition situation of
Lira District.
Objectives
♦ To assess the nutritional status of children aged between 6 and 59 months,
♦ To estimate the levels of retrospective crude mortality rates,
♦ To determine the measles immunization coverage in children of age 9-59 months,
♦ To determine the incidence of common diseases (malaria, measles, diarrhea, and ARI)
among children aged between 6 and 59 months in a period of two weeks prior to the
assessment,
♦ To assess the factors influencing the nutrition situation of the community.
Methodology
SMART methodology was used in the implementation of the nutritional anthropometric survey
and retrospective mortality assessment. Children aged 6-59 months formed the target group for
the anthropometric survey because of their vulnerability while the whole population was
considered for crude mortality rate. Information utilised for planning the survey was obtained from
secondary sources such as ACF survey reports, Uganda Demographic Health Survey (2006),
Lira District sub county offices and the Uganda National Nutrition Survey Guidelines (June, 2009).
Planning data is shown in Table 1 below.

5
Table 1: Survey planning data
Anthropometric survey Mortality survey
Population 76,4641 382,321
Estimated prevalence1 6 % 0.82
± Desired precision % 2.5% 0.4%
Design effect 1.5 1.5
Sample sizes 518 2,648
Anthropometric survey: A final sample size of 570 children was obtained after factoring in 10% to
cater for contingency. The sample (570) was then divided by 172
to obtain the number of clusters
(34) required for the survey.
Mortality survey: The recall period was of 110 days based on a public holiday (Labour Day as the
starting date). The automatically calculated sample size (2,648) was increased by 10% and the
final sample was divided by the total number of clusters (34) to obtain the required number of
persons present now per cluster (86).
At parish level, random selection was applied to select a particular village for the survey with help
of the local leaders putting into consideration factors such as accessibility. The selected village
was surveyed using the EPI method. Mortality questionnaires were then administered in every
selected household using a recall period of 110 days as well as household nutrition security
questionnaires whereas anthropometry was administered only to households with children 6-59
months of age. Key informant interviews and observations were also used to collect nutrition
security data.
Anthropometric and mortality data was analyzed using Emergency Nutrition Assessment (ENA)
for SMART (version 1 October 2007) software with both WHO and NCHS references. Excel was
used to carry out analyses on MUAC and measles immunization coverage. Finally, household
nutrition security data was analysed using SPSS 15.0.
Summary of findings
Nutrition and Mortality Survey Results
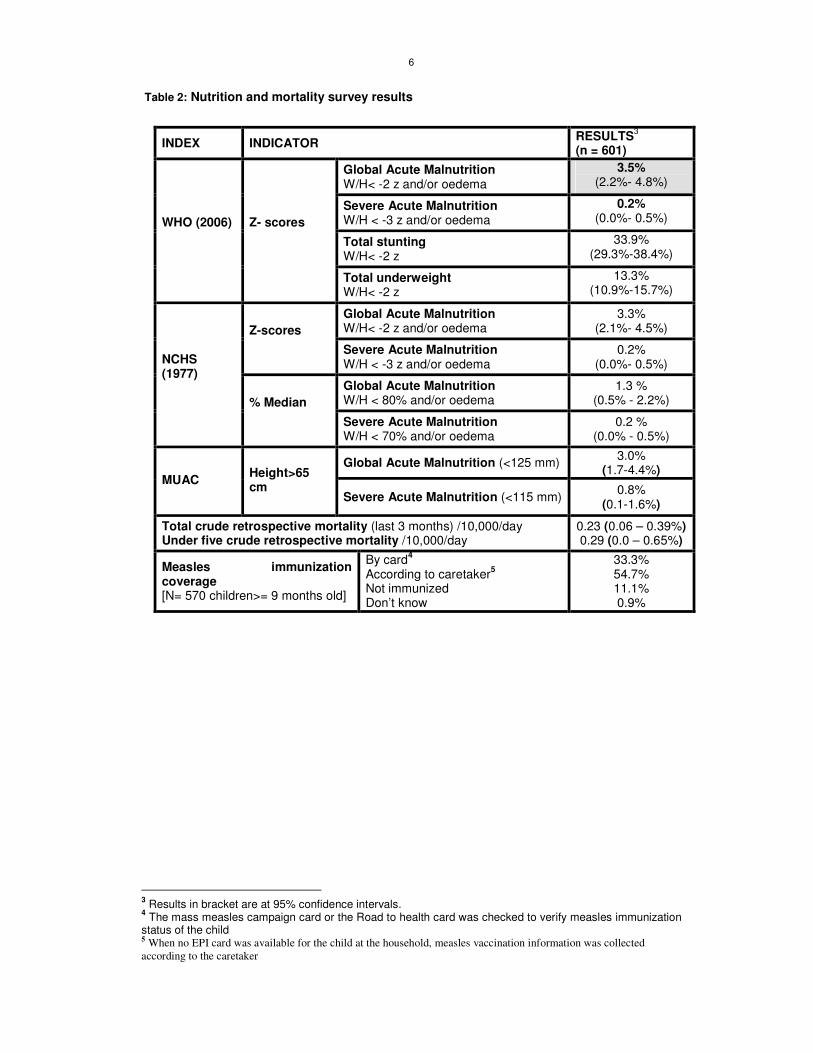
The final analysis was done on 601 children upon exclusion of 5 incoherent data sets. The GAM
was 3.5% (2.2% - 4.8%) based on WHO 2006 reference and falls within the normal category
(Less than 5%). Underweight rate of 13.3% (10.9% - 15.7%) fell within the moderate category
while stunting rate of 33.9% was classified as serious. Detailed results are shown in Table 3
below.
1 20% of the estimated population to cater for children under 5 years
2 Number of children that could be measured accurately by each team per day
6
Table 2: Nutrition and mortality survey results
INDEX INDICATOR RESULTS
3
(n = 601)
Global Acute Malnutrition W/H< -2 z and/or oedema
3.5% (2.2%- 4.8%)
Severe Acute Malnutrition W/H < -3 z and/or oedema
0.2% (0.0%- 0.5%)
Total stunting W/H< -2 z
33.9% (29.3%-38.4%)
WHO (2006)
Z- scores
Total underweight W/H< -2 z
13.3% (10.9%-15.7%)
Global Acute Malnutrition W/H< -2 z and/or oedema
3.3% (2.1%- 4.5%) Z-scores
Severe Acute Malnutrition W/H < -3 z and/or oedema
0.2% (0.0%- 0.5%)
Global Acute Malnutrition W/H < 80% and/or oedema
1.3 % (0.5% - 2.2%)
NCHS (1977)
% Median Severe Acute Malnutrition
W/H < 70% and/or oedema 0.2 %
(0.0% - 0.5%)
Global Acute Malnutrition (<125 mm) 3.0%
(1.7-4.4%) MUAC
Height>65 cm
Severe Acute Malnutrition (<115 mm) 0.8%
(0.1-1.6%)
Total crude retrospective mortality (last 3 months) /10,000/day Under five crude retrospective mortality /10,000/day
0.23 (0.06 – 0.39%) 0.29 (0.0 – 0.65%)
Measles immunization coverage [N= 570 children>= 9 months old]
By card4
According to caretaker5
Not immunized Don’t know
33.3% 54.7% 11.1% 0.9%
3 Results in bracket are at 95% confidence intervals.
4 The mass measles campaign card or the Road to health card was checked to verify measles immunization
status of the child 5 When no EPI card was available for the child at the household, measles vaccination information was collected
according to the caretaker
7
.II. INTRODUCTION
Lira District is located in Lango sub-region of Northern Uganda. It is bordered by Dokolo District
to the south, Amuria District to the east, Moroto and Abim Districts to the north east, Pader
District to the north, Oyam District to the northwest and Apac District to the west. It has a total
area of 7,251 km² with an average altitude of 170 meters. Lira District is comprised of five
counties: Erute North, Erute South, Otuke, Moroto and Lira City Council. These are further
subdivided into 15 sub-counties four of which are municipal divisions (Central, Ojuuina, Railways
and Adyel). The national population census of 2002 estimated the population of the district at
530,342, with an annual population growth rate of 3.5%. The estimated population of Lira as of
2009 after considering the population growth rate is about 674,744.
The northern region of Uganda witnessed a tragic insurgency for almost two decades perpetrated
by the Lord's Resistance Army (LRA) led by Joseph Kony against the Government of Uganda.
Lira District was affected in 2003 by the LRA insurgency that ravaged Kitgum, Gulu, Amuru and
Pader Districts. The conflict resulted in massive population displacement into the district in May
2003. There was increased movement of rebels along the northern border which made Lira
district a clear target of attacks, abductions, and looting. Internally Displaced People (IDP) camps
were established to create settlements for the people and these were in close proximity to
Uganda People’s Defense Force (UPDF) units. Living conditions in the IDP camps were very
difficult and precarious. The population in the IDPs regularly faced food shortages due to lack of
access to farmland. The peace talk negotiations held in Juba (southern Sudan) in July 2006
between the Uganda government and the LRA made progress with a formal cessation of
hostilities agreement signed on August 26, 2006 leading to the return of peace to the region. Lira
District experienced a massive return of IDPs, whereby over 310,000 of the estimated 350,000
people left the camps to return to their home villages in a period of 14 months.
The continental climate of the district is modified by the swampy area surrounding the southern
part of the district while the rest of land is mainly flat landscape. The rainfall is bi modal with one
peak during April-May and the other in August-October. The average annual rainfall varies
between 1200-1600mm decreasing northwards with average minimum and maximum
temperatures of 22.5°C and 25.5°C, respectively. Lira district is also naturally endowed with fertile
soils that are condusive for agriculture.
The major commercial activities in Lira include; grain and oil milling, wholesale and retail trade in
general merchandise, fishing, and transport business including boda-boda cycling. Major
investment opportunities in the district are; oil seed production, cotton industry, shea butter
project, agro forestry and small scale industries.
To build national capacity in the detection of malnutrition, Action Against Hunger in collaboration
with the Ministry of Health conducted a regional training in Lira that covered six northern districts

8
that is Lira, Abim, Oyam, Amuru, Moroto and Gulu. The training focused on National Guidelines
for conducting nutritional surveys in Uganda and SMART methodology. In order to equip
participants with practical skills, a nutritional anthropometric survey was implemented between
17th and 25
th August 2009.
.III. OBJECTIVES
♦ To assess the nutritional status of children aged between 6 and 59 months.
♦ To estimate Crude Mortality Rates (CMR) through a retrospective mortality survey in Lira
district.
♦ To determine the measles immunization coverage in children aged 9-59 months.
♦ To determine the incidence of common diseases (diarrhea, malaria, measles and Acute
Respiratory Infections - ARI) among children aged between 6 and 59 months in a period of
two weeks prior to the assessment.
♦ To assess the factors influencing the nutrition situation of the community.
.IV. METHODOLOGY
.IV.1. Type of Survey and Sample Size
A nutrition anthropometric survey was undertaken in Lira District using SMART methodology.
Data on anthropometry, mortality and nutrition security was collected simultaneously. Key
informant interviews targeting parish chiefs, caretakers and other informed persons were
conducted in all of the 34 clusters. The study covered Erute, Moroto and Otuke Counties. The
sub counties covered were; Aromo, Barr, Ogur, Abako, Aloi, Amugu, Apala, Omoro, Adwari,
Okwang and Olilim (See appendix X: 1 and X. 5.). The survey focused on the above counties in
which Internally Displaced Persons (IDPs) numbering 310,000 and above settled within 14
months after a peace agreement was reached in 2006 and a process to close camps was
initiated. The accessible population was estimated at 382,3216 persons and during the survey;
children aged 6-59 months formed the target group.
.IV.2. Sampling Methodology
A two-stage cluster sampling method was used:
• Cluster selection: The sample sizes for anthropometry and mortality were automatically
calculated in ENA for SMART Software October 2007 version. ACF nutritional
anthropometric survey report of April 2008 provided necessary information for planning.
The number of clusters was calculated based on the capacity of the teams to measure
6 Population of surveyed counties based on UBOS estimates

9
children and logistical support available. Clusters were then selected at parish level
population with use of ENA (See appendix X: 1).
Anthropometric survey: The estimated total population in the surveyed area was 382,321
persons. Twenty percent (20%) of this population was calculated to obtain the number of children
below 5 years (76,464). The sample size of 518 children was obtained after inputting target
population (76,464), estimated malnutrition prevalence (6%), precision (2.5%) and maximum
expected design effect (1.5). The final sample size of 570 children was obtained after factoring in
10% contingency allowance for unforeseen eventualities. The sample of 570 was then divided by
17 to obtain the total number of clusters required for the survey (34).
Mortality survey: The total population (382,321) estimated CMR prevalence (0.82), corresponding
desired precision (0.4%), design effect of 1.5 and 110 recall days were keyed into the mortality
section of the planning template. A sample of 2,913 was obtained after factoring in 10%
contingency. The calculated sample size (2,913) was then divided by the total number of clusters
(34) to obtain the required number of persons present now per cluster (86).
• Selection of households and children
Within a cluster: At parish level, random selection was applied to select a particular village for the
survey with help of the local leaders putting into consideration factors such as accessibility. The
selected village was surveyed using the EPI method. Mortality questionnaires were then
administered in every selected household using a recall period of 110 days as well as the
nutrition security questionnaires whereas anthropometry was administered only to households
with children 6-59 months of age. Key informant interviews and observations were also used to
collect nutrition security data.
Choosing children within the house: In every selected household, all children aged 6-59
months were assessed till a target of 17 was obtained in the cluster. Child Health Cards and a
local calendar of events were used to determine the ages of children. In cases whereby the
teams only needed one child to attain the target of 17, measurements were taken for all eligible
children in the last household visited.
.IV.3. Data Collection
The anthropometric questionnaire (See appendix X: 2) was administered to all eligible children
till a target of 17 children per cluster was attained.
The following information was obtained:
� Age: Recorded with the help of child health cards and a local calendar of events (See
appendix X: 6).
� Gender: Male or female
� Weight: Targeted children were weighed using UNISCALES that were calibrated using a
2kg stone.

10
� Height: Children were measured on a measuring board (precision of 0.1cm). Children
less than 87m were measured lying down, while those greater than or equal to 87cm
were measured standing up.
� Mid-Upper Arm Circumference (MUAC): MUAC was measured at the mid-point of the
left upper arm (precision of 0.1cm).
� Bilateral oedema: Assessed by the application of normal thumb pressure for at least 3
seconds to both feet.
� Measles vaccination: Assessed by checking for measles vaccination on Child health
cards and probing caretakers.
Households without eligible children remained a part of the “sample” that contributed zero
children to the nutritional part of the survey. Children with MUAC less than 115 or W/H < -3 Z-
score and or oedema were referred to the nearest Out- patient Treatment Program (OTP) sites.
Operational OTPs in Lira District include: Okwongo, Aleptong, Okwang, Omoro, Olilim and Orum.
Household nutrition security data: Information was sought on the residence status, source of
livelihood, dietary diversity scores, coping mechanisms, as well as Water, Sanitation and Hygiene
(WASH) using a structured questionnaire.
The mortality questionnaire (See Appendix .X.3 and .X.4) was administered in all households
irrespective of whether they had eligible children or not until a target of 86 persons present ‘now’
per cluster was attained.
Retrospective morbidity of children
The recall period for children’s illness including malaria, diarrhea, ARI, skin disease and other
diseases was 2 weeks. Caretakers were asked questions about children’s illnesses.
.IV.4. Indicators, Guidelines, and Formula Used
.IV.4.1. Acute Malnutrition
� Weight for Height Index
Low weight-for-height identifies wasted children. This index is appropriate when examining short-
term effects such as seasonal changes in food supply or short-term nutritional stress brought
about by illness.
Acute malnutrition rates were estimated from the weight for height (W/H) index values as well as
presence of bilateral oedema. Results were obtained using World Health Organization (WHO)7
7 WHO Child Growth Standards: length/height-for-age, weight-for-age, weight-for-length, weight-for-height and body mass
index-for-age. Methods and development, Geneva, Switzerland: World Health Organization, 2006.

11
standards 2006 and National Center for Health Statistics (NCHS) 8 references. The result was
then expressed in both Z-scores and percentage of the median.
Other than having a true statistical meaning, expression in z- score conveys malnutrition rates
more precisely and allows for inter-study comparison. The percentage of the median on the other
hand, estimates weight deficits more accurately and in the recent past was used in determining
eligible children for targeted feeding programs.
The following guidelines were thus used in expression of results in Z-score and percentage of the
median.
Guidelines for results expressed in Z-score:
� Severe malnutrition: - WFH < -3 SD and/or existing bilateral oedema on the child’s lower
limbs.
� Moderate malnutrition: - WFH < -2 SD and ≥ -3 SD and no oedema.
� Global acute malnutrition: - WFH < -2 SD and/or existing bilateral oedema.
Guidelines for results expressed in percentage of median:
� Severe malnutrition: WFH < 70 % and/or existing bilateral oedema on the child’s lower
limbs.
� Moderate malnutrition: WFH < 80 % and ≥ 70 % and no oedema.
� Global acute malnutrition: WFH <80% and/or existing bilateral oedema
.IV.4.2. Chronic malnutrition
� Height for age Index
The height-for-age index is an indicator of linear growth retardation and cumulative growth
deficits. Children whose height-for-age Z-score is below -2 z scores are considered short for their
age (stunted) and are chronically malnourished. Children who are below -3 z scores are
considered severely stunted. Stunting reflects failure to receive adequate nutrition over a long
period of time and is also affected by recurrent and chronic illness. Height-for-age, therefore,
represents the long-term effects of malnutrition in a population and is not sensitive to recent,
short-term changes in dietary intake.
.IV.4.3. Underweight
� Weight for age index
Weight-for-age is a composite index of height-for-age and weight-for-height. It takes into account
both acute and chronic malnutrition. Children whose weight-for-age is below -2 z scores are
classified as underweight. Children whose weight-for-age is below -3 z scores are considered
severely underweight.
8 NCHS: National Center for Health Statistics (1977) NCHS growth curves for children birth-18 years. United
States. Vital Health Statistics, 165, 11-74.

12
� Children’s Mid-Upper Arm Circumference (MUAC)
MUAC is a good predictor of mortality. It is a malnutrition indicator in children taller than 65 cm in
some protocols, and children taller than 75cm in others. As such, MUAC measurements of the
assessed children were presented in various height groups of <75cm, ≥75cm - < 90cm and ≥ 90
cm.
MUAC Guidelines
MUAC < 115mm and/or oedema Severe malnutrition and high risk of mortality
MUAC ≥ 115 mm and <125 mm Moderate malnutrition and risk of mortality
MUAC ≥ 125 mm and <135 mm At risk of malnutrition
MUAC ≥ 135 Adequate nutritional status.
.IV.4.4. Mortality
Crude Mortality Rate (CMR) = 10,000/a*f/ (b+f/2-e/2+d/2-c/2), where:
a = Number of recall days (94)
b = Number of current household residents
c = Number of people who joined household
d = Number of people who left household
e = Number of births during recall
f = Number of deaths during recall period
The result is expressed per 10,000 people / day.
Thresholds are defined as follows9:
Total CMR:
Alert level: 1/10,000 people/day
Emergency level: 2/10,000 people/day
Under five CMR:
Alert level: 2/10,000 people/day
Emergency level: 4/10,000 people/day
.IV.5. Field Work
Training of the participants was done for 5 days facilitated by the national Training of Trainers
(TOTs) team and focused on the National Survey Guidelines, SMART methodology,
standardization test and pilot test. Five teams of a minimum of 4 people each (one team leader,
two measurers, one enumerator for the household nutrition security component and the other for
9 Health and nutrition information systems among refugees and displaced persons, Workshop report on
refugee’s nutrition, ACC / SCN, Nov 95.

13
the key informant and observation questionnaire) completed the data collection. The overall
supervision of the survey was done by the training facilitators and ACF staff that comprised of
Nutrition Program Manager and 2 Nutrition Program Officers.
Field work was undertaken from 17th
to 24th August 2009 and the data collected was entered on a
daily basis by the field supervisors. Teams were debriefed each morning on errors encountered
and ways to ensure quality data.
.IV.6. Data Analysis
Data entry, processing and analysis for both anthropometric and mortality data were carried out
using ENA for SMART Software (October 2007 version). SPSS 15.0 and Excel 2003 were used
to carry out analyses on MUAC, Measles, immunization coverage, and other nutrition security
related data.
.V. RESULTS OF THE QUALITATIVE ASSESSMENT
.V.1. Socio- demographic Characteristics of the Respondents
A total of 468 households were assessed to collect nutrition security data. Female respondents
were 77.6%. This could be attributed to the fact that males are the main income earners and most
of the time they are not found at home. Most of the inhabitants in the surveyed areas were
permanent residents as depicted in Figure 1 below. It is important to note that most of them had
moved from camps a few years ago. The type of shelters in the study parishes were mostly grass
thatched huts with a few permanent houses. Congestion problem was reported in Abukamola and
Ogur parishes.
Resident 81.2%
Temporary resident 0.9%
Returnee 17.9%
Figure 1: Residency status of surveyed households
Figure 2 shows the distribution of livelihood sources. Most households’ source of livelihood was
crop farming (72.5%). Others sources of livelihood included mixed farming (20.4%), petty trade
(1.6%), permanent jobs (4.0%), temporary jobs (0.6%) and other (0.8%). The major crops grown
were cereals such as maize, millet, sorghum and vegetables (cowpea leaves). Prior to the
conflict, cultivation of millet and sorghum was of significant importance. Farmers produced large

14
quantities of corn, sweet potatoes, cassava, peas, beans, rice and various vegetables (ACF
nutritional survey report in Lira, April 2008). The past conflict is likely to have contributed to heavy
reliance on crop farming in comparison to livestock keeping. Households lost some of their assets
including capacity to rear large herds of livestock during the conflict. It is important to note that
crop farming / cultivation being a source of food as well as income may contribute to food
insecurity problem especially in times of crop failure, unfavorable weather conditions and
competing interests between food and money.
0 10 20 30 40 50 60 70 80
Permanent job
Temporary job
Petty trade
Crop farming
Mixed farming
Others
Liv
elih
oo
d o
pti
on
Percentage
Figure 2: Livelihood source
.V.2. Food Security
For most households, the main source of food in the month of August was cultivation (87.9%).
Most households were observed harvesting maize while a few were planting for the second
cropping season. Those who bought food constituted 9.3% of the respondents while a very small
proportion depended on livestock, food aid and kinship support.
0
10
20
30
40
50
60
70
80
90
100
Cultivation Buying Kinship support Others
Food source
Percentage
Figure 3: Household main source of food
The major food groups consumed in the last 24 hours preceding the interview were cereals,
vegetables and legumes. Tubers, roots, plantains, fish, fruits and animal products were the least

15
consumed food groups. This is interesting to note because the ACF Nutrition survey report for
Lira (April 2008) reported that most households (89%) owned livestock with every household
owning an average of 3 chickens, 2 pigs, 2 goats and 3 cows. This is attributed to the fact that
culturally animals are kept for prestige and as a source of income. Findings from key informants
and observation revealed that most households had granaries and were observed sun drying
sorghum, millet and maize. The average household dietary diversity score was 3. The score is
low on a scale of 12 and indicates a poor household economic access to food.
The main coping strategies to mitigate food scarcity were reduction of food quantity consumed
per meal (44%). Other coping strategies included reduction in number of meals, consumption of
low quality food, borrowing of food and money. Only 0.2% of the respondents had never faced
food scarcity. Figure 4 below illustrates the findings.
0 10 20 30 40 50
Borrow food
Borrow money
Food reduction per meal
Meal reduction
Sell assets
Eat low quality food
Others
Coping strategies
Percentage
Figure 4: Coping strategies
.V.3. Health and Nutrition
Health facilities present were government health centers (I to IV), private health facilities and local
pharmacies / drug shops. Key informants reported availability of at least 1 government health
facility in most of the parishes except Oculokori. Respondents reported that on falling sick they
mainly sought treatment from public health facilities (94.2%), private health facilities (3.6%)
pharmacies or drug shops (1.9%) and others such as traditional healers (0.2%). Access to health
services was determined by cost and proximity to the health facilities. Majority of the households
(62.4%) required 1 - 2 hours to access the health facilities. Furthermore, 11.8% of the households
required 2 hours and above to access the health facilities.
Measles immunization coverage was 88.1% of which 33.3% was confirmed by cards and 54.7%
by caretakers. The coverage shows a slight improvement of 3.7% from the previous year’s
results. The national target for measles coverage is 100%.
16
The majority (81.5%) of under-five children were reported to have been ill in the two weeks
preceding the survey. The most prevalent cause of morbidity was malaria (68.8%). Other
common diseases were acute respiratory infections (18.5%), diarrhea (5.9%), and skin infections
(3.7%). In addition there were cases of worm infestations, HIV/AIDS and sickle cell anaemia
reported among (3.1%) of the children. High prevalence of malaria was attributed to bushy
environment and swamps that encourage mosquito breeding.
0.23 [0.06 – 0.39] /10,000/day and 0.29 [0.00 – 0.65] /10,000/day crude and under five mortality
rates were obtained respectively. Analytically, both findings fall below the mortality alert and
emergency levels.
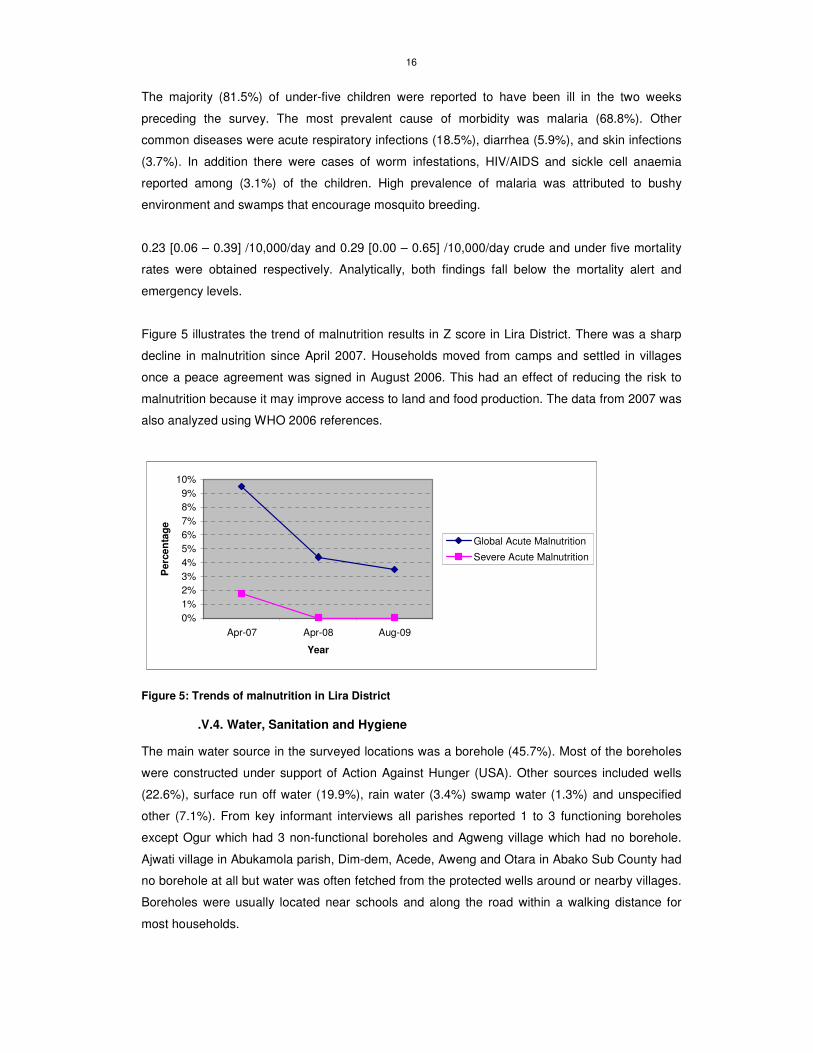
Figure 5 illustrates the trend of malnutrition results in Z score in Lira District. There was a sharp
decline in malnutrition since April 2007. Households moved from camps and settled in villages
once a peace agreement was signed in August 2006. This had an effect of reducing the risk to
malnutrition because it may improve access to land and food production. The data from 2007 was
also analyzed using WHO 2006 references.
0%
1%
2%
3%
4%
5%
6%
7%
8%
9%
10%
Apr-07 Apr-08 Aug-09
Year
Perc
en
tag
e
Global Acute Malnutrition
Severe Acute Malnutrition
Figure 5: Trends of malnutrition in Lira District
.V.4. Water, Sanitation and Hygiene
The main water source in the surveyed locations was a borehole (45.7%). Most of the boreholes
were constructed under support of Action Against Hunger (USA). Other sources included wells
(22.6%), surface run off water (19.9%), rain water (3.4%) swamp water (1.3%) and unspecified
other (7.1%). From key informant interviews all parishes reported 1 to 3 functioning boreholes
except Ogur which had 3 non-functional boreholes and Agweng village which had no borehole.
Ajwati village in Abukamola parish, Dim-dem, Acede, Aweng and Otara in Abako Sub County had
no borehole at all but water was often fetched from the protected wells around or nearby villages.
Boreholes were usually located near schools and along the road within a walking distance for
most households.

17
Most households (85%) did not treat water before drinking despite the fact that more than 50% of
the water sources are reported to not be safe. Only 2.4% of the households used chemicals such
as water guard and aqua safe while 6.0% filtered water. Ogur parish was one of the locations in
which households had limited access to safe water. The majority of the households in the
surveyed area (95.5%) stored drinking water in pots. Jerricans were also used by some
households (3.8%) despite the poor hygiene that was associated with them.
Poor sanitation coupled with unsafe water sources increases the risk of water-borne diseases.
Among the assessed households, 81.8% had access to a latrine. Almost 70% of these
households owned the latrines. Most households in Otuke County did not have any access to
latrines and hence disposed off human waste in bushes.
The pit latrine was the most common type except in Ogur parish, where plastic ones were noted.
These pit latrines were poorly constructed, lacked vent pipes and were small in size. However,
respondents noted that the appalling state of latrines was due to limited resources and the fact
that people were just settling into their homes after coming from IDP camps. Respondents who
lacked latrines seemed unaware of the dangers of living without one.
.V.5. Child care practices
The current Infant and Young Child Feeding (IYCF) recommendations in Uganda include:
exclusive breastfeeding up to at least 6 months, timely introduction of complementary feeds such
as porridge and continued breastfeeding until 2 years of age or beyond. A child between 6 and 8
months should eat 2 – 3 meals and 1 – 2 snacks per day. A child of age 9 - 11 requires 3 – 4
meals and 1 - 2 snacks per day. The child should be able to eat most family foods and snacks by
the age of 1 year. The use of locally available nutritious foods in the right consistence and nutrient
density, active feeding and high standards of hygiene when handling the infant’s food or water
safety are also recommended. In addition, counseling and support for mothers to space births 2-3
years apart and continued growth monitoring through five years of age are components of the
IYCF guidelines (Policy Guidelines on IYCF- MOH, 2009).
The results indicated that out of 53 households with infants 0-6 months, 84.9% exclusively
breastfed the infants and 15.1% used breast milk and other foods such as soups and cereal
porridge. No assessed household practiced complete replacement feeding. Almost half of the
children (48.5%) were fed on 2 meals per day. Very few households (1.3%) fed children on more
than 4 meals per day (Figure 5). According to Infant and Young Child Feeding (IYCF)
recommendations of a minimum of 2 meals per day, children in the assessed communities
require improved feeding. It was also observed that some children had distended stomachs and
skin rashes (sign of worm infestation) and wore dirty garments.

18
0 10 20 30 40 50
Percentage
Nu
mb
er
of
meals
Number of meals consumed by children 5 years and below in the last 24 hours
No children < 5 years
4
3
2
1
Figure 6: Number of meals consumed by children below 5 years of age in the last 24 hours
The table below lists organizations running various programs in Lira District. Table 3: List of organizations working in Lira district and fields of activity
Sector Organization
Agriculture
and Food
Security
Action Against Hunger (ACF-USA), Agricultural Cooperative Development
International /Volunteers Overseas Cooperative Assistance (ACDI/VOCA),
Facilitation for Integrated Community Rural Development (FICRO), World Food
Programme (WFP) and Lira Community Development Association (LICODA).
Health and
Nutrition
District Health Office (DHO), Action Against Hunger (ACF-USA), Marie Stopes
Uganda (MSU), World Health Organization (WHO), Northern Uganda Malaria,
AIDS and Tuberculosis (NUMAT), Canadian Physicians for AID and Relief
(CPAR), United Nations Children’s Fund (UNICEF), Medical Teams International
(MTI), UNFPA, AIDS Information Center (AIC), Reproductive Health Uganda
(RHU) and UNFPA.
WASH ACF-USA, UNICEF, Catholic Relief Services (CRS), CARE, COOPI and Uganda
Red Cross.
Protection
and Education
Uganda Red Cross Society (URCS) and Education Development Advocacy with
Principled Integrity (EDAPRI)

19
.VI. RESULTS OF THE ANTHROPOMETRIC SURVEY
.VI.1. Distribution by Age and Sex
Table 4: Distribution by Age and Sex
Age in months
Boys Girls Total Sex ratio
N % N % N % Boy: Girl
6-17 87 57.6 64 42.4 151 25.1 1.4
18-29 64 53.3 56 46.7 120 20.0 1.1
30-41 74 47.4 82 52.6 156 26.0 0.9
42-53 56 50.5 55 49.5 111 18.5 1.0
54-59 34 54.0 29 46.0 63 10.5 1.2
Total 315 52.4 286 47.6 601 100.0 1.1
An overall sex ratio of 1.1 falls within the acceptable range of 0.8 – 1.2. However, there were
more boys than girls in the sample.
Figure 7: Distribution by Age and Sex
-60% -40% -20% 0% 20% 40% 60%
Percentage
"6-17
18-29
30-41
42-53
54-59
Ag
e g
rou
p
Boys
Girls
20
.VI.2. Anthropometrics Analysis
.VI.2.1. Acute Malnutrition defined in Weight for Height
� Distribution of Acute Malnutrition in Z-Scores
Table 5: Weight for Height distribution by Age in Z - scores and / or oedema (WHO Reference)
Severe wasting
(<-3 z-score)
Moderate
wasting
(>= -3 and <-2 z-
score )
Normal
(> = -2 z
score)
Oedema
Age (months)
Total no.
No. % No. % No. % No. %
6-17 151 0 0.0 10 6.6 141 93.4 0 0.0
18-29 120 0 0.0 5 4.2 114 95.0 1 0.8
30-41 156 0 0.0 3 1.9 153 98.1 0 0.0
42-53 111 0 0.0 0 0.0 111 100.0 0 0.0
54-59 63 0 0.0 2 3.2 61 96.8 0 0.0
Total 601 0 0.0 20 3.3 580 96.5 1 0.2
Table 6: Weight for Height distribution by Age in Z - scores and / or oedema (NCHS Reference)
Severe wasting
(<-3 z-score)
Moderate
wasting
(>= -3 and <-2 z-
score )
Normal
(> = -2 z
score)
Oedema
Age (months)
Total no.
No. % No. % No. % No. %
6-17 151 0 0.0 9 6.0 142 94.0 0 0.0
18-29 120 0 0.0 6 5.0 113 94.2 1 0.8
30-41 156 0 0.0 3 1.9 153 98.1 0 0.0
42-53 111 0 0.0 0 0.0 111 100.0 0 0.0
54-59 63 0 0.0 1 1.6 62 98.4 0 0.0
Total 601 0 0.0 19 3.2 581 96.7 1 0.2
Table 7: Weight for Height Vs Oedema in Z - scores (WHO and NCHS Reference)
WHO 2006 NCHS 1977 WEIGHT FOR
HEIGHT <-3 SD ≥ -3 SD <-3 SD ≥ -3 SD
OEDEMA YES Marasmic kwashiorkor
0 (0.0 %)
Kwashiorkor 1 (0.2 %)
Marasmic kwashiorkor
0 (0.0 %)
Kwashiorkor 1 (0.2 %)
NO Marasmic 0 (0.0 %)
Normal 1 (99.8 %)
Marasmic 0 (0.0 %)
Normal 600 (99.8 %)

21
A standard deviation of 0.99 was unveiled as shown in the graph below. This fell within the
acceptable range (0.8-1.2) indicating that the sample was representative.
Figure 8: Weight-for-Height z-scores based on WHO standards
� Distribution of Acute Malnutrition in Percentage of the Median
Table 8: Prevalence of malnutrition by age, based on weight-for-height percentage of the median and oedema (NCHS reference)
Severe
wasting
(<70%
median)
Moderate
wasting
(>=70% and
<80% median)
Normal
(> =80% median)
Oedema
Age
(months)
Total
no. No. % No. % No. % No. %
6-17 151 0 0.0 3 2.0 148 98.0 0 0.0
18-29 120 0 0.0 2 1.7 117 97.5 1 0.8
30-41 156 0 0.0 1 0.6 155 99.4 0 0.0
42-53 111 0 0.0 0 0.0 111 100.0 0 0.0
54-59 63 0 0.0 1 1.6 62 98.4 0 0.0
Total 601 0 0.0 7 1.2 593 98.7 1 0.2
22
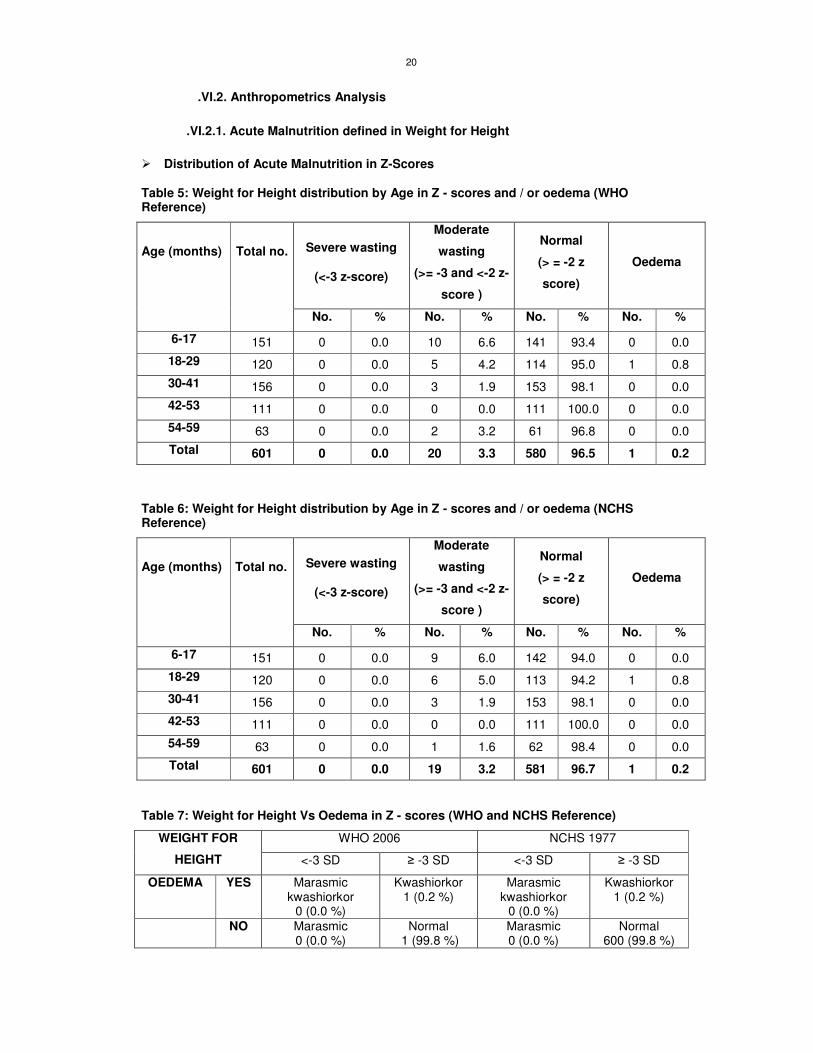
Table 9: Prevalence of acute malnutrition based on the percentage of the median and/or oedema (NCHS reference)
n = 601
Prevalence of Global Acute Malnutrition
(<80% and/or oedema) (8) 1.3 %
(0.5% - 2.2%)
Prevalence of Moderate Acute Malnutrition
(<80% and >= 70%, no oedema) (7) 1.2 %
(0.4% - 2.0%)
Prevalence of Severe Acute Malnutrition
(<70% and/or oedema) (1) 0.2 %
(0.0% - 0.5%)
.VI.2.2. Risk of Mortality: Children’s MUAC
Table 10: MUAC Distribution
< 65 - < 75 cm height
>=75 – < 90 CM height
≥≥≥≥ 90 cm height
Total MUAC (mm)
N % N % N % N %
< 115 4 3.1 1 0.4 0 0 5 0.8
≥115 and<125 8 6.3 7 2.8 0 0 15 2.5
≥125 MUAC <135
19 14.9 25 9.9 4 1.8 48 8.0
MUAC ≥ 135 96 75.6 219 86.9 218 98.2 533 88.7
TOTAL 127 21.1 252 41.9 222 36.9 601 100
According to MUAC, 2.5% and 0.8% children were moderately and severely malnourished
respectively.
.VI.3. Measles Vaccination Coverage
Table 11: Measles Vaccination Coverage*
Measles vaccination N %
Proved by Card 190 33.3
According to the mother/caretaker 312 54.7
Not immunized 63 11.1
Don’t know 5 0.9
Total 570 100.0
From the above results, 88% of the children were immunized against measles while 11.1% were
not immunized at all. The national measles immunization target is 100%.
23
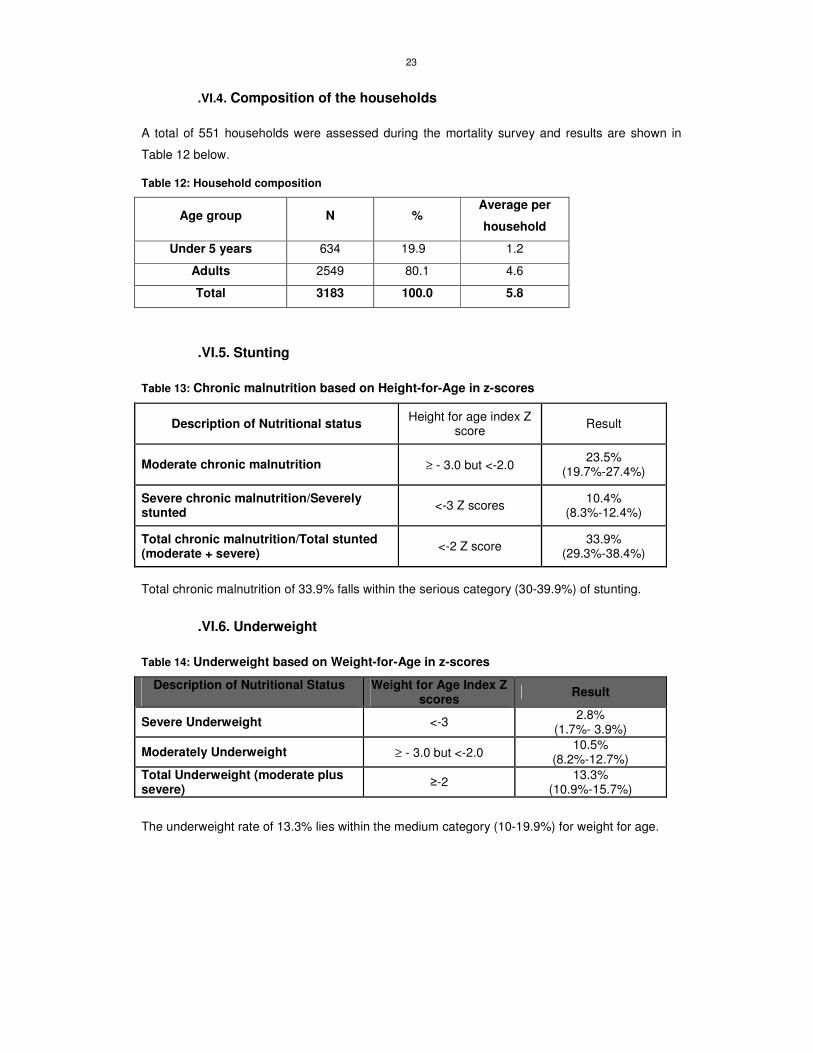
.VI.4. Composition of the households
A total of 551 households were assessed during the mortality survey and results are shown in
Table 12 below.
Table 12: Household composition
Age group N % Average per
household
Under 5 years 634 19.9 1.2
Adults 2549 80.1 4.6
Total 3183 100.0 5.8
.VI.5. Stunting
Table 13: Chronic malnutrition based on Height-for-Age in z-scores
Description of Nutritional status Height for age index Z
score Result
Moderate chronic malnutrition ≥ - 3.0 but <-2.0 23.5%
(19.7%-27.4%)
Severe chronic malnutrition/Severely stunted
<-3 Z scores 10.4%
(8.3%-12.4%)
Total chronic malnutrition/Total stunted (moderate + severe)
<-2 Z score 33.9%
(29.3%-38.4%)
Total chronic malnutrition of 33.9% falls within the serious category (30-39.9%) of stunting.
.VI.6. Underweight
Table 14: Underweight based on Weight-for-Age in z-scores
Description of Nutritional Status
Weight for Age Index Z scores
Result
Severe Underweight <-3 2.8%
(1.7%- 3.9%)
Moderately Underweight ≥ - 3.0 but <-2.0 10.5%
(8.2%-12.7%)
Total Underweight (moderate plus severe)
≥-2 13.3%
(10.9%-15.7%)
The underweight rate of 13.3% lies within the medium category (10-19.9%) for weight for age.
24
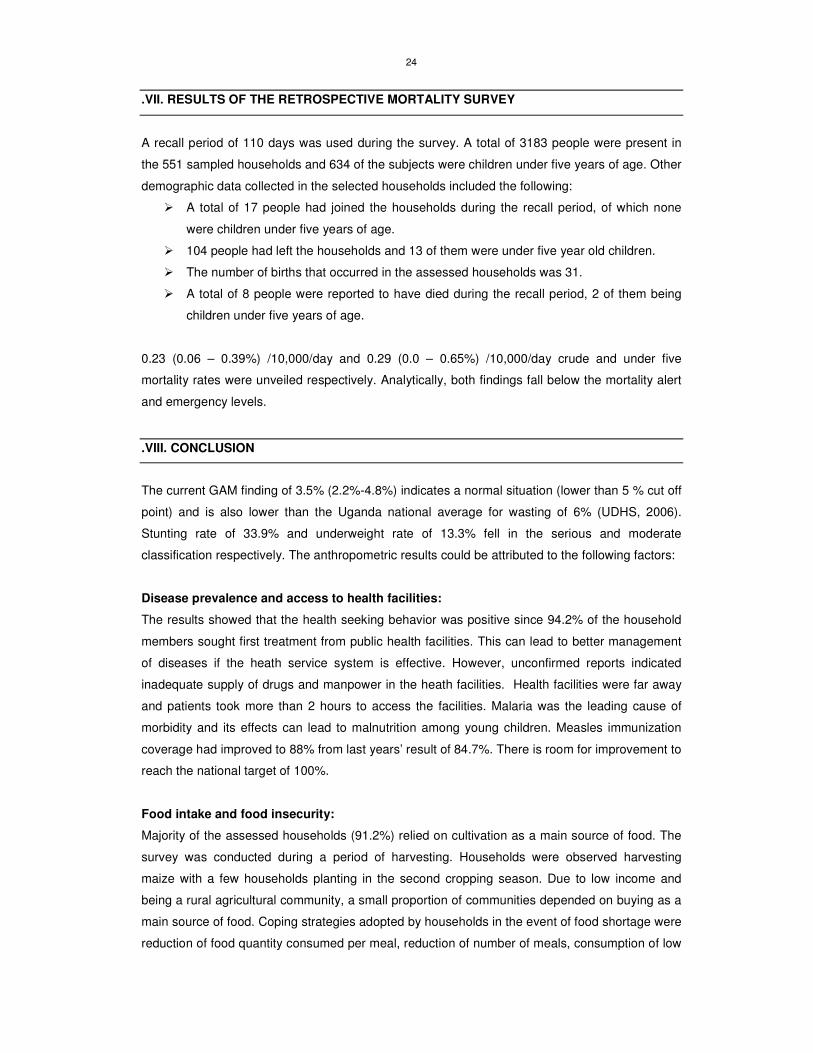
.VII. RESULTS OF THE RETROSPECTIVE MORTALITY SURVEY
A recall period of 110 days was used during the survey. A total of 3183 people were present in
the 551 sampled households and 634 of the subjects were children under five years of age. Other
demographic data collected in the selected households included the following:
� A total of 17 people had joined the households during the recall period, of which none
were children under five years of age.
� 104 people had left the households and 13 of them were under five year old children.
� The number of births that occurred in the assessed households was 31.
� A total of 8 people were reported to have died during the recall period, 2 of them being
children under five years of age.
0.23 (0.06 – 0.39%) /10,000/day and 0.29 (0.0 – 0.65%) /10,000/day crude and under five
mortality rates were unveiled respectively. Analytically, both findings fall below the mortality alert
and emergency levels.
.VIII. CONCLUSION
The current GAM finding of 3.5% (2.2%-4.8%) indicates a normal situation (lower than 5 % cut off
point) and is also lower than the Uganda national average for wasting of 6% (UDHS, 2006).
Stunting rate of 33.9% and underweight rate of 13.3% fell in the serious and moderate
classification respectively. The anthropometric results could be attributed to the following factors:
Disease prevalence and access to health facilities:
The results showed that the health seeking behavior was positive since 94.2% of the household
members sought first treatment from public health facilities. This can lead to better management
of diseases if the heath service system is effective. However, unconfirmed reports indicated
inadequate supply of drugs and manpower in the heath facilities. Health facilities were far away
and patients took more than 2 hours to access the facilities. Malaria was the leading cause of
morbidity and its effects can lead to malnutrition among young children. Measles immunization
coverage had improved to 88% from last years’ result of 84.7%. There is room for improvement to
reach the national target of 100%.
Food intake and food insecurity:
Majority of the assessed households (91.2%) relied on cultivation as a main source of food. The
survey was conducted during a period of harvesting. Households were observed harvesting
maize with a few households planting in the second cropping season. Due to low income and
being a rural agricultural community, a small proportion of communities depended on buying as a
main source of food. Coping strategies adopted by households in the event of food shortage were
reduction of food quantity consumed per meal, reduction of number of meals, consumption of low

25
quality food and borrowing of food and money. The diet of the households was less diversified
with most households consuming cereals and vegetables. Animal products, fruits, fish and tubers
were the least consumed foods.
Water and sanitation situation:
The main source of water was boreholes (45.7%) that were constructed by Action Against Hunger
-USA. Key informant interviews revealed that all parishes had 1 to 3 functional boreholes except
Ogur which had 3 non-functional boreholes. Ajwati village in Abukamola parish, Agweng, Dim-
dem, Acede, Aweng and Otara in Abako Sub County had no boreholes and households fetched
water from protected wells around or nearby villages. Boreholes were usually located near
schools and along the road within a walking distance for most households. Most households
(85%) did not treat water before drinking despite the fact that more than 50% of the water sources
might not be safe. Water was usually stored in pots and plastic containers. The plastic containers
were generally dirty and mould could be spotted.
Poor sanitation coupled with unsafe water sources increases the risk of water-borne diseases.
Among the assessed households (81.8%) had access to a latrine. However, most households in
Otuke County did not have access to latrines and hence disposed off human waste in bushes.
Child care practices:
The use of locally available nutritious foods in the right consistency and nutrient density, active
feeding and high standards of hygiene when handling the infant’s food or water safety are
recommended in the Uganda IYCF guidelines. In addition, counseling and support for mothers to
space births 2-3 years apart and continued growth monitoring through five years of age is also
recommended. Exclusive breast feeding was widely practiced (84.9%). In addition, almost half of
the children were fed on 2 meals per day (48.5%). Very few households (1.3%) fed children on
more than 4 meals per day. According to IYCF recommendations, slightly above 50% of the
children in the assessed community received fewer than the recommended meals per day. It was
also observed that some children had distended stomachs and skin rashes (sign of worm
infestation) and clothed in dirty garments.
.IX. RECOMMENDATIONS
Health and Nutrition
� To collaborate with the District Health Office (DHO) in capacity building so that all health
facilities have the capacity to treat Severe Acute Malnutrition. Training of nutrition and
health workers on application of the new WHO standards in detection and treatment of
malnutrition is required.
� To disseminate and promote use of National Nutrition Survey Guidelines. Participants in
the Northern region training should take an active role in applying the guidelines.

26
� To introduce nutrition and health education sessions at community level, with an
emphasis on breastfeeding, weaning, complementary foods, balanced diets and
prevention of malaria, acute respiratory infections and diarrhoea. Target groups should
include both men and women.
� To improve availability and access to drugs in the health facilities.
� To sensitize the communities on the importance of eating animal products to complement
plant sources of food. Diet diversification is essential in improving the quality of diets.
Food security
� To enhance food production through increased acreage and use of technologies such as animal traction.
� To promote access to income through cash based program and marketing of local produce.
Water and sanitation
� Government and other partners are recommended to make efforts and construct
boreholes in Ajwati, Dim- Dem, Acede, Aweng and Otara villages. The parishes affected
include Abukamola, Along, Arwot Omito and Abunga.
� To increase emphasis on hygiene and sanitation activities such as: safe water
access/treatment, proper water storage, water sources protection, human and garbage
disposal. Households especially in Otuke County lacked latrines.

27
.X. APPENDIX
.X.1. Sample Size and Cluster Determination
Sub county Parish Pop Cluster Sub county Parish Pop Cluster
Acutcum 3231 Abongatin 5097
Apua 3179 1 Abunga 7197 21
Apuce 3778 Ajonyi 4850
Arwot Omito 6016 2
AMUGU
Omee 7680 22
Barpii 4397 Abia 6445 23
Odora 3148 Abiting 6216
Otara 3703 3 Atinkok 6760 24
AROMO
Walela 5185 Obim 5233
Abunga 5944 4 Okwangole 7087 25
Alebere 5252
APALA
Otena 6804
Ayira 7786 5 Abukamola 6210 26
Ober 5750 Angetta 8418 27
Olilo 6178 6 Alolololo 3677
Onywako 7785 Ocokober 3238
BARR
Ayamo 2262 7 Oculokori 2725 28
Abala 5810
OMORO
Omarari 5118
Adwoa 4288 8 Agweng 4334
Akangi 6545 Alango 7721 29
Akano 5527 9 Okere 3024
Angolocom 7567 Olarokwon 3245 30
Apoka 6986 10
ADWARI
Omito in Adwari 3310
Ogur 8445 11 Amoyai 3491
OGUR
Orit 6030 Arwotngo 3305 31
Acede 7007 12 Barocok 1892
Alanyi 9483 13 Olworongu 3591
Amoneno 8891
OKWANG
Opejal 3591
Awapiny 7506 14 Amunga 2375 32
Ojul 5167 15 Anepkide 2035
Olyet 4210 Angetta in Olilim 5436
ABAKO
Owalo 5652 Atira 2041
Akura 4376 16 Got Ojwang 2484 33
Akwangkel 7603 17
OLILIM
Ogwete 1374
Alal 8454 Alangi/Bar-odugu 3650
Alebtong 9151 18 Anepmoroto 4297 34
Anara 4298 Anyalima 1508
Anyanga 4355 19 Atangwata 1852
Aweipek 4914
ORUM
Ating/Abongorwoa 2850
ALOI
Otweotoke 6301 20

28
.X.2. Anthropometric data collection form for children 6-59 months
Anthropometric data collection form for children 6-59 months Village/zone: __________________ Date: _________________ Cluster number: _______ Team number: _______
Child
no.
HH. No.
Sex (F/M)
Age in month
s
Weight (kg)
±±±±0.1 kg
Height/ Length
10 (cm)
±±±±0.1cm
Oedema (Y/N)
MUAC (mm)
Measles11
Vaccination
Illness in the last 2 weeks
12
1
2
3
4
5
6
7
8
9
10
11
12
13
14
15
16
17
18
19
20
21
22
Case definition: Diarrhea is an episode of more than three stools per day; Bloody
diarrhea is an episode of more than three stools with blood stains per day; ARI is an
episode with associated fever and cough and at least one of the following signs: sputum,
thoracic pain, dyspnoea, wheezing; Fever is an elevated body temperature (confirm if
test was done).
10
Height measurement standing when child is ≥24 months( height proxy ≥87 cm) 11
1 = Yes (with card); 2= Yes (without card); 3= No; 4= Not applicable for children below 9 months. 12
1= No illness; 2= malaria; 3= diarrhea; 4= ARI; 5= skin disease; 6=other(specify)

29
.X.3. Household enumeration data collection form for a death rate calculation survey (one sheet/household)
Survey district: Village: Cluster number: HH number: Date: Team number:
1 2 3 4 5 6 7
ID HH
member Present
now
Present at beginning of recall (include those not present now and indicate which members
were not present at the start of the recall period )
Sex Date of
birth/or age in years
Born during recall
period?
Died during the recall
period
1
2
3
4
5
6
7
8
9
10
11
12
13
14
15
16
17
18
19
20
Tally (these data are entered into ENA for each household):
Current HH members – total
Current HH members - < 5
Current HH members who arrived during recall (exclude births)
Current HH members who arrived during recall - <5 Past HH members who left during recall (exclude deaths)
Past HH members who left during recall - < 5
Births during recall13
Total deaths
Deaths < 5
13
If the child subsequently died during the recall period tally up as death ONLY

30
.X.4. Enumeration data collection form for a death rate calculation survey (one sheet/cluster)
Parish: Village: Cluster number: HH number: Date: Team number:
Current HH
member
Current HH
members who
arrived during recall
(exclude births)
Past HH members
who left during
recall
(exclude deaths)
Deaths during recall N
Total < 5 Total <5 Total < 5
Births
during
recall
Total < 5
1
2
3
4
5
6
7
8
9
10
11
12
13
14
15
16
17
18
19
20
21
22
23
24
25
31
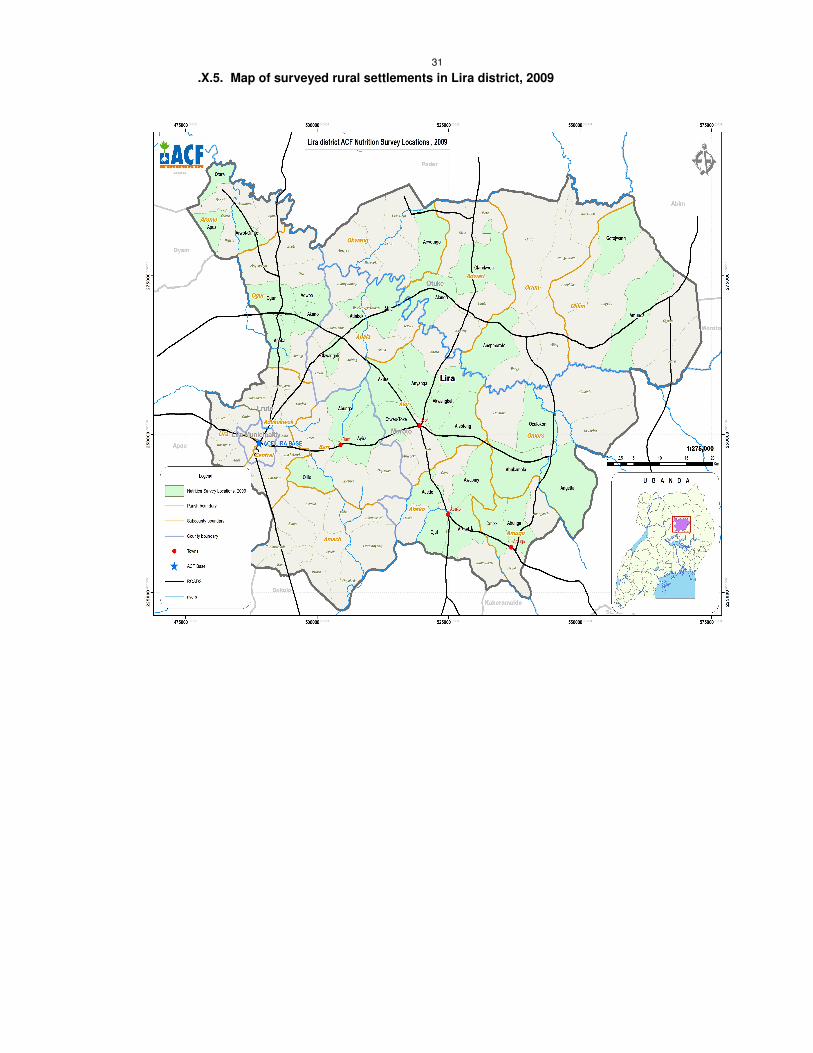
.X.5. Map of surveyed rural settlements in Lira district, 2009

32
.X.6. Calendar of events, Lira District, August 2009
MONTH ANNUAL EVENTS
EVENTS PER MONTH AND PER YEAR
2004 2005 2006 2007 2008 2009
JANUARY
1ST
new year, 26
th victory day
55
43
31
19
Swearing in for President Barrack Obama, USA
7
FEBRUARY
Cleaning the field, opening school
54
23rd presidential
elections (Multiparty)
42
30
18
6
MARCH
Women’s day, Sea-nut season
Beginning of rainy season, Barlonyo attack 7 march 2004,
Beginning of rainy season,
53
Beginning of rainy season, National LC3 & LC5 elections
41
Beginning of rainy season
29
Beginning of rainy season
17
Beginning of rainy season
5
APRIL
Easter, White-aunt season, Fools day 1
st Day
52
40
28
Fire outbreak at Buddo Junior Primary School
16
4
MAY
1st labor day,
Mango season
51
39
27
15
National Child Health Days Plus (Ministry of Health/EPI)
3
JUNE
3RD
martyrs day, 9
th heroes day
Attack on Aboke girls 28 people killed and 7 abducted
Graduated tax scrapped
50
38
26
14
2
JULY
Harvest of millet Harvest 1st
session
Harvest 1st
session 49
Harvest 1st
session 37
25
13
Harvest 1st
session 1
AUGUST
Ascension day
John Garang died
48
Uganda and LRA rebels signed a truce to end war in Juba, Peace talks in Juba
36
Plan crash killed 72 soldiers
24
12
0
SEPTEMBER
Weeding of 2nd
session
59
47
35
Flooding washed away towns and lives in Teso region
23
11
OCTOBER
9th independence
day
58
Death of former president Milton Obote 10/10/05
46
Museveni meets LRA rebels 34
Floods
22
10
NOVEMBER
Harvest of maize and millet
Harvest 2nd
session
57
Harvest 2nd
session, Dr.Kizza Besigye arrested
45
Harvest 2nd
session
33
Harvest 2nd
session
21
Election day for President Barrack Obama
9
DECEMBER
25th Christmas,
26th boxing day
Peace talks failed and Museveni declared war
56
44
Sadam Hussein executed 32
20
8

33