MINIREVIEW Adhesin Presentation in Bacteria Requires Molecular Chaperones and Ushers

Vision Research 39 (1999) 2749–2766
Minireview
Motion detection in insect orientation and navigation
Mandyam V. Srinivasan a,*, Michael Poteser b, Karl Kral b
a Centre for Visual Science, Research School of Biological Sciences, Australian National Uni6ersity, PO Box 475, Canberra, ACT 2601, Australiab Institute of Zoology, Karl-Franzens-Uni6ersity Graz, A-8010 Graz, Austria
Received 31 August 1998; received in revised form 7 December 1998
Abstract
The visual systems of insects are exquisitely sensitive to motion. Over the past 40 years or so, motion processing in insects hasbeen studied and characterised primarily through the optomotor response. This response, which is a turning response evoked bythe apparent movement of the visual environment, serves to stabilise the insect’s orientation with respect to the environment.Research over the past decade, however, is beginning to reveal the existence of a variety of other behavioural responses in insects,that use motion information in different ways. Here we review some of the recently characterised behaviours, describe the inferredproperties of the underlying movement-detecting processes, and propose modified or new models to account for them. © 1999Elsevier Science Ltd. All rights reserved.
Keywords: Insect; Vision; Movement detection; Range perception
1. Introduction
Research over several decades has revealed that thevisual systems of insects are exquisitely sensitive tomotion. Studies of the optomotor response and thevisually evoked landing response have contributedgreatly towards the understanding and characterisationof some of the movement-detecting mechanisms in theinsect visual pathway. Indeed, the so-called correlationmodel of motion detection emerging from these studiesis turning out to provide an excellent description ofcertain motion-dependent behaviours not only in in-sects, but also in a number of other phyla includingman (e.g. Nakayama, 1985; Borst & Egelhaaf, 1989;van den Berg & van de Grind, 1989; Emerson, Bergen& Adelson, 1992; Ibbotson, Mark & Maddess, 1994;Wolf-Oberhollenzer & Kirschfeld, 1994).
More recently, however, investigation of certainother behaviours in insects is beginning to reveal thepresence of motion-sensitive processes with properties
rather different from those of the classical ones. In thisarticle we begin by briefly reviewing the classical re-sponses and the mechanisms which subserve them. Wethen describe some of the recently studied behaviours,discuss the ways in which the underlying movementcomputations are different, and propose extended,modified or new models to account for the differences.
2. The classical behaviours
2.1. The optomotor response
An insect, flying tethered inside a striped drum (Fig.1a), will tend to turn in the direction in which the drumis rotated (Reichardt, 1969). If the drum rotates clock-wise the insect will generate a yaw torque in the clock-wise direction, and vice versa. This reaction serves tohelp the insect maintain a straight course by compen-sating for undesired deviations: a gust of wind thatcauses the insect to veer to the left, for example, wouldcreate rightward image motion on the eyes and causethe insect to generate a compensatory yaw to the right.Investigation of this so-called optomotor response over
* Corresponding author. Tel.: +61-2-62492409; fax: +61-2-62493808.
E-mail address: [email protected] (M.V. Srinivasan)
0042-6989/99/$ - see front matter © 1999 Elsevier Science Ltd. All rights reserved.
PII: S 0 0 4 2 -6989 (99 )00002 -4

M.V. Srini6asan et al. / Vision Research 39 (1999) 2749–27662750
Fig. 1. Properties of the optomotor response of insects. If a flying insect is suspended in a rotating striped drum, it will attempt to turn in thedirection of rotation of the drum. The resulting yaw torque, as registered by a torque transducer, is a measure of the strength of the optomotorresponse. For stripes of a given angular period (as in (a)), the normalised strength of the optomotor response is a bell-shaped function of therotational speed of the drum, peaking at a specific angular velocity of rotation (solid curve, (d)). If the stripes are made finer (as in (b)), oneobtains a similar bell-shaped curve, but with the peak shifted toward a lower angular velocity (dashed curve, (d)). If they are made coarser (asin (c)), the peak response occurs at higher angular velocities (dot-dashed curve, (d)). However, the normalised response curves coincide with eachother if they are re-plotted to show the variation of response strength with the temporal frequency of optical stimulation that the moving stripedpattern elicits in the photoreceptors, as illustrated in Fig. 1e. Thus, the optomotor response that is elicited by moving striped patterns is tunedto temporal frequency, rather than to angular velocity.
several decades has provided valuable information onsome of the characteristics of motion perception by theinsect visual system (Reichardt, 1969; Buchner, 1984;Borst & Egelhaaf, 1989).
If the angular period of the stripes is kept constantand the angular velocity (rotational speed, in deg/s) ofthe drum is varied, the strength of the optomotorresponse varies in a bell-shaped curve as shown in thesolid curve of Fig. 1d. The response is weak at very lowangular velocities (approaching a stationary drum) andvery high angular velocities, and is strong at an inter-mediate velocity. If the stripes are made finer (angularperiod decreased, Fig. 1b), one obtains a similar bellshaped curve, but with the peak shifted toward the left,to a lower angular velocity (dashed curve, Fig. 1d).Making the stripes coarser (increasing the angular pe-riod, Fig. 1c) has the opposite effect (dot-dashed curve,Fig. 1d). An interesting thing happens, however, ifthese curves are re-plotted to show the variation of theresponse as a function of the temporal frequency ofoptical stimulation that the moving striped patternelicits in the photoreceptors. This temporal frequency isgiven by the number of dark (or bright) stripes passingthe receptive field of a given photoreceptor per second.
The curves then all peak at the same temporal fre-quency and exhibit similar widths (Fig. 1e). This impliesthat the movement-detecting system underlying the op-tomotor response is not sensitive to the angular velocityof rotation of the drum per se: the angular velocity atwhich the response is strongest depends upon the angu-lar period of the stripes. The structure and connectivityof a neural circuit that would exhibit such propertieshas been investigated thoroughly (Reichardt, 1969). Aschematic of a circuit displaying the essential propertiesis shown in Fig. 2. Consider two neighbouring photore-ceptors, A and B, viewing neighbouring regions of amoving scene. Since the two photoreceptors are viewingthe same scene, they will register the same signal (i.e.the same temporal waveform of intensity variation).However, the signal from one receptor will lead or lagbehind that from the other receptor depending uponthe direction in which the scene is moving. If the signalfrom A leads that from B, it is clear that the scene ismoving from A to B (left to right); on the other hand,if the signal from A lags behind that of B, the scene ismoving from B to A (right to left). A simple way todetermine the direction of movement, then, would be to

M.V. Srini6asan et al. / Vision Research 39 (1999) 2749–2766 2751
(i) delay the signal from A and compare it with thatfrom B; and (ii) delay the signal from B and compare itwith that from A. If the delayed signal from A is morestrongly correlated with the signal from B than the
delayed signal from B is with A, it follows that thescene is moving from A to B; and if the opposite is true,the scene is moving from B to A. Thus, a scheme thatuses delay followed by multiplication can provide areliable indication of the direction of scene motion.
The scheme of motion detection that actually existsin the insect eye does not perform a simple delay-and-correlate. Rather, it incorporates temporal filters withdifferent dynamics in the two arms, as shown in Fig. 2.The photoreceptor signals are initially filtered in timeby the temporal filters labelled R, which represent thedynamics of the front end of the visual system. Thisincludes the dynamics of phototransduction, as well asthose of other processes occurring at early stages of thevisual pathway. The output of the R filter associatedwith one receptor passes through a further temporalfilter, G, and is multiplied with the output of the Rfilter associated with the neighbouring receptor, afterthat signal has been further processed by another tem-poral filter, H. The G and H filters represent thetemporal dynamics of processing at higher levels of themotion-detecting pathway, for example in the laminaand the medulla. Such a scheme detects the direction ofmovement in a manner that is qualitatively similar tothe simple delay-and-multiply scheme discussed above.It is biologically more realistic, however, since puretime delay operators are not commonly found in ner-vous systems. The model is excellent at predicting thevariation of the strength of the optomotor response asa function of the speed, spatial structure and contrastof a motion stimulus.
Movement-sensitive neurons have been discoveredand characterised in the lobule plate of the fly thatdisplay all of the characteristics of the behaviourallymeasured optomotor response (Egelhaaf & Borst, 1989;Egelhaaf, Borst & Reichardt, 1989; Hausen, 1993;Krapp & Hengstenberg, 1996; Single, Haag & Borst,1997). The responses of these neurons are also wellcharacterised by the correlation model discussed above.Thus, we may state with some confidence that theoptomotor response, and the neural pathways subserv-ing it are fairly well understood. However, the nature ofthe neural mechanisms that mediate the multiplicativesignal interaction, and the location of these mechanismsin the visual pathway remain to be elucidated.
The movement-detecting system that mediates theoptomotor response does not need to measure thespeed of motion of the image on the retina accurately.It only needs to measure the direction of image motionreliably, so as to generate a signal that is appropriatefor correcting deviations from the intended flight path.Indeed, it has been shown that the nonlinear (bell-shaped), rather than linear dependence of the optomo-tor response on image speed is actually advantageous in
Fig. 2. Correlation scheme of directionally-selective motion detection.The signals from neighbouring photoreceptors (A and B) are initiallyfiltered in time by the temporal filters R, which represent the dynam-ics of the font end of the visual system. The output of the R filterassociated with one receptor passes through a further temporal filter,G, and is multiplied with the output of the R filter associated with theneighbouring receptor, after that signal has been further processed byanother temporal filter, H. The G and H filters represent the temporaldynamics of processing at higher levels of the motion-detectingpathway. When a visual pattern moves toward the right, the signal inreceptor A will lead the signal in receptor B. But if the G filters aremore sluggish than the H filters in their response characteristics, thenthe signal arriving at the left-hand multiplier along the path A-R-Gwill tend to be temporally coincident with the signal arriving alongthe path B-R-H, resulting in a strong positive response. When avisual pattern moves toward the left, the signals arriving at theright-hand multiplier along the paths B-R-G and A-R-H will tend tobe temporally coincident, leading to a strong negative response. Thisso-called elementary motion detector (EMD) therefore produces adirectionally selective response to motion. The box labelled ‘‘Aver-age’’ represents an ensemble average (spatial summation) of theoutputs of a number of EMDs, each viewing a different patch of themoving pattern.
M.V. Srini6asan et al. / Vision Research 39 (1999) 2749–27662752
producing a control system that achieves high gainwithout becoming unstable (Warzecha & Egelhaaf,1996).
2.2. The landing response
When a tethered, flying fly encounters a loomingstimulus, it extends its forelegs in preparation to land.This landing response, which is an all-or-nothing event,can be elicited by a visual stimulus that simulates anapproaching surface by creating an expanding image.Examples of such stimuli are a pair of outwardlymoving gratings, one stimulating each eye (e.g. Eckert& Hamdorf, 1980; Borst & Bahde, 1988) or a spiralpattern rotating in such a direction as to produce theillusion of expansion (e.g. Goodman, 1960; Braitenberg& Taddei-Feretti, 1966). Experiments using such stimulisuggest that the strength of the landing response (mea-sured as the reciprocal of its latency) depends upon thespatial-frequency content and contrast of the pattern,as well as the duration of its expansion (Borst & Bahde,1988). According to the model proposed by Borst andBahde, the landing response is triggered when the time-accumulated output of a movement-detecting system,based on the correlation model, exceeds a presetthreshold.
Wagner (1982) filmed freely-flying flies approachingto land on dark spheres of various sizes, and observedsharp decelerations before landing. His data suggestthat the onset of deceleration occurs at a projected timeto contact of approximately 90 ms, regardless of thespeed of approach or size of the sphere. In other words,the visual system of the landing fly uses the relative rateof expansion of the image of the target [(dr/dt)/r, wherer denotes instantaneous target size] to compute the timeto contact. It is the time to contact, rather than the sizeor distance to the object, or the speed at which it isapproached, that decides when to initiate the decelera-tion. This conclusion is not entirely compatible withthat of Borst and Bahde discussed above. From afunctional point of view, it would obviously be advan-tageous to use a scheme which estimates time to contactindependently of the spatial structure of the objectbeing approached. Indeed, there is evidence that gan-nets plunging into the sea to catch fish (Lee & Reddish,1981) and automobile drivers braking to avoid colli-sions (Lee, 1976) control their manoeuvres by usinginformation related to the time of contact, extractedfrom the optical flow. It must be noted, however, thatnone of the above studies, apart from those of Borstand Bahde, have systematically investigated the influ-ence of object texture in this context.
From the above discussion, it is evident that thesecrets of the landing fly’s strategy have not yet beencompletely fathomed. However, at least in the case oftethered, flying flies that are exposed to an expanding
retinal image, it appears that the landing response—measured in terms of the likelihood with which theforelegs are extended—is mediated by neural mecha-nisms which utilise the correlation principle of motiondetection, just like the optomotor response.
3. Recently explored behaviours
3.1. Peering beha6iour
Unlike vertebrates, insects have immobile eyes withfixed-focus optics. Thus, they cannot infer the distanceof an object from the extent to which the directions ofgaze must converge to view the object, or by monitor-ing the refractive power that is required to bring theimage of the object into focus on the retina. Further-more, compared with human eyes, the eyes of insectsare positioned much closer together, and possess infe-rior spatial acuity. Therefore the precision with whichinsects could estimate the range of an object throughbinocular stereopsis would be much poorer and re-stricted to relatively small distances, even if they pos-sessed the requisite neural apparatus (Srinivasan, 1993).Indeed, the praying mantis is the only insect in whichbinocular vision has been conclusively demonstrated(Rossel, 1983). Not surprisingly, therefore, insects haveevolved alternative strategies for dealing with the prob-lem of range estimation.
Over 100 years ago Exner (1891), pondering theeyestalk movements of crabs, speculated that inverte-brates might use image motion to estimate object range.However, the first clear evidence to support this conjec-ture did not arrive until the late 50s, when Wallace(1959) made the astute observation that a locust swaysits head from side to side before jumping on to anearby object (Fig. 3a). Wallace hypothesised that thispeering motion, typically 5–10 mm in amplitude, was ameans of measuring object range. To test this hypothe-sis, he presented a locust with two objects subtendingthe same visual angle. One object was relatively small insize and was placed close to the locust, whilst the otherwas larger and situated further away. He found that thelocust, after peering, jumped almost invariably to thenearer object. In a further series of elegant experiments,recently confirmed more quantitatively by Sobel (1990),a target was oscillated from side to side, in synchronywith the insect’s peering movements. When the targetwas oscillated in phase with the movement of the head,thereby decreasing the speed and amplitude of theobject’s image on the retina, the locust consistencyoverestimated the range of the target (Fig. 3b); whenthe target was oscillated out of phase with the head, itunderestimated the range (Fig. 3c). This showed thatthe reduced image motion of the target caused theinsect to overestimate the range of the target, whilst

M.V. Srini6asan et al. / Vision Research 39 (1999) 2749–2766 2753
Fig. 3. Experiments investigating how locusts measure the range of a target by peering, i.e. moving the head from side to side. Range is estimatedcorrectly when the target is stationary (a), overestimated when the target is moved in the same direction as the head (b), and underestimated whenit is moved in the opposite direction (c). Thus, the range of the target is estimated in terms the motion of the target’s image during the peer. Thetake-off velocities of locusts jumping at fixed targets at various distances (d, circles) can be reproduced quite precisely (d, triangles) by keepinga target at a constant distance of 16 cm (arrow) and coupling its lateral motion to the peering head motion by using a coupling coefficient chosento simulate, in turn, the distance of each of the stationary targets in the first series of measurements. Modified from Sobel (1990).
increased motion had the opposite effect. These find-ings suggested that the peering locust was estimatingthe range of the target in terms of the speed of theimage on the retina. To investigate the phenomenonfurther, Sobel measured the take-off velocities of lo-custs when they jumped at targets at various distances(circles, Fig. 3d). He then compared these velocitieswith the take-off velocities when they jumped at atarget which was positioned at a constant distance of 16cm (arrow, Fig. 3d) but whose lateral movement wascoupled to the locust’s peering using various couplingcoefficients (gains). These coefficients were chosen tosimulate, in turn, the distance of each of the stationary
targets in the first set of measurements. The take-offvelocities elicited by the moving target (triangles, Fig.3d) were very close to those elicited by the stationarytargets at the corresponding distances. This experimentproves, neatly and convincingly, that a peering locustestimates the range of the target in terms of the motionof the target’s image on the retina. Furthermore, rangeis computed as a precise, continuous function of imagemotion.
Normally, when a locust peers at a stationary target,the image of the target in the compound eye moves ina direction opposite to that of the head. Sobel (1990)investigated the properties of the locust’s range-estimat-

M.V. Srini6asan et al. / Vision Research 39 (1999) 2749–27662754
ing mechanism further by artificially moving the targetin the same direction as the head, but at a speed thatwas high enough that the retinal image of the targetmoved in the same direction as the head. The speed ofthe target was adjusted such that the target’s imagemoved at the speed of the image of a stationary targetat the same distance, but in the opposite direction.Although this was a situation that the locust wouldnormally never encounter in nature, it continued tojump at the target, estimating its distance, as before, tobe that corresponding to the speed of the target’s imageon the retina. In other words, the locust behaved as ifit paid attention only to the speed of the target’s imageon the retina, and was oblivious to the direction inwhich the image moved. Thus, range appears to becomputed with the aid of a non-directional movement-sensitive system. One way to test this would be move atarget in various directions (horizontally, vertically, andin oblique directions) while a locust is peering at it.Such an experiment has not yet been carried out onlocusts, but recent work on the praying mantis, whichalso uses peering to estimate range, as described furtherbelow, suggests that mantids ignore the vertical compo-nent of the target’s motion and respond only to thehorizontal component (Kral, 1998).
In principle, there are several ways in which peeringcan be used to determine the range of a target. Someare: (i) Holding the peering speed constant, in whichcase the range of the target is inversely proportional tothe speed of the image; (ii) allowing peering speed tovary, but holding the peering amplitude constant, sothat target range can be computed in terms of the ratioof peering amplitude to the amplitude of image motion;(iii) adjusting peering amplitude such that the ampli-tude of motion of the target’s image is constant, possi-bly at a threshold level, and estimating target range interms of peering amplitude; this would predict peeringamplitude to increase linearly with target range; (iv)adjusting peering speed such that the speed of motionof the target’s image is constant, possibly at a thresholdlevel; this would predict peering speed to increase lin-early with target range; (v) allowing the amplitude andspeed of peering to vary arbitrarily, but monitoringthese quantities and estimating the range of the targetin terms of the ratio of peering speed to image speed (orthe ratio of peering amplitude to the amplitude ofimage motion).
Some of the above questions have been addressed inrecent studies on mantids, which appear to use range-extraction mechanisms that are at least qualitativelysimilar to those used by locusts (Horridge, 1986;Walcher & Kral, 1994; Poteser & Kral, 1995; Kral &Poteser, 1997). While locusts use peering to estimate thepower of the jump required to reach the target, mantidshave a comparatively short jumping range and seem touse peering mainly to determine whether the target is
within jumping range (Kral & Poteser, 1997; Kral,1998; Poteser, Pabst & Kral, 1998). Experimental ob-servations on mantids show that the amplitude as wellas the speed of head motion are variable and largelyindependent of target range (Poteser & Kral, 1995; Kral& Poteser, 1997). This indicates that range informationcannot be derived from head motion alone: it must becomputed by comparing head motion with the resultingimage motion, as proposed in (v) above. This hypothe-sis is corroborated by a recent study on the prayingmantis, which shows that surgical deafferentation of theproprioceptive hair plate sensilla in the neck does notaffect head motion, but impairs the estimation of range(Poteser et al., 1998).
Peering can also serve to detect a target when itpossesses the same texture as a more distant back-ground: the target pops out during peering because itsimage moves more rapidly than that of the more distantbackground (Collett & Paterson, 1991). Motion paral-lax cues of this sort are also used by flies (Egelhaaf,Hausen, Reichardt & Wehrhahn, 1988) and bees (Srini-vasan, Lehrer & Horridge, 1990) to segregate objectsfrom similarly textured backgrounds. It appears, how-ever, that the range of such a target, as estimated by apeering locust, is determined primarily by the motion ofthe target’s image, and only secondarily by the extent ofrelative motion (motion parallax) that occurs at theboundary between the images of the target and thebackground (Collett & Paterson, 1991).
In summary, the studies of peering suggest that therange of a target is estimated by a movement-detectingmechanism that measures the speed and/or displace-ment of the target’s image and compares this informa-tion with the speed and/or displacement of the head. Inthe case of mantids, image motion seems to be mea-sured only in the equatorial plane.
3.2. The centring response
When a bee flies through a narrow gap, it tends to flythrough its centre. How does the insect, lacking stereovision, gauge and balance the distances to the sides ofthe gap? One possibility is that it simply balances thespeeds of image motion on the two eyes. This hypothe-sis was investigated by training bees to enter an appara-tus which offered a reward of sugar solution at the endof a tunnel (Srinivasan, Lehrer, Kirchner & Zhang,1991). Each side wall carried a pattern consisting of avertical black-and-white grating (Fig. 4). The grating onone wall could be moved horizontally at any desiredspeed, either towards the reward or away from it. Afterthe bees had received several rewards with the gratingsstationary, they were filmed from above, as they flewalong the tunnel.
When both gratings were stationary, the bees tendedto fly along the midline of the tunnel, i.e. equidistant

M.V. Srini6asan et al. / Vision Research 39 (1999) 2749–2766 2755
Fig. 4. Experiment investigating how bees fly through the middle of a tunnel (the centring response). Bees are trained to fly through a tunnel tocollect a reward placed at the far end. The walls of the tunnel are lined with vertical black-and-white stripes, as shown in the upper left-hand panel.The flight trajectories of bees, as recorded by a video camera positioned above the tunnel, are shown in (a)–(f). In each panel the shaded arearepresents the mean and standard deviation of the positions of the flight trajectories, analysed from recordings of several hundred flights. The darkbars represent the black stripes of the patterns on the walls. The small arrow represents the direction of bee flight, and the large arrow the directionof pattern movement, if any. When the patterns on the walls are stationary, bees tend to fly close to the midline of the tunnel (a, d). When thepattern on one of the walls is in motion, however, bees tend to fly closer to that wall if the pattern moves in the same direction as the bee (b, e)and farther away from that wall if the pattern moves in the opposite direction (c, f). These results indicate that bees balance the distances to thewalls of the tunnel by balancing the speeds of image motion that are experienced by the two eyes, and that they are able to measure image speedrather independently of the spatial structure of the image. Modified from Srinivasan et al. (1991)
from the two walls (Fig. 4a). But when one of thegratings was moved at a constant speed in the directionof the bees’ flight, thereby reducing the speed of retinalimage motion on that eye relative to the other eye, thebees’ trajectories shifted towards the wall with themoving grating (Fig. 4b). When the grating moved in adirection opposite to that of the bees’ flight, therebyincreasing the speed of retinal image motion on that eyerelative to the other, the bees’ trajectories shifted awayfrom the wall with the moving grating (Fig. 4c). Thesefindings demonstrate that when the walls were station-ary, the bees maintained equidistance by balancing theapparent angular speeds of the two walls, or, equiva-lently, the speeds of the retinal images in the two eyes.A lower image speed on one eye was evidently taken tomean that the grating on that side was further away,and caused the bee to fly along a trajectory closer to it.A higher image speed, on the other hand, had theopposite effect.
Were the bees really measuring and balancing imagespeeds on the two sides as they flew along the tunnel, orwere they simply balancing the contrast frequenciesproduced by the succession of dark and light bars ofthe gratings? This question was investigated byanalysing the flight trajectories of bees when the twowalls carried gratings of different spatial periods. Whenthe gratings were stationary, the trajectories were al-ways equidistant from the two walls, even when thespatial frequencies of the gratings on the two sides—and therefore the contrast frequencies experienced bythe two eyes—differed by a factor of as much as four(Fig. 4d). When one of the gratings was in motion, thetrajectories shifted towards or away from the movinggrating (as described above) according to whether the
grating moved with or against the direction of the bees’flight (Fig. 4e, f). These results indicate that the beeswere indeed balancing the speeds of the retinal imageson the two eyes and not the contrast frequencies. Theabove findings’ are true irrespective of whether thegratings possess square-wave intensity profiles (withabrupt changes of intensity) or sinusoidal profiles (withgradual intensity changes) and irrespective of whetherthe contrasts of the gratings on the two sides are equal,or considerably different (Srinivasan et al., 1991). Fur-ther experiments have revealed that—knowing the ve-locities of the bee and the pattern—it is even possibleto predict the position of a bee’s flight trajectory alongthe width of the tunnel, on the assumption that the beebalances the apparent angular velocities on either sideof the tunnel (Srinivasan et al., 1991).
Taken together, the above findings suggest that,when a bee flies through a narrow gap, its visual systemis capable of comparing the angular speeds of theimages of the flanking walls independently of theircontrast or spatial-frequency content. It is worth notingthat, if movement cues are to be exploited to flythrough a space between two surfaces, it is necessary touse a mechanism that measures the speed of the imageindependently of its geometrical structure. This mecha-nism is what the bee seems to possess and is the kind ofsystem that would enable an insect to fly through themiddle of a gap between, say, two vertical branches ofa tree, regardless of the textural properties of the barkon the two sides.
More recent studies (Srinivasan, Zhang & Chan-drashekara, 1993; Srinivasan & Zhang, 1997) have in-vestigated the centring response further by comparingits properties with those of the optomotor response in

M.V. Srini6asan et al. / Vision Research 39 (1999) 2749–27662756
an experimental setup which allows the two responsesto be compared in one and the same individual underthe same conditions. The results indicate that whilst theoptomotor response is mediated by a movement-detect-ing system that is direction-sensitive, the centring re-sponse is driven by a movement-detecting system that isdirection-insensitive. Thus, for eliciting a centring re-sponse, the image need not necessarily move backwardson the eye: an image moving vertically upward, down-ward, or forward at the same speed has the same effect.In particular, rapid movement of pattern on one of thewalls in the same direction as the flying bee has thesame effect as slow movement in the opposite directionas long as the speed of the image is the same in the twocases (Srinivasan et al., 1991). The results of thesestudies also reveal that the centring response is sensitiveto higher temporal frequencies than is the optomotorresponse. Whereas the optomotor response exhibits apeak in the vicinity of 25–50 Hz and drops to zero at100 Hz, the strength of the centring response is approx-imately constant over the range of 25–100 Hz, and issubstantial at 100 Hz (Srinivasan et al., 1993; Srini-vasan & Zhang, 1997). The centring response may berelated to the so-called movement avoidance response,a tendency shown by bees to avoid flying towardrapidly moving objects (Srinivasan & Lehrer, 1984;Srinivasan & Zhang, 1997). The movement avoidanceresponse, like the centring response, is sensitive to abroad range of temporal frequencies. At low temporalfrequencies (1 Hz–20 Hz), the movement avoidanceresponse depends primarily on image speed; at rela-tively high temporal frequencies (50 Hz–200 Hz), theresponse depends primarily on temporal frequency (seeFig. 5 of Srinivasan & Lehrer, 1984; Srinivasan &Zhang, 1997). It may well be that the centring responsethat bees exhibit whilst flying through a tunnel is theresult of equal and oppositely-directed movementavoidance responses generated by the image motionsexperienced by the two eyes (Srinivasan & Zhang,1997). These studies have also shown that the move-ment-detecting system that underlies the centring re-sponse computes motion within receptive fields whosediameter is no larger than ca. 15° (Srinivasan et al.,1993; Srinivasan & Zhang, 1997).
To summarise, the centring response differs from theoptomotor response in three respects. Firstly, the cen-tring response is sensitive primarily to the angular speedof the stimulus, regardless of its spatial structure. Theoptomotor response, on the other hand, is sensitiveprimarily to the temporal frequency of the stimulus;therefore, it confounds the angular velocity of a stripedpattern with its spatial period. Secondly, the centringresponse is non-directional, whilst the optomotor re-sponse is directionally selecti6e. (It is worth noting,however, that non-directional motion detection can beachieved by summing the outputs of directionally selec-
tive motion detectors with opposite preferred direc-tions. Thirdly, the centring response is sensitive tohigher temporal frequencies than is the optomotor re-sponse. Thus, the motion-detecting processes underly-ing the centring response exhibit properties that aresubstantially different from those that mediate the op-tomotor response (Srinivasan et al. 1993; Srinivasan &Zhang, 1997).
Given that the role of the centring response is toensure that the insect flies through the middle of a gapirrespective of the texture of the side walls, it is easy tosee why the response is mediated by a movement-de-tecting system which measures the angular speed of theimage independently of its spatial structure. The move-ment-detecting system that subserves the optomotorresponse, on the other hand, does not need to measureimage speed in a robust way: it merely needs to signalthe direction of image motion reliably, so that a correc-tive yaw of the appropriate polarity may be generated.Of course, even a mechanism that is sensitive to theangular speed of the image, such as that underlyingcentring behaviour, cannot provide information on theabsolute translational speed with which an insect fliesalong a wall. This information can be derived only ifthe absolute distance to the wall is also known.
Why is the centring mechanism sensitive only to thespeed of the image, and not to direction in which theimage moves? We can think of two reasons. Firstly, inneural terms, it may be much simpler to build a non-di-rectional speed detector, than to build a detector thatcomputes speed as well as direction of motion. Instraight-ahead flight, the direction of image motionalong each viewing direction is predetermined (Gibson,1979; Wehner, 1981: Fig. 5, p. 325) and therefore doesnot need to be computed. It is the local speed thatconveys information on range. The insect visual systemmay thus be adopting a short-cut which takes advan-tage of the fact that the optic flow experienced instraight-ahead flight is constrained in special ways.Secondly, a non-directional speed detector offers a dis-tinct advantage over a detector that measures speedalong a given axis: the latter can produce large spuriousresponses when the orientation of an edge is nearlyparallel to the detector’s axis. For example, a detectorconfigured to measure speed along the horizontal axiswill register large horizontal velocities if it is stimulatedby a near-horizontal edge moving in the vertical direc-tion. This obliquity problem can be avoided by usingeither a two-dimensional velocity detector, or a non-di-rectional speed detector—of which the latter offers asimpler, more elegant solution (Srinivasan, 1992).
It should be noted that estimation of range via imagemotion cues requires that the animal move in a straightline, or at least, that there be a translatory componentto its motion. It is only the translatory component ofself-motion that induces range-dependent image mo-

M.V. Srini6asan et al. / Vision Research 39 (1999) 2749–2766 2757
tion: the rotatory component produces image speedsthat are independent of object range (Buchner, 1984).
3.3. Visual regulation of flight speed
Work by David (1982) and by Srinivasan, Zhang,Lehrer and Collett (1996) has shown that insects regu-late the speed of their flight by monitoring and holdingconstant the speed with which the image of the environ-ment moves on the eyes.
David (1982) observed fruitflies flying upstream in awind-tunnel, attracted by an odour of fermenting ba-nana. The walls of the cylindrical wind-tunnel weredecorated with a helical black-and-white striped pat-tern, so that rotation of the cylinder about its axisproduced apparent movement of the pattern towardsthe front or the back. With this arrangement, therotational speed of the cylinder (and hence the speed ofthe backward motion of the pattern) could be adjustedsuch that the fly was stationary (i.e. did not move alongthe axis of the tunnel). The apparent backward speed ofthe pattern then revealed the ground speed that the flywas choosing to maintain, as well as the angular veloc-ity of the image of the pattern on the flies’ eyes. In thissetup, fruitflies tended to hold the angular velocity ofthe image constant. Increasing or decreasing the speedof the pattern caused the fly to move backward orforward (respectively) along the tunnel at a rate suchthat the angular velocity of the image on the eye wasalways clamped at a fixed value. The flies also compen-sated for headwind in the tunnel, increasing or decreas-ing their thrust so as to maintain the same apparentground speed (as indicated by the angular velocity ofimage motion on the eye). Experiments in which theangular period of the stripes was varied revealed thatthe flies were measuring (and holding constant) theangular velocity of the image on the eye, irrespective ofthe spatial structure of the image.
Bees appear to use a similar strategy to regulate flightspeed (Srinivasan et al., 1996), When a bee flies througha tapered tunnel, she decreases her flight speed as thetunnel narrows so as to keep the angular velocity of theimage of the walls, as seen by the eye, constant at about320 deg/s (Fig. 5). This suggests that flight speed iscontrolled by monitoring and regulating the angularvelocity of the image of the environment on the eye.(That is, if the width of the tunnel is doubled, the beeflies twice as fast.) On the other hand, a bee flyingthrough a tunnel of uniform width does not change herspeed when the spatial period of the stripes lining thewalls is abruptly changed (Fig. 6). This indicates thatflight speed is regulated by a visual motion-detectingmechanism which measures the angular velocity of theimage largely independently of its spatial structure. Inthis respect, the speed-regulating system is similar to thecentring system. However, it is not yet known whether
the regulation of flight speed in bees is mediated by adirectionally selective movement-detecting mechanism,or a non-directional one. Visual stimulation of tetheredflies with forward or backward-moving gratings in thetwo eyes indicates that flight thrust (which is related toflight speed) is controlled by directionally selectivemovement detectors (Gotz, 1989; Gotz & Wandel,1984; Gotz & Wehrhahn, 1984).
Fig. 5. Experiment investigating visual control of flight speed. Beesare trained to fly through a tapered tunnel to collect a reward placedat the far end (a). The walls of the tunnel are lined with verticalblack-and-white stripes of period 6 cm. A typical flight trajectory, asfilmed from above by a video camera, is shown in (b), where the bee’sposition and orientation are shown every 50 ms. The bars in (c) showthe mean and standard of flight speeds measured at various positionsalong the tunnel (data from 18 flights). The dashed line shows thetheoretically expected flight speed profile if the bees were to hold theangular velocity of the images of the walls constant at 320 deg/s asthey fly through the tunnel. The data indicate that bees control flightspeed by holding constant the angular velocity of the image of theenvironment. Adapted from Srinivasan et al. (1996).

M.V. Srini6asan et al. / Vision Research 39 (1999) 2749–27662758
Fig. 6. Two experiments (a, b) examining control of flight speed intunnels of constant width, each lined with black-and-white stripedpatterns whose spatial period changes abruptly in the middle. In eachpanel, the upper illustration shows the tunnel and the patterns, andthe lower illustration shows measurements of flight speed at variouspositions along the tunnel (0 cm represents position at which thespatial period changes). Bees flying through such tunnels maintain anearly constant flight speed regardless of whether the stripe periodincreases (a) or decreases (b). This suggests that the speed of flight iscontrolled by a movement-detecting system which measures andholds constant the speeds of the images of the walls accuratelyregardless of their spatial structure. Data represent mean and std. of18 flights in (a) and 21 flights in (b). Adapted from Srinivasan et al.(1996).
communicate to their nestmates the distance and direc-tion in which to fly to reach it, through the waggledance (von Frisch, 1993). However, the cues by whichbees gauge the distance flown to the goal have been asubject of controversy. Recently, it has been shown thatdistance flown is estimated in terms the integral, overtime, of the image motion (optic flow) that is experi-enced along the way (Esch & Burns, 1996; Srinivasan etal., 1996; Srinivasan, Zhang & Bidwell, 1997). In thelaboratory, this has been demonstrated by training beesto fly into a tunnel and find a reward of sugar waterplaced at a fixed distance from the entrance (Fig. 7).The walls and floor of the tunnel are lined with atexture, usually composed of black and white stripes.When the trained bees are tested in an identical, freshtunnel with the reward removed, they search in thevicinity of the former location of the reward. Bees losetheir ability to estimate the distance of the feeder whenimage-motion cues are removed by lining the tunnelwith axial (rather than vertical) stripes (Srinivasan etal., 1997). By manipulating a variety of cues such asflight duration, energy consumption, image motion,airspeed, inertial navigation and landmarks, it has been
Fig. 7. Experiment investigating how honeybees gauge distance flownto a food source. Bees are trained to find a food reward placed at adistance of 1.7 m from the entrance of a 3.2 m long tunnel of width22 cm and height 20 cm. The tunnel is lined with vertical black-and-white stripes of period 4 cm. When the trained bees are tested in afresh tunnel with the reward absent, they search at the formerlocation of the feeder irrespective of whether the period of the stripesis 4 (as in the training), 8 or 2 cm. The inverted triangle shows theformer position of the reward, and the symbols below it depict themean values of the search distributions. Bees lose their ability toestimate the distance of the feeder when image-motion cues areremoved by lining the tunnel with axial (rather than vertical) stripes(data not shown). These experiments and others (Srinivasan et al.,1997) demonstrate that (i) distance flown is estimated visually, byintegrating over time the image velocity that is experienced during theflight; and (ii) the honeybee’s odometer measures image velocityindependently of image structure. Adapted from Srinivasan et al.(1997).
3.4. Visual odometry
It is well known that honeybees can navigate accu-rately and repeatedly to a food source, as well as

M.V. Srini6asan et al. / Vision Research 39 (1999) 2749–2766 2759
Fig. 8. Schematic illustration of the spatiotemporal frequency response function of a correlation-based movement detector, shown as athree-dimensional plot (a), and as a contour plot (b). The exact shape of the function will depend upon the spatial and temporal parameters ofthe movement detector (see text), but for the present purpose this response function is modelled as a two-dimensional Gaussian with a half-widthof 3.33 units in spatial frequency and 4.71 units in temporal frequency. In the contour plot (b), all of the points that lie on a given responsecontour represent combinations of spatial and temporal frequency that elicit the same response. The (angular) image velocity corresponding toa given point on a contour is the slope of the line connecting this point to the origin (V= temporal frequency/spatial frequency; dotted line). Allof the velocities represented on a contour are confounded by the detector. The contour plot in (b) is normalised to a maximum value of 1.0 andthe numbers indicate relative response magnitudes for the individual contours.
shown that distance travelled is estimated by integratingover time the image velocity that is experienced on theway to the feeder (Srinivasan et al., 1997).
Trained bees tend to search for the feeder at the sameposition in the tunnel, even if the period of the stripeslining the walls and floor is varied in the tests (Fig. 7).This indicates that the odometric system reads imagevelocity accurately over a four-fold variation in thespatial period of the grating. Further investigation isneeded, however, to determine whether this mechanismis directionally selective or not.
4. Modified and new models for motion detection
We have seen that while the correlation model pro-vides an excellent description of the movement-detec-tion system that mediates the optomotor response (andpossibly the landing response), it is not adequate toaccount for the mechanisms that seem to underlie themore recently investigated phenomena, such as thecentring response, the control of flight speed, visualodometry, and, possibly, peering behaviour.
Before proposing modified or new motion-detectingmodels to account for the more recently characterisedbehaviours, let us take a closer look at the properties ofthe correlation model to examine why it does notencode image velocity faithfully.
A correlation-based movement-detecting system doesnot provide an unambiguous indication of the speed ofthe image: it confounds the speed of the image with itsspatial structure. A coarse, rapidly-moving grating canelicit the same response in such a detector as a fine,slowly-moving grating. The reason for this, as we dis-cussed earlier, is that, with a grating of a given spatial
period, the response is a bell-shaped function of thetemporal frequency that the moving grating induces (seeFig. 1). Again, with gratings that induce a given tempo-ral frequency, the response is a bell-shaped function ofthe spatial frequency of the grating. The reason is that,at high spatial frequencies, the response drops to zerobecause the optics become less and less effective attransmitting contrast. Furthermore, movement signalsbecome weaker as the spatial frequency is increasedtoward the Nyquist sampling limit of the compound eye(Reichardt, 1969). At low spatial frequencies, the re-sponse again falls off because the directional informa-tion in the signals from neighbouring receptors becomesprogressively weaker. Combining all of this informa-tion, we see that if the response is plotted as a two-di-mensional function of spatial and temporal frequency, itshould appear as illustrated in Fig. 8a. The response isstrongest at a specific temporal and spatial frequency,and diminishes as one moves away from this optimumalong any direction in spatio-temporal frequency space.The exact shape of the spatio-temporal frequency re-sponse function will depend upon the angular separa-tion of the visual axes of the two input channels thatfeed into each elementary motion detector (A and B inFig. 2), the angular sizes and shapes of the receptivefields of these channels (Srinivasan & Dvorak, 1980),and the temporal characteristics of the dynamical filtersR, G and H in Fig. 2 (Kirschfeld, 1978). However, thesedetails are not important in the present context. Themain point is that the spatio-temporal response functiongenerally has the form of a hill with a single, prominentmaximum, as shown in Fig. 8a. This is in conformitywith experimental measurements of the spatio-temporalfrequency response functions of insect motion detectors(e.g. O’Carroll, Bidwell, Laughlin & Warrant, 1996).

M.V. Srini6asan et al. / Vision Research 39 (1999) 2749–27662760
Fig. 9. Multiple-correlator scheme for measurement of image velocity. The figure shows contour plots for the spatio-temporal frequency responsesof three correlators, each producing a maximum response at a different spatio-temporal frequency. The symbols *, + , � and × representsinusoidal gratings of spatial frequency 2, 4, 6 and 8 units, respectively. The responses that these gratings elicit in each correlator when they moveat an angular velocity of V1, V2 or V3 can be read off according to the positions of these symbols along the straight lines of slope V1, V2 andV3 as shown. The angular velocity of any grating can be estimated unambiguously, and independently of its spatial frequency or contrast bydetermining which correlator produces the largest response. The spatio-temporal response function of each correlator is modelled as atwo-dimensional Gaussian with a half-width of 2.35 units in spatial frequency and 3.33 units in temporal frequency. The contour intervals are asin Fig. 8b.
A contour plot of the response is shown in Fig. 8b.All of the points that lie on a given response contourrepresent combinations of spatial and temporal fre-quency that elicit the same response. They are thereforeconfounded by the movement detector. The (angular)image velocity corresponding to a given point on acontour is the slope of the line connecting this point tothe origin (V= temporal frequency/spatial frequency;see dotted line in Fig. 8b). All of the velocities repre-sented on this contour are confounded. So far, we haveassumed that the contrast of the grating is fixed. If weallow the contrast to vary, we introduce another degreeof freedom (and uncertainty): since the response in-creases with contrast, all of the points on a givenresponse contour will be confounded with points on aweaker response contour if the contrast of the stimulirepresenting the weaker contour is appropriatelyincreased.
4.1. A 6elocity-sensiti6e model based on multiplecorrelators
The ambiguity described above can be removed if weincorporate more than one correlator in the movement-detecting process, with each correlator having a differ-ent spatio-temporal frequency optimum (Heeger, 1987;Simoncelli & Heeger, 1998). This is illustrated in Fig. 9
for a system comprising three correlators. Considernow a grating composed of, say, four spatial frequen-cies denoted by the symbols *, + , � and × in Fig. 9.When the grating moves at a velocity V, the temporalfrequencies that it generates can be represented bymapping these four spatial frequencies on to a linethrough the origin with a slope equal to V. We now seeimmediately that a low image velocity (V=V1) willpreferentially stimulate correlator 1, a high image veloc-ity (V=V3) will preferentially stimulate correlator 3,and an intermediate image velocity (V=V2) will prefer-entially stimulate correlator 2. This is true regardless ofthe spatial frequency content of the stimulus. Increasingthe contrast of the grating would increase the responseof all of the correlators, but the correlator that pro-duces the largest response will continue to be deter-mined by the image velocity in the same way. Thus, thevelocity of the image can be estimated unambiguously,and independently of its spatial structure or contrast bydetermining which correlator produces the largest re-sponse. The latter operation can readily be carried outby a winner takes all neural network. It is clear thatsuch a scheme would have to incorporate a minimumof two correlators, each with a different optimum spa-tio-temporal frequency. With two correlators, the ratioof the outputs of the correlators (for example) wouldprovide a reliable indication of image velocity. The
M.V. Srini6asan et al. / Vision Research 39 (1999) 2749–2766 2761
optimum spatial frequency of a correlator can be variedby changing the angular separation between the inputchannels A and B (Fig. 2), or by appropriate spatialprefiltering of the visual input prior to motion detec-tion. There is evidence for both kinds of variability inthe movement-detecting pathway of the fly’s visualsystem (Pick & Buchner, 1979; Srinivasan & Dvorak,1980; Schuling, Mastebroek, Bult & Lenting, 1989).The optimum temporal frequency can be varied bychanging the time constants of the temporal filters R, Gand H (Fig. 2).
Two classes of movement-sensitive neurons, withpeak sensitivities at different temporal frequencies, havebeen reported in the visual systems of the fly, butterflyand locust (Horridge & Marcelja, 1992). There is be-havioural evidence that the optomotor system of crabsis driven by three different motion-detecting pathwaysacting in parallel, with different temporal-frequencyoptima, although the crab’s optomotor system does notseem to extract velocity information (Nalbach, 1989).Thus, the neural substrate for evaluation of imagevelocity certainly exists in the invertebrate visual sys-tem, although it remains to be ascertained whether thevelocity computations are carried out as we describehere.
A correlation-based movement detector that is sensi-tive to the speed of image motion, but not to thedirection of motion can be produced by using a schemeas described above, but in which each correlator isreplaced by a unit which sums the outputs of fouridentical correlators, with rightward, leftward, upwardand downward preferred directions, respectively (Dou-glass & Strausfeld, 1996). Since individual correlatorsare broadly tuned with regard to directional sensitivity(e.g. van Hateren, 1990), such multidirectional unitswould exhibit a nearly uniform sensitivity to all direc-tions of image motion. Image speed could then beestimated by comparing the responses of two multidi-rectional units with different optimum spatiotemporalfrequencies, as described above. Thus, the signals fromthe directionally selective elementary motion detectorsat the front end of this system could be used to drivethe optomotor response, whilst the non-directional mo-tion signal produced at the output of this system couldbe used to mediate some of the other behaviours andvisual functions that we have discussed here.
4.2. A 6elocity-sensiti6e model based on half-detectors
In the above scheme we assumed that the individualmotion detectors have a symmetrical structure, asshown in Fig. 2. That is, the response of each motiondetector is obtained by subtracting the output of onehalf-detector, which prefers rightward motion, fromanother half-detector which prefers leftward motion.The responses of a simplified version of such a symmet-
rical motion detector, in which each half-detector uses asingle, temporal low-pass filter (Fig. 10a), are shown inFig. 10c for sinusoidal gratings of three different peri-ods, moving at various speeds. The response-versus-an-gular velocity curve for each grating period has beennormalised to a value of 1.0. As explained earlier, thespeed at which such a detector produces a maximumresponse varies systematically with the spatial period ofthe grating, making the detector tuned to temporalfrequency rather than velocity. (When we say that adetector is tuned to temporal frequency or to velocity,we mean that a moving sinusoidal grating of a givencontrast elicits the strongest response at a fixed tempo-ral frequency in the former case, and at a fixed angularvelocity in the latter. Of course, the response of eachkind of detector will also vary with the contrast of thegrating.)
It turns out that velocity tuning, rather than tempo-ral-frequency tuning, can be achieved by using a mo-tion detector that is not symmetrical, but which uses asingle half-detector as shown in Fig. 10b (Glunder,1990; Snippe & Koenderink, 1994; Zanker, Srinivasan& Egelhaaf, 1999). For such an asymmetrical detectorthe optimum velocity is independent of grating period,as shown in Fig. 10d. The velocity of a grating can thenbe determined unambiguously by comparing the re-sponses of two half-detectors, each tuned to a differentvelocity. (The optimum velocity of a half-detector canbe varied by changing the time constant of the low-passfilter and/or the angular separation of the input chan-nels A and B.) Reasonable velocity tuning, and insensi-tivity to grating period, can also be achieved bydetectors that are partially symmetrical, i.e. by schemesthat use both half detectors, but generate the responseby subtracting a fraction of the output of the right halfdetector from the output of the left half-detector(Zanker et al., 1999). This is of interest because there isevidence for the existence of partially symmetrical mo-tion detectors in the visual system of the fly (Egelhaaf etal., 1989). Thus, by using half-detectors, velocity tuningcan be achieved with some sacrifice of directional selec-tivity. Loss of directional sensitivity would obviously bea disadvantage for a motion-detecting system that me-diates the optomotor response. But it would be appro-priate for the motion detectors that mediate thecentring response in the bee and the extraction of rangefrom peering in the grasshopper, because they appar-ently use non-directional mechanisms.
4.3. A 6elocity-sensiti6e model based on a modifiedgradient scheme
Another possible scheme (Srinivasan et al., 1991),which embodies a neural realisation of a scheme formeasurement of image velocity that is well known to

M.V. Srini6asan et al. / Vision Research 39 (1999) 2749–27662762
Fig. 10. Performance of symmetrical (a) and asymmetrical (b) motion detectors. The lower panels compare response-versus angular velocity curvesfor symmetrical (c) and asymmetrical (d) motion detectors, for moving sinusoidal gratings of various periods. Each curve is normalised to amaximum response of 1.0. While the peak response of the symmetrical detector shifts systematically toward larger angular velocities as the periodof the grating is increased (c), the response of the asymmetrical detector peaks at about the same angular velocity regardless of grating period (d).The low-pass filters are assumed to be first-order, with a time constant of 0.1 s, and the angular separation between the input channels A and Bis assumed to be 2°.
M.V. Srini6asan et al. / Vision Research 39 (1999) 2749–2766 2763
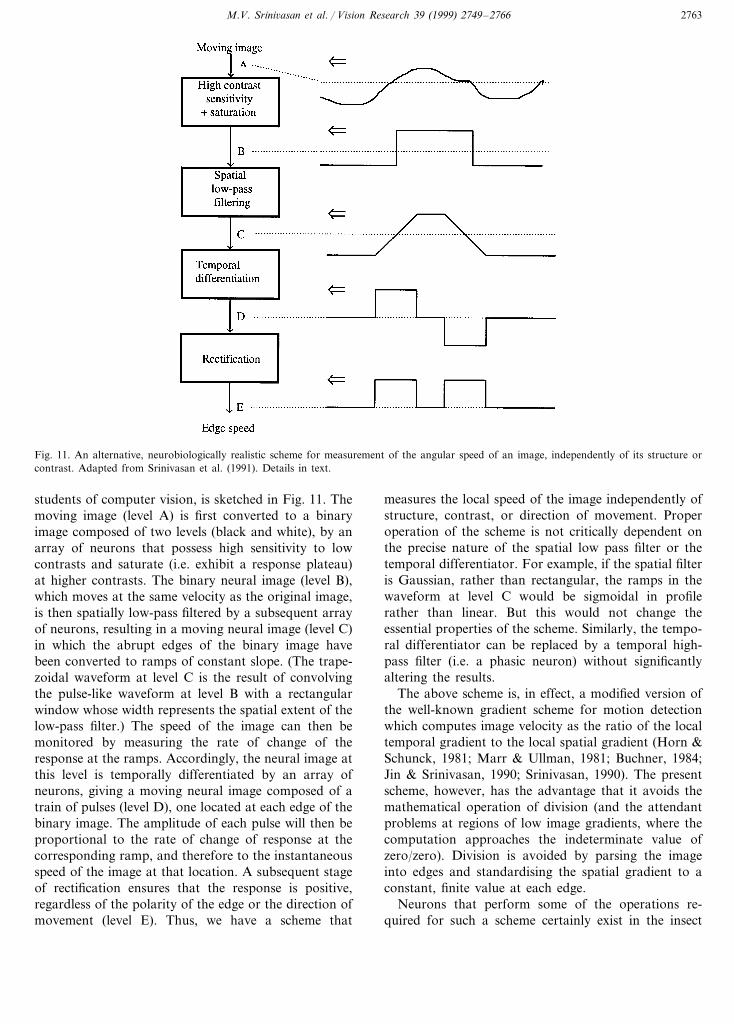
Fig. 11. An alternative, neurobiologically realistic scheme for measurement of the angular speed of an image, independently of its structure orcontrast. Adapted from Srinivasan et al. (1991). Details in text.
students of computer vision, is sketched in Fig. 11. Themoving image (level A) is first converted to a binaryimage composed of two levels (black and white), by anarray of neurons that possess high sensitivity to lowcontrasts and saturate (i.e. exhibit a response plateau)at higher contrasts. The binary neural image (level B),which moves at the same velocity as the original image,is then spatially low-pass filtered by a subsequent arrayof neurons, resulting in a moving neural image (level C)in which the abrupt edges of the binary image havebeen converted to ramps of constant slope. (The trape-zoidal waveform at level C is the result of convolvingthe pulse-like waveform at level B with a rectangularwindow whose width represents the spatial extent of thelow-pass filter.) The speed of the image can then bemonitored by measuring the rate of change of theresponse at the ramps. Accordingly, the neural image atthis level is temporally differentiated by an array ofneurons, giving a moving neural image composed of atrain of pulses (level D), one located at each edge of thebinary image. The amplitude of each pulse will then beproportional to the rate of change of response at thecorresponding ramp, and therefore to the instantaneousspeed of the image at that location. A subsequent stageof rectification ensures that the response is positive,regardless of the polarity of the edge or the direction ofmovement (level E). Thus, we have a scheme that
measures the local speed of the image independently ofstructure, contrast, or direction of movement. Properoperation of the scheme is not critically dependent onthe precise nature of the spatial low pass filter or thetemporal differentiator. For example, if the spatial filteris Gaussian, rather than rectangular, the ramps in thewaveform at level C would be sigmoidal in profilerather than linear. But this would not change theessential properties of the scheme. Similarly, the tempo-ral differentiator can be replaced by a temporal high-pass filter (i.e. a phasic neuron) without significantlyaltering the results.
The above scheme is, in effect, a modified version ofthe well-known gradient scheme for motion detectionwhich computes image velocity as the ratio of the localtemporal gradient to the local spatial gradient (Horn &Schunck, 1981; Marr & Ullman, 1981; Buchner, 1984;Jin & Srinivasan, 1990; Srinivasan, 1990). The presentscheme, however, has the advantage that it avoids themathematical operation of division (and the attendantproblems at regions of low image gradients, where thecomputation approaches the indeterminate value ofzero/zero). Division is avoided by parsing the imageinto edges and standardising the spatial gradient to aconstant, finite value at each edge.
Neurons that perform some of the operations re-quired for such a scheme certainly exist in the insect

M.V. Srini6asan et al. / Vision Research 39 (1999) 2749–27662764
visual pathway, although it remains to be determinedwhether they are indeed involved in computing imagespeed. For example, the so-called large monopolar cells(LMCs) in the lamina—the second stage of visualprocessing in the insect visual pathway—are highlysensitive to moving edges. They produce a responsewhose amplitude increases monotonically with edgespeed over a range of ca. 0–1000 deg/s (Srinivasan,Pinter & Osorio, 1990), and with sinusoidal temporalfrequency over a range of 0–30 Hz (Coombe, Srini-vasan & Guy, 1989). However, the responses of LMCsare not entirely independent of the contrast of the edge.Neurons with dynamic properties similar to those of theLMCs, but which are less sensitive to variations of edgecontrast, have been encountered in the locust medulla(Osorio, 1992). The response properties of these cellswould correspond roughly to those at level D in themodel of Fig. 11. Non-directional motion-sensitive neu-rons have been reported in the locust optic lobe (Rind,1987; Bult & Mastebroek, 1994). Although these neu-rons possess large receptive fields, their responses sug-gest that they receive inputs from visual units withsmaller receptive fields at earlier stages of the visualpathway. Thus, the existence of non-directional mo-tion-sensitive neurons with small receptive fields is quitelikely in the insect visual pathway. Douglass andStrausfeld (1996) have recently characterised a class ofsmall-field cells (T4) in the fly medulla that respond tomotion in a non-directional way. Indeed, their studypoints to the existence of two parallel pathways forelementary movement detection: one directional, andthe other nondirectional. However, the sensitivity of thenon-directional movement-detecting neurons to thespeed and spatial structure of the stimulus remains tobe investigated.
5. Conclusions and outlook
Some of the well-known visually mediated be-haviours in the insect, such as the optomotor response(and possibly the landing response) can be well charac-terised by the correlation model of movement detection.The salient properties of the movement-sensitive mech-anism underlying these responses are that it is direc-tional, and it does not encode the speed of the movingimage. Rather, it is sensitive to the temporal frequencyof intensity fluctuations generated by the moving im-age, and therefore confounds the speed of the imagewith its spatial structure. Such a system is adequate fordriving the optomotor response where the primary re-quirement is to detect the direction of image motionreliably, and not its speed. Since the primary role of theoptomotor response is to stabilise yaw, it is geared tominimise image motion in the frontal visual field; it is acontrol system which tries to regulate frontal image
velocity around a set-point of zero. Recent work, how-ever, is beginning to uncover other behaviours, such asthe centring response, control of flight speed, visualodometry and possibly peering, which seem to rely onmovement-detecting mechanisms which need to, and doextract the speed of the image fairly accurately, irre-spective of its spatial structure. Unlike the optomotorresponse, these other behaviours are not geared toachieve a set-point of zero image velocity. Rather, themechanisms underlying these behaviours appear to ex-tract measurements of image velocity that are used toestimate the ranges of objects, to regulate flight speedor to estimate distance flown. To account for thesebehaviours, modified or new models of motion detec-tion are proposed. The emerging picture is that thereare a number of motion-sensitive pathways in the insectvisual system, each with a distinct set of properties andgeared to a specific visual function. One now needs toask whether the newly characterised behaviours aresubserved by entirely different motion-sensitive path-ways that act in parallel with the pathways that mediatethe optomotor response, or whether they share a com-mon front end that performs elementary motion detec-tion, after which individual pathways process theelementary motion signals differently to cater to differ-ent visual functions. Clearly, the challenge ahead is touncover the neural mechanisms underlying the newbehaviours.
Acknowledgements
We are grateful to Johannes Zanker and Jochen Zeilfor many useful comments on the manuscript. M.Poteser and K. Kral were partly supported by Grant10861-Bio from the Austrian Science Foundation. MVSwas partly supported by International Human FrontierScience Program Grant RG-84/97.
References
van den Berg, A. V., & van de Grind, W. A. (1989). Reaction timesto motion onset and motion detection thresholds reflect theproperties of bifocal motion detectors. Vision Research, 29, 1261–1266.
Borst, A., & Bahde, S. (1988). Visual information processing in thefly’s landing system. Journal of Comparati6e Physiology A, 163,167–173.
Borst, A., & Egelhaaf, M. (1989). Principles of visual motion detec-tion. Trends in Neuroscience, 12, 297–306.
Braitenberg, V., & Taddei-Feretti, C. (1966). Landing reaction ofMusca domestica. Naturwissenschaften, 53, 155–156.
Buchner, E. (1984). Behavioral analysis of spatial vision in insects. InM. A. Ali, Photoreception and 6ision in in6ertebrates (pp. 561–621). New York: Plenum.
Bult, R., & Mastebroek, H. A. K. (1994). Response characteristics ofwide-field nonhabituating non-directional motion detecting neu-rons in the optic lobe of the locust, Locusta migratoria. Journal ofComparati6e Physiology A, 174, 723–729.
M.V. Srini6asan et al. / Vision Research 39 (1999) 2749–2766 2765
Collett, T. S., & Paterson, C. J. (1991). Relative motion parallax andtarget localisation in the locust, Schistoeerca gregaria. Journal ofComparati6e Physiology A, 169, 615–621.
Coombe, P., Srinivasan, M. V., & Guy, R. (1989). Are the largemonopolar cells of the insect lamina on the optomotor pathway?Journal of Comparati6e Physiology A, 166, 23–35.
David, C. T. (1982). Compensation for height in the control ofgroundspeed by Drosophila in a new, Barber’s Pole wind tunnel.Journal of Comparati6e Physiology, 147, 485–493.
Douglass, J. K., & Strausfeld, N. J. (1996). Visual motion-detectioncircuits in flies: parallel dircetion- and non-direction-sensitivepathways between the medulla and lobule plate. Journal of Neuro-science, 16, 4551–4562.
Eckert, H., & Hamdorf, K. (1980). Excitatory and inhibitory re-sponse components in the landing response of the blowfly, Cal-liphora erythrocephala. Journal of Comparati6e Physiology, 138,253–264.
Egelhaaf, M., & Borst, A. (1989). Transient and steady-state responseproperties of movement detectors. Journal of the Optical Societyof America, 6, 116–127.
Egelhaaf, M., Borst, A., & Reichardt, W. (1989). Computationalstructure of a biological motion-detection system as revealed bylocal detector analysis in the fly’s nervous system. Journal of theOptical Society of America A, 6, 1070–1087.
Egelhaaf, M., Hausen, K., Reichardt, W., & Wehrhahn, C. (1988).Visual course control in flies relies on neuronal computation ofobject and background motion. Trends in Neuroscience, 11, 351–358.
Emerson, R. C., Bergen, J. R., & Adelson, E. H. (1992). Directionallyselective complex cells and the computation of motion energy incat visual cortex. Vision Research, 32, 203–218.
Esch, H., & Burns, J. (1996). Distance estimation by foraging honey-bees. Journal of Experimental Biology, 199, 155–162.
Exner, S. (1891). The physiology of the compound eyes of insects andcrustaceans (pp. 130–131). Berlin: Springer-Verlag (R. C. Hardie,Trans.).
von Frisch, K. (1993). The dance language and orientation of bees.Cambridge, MA: Harvard University.
Gibson, J. J. (1979). The ecological approach to 6isual perception.Hillsdale, NJ: Lawrence Erlbaum.
Glunder, H. (1990). Correlative velocity estimation: visual motionanalysis, independent of object form, in arrays of velocity-tunedbifocal detectors. Journal of Optical Society of America A, 7,255–263.
Goodman, L. J. (1960). The landing responses of insects. I. Thelanding response of the fly, Lucilia sericata, and other calliphori-dae. Journal of Experimental Biology, 37, 854–878.
Gotz, K. G. (1989). Movement discrimination in insects. In W.Reichardt, Processing of optical data by organisms and machines(pp. 493–494). New York: Academic.
Gotz, K. G., & Wandel, U. (1984). Optomotor control of the force offlight in Drosophila and Musca. II. Covariance of lift and thrust instill air. Biological Cybernetics, 51, 135–139.
Gotz, K. G., & Wehrhahn, C. (1984). Optomotor control of the forceof flight in Drosophila and Musca. I. Homology of wingbeat-in-hibiting movement detectors. Biological Cybernetics, 51, 129–134.
van Hateren, J. H. (1990). Directional tuning curves, elementarymovement detectors and the estimation of the direction of visualmovement. Vision Research, 30, 603–614.
Hausen, K. (1993). How insects infer range from visual motiondecoding of retinal image flow in insects. In F. A. Miles, & J.Wallman, Visual motion and its role in the stabilization of gaze (pp.203–235). Amsterdam: Elsevier.
Heeger, D. J. (1987). Model for the extraction of image flow. Journalof the Optical Society of America A, 1455–1471.
Horn, B. K. P., & Schunck, B. (1981). Determining optical flow.Artificial Intelligence, 17, 185–203.
Horridge, G. A. (1986). A theory of insect vision: velocity parallax.Proceedings of the Royal Society of London B, 230, 279–292.
Horridge, G. A., & Marcelja, L. (1992). On the existence of fast andslow directionally sensitive motion detector neurons in insects.Proceedings of the Royal Society of London B, 248, 47–54.
Ibbotson, M. R., Mark, R. F., & Maddess, T. L. (1994). Spatiotem-poral response properties of direction-selective neurons in thenucleus of the optic tract and dorsal terminal nucleus of thewallaby, Macropus eugenii. Journal of Neurophysiology, 72, 2927–2943.
Jin, S., & Srinivasan, M. V. (1990). A neural gradient schemefor measurement of image velocity. Visual Neuroscience, 5, 261–271.
Kirschfeld, K. (1978). The visual system of the fly: physiologicaloptics and functional anatomy as related to behaviour. In F. O.Schmitt, & F. G. Worden, The neurosciences: fourth study program(pp. 297–310). MA: MIT.
Kral, K. (1998). Side-to-side head movements to obtain motion depthcues: a short review of research on the praying mantis. Be-ha6ioural Processes, 43, 71–77.
Kral, K., & Poteser, M. (1997). Motion parallax as a source ofdistance information in locusts and mantids. Journal of InsectBeha6iour, 10, 145–163.
Krapp, H. G., & Hengstenberg, R. (1996). Estimation of self-motionby optic flow processing in single visual interneurons. Nature(London), 384, 463–466.
Lee, D. N. (1976). A theory of visual control of braking based oninformation about time-to-collision. Perception, 5, 437–459.
Lee, D. N., & Reddish, P. E. (1981). Plummeting gannets: a paradigmof ecological optics. Nature (London), 293, 293–294.
Marr, D., & Ullman, S. (1981). Directional selectivity and its use inearly visual processing. Proceedings of the Royal Society of Lon-don B, 211, 151–180.
Nalbach, H.-O. (1989). Three temporal frequency channels constitutethe dynamics of the optokinetic system of the crab, Carcinusmaenas (L.). Biological Cybernetics, 61, 59–70.
Nakayama, K. (1985). Biological image motion processing: a review.Vision Research, 25, 625–660.
O’Carroll, D. C., Bidwell, N. J., Laughlin, S. B., & Warrant, E. J.(1996). Insect motion detectors matched to visual ecology. Nature(London), 382, 63–66.
Osorio, D. (1992). Retinotopic vision in the locust. In R. B. Pinter,Nonlinear 6ision (pp. 377–390). Boca Raton: CRC.
Pick, B., & Buchner, E. (1979). Visual movement detection underlight- and darkadaptation in the fly, Musca domestica. Journal ofComparati6e Physiology, 134, 45–54.
Poteser, M., & Kral, K. (1995). Visual distance discrimination be-tween stationary targets in praying mantis: an index of the use ofmotion parallax. Journal of Experimental Biology, 198, 2127–2137.
Poteser, M., Pabst, M.-A., & Kral, K. (1998). Proprioceptive contri-bution to distance estimation by motion parallax in a prayingmantid. Journal of Experimental Biology, 201, 1483–1491.
Reichardt, W. (1969). Movement perception in insects. In W. Re-ichardt, Processing of optical data by organisms and machines (pp.465–493). New York: Academic.
Rind, F. C. (1987). Non-directional, movement sensitive neurones inthe locust optic lobe. Journal of Comparati6e Physiology A, 161,477–494.
Rossel, S. (1983). Binocular stereopsis in an insect. Nature (London),302, 821–822.
Schuling, F. H., Mastebroek, H. A. K., Bult, R., & Lenting, B. P. M.(1989). Properties of elementary movement detectors in the fly

M.V. Srini6asan et al. / Vision Research 39 (1999) 2749–27662766
Calliphora erythrocephala. Journal of Comparati6e Physiology A,165, 179–192.
Simoncelli, E. P., & Heeger, D. J. (1998). A model of neuronalresponses in visual area MT. Vision Research, 38, 743–761.
Single, S., Haag, J., & Borst, A. (1997). Dendritic computation ofdirection selectivity and gain control in visual interneurons. Jour-nal of Neuroscience, 17, 6023–6030.
Snippe, H. P., & Koenderink, J. J. (1994). Extraction of opticalvelocity by use of multi-input Reichardt detectors. Journal of theOptical Society of America A, 11, 1222–1236.
Sobel, E. C. (1990). The locust’s use of motion parallax to measuredistance. Journal of Comparati6e Physiology A, 167, 579–588.
Srinivasan, M. V. (1990). Generalized gradient schemes for the mea-surement of two-dimensional image motion. Biological Cybernet-ics, 63, 421–431.
Srinivasan, M. V. (1992). How flying bees compute range fromoptical flow: behavioral experiments and neural models. In R. B.Pinter, Nonlinear 6ision (pp. 353–375). Boca Raton: CRC.
Srinivasan, M. V. (1993). How insects infer range from visual motion.In F. A. Miles, & J. Wallman, Visual motion and its role in thestabilization of gaze (pp. 139–156). Amsterdam: Elsevier.
Srinivasan, M. V., & Dvorak, D. (1980). Spatial processing of visualinformation in the movement-detecting pathway of the fly. Jour-nal of Comparati6e Physiology, 140, 1–23.
Srinivasan, M. V., & Lehrer, M. (1984). Temporal acuity of honeybeevision: behavioural studies using moving stimuli. Journal of Com-parati6e Physiology, 155, 297–312.
Srinivasan, M. V., Lehrer, M., & Horridge, G. A. (1990). Visualfigure-ground discrimination in the honeybee: the role of motionparallax at boundaries. Proceedings of the Royal Society of Lon-don B., 238, 331–350.
Srinivasan, M. V., Lehrer, M., Kirchner, W. H., & Zhang, S. W.(1991). Range perception through apparent image speed in freely-flying honeybees. Visual Neuroscience, 6, 519–535.
Srinivasan, M. V., Pinter, R. B., & Osorio, D. (1990). Matchedfiltering in the visual system of the fly: large monopolar cells in
the lamina are optimized to detect moving edges and blobs.Proceedings of the Royal Society of London B, 240, 279–293.
Srinivasan, M. V., & Zhang, S. W. (1997). Visual control of honeybeeflight. In M. Lehrer, Orientation and communication in arthropods(pp. 95–113). Basel: Birkhauser Verlag.
Srinivasan, M. V., Zhang, S. W., & Bidwell, N. (1997). Visuallymediated odometry in honeybees. Journal of Experimental Biol-ogy, 200, 2513–2522.
Srinivasan, M. V., Zhang, S. W., & Chandrashekara, K. (1993).Evidence for two distinct movement-detecting mechanisms ininsect vision. Naturwissenschaften, 80, 38–41.
Srinivasan, M. V., Zhang, S. W., Lehrer, M., & Collett, T. S. (1996).Honeybee navigation en route to the goal: visual flight controland odometry. Journal of Experimental Biology, 199, 237–244.
Wagner, H. (1982). Flow-field variables trigger landing in flies. Na-ture (London), 297, 147–148.
Walcher, F., & Kral, K. (1994). Visual deprivation and distanceestimation in the praying mantis larvae. Physiological Entomology,19, 230–240.
Wallace, G. K. (1959). Visual scanning in the desert locust Schisto-cerca gregaria, Forskal. Journal of Experimental Biology, 36,512–525.
Warzecha, A.-K., & Egelhaaf, M. (1996). Intrinsic properties ofbiological motion detectors prevent the optomotor control systemfrom getting unstable. Philosophical, Transactions of the RoyalSociety of London B, 351, 1579–1591.
Wehner, R. (1981). Spatial vision in insects. In H. Autrum, Handbookof sensory physiology, vol. 7/6C (pp. 287–616). Berlin: Springer-Verlag.
Wolf-Oberhollenzer, F., & Kirschfeld, K. (1994). Motion sensitivityin the nucleus of the basal optic root of the pigeon. Journal ofNeurophysiology, 71, 1559–1573.
Zanker, J., Srinivasan, M. V., & Egelhaaf, M. (1999). Speed tuning inelementary motion detectors of the correlation type. BiologicalCybernetics, 80, 109–116.
..