
Mining of Self-Organizing Map Gene-Expression Portraits ...
24
cancers Article Mining of Self-Organizing Map Gene-Expression Portraits Reveals Prognostic Stratification of HPV-Positive Head and Neck Squamous Cell Carcinoma Laura D. Locati 1, † , Mara S. Serafini 2, † , Maria F. Iannò 2 , Andrea Carenzo 2 , Ester Orlandi 3 , Carlo Resteghini 1 , Stefano Cavalieri 1 , Paolo Bossi 1 , Silvana Canevari 2 , Lisa Licitra 1,4 and Loris De Cecco 2, * 1 Head and Neck Medical Oncology Department, Fondazione IRCCS Istituto Nazionale dei Tumori di Milano, 20133 Milan, Italy 2 Integrated Biology Platform, Department of Applied Research and Technology Development, Fondazione IRCCS Istituto Nazionale dei Tumori di Milano, 20133 Milan, Italy 3 Radiation Oncology Department, Fondazione IRCCS Istituto Nazionale dei Tumori di Milano, 20133 Milan, Italy 4 Department of Oncology, University of Milan, 20122 Milan, Italy * Correspondence: [email protected] † Authors contributed equally to this paper. Received: 10 July 2019; Accepted: 24 July 2019; Published: 26 July 2019 Abstract: Patients (pts) with head and neck squamous cell carcinoma (HNSCC) have different epidemiologic, clinical, and outcome behaviors in relation to human papillomavirus (HPV) infection status, with HPV-positive patients having a 70% reduction in their risk of death. Little is known about the molecular heterogeneity in HPV-related cases. In the present study, we aim to disclose the molecular subtypes with potential biological and clinical relevance. Through a literature review, 11 studies were retrieved with a total of 346 gene-expression data points from HPV-positive HNSCC pts. Meta-analysis and self-organizing map (SOM) approaches were used to disclose relevant meta-gene portraits. Unsupervised consensus clustering provided evidence of three biological subtypes in HPV-positive HNSCC: Cl1, immune-related; Cl2, epithelial–mesenchymal transition-related; Cl3, proliferation-related. This stratification has a prognostic relevance, with Cl1 having the best outcome, Cl2 the worst, and Cl3 an intermediate survival rate. Compared to recent literature, which identified immune and keratinocyte subtypes in HPV-related HNSCC, we confirmed the former and we separated the latter into two clusters with different biological and prognostic characteristics. At present, this paper reports the largest meta-analysis of HPV-positive HNSCC studies and offers a promising molecular subtype classification. Upon further validation, this stratification could improve patient selection and pave the way for the development of a precision medicine therapeutic approach. Keywords: self-organizing map; head and neck cancer; treatment de-escalation; HP; molecular subtypes; tumor microenvironment 1. Introduction Worldwide, head and neck squamous cell carcinoma (HNSCC) affects more than 550,000 patient cases/year with around 380,000 deaths annually [1]. Traditionally, alcohol exposure and tobacco smoking are identified as exogenous risk factors. However, human papillomavirus (HPV) infection, caused predominantly by HPV type 16, is currently recognized as an independent causal factor for the Cancers 2019, 11, 1057; doi:10.3390/cancers11081057 www.mdpi.com/journal/cancers
Transcript of Mining of Self-Organizing Map Gene-Expression Portraits ...

cancers
Article
Mining of Self-Organizing Map Gene-ExpressionPortraits Reveals Prognostic Stratification ofHPV-Positive Head and Neck SquamousCell Carcinoma
Laura D. Locati 1,†, Mara S. Serafini 2,†, Maria F. Iannò 2, Andrea Carenzo 2, Ester Orlandi 3,Carlo Resteghini 1, Stefano Cavalieri 1 , Paolo Bossi 1, Silvana Canevari 2, Lisa Licitra 1,4 andLoris De Cecco 2,*
1 Head and Neck Medical Oncology Department, Fondazione IRCCS Istituto Nazionale dei Tumori di Milano,20133 Milan, Italy
2 Integrated Biology Platform, Department of Applied Research and Technology Development, FondazioneIRCCS Istituto Nazionale dei Tumori di Milano, 20133 Milan, Italy
3 Radiation Oncology Department, Fondazione IRCCS Istituto Nazionale dei Tumori di Milano, 20133 Milan,Italy
4 Department of Oncology, University of Milan, 20122 Milan, Italy* Correspondence: [email protected]† Authors contributed equally to this paper.
Received: 10 July 2019; Accepted: 24 July 2019; Published: 26 July 2019�����������������
Abstract: Patients (pts) with head and neck squamous cell carcinoma (HNSCC) have differentepidemiologic, clinical, and outcome behaviors in relation to human papillomavirus (HPV) infectionstatus, with HPV-positive patients having a 70% reduction in their risk of death. Little is knownabout the molecular heterogeneity in HPV-related cases. In the present study, we aim to disclosethe molecular subtypes with potential biological and clinical relevance. Through a literature review,11 studies were retrieved with a total of 346 gene-expression data points from HPV-positive HNSCC pts.Meta-analysis and self-organizing map (SOM) approaches were used to disclose relevant meta-geneportraits. Unsupervised consensus clustering provided evidence of three biological subtypesin HPV-positive HNSCC: Cl1, immune-related; Cl2, epithelial–mesenchymal transition-related;Cl3, proliferation-related. This stratification has a prognostic relevance, with Cl1 having the bestoutcome, Cl2 the worst, and Cl3 an intermediate survival rate. Compared to recent literature, whichidentified immune and keratinocyte subtypes in HPV-related HNSCC, we confirmed the formerand we separated the latter into two clusters with different biological and prognostic characteristics.At present, this paper reports the largest meta-analysis of HPV-positive HNSCC studies and offers apromising molecular subtype classification. Upon further validation, this stratification could improvepatient selection and pave the way for the development of a precision medicine therapeutic approach.
Keywords: self-organizing map; head and neck cancer; treatment de-escalation; HP; molecularsubtypes; tumor microenvironment
1. Introduction
Worldwide, head and neck squamous cell carcinoma (HNSCC) affects more than 550,000 patientcases/year with around 380,000 deaths annually [1]. Traditionally, alcohol exposure and tobaccosmoking are identified as exogenous risk factors. However, human papillomavirus (HPV) infection,caused predominantly by HPV type 16, is currently recognized as an independent causal factor for the
Cancers 2019, 11, 1057; doi:10.3390/cancers11081057 www.mdpi.com/journal/cancers

Cancers 2019, 11, 1057 2 of 24
development of HNSCC. Since the 1990s, there was a significant increase in HPV-related HNSCC inwestern countries, whilst the incidence of HPV-negative HNSCC is globally declining [2,3], in parallelwith the decline in tobacco smoking rates. This high incidence of HPV-positive cases establishesHNSCC as one of the most common HPV-related cancers, second only to cervical cancer [4]. Moreover,it is estimated that the annual incidence could increase and eventually surpass the annual incidence ofcervical cancer by 2020. Previous epidemiological studies showed that around 25% of all HNSCCs arerelated to HPV infection, with a tendency for the oropharynx (OPSCC) to be the specific site, comparedto infection in other sites (oral cavity, larynx, and hypopharynx) [5]. It is known that HPV-relatedHNSCC patients have different epidemiologic and clinical behaviors in comparison with HPV-negativeHNSCC patients, allowing the identification of HPV-positive HNSCC as a specific distinct diseasewith peculiar prognostic characteristics [6]. In fact, HPV-positive HNSCC is diagnosed at a youngerage than HPV-negative HNSCC, and the five-year survival rate for HPV-positive HNSCC is 60–90%as compared with 20–70% for HPV-negative HNSCC [7], conferring a more favorable prognosis forHPV-positive HNSCC patients. The differences in outcomes between HPV-positive and HPV-negativetumors were already provided, and a multitude of molecular differences comparing HPV-negativeand HPV-positive HNSCC patients were reported [8–10]. However, a clear biological picture behindtheir broad diversity is not yet elucidated. Moreover, considering the better prognosis of HPV-positiveHNSCC patients compared with their HPV-negative HNSCC counterparts and the median youngerage of patients at diagnosis, the question about how to treat HPV-positive patients requires an answer.De-escalation of treatment protocols, for this subgroup of patients, is currently ongoing [11], with thefinal aim being to reduce the intensity of treatments (both chemoradiation and surgery) and theburden of treatment-related toxicities over the next few years. A further investigation on HPV-relatedHNSCC is needed. As already reported in the literature, in addition to the diversity of HPV-positiveHNSCC compared with HPV-negative HNSCC, it is possible to also observe an intrinsic biologicalheterogeneity in the HPV-positive HNSCC. In particular, we refer to Keck et al. [12], who identifiedtwo different clusters on the basis of their gene expression, and to Zhang et al. [13], who classifiedthese two groups as HPV-positive immune-related (HPV-IMU) and HPV-positive with keratinocytedifferentiation (HPV-KRT) HNSCC. Both of these studies had the ability to explore the biology relatedto HPV infection, unfortunately without showing a significant survival difference.
High-throughput technologies allow the assessment of thousands of features, posing challenges todata analysis. To deal with increased data complexity, researchers apply machine learning approaches toimprove biological knowledge via intuitive visualization, even at single-sample resolution. This allowsquestions, such as biomarker discovery and functional biological information mining, to be addressed.A particular method, self-organizing maps (SOM), provides important benefits including dimensionreduction, multidimensional scaling, visualization capabilities over alternative methods such asnon-negative matrix factorization, and hierarchical clustering [14]. SOM gained immediate attentionin the bioinformatics field, and early microarray studies reported its application [15,16]. Since then,a number of studies on different cancer types proved its robustness [17,18].
In the present analysis, we focused our attention on HPV-positive HNSCC with annotated geneexpression data and clinical annotations by exploiting a meta-analysis approach. We applied the SOMmachine learning method on a total of 346 HPV-positive tumor samples. This allowed us to dissect themolecular heterogeneity of the disease and to make suggestions for de-escalation treatment.
2. Results
2.1. Case Material
In order to dissect the molecular heterogeneity in HPV-positive HNSCC, 11 eligible publishedstudies reporting gene expression data were selected for a systematic survey (Table S1, SupplementaryMaterials). Of these studies, all but one utilized microarray technology for gene expression analysis,and, in the majority of cases, HPV status was assessed with qPCR or HPV genotyping. The resulting

Cancers 2019, 11, 1057 3 of 24
meta-analysis dataset, containing 346 samples and 8254 EntrezID genes, was used for the genomicanalysis. HPV infection was assessed by p16 immunohistochemistry (IHC) (13 cases, 4%) or DNAor RNA from HPV testing (333, 96%) (Table S1, Supplementary Materials). All the methods used arerecognized and utilized in clinical practice [19].
According to the clinical information (Table 1), a male preponderance (83%) and median age of58.7 years (range, 35–87) were observed, in line with the epidemiological data reported in the literature.The main subsite of origin was the oropharynx (68%), followed by the oral cavity (17%), larynx (6%),and hypopharynx (3%). Stages, assessed following malignant tumor classification system (TNMedition 7, American Joint Committee on Cancer, AJCC), were divided into stages I–II (35), stages III–IV(229), and information not available (82). Locally advanced stages (III–IV) were the most represented(66%), followed by not available (24%) and early stages (I–II; 10%). Survival data were available for197 cases (57%) and not present for 149 cases (43%). Smoking habits were reported for 245 patients(169 smokers, 76 never smokers), and were unknown for 101 patients (Table 1).
Table 1. Demographic and clinical data of the head and neck squamous cell carcinoma (HNSCC)human papillomavirus (HPV)-positive patients entered in the meta-analysis.
Characteristics No. %
Age, years
(median; range) 57 (35–87) 77%
Not available 78 23%
Gender (male:female ratio) 287/59 83%/17%
Subsite
Oropharynx 235 68%
Oral cavity 59 17%
Larynx 20 6%
Hypopharynx 10 3%
Not available 22 6%
Stage according to TNM edition 7
Stage I–II 35 10%
Stage III–IV 229 66%
Not available 82 24%
Smoking
Smoker 169 49%
Not smoker 76 22%
Not available 101 29%
Availability of follow-up data
Yes 197 57%
No 149 43%
Total 346 100%
2.2. HPV-Positive HNSCC Tumor Clusters: First-Level Self-Organizing Map (SOM) and UnsupervisedClustering Analysis
We applied the SOM machine learning algorithm to convert the meta-analysis dataset into a matrixof meta-gene expression data. Starting from the 8254 genes, we imposed the log-intensity variationp-value < 0.01, and a data matrix of 3498 genes was yielded. These 3498 genes were aggregatedin meta-genes (average 10 genes each), resulting in a matrix of 18 × 18 meta-genes. Consensus

Cancers 2019, 11, 1057 4 of 24
unsupervised clustering was applied on the meta-gene data, revealing three clusters of samples.The cluster had well-defined boundaries, as shown by the consensus heatmap (Figure 1a). To excludethe existence of under-represented clusters, the consistency of sample assignment was evaluated bysilhouette plot analysis. The resulting clustering configuration was appropriate (Figure 1b), since mostsamples in each cluster had a positive value (average < s >: Cluster 1, Cl1 = 0.68; Cluster 2, Cl2 =
0.53; Cluster 3, Cl3 = 0.48). Only seven samples (two belonging to Cl2 and five belonging to Cl3),corresponding to 2% of the entire case material, had negative values but were in the range between−0.01 and −0.04. These seven samples were assigned by silhouette analysis, as follows: two Cl2samples to Cl1, three Cl3 samples to Cl2, and three Cl3 samples to Cl1. We assessed the samplesize adequacy by estimating the power for the detection of the three clusters; the robustness of theclassification was ensured since at least 87% of genes had a power level of 0.9 (Figure S1, SupplementaryMaterials). By training the SOM algorithm, each sample was portrayed by displaying its molecularfingerprint. The generated subtype SOM images revealed a series of adjacent mosaic tiles coherentlyover- or under-expressed, and the resulting gallery of SOM portraits was used to intuitively visualizethe coherent cluster patterns. In this way, we highlighted cluster-specific tiles in the SOM portraits,independent of the patient’s individuality (Figure 1c).

Cancers 2019, 11, 1057 5 of 24
Cancers 2019, 11, x 4 of 22
between −0.01 and −0.04. These seven samples were assigned by silhouette analysis, as follows: two Cl2 samples to Cl1, three Cl3 samples to Cl2, and three Cl3 samples to Cl1. We assessed the sample size adequacy by estimating the power for the detection of the three clusters; the robustness of the classification was ensured since at least 87% of genes had a power level of 0.9 (Figure S1, Supplementary Materials). By training the SOM algorithm, each sample was portrayed by displaying its molecular fingerprint. The generated subtype SOM images revealed a series of adjacent mosaic tiles coherently over- or under-expressed, and the resulting gallery of SOM portraits was used to intuitively visualize the coherent cluster patterns. In this way, we highlighted cluster-specific tiles in the SOM portraits, independent of the patient’s individuality (Figure 1c).
Figure 1. Human papillomavirus (HPV)-positive head and neck squamous cell carcinoma (HNSCC) tumor clusters: first-level self-organizing map (SOM) and unsupervised clustering analysis. (a) Consensus matrix heatmap imposing three clusters: Cl1 (n = 134; 39%), Cl2 (n = 104; 30%), and Cl3 (n = 108; 31%). The consensus values are reported in a range from 0 (white, samples that never cluster together) to 1 (blue, samples showing the highest clustering affinity). (b) Silhouette plot analysis. The samples are ranked based on silhouette values (S) in each cluster. The heights indicate a strong similarity of the samples within their clusters compared with the samples belonging to other clusters. The colors in the lower bar show the predicted membership by silhouette analysis; the colors correspond to the consensus clustering assignment for all samples with the exception of the seven samples with a negative number but close to 0. (c) First level of the SOM gallery of the three clusters with cluster-specific tiles highlighted. The expression patterns are translated into a color code indicating over- and under-expression in a range from red to blue spots, respectively.
We also investigated the influence related to technical sources of variability on our findings. An alluvial diagram was used to show the three-cluster membership, based on the study of origin and the platform used for the expression profiling (Figure 2). The percentage of variation, explained by these variables, was investigated compared with the variation associated with the present cluster
Figure 1. Human papillomavirus (HPV)-positive head and neck squamous cell carcinoma(HNSCC) tumor clusters: first-level self-organizing map (SOM) and unsupervised clustering analysis.(a) Consensus matrix heatmap imposing three clusters: Cl1 (n = 134; 39%), Cl2 (n = 104; 30%), andCl3 (n = 108; 31%). The consensus values are reported in a range from 0 (white, samples that nevercluster together) to 1 (blue, samples showing the highest clustering affinity). (b) Silhouette plotanalysis. The samples are ranked based on silhouette values (S) in each cluster. The heights indicate astrong similarity of the samples within their clusters compared with the samples belonging to otherclusters. The colors in the lower bar show the predicted membership by silhouette analysis; the colorscorrespond to the consensus clustering assignment for all samples with the exception of the sevensamples with a negative number but close to 0. (c) First level of the SOM gallery of the three clusterswith cluster-specific tiles highlighted. The expression patterns are translated into a color code indicatingover- and under-expression in a range from red to blue spots, respectively.
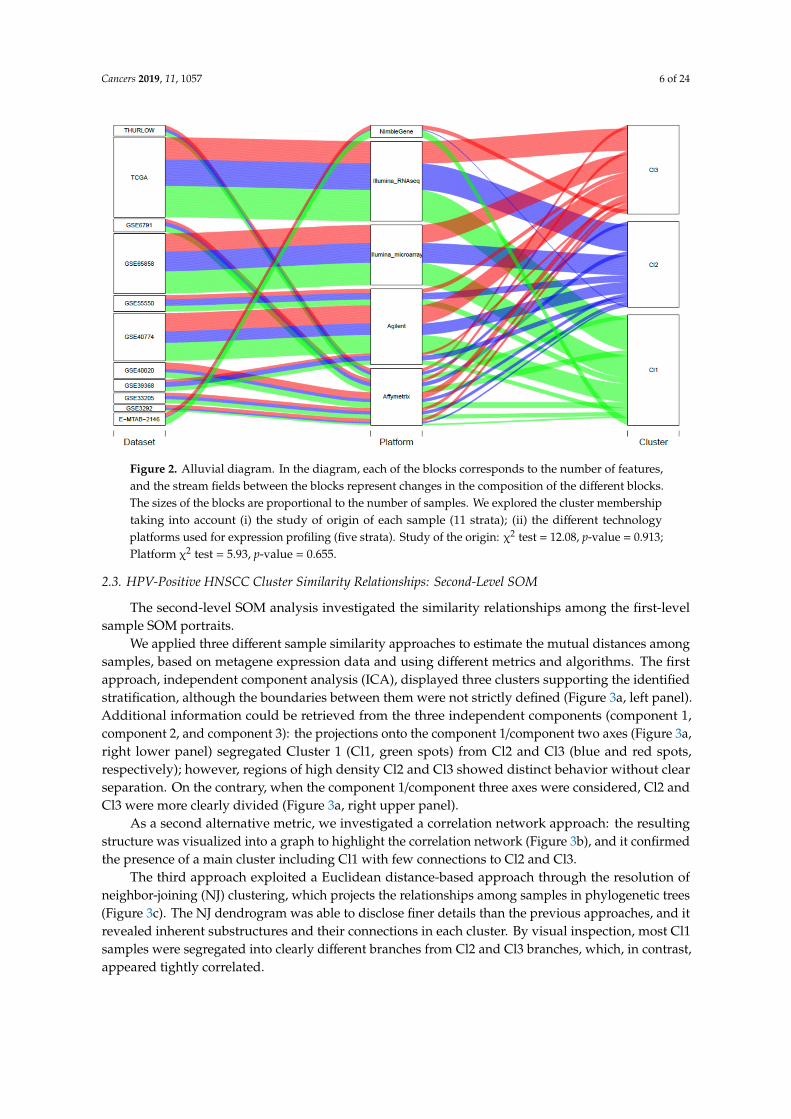
We also investigated the influence related to technical sources of variability on our findings.An alluvial diagram was used to show the three-cluster membership, based on the study of originand the platform used for the expression profiling (Figure 2). The percentage of variation, explainedby these variables, was investigated compared with the variation associated with the present clusterstratification, and this is summarized in the violin plots (Figure S2, Supplementary Materials).Our findings supported the biological value behind our three-subtype stratification, with a negligibleinfluence of technical covariates.
Cancers 2019, 11, 1057 6 of 24
Cancers 2019, 11, x 5 of 22
stratification, and this is summarized in the violin plots (Figure S2, Supplementary Materials). Our findings supported the biological value behind our three-subtype stratification, with a negligible influence of technical covariates.
Figure 2. Alluvial diagram. In the diagram, each of the blocks corresponds to the number of features, and the stream fields between the blocks represent changes in the composition of the different blocks. The sizes of the blocks are proportional to the number of samples. We explored the cluster membership taking into account (i) the study of origin of each sample (11 strata); (ii) the different technology platforms used for expression profiling (five strata). Study of the origin: χ2 test = 12.08, p-value = 0.913; Platform χ2 test = 5.93, p-value = 0.655.
2.3. HPV-Positive HNSCC Cluster Similarity Relationships: Second-Level SOM
The second-level SOM analysis investigated the similarity relationships among the first-level sample SOM portraits.
We applied three different sample similarity approaches to estimate the mutual distances among samples, based on metagene expression data and using different metrics and algorithms. The first approach, independent component analysis (ICA), displayed three clusters supporting the identified stratification, although the boundaries between them were not strictly defined (Figure 3a, left panel). Additional information could be retrieved from the three independent components (component 1, component 2, and component 3): the projections onto the component 1/component two axes (Figure 3a, right lower panel) segregated Cluster 1 (Cl1, green spots) from Cl2 and Cl3 (blue and red spots, respectively); however, regions of high density Cl2 and Cl3 showed distinct behavior without clear separation. On the contrary, when the component 1/component three axes were considered, Cl2 and Cl3 were more clearly divided (Figure 3a, right upper panel).
As a second alternative metric, we investigated a correlation network approach: the resulting structure was visualized into a graph to highlight the correlation network (Figure 3b), and it confirmed the presence of a main cluster including Cl1 with few connections to Cl2 and Cl3.
The third approach exploited a Euclidean distance-based approach through the resolution of neighbor-joining (NJ) clustering, which projects the relationships among samples in phylogenetic trees (Figure 3c). The NJ dendrogram was able to disclose finer details than the previous approaches, and it revealed inherent substructures and their connections in each cluster. By visual inspection, most Cl1 samples were segregated into clearly different branches from Cl2 and Cl3 branches, which, in contrast, appeared tightly correlated.
Figure 2. Alluvial diagram. In the diagram, each of the blocks corresponds to the number of features,and the stream fields between the blocks represent changes in the composition of the different blocks.The sizes of the blocks are proportional to the number of samples. We explored the cluster membershiptaking into account (i) the study of origin of each sample (11 strata); (ii) the different technologyplatforms used for expression profiling (five strata). Study of the origin: χ2 test = 12.08, p-value = 0.913;Platform χ2 test = 5.93, p-value = 0.655.
2.3. HPV-Positive HNSCC Cluster Similarity Relationships: Second-Level SOM
The second-level SOM analysis investigated the similarity relationships among the first-levelsample SOM portraits.
We applied three different sample similarity approaches to estimate the mutual distances amongsamples, based on metagene expression data and using different metrics and algorithms. The firstapproach, independent component analysis (ICA), displayed three clusters supporting the identifiedstratification, although the boundaries between them were not strictly defined (Figure 3a, left panel).Additional information could be retrieved from the three independent components (component 1,component 2, and component 3): the projections onto the component 1/component two axes (Figure 3a,right lower panel) segregated Cluster 1 (Cl1, green spots) from Cl2 and Cl3 (blue and red spots,respectively); however, regions of high density Cl2 and Cl3 showed distinct behavior without clearseparation. On the contrary, when the component 1/component three axes were considered, Cl2 andCl3 were more clearly divided (Figure 3a, right upper panel).
As a second alternative metric, we investigated a correlation network approach: the resultingstructure was visualized into a graph to highlight the correlation network (Figure 3b), and it confirmedthe presence of a main cluster including Cl1 with few connections to Cl2 and Cl3.
The third approach exploited a Euclidean distance-based approach through the resolution ofneighbor-joining (NJ) clustering, which projects the relationships among samples in phylogenetic trees(Figure 3c). The NJ dendrogram was able to disclose finer details than the previous approaches, and itrevealed inherent substructures and their connections in each cluster. By visual inspection, most Cl1samples were segregated into clearly different branches from Cl2 and Cl3 branches, which, in contrast,appeared tightly correlated.

Cancers 2019, 11, 1057 7 of 24Cancers 2019, 11, x 6 of 22
Figure 3. HPV-positive HNSCC cluster similarity relationships: second-level SOM. (a) Independent component analysis of meta-gene data. Samples were distributed along the three leading independent components; the plots show the three-dimensional distribution and the projections into the component 1/component 2 (lower panel) and component 1/component 3 (upper panel) dimensions. (b) Sample correlation network. The samples are visualized by nodes connected by edges with a backbone structure linking samples with the highest correlation. The similarity between samples is represented by their reciprocal distance; closer nodes have higher similarity and distant nodes have lower similarity. (c) Neighbor-joining analysis. The sample similarities are summarized in a phylogenetic tree structure computed using Euclidean distance. The neighbor-joining (NJ) analysis visualizes “bush-like” groups of similar samples by assessing their mutual dissimilarity.
Finally, we investigated the relationship among meta-genes characterizing the three identified subtypes. The process of detection of coherent expression of meta-genes in SOM portraits highlighted specific molecular features for each subtype. Indeed, the resulting map defined three over-expression regions, each of them located in distinct corners of the map. These regions corresponded to SOM
Figure 3. HPV-positive HNSCC cluster similarity relationships: second-level SOM. (a) Independentcomponent analysis of meta-gene data. Samples were distributed along the three leading independentcomponents; the plots show the three-dimensional distribution and the projections into the component1/component 2 (lower panel) and component 1/component 3 (upper panel) dimensions. (b) Samplecorrelation network. The samples are visualized by nodes connected by edges with a backbonestructure linking samples with the highest correlation. The similarity between samples is representedby their reciprocal distance; closer nodes have higher similarity and distant nodes have lower similarity.(c) Neighbor-joining analysis. The sample similarities are summarized in a phylogenetic tree structurecomputed using Euclidean distance. The neighbor-joining (NJ) analysis visualizes “bush-like” groupsof similar samples by assessing their mutual dissimilarity.
Finally, we investigated the relationship among meta-genes characterizing the three identifiedsubtypes. The process of detection of coherent expression of meta-genes in SOM portraits highlighted

Cancers 2019, 11, 1057 8 of 24
specific molecular features for each subtype. Indeed, the resulting map defined three over-expressionregions, each of them located in distinct corners of the map. These regions corresponded to SOMclusters of co-regulated meta-genes (Figure 4a). The association of meta-genes to each cluster in precisemap locations (left panels) and to a bar plot of expression intensity (right panels) better confirmed anddefined the differences between subtypes: 54, 93, and 57 meta-genes had positive correlations withClusters 1, 2, and 3, respectively (r = 0.77, r = 0.53, r = 0.67) (Figure 4b).
Cancers 2019, 11, x 7 of 22
clusters of co-regulated meta-genes (Figure 4a). The association of meta-genes to each cluster in precise map locations (left panels) and to a bar plot of expression intensity (right panels) better confirmed and defined the differences between subtypes: 54, 93, and 57 meta-genes had positive correlations with Clusters 1, 2, and 3, respectively (r = 0.77, r = 0.53, r = 0.67) (Figure 4b).
Figure 4. Subtype characterization by group overexpression maps. (a) The 18 × 18 map of meta-genes summarizes the expression landscapes over the three subtypes; according to this analysis, co-regulated meta-genes are located in the opposite corners of the map. (b) Detailed analysis of metagenes overexpressed in each subtype: map location (left panels) and bar plot of expression intensity (right panels). The bar plot represents the average meta-gene expression of each sample for the selected tiles.
2.4. Tumor Microenvironment Landscape
Figure 4. Subtype characterization by group overexpression maps. (a) The 18 × 18 map of meta-genessummarizes the expression landscapes over the three subtypes; according to this analysis, co-regulatedmeta-genes are located in the opposite corners of the map. (b) Detailed analysis of metagenesoverexpressed in each subtype: map location (left panels) and bar plot of expression intensity (rightpanels). The bar plot represents the average meta-gene expression of each sample for the selected tiles.

Cancers 2019, 11, 1057 9 of 24
2.4. Tumor Microenvironment Landscape
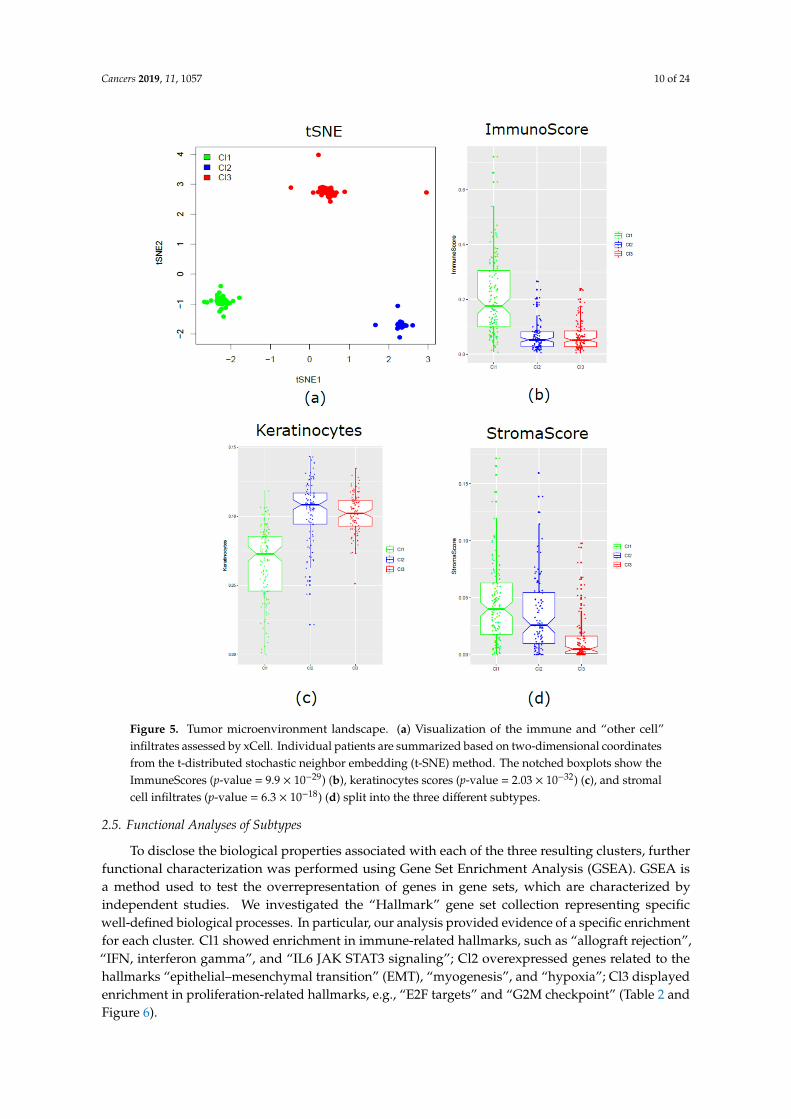
The xCell tool was applied for the detection and evaluation, if present, of any differences in the threeclusters, regarding microenvironment components. According to a dimensionality reduction technique(t-distributed stochastic neighbor embedding, t-SNE), we obtained two-dimensional coordinates thatclearly segregated the three molecular clusters. It provided evidence about the existence of unique anddefined biological subtypes (Figure 5a). To better disclose the properties of each subtype, the compositescores of immune cells (ImmuneScore), stromal cells (StromaScore), and the score of keratinocytes werecalculated. Cl1, compared to Cl2 and Cl3, was characterized by enrichment of immune components(p-value = 9.9 × 10⁻²⁹) (Figure 5b) and under-expression of keratinocytes (p-value = 2.03 × 10⁻³²)(Figure 5c). On the contrary, Cl2 and Cl3 showed similar enrichment in keratinocytes, but a lowerimmunoscore. Cl2 and Cl3 were clearly separated when compared in terms of stromal components,with Cl3 significantly decreased (p-value = 6.3 × 10⁻¹⁸) compared with the two other two subtypes(Figure 5d).
Cancers 2019, 11, 1057 10 of 24
Cancers 2019, 11, x 8 of 22
The xCell tool was applied for the detection and evaluation, if present, of any differences in the three clusters, regarding microenvironment components. According to a dimensionality reduction technique (t-distributed stochastic neighbor embedding, t-SNE), we obtained two-dimensional coordinates that clearly segregated the three molecular clusters. It provided evidence about the existence of unique and defined biological subtypes (Figure 5a). To better disclose the properties of each subtype, the composite scores of immune cells (ImmuneScore), stromal cells (StromaScore), and the score of keratinocytes were calculated. Cl1, compared to Cl2 and Cl3, was characterized by enrichment of immune components (p-value = 9.9 × 10⁻²⁹) (Figure 5b) and under-expression of keratinocytes (p-value = 2.03 × 10⁻³²) (Figure 5c). On the contrary, Cl2 and Cl3 showed similar enrichment in keratinocytes, but a lower immunoscore. Cl2 and Cl3 were clearly separated when compared in terms of stromal components, with Cl3 significantly decreased (p-value = 6.3 × 10⁻¹⁸) compared with the two other two subtypes (Figure 5d).
Figure 5. Tumor microenvironment landscape. (a) Visualization of the immune and “other cell” infiltrates assessed by xCell. Individual patients are summarized based on two-dimensional
Figure 5. Tumor microenvironment landscape. (a) Visualization of the immune and “other cell”infiltrates assessed by xCell. Individual patients are summarized based on two-dimensional coordinatesfrom the t-distributed stochastic neighbor embedding (t-SNE) method. The notched boxplots show theImmuneScores (p-value = 9.9 × 10⁻²⁹) (b), keratinocytes scores (p-value = 2.03 × 10⁻³²) (c), and stromalcell infiltrates (p-value = 6.3 × 10⁻¹⁸) (d) split into the three different subtypes.
2.5. Functional Analyses of Subtypes
To disclose the biological properties associated with each of the three resulting clusters, furtherfunctional characterization was performed using Gene Set Enrichment Analysis (GSEA). GSEA isa method used to test the overrepresentation of genes in gene sets, which are characterized byindependent studies. We investigated the “Hallmark” gene set collection representing specificwell-defined biological processes. In particular, our analysis provided evidence of a specific enrichmentfor each cluster. Cl1 showed enrichment in immune-related hallmarks, such as “allograft rejection”,“IFN, interferon gamma”, and “IL6 JAK STAT3 signaling”; Cl2 overexpressed genes related to thehallmarks “epithelial–mesenchymal transition” (EMT), “myogenesis”, and “hypoxia”; Cl3 displayedenrichment in proliferation-related hallmarks, e.g., “E2F targets” and “G2M checkpoint” (Table 2 andFigure 6).

Cancers 2019, 11, 1057 11 of 24
Table 2. Gene-sets significantly up-regulated in each cluster.
Gene-set ID HALLMARKGene-Set Name Genes a NES b Nom
p-ValueFDRq-val
Cl1 vs. Cl2 and Cl3
GS-1 ALLOGRAFT REJECTION(immune resp) 130 2.89 <0.00001 <0.00001
GS-2 INTERFERON GAMMARESPONSE 151 2.18 <0.00001 <0.00001
GS-3 IL6 JAK STAT3SIGNALING 60 1.94 <0.00001 <0.00001
GS-4 INFLAMMATORYRESPONSE 132 1.76 <0.00001 0.0018
GS-5 KRAS SIGNALING UP 114 1.75 <0.00001 0.0019
Cl2 vs. Cl1 and Cl3
GS-1EPITHELIAL
MESENCHYMALTRANSITION
140 3.01 <0.00001 <0.00001
GS-2 MYOGENESIS 119 2.42 <0.00001 <0.00001GS-3 COAGULATION 77 2.23 <0.00001 <0.00001GS-4 ANGIOGENESIS 19 2.02 <0.00001 <0.00001GS-5 HYPOXIA 133 1.90 <0.00001 <0.00001GS-6 HEDGEHOG SIGNALING 17 1.89 0.0020 <0.00001GS-7 UV RESPONSE DN 97 1.78 <0.00001 0.0020GS-8 APICAL JUNCTION 137 1.78 <0.00001 0.0020
Cl3 vs. Cl1 and Cl2
GS-1 E2F TARGETS 143 2.56 <0.00001 <0.00001GS-2 G2M CHECKPOINT 150 2.24 <0.00001 0.0020
GS: geneset; thresholds: FDR ≤ 0.005; NES≥1.75, a Number of total genes present in the geneset, b NES = normalizedenrichment score.
Cancers 2019, 11, x 10 of 22
Figure 6. Visualization of the Gene Set Enrichment Analysis (GSEA) functional analysis for each of the three clusters. The boxplots show how the gene set Z score (GSZ) values (depicted in y-axis) are distributed within each of the three clusters (Cl1, green; Cl2, blue; Cl3 red). In each row, comparisons of the GSZ score values for the two most enriched hallmark gene sets are shown: for Cl1, over-expression is shown for the “immune response” hallmark (p-value 1.09 × 10−40) and “interferon (IFN)-
Figure 6. Cont.

Cancers 2019, 11, 1057 12 of 24
Cancers 2019, 11, x 10 of 22
Figure 6. Visualization of the Gene Set Enrichment Analysis (GSEA) functional analysis for each of the three clusters. The boxplots show how the gene set Z score (GSZ) values (depicted in y-axis) are distributed within each of the three clusters (Cl1, green; Cl2, blue; Cl3 red). In each row, comparisons of the GSZ score values for the two most enriched hallmark gene sets are shown: for Cl1, over-expression is shown for the “immune response” hallmark (p-value 1.09 × 10−40) and “interferon (IFN)-
Figure 6. Visualization of the Gene Set Enrichment Analysis (GSEA) functional analysis for each ofthe three clusters. The boxplots show how the gene set Z score (GSZ) values (depicted in y-axis)are distributed within each of the three clusters (Cl1, green; Cl2, blue; Cl3 red). In each row,comparisons of the GSZ score values for the two most enriched hallmark gene sets are shown:for Cl1, over-expression is shown for the “immune response” hallmark (p-value 1.09 × 10−40) and“interferon (IFN)-gamma response” hallmark (p-value = 9.32 × 10⁻¹⁴); for Cl2, enrichment is shown inthe “epithelial–mesenchymal transition (EMT)” hallmark (p-value = 4.30 × 10⁻³³) and “myogenesis”hallmark (p-value = 9.68 × 10⁻¹⁹); for Cl3, over-expression is shown in the “E2F targets” hallmark(p-value = 2.68 × 10⁻¹⁸) and “G2M checkpoint” (p-value 2.10 × 10⁻¹³). The p-values were obtained bymeans of Kruskal–Wallis tests.
2.6. HPV Presence/Integration and Its Association with Clusters
We investigated the association between HPV viral integration and our three clusters, using thedata provided by Koneva et al. [20]. Table S2 (Supplementary Materials) shows the contingency tablefor the TCGA cases analyzed in Koneva et al., reaching a significant association of χ2 =12.32 and ap-value = 0.00212; the relative presence of HPV integrated cases in each subtype increased in the orderCl1 < Cl3 < Cl2, with relative frequencies of 0.45, 0.77, and 1, respectively. Moreover, we explored theexpression of viral genes (E2, E4, and E5). The expression patterns in Cluster 2 are consistent with viral
Cancers 2019, 11, 1057 13 of 24
integration. When integrated, the expression of the E2 gene is reduced, since it is truncated along withdownstream genes such as E4 and E5 (Figure S3).
2.7. Prognostic Values of the Three-Subtype Classification
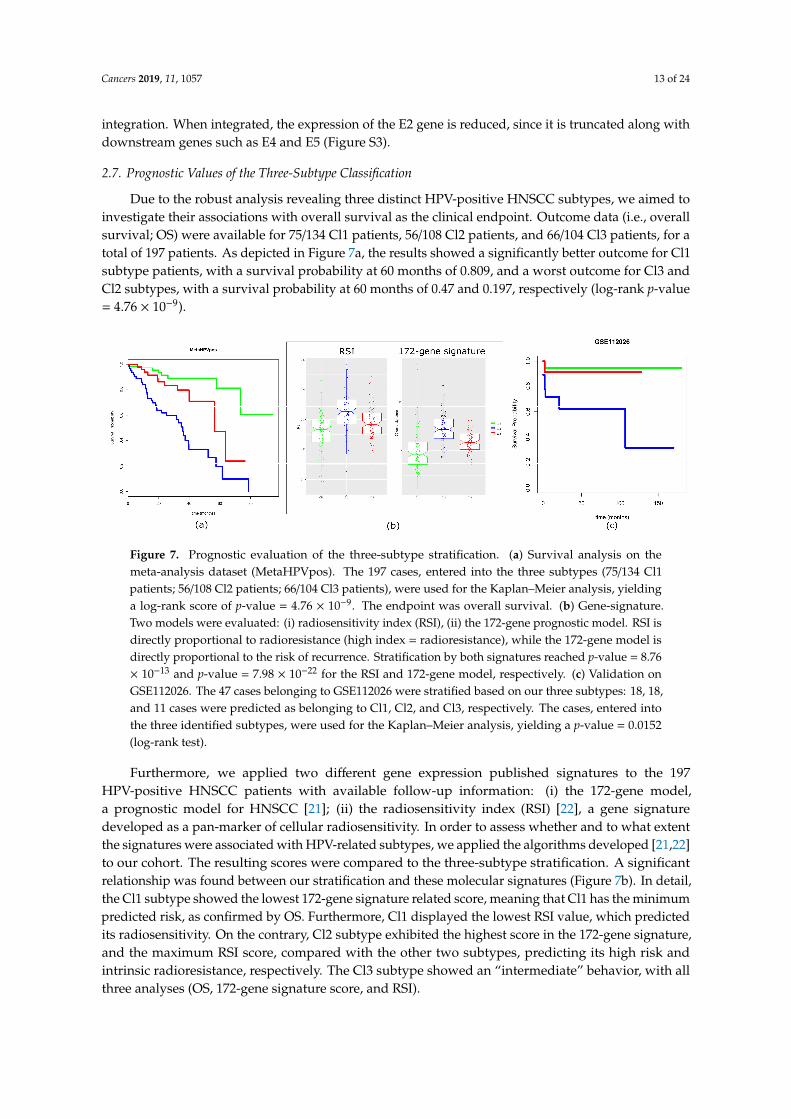
Due to the robust analysis revealing three distinct HPV-positive HNSCC subtypes, we aimed toinvestigate their associations with overall survival as the clinical endpoint. Outcome data (i.e., overallsurvival; OS) were available for 75/134 Cl1 patients, 56/108 Cl2 patients, and 66/104 Cl3 patients, for atotal of 197 patients. As depicted in Figure 7a, the results showed a significantly better outcome for Cl1subtype patients, with a survival probability at 60 months of 0.809, and a worst outcome for Cl3 andCl2 subtypes, with a survival probability at 60 months of 0.47 and 0.197, respectively (log-rank p-value= 4.76 × 10⁻⁹).Cancers 2019, 11, x 12 of 22
Figure 7. Prognostic evaluation of the three-subtype stratification. (a) Survival analysis on the meta-analysis dataset (MetaHPVpos). The 197 cases, entered into the three subtypes (75/134 Cl1 patients; 56/108 Cl2 patients; 66/104 Cl3 patients), were used for the Kaplan–Meier analysis, yielding a log-rank score of p-value = 4.76 × 10⁻⁹. The endpoint was overall survival. (b) Gene-signature. Two models were evaluated: (i) radiosensitivity index (RSI), (ii) the 172-gene prognostic model. RSI is directly proportional to radioresistance (high index = radioresistance), while the 172-gene model is directly proportional to the risk of recurrence. Stratification by both signatures reached p-value = 8.76 × 10⁻¹³ and p-value = 7.98 × 10⁻²² for the RSI and 172-gene model, respectively. (c) Validation on GSE112026. The 47 cases belonging to GSE112026 were stratified based on our three subtypes: 18, 18, and 11 cases were predicted as belonging to Cl1, Cl2, and Cl3, respectively. The cases, entered into the three identified subtypes, were used for the Kaplan–Meier analysis, yielding a p-value = 0.0152 (log-rank test).
3. Discussion
Among HNSCCs, the HPV-positive tumors are an independent entity with specific clinical and molecular characteristics. Moreover, inside the HPV-positive subgroup, it is additionally possible to observe an intrinsic heterogeneity, in terms of patients’ outcomes. This assumption questions whether treatment de-intensification could be applied to all HPV-positive HNSCCs. Clinical factors, such as large tumor burden and smoking history, correlate with a worse prognosis, but the biological mechanisms elucidating the complexity of the HPV-positive subgroup are still not fully understood. In the present meta-analysis of transcriptomic data, we applied a rigorous and up-to-date bioinformatics analysis to 346 HPV-positive HNSCCs with published sample data. To the best of our knowledge, this is the largest cohort of HPV-positive HNSCCs analyzed up until now. Specifically, our study identified three tumor subtypes, and it further dissected a population, which was previously divided into only two subgroups by published studies [12,13,24]. In agreement with these findings, we clearly identified an immune-associated cluster (named Cl1 in our analysis). In addition, we stratified the remaining patients (previously described as one “keratinocyte subtype” cluster [13,24]) into two well distinct subtypes with clearly defined biological and prognostic characteristics. The stratification refinement could be attributed not only to the dimension of the analyzed cohort (from two to three times larger than in previous studies), but also to the application of the NJ analysis, which revealed a degree of heterogeneity moving from Cl2 to Cl3 samples with disjointed branches.
In general, HPV-related HNSCCs are known to have better outcomes when compared with HPV-negative HNSCCs [25]. The observed overall survival of our cohort of patients is aligned with the reported prognostic data. However, our analysis displayed a specific prognosis for each cluster, identifying those HPV-positive cases with the best, intermediate, and poorest prognoses. Interestingly, the subtype stratification did not provide evidence of a significant association with smoking habit, but highlighted some specific biological traits for each cluster that could help in interpreting their different outcomes.
Cluster 1 patients exhibited the best outcome at five years and it showed similar behavior to those patients identified as having low-risk HPV-related HNSCC [25]. Additionally, Cl1 was clearly
Figure 7. Prognostic evaluation of the three-subtype stratification. (a) Survival analysis on themeta-analysis dataset (MetaHPVpos). The 197 cases, entered into the three subtypes (75/134 Cl1patients; 56/108 Cl2 patients; 66/104 Cl3 patients), were used for the Kaplan–Meier analysis, yieldinga log-rank score of p-value = 4.76 × 10⁻⁹. The endpoint was overall survival. (b) Gene-signature.Two models were evaluated: (i) radiosensitivity index (RSI), (ii) the 172-gene prognostic model. RSI isdirectly proportional to radioresistance (high index = radioresistance), while the 172-gene model isdirectly proportional to the risk of recurrence. Stratification by both signatures reached p-value = 8.76× 10⁻¹³ and p-value = 7.98 × 10⁻²² for the RSI and 172-gene model, respectively. (c) Validation onGSE112026. The 47 cases belonging to GSE112026 were stratified based on our three subtypes: 18, 18,and 11 cases were predicted as belonging to Cl1, Cl2, and Cl3, respectively. The cases, entered intothe three identified subtypes, were used for the Kaplan–Meier analysis, yielding a p-value = 0.0152(log-rank test).
Furthermore, we applied two different gene expression published signatures to the 197HPV-positive HNSCC patients with available follow-up information: (i) the 172-gene model,a prognostic model for HNSCC [21]; (ii) the radiosensitivity index (RSI) [22], a gene signaturedeveloped as a pan-marker of cellular radiosensitivity. In order to assess whether and to what extentthe signatures were associated with HPV-related subtypes, we applied the algorithms developed [21,22]to our cohort. The resulting scores were compared to the three-subtype stratification. A significantrelationship was found between our stratification and these molecular signatures (Figure 7b). In detail,the Cl1 subtype showed the lowest 172-gene signature related score, meaning that Cl1 has the minimumpredicted risk, as confirmed by OS. Furthermore, Cl1 displayed the lowest RSI value, which predictedits radiosensitivity. On the contrary, Cl2 subtype exhibited the highest score in the 172-gene signature,and the maximum RSI score, compared with the other two subtypes, predicting its high risk andintrinsic radioresistance, respectively. The Cl3 subtype showed an “intermediate” behavior, with allthree analyses (OS, 172-gene signature score, and RSI).
Cancers 2019, 11, 1057 14 of 24
The clinical relevance of our classification was additionally investigated and associated withthe outcome in an external validation dataset. For our analysis, we retrieved the RNA-sequencing(RNA-seq) data of Ando et al. [23], which included 47 HPV-positive oropharyngeal squamous cellcarcinomas. With this external validation, we confirmed that the three-subtype stratification providesuseful prognostic information. As a matter of fact, better outcomes were associated with patientsbelonging to Cl1/Cl3 subtypes, and worse outcomes were associated with patients belonging to Cl2subtype (Figure 7c) (log-rank p-value = 0.0152). Finally, we investigated the association betweenclinal features and our molecular stratification. Table S3 (Supplementary Materials) reports the datarelated to gender, age, smoking habit, site, and TNM v7 stage. We found a significant association withsite having Cl2 a higher percentage of cases other than oropharynx. In addition, due to its potentialprognostic role, smoking habit was associated with the three subtypes. There was a trend in the differentdistribution of the smoking habit with higher percentage of smokers in Cl2. Table S4 (SupplementaryMaterials) reports the association for Ando’s dataset including gender, age, smoking, Ang et al. (2010)classification system, smoked packs per year, alcohol use, t-stage, and n-stage. We found a significantassociation with t-stage, having Cl2 cases a higher percentage of T3–4.
3. Discussion
Among HNSCCs, the HPV-positive tumors are an independent entity with specific clinical andmolecular characteristics. Moreover, inside the HPV-positive subgroup, it is additionally possibleto observe an intrinsic heterogeneity, in terms of patients’ outcomes. This assumption questionswhether treatment de-intensification could be applied to all HPV-positive HNSCCs. Clinical factors,such as large tumor burden and smoking history, correlate with a worse prognosis, but the biologicalmechanisms elucidating the complexity of the HPV-positive subgroup are still not fully understood.In the present meta-analysis of transcriptomic data, we applied a rigorous and up-to-date bioinformaticsanalysis to 346 HPV-positive HNSCCs with published sample data. To the best of our knowledge,this is the largest cohort of HPV-positive HNSCCs analyzed up until now. Specifically, our studyidentified three tumor subtypes, and it further dissected a population, which was previously dividedinto only two subgroups by published studies [12,13,24]. In agreement with these findings, we clearlyidentified an immune-associated cluster (named Cl1 in our analysis). In addition, we stratified theremaining patients (previously described as one “keratinocyte subtype” cluster [13,24]) into two welldistinct subtypes with clearly defined biological and prognostic characteristics. The stratificationrefinement could be attributed not only to the dimension of the analyzed cohort (from two to threetimes larger than in previous studies), but also to the application of the NJ analysis, which revealed adegree of heterogeneity moving from Cl2 to Cl3 samples with disjointed branches.
In general, HPV-related HNSCCs are known to have better outcomes when compared withHPV-negative HNSCCs [25]. The observed overall survival of our cohort of patients is aligned withthe reported prognostic data. However, our analysis displayed a specific prognosis for each cluster,identifying those HPV-positive cases with the best, intermediate, and poorest prognoses. Interestingly,the subtype stratification did not provide evidence of a significant association with smoking habit,but highlighted some specific biological traits for each cluster that could help in interpreting theirdifferent outcomes.
Cluster 1 patients exhibited the best outcome at five years and it showed similar behavior to thosepatients identified as having low-risk HPV-related HNSCC [25]. Additionally, Cl1 was clearly separatedfrom the other two clusters by its high immune score in the xCell analysis, and by upregulation ofthe hallmarks “IFN, interferon gamma signaling” and “IL6 JAK STAT3 signaling”. The high immunescore, associated with a good outcome, could be in agreement with the hypothesis that, in thesepatients, the immune system plays an important role in the clearance of viral proteins expressedin HPV-positive cancers [26]. Indeed, tumors enriched by the IFN-gamma signature may benefitfrom immunotherapy [27]. On the contrary, the IL6/JAK/STAT3 pathway hyper-activation is moredifficult to interpret in the context of a better prognosis. In fact, IL6/JAK/STAT3 signaling is expected

Cancers 2019, 11, 1057 15 of 24
to drive proliferation, survival, and invasiveness of tumor cells, and to suppress the anti-tumorimmune response. Overall, we could assume that, in Cl1, the immune infiltrate, as determined by theImmuneScore, and the high “IFN, interferon gamma signaling” could counterbalance the pro-tumoralaction of IL6 JAK STAT3 signaling; however, specific functional assays are necessary to confirmthis assumption. Considering the better prognosis and the biological profile, we could hypothesizethat Cl1 patients would be the best candidate for de-escalating treatment strategies, even includingcheckpoint inhibitors.
Cluster 2 exhibited the worst outcomes, and it strongly differed from the other two subtypes byits high stromal score. Essentially, this score reflects fibroblast infiltration, and it frequently leads toderegulation of EMT-inducing factors, EMT upregulation, and hallmark “hypoxia” overexpression.The EMT changes in tumor cells were reported to be linked to the acquisition of aggressive behaviorsincluding (i) increased invasive properties, (ii) resistance to DNA damage, (iii) chemotherapy-inducedapoptosis, (iv) immunosuppression, and (v) acquisition of stem-like features [28]. In addition,the increase in the hallmark “hypoxia” is in agreement with the radioresistance detected byRSI [29]. We hypothesize that treatment intensification could be beneficial for these patients. As anexample, an accelerated fractionation schedule of radiotherapy should be considered as a strategy toovercome radioresistance.
Cluster 3, characterized by an intermediate outcome compared with the other two clusters, wasclearly defined by upregulation of the hallmarks “E2F targets” and “G2M checkpoint”, both associatedwith increased proliferation. A possible explanation for these data may be the interpretation of boostedproliferation as a result of the integration of the viral genome in the host cell. Moreover, upregulationof the hallmarks “E2F targets” and “G2M checkpoints” is in agreement with the observation that theHPV genome does not encode enzymes necessary for viral replication [26]. Instead, the virus utilizeshost cell proteins to replicate its DNA. Therefore, basal cells containing HPV genomes remain active inthe pathway related to the cell cycle, also due to Rb degradation. The E2F transcription factor, withoutRb function, is free to drive the expression of S-phase genes [26,30]. A first explorative investigation,between the viral integration and our three clusters using data provided by Koneva et al. [20], revealeda significant association between the integration of HPV in the host genome and each of our subtypesin the following order: Cl1 < Cl3 < Cl2 (Figure S2, Supplementary Materials). Despite the analysisbeing performed on a limited number of samples, Cl2 seemed to be in accordance with cases alreadydescribed in literature, in which HPV was integrated and viral integration was associated with a poorprognosis [31]. Nevertheless, in this regard, Cl3 shows an intermediate behavior, which may possiblybe explained through Nulton discovery [32]. Indeed, HPV infection is described not only as its usualintegrated and episomal state but, additionally, as a third state where the viral genome exists as bothepisomal and integrated states. Anyway, the proposed associations require further evaluation, for notonly exploring the HPV state, in terms of integration, episomal, and intermediate states, but also toexamine possible target amplification.
Some limitations of this study and some differences with more recent data should be mentioned.Based on the clinical characteristics of the analyzed patients, we observed a relatively high number ofmissing clinical data (near to 30% in age and stage). The possible explanation for the unavailabilityof these data could reside in the nature of the studies included in our meta-analysis, which had thebiological description of the HPV tumors as a primary endpoint and, accordingly, an inconsistentcollection of clinical data was performed.
It is noteworthy that HPV-related tumors in subsites, other than the oropharynx, reached ahigher percentage than expected (10%). We hypothesize that this difference could be attributed to thesample collection in the years before the clear prognostic role of HPV infection in oropharynx cancers.In fact, the new TNM staging system (American Joint Committee on Cancer, 8th edition) distinguishes,for the first time, HPV-related from HPV-unrelated oropharynx cancers by stratifying according to p16expression. The prognostic value for other subsites (i.e., oral cavity, hypopharynx, larynx) other than

Cancers 2019, 11, 1057 16 of 24
the oropharynx is still debatable, although a recent review demonstrated a prognostic role for HPVinfection in all HNSCC subsites [33].
Considering the prognostic role of our stratification, three subtypes, with different outcomes,were described for the first time. An identified limitation could be the fact that treatment was notsystematically recorded, and the overall survival of our case series was poorer than the expectedoutcome [25]. Moreover, another limitation was identified: the association of subtypes and prognosesshould be underscored, although we should highlight that the follow-up was only available for 197out of 346 (57%) cases. A further bias is related to the differences in treatment techniques used in thelast 15 years (e.g., three-dimensional (3D) vs. intensity-modulated radiotherapy; trans-oral roboticsurgery, TORS, robotics vs. traditional open surgery).
In conclusion, ongoing trials on de-escalation treatment approaches in HPV-positive HNSCCare based only on HPV status and do not take the contributions of genomics and molecular profilesinto consideration [34]. It is conceivable that, upon rigorous validation, our stratification could helpdevelop a “precision treatment approach” based on the genomic profile of HPV-related HNSCC toselect patients.
4. Materials and Methods
4.1. Case Material: Gene Expression and Clinical Data
A survey of gene-expression data on HNSCC (available at 31 August 2018) was accomplished.The cases entered into our study were selected based on the following eligibility criteria: (i) primarylesions of squamous cell carcinoma; (ii) reported HPV status, according to the clinical practicein the reference center; (iii) MIAME (Minimum Information about a Microarray Experiment) [35]complaint data with the availability of raw data deposited on publicly accessible repositories andfull gene annotation (Gene Bank accession or EntrezID). After literature revision, there were 11datasets [12,36–45]. See Table S1 (Supplementary Materials) for details regarding the datasets includingthe accession numbers and methods of HPV detection. Raw microarray data were retrieved from theNCBI (National Center for Biotechnology Information) Gene Expression Omnibus (GEO) database [46],ArrayExpress (the EMBL European Bioinformatics Institute, UK) [47], MIAME-Vice [48], and TCGArepositories [49] and were integrated into a unique dataset through a meta-analysis approach, aspreviously described [50].
In addition, we collected available clinical data related to this case material, comprising age atdiagnosis, gender, smoking habits, tumor subsite, stage, and overall survival.
For validation purposes, we retrieved the data from Ando et al. [23], which are publicly available onthe GEO repository (identifier (ID): GSE112026). A cohort of 47 primary tumor tissues with HPV-relatedoropharyngeal squamous cell carcinoma was collected for RNA-seq analysis and microdissected toyield at least 80% tumor purity. HPV tumor status was confirmed by in situ hybridization forhigh-risk HPV subtypes or p16 immunohistochemistry. According to the TCGA RSEM (RNA-Seqby Expectation Maximization) pipeline, RNA-seq data were processed using RSEM version 1.2.9and upper quartile normalization. For class prediction purposes, analyses were performed throughR-based BRB-ArrayTools software (version 3.5.0) developed by Richard Simon and the BRB-ArrayToolsdevelopment team [51]. A class prediction method based on a supervised learning method was appliedfor classifying GSE112026 cases. Prediction was based on the support vector machine (SVM) methodby incorporating genes at the univariate significance level (α = 0.001) in a binary tree classificationframework, which was chosen due to its ability to classify more than two classes. SVM is specificallydesigned to address binary classification; however, it can be adapted to handle multi-class classificationby building a sequence of binary classifiers. The prediction error of the binary tree classifier wasestimated by the leave-one-out cross-validation method.

Cancers 2019, 11, 1057 17 of 24
4.2. Data Preprocessing for Meta-Analysis Dataset Generation
The selected studies were analyzed with four platforms, including three microarray platforms(Affymetrix, Agilent, and Nimblegene) and one RNA-seq (Illumina). For Affymetrix data, signalintensities were normalized within each individual dataset using a robust multi-array average (RMA)tool. For Agilent data, the normexp background correction and loess normalization were used fortwo-channel arrays, while quantile normalization procedures were applied to the probe-level data.For Illumina microarray data, quantile normalization was applied. For RNA-seq data, TCGA level 3files were downloaded along with the clinical annotations and used for the analysis. The redundancyof probes mapping the same EntrezID was removed by selecting the probe with the highest varianceamong multiple probe-sets by identifying the same gene; collapse was performed using WGCNApackage 1.63 (function: collapseRows) and the “maxRowVariance” method [52]. To reduce the likelihoodof systemic non-biological technical experimental biases among data from different platforms, afterlog2 transformation, the ComBat algorithm was applied [53]. Then, the expression value of each genewas averaged over all samples of our data matrix, converting the expression data into the changein log-expression (∆ei,m) of gene i in sample m; ∆ei,m = 0 implies an expression level according to itsmean value, while a relative positive or negative value refers to over- or under-expression, respectively,according to the mean gene expression.
4.3. Tumor Clusters: First-Level SOM
The ∆ei,m data matrix was used to train a SOM, an unsupervised machine learning method basedon the artificial neural network, enabling the dimensionality reduction of complex data structures ofsize N ×M (N: number of genes; M: number of samples) to K ×M (K: number of meta-genes), whereK << N, promoting the discovery of qualitative relationships among samples [54]. Each meta-generepresents a cluster of genes sharing similar expression profiles and was selected by an interactivemachine learning process by SOM; the process was trained until the meta-genes captured the entirerange of expression patterns present in the data matrix. SOM algorithm data analysis and landscapevisualization were performed using the “oposSOM” R package (version 1.18.0) [55], which uses the“som” R package [56]. A statistical significance criterion based on expression variance was appliedto discard the non-informative features in our data matrix through the BRB-ArrayTools developedby Dr. Richard Simon and the BRB-ArrayTools Development Team [57]. The procedure assigns eachinput gene measured in M samples into a meta-gene of the same length, and each gene is included in ameta-gene, ∆ei,m
meta, of closest similarity established by the Euclidian distance. The meta-genes areorganized in a two-dimensional grid of K = x × y tiles with the most similar expression profiles ofmeta-genes adjacent each to another, while the dissimilar ones are more distant. In the present study, weadopted a tile size with an average of nk ≈ 10 genes per meta-gene, corresponding to a two-dimensionalgrid of size K = 18 × 18 meta-genes with square topology and the Gaussian neighborhood function [14].The meta-genes were normalized to fit into the range −1 ≤ ei,m
meta≤ 1 and coded by a color scale from
blue (low expression) to red (high expression).
4.4. Tumor Clusters: Unsupervised Clustering Analysis
The R-package “ConsensusClusterPlus” [58] was applied to portion the samples into molecularcoherent subtypes. The meta-data ∆ei,m
meta were used as input for unsupervised class identificationusing partition around medoids (PAM) clustering with 1-Pearson correlation as the distance matrix.The PAM algorithm [59] is similar to the K-means algorithm, with both being partitional algorithmsthat split the dataset into clusters and try to minimize the error. However, while K-means workswith centroids, which are artificially created entities that are representative of each cluster, PAMchooses real data-points as cluster centers. An unsupervised clustering procedure was applied to thedata through 1000 re-sampling interactions by randomly selecting a fraction of the samples. Clusternumbers ranging from 2 to 10 were tested, and the empirical cumulative distribution function (CDF)

Cancers 2019, 11, 1057 18 of 24
and delta area plots displaying consensus distributions were assessed to identify the number of clustersgiving maximum stability with a negligible increase in the CDF area [60]. To estimate the accuracy ofthe classification, the silhouette correlation width values were calculated for all samples (R-package:“oposSOM”), providing a graphical representation of how well the samples lay within their assignedcluster. The silhouette values ranged from +1 to −1, indicating the degree of similarity of a sample tothe assigned cluster (cohesion) or to other clusters (separation). The evaluation of sample size adequacyof the identified clusters was assessed according to Warnes and Liu (R-package: “ssize”) [61] andcomputed by imposing the type I error rate (false discovery rate, FDR), α = 0.05, and a minimum effectsize (log fold-change) of ∆ = 1. Cluster-specific portraits represent the mean value of each meta-geneof the samples belonging to the cluster in detail. The portraits are depicted in a log (fold-change)scale where the fold-change is the expression difference compared with the mean expression in allsamples. To ascertain to what degree technical variability (i.e., study of origin and platform) affectsour subtype clustering analysis, we used the “alluvial diagram”, a variant of the parallel coordinatesplot that is helpful for exploring categorical data by grouping them into flows that can easily betraced in the diagram [62]. The plots were generated using the R-package “alluvial”. In addition,we used a linear mixed model to quantify the extent of technical variability in each sample throughthe “variancePartition” R package [63]. To visualize the contribution of each variable, violin plots weredepicted to show the trend and rank the distribution of variance explained by each variable across allgenes. The plots summarize the results in terms of the percentage of variance explained.
4.5. Cluster Similarity Relationships: Second-Level SOM Cartography
Second-level SOM analysis aims to address the issue of similarity relationships among groups ofsamples. It estimates the hierarchy of similarities and mutual distances based on the expression ofmeta-genes, and it provides improved visualization and representativeness of the results. To infer themain structures present in our data, we applied three approaches for computing the distance metrics.
Independent component analysis (ICA) [64] was applied to the SOM meta-genes using the“fastICA” R package [65], a method based on the covariance matrix assessed by Pearson’s correlation todecompose the input meta-genes into independent and non-Gaussian components in order to ensurethat each one is statistically as independent from the others as possible.
The correlation backbone through a two-nearest-neighbor graph is a correlation network approachwhere Pearson correlations are computed between all pairwise combinations of samples, and theirstructures are visualized in a graph.
The NJ algorithm (“ape” R package [66]) is a distance-based method offering phylogenetic treereconstruction where similarity trees are defined between samples into an Euclidian space, allowing“bush-like clusters” displaying mutual dissimilarity to be revealed [67].
To visualize the main meta-genes related to subtype stratification, we assessed the groupover-expression spots. We exploited SOM portraits by detection of the coherent expression ofmeta-genes. Using group overexpression maps, we linked selected meta-genes (correlation with r >
0.5) in different regions of the SOM with groups of samples. The group overexpression portrait wascalculated as the mean map profile by averaging the meta-gene expression over the three subtypes.To identify the over-expression tiles, a 98th percentile criterion was applied to the meta-gene expressionSOM training aggregate meta-genes with similar profiles in the adjacent neighbored tiles of the map.These tiles’ profiles grouped over-expressed (or under-expressed) samples that differed from theothers. The samples belonging to each subtype were summarized in an average representative portrait.The mining of biological functions from SOM portraits was performed using “oposSOM” R package(version 1.18.0).
4.6. Tumor Microenvironment Landscape
To evaluate the heterogeneity in the tumor microenvironment, the immune, stromal, and other cellcomponents were inferred by an in silico approach using the xCell tool [68,69]. This approach enables

Cancers 2019, 11, 1057 19 of 24
the assessment of 64 cell types using the bulk gene expression profiles of the tumors as input andcomparing them across samples, as described by the authors of Reference [69]. The tool outputs includethe transformed xCell scores for the immune, stromal, and other cell types. The adjusted ImmuneScoreincluded 10 populations (B-cells, CD4+ T-cells, CD8+ T-cells, DC, eosinophils, macrophages, monocytes,mast cells, neutrophils, and NK cells) and StromaScore 3 populations (adipocytes, endothelialcells, fibroblasts). In addition, to identify potential keratinocyte differentiation, the xCell score forkeratynocytes was computed. To visualize the cellular heterogeneity of the clusters, we applieda dimension reduction method by t-distributed stochastic neighbor embedding (t-SNE) using the“Rtsne” package [70], which projected the cell type enrichment scores onto two-dimensional axes [71].We presented the scores of each subtype in notched boxplots using the “ggplot2” R package. Notchboxplots display a confidence interval around the median based on the median±1.58× IQR (interquartilerange) /sqrt(n). They are useful graphs for comparing groups of samples, because an absence in notchoverlapping provides strong visual evidence that the medians differ. The p-values were calculated bythe Kruskal–Wallis test, a nonparametric test that compares the means among three or more groups, asin our subtype classification.
4.7. Functional Analyses
To disclose the biological functional properties associated with the proposed molecular subtypes,gene set analysis was applied. This approach estimates gene set over-representation (probabilityof finding genes in a list compared to their random appearance) and over-expression (difference inexpression compared to the mean expression over the samples). The gene sets were defined from apriori knowledge from independent studies and they were summarized in a list of genes specificallyrelated to molecular pattern/biological function. A large collection of gene sets was retrieved fromthe Gene Set Enrichment Analysis (GSEA Broad Institute; software.broadinstitute.org/gsea/) and theMolecular Signatures Database (MSigDB) repository, including 50 hallmark gene sets. We used thegene set Z-score (GSZ) to summarize the profile of a gene set across all samples [72]. GSZ is a Z-scorefunction that merges both over-representation and over-expression features from a gene set to give adefined gene set and provides a representative score of the gene set for each sample. Boxplots weregenerated using the “ggplot2” R package with the notched boxplot function (see Section 4.6).
4.8. Analysis of Viral Presence/Integration and Its Association with Clusters
The association between viral integration and our subtype stratification was investigated usingthe results provided by Koneva et al. [20]. Based on TCGA RNA-seq data and exploiting VirusSeqsoftware [73], they detected known virus strains and identified the integration sites. Thus, the authorsdisclosed the HPV integration status of 65 TCGA cases present in our meta-analysis and assessedviral gene expression (E2, E4, and E5). We investigated the relative presence of integrated HPV casesdefined as integrated cases/(integrated + non-integrated cases) in each subtype, and significance wascalculated by the χ2 test. Counts per million (CPM) were retrieved from Koneva et al. and transformedinto the log scale by log2(CPM + 1) [74]. Associations with viral gene expression were visualized by aheatmap. The samples were ranked by the Gene Set Variation Analysis (GSVA [75]) based on the threeviral genes. GSVA was used to estimate the variation of a gene set over the samples in an unsupervisedmanner. The p-values were calculated by the Kruskal–Wallis test.
4.9. Evaluation of Prognostic Signatures
Statistical analysis was performed using R (version 3.5.1) [76] and Bioconductor (release 3.7) [77].Survival curves were assessed according to the Kaplan–Meier method, and overall survival wasused as the endpoint. Differences between the subtypes were assessed using the log-rank test and Rpackage “survival”. Two signatures were evaluated: (i) the 172-gene prognostic model [21]; (ii) theradiosensitivity index (RSI) [22]. The list of genes and the algorithm used for model assessment wereretrieved from the original papers.

Cancers 2019, 11, 1057 20 of 24
Supplementary Materials: Supplementary materials can be found at http://www.mdpi.com/2072-6694/11/8/1057/s1: Figure S1: Estimation of sample size adequacy. The relationship between the genes in our data matrix andpower to detect a sample size defined by our three-subtype stratification (Cl1 = 134; Cl2 = 104; Cl3 = 108) is shownin the plots. The percentage of genes achieving a power level of at least 0.9 is displayed by the red bars and wascalculated by performing a pairwise comparison between subtypes; Figure S2: Violin and boxplot of the percentvariation in gene expression explained by the study of origin, platform, and our three-cluster stratification. Medianpercentage variation explained: cluster = 50.4%; study <1%; platform <1%; Figure S3: Expression heatmap ofviral genes. The expression values for HPV E2, E4, and E5 in the TCGA cases were retrieved from Koneva et al.For visualization purposes, samples were ranked based on Gene Set Variation Analysis (GSVA) from low to highviral gene enrichment. The membership of each TCGA sample is depicted in the bar below the heatmap. Low E2,E4, and E5 expression was found in Cl2 cases compared with Cl1 and Cl3 (p-value = 0.00156, p-value = 0.00204,and p-value = 0.00147 determined by Kruskal–Wallis Tests, respectively); Table S1: List of used datasets. Datasetname, platform used, provider, technology, repository (included websource), number of samples, assignmentto the three clusters, and methods of HPV detection are detailed in the table for each of the 11 sources utilized;Table S2: Contingency table for TCGA HPV cases annotated for HPV integration status by Koneva et al; TableS3: Association to clinical parameters in the meta-analysis dataset. The table includes the evaluation of thefollowing clinical parameters: (i) gender; (ii) age; (iii) smoking habit (current or former smokers vs. never smoke);(iv) site (oropharynx vs. other sites); (v) stage. p-values by χ2 test, with the exception for age determined byKruskal–Wallis Tests; Table S4: Association to clinical parameters in the validation dataset (GSE112026). The tableincludes the evaluation of the following clinical parameters: (i) gender; (ii) age; (iii) smoking, (iv) Ang et al. (2010)classification system; (v) smoked packs per year; (vi) alcohol use; (vii) t-stage; (viii) n-stage. p-values by χ2 test,with the exception for age determined by Kruskal–Wallis Tests.
Author Contributions: Conceptualization, L.D.L. and L.D.C.; Data curation, L.D.C., E.O., S.C., P.B., S.C. and L.D.C.;Formal analysis, M.S.S., M.F.I. and A.C.; Funding acquisition, L.L. and L.D.C.; Investigation, C.R.; Methodology,M.S.S., A.C. and L.D.C.; Writing—original draft, L.D.C., M.S.S. and S.C.; Writing—review & editing, L.D.L., M.S.S.and L.D.C.
Funding: This work was supported by Associazione Italiana Ricerca Cancro (AIRC IG 18519 to L.D.C.) and by theEuropean Union’s Horizon 2020 research and innovation program under grant agreement No. 689715.
Conflicts of Interest: The authors declare no conflicts of interest. The funders had no role in the design of thestudy; in the collection, analyses, or interpretation of data; in the writing of the manuscript, and in the decision topublish the results.
References
1. Fitzmaurice, C.; Allen, C.; Barber, R.M.; Barregard, L.; Bhutta, Z.A.; Brenner, H.; Dicker, D.J.; Chimed-Orchir, O.;Dandona, R.; Dandona, L.; et al. Global, regional, and national cancer incidence, mortality, years of life lost,years lived with disability, and disability-adjusted life-years for 32 cancer groups, 1990 to 2015: A systematicanalysis for the global burden of disease study. JAMA Oncol. 2017, 3, 524–548. [PubMed]
2. Chaturvedi, A.K.; Engels, E.A.; Anderson, W.F.; Gillison, M.L. Incidence trends for humanpapillomavirus-related and -unrelated oral squamous cell carcinomas in the United States. J. Clin. Oncol.2008, 26, 612–619. [CrossRef] [PubMed]
3. Rettig, E.M.; D’Souza, G. Epidemiology of head and neck cancer. Surg. Oncol. Clin. N. Am. 2015, 24, 379–396.[CrossRef] [PubMed]
4. Gillison, M.L.; Castellsagué, X.; Chaturvedi, A.; Goodman, M.T.; Snijders, P.; Tommasino, M.; Arbyn, M.;Franceschi, S. Eurogin Roadmap: Comparative epidemiology of HPV infection and associated cancers of thehead and neck and cervix. Int. J. Cancer 2014, 134, 497–507. [CrossRef] [PubMed]
5. Marur, S.; Forastiere, A.A. Head and neck cancer: Changing epidemiology, diagnosis, and treatment. MayoClin. Proc. 2008, 83, 489–501. [CrossRef]
6. Fakhry, C.; Westra, W.H.; Li, S.; Cmelak, A.; Ridge, J.A.; Pinto, H.; Forastiere, A.; Gillison, M.L. Improvedsurvival of patients with human papillomavirus-positive head and neck squamous cell carcinoma in aprospective clinical trial. J. Natl. Cancer Inst. 2008, 100, 261–269. [CrossRef] [PubMed]
7. Martín-Hernán, F.; Sánchez-Hernández, J.G.; Cano, J.; Campo, J.; del Romero, J. Oral cancer, HPV infectionand evidence of sexual transmission. Med. Oral Patol. Oral Cir. Bucal 2013, 18, e439–e444. [CrossRef]
8. Lechner, M.; Fenton, T.; West, J.; Wilson, G.; Feber, A.; Henderson, S.; Thirlwell, C.; Dibra, H.K.; Jay, A.;Butcher, L.; et al. Identification and functional validation of HPV-mediated hypermethylation in head andneck squamous cell carcinoma. Genome Med. 2013, 5, 15. [CrossRef]
9. Sepiashvili, L.; Bruce, J.P.; Huang, S.H.; O’Sullivan, B.; Liu, F.F.; Kislinger, T. Novel insights into head andneck cancer using next-generation “omic” technologies. Cancer Res. 2015, 75, 480–486. [CrossRef]

Cancers 2019, 11, 1057 21 of 24
10. Leemans, C.R.; Snijders, P.J.F.; Brakenhoff, R.H. The molecular landscape of head and neck cancer. Nat. Rev.Cancer 2018, 18, 269–282. [CrossRef]
11. Mirghani, H.; Blanchard, P. Treatment de-escalation for HPV-driven oropharyngeal cancer: Where do westand? Clin. Transl. Radiat. Oncol. 2017, 8, 4–11. [CrossRef] [PubMed]
12. Keck, M.K.; Zuo, Z.; Khattri, A.; Stricker, T.P.; Brown, C.D.; Imanguli, M.; Rieke, D.; Endhardt, K.; Fang, P.;Brägelmann, J.; et al. Integrative analysis of head and neck cancer identifies two biologically distinct HPVand three non-HPV subtypes. Clin. Cancer Res. 2015, 21, 870–881. [CrossRef] [PubMed]
13. Zhang, Y.; Koneva, L.A.; Virani, S.; Arthur, A.E.; Virani, A.; Hall, P.B.; Warden, C.D.; Carey, T.E.; Chepeha, D.B.;Prince, M.E.; et al. Subtypes of HPV-Positive Head and Neck Cancers Are Associated with HPV Characteristics,Copy Number Alterations, PIK3CA Mutation, and Pathway Signatures. Clin. Cancer Res. 2016, 22, 4735–4745.[CrossRef] [PubMed]
14. Wirth, H.; Loffler, M.; von Bergen, M.; Binder, H. Expression cartography of human tissues using selforganizing maps. BMC Bioinform. 2011, 12, 306. [CrossRef] [PubMed]
15. Tamayo, P.; Slonim, D.; Mesirov, J.; Zhu, Q.; Kitareewan, S.; Dmitrovsky, E.; Lander, E.S.; Golub, T.R.Interpreting patterns of gene expression with self-organizing maps: Methods and application to hematopoieticdifferentiation. Proc. Natl. Acad. Sci. USA 1999, 96, 2907–2912. [CrossRef] [PubMed]
16. Törönen, P.; Kolehmainen, M.; Wong, G.; Castrén, E. Analysis of gene expression data using self-organizingmaps. FEBS Lett. 1999, 451, 142–146. [CrossRef]
17. Loeffler-Wirth, H.; Kreuz, M.; Hopp, L.; Arakelyan, A.; Haake, A.; Cogliatti, S.B.; Feller, A.C.; Hansmann, M.L.;Lenze, D.; Möller, P.; et al. A modular transcriptome map of mature B cell lymphomas. Genome Med. 2019,11, 27. [CrossRef]
18. Kunz, M.; Löffler-Wirth, H.; Dannemann, M.; Willscher, E.; Doose, G.; Kelso, J.; Kottek, T.; Nickel, B.; Hopp, L.;Landsberg, J.; et al. RNA-seq analysis identifies different transcriptomic types and developmental trajectoriesof primary melanomas. Oncogene 2018, 37, 6136–6151. [CrossRef]
19. Venuti, A.; Paolini, F. HPV detection methods in head and neck cancer. Head Neck Pathol. 2012, 6 (Suppl. 1),S63–S74. [CrossRef]
20. Koneva, L.A.; Zhang, Y.; Virani, S.; Hall, P.B.; McHugh, J.B.; Chepeha, D.B.; Wolf, G.; Carey, T.E.; Rozek, L.S.;Sartor, M.A. HPV Integration in HNSCC Correlates with Survival Outcomes, Immune Response Signatures,and Candidate Drivers. Mol. Cancer Res. 2017. [CrossRef]
21. De Cecco, L.; Bossi, P.; Locati, L.; Canevari, S.; Licitra, L. Comprehensive gene expression meta-analysis ofhead and neck squamous cell carcinoma microarray data defines a robust survival predictor. Ann. Oncol.2014, 25, 1628–1635. [CrossRef] [PubMed]
22. Eschrich, S.A.; Pramana, J.; Zhang, H.; Zhao, H.; Boulware, D.; Lee, J.H.; Bloom, G.; Rocha-Lima, C.; Kelley, S.;Calvin, D.P.; et al. A gene expression model of intrinsic tumor radiosensitivity: Prediction of response andprognosis after chemoradiation. Int. J. Radiat. Oncol. Biol. Phys. 2009, 75, 489–496. [CrossRef]
23. Ando, M.; Saito, Y.; Xu, G.; Bui, N.Q.; Medetgul-Ernar, K.; Pu, M.; Fisch, K.; Ren, S.; Sakai, A.; Fukusumi, T.; et al.Chromatin dysregulation and DNA methylation at transcription start sites associated with transcriptionalrepression in cancers. Nat. Commun. 2019, 10, 2188. [CrossRef]
24. Gleber-Netto, F.O.; Rao, X.; Guo, T.; Xi, Y.; Gao, M.; Shen, L.; Erikson, K.; Kalu, N.N.; Ren, S.; Xu, G.;et al. Variations in HPV function are associated with survival in squamous cell carcinoma. JCI Insight 2019.[CrossRef] [PubMed]
25. Ang, K.K.; Harris, J.; Wheeler, R.; Weber, R.; Rosenthal, D.I.; Nguyen-Tân, P.F.; Westra, W.H.; Chung, C.H.;Jordan, R.C.; Lu, C.; et al. Human papillomavirus and survival of patients with oropharyngeal cancer. N.Engl. J. Med. 2010, 363, 24–35. [CrossRef] [PubMed]
26. Blitzer, G.C.; Smith, M.A.; Harris, S.L.; Kimple, R.J. Review of the clinical and biologic aspects of humanpapillomavirus-positive squamous cell carcinomas of the head and neck. Int. J. Radiat. Oncol. Biol. Phys.2014, 88, 761–770. [CrossRef]
27. Chen, Y.P.; Wang, Y.Q.; Lv, J.W.; Li, Y.Q.; Chua, M.L.K.; Le, Q.T.; Lee, N.; Colevas, A.D.; Seiwert, T.;Hayes, D.N.; et al. Identification and validation of novel microenvironment-based immune molecularsubgroups of head and neck squamous cell carcinoma: Implications for immunotherapy. Ann. Oncol. 2019.[CrossRef]
28. Suarez-Carmona, M.; Lesage, J.; Cataldo, D.; Gilles, C. EMT and inflammation: Inseparable actors of cancerprogression. Mol. Oncol. 2017, 11, 805–823. [CrossRef]

Cancers 2019, 11, 1057 22 of 24
29. Nordsmark, M.; Bentzen, S.M.; Rudat, V.; Brizel, D.; Lartigau, E.; Stadler, P.; Becker, A.; Adam, M.; Molls, M.;Dunst, J.; et al. Prognostic value of tumor oxygenation in 397 head and neck tumors after primary radiationtherapy. An international multi-center study. Radiother. Oncol. 2005, 77, 18–24. [CrossRef]
30. Speel, E.J. HPV Integration in Head and Neck Squamous Cell Carcinomas: Cause and Consequence. RecentResults Cancer Res. 2017, 206, 57–72.
31. Nulton, T.J.; Nak-Kyeong, K.; DiNardo, L.J.; Morgan, I.M.; Windle, B. Patients with integrated HPV16 inhead and neck cancer show poor survival. Oral Oncol. 2018, 80, 52–55. [CrossRef] [PubMed]
32. Nulton, T.J.; Olex, A.L.; Dozmorov, M.; Morgan, I.M.; Windle, B. Analysis of The Cancer Genome Atlassequencing data reveals novel properties of the human papillomavirus 16 genome in head and neck squamouscell carcinoma. Oncotarget 2017, 17684–17699. [CrossRef]
33. Li, H.; Torabi, S.J.; Yarbrough, W.G.; Mehra, S.; Osborn, H.A.; Judson, B. Association of Human PapillomavirusStatus at Head and Neck Carcinoma Subsites With Overall Survival. JAMA Otolaryngol. Head Neck Surg.2018, 144, 519–525. [CrossRef] [PubMed]
34. Orlandi, E.; Alfieri, S.; Simon, C.; Trama, A.; Licitra, L.; RARECAREnet Working Group. Treatment challengesin and outside a network setting: Head and neck cancers. Eur. J. Surg. Oncol. 2019, 45, 40–45. [CrossRef][PubMed]
35. Brazma, A.; Hingamp, P.; Quackenbush, J.; Sherlock, G.; Spellman, P.; Stoeckert, C.; Aach, J.; Ansorge, W.;Ball, C.A.; Causton, H.C.; et al. Minimum information about a microarray experiment (MIAME)-towardstandards for microarray data. Nat. Genet. 2001, 29, 365–371. [CrossRef]
36. Slebos, R.J.; Yi, Y.; Ely, K.; Carter, J.; Evjen, A.; Zhang, X.; Shyr, Y.; Murphy, B.M.; Cmelak, A.J.; Burkey, B.B.;et al. Gene expression differences associated with human papillomavirus status in head and neck squamouscell carcinoma. Clin. Cancer Res. 2006, 12 Pt 1, 701–709. [CrossRef]
37. Pyeon, D.; Newton, M.A.; Lambert, P.F.; den Boon, J.A.; Sengupta, S.; Marsit, C.J.; Woodworth, C.D.;Connor, J.P.; Haugen, T.H.; Smith, E.M.; et al. Fundamental differences in cell cycle deregulation in humanpapillomavirus-positive and human papillomavirus-negative head/neck and cervical cancers. Cancer Res.2007, 67, 4605–4619. [CrossRef]
38. Walter, V.; Yin, X.; Wilkerson, M.D.; Cabanski, C.R.; Zhao, N.; Du, Y.; Ang, M.K.; Hayward, M.C.; Salazar, A.H.;Hoadley, K.A.; et al. Molecular subtypes in head and neck cancer exhibit distinct patterns of chromosomalgain and loss of canonical cancer genes. PLoS ONE 2013, 8, e56823. [CrossRef]
39. Sun, W.; Gaykalova, D.A.; Ochs, M.F.; Mambo, E.; Arnaoutakis, D.; Liu, Y.; Loyo, M.; Agrawal, N.; Howard, J.;Li, R.; et al. Activation of the NOTCH pathway in head and neck cancer. Cancer Res. 2014, 74, 1091–1104.[CrossRef]
40. Thibodeau, B.J.; Geddes, T.J.; Fortier, L.E.; Ahmed, S.; Pruetz, B.L.; Wobb, J.; Chen, P.; Wilson, G.D.;Akervall, J.A. Gene Expression Characterization of HPV Positive Head and Neck Cancer to Predict Responseto Chemoradiation. Head Neck Pathol. 2015, 9, 345–353. [CrossRef]
41. Tomar, S.; Graves, C.A.; Altomare, D.; Kowli, S.; Kassler, S.; Sutkowski, N.; Gillespie, M.B.; Creek, K.E.;Pirisi, L. Human papillomavirus status and gene expression profiles of oropharyngeal and oral cancers fromEuropean American and African American patients. Head Neck 2016, 38 (Suppl. 1), E694–E704. [CrossRef]
42. Wichmann, G.; Rosolowski, M.; Krohn, K.; Kreuz, M.; Boehm, A.; Reiche, A.; Scharrer, U.; Halama, D.;Bertolini, J.; Bauer, U.; et al. The role of HPV RNA transcription, immune response-related gene expressionand disruptive TP53 mutations in diagnostic and prognostic profiling of head and neck cancer. Int. J. Cancer2015, 137, 2846–2857. [CrossRef]
43. Mirghani, H.; Ugolin, N.; Ory, C.; Lefèvre, M.; Baulande, S.; Hofman, P.; St Guily, J.L.; Chevillard, S.; Lacave, R.A predictive transcriptomic signature of oropharyngeal cancer according to HPV16 status exclusively.Oral Oncol. 2014, 50, 1025–1034. [CrossRef]
44. Thurlow, J.K.; Peña Murillo, C.L.; Hunter, K.D.; Buffa, F.M.; Patiar, S.; Betts, G.; West, C.M.; Harris, A.L.;Parkinson, E.K.; Harrison, P.R.; et al. Spectral clustering of microarray data elucidates the roles ofmicroenvironment remodeling and immune responses in survival of head and neck squamous cell carcinoma.J. Clin. Oncol. 2010, 28, 2881–2888. [CrossRef]
45. Cancer Genome Atlas Network. Comprehensive genomic characterization of head and neck squamous cellcarcinomas. Nature 2015, 517, 576–582. [CrossRef]
46. Edgar, R.; Domrachev, M.; Lash, A.E. Gene Expression Omnibus: NCBI gene expression and hybridizationarray data repository. Nucleic Acids Res. 2002, 30, 207–210. [CrossRef]

Cancers 2019, 11, 1057 23 of 24
47. Kolesnikov, N.; Hastings, E.; Keays, M.; Melnichuk, O.; Tang, Y.A.; Williams, E.; Dylag, M.; Kurbatova, N.;Brandizi, M.; Burdett, T.; et al. ArrayExpress update—Simplifying data submissions. Nucleic Acids Res. 2015,43, D1113–D1116. [CrossRef]
48. BIOINFORMATICS @ MANCHESTER. Available online: http://bioinformatics.picr.man.ac.uk/vice/Welcome.vice (accessed on 31 March 2016).
49. National Cancer Institute GDC Data Portal. Available online: https://portal.gdc.cancer.gov/repository(accessed on 30 April 2018).
50. De Cecco, L.; Nicolau, M.; Giannoccaro, M.; Daidone, M.G.; Bossi, P.; Locati, L.; Licitra, L.; Canevari, S. Headand neck cancer subtypes with biological and clinical relevance: Meta-analysis of gene-expression data.Oncotarget 2015, 6, 9627–9642. [CrossRef]
51. Simon, R.; Lam, A.; Li, M.C.; Ngan, M.; Menenzes, S.; Zhao, Y. Analysis of gene expression data usingBRB-ArrayTools. Cancer Inform. 2007, 3, 11–17. [CrossRef]
52. Langfelder, P.; Horvath, S. WGCNA: An R package for weighted correlation network analysis. BMC Bioinform.2008, 9, 559. [CrossRef]
53. Johnson, W.E.; Li, C.; Rabinovic, A. Adjusting batch effects in microarray expression data using empiricalBayes methods. Biostatistics 2007, 8, 118–127. [CrossRef]
54. Kohonen, T. Self-organized formation of topologically correct feature maps. Biol. Cybern. 1982, 43, 59–69.[CrossRef]
55. Löffler-Wirth, H.; Kalcher, M.; Binder, H. oposSOM: R-package for high-dimensional portraying ofgenome-wide expression landscapes on bioconductor. Bioinformatics 2015, 31, 3225–3227. [CrossRef]
56. Yan, J. Som: Self-Organizing Map. 2010 R Package. Available online: Cran.r-project.org/web/packages/som(accessed on 30 November 2018).
57. National Cancer Institute. Available online: https://brb.nci.nih.gov/BRB-ArrayTools/index.html (accessed on30 November 2018).
58. Wilkerson, M.D.; Hayes, D.N. ConsensusClusterPlus: A class discovery tool with confidence assessmentsand item tracking. Bioinformatics 2010, 26, 1572–1573. [CrossRef]
59. Kaufman, L.; Rousseeuw, P. Clustering by Means of Medoids. In Proceedings of the Statistical Data AnalysisBased on the L1 Norm and Related Methods, Neuchâtel, Switzerland, 31 August–4 September 1987; Dodge, Y.,Ed.; Elsevier Science Pub. Co.: Amsterdam, The Netherlands, 1987; pp. 405–416.
60. Monti, S.; Tamayo, P.; Mesirov, J.; Todd, G. Consensus Clustering: A Resampling-Based Method for ClassDiscovery and Visualization of Gene Expression Microarray Data. Mach. Learn. 2003, 52, 91–118. [CrossRef]
61. Warnes, G.; Liu, P.; Li, F. Ssize: Estimate Microarray Sample Size. R Package Version 1.54.0. Available online:http://bioconductor.org/packages/release/bioc/html/ssize.html (accessed on 31 May 2017).
62. Rosvall, M.; Bergstrom, C.T. Mapping Change in Large Networks. PLoS ONE 2010, 5, e8694. [CrossRef]63. Hoffman, G.E.; Schadt, E.E. variancePartition: Interpreting drivers of variation in complex gene expression
studies. BMC Bioinform. 2016, 17. [CrossRef]64. Hyvärinen, A.; Oja, E. Independent component analysis: Algorithms and applications. Neural Netw. 2000,
13, 411–430. [CrossRef]65. FastICA. Available online: https://CRAN.R-project.org/package=fastICA (accessed on 30 November 2018).66. Paradis, E.; Claude, J.; Strimmer, K. APE: Analyses of Phylogenetics and Evolution in R language.
Bioinformatics 2004, 20, 289–290. [CrossRef]67. Saitou, N.; Nei, M. The neighbor-joining method: A new method for reconstructing phylogenetic trees. Mol.
Biol. Evol. 1987, 4, 406–425.68. xCell. Available online: http://xcell.ucsf.edu/ (accessed on 28 February 2019).69. Aran, D.; Hu, Z.; Butte, A.J. xCell: Digitally portraying the tissue cellular heterogeneity landscape. Genome Biol.
2017, 18, 220. [CrossRef]70. Krijthe, J.H. Rtsne: T-Distributed Stochastic Neighbor Embedding Using a Barnes-Hut Implementation.
Available online: https://github.com/jkrijthe/Rtsne (accessed on 28 February 2019).71. van der Maaten, L.; Hinton, G. Visualizing data using t-SNE. J. Mach. Learn. Res. 2008, 9, 2579–2605.72. Törönen, P.; Ojala, P.J.; Marttinen, P.; Holm, L. Robust extraction of functional signals from gene set analysis
using a generalized threshold free scoring function. BMC Bioinform. 2009, 10, 307. [CrossRef]

Cancers 2019, 11, 1057 24 of 24
73. Chen, Y.; Yao, H.; Thompson, E.J.; Tannir, N.M.; Weinstein, J.N.; Su, X. VirusSeq: Software to identify virusesand their integration sites using next-generation sequencing of human cancer tissue. Bioinformatics 2013, 29,266–267. [CrossRef]
74. Law, C.W.; Chen, Y.; Shi, W.; Smyth, G.K. voom: Precision weights unlock linear model analysis tools forRNA-seq read counts. Genome Biol. 2014, 15, R29. [CrossRef]
75. Hänzelmann, S.; Castelo, R.; Guinney, J. GSVA: Gene set variation analysis for microarray and RNA-Seqdata. BMC Bioinform. 2013, 14, 7. [CrossRef]
76. R Development Core Team. R: A Language and Environment for Statistical Computing. Vienna, Austria:R Foundation for Statistical Computing 2007. Available online: http://www.R-project.org (accessed on 30September 2018).
77. Gentleman, R.C.; Carey, V.J.; Bates, D.M.; Bolstad, B.; Dettling, M.; Dudoit, S.; Ellis, B.; Gautier, L.; Ge, Y.;Gentry, J.; et al. Bioconductor: Open software development for computational biology and bioinformatics.Genome Biol. 2004, 5, R80. [CrossRef]
© 2019 by the authors. Licensee MDPI, Basel, Switzerland. This article is an open accessarticle distributed under the terms and conditions of the Creative Commons Attribution(CC BY) license (http://creativecommons.org/licenses/by/4.0/).