Mining and Metallurgy Engineering Bor · 1/2/2017 · SELECTION LEVEL FOR MINING AT THE OPEN PIT...
154
Mining and Metallurgy Engineering Bor UDC 622 ISSN 2334-8836 (Štampano izdanje) ISSN 2406-1395 (Online) Published by: Mining and Metallurgy Institute Bor 1-2/2017
Transcript of Mining and Metallurgy Engineering Bor · 1/2/2017 · SELECTION LEVEL FOR MINING AT THE OPEN PIT...

Mining and MetallurgyEngineering Bor
UDC 622 ISSN 2334-8836 (Štampano izdanje)
ISSN 2406-1395 (Online)
Published by: Mining and Metallurgy Institute Bor
1-2/2017

MINING AND METALLURGY INSTITUTE BOR
MINING AND METALLURGY ENGINEERING
BOR is a journal based on the rich tradition of
expert and scientific work from the field of mining, underground and open-pit mining, mineral proce-
ssing, geology, mineralogy, petrology, geomecha-
nics, metallurgy, materials, technology, as well as related fields of science. Since 2001, published
twice a year, and since 2011 four times a year.
Editor-in-chief
Academic Ph.D. Milenko Ljubojev, Principal
Reasearch Fellow Mining and Metallurgy
Institute Bor Full member of ESC
E-mail: [email protected]
Phone: +38130/454-109, 435-164
Editor
Vesna Marjanović, B.Eng.
English Translation
Nevenka Vukašinović, prof.
Technical Editor
Suzana Cvetković
Preprinting
Vesna Simić
Printed in: Grafomedtrade Bor
Circulation: 200 copies
Web site
www.irmbor.co.rs
Journal is financially supported by
The Ministry of Education, Science and Technological Development of the Republic Serbia
Mining and Metallurgy Institute Bor
ISSN 2334-8836 (Printed edition)
ISSN 2406-1395 (Online)
Journal indexing in SCIndex and ISI.
All rights reserved.
Published by
Mining and Metallurgy Institute Bor
19210 Bor, Zeleni bulevar 35 E-mail: [email protected]
Phone: +38130/454-110
Scientific – Technical Cooperation with
the Engineering Academy of Serbia
Editorial Board
Prof.Ph.D. Tajduš Antoni
The Stanislaw University of Mining and
Metallurgy, Krakow, Poland
Prof.Ph.D. Mevludin Avdić
MGCF-University of Tuzla, B&H
Prof.Ph.D. Vladimir Bodarenko
National Mining University, Department of
Deposit Mining, Ukraine
Ph.D. Mile Bugarin, Principal Research Fellow
Mining and Metallurgy Institute Bor
Prof.Ph.D. Ruža Čeliković
MGCF-University of Tuzla, B&H
Ph.D. Miroslav R.Ignjatović, Senior Research Associate
Chamber of Commerce and Industry Serbia
Prof.Ph.D. Vencislav Ivanov Mining Faculty, University of Mining and Geology
"St. Ivan Rilski" Sofia Bulgaria
Academic Prof.Ph.D. Jerzy Kicki
Gospodarkl Surowcami Mineralnymi i Energia, Krakow, Poland
Ph. D., PEng. Dragan Komljenović Hydro-Quebec Research Institute Canada
Ph. D. Ana Kostov, Principal Research Fellow
Mining and Metallurgy Institute Bor
Prof. Ph. D. Nikola Lilić
Faculty of Mining and Geology Belgrade
Ph.D. Dragan Milanović, Senior Research Associate
Mining and Metallurgy Institute Bor
Prof.Ph.D. Vitomir Milić
Technical Faculty Bor
Ph.D. Aleksandra Milosavljević, Senior Research Associate
Mining and Metallurgy Institute Bor
Ph.D. Eldar Pirić
Mining Institute Tuzla
Ph.D. Dragoslav Rakić
Faculty of Mining and Geology Belgrade
Prof.Ph.D. Rodoljub Stanojlović
Technical Faculty Bor
Academic Prof.Ph.D. Mladen Stjepanović Engineering Academy of Serbia
Ph.D. Biserka Trumić, Principal Research Fellow
Mining and Metallurgy Institute Bor
Prof.Ph.D. Milivoj Vulić
University of Ljubljana, Slovenia
Prof.Ph.D. Nenad Vušović
Technical Faculty Bor
JOURNAL OF INTERNATIONAL IMPORTANCE, VERIFIED BY A SPECIAL DECISION
OF THE MINISTRY OF EDUCATION, SCIENCE AND TECHNOLOGICAL DEVELOPMENT
OF THE REPUBLIC SERBIA - M24

CONTENS
SADRŽAJ
Slađana Krstić, Milenko Ljubojev, Mile Bugarin
POSSIBILITY OF USE THE KAONA QUARTZITE (EAST SERBIA) ......................................................... 1
Daniel Kržanović, Nenad Vušović, Milenko Ljubojev, Radmilo Rajković
IMPORTANCE OF PLANNING THE OPEN PITS IN THE CONDITIONS OF CONTEMPORARY MINING - A CASE STUDY:
THE OPEN PIT SOUTH MINING DISTRICT MAJDANPEK ..................................................................... 15
Nikola Stanić, Saša Stepanović, Dejan Bugarin, Miljan Gomilanović
SELECTION THE RATIONAL MODEL OF TRANSPORT TRUCK BY THE SELECTIVE COAL MINING AT THE OPEN PIT GACKO .............................................................................................. 23
Miomir Mikić, Milenko Jovanović, Ivana Jovanović, Sanja Petrović
IMPACT OF DRILLING IN THE OPEN PIT MINING ON THE ENVIRONMENT ................................................................................................................................... 35
Vladimir Andrić, Ljubiša Andrić, Dragan Radulović
THE EXTRACTION OF AGGREGATES IN SERBIA, 1973 - 2015, A STATISTICAL EXPLORATION .......................................................................................... 41
Jelena Ivaz, Pavle Stojković, Dejan Petrović, Vitomir Milić
THE USE OF DATABASE ON INJURY AT WORK RECORDS IN SERBIA ............................................ 53
Branislav Rajković, Zoran Ilić, Radmilo Rajković
DRIVING POWER VERIFICATION OF
THE APRON FEEDER FOR ORE TRANSPORTATION ............................................................................. 63
Saša Stepanović, Nikola Stanić, Miodrag Šešlija, Miljan Gomilanović
ANALYSIS OF COAL QUALITY IN A FUNCTION OF
SELECTION LEVEL FOR MINING AT THE OPEN PIT GACKO ............................................................. 71
Vladimir Todorović, Boban Branković, Dejan Dramlić, Silvana Ilić
A NEW METHOD OF COAL EXCAVATION IN THE COMPLEX NATURAL-GEOLOGICAL CONDITIONS .................................................................................................. 85
Nikola Stanić, Saša Stepanović, Milan Nikolić, Aleksandar Doderović
BENEFITS OF APPLICATION THE MODERN TECHNOLOGY OF MECHANIZED CHARGING THE BOREHOLES AT THE OP POTRLICA PLJEVLJA ............................ 93

Boris Siljković, Nebojša Denić, Goran Rakić
ENVIRONMENTAL AND ECONOMIC ASSESSMENS THE EFFECT OF
CRITICAL MINERAL OF GREEN REVOLUTION – LITHIUM ............................................................... 103
Zoran Katanić, Snežana Todosijević Lazović, Radmilo Todosijević
QUALITY MANAGEMENT IN THE TOURISM INDUSTRY .................................................................. 115
Aleksandar Djokić, Nebojša Djokić, Miša Ivanović
OPTIONS OF IMPLEMENTATION THE MODERN BUSINESS QUALITY MANAGEMENT METHODS IN MINING ................................................................................................. 125
Aleksandra T. Ivanović, Biserka T. Trumić, Svetlana Lj. Ivanov, Saša R. Marjanović
PdNi5 ALLOY: EFFECT OF THERMO-MECHANICAL TREATMENT ON MECHANICAL AND MICROSTRUCTURAL PROPERTIES ................................................................... 131
Vladimir Todorović, Zlatko Dragosavljević, Dejan Dramlić, Boban Branković
ELECTRO-FILTER ASH USE IN THE UNDERGROUND COAL MINES ............................................... 143

No. 1-2, 2017 Mining & Metallurgy Engineering Bor 1
MINING AND METALLURGY INSTITUTE BOR ISSN: 2334-8836 (Štampano izdanje)
UDK: 622 ISSN: 2406-1395 (Online)
UDK: 622.362:550.8(045)=111 doi:10.5937/mmeb1702001K
Slađana Krstić*, Milenko Ljubojev*, Mile Bugarin*
POSSIBILITY OF USE THE KAONA QUARTZITE
(EAST SERBIA)**
Abstract
The locality of "Kornjica" is located in the area of the village Kaona, about 5 km from the main road
Majdanpek-Kučevo-Požarevac-Belgrade, or about 10 km west of Kučevo. Quartzites and quartz
metaconglomerates on the surface of about 2 km2 were studied at the site "Kornjica". Quartzites and
quartz metaconglomerates build a package of layers of thickness about 150 m, which are white, solid,
compact and cores. The thickness of pure quartzites is 30 to 40 m, which is multiple interlayered with
the other quartzites and quartz metaconglomerates. The rocks are of different compactness and
composition. Sometimes, the relict pseptic structures are observed in them as well as the quartz-serie
binders. From the existing three horizons of quartzite and quartz metaconglomerates (Kalenić, Hadži-
Vuković, 1974), the oldest package occurs at Kaona, which is considered to signify the passage of
vendor in the Cambrian. The field geological explorations, petrological tests, chemical tests, physical-
mechanical tests and directed technological research (in the laboratory conditions) were carried out.
The obtained results of research, along with the already existing data, have enabled the definition of
quartzite deposits near Kaona, as well as determining the possibility of using these rocks as the mineral
raw materials (whose quality would meet the prescribed standards for use in metallurgy, refractory and
chemical industries).
Keywords: quartzite and quartz metaconglomerates, petrographic characteristics, physical-mecha-
nical characteristics, chemical characteristics, quartzite quality, East Serbia
* Mining and Metallurgy Institute Bor, Zeleni bulevar 35, 19210, Serbia,
e-mail: [email protected] **
This paper is the result of the Project No. TR 33021 “Research and Monitoring the Changes of the
Stress Strain State in the Rock Mass "In-Situ" around the Underground Rooms with Development of
Models with Special Reference to the Tunnel of the Krivelj River and Pit Bor", funded by the Ministry
of Education, Science and Technological Development of the Republic of Serbia
1 INTRODUCTION
The location of "Kornjica" is located, by
air line, about 10 km in the west of Kučevo,
in the attic of Kaona village (East Serbia,
Figure 1). This orographic region belongs to
the South Carpathians; it is a hydrographic
part of the central river basin of the river
Pek,and it administratively belongs to the
Branicevo District (Municipality of Ku-
čevo). For the immediate vicinity of the
explored area, besides the river Pek that
flows in the immediate vicinity, the Kaonski
stream is of great importance. The meta-
morphic complex in the Kaona region (Ka-
lenić, Hadži - Vukovic, 1974) was insuffi-
ciently studied from the aspect of quartzite
exploration as the quartz mineral resource.
In order to solve the set problems, in addi-
tion to the field observations, a detailed
geological exploration the metamorphic
complex was carried out on an area of about

No. 1-2, 2017 Mining & Metallurgy Engineering Bor 2
0.60 km2. Interpretation of the obtained
results of exploration, along with already
existing data, has enabled defining the
quartzite deposit near Kaona, development
the necessary graphic and other documenta-
tion, as well as determining the possibility
of applying these rocks as mineral raw ma-
terials.
Figure 1 Geographical position of the Kaona quartzites
2 BASIC GEOLOGICAL DATA
AND OVERVIEW OF PREVIOUS
EXPLORATIONS
The Kaona area belongs to the Kucevo
OGK leaf, scale 1: 100,000 with the mark L-
34-128. The leaf Kučevo is located between
44020'4 and 44
040' of the north latitude, and
21030 ́and 22
00´ of the east longitude GMT.
Includes Braničevo, upper river Mlava, Stig,
a part of Homolje and North Kučaj.The
boundaries of the explored area are located
in a part of the Kladurovo leaf (L-34-128-
Ca, scale 1: 25,000). A wider surrounding of
the explored area (Figure 2) is built of the
Palaeozoic, Mesozoic and Kenoosic rocks
(Kalenić, Hadži-Vuković 1974).
In recent years, the paleozoic meta-
morphic complex in the Kaona area has
been relatively little investigated by our and
foreign researchers who have been dealing
with the individual research in terms of sedi-
mentology (Kalenić, Milosavljević, 1987,
1988), paleontology (Djajić 1992), mag-
matism or metamorphism (Ivanović. 2000).
Djajić states that the original sediments were
deposited in the marine environment, pro-
bably by the end of Siluria and the beginning
of Devon, and the spores of the first primi-
tive land-based plants were together with the
other material transported from the surroun-
ding land or island into the deposition basin.
Milosavljevic (1992) dealt with the quartzi-
tes of Turian and Sena in detail. She deter-
mines the quartzites of the Moravian Zone
as a part of the Serbian-Macedonian mass
that stretche from the Danube to Vlasina
Lake, in a narrow zone of about 250 km in
length. She describes quartizites as the rocks
that appear as one, two or more successive
discontinuous hori-zons (a few tens of
meters thick) by the palinopalinological
analyses of the proven lower Devon age.
Petrologic - sedimentological studies of
quartzites have proved that they are meta-
morphic sediments (quartzites of the Mora-
vian Zone according to the preserved relict
structures and textures are determined as the

No. 1-2, 2017 Mining & Metallurgy Engineering Bor 3
primary conglomerates and sand-stones
formed by the shallow water sedimenta-
tion). Metamorphism caused the recrysta-
llization and loss of contours of the primary
grains and fragments. A large amount of
silicon binder is present pri-marily because
of isochemical and exoechemic dissolution
and redissolution of silicon during and after
diogenesis. By analyzing the quartz pebbles,
detritic minerals (primarily zircon), it has
been proved that the clastic quartzite
material originated of the rocks from the
metamorphic region. The occurrence of
chloritoids and pyrophyllites in the matrix of
metaclastite of the Moravian zone were
studied by Milovanović et al. (1994). These
authors believe that chloritoide, pyrophilic
and chlorite were formed at temperatures
around 3500S ± 50
0S and pressures of
2-3 kbar.
Figure 2 Geological map of a wider area of explored Kaona territory (Kučevo a part of
the leaf Kučevo 1:100 000 (Kalenic, Hadzi Vukovic, 1974) with a view of
geological columns (Kalenic et al. 1987)
Legend: 1. alluvium; 2. deluvium; 3. proluviums; 4. river terrace; 5. gravel, sand, clay and limestone;
6. sands and gravels; 7. conglomerates, sandstones, clays, tuffs and coal; 8. conglomerates, shales with
coal and marl; 9. massive and banked limestones; 10. marl, marly limestone and limestone with a pink
bump; 11. banked and layered limestone, marl limestone and marl; 12. banked and plate limestones with
pink bumps; 13. dolomitic limestone and limestone; 14. red sandstones and conglomerates; 15. metap-
samites and metadiabasites; 16. acidic metavoclanites, metapelites and metapsamites; 17. metabasites
and filitoids; 18. quartzites and quartz conglomerates; 19. sericite schists; 20. exploration area of the
Kaona quartzites; 21. location of the geological column Kaona-Turija; 22. location of the geological
column Sena-Turija, and 23. location of the geological column Sena-Mišljenovac

No. 1-2, 2017 Mining & Metallurgy Engineering Bor 4
The metamorphic complex in the area
Kaona has been insufficiently studied from
the aspect of quartzite research as a quartz
mineral resource. In the period 1988 - 1990
(Bugarin), a quartzite prospectus was carried
out in the area of Kaona, a narrow locality of
the "Kornjica" (a detailed geological map
1:2.500, the surface area of 2 km2 and 200
ha, was made, covering the area where the
quartzite outcrops were observed.) In the
same proportions, a structural map of the
locality of Kornjica was made. Systematic
research of the regional character included:
recognition and geological mapping of the
terrain for development a geological map of
1:10.000. In geological mapping, the samp-
les were taken for mineralogical-petrological
tests as well as for laboratory tests of che-
mical composition of quartzite. It is deter-
mined by the geological researches that it is
a quartzite series of thickness up to 150 m,
in the form of packages (layers), whose
quality differs macroscopically by compact-
ness, thickness, grain size distribution, etc.
The scope and type, as well as the density of
applied exploration works was not satisfa-
ctory to talk about the reserves of higher
categories on which the future exploitation is
based.
2.1 Geological Characteristics of
the Quartzite Deposit Kaona
The area of field of the quartz raw mate-rial, Kaona, was built mainly of crystalline shales, within which quartzites, quartz metaconglomerates and quartz metasands are located (Figure 3). The southeastern and southwestern parts of this terrain are formed by the sedimentary structures of the Miocene age.
Figure 3 Geological map of the explored area Kaona 1:10 000 (a part of the leaf
Kladurovo 2-L-34-128-Ca 1:25 000)
Legend: 1. Delluvium; 2. conglomerates, sandstones, sandy clays and coal;
3. conglomerates, sandstones, marls, exfoliated schist, clay and coal; 4. quartzites with
metaconglomerates and quartz conglomerates; 5. metamorphosed gabbro; 6. meta-
morphosed diabase and gabrodiabase; 7. quartz-sericite-chlorite schists and graphitic schists;
8. anticline; 9. fault; 10. exploration area

No. 1-2, 2017 Mining & Metallurgy Engineering Bor 5
The deposit Kaona is located at the
forehead of putting on the proterozoic and
old paleozoic complexes of the Moravian
zone, over the Mesozoic structures of the
Golubac-Gornjak structural unit. If the
Mesozoic sediments east of Kaona are
excluded, and in our case they represent only
the ground on which the Vend-Cambrian
formation is drawn, then the geological
situation is quite simple.
By studying quartzite, quartz metacon-
lomerates and quartz metasandstones of
Kaona, it was observed that, in the vertical
column, three identical zones can be
separated, thickness of about 80 m. From the
existing three horizons of quartzite, disin-
tegrated quartzite, and quartz metacon-
glomerates and quartz metasandstones, the
oldest one occurs near Kaona that denotes
the passage of proterozoic (venda) into the
cambium (Kalenić, Hadži-Vuković, 1974).
Quartzites are the metamorphic struc-
tures that originate from quartz sands, quartz
sandstones and quartz conglo-merates,
which underwent changes in both methane
and cement binder due to the regional
metamorphism, both the base mass and
cement binder. In spite of the fact that the
proportion of cement masses in the higher
horizons is not large, however, quartzites of
Kaone are a better quality mineral raw
material as cleaner.
3 MATERIAL AND METHODS
OF QUARTZITE TESTING AS
THE MINERAL RAW MATERIAL
Within testing the quality of quartz
mineral raw material, the earlier results of
systematic testing of regional character
(period from 1988 to the end of 1989) were
used, by reconnaissance and geological
mapping of the terrain surface, as well as
development of shallow trenches. Sampling
of trenches was carried out by outbreaking a
rough furrow (in total 23 samples were
taken, which were analyzed on: SiO2,
Al2O3, Fe2O3, Fe2O3 and CaO).
The basic method of detailed geological
exploration the deposit of quartz raw mate-
rial Kaon was the exploration depth drilling
with coring. The Kaona deposit at Kucevo
was explored by vertical cross-sections
(Figure 4), exploration drilling from the
terrain surface (9 vertical exploration drill-
holes). Total of 419.0 meters was drilled.
Geological works followed the explo-
ration drilling; they were performed simulta-
neously and continued after them.
The applied test methods are reduced to
sampling the exploration drillholes. Tests
were taken for laboratory (chemical), petro-
logical, and physico-mechanical tests.
Testing of the exploration drillholes cores
was carried out in parallel with the geolo-
gical mapping the core of drillhole. For
laboratory test (chemical) tests, individual
samples were taken along the entire length
of the drillholes (except the humus cover
interval). The lengths of sampling the cores
from drillholes were 2 m (exceptionally, 1.8
m or 2.5 m when, due to the lack of core, the
two-meter interval could not be accurately
determined). Total of 198 individual samp-
les were taken. Total of 19 samples was
taken for petrological testing of samples
from exploratory drillholes (Table 6) of
which 11 preparations were made. For labo-
ratory tests of physical-mechanical proper-
ties, total of 104 samples was taken. The
taken samples were analyzed in the MMI
Bor laboratories (chemical tests, minera-
logical-petrological, geomechanical tests and
targeted technological tests).

No. 1-2, 2017 Mining & Metallurgy Engineering Bor 6
Figure 4 Map of sampling the site Kornjice, 1:10 000 (a part of
the leaf Kladurovo 2 L-34-128-Ca)
Legend: ● ABCDEFG - Breakpoints of the exploration area of quartz mineral resources; ● 404 – petro-
logical prospecting point; ● - chemical test outcrops in 1988; ● K-9/07 - petrological tests of explo-
ration drillholes; 5-5' – Exploratory cross section
4 RESULTS OF TESTING
THE QUALITY OF MINERAL
RAW MATERIAL
4. 1 Chemical Characteristics of
the Kaona Quartzite
The basic criterion for contouring the
productive interval, i.e. determining the
internal contour of the deposit, was a
minimum content of SiO2 of 85% and a
maximum content of harmful substances:
Al2O3 to 5.0%, Fe2O3 to 5.0% and CaO to
5.0%.
Based on the demands of certain branches of the quartz raw material industry, the exi-stence of parts of deposits with different SiO2 medium contents, which had to be taken into account in designing the model, were identified, so that three quality classes (Table 1) were separated within the base.

No. 1-2, 2017 Mining & Metallurgy Engineering Bor 7
Table 1 Quality classes of the deposit Kaona
Quality class
Content of useful and harmful components (%)
Useful components Harmful components
SiO2 Fe2O3 Al2O3 CaO
QI > 93.00 mah 5.00 mah 5.00 mah 5.00
QII 90.00 – 93.00 mah 5.00 mah 5.00 mah 5.00
QIII 85.00 – 90.00 mah 5.00 mah 5.00 mah 5.00
Witin testing the quality of quartz
mineral raw material, the previous results of
systematic testing of a regional character
were also used. Sampling of a trench was
done by outbreaking a rough furrow. The so-
formed individual test sample was analyzed
on: SiO2, Al2O3, FeO, Fe2O3 and CaO (total
of 23 samples were taken). The SiO2 content
ranges from a minimum of 93.82% to a
maximum of 98.22%, and a mean content of
96.32 %. The Al2O3 content varies from a
minimum of 0.10 % to a maximum of
1.63%, and a mean content of 0.68%. The
Fe2O3 content varies from a minimum of
0.34% to a maximum of 2.12%, and a mean
content of 0.96%. The FeO content varies
from a minimum of 0.37% to a maximum of
1.01%, and a mean content of 0.64%. The
content of CaO from the taken samples is in
traces. Three composite samples were for-
med from the same samples. Composite
samples were analyzed on: TiO2, Cr2O3,
MgO, K2O, Na2O, and loss by ignition. The
results of chemical analyses of composite
samples are shown in Table 2.
In the laboratory conditions, the che-
mical analyses of individual samples from
drillholes were carried out on useful and
harmful components: SiO2, Al2O3, Fe2O3,
CaO. From the individual samples, the
composite samples (total of 41) were for-
med, which were tested for SiO2, Al2O3,
Fe2O3, CaO, MgO, S-total, SO3, TiO2, K2O,
Na2O, Cr2O3 and loss by ignition. A composite sample was obtained com-
bining the material with five consecutive, individual samples p (ten-meter interval). The mean content of useful and harmful components in the drillholes, calculated on the basis of chemical analyses of individual samples, were obtained as weighted values by the length of testing interval, while the mean content was calculated for the whole deposit as the weighted value of the entire sampling interval (Table 3). The mean content of useful and harmful components, calculated by the MINEX 5.2.1 program package, from the composite samples by the selected quality classes, depending on the require-ments of application the mineral raw material, are shown in Table 4 for the whole deposit.
Table 2 Results of outcrops sampling (composite test)
Sample designation Medium content (%)
TiO2 Cr2O3 MgO K2O Na2O G.Ž.
1-13 AB 0.033 0.000 0.027 0.172 0.033 0.390
10-20/ CD 0.033 0.027 0.015 0.183 0.031 0.140
17-A; 17-B; 17-C 0.080 0.000 0.029 0.251 0.037 0.280

No. 1-2, 2017 Mining & Metallurgy Engineering Bor 8
Table 3 Medium content of useful and harmful components (by drillholes,
from individual tests)
Drillhole
designation
Medium content (%)
SiO2 Fe2O3 Al2O3, CaO
K-1/07 96.222 1.766 1.433 0.230
K-2/07 93.405 1.601 3.051 0.118
K-6/07 92.900 1.268 3.126 0.229
K-5/07 94.848 1.686 1.852 0.451
K-17/07 95.293 1.433 1.663 0.113
K-11/07 92.831 1.926 2.485 0.107
K-20/07 95.582 1.272 1.293 0.220
K-7/07 94.213 1.691 1.845 0.271
K-9/07 94.929 1.618 1.361 0.147
Whole deposit 94.442 1.569 2.013 0.215
Table 4 Medium contents from composite tests by the quality classes, calculated by the
software package MINEX 5.2.1.
Quality class Medium content (%)
SiO2 Fe2O3 Al2O3 CaO MgO Na2O K2O S TiO2 SO3 Cr2O3
QI (> 93% SiO2) 95.19 1.45 1.63 0.23 0.12 0.09 0.33 0.16 0.13 0.42 0.08
QII (90-93% SiO2) 91.30 2.06 2.88 0.33 0.16 0.16 0.62 0.26 0.17 0.65 0.03
QIII (85-90% SiO2) 88.72 2.42 5.26 0.07 0.20 0.16 0.88 0.14 0.18 0.35 0.04
Whole deposit 94.84 1.76 1.76 0.23 0.13 0.10 0.35 0.17 0.13 0.43 0.08
4.2 Petrographic Quartzite
Characteristics
By a detailed observation and measuring
on the outcropsa of rocks, the way of quart-
zite occurrence was determined, i.e. the
exture properties of the same. Each outcrop
is described, determined by coordinates and
documented by the photographs on appeara-
nce and way of occurrence of these rocks
(Figure 4). The samples of quartzite and
quartz metaconglomerates were taken from
the same outcrops for petrochemical testing
(determining the mineral composition and
rock structure and chemical testing.). Total
of 14 samples were taken by the petrological
prospecting the site Kornjica along the
routes, parallel profiles, at a distance of 50
meters. Mineralogical - petrographic testing
was carried out on selected samples from the
drillholes (total of 11 samples) Total of 25
petrographic preparations were made. The
examination of preparations was carried out
on the Carl Zeiss/Jena polarization micro-
scope, magnification up to 1200 x.
Based on the mineral composition,
structure and texture, the Kaona quartztes
are divided into: quartz metachonglo-
merates, massive quartzites, quartzite with
sericity, cataclastic quartzite and quartzite
with chloritide. Quartz metaconlomerates
are dominant rocks in the researched area.
They are of shrunken texture, build the
banks of thickness up to a dozen meters
(Figure 5). Macroscopic, on the ground, they

No. 1-2, 2017 Mining & Metallurgy Engineering Bor 9
are recognized by quartz pebbles, size of
2 to 5 cm, which are deposited in a fine-
grained quartz mass. The rock is mono-
mineral, built of quartz, granoblastic struc-
ture withof elements of blastopsamitic and
porphyroblastic. Quartz occurs in grains
of size from the tenth part up to several
millimeters. Bigger quartz grains make
for the most part the pebbles, size up to
several millimeters, when the wall gets
blastopsamitic and porphyroblastic struc-
ture.
Figure 5 Banks of quartz metaconglomerates on the north-eastern part of Kornjica,
above left a detail of the rock
4.3 Physical - Mechanical
Characteristics of Quarcite
Physical-mechanical testing of samples
from the exploratory drillholes (104 pcs.)
was carried out on prepared test samples
according to the valid standards for each
type of test or according to the recommen-
dations of the International Society for Rock
Mechanics (ISRM). The following physical
properties were determined on quartzite and
quartz sand samples: humidity v = 11.40%,
specific gravity or bulk density of solid
particles s = 18.84 kN/m3, volume weight
γ = 16.83 kN/m3, porosity n = 3.58%,
velocity of longitudinal wave propagation
VL = 4.123.43 m/s. From the mechanical
parameters, the following were tested:
uniform pressure strength σp = 93.89 Mpa,
and shear resistance parameters (cohesion
C=25.57 MPa, and angle of internal friction
= 27.88°).
4.4 Granulometric Characteristics
of Quarcite
Testing the granulometric composition
of the quartz mineral raw material from the
Kaona deposit at Kučevo was carried out by

No. 1-2, 2017 Mining & Metallurgy Engineering Bor 10
two methods. The first method is to test the
grain size distribution of the composite
samples. Composite samples were formed
according to the quality classes for each
individual drillhole (Figure 6). The second
method of testing consisted in testing the
grain size distribution of each individual
sample from all drillholes. The grain size
distribution the samples of the quartz
mineral raw material of the Kaona deposit is
characterized Kaon deposit that fine classes
(-0.212 + 0 mm) and coarse classes (+4 mm)
participate with about 10-30%. Classes -4 +
0,212 mm prevail, with a share of 70-90%.
Figure 6 Three-component diagram of particle size distribution of composite samples
4.5 Results of direct technological
quarcite testing
The direct technological tests (in order
to determine the adequate technology to
enable the cheapest production of commer-
cial products through laboratory testing of
disintegration, screening and atry sand
washing), have resulted in a technological
scheme for processing the quartz mineral
raw materials in the Kaona deposit. A
technological sample was formed of mate-
rials of all quality classes (run-of-mine raw
material = minimal content of SiO2 85% and
maximum content of harmful substances:
Al2O3 to 5.0%, Fe2O3 to 5.0% and CaO to
5.0%) and the results of these direct
technological tests are shown in Tables 5
and 6. The proposed technological scheme
for processing the quartz mineral raw
materials for the Kaona deposit (Milanović
et al., 2009, 2010) contains the primary
disintegration into a washing drum, and the
secondary disintegration in the atry washing
equipment is omitted (based on the achieved
laboratory results by simulation the process
of atry washing).
Clay
Sand
Alevrit silt

No. 1-2, 2017 Mining & Metallurgy Engineering Bor 11
Table 5 Content of useful and harmful components in the useful fractions of deposit
Particle size
distribution SiO2 Al2O3 Fe-uk K2O Na2O TiO2 Cr2O3 G.Ž
(mm) %
-30+2.362 96.33 1.62 0.93 0.49 0.052 0.19 0.10 0.053
-2.362+0.63 97.60 0.95 0.67 0.18 0.034 0.068 0.050 0.35
-0.63+0.106 96.13 1.39 0.90 0.26 0.057 0.15 0.11 0.98
-0.106+0.000 88.45 5.46 1.60 0.66 0.17 1.23 0.39 1.95
Table 6 Physical-chemical characteristics of the run-of mine raw material, Kaona
PHYSICAL - CHEMICAL CHARACTERISTICS
Bond's index - balls Wi (kWh/t) 12.71
Bulk density of dry sample s (kg/m3) 1,102.6
Bulk density of wet sample v (kg/m3) 1,363.83
Rough moisture content vg (%) 9.53
Density of sample ρ (kg/m3) 2,720
ELEMENT CONTENT (%) ANALYTICAL METHOD
SiO2 95.22 G
Al2O3 1.53 AAS
Fe2O3 0.35 AAS
K2O 0.069 AAS
Na2O 0.37 AAS
TiO2 0.13 ICP-AAS
Cr2O3 0.035 ICP-AAS
Fe 1.01 AAS
G.Ž. 0.88 G
pH 8.25
5 DISCUSSION OF DIRECT
TECHNOLOGICAL QUARTZITE
TESTING
Quartz raw materials are used in: refra-
ctory industry, glass and ceramics industry,
plastics industry, chemical industry (to
obtain acid resistant materials, enamel for
dishes), metallurgy (as fluxes, granulate
production for metallurgical processing of
ferro alloys), in casting industry (for molds
and cores), construction, for production of
silicate fillers, as well as the production of
ferrosilicon (Table 7). The use of quartz raw
materials depends on the quality (chemical
composition) and physical-mechanical
properties of the same.
The plan of mining exploitation of mine-
ral resources (open pit mining) foresees the
annual mining capacity of 150,000 t/year,
commercial fractions or commercial pro-
ducts with application shown in Table 7, and

No. 1-2, 2017 Mining & Metallurgy Engineering Bor 12
the expected annual production balance
mass of the annual production is shown in
Table 8. The proposed technology and
technological solutions have achieved the
primary goal: to obtain several commercial
products for use in various industrial bran-
ches by a relatively small investment
(simpler technology).
Table 7 Fields of application the commercial size classes of quartz mineral resources
Size class (mm) Fields of application
-30.00+2.362 Construction, filter fillings, oil industry, air sand blasting
-2.326+0.630 Construction, filter fillings, oil industry, air sand blasting
-0.630+0.106 Casting industry (very good), glass industry (VIII class), ceramic
industry (II class)
-0.106+0.053 Construction industry (gas, concrete), chemical industry, extrac-
tive metallurgy, casting industry, construction
-0.053+0.000 Building ceramics
Table 8 Commercial products - expected balance of weight at the annual level,
deposit Kaona
Product Size class
(mm)
Production
(t/h)
Mass
(%)
Annual
production
(t/year)
P1 -30+15 3.24 9.08 13,617.60
P2 -15+2.362 5.23 14.65 21,976.66
P3 -2.36+0.63 16.29 45.61 68,418.75
P4 -0.63+0.106 9.54 26.70 40,041.56
Waste -0.106+0.000 1.41 3.96 5,945.43
Capacity (Qyear) 150,000 t/year (35,712 t/h)
CONCLUSION
Based on the results of detailed geolo-
gical explorations (chemical, mineralogical -
petrological and geomechanical tests) and
direct technological testing (in the laboratory
conditions), the deposit of quartzite Kaona is
included in the first groupof the “Quartzite
and quartz sand deposits of uniform thick-
nesses and chemical - mineral composition
with the reserves amounts to over 1,000,000
tons of mineral raw materials”. The explo-
ration works include a small part of the
deposit, an area of about 0.57 km2, which
indicates that the geological explo-rations of
the deposit itself should be continued.
Due to the uneven quality of mineral raw
materials of the Kaona deposit (chemical
composition and physical - mechanical
properties), the same can have limited
application in the refractory industry, glass
and ceramics industry, plastics indu-stry,
chemical industry (to obtain acid resistant
materials, enamel dishes), metallurgy (as
fluxes, production of granules for metallur-
gical processing of ferro alloys), casting
industry (for molds and cores), construction,
for the production of silicate fillers, as well
as the production of ferrosilicon.

No. 1-2, 2017 Mining & Metallurgy Engineering Bor 13
REFERENCES
[1] Bugarin M.: Project of Geological
Exploration of Quartzites in the Kaona
Area in 1989/1990, Copper Institute
Bor (unpublished), 1989, (in Serbian)
[2] Bugarin M., Anđelković A.: Quartzite
Exploration in the Kaona Area
(Geodetic Study), Copper Institute Bor
(unpublished), 2005, (in Serbian)
[3] Djajić S.: Report on Palaeoplinological
Investigations by the Project "Crysta-
lline Schists of the Serbian-Macedo-
nian Mass-Geological Map of SFRY
1:50.000". Professional Docu-ments
Fund Geozavod - "Gemini", Belgrade,
1992 (in Serbian)
[4] Ivanović M.: Petrology of Palaeozoic
Metamorphic Rocks between the
Rivers Mlava and Peak. Master thesis
(unpublished); Belgrade, 2000 (in
Serbian)
[5] Kalenić M., Hadži-Vukovic M., Prote-
rozoic-paleozoic. Interpreter of OGC
SFRY Leaf Kučevo 1: 100.000, Pro-
fessional Documentation Fund Geo-
zavoda-"Gemini", 1974, Belgrade (in
Serbian)
[6] Kalenić M., Hadži-Vuković M. et al.:
Interpreter for the Leaf Kučevo OGK
SFRz 1: 100 000. Federal Geological
Survey, Belgrade, 1980 (in Serbian)
[7] Kalenić M., Hadži-Vuković M. et al.:
Leaf Kučevo L 34-128 OGK SFRJ 1:
100 000. Federal Geological Institute,
Belgrade, 1980 (in Serbian)
[8] Kalenić M., Milosavljević M.: Final
report on the microscopic examination
of the preparations of the wall from the
Lapovo leaf 1:25.000. Professional
Documents Foundation Geozavoda -
"Gemini", Belgrade, 1987 (In Serbian)
[9] Kalenić M., Milosavljević M.: Annual
Report on the Construction of the
Geological Map of SFRY 1:50.000 -
Project B1, "Crystalline Shards of the
Serbian - Macedonian Mass". Profe-
ssional Documentation Fund Geoza-
voda "Gemini", Belgrade, 1988 (unpu-
blished)
[10] Maksimović M., Ljubojev V., Krstić
S.: Project of Geological Exploration
of Quartz Raw Materials (Quartzite) in
the Area Kaona near Kucevo in 2007,
Mining and Metallurgy Institute Bor,
2007 (unpublished) (in Serbian)
[11] Maksimović M., Pačkovski G., Lju-
bojev V., Jovanović M., Marinko-
vić V., Krstić S.: Elaborate on Geolo-
gical Exploration of Deposit of Quartz
Mineral Raw Material Kaona near
Kučevo in 2007, Mining and Meta-
llurgy Institute Bor, 2009 (unpub-
lished) (in Serbian)
[12] Milanović D. et al.: Feasibility Study
for Separation of Quartz Sand from the
Kaona Deposit near Kučevo, Mining
and Metallurgy Institute, Bor, 2009
(unpublished) (in Serbian)
[13] Milanović D., Ignjatović M., Obra-
dović Lj., Magdalinović S., Uroše-
vić D.: Separation of Quartz Mineral
Raw Materials from the Kaona Deposit
near Kučevo. Zbornik radova, Ru-
darstvo 2010, Tara, May 210, p. 459-
468 (in English);
[14] Miyashiro A.: Pressure and Tempe-
rature Conditions and Tectonic Signi-
ficance of Regional and Ocean-Floor
Metamorphism. Tectonophysic, 1972,
V. 13, p. 141-159;
[15] Milovanović D., Milosavljević M.,
Kalenić M., Marshig V.: Chloritoide

No. 1-2, 2017 Mining & Metallurgy Engineering Bor 14
and Pyrophyllite and Metaclastic
Rocks of the Morava Zone. Geologica
Balcanica, 24/3, 31-39, Sofia,1994.
[16] Milosavljević M.: Quartzite and Quart-
zite Metaconglomerates of the Older
Paleozoic Age in the Area between the
Rivers Mlava and Peak. Trainee work
(unpublihes); Belgrade, 1988 (in
Serbian)
[17] Milosavljević M.: Solving the Genesis
of Paleozoic Quartzites of the Mora-
vian Zone, Master Thesis (unpubli-
shed); Belgrade, 1992 (in Serbian)
[18] Milosavljević M., Kalenić M.: Devon
quartzites of Seine and Turia. Geol.
Anali Balk. Pol., Book. LVI, Vol. 1,
p. 53-67 Belgrade, 1992 (in Serbian)

No. 1-2, 2017 Mining & Metallurgy Engineering Bor 15
MINING AND METALLURGY INSTITUTE BOR ISSN: 2334-8836 (Štampano izdanje)
UDK: 622 ISSN: 2406-1395 (Online)
UDK: 622.271(045)=111 doi:10.5937/mmeb1702015K
Daniel Kržanović*, Nenad Vušović**, Milenko Ljubojev*, Radmilo Rajković*
IMPORTANCE OF PLANNING THE OPEN PITS IN THE
CONDITIONS OF CONTEMPORARY MINING - A CASE STUDY:
THE OPEN PIT SOUTH MINING DISTRICT MAJDANPEK***
Abstract
In today’s financial and environmental climate, it is imperative to develop the robust projects with
good economics. Successful business in conditions of limited resources is impossible without analyzing
all the technical and economic parameters and scenarios of sustainable operation. In this sense, it
requires the application of mathematical algorithms implemented in the contemporary software tools
able to efficiently provide the effective troubleshooting of design in complex conditions of modern
mining.
This paper, an example of the open pit South Mining District Majdanpek, shows the importance of
planning and design the ore exploitation in achieving the maximum net present value (NPV).
Keywords: planning, optimization, net present value, open pit South Mining District Majdanpek
* Mining and Metallurgy Institute Bor, e-mail: [email protected]
** University of Belgrade, Technical Faculty in Bor
*** The work is the result of the Project TR 33038 „Improvement the Technology of Copper Ore Mining
and Processing with Monitoring of Living and Working Environment in RTB Bor Group“, funded by
the Ministry of Education, Science and Technological Development of the Republic of Serbia
INTRODUCTION
Mine planning is aimed at one goal:
maximizing the value to be realized from
extracting the mineral resources. This goal
achievements depends primarily on the
ability of an engineer to realize the all
issues related to the production process in
terms of the number of alternatives related
to the investment and exploitation factors.
The decisions are updated through time,
usually annually, as a new information
becomes available.
The size, location and final shape of an
open pit are important in planning the lo-
cation of waste dumps, stockpiles, pro-
cessing plant, access roads and other sur-
face facilities, and for development the
production program. The pit design also
defines the minable reserves and associat-
ed amount of waste to be removed during
the operation life. Over the past 50 years,
determining the optimum open pits has
been in the areas of operational research in
the mining industry.y and many algo-
rithms have been published.
The design and scheduling of open pit
mines is a significant and complex prob-
lem in the mine planning. The principal
aim of mining operation is to ensure that
an ore body is exploited in a way such that
the value realized from the mine is maxi-
mum. A well-known early contribution to
this field was made by Lerchs and Gross-
mann [8], who presented a graph-theoretic
algorithm for determining the final con

No. 1-2, 2017 Mining & Metallurgy Engineering Bor 16
tour of the open pit, known as the ultimate
pit, such that the total profit from the mine
is maximized.
Some optimization methods for solving
problems of mine scheduling are the heuris-
tics (Gershon [1]), dynamic programming
(Onur and Dowd [2], Wang [3], parametric
methods (Whittle [4]), Tolwinski and Un-
derwood [5], Tolwinski i Golosinski [6]),
integer linear programming (Gershon [7],
Smith [8], Caccetta and Hill [9]) and Mixed
Integer Linear Programming – MILP (Vahid
Rafiee i Omid Asghari [10]).
METHODOLOGY
Mining processes are complex and
complicated, with many different economic,
technical, environmental and other parame-
ters that must be planned before the project
gets its practical value. Many of these pa-
rameters are evaluated independently of the
other, due to the expediency and difficulty
in predicting the values of variables under
consideration. Costs, prices, reserves, ore
mining and processing, as well as many
aspects of society, such as the issuance for
implementation of works are absolutely
essential for the project evaluation.
Each ore body is different, but the main
steps in the open pit planning, when the
main objective is the maximization of NPV,
take place on the same principle. These
steps are for simplicity represented as linear.
The actual planning process is an iterative
process in which some steps or combination
of steps are repeated many times with the
sensitivity analysis.
Achieving the maximum NPV is real-
ized by the procedure which comprises first
the optimization of open pit and defining
the phase of open pit development
(pushbacks) with calculation the ore amount
and mineral content in each phase. The next
step is to optimize the mining dynamics.
Blok model of deposit, created by the
method of geostatistical modeling, with
separate areas of useful mineral blocks and
non-profit blocks of waste, allows engineers
to select the appropriate mining methods
and plan the necessary equipment and infra-
structure that are essential for development
the process of ore mining. Blok model of
deposit is a major input in the optimization
process of the open pit.
Optimization of the open pit comprises
obtaining a possible contour of the open pit,
based on a block model of deposit, which
has an economic value, and which can be
calculated. The term a possible contour of
the open pit means an open pit contour with
maximum inclination of general slope,
formed after mapping the transport routes
and safety berms, and which meets the sta-
bility criteria.
To calculate the economic value, the se-
quence of excavation has to be firstly de-
fined, and then, progressively with excava-
tion, to accumulate the income and expens-
es. Application the principle of the time
value of money, or that a dollar that is ob-
tained today, is more valuable than the one
that will (maybe) be obtained next year,
means that discounting of revenue and costs
is done by a factor that increases over the
life of the mine.
Another thing to note is that the calcula-
tion of values is made for each block in the
block model, or each block has its economic
value. Calculation the economic value of
the block (EVB) requires a detailed
knowledge of a large number of parameters,
such as the content of useful component in a
block, the selling price of useful component,
the costs of mining and processing, cut-off
grade in mining and processing, recoveries
in mining and processing.
Today's the open pit optimization tech-
niques, which are implemented in special-
ized software, finding the optimal contour
of the open pit are based on maximizing the
NPV. This ensures that there is no inde-
pendent block or combination of blocks that
can be added or subtracted within the con-
tour of the pit, which would lead to an in-
crease in the NPV.
No. 1-2, 2017 Mining & Metallurgy Engineering Bor 17
Optimization the open pit limit and mi-
ning dynamics was carried out in this work
using Whittle software. Whittle process is
based on a rapid implementation the series
of the Lerchs-Grossmann (LG) algorithm.
This algorithm provides the mathematically
optimal ultimate open pit limit when the
criterion for optimization is the maximum
undiscounted cash flows. The process is
used for selection the optimum final pit
limit for the best and worst case of the min-
ing excavation plans for which the NPV
curves are obtained. A wide range of possi-
ble open pits is generated by this way in-
cluding an engineer selecting the optimum
open pit, which once again confirms that an
engineer still has an irreplaceable role in
design despite the a strong software deve-
lopment and computer equipment.
In the process of optimization of mining
dynamics, a simulation and discounted cash
flow analysis (DCF) are done to obtain the
most favorable solution, that is, to deter-
mine the number of phases which affects
maximization of the net present value in a
long - term planning of the open pits.
The analysis is based on the Milawa al-
gorithm, which is specifically designed to
optimize the mining dynamics in the long-
term planning strategy of mining.
The Net Present Value is calculated by
discounting the estimated annual cash flows
at the current time using the discount rate,
which represents the risk of investment.
(1)
where:
k - discount rate
t - number of years.
The importance of planning the open pits
is seen in the case of the open pit South Mi-
ning District Majdanpek in which the copper
ore is mined. The analysis of mining dyna-
mics for current real indicators of mining
conditions at the open pit and designed mi-
ning dynamics, and within the framework of
the project defined the optimal contours of
the open pit, has shown how the business
operations of a mining company is sensitive
to the changes in mining production.
CASE STUDY
The open pit South Mining District of
the Copper Mine Majdanpek is located in
the south of the town of Majdanpek in its
immediate vicinity. Mining of copper ore at
the open pit South Mining District is carried
out using a discontinuous technology of
excavation, using the drilling - blasting
works and loading - transport machines.
The open pit South Mining District op-
erates within the company Copper Mine
Majdanpek, which is part of the company
Mining and Smelting Basin Bor Group
(RTB Bor Group).
In 2013, the project was developed that
reviewed the long-term development of the
open pit South Mining District Majdanpek
[11]. Input data for defining the final limits
of the open pit and mining dynamics in the
software Whittle are provided in the follo-
wing Table 1.

No. 1-2, 2017 Mining & Metallurgy Engineering Bor 18
Table 1 Techno-economic data for analysis [11]
Parameter Unit Value
Base metal prices
- Copper $/t 6,000
- Gold $/kg 35,000
- Silver $/kg 650
Costs of ore mining $/t 1.50
Costs of waste mining $/t 2.50
Costs of flotation ore processing
- Up to 2014 $/t 4.00
- Period after 2014 $/t 3.20
Costs of metallurgical treatment of concentrates
- Costs of copper production from concentrates
- 2013 $/t Cu cathode 850
- Period after 2013 $/t Cu cathode 600
- Costs of gold refining $/kg 150
- Costs of silver refining $/kg 15
Flotation copper recovery from ore
- Up to 2014 % 80
- Period after 2014 % 86
Metallurgical copper recovery from ores
- Up to 2014 % 94
- period after 2014 % 98
Total recovery of gold % 50
Total recovery of silver t/year 50
Annual processing capacity of ore t/year 8,500,000
Discount rate t/year 10
The basic problem of production system
at the open pit, in the period from 2013 to
the present day, is related to a delay in relo-
cation the major infrastructure facilities,
located in a newlydefined contour of the
open pit (the route of the state road M22 I B
series, a part of the route of the existing
35 kV transmission line, the riverbed of the
river Mali Pek, the urban waste water col-
lector), as well as pumping of the mine
water, whose starting level was at a height
of k+221, and these are amounts of
15,136,286 m3. This caused a delay in the
ore stripping and therefore deviation from
the designed solutions and parameters that
guarantee the maximum NPV, which is veri-
fied by the techno-economic analysis of the
project.
The conducted analysis is aimed to de-
termine the resulting implications in the
company business, which is reflected pri-
marily in the lost profit due to deviations
from the optimal mining dynamics defined
by the mining project.
The amount of ore and overburden in
the early years, from the first to the fifth
year, represent the real amounts, excavated
at the open pit South Mining District Maj-
danpek [12].
Geological reserves of the copper de-
posit South Mining District Majdanpek are
calculated by the method of mini blocks,
sizes 15x15x15 m. The basis for calculation
the geological reserves is a digital block
model of the deposit which was formed in
the software Gems [13, 14]. Geostatistical

No. 1-2, 2017 Mining & Metallurgy Engineering Bor 19
method that, used to assess the content of
metals in the process of deposit modeling is
a method of real kriging.
Figure 1 shows a three-dimensional
block model of Cu in the deposit South
Mining District.
Figure 1 View the 3D block model of the deposit South Mining District Majdanpek
On the basis of a defined block model
of the deposit, the optimization of the final contour of the open pit was done in the software Whittle and defined
development phases of the open pit; six pjases are defined, wherein the sixth pha-se is the final contour of the open pit, Figure 2.
Figure 2 View of the final contour of the open pit mining South Mining
District Majdanpek (3D) [15]
a) Phase 1; b) Phase 2; c) Phase 3; d) Phase 4; e) Phase 5; f) Phase 6 (final contour of the open pit)

No. 1-2, 2017 Mining & Metallurgy Engineering Bor 20
Maximization of the NPV of the project
in the life time of the mine was carried out
by optimization the mining dynamics.
RESULTS AND DISCUSSION
The results of carried out analysis are
shown in the following graphs in Figures
3 and 4.
Figure 3 Mining dynamics for the project design and conducted analysis
The following can be concluded from
the graph in Figure 3:
1) During the period from the first to
the sixth year, significantly lower amounts
of ore and overburden were mined relative
to the designed amounts.
2) The amounts of overburden are-
balanced by the project, which in the peri-
od up to 13th
year have a uniform value,
and then decline steadily until the end of
mining life.
3) The conducted analysis shows that
it is necessary to significantly increase the
annual amounts of overburden to achieve
the required capacity of ore mining.
4) The lifetime of the mine was in-
creased by 4 years, while the amounts of
ore and overburden are the same.
Figure 4 Cash flows for the project design and conducted analysis

No. 1-2, 2017 Mining & Metallurgy Engineering Bor 21
Graph in Figure 4 indicates the follo-
wing:
1) Cash flows in the period up to 3rd
year of mining are negative for the
conducted analysis and total to –
35,771,590 $. In the project design,
the negative values of cash flows
are up to 2nd
year of mining and
amount to $ -16,912,075.
2) The curve of cash flows for the
conducted analysis, after reaching a
positive value grows much slower
and has less value compared to the
curve of cash flows for the solution
provided in the project.
Based on the generated cash flows, the
maximum NPV are calculated and to be
achieved in the following cases:
- NPV obtained by the project design
is 507,621,108 $,
- NPV obtained by the conducted
analysis is 354,763,334 $.
Due to a deviation from the given so-
lution in the project, or the planned min-
ing dynamics, there was a realization of
smaller cash flows in the initial years of
operation and longer mining life of the
open pit, what have also increased the
discounting time that has a significant
reduction in the NPV in the amount of
152,857,774 $ in the end result.
CONCLUSION
Planning every mining operation has the
main goal to achieve the best economic
effects of business in the life time of the
mine. Also, the mining company may want
to simultaneously maximize the NPV, the
life time of the mine and metal content in
the ore, and on the other hand to minimize
the capital expenditures, which is difficult to
achieve. The most common case is that the
main objective of the company is to maxi-
mize the NPV, and that the life time, re-
serves and capital costs are in certain accep-
table limits.
The main value of the conducted analy-
sis is that the real case shows how important
it is the planning in the mining system in
terms of achieving the best business results.
Analysis indicates that any deviation from
the planned solutions in a project can lead
the business to be affected, not only mine,
but also the entire company of RTB Bor
Group.
Analysis has showed that the deviation
from the planned mining dynamics, within
the project defined optimal contour of
the mine, resulting in a reduction the pro-
jected values of the NPV for 30%, or
152,857,774 $.
REFERENCES
[1] E. M. Gershon, An Open - Pit
Production Scheduler: Algorithm and
Implementation, Mining Engineering
39 (1987) 793-796.
[2] A. H. and P. A. Onur Dowd, Open-Pit
Optimization - Part 2: Production
Scheduling and Inclusion of Road-
ways, Transactions of the Institute of
Mining and Metallurgy Section A 102
(1993) A105-A113.
[3] Wang Q., Long - Term Open - Pit
Production Scheduling Through Dyna-
mic Phase - Bench Sequencing, Tran-
sactions of the Institute of Mining and
Metallurgy Section A 105 (1996)
A104-A99.
[4] Whittle J., The Facts and Fallacies of
Open Pit Optimization, Whittle Pro-
gramming Pty., Ltd., North Balwyn,
Victoria, Australia. 1989,
[5] B. Tolwinski and R. Underwood, A
scheduling Algorithm for Open Pit
Mines, IMA Journal of Mathematics
Applied in Business 7 and Industry
(1996) 247-270.
[6] Tolwinski B. and Golosinski T. S.,
1995, Long Term Scheduler Open Pit,
in Proceedings of the International

No. 1-2, 2017 Mining & Metallurgy Engineering Bor 22
Symposium on Mine Planning and
Equipment Selection, p. 256-270.
[7] E. M. Gershon, Mine Scheduling Opti-
mization with Mixed Integer Progra-
mming, Mining Engineering 35 (1983)
351-354.
[8] M. L. Smith, Optimizing Inventory
Stockpiles and Mine Production: An
Application of Separable and Goal
Programming to Phosphate Mining
Using AMPL/CPLEX, CIM Bulletin
92 1030 (1999) 61-64.
[9] L. S. Caccetta and P. Hill, An Appli-
cation of this Branch and Cut Open Pit
Mine Scheduling, Journal of Global
Optimization 27 (2003) 349-365
[10] V. Rafiee, Asghari, O., 2008, A Heuri-
stic Traditional MIP Solving Approach
for Long Term Production Scheduling
and Open Pit Mine, Journal of Applied
Science 8 (24), pp. 4512-4522.
[11] D. Kržanović et all, Supplementary
Mining Project of the Copper Ore Mi-
ning from the Deposit South Mining
District of the Copper Mine Majdan-
pek, Mining and Metallurgy Institute
Bor, 2013 (in Serbian)
[12] Source: Group RTB Bor
[13] D. Kržanović, M. Žikić, R. Pantović:
Important Improvement of Utilization
the Available Geological Reserves of
the South Mining District Deposit
Majdanpek and the New Defined
Optimum Contour of the Open pit
using the Whittle and Gemcom Soft-
ware, Mining Engineering - Mining
Engineering, Mining and Metallurgy
Institute Bor, 2012, pp. 29-36
[14] D. Kržanović, M. Žikić, Z. Vaduves-
ković: Innovated Block Model of the
Copper ore Deposit South Mining
District Majdanpek as a Basis for
Analysis the Optimum Development
of the Open Pit Using the Software
Packages Whittle and Gemcom,
Mining Industry - Mining Engineering,
Mining and Metallurgy Institute Bor,
2011, pp. 69-76
[15] D. Kržanović, R. Rajkovic, M. Mikić,
M. Ljubojev, Analyzing the Possibility
of Increasing Capacity of Copper Ore
Mining at the Open Pit South Mining
District Majdanpek at 11x106 t
Annually, Mining and Metallurgy
Engineering Bor, 3/2015, Mining and
Metallurgy Institute Bor, pp. 73-80.

No. 1-2, 2017 Mining & Metallurgy Engineering Bor 23
MINING AND METALLURGY INSTITUTE BOR ISSN: 2334-8836 (Štampano izdanje)
UDK: 622 ISSN: 2406-1395 (Online)
UDK: 622.271/.33(045)=111 doi:10.5937/mmeb1702023S
Nikola Stanić* Saša Stepanović*, Dejan Bugarin*, Miljan Gomilanović*
SELECTION THE RATIONAL MODEL OF
TRANSPORT TRUCK BY THE SELECTIVE COAL MINING
AT THE OPEN PIT GACKO**
Abstract
This paper gives the selection of the optimal model of trucks for transport of coal, and seam waste at
the OP Gacko in terms of selective exploitation. Mining of coal and seam waste is carried out in two
exploitation zones, the central and roof zone, and the coal and waste transport and disposal is carried
out to the different crushing plants and landfills. Using the software package Talpak, the capacity of a
truck for transport of coal, and seam waste was calculated for different transport routes and types of
trucks. The analysis was done for three types of trucks: Belaz 7555, Belaz 75491 and Belaz 75135. The
results analysis were used for evaluation, ranking and selection the optimal type of truck.
Keywords: truck transport, OP Gacko, transportation costs
* Mining and Metallurgy Institute Bor, e-mail: [email protected]
** This work is derived from the project TR37001 “The Impact of Mining Waste from RTB Bor on the
Pollution of Surrounding Water Systems with the Proposal of Measures and Procedures for Reduc-
tion Harmful Effect on the Environment”, funded by the Ministry of Education, Science and Techno-
logical Development of the Republic of Serbia
INTRODUCTION
Works on coal mining at the open pit
Gacko currently performed by the Main
mining project of the open pit Gacko - Cen-
tral field capacity of 2.3 ∙ 106 t/year of run-
of-mine coal. Mining takes place in two
zones, the roof and central exploitation zone.
Excavation the overburden and inter-
seam waste in the central zone of the open
pit (the zone of exploitation the main and
the first and the second floor of coal seam),
is carried out within the second continuous
BTO system and within the DTO the com-
bined system. Overburden excavated by the
bucket wheel excavator type ER 1250
17/1.5 within the first BTO system is trans-
ported by conveyor belts with a belt width
of 1200 mm and disposed on the West outer
landfill by a spreader Ars 1200 (20 + 50) *
21. In the case of the second BTO system,
the base of excavation equipment includes
a bucket-wheel excavator ER 1250*16/1,
which operates in tandem with a selfpro-
pelled transporter P of 1600*21/50. Dis-
posal is done in the excavated space of the
Field B. In addition to a continuous system
in the excavation of overburden, the hy-
draulic shovel excavators Komatsu PC
2000, Terex RH 90C, D 475 bulldozer
Comatsu in tandem with a loader Komatsu
WA 700 and a combine Wirtgen 2500SM.
Transport of overburden is carried out by
trucks, capacity of 110 t (trucks BELAZ
75135) to the crusher SB are 1525 (DTO
system).

No. 1-2, 2017 Mining & Metallurgy Engineering Bor 24
Coal mining is done applying the tech-
nology of selective mining. The following
hydraulic shower excavators are engaged on
these activities are engaged: Komatsu PC
800, Hyundai R800, and CAT 385B. Re-
moved quantities of coal are transported by
truck 55 t (BELAZ 7555) to the primary
crusher for coal SB 1315, and SB 1515
(DTD system).
TRANSPORTATION SYSTEMS OF
COAL AND SEAM WASTE
Transportation of coal and waste exca-vated in the process of selective coal mining is divided into internal and external. Having in mind, the coal excavation and seam waste takes place in two spatially separate exploi-tation wholes, the central zone and roof zone. In each zone and for different periods of development work, there are the appro-priate schemes of coal and seam waste transport, given in Figures 1 and 2.
Figure 1 Scheme of coal and waste transport in the central zone of exploitation
Figure 2 Scheme of coal and waste in the roof zone of exploitation

No. 1-2, 2017 Mining & Metallurgy Engineering Bor 25
Internal transport of coal is by trucks
and takes place from the excavation site to
the crushing plants for coal.
Internal transport of waste is by truck
in the central zone of exploitation and
takes place from the excavation site to the
crushing plant for waste, or DTO crusher
system. Transport of waste in the roof
zone of exploitation is by truck from the
excavation site to a place of disposal on
the external landfill.
External transport of coal takes place
from the crushing plants to the landfill of the
power plant by belt conveyors, belt width
1200 mm. The external transport of waste
from the central coal series takes place from
the crushing plant for waste to the site of
disposal in ther excavated area of the Field
B. Disposal of waste tailings is carried out
within a disposal of overburden from the
central zone of the open pit, or by a com-
bined system (DTO, crusher-conveyor belt-
stacker). Disposal is done by a stacker type
OS 1600.
CALCULATION THE TRUCK
TRANSPORT
Computer program Talpac was used for
calculation the system excavator - truck used
a computer program Talpac. Based on the
input parameters, a hourly capacity of the
truck was calculated for a particular relation.
Software package Talpak is a simulation
of the loading and transport process at the
open pits. The software optimizes the
transport fleet budget, calculation the tech-
nical and economic parameters of equipment
operation such as a cycle length, capacity,
etc. In the present case, this program was
used to determine the parameters in transport
of various materials (coal and waste) and
from different sites (the central zone and
roof zone of exploitation). The calculation
results are used as the base for the operating
costs of transport.
The organization of work at the open pit
Gacko is 365 days a year, 7 days a week in 3
shifts. Total effective time during the year
amounted to 3,500. Based on these organiza-
tions, following the planned working time
was used for calculation the loading and
transport:
- Total possible number of shifts per year: 1,095 shift/year
- Duration of a shift: 8 h
- Operating hours per year: 8,760 hours
- Effective working hours per shift 5.5 h
- Effective working hours per year 3,500 hours
Presented planned and effective working
hours at the open pit was used in the soft-
ware Talpac for calculation the loading and
transport system. Table 1 shows the input
parameters and loading mechanization used
for calculation. Table 2 shows the input pa-
rameters for the transport mechanization
required for calculation.

No. 1-2, 2017 Mining & Metallurgy Engineering Bor 26
Table 1 Characteristics of loading machinery
Komatsu PC 800
Parameters
Showel volume (m3) 6 Motor power (kW) 363
Speed (km/h) 4.2 No. of revolutions (rpm) 1800
Excavation depth (m) 8.45 Weight (kg) 75200
Medium ground
pressure (N/cm2) 12.2 Length of rig (mm) 7500
Caterpillar width
(mm) 610 Total length (mm) 14405
Width of caterpillar
base (mm) 4110 Height of branch 4690
Length of caterpillar
base (mm) 5810 Cabin height 3670
Shovel width (mm) 2200 Total width 4110
Table 2 Characteristics of transport mechanization
Truck Belaz 7555-55 tons
Hopper capacity (m3) 37.5
Engine power (kW) 522
Capacity (t) 55
Max. speed (km / h) 55
Dump angle (o) 47
Weight (kg) 41000
Total height (mm) 4610
Total width (mm) 5240
Total length (mm) 8890
Price (KM) 800 000
Truck Belaz 75491-80 tons
Hopper capacity (m3) 46
Engine power (kW) 630
Capacity (t) 80
Max. speed (km / h) 50
Dump angle (o) 46
Weight (kg) 72500
Total height (mm) 5350
Total width (mm) 5420
Total length (mm) 10300
Price (KM) 1 300 000
Truck Belaz 75135-110 tons
Hopper capacity (m3) 71.2
Engine power (kW) 895
Capacity (t) 110
Max. speed (km / h) 50
Dump angle (o) 47
Weight (kg) 100100
Total height (mm) 5900
Total width (mm) 6400
Total length (mm) 11500
Price (KM) 1 800 000

No. 1-2, 2017 Mining & Metallurgy Engineering Bor 27
Based on the entered data, the hourly ca-
pacities of the truck were calculated for the
certain relation expressed in čm3/h when
operating in conjunction with the loading
equipment. Based on the amounts that
should be transported into a specific route
and hours of operation, for each zone of
work implementation in the considered pe-
riod of exploitation, the number of required
trucks was calculated. Number of trucks
needed in the corresponding period was
calculated based on the total time required
for truck engagement for the amounts of
coal and seam waste from the individual
work sites, and for the specific transport
lengths. Tables 3, 4 and 5 are give the pa-
rameters of loading and transport system,
calculated in the software package Talpac.
Calculations are made according to the an-
nual periods for the three types of trucks
(Belaz 7555, Belaz 75491, Belaz 55135),
depending on the zone of exploitation (roof
and central zone) and the type of materials
(coal and seam waste).
Table 3 Parameters of transport by the trucks type Belaz 7555
Yea
r
Place
Central
Zone -
Coal
Central
Zone –
seam
waste
Roof
zone -
coal
Roof zone
– seam
waste
Required
number
of trucks
Reserve in
capacity
(%)
20
17
Quantities (čm3) 703,125 175,732 1,077,000 357,712
10 24.50%
Capacity of transp.
truck (čm3/h) 98.8 89.4 69.9 47.8
Required time of
engagement (h) 7,114 1,965 15,401 7,484
20
18
Quantities (čm3) 703,125 155,418 1,077,000 521,436
11 19.64%
Capacity of transp. truck (čm3/h)
92.5 84.9 66.5 46.7
Required time of
engagement (h) 7,601 1,831 16,203 11,156
20
19
Quantities (čm3) 703,125 94,935 1,077,000 769,835
13 17.72%
Capacity of transp.
truck (čm3/h) 78.3 68.4 55.54 46
Required time of
engagement (h) 8,978 1,389 19,392 16,735
20
20
Quantities (cm3) 703,125 208,438 1,077,000 589,884
14 21.51%
Capacity of transp.
truck (čm3/h) 70.29 62.86 56.16 39.67
Required time of
engagement (h) 10,003 3,316 19,177 14,870

No. 1-2, 2017 Mining & Metallurgy Engineering Bor 28
Table 4 Parameters of transport by trucks type Belaz 75491
Yea
r
Place
Central
Zone -
Coal
Central
Zone –
seam
waste
Roof
zone -
coal
Roof zone
– seam
waste
Required
number
of trucks
Reserve
in
capacity
(%)
20
17
Quantities (čm3) 703,125 175,732 1,077,000 357,712
9 12.00% Capacity of transp.
truck (čm3/h) 109.32 99.25 77.32 59.81
Required time of
engagement (h) 6,430 1,771 13,929 5,981
20
18
Quantities (čm3) 703,125 155,418 1,077,000 521,436
10 9.00%
Capacity of
transp. truck
(čm3/h)
96.22 97.03 72.23 51.99
Required time of
engagement (h) 7,309 1,602 14,912 10,030
20
19
Quantities (čm3) 703,125 94,935 1,077,000 769,835
11 8.40%
Capacity of
transp. truck
(čm3/h)
92.84 89.08 70.53 58.36
Required time of
engagement (h) 7,572 1066 15,270 13,192
20
20
Quantities (cm3) 703,125 208,438 1,077,000 589,884
12 7.80%
Capacity of
transp. truck
(čm3/h)
77.5 58.08 70.34 49.37
Required time of
engagement (h) 9,072 3,581 15,312 11,949

No. 1-2, 2017 Mining & Metallurgy Engineering Bor 29
Table 5 Parameters of transport by trucks type Belaz 75135
Yea
r
Place
Central
Zone -
Coal
Central
Zone –
seam
waste
Roof zone
- coal
Roof zone –
seam waste
Required
number
of trucks
Reserve in
capacity
(%)
20
17
Quantities (čm3) 703,125 175,732 1,077,000 357,712
6 21.25% Capacity of transp.
truck (čm3/h) 120.3 142.3 120.1 96.1
Required time of
engagement (h) 5,844 1,235 8,964 3,721
20
18
Quantities (čm3) 703,125 155,418 1,077,000 521,436
7 27.48% Capacity of transp.
truck (čm3/h) 120.3 109.8 120.2 93.8
Required time of
engagement (h) 5,843 1,415 8,964 5,559
20
19
Quantities (čm3) 703,125 94,935 1,077,000 769,835
7 16.16% Capacity of transp.
truck (čm3/h) 120.2 109.1 119.9 90.4
Required time of
engagement (h) 5,848 870 8,986 8,515
20
20
Quantities (cm3) 703,125 208,438 1,077,000 589,884
7 18.52%
Capacity of transp.
truck (čm3/h) 120 108.9 118.9 86.3
Required time of
engagement (h) 5,858 1,915 9,058 6,835
Based on the determined parameters of
transportation the masses of coal and waste,
the costs of standardized material were cal-
culated. The standardized materials inclu-
ded: fuel (kg/čm3), lubricant (kg/čm
3), an oil
(kg/čm3), tires (pcs.) and spare parts
(kg/čm3), Table 6 gives a summary of the
standardized material costs per year for three
types of trucks. Based on the calculated
standardized costs, the calculation was made
of the total operating costs, and they are
shown in Table 7.

No. 1-2, 2017 Mining & Metallurgy Engineering Bor 30
Table 6 Costs of standardized material per year
Normative costs per year
Type of
truck Years
Unit costs
(KM/čm3)
Unit
costs
(KM/t)
Unit costs
(KM/čm3)
Unit
costs
(KM/t)
Unit costs
(KM/čm3)
Unit
costs
(KM/t)
Unit costs
(KM/čm3)
Unit
costs
(KM/t)
CZ-U* CZ-U CZ-SJ
† CZ-SJ KZ-U
‡ KZ-U KZ-SJ
§ KZ-SJ
Belaz
7555
2017 1.574 0.984 1.721 1.076 2.151 1.344 3.062 1.914
2018 1.669 1.043 1.803 1.127 2.251 1.407 3.130 1.956
2019 1.939 1.212 2.194 1.371 2.660 1.663 3.175 1.984
2020 2.140 1.337 2.371 1.482 2.633 1.646 3.652 2.283
Belaz
75491
2017 1.685 1.053 1.838 1.148 2.308 1.442 2.931 1.832
2018 1.890 1.181 1.875 1.172 2.458 1.536 3.344 2.090
2019 1.952 1.220 2.027 1.267 2.513 1.570 2.999 1.874
2020 2.303 1.439 3.013 1.883 2.519 1.574 3.512 2.195
Belaz
75135
2017 2.381 1.349 2.041 1.156 2.384 1.351 2.935 1.663
2018 2.381 1.349 2.591 1.468 2.383 1.350 3.003 1.701
2019 2.383 1.350 2.607 1.477 2.388 1.353 3.109 1.761
2020 2.386 1.352 2.611 1.479 2.407 1.364 3.248 1.840
Table 7 Operating costs of the different types of trucks
CZ-U CZ-SJ KZ-U KZ-SJ
Tru
ck B
ela
z 7
555
2017 The required quantities (čm
3) 703,125 175,732 1,077,000 357,712
Total (KM) 1,106,892 302,408 2,316,299 1,095,254
2018 The required quantities (čm
3) 703,125 155,418 1,077,000 521,436
Total (KM) 1,173,661 280,143 2,424,814 1,631,945
2019 The required quantities (čm
3) 703,125 94,935 1,077,000 769,835
Total (KM) 1,363,556 208,279 2,865,060 2,443,918
2020 The required quantities (čm
3) 703,125 208,438 1,077,000 589,884
Total (KM) 1,504,519 494,291 2,835,571 2,154,515
Tru
ck B
ela
z 7
549
1
2017 The required quantities (čm
3) 703,125 175,732 1,077,000 357,712
Total (KM) 1,184,685 322,920 2,485,396 1,048,314
2018 The required quantities (čm
3) 703,125 155,418 1,077,000 521,436
Total (KM) 1,328,744 291,486 2,646,879 1,743,859
2019 The required quantities (čm
3) 703,125 94,935 1,077,000 769,835
Total (KM) 1,372,512 192,415 2,706,005 2,308,698
2020 The required quantities (čm
3) 703,125 208,438 1,077,000 589,884
Total (KM) 1,619,129 627,928 2,712,791 2,071,830
Tru
ck B
ela
z 7
513
5
2017 The required quantities (čm
3) 703,125 175,732 1,077,000 357,712
Total (KM) 1,673,999 358,590 2,568,067 1,049,887
2018 The required quantities (čm
3) 703,125 155,418 1,077,000 521,436
Total (KM) 1,673,999 402,728 2,566,091 1,565,642
2019 The required quantities (čm
3) 703,125 94,935 1,077,000 769,835
Total (KM) 1,675,286 247,470 2,572,027 2,393,199
2020 The required quantities (čm
3) 703,125 208,438 1,077,000 589,884
Total (KM) 1,677,867 544,270 2,592,028 1,915,858
* Central Zone - coal,
† Central Zone – seam waste ‡ Roof zone - coal, § Roof zone – seam waste

No. 1-2, 2017 Mining & Metallurgy Engineering Bor 31
CAPITAL AND OPERATING
COSTS OF VARIANT SOLUTIONS
In order to gain a clearer status on the
costs of variant solutions, the calculation of
the capital costs was made. Capital expen-
diture (capex) were calculated as annuity
loans for the purchase of a truck loan. The
loan was calculated for the following condi-
tions: the return period 10 years, interest rate
of 6%. The operating costs (opex) included
the total standardized costs per year in the
areas of exploitation. Table 8 gives the total
values of capital and operating costs. Figure
3 and Figure 4 shows a graph of movement
the capital and operating costs for three
types of trucks.
Table 8 Capital and operating costs (KM)
Type of
truck costs 2017 2018 2019 2020 Σ
Belaz 7555
opex 4,820,853 5,510,564 6,880,814 6,988,895 24,201,126
capex 1,280,000 1,360,000 1,563,200 1,628,800 5,832,000
Belaz 75491
opex 5,041,315 6,010,968 6,579,629 7,031,678 24,663,590
capex 2,402,000 2,009,800 2,139,800 2,262,000 8,813,600
Belaz 75135
opex 5,650,541 6,208,460 6,887,982 6,730,024 25,477,007
capex 1,728,000 1,951,200 1,875,600 2,008,000 7,562,800
Figure 3 Operating costs by type of truck
4,000,000
4,500,000
5,000,000
5,500,000
6,000,000
6,500,000
7,000,000
7,500,000
2017 2018 2019 2020
Op
erat
ing
cost
(K
M)
Opex
Belaz 7555 Belaz 75491 Belaz 75135

No. 1-2, 2017 Mining & Metallurgy Engineering Bor 32
Figure 4 Capital costs by type of truck
TRANSPORT COSTS PER VARIANT
SOLUTIONS
Specific costs of transport according to
the variant embodiments given as a ratio of
the total cost and weight needed to conduct
necessary transported per year periods,
and the values are shown in the diagram in
Fi-gure 5. Cost unit quantity of material is
provided in the HP/m3.
Figure 5 Specific transportation costs KM/m3
1,000,000
1,200,000
1,400,000
1,600,000
1,800,000
2,000,000
2,200,000
2,400,000
2,600,000
2017 2018 2019 2020
Cap
ital
co
sts
(K
M)
Capex
Belaz 7555 Belaz 75491 Belaz 75135
2017 2018 2019 2020
Belaz 7555 2.637 2.796 3.193 3.342
Belaz 75491 3.217 3.264 3.297 3.604
Belaz 75135 3.189 3.321 3.313 3.389
2.000
2.200
2.400
2.600
2.800
3.000
3.200
3.400
3.600
3.800
Specific transportation costs in KM/m3

No. 1-2, 2017 Mining & Metallurgy Engineering Bor 33
Figure 6 shows the specific transport
costs, expressed per meter of transport. The-
se specific costs are given for the medium
annual transport lengths. A medium
transport length per some years is calculated
as a weighted mean of length of transport
route by the amount of material that is
transported.
Figure 6 Costs per meter of transport route
CONCLUSION
Based on the calculated values of the
technical and economic parameters of trans-
port, as the most type of truck is allocated a
truck Belaz 7555 capacity 55 t. The optimal
type of truck can be determined through the
present procedure of analysis, which has to
satisfy the relevant require-ments.
The analysis was required on:
specific ratio the amount of coal and
seam waste in the deposit and defi-
ned level of selection in exploitation;
specific physical and mechanical
properties of coal and seam waste;
specific transport lengths of coal and
seam waste;
specific site within the open pit, if
there are more.
All listed parameters significantly affect
the efficiency of operation the specific truck
model, and a good knowledge of physical
mechanical and structural characteristics of
the work environment and technological
characteristics of excavation equipment
must be to make the final assessment on the
best model of vehicle. When considering
different models of trucks in addition to the
technical operating parameters, such as the
hourly capacity, capacity utilization factor,
time utilization, etc. must be analyzed as
well as the economic parameters of material
transport for a specific model of truck that
would cover both operating and capital
costs.
In this case, the most favorable model
truck is a truck Belaz 7555, which has the
0.0005
0.00055
0.0006
0.00065
0.0007
0.00075
0.0008
4,300 5,200 5,500 5,750
Specific transportation costs in KM/m3/m'
Belaz 7555 Belaz 75491 Belaz 75135

No. 1-2, 2017 Mining & Metallurgy Engineering Bor 34
smallest capacity and the volume of the
crate. This conclusion can be drawn only for
the period under consideration, or for con-
sideration the weighted average duration of
transport. The presented analysis shows that
the increase of transport length, the parame-
ters on the basis of which the asse-ssment of
the transportation economy change in favor
of the vehicles with a higher load-carrying
capacity and volume of crates. The limit of
application in relation to the other model of
vehicle, in this particular case is the model
7555 Belaz up to 6 kilometers, while in the
longer distances better para-meters can be
expected in the application a truck Belaz
75135.
The question of selecting the optimal
type of truck in selective exploitation must
be solved through a complex analysis for
each specific case. This derives from the
specificity of transport in selective exploit-
tation considering that the same type of
truck is used for transport of waste and
transport of useful minerals. Also, the analy-
sis must include a longer period of time in
order to take into account the changeable
conditions of exploitation in the real space of
the open pit and real-time of exploitation.
REFERENCES
[1] Strategy of Mining-Technological
Opening, Development, Optimization
And Maintenance of The Continuity of
Production of The Coal With Intro-
duction The Process of Coal Enri-
chment in The Dry Separation OP -
Gacko; MMI Bor, 2015 (in Serbian)
[2] The Main Design of The Open Pit
Mining Gacko - Central Field For The
Capacity of 2.3x10⁶ T/A of Run-of-
Mine Coal, The Defense Project of
The Open Pit Defense Against Water,
MMI Bor D.O.O. Zvornik, Zvornik,
2016 (in Serbian)
[3] Tutorial - Talpac 9.0 Truck Loader &
Productivity Analysis Software, Tuto-
rial - Metric, Runge Limited, Brisbane,
Australia, 2007.
[4] Truck Transport at The Open Pit
Mines, University of Belgrade, Belgra-
de RGF, Ranko Borovic, 1995 (in
Serbian)
[5] Calculation of transport Means,
University of Belgrade, Belgrade RGF,
Ranko Borovic, 1987 (in Serbian)

No. 1-2, 2017 Mining & Metallurgy Engineering Bor 35
MINING AND METALLURGY INSTITUTE BOR ISSN: 2334-8836 (Štampano izdanje)
UDK: 622 ISSN: 2406-1395 (Online)
UDK: 622.33:628.3(045)=111 doi:10.5937/mmeb1702035M
Miomir Mikić*, Milenko Jovanović*, Ivana Jovanović*, Sanja Petrović*
IMPACT OF DRILLING IN THE OPEN PIT MINING ON
THE ENVIRONMENT**
Abstract
In order to provide better and easier loading of useful component and overburden, the drilling
and blasting belong to the important work operations at the open pits. Borehole drilling represents a
source of harmful respirable mineral dust beside the applied measures for its prevention at the place
of creation. Dust emissions during borehole drilling depends on a method and speed of drilling,
borehole diameter, mechanical rock properties and applied method to capture dust in order to sup-
press the dust concentration in the working and living environment of the open pit.
Keywords: drilling, dust, environment
* Mining and Metallurgy Institute Bor
** This work is the result of the Project No. TR33021 “Research and Monitoring the Changes of the
Stress Strain State in the Rock Mass "In-Situ" around the Underground Rooms with Development of
Models with Special Reference to the Tunnel of the Krivelj River and Pit Bor", funded by the Minis-
try of Education, Science and Technological Development of the Republic of Serbia
1 INTRODUCTION
Air is a very important part for the exist-
ence of human and other living orga-nisms.
The main sources of air pollution can be
broadly categorized in natural as well as in
anthropogenic emissions (Tofan Kumar
Rout et al., 2014). Natural emissions are not
yet under human control, with the air pollu-
tion control technologies being implemented
to suppress the human emissions (Tofan
Kumar Rout et al., 2014). The main anthro-
pogenic sources of the air pollution are in-
dustry (thermal power plants, refineries,
open pits, etc.), traffic and home (domestic)
emissions. Between these various sources of
the air pollution, mining is the main source
of dust pollution (Ghose and Majee, 2000).
The coal open pits use a large-scale
mechanization and in their work a large
amount of dust and gases is realized, which
negatively affect the human health (Dhar,
1994). Various mining processes that release
a large amount of dust, especially at the
open pits, are: removal of overburden, re-
moval of waste, mining and drilling opera-
tions, coal mining, transport of useful com-
ponents or waste on transport routes, operat-
ing of crushing plants, etc. The rate of dust
drop and its chemical composition are need-
ed in quantitative and qualitative frame-
works to the dust pollution in a particular
region. Managing dust from the mine is im-
portant because it can affect local and re-
gional air quality and negatively affects the
local community and present a risk to public
health (Pandey et al., 2008).
2 DRILLING
Drilling of boreholes in a useful compo-
nent or accompanying rocks represents the
main and permanent source of very stable
and highly dispersed systems of floating,
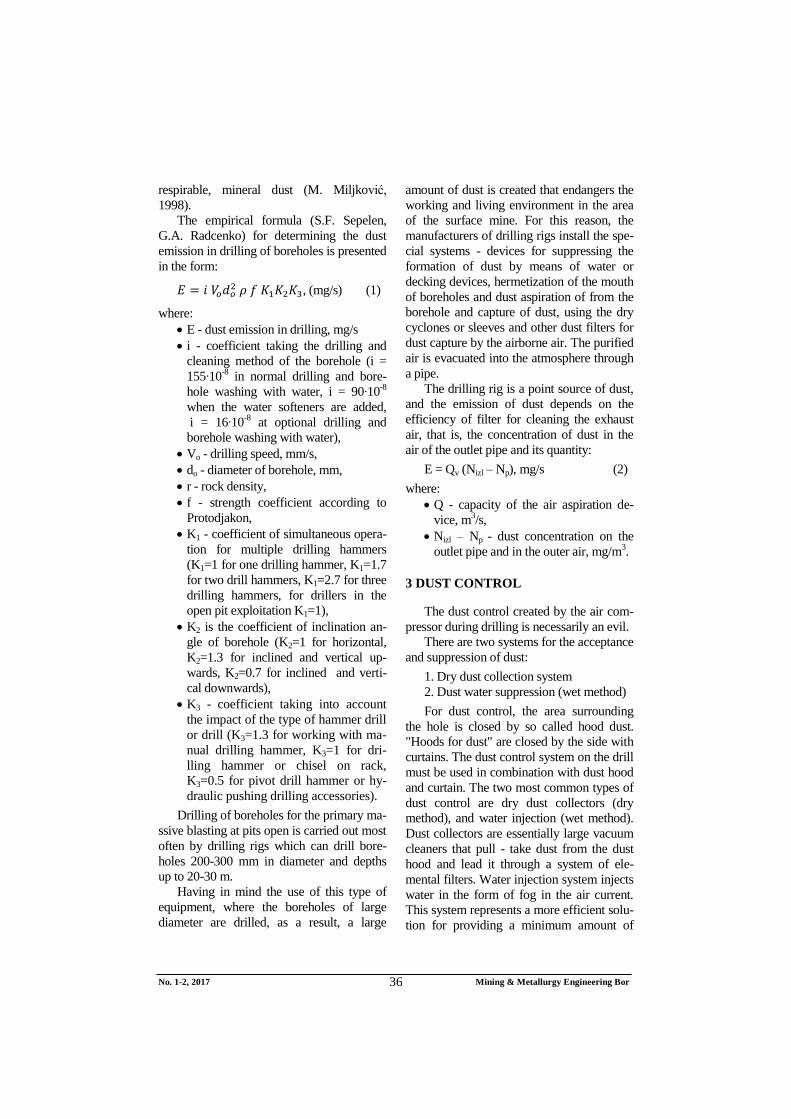
No. 1-2, 2017 Mining & Metallurgy Engineering Bor 36
respirable, mineral dust (M. Miljković,
1998).
The empirical formula (S.F. Sepelen,
G.A. Radcenko) for determining the dust
emission in drilling of boreholes is presented
in the form:
, (mg/s) (1)
where:
E - dust emission in drilling, mg/s
i - coefficient taking the drilling and
cleaning method of the borehole (i =
155∙10-8 in normal drilling and bore-
hole washing with water, i = 90∙10-8
when the water softeners are added,
i = 16∙10-8
at optional drilling and
borehole washing with water),
Vo - drilling speed, mm/s,
do - diameter of borehole, mm,
r - rock density,
f - strength coefficient according to
Protodjakon,
K1 - coefficient of simultaneous opera-
tion for multiple drilling hammers
(K1=1 for one drilling hammer, K1=1.7
for two drill hammers, K1=2.7 for three
drilling hammers, for drillers in the
open pit exploitation K1=1),
K2 is the coefficient of inclination an-
gle of borehole (K2=1 for horizontal,
K2=1.3 for inclined and vertical up-
wards, K2=0.7 for inclined and verti-
cal downwards),
K3 - coefficient taking into account
the impact of the type of hammer drill
or drill (K3=1.3 for working with ma-
nual drilling hammer, K3=1 for dri-
lling hammer or chisel on rack,
K3=0.5 for pivot drill hammer or hy-
draulic pushing drilling accessories).
Drilling of boreholes for the primary ma-
ssive blasting at pits open is carried out most
often by drilling rigs which can drill bore-
holes 200-300 mm in diameter and depths
up to 20-30 m.
Having in mind the use of this type of
equipment, where the boreholes of large
diameter are drilled, as a result, a large
amount of dust is created that endangers the
working and living environment in the area
of the surface mine. For this reason, the
manufacturers of drilling rigs install the spe-
cial systems - devices for suppressing the
formation of dust by means of water or
decking devices, hermetization of the mouth
of boreholes and dust aspiration of from the
borehole and capture of dust, using the dry
cyclones or sleeves and other dust filters for
dust capture by the airborne air. The purified
air is evacuated into the atmosphere through
a pipe.
The drilling rig is a point source of dust,
and the emission of dust depends on the
efficiency of filter for cleaning the exhaust
air, that is, the concentration of dust in the
air of the outlet pipe and its quantity:
E = Qv (Nizl – Np), mg/s (2)
where:
Q - capacity of the air aspiration de-
vice, m3/s,
Nizl – Np - dust concentration on the
outlet pipe and in the outer air, mg/m3.
3 DUST CONTROL
The dust control created by the air com-
pressor during drilling is necessarily an evil.
There are two systems for the acceptance
and suppression of dust:
1. Dry dust collection system
2. Dust water suppression (wet method)
For dust control, the area surrounding
the hole is closed by so called hood dust.
"Hoods for dust" are closed by the side with
curtains. The dust control system on the drill
must be used in combination with dust hood
and curtain. The two most common types of
dust control are dry dust collectors (dry
method), and water injection (wet method).
Dust collectors are essentially large vacuum
cleaners that pull - take dust from the dust
hood and lead it through a system of ele-
mental filters. Water injection system injects
water in the form of fog in the air current.
This system represents a more efficient solu-
tion for providing a minimum amount of
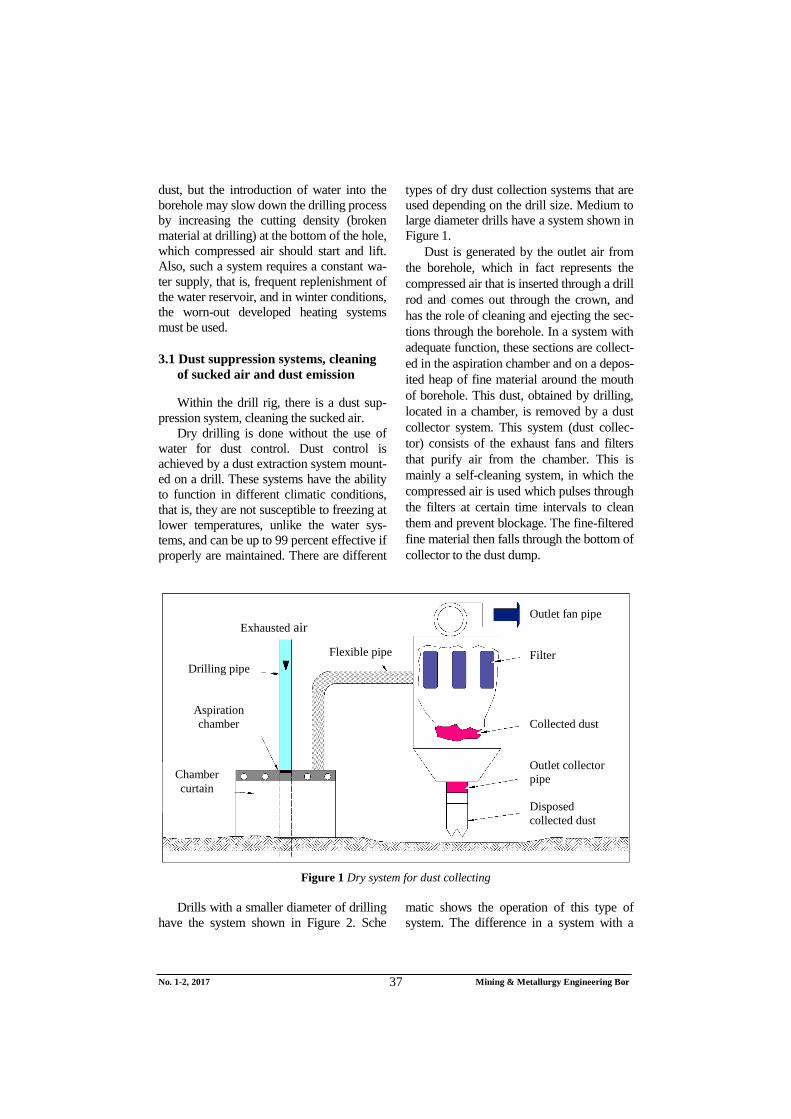
No. 1-2, 2017 Mining & Metallurgy Engineering Bor 37
dust, but the introduction of water into the
borehole may slow down the drilling process
by increasing the cutting density (broken
material at drilling) at the bottom of the hole,
which compressed air should start and lift.
Also, such a system requires a constant wa-
ter supply, that is, frequent replenishment of
the water reservoir, and in winter conditions,
the worn-out developed heating systems
must be used.
3.1 Dust suppression systems, cleaning
of sucked air and dust emission
Within the drill rig, there is a dust sup-
pression system, cleaning the sucked air.
Dry drilling is done without the use of
water for dust control. Dust control is
achieved by a dust extraction system mount-
ed on a drill. These systems have the ability
to function in different climatic conditions,
that is, they are not susceptible to freezing at
lower temperatures, unlike the water sys-
tems, and can be up to 99 percent effective if
properly are maintained. There are different
types of dry dust collection systems that are
used depending on the drill size. Medium to
large diameter drills have a system shown in
Figure 1.
Dust is generated by the outlet air from
the borehole, which in fact represents the
compressed air that is inserted through a drill
rod and comes out through the crown, and
has the role of cleaning and ejecting the sec-
tions through the borehole. In a system with
adequate function, these sections are collect-
ed in the aspiration chamber and on a depos-
ited heap of fine material around the mouth
of borehole. This dust, obtained by drilling,
located in a chamber, is removed by a dust
collector system. This system (dust collec-
tor) consists of the exhaust fans and filters
that purify air from the chamber. This is
mainly a self-cleaning system, in which the
compressed air is used which pulses through
the filters at certain time intervals to clean
them and prevent blockage. The fine-filtered
fine material then falls through the bottom of
collector to the dust dump.
Figure 1 Dry system for dust collecting
Drills with a smaller diameter of drilling
have the system shown in Figure 2. Sche
matic shows the operation of this type of
system. The difference in a system with a
Outlet fan pipe
Filter
Collected dust
Outlet collector
pipe
Disposed
collected dust
Flexible pipe
Exhausted air
Drilling pipe
Aspiration
chamber
Chamber
curtain

No. 1-2, 2017 Mining & Metallurgy Engineering Bor 38
larger diameter drill is that this system col-
lects the all materials in the cutting-drilling,
then sends it to a large separation cyclone
located on a drill bit to remove the large
diameter (large granulation) cuts and then
sends the residue to the dust collector on the
back of drill, where dust and fine cuts are
released (small granulation material).
Maintenance a dust collection system is im-
portant for maintenance the effective dust
control on these systems. The two most im-
portant things in maintenance are: the filters
should be replaced before they become
clogged, and the dust release can be signifi-
cant if drilling rods and crowns are not
properly maintained.
Figure 2 Dry system for dust collecting in drills with smaller drilling diameter
The system for dust suppression with
water (wet method) is shown in Figure 3.
The best method for dust control in drill-
ing at the open pits is to use the wet drilling
techniques. Wet drilling injects water to-
gether with air to wash the cuts from the
borehole as shown in Figure 3. Testing has
shown that this technique can provide dust
control with an efficiency of up to 96 per-
cent [USBM 1987]. Water injection re-
quires monitoring by the operator for effec-
tive dust control. The
required amount of water for dust control is
not great. Typical water flow in wet drilling
systems is generally in the range of 0.37 to
7.5 l/min, but this va-ries depending on the
type of drill, geology, and the humidity le-
vel of drilling material. Too little water
leads to a reduction the efficiency of dust
control while too much water leads to the
operational problems with the drill. It is
concluded that the amount of water required
for dust control depends on the type of drill
and drilling material.
Cuts of
larger
granulation
Compressed air passed through
a drilling rod Dust and
fine cuts
Outlet of
clean air
Sealing ring Drilling rod
Drilling bit
Cyclone for separation of cuts Dust filters
Centrifugal fan and driving engine
Back filter with a rinsing modulke

No. 1-2, 2017 Mining & Metallurgy Engineering Bor 39
Figure 3 Wet drilling method
4 EFFICIENCY OF THE WET
METHOD AND DUST
ELIMINATION DURING
DRILLING AT THE OPEN PITS
In order to reduce dust when drilling on
a drill rig, it is mandatory that the dust extra-
ction and purification device of the suction-
ned dust air is in the proper state. A rubber
seal should be installed on the borehole open
for dust suction, which, after filtering the
purified air, is released into atmosphere with
a concentration less than 50 mg/m3.
During the borehole drilling, dust may
fall into the environment if the dusting sys-
tem is not in a function. Borehole drilling
rigs have the installed devices for cleaning
the boreholes from fragments by compre-
ssed air through which the water is added by
the injector.
The scattered water in the form of fog
and fine droplets with dust from the bore-
hole creates agglomerates that compressed
air takes and deposits under a hood with
which the borehole is isolated from the envi-
ronment. The reduction efficiency is reduced
by reduction the amount of water, and
completely is absent if the boreholes are
cleaned only by compressed air (dry dri-
lling).
The efficiency (i) of dust wetting with
water added to the compressed air is 60%
(i = 0.6).
At the drilling machine beside the wet
process, an additional air cleaning method
of dust of less than 10 μm diameter is
applied. The efficiency of controlling the
dust emission of less than 10 μm diameter is
about 80% if the device for dust aspiration
is in the correct state.
The efficiency coefficient of aspiration
and cleaning of air on drilling in the proper
operation of device is:
92,0)1)(1(1 21 i (3)
Dust reduction effect is:
timesN 5,12)1)(1(
1
21
(4)
where:
1 and 2 - coefficients

No. 1-2, 2017 Mining & Metallurgy Engineering Bor 40
5 CONCLUSION
Drilling as a technological phase of ex-ploitation the mineral raw materials at the open pits causes the formation of large quan-tities and concentration of dust. Such a nega-tive effect on the working and living envi-ronment should be controlled by the efficient dust suppression and dust cleaning systems. As the efficiency of these systems is shown as over 90%, and more importan-tly, the total dust concentrations generated by drill-ing can be reduced by 12.5 times.
REFERENCES
[1] Tofan Kumar Rout, Reginald Ebhin Masto, Pratap Kumar Padhy, Joshy George, Lal Chand Ram, Sudip Maity. Dust Fall and Elemental Flux in a Coal Mining Area. Journal of Geochemical Exploration, 144 (2014), 443–455.
[2] Ghose M. K., Majee S. R., Assessment of Dust Generation due to Opencast Coal Mining-an Indian Case Study. Environ. Monit. Assess. 2000, 67, 255-256.
[3] Dhar B. B., 1994. Changing Environ-ment Scenario in Mining Industry. J. Mines Met. Fuel 309–314.
[4] Pandey S.K., Tripathi B.D., Mishra V. K., 2008. Dust deposition in a sub-tropical opencast coalmine area, India. J. Environ. Manag. 86, 132–138.
[5] M. Miljković, Z. Stojković, The Effect of Open Pit Metal Ore Mining on Ecological Factors of the Environment, Monograph, Bor 1998. (in Serbian)
[6] USBM [1987]. Optimizing Dust Con-trol on Surface Coal Mine Drills. By Page SJ. U.S. Department of the Inte-rior, Bureau of Mines Technology News 286.
[7] T. Apostolovski Trujić, M. Mikić, V. Tasić, Air Quality Control in the Area of Environmental Influence, 46
th
International October Conference on Mining and Metallurgy-Proceedings, Serbia, 2014, 545-549.
[8] M. Mikić, D. Kržanović, R. Rajković. Effect of Exploitation at Social
Community, and Other Public Facilities in Zone of Open Pit Južni Revir in Majdanpek, Mining 2012, Privredna Komora Srbije, 397-402 (in Serbian)
[9] M. Mikić, R. Rajković, D. Kržanović. Recultivation of Degraded Area at the Open Pit Južni Revir in Majdanpek, Mining 2012, Privredna Komora Srbije, 491-499 (in Serbian)
[10] R. Rajković, M. Bugarin, V. Marin-ković: Analysis the Stability of the Waste Dump “Oštreljski planir” of the Open Pit “Bor” in a Function of Wate-ring, Mining and Metallurgy Enginee-ring Bor, 3/2013, pp. 57-64 (in Serbian)
[11] M. Ignjatović, S. Ignjatović, M. Nego-vanović, R. Rajković, L. Djurdjevac Ignjatović, D. Ignjatović: Determina-tion of the Final Slope Angle of the Open Pit Mine During Exploitation of Oil Shale from Aleksinac Deposit Du-ring GeoStudio2007 - SLOPE/W prog-ram; TTEM - Technics Technologies Education Management 2011/3; pp. 615 – 621.
[12] M. Ignjatović, R. Rajković, B. Rajko-vić, D. Milanović, M. Popović: Stability Analysis of the Open Pit “Progorelica“ by the Bishop Method and Program Plan Failure Analysis; II International Symposium “Mining 2011“ Mining Presents State and Future Prospects and Sustainable Development; Vrnjačka banja 10 – 13 May 2011; pp. 599 – 603.
[13] R. Lekovski, M. Mikić, D. Kržanović; The Impact of the Flotation Tailing Dumps on the Environment of Bor and Protection Measures, Mining and Metallurgy Engineering Bor, 2/2013, pp. 107-116 (in Serbian)
[14] M. Mikić, D. Kržanović, M. Jovano-vić, M. Maksimović: Review of the Open Mine South Mining District - Majdanpek Impact on the Environment and Protective Measures, Mining and Metallurgy Engineering Bor 3/2015, pp.1-16 (in Serbian)

No. 1-2, 2017 Mining & Metallurgy Engineering Bor 41
MINING AND METALLURGY INSTITUTE BOR ISSN: 2334-8836 (Štampano izdanje)
UDK: 622 ISSN: 2406-1395 (Online)
UDK: 553:519.2(497.11)(045)=111 doi:10.5937/mmeb1702041A
Vladimir Andrić*, Ljubiša Andrić**, Dragan Radulović**
THE EXTRACTION OF AGGREGATES IN SERBIA,
1973 - 2015, A STATISTICAL EXPLORATION***
Abstract
We contribute to the fields of mineral economics, environmental and economic history in two re-
spects: first, we construct a novel time series data set for the levels of aggregates extraction in Serbia
between 1973 and 2015; the second, we estimate a change point ordinary least squares regression to
model the dynamics of aggregates extraction in the aforementioned period. Our cliometric estimates are
in great accordance with the major business cycle facts of the Serbian economy in the last 40 years. The
most important policy implication of our results pertains to the potential slowdown of aggregates ex-
traction from the onset of the Great Recession.
Keywords: aggregates, mineral economics, Serbia, cliometrics, change point regression
* Institute of Economic Sciences, 11000 Belgrade, Serbia, e-mail: [email protected]
** Institute for Technology of Nuclear and other Mineral Raw Materials, 11000 Belgrade, Serbia
*** We wish to express our deepest gratitude to Georgios N. Anastassakis, Professor of National Tech-
nical University of Athens [NTUA], School of Mining, Engineering and Metallurgy, for several con-
structive discussions which led to the writing of this paper. The paper was supported by funds from
the Projects OI 179015, TR 34013 and TR 34006 financed by the Ministry of Education, Science
and Technological Development of Republic of Serbia
1 INTRODUCTION
Aggregates (crushed stone, sand and
gravel) are high bulk, low unit value granu-
lar materials used primarily in the construc-
tion industry. The use of aggregates in con-
struction industry is primarily in the form of
cement, asphalt, mixed and pre-cast concre-
te. They can also represent the end-products
in the form of railroad ballast, armour
stones, filter beds or flux materials. Trans-
portation costs, i.e., the market location, is
the most important factor in determining the
value of aggregates.
Aggregates, as documented by Mene-
gaki and Kaliampakos [15], represent the
biggest branch of mining by production vol-
ume, and the second biggest branch of min-
ing by production value, just after the sector
of fossil fuels. They, hence, represent the
most valuable non-fuel mineral commodity
in the world. In addition, as Menegaki and
Kaliampakos [15] note, their close conection
with the construction industry places them
among the most used materials worldwide,
second only to water. Krausmann et al. [14]
document how the total aggregates extrac-
tion in the XXth century has increased by a
factor of 34.
Aggregates, apart from their importance
for the construction industry, are also impor-
tant from the standpoint of sustainable re-
source management. Bleischwitz and Bahn-
Walkowiak [11] emphasize the environmen-
tal importance of aggregates extraction from
two perspectives: 1) material intensity per-
spective-the relevance of aggregates for in-
creasing resource productivity in the Euro
No. 1-2, 2017 Mining & Metallurgy Engineering Bor 42
pean Union (EU) as a part of the Lisbon
strategy; 2) environmental intensity perspec-
tive-the relevance of aggregates for increa-
sing the eco-efficiency and lowering the
environmental impacts in the EU.
This paper is concerned with the analysis
of aggregates extraction dynamics in Serbia
between 1973 and 2015. T hecliometric es-
timates are in great accordance with the ma-
jor business cycle facts of the Serbian econ-
omy in the last 40 years. The most important
policy implication of our results pertains to
the potential slowdown of aggregates extrac-
tion from the onset of the Great Recession.
We contribute to the fields of mineral
economics, environmental and economic
history in two ways. First, we construct a
novel time series data set for the aggregates
extraction in Serbia between 1973 and 2015.
Bleischwitz and Bahn-Walkowiak [11], as
well as Behrens et al. [9], acknowledge how
the present data are fragmentary, incomplete
and in most instances based on different
definitions and classifications. Second, we
estimate a change point ordinary least squa-
res regression to capture the dynamics of
aggregates extraction in the aforementioned
period. Menegaki and Kaliampakos [15]
analyse the extraction of aggregates in 26
European economies between 1997 and
2006. Their data set mainly deals with the
advanced European economies, while their
empirical estimates are mostly concerned in
detecting the most important explanatory
factors of aggregates extraction, such as
population size, gross domestic product
(GDP) and construction sector value added.
Our approach is somewhat different, since
we present a detailed single country study
from emerging Europe with an emphasis on
a much longer sample span.
The rest of the paper is organized as fol-
lows. Section II provides theoretical back-
ground for our subsequent cliometric esti-
mates. Section III presents our novel time
series data set, as well as the results of our
change point regression model. Section IV
concludes by providing some policy pre
scriptions for the revival of aggregates ex-
traction industry in Serbia.
2 CHANGE POINT REGRESSION
MODEL
We base our cliometric estimates on the following change point ordinary least squares (OLS) regression model with m potential structural breaks ( ):
( ) (II.1)
in which , and
, refers to the intercept coeffi-
cients with property ( ), refers to the linear time trend coeffi-
cients with property ( ) and corresponds to the error term. is a dependent variable, and refers to the
levels of aggregates extraction measured in
000 of cubic meters (m3).
Bai [5] was the first to derive the con-
sistency, rate of convergence and asymptotic
distribution of the OLS estimates of a
change point regression model from equa-
tion (II.1). Building on the work of Bai
(1997), Bai and Perron [6, 7, 8] have pro-
posed two tests of the null hypothesis of no
structural break against an unknown number
of breaks given some upper bound M. The
upper bound M for the number of breaks is
inversely proportional to the size of trim-
ming percentage ϵ, ⁄ , in which h
represents the minimal length of each sub-
regime. The OLS estimates are consistent
even if the disturbances are heterogeneous
across regimes. If the disturbances are auto-
correlated, Bai and Perron [7] specify a
quadratic spectral kernel based heteroscedas-
ticity and autocorrelation consistent (HAC)
covariance matrix using the pre-whitened
disturbances. The kernel bandwidth is de-
termined automatically using the Andrews
AR (1) method.
In summary, Bai and Perron [6, 7, 8]
propose the following algorithm for estima-
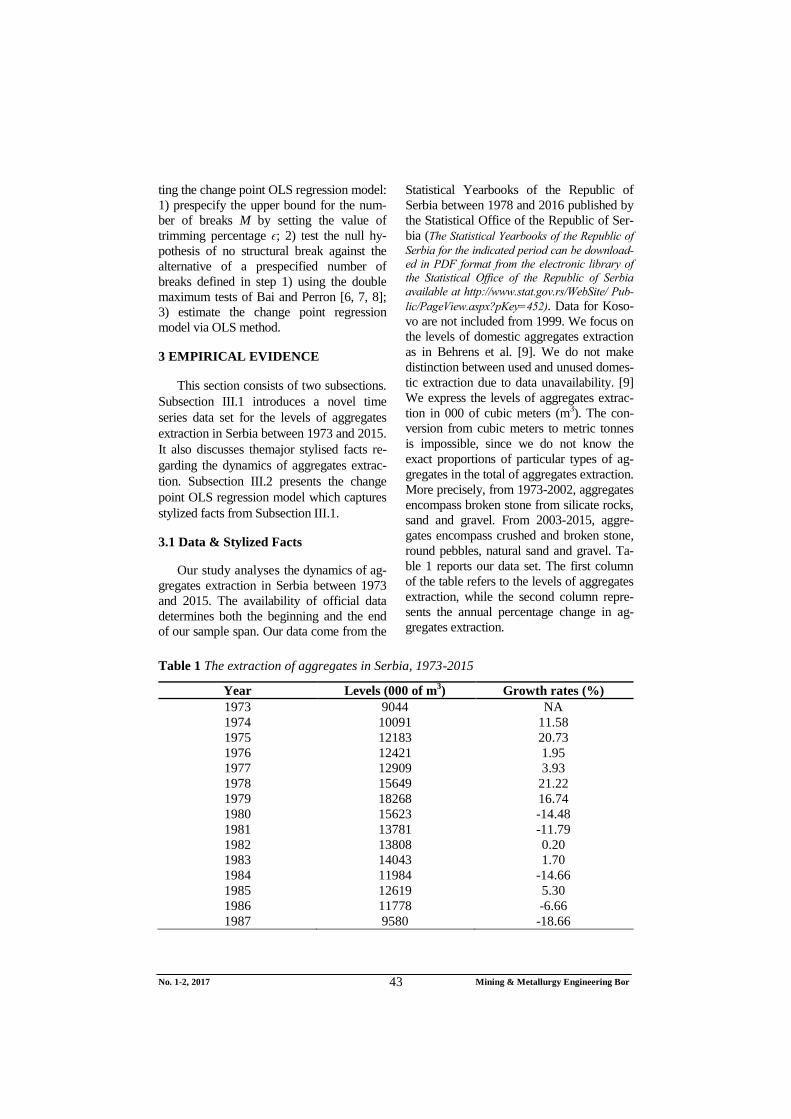
No. 1-2, 2017 Mining & Metallurgy Engineering Bor 43
ting the change point OLS regression model:
1) prespecify the upper bound for the num-
ber of breaks M by setting the value of
trimming percentage ϵ; 2) test the null hy-
pothesis of no structural break against the
alternative of a prespecified number of
breaks defined in step 1) using the double
maximum tests of Bai and Perron [6, 7, 8];
3) estimate the change point regression
model via OLS method.
3 EMPIRICAL EVIDENCE
This section consists of two subsections.
Subsection III.1 introduces a novel time
series data set for the levels of aggregates
extraction in Serbia between 1973 and 2015.
It also discusses themajor stylised facts re-
garding the dynamics of aggregates extrac-
tion. Subsection III.2 presents the change
point OLS regression model which captures
stylized facts from Subsection III.1.
3.1 Data & Stylized Facts
Our study analyses the dynamics of ag-
gregates extraction in Serbia between 1973
and 2015. The availability of official data
determines both the beginning and the end
of our sample span. Our data come from the
Statistical Yearbooks of the Republic of
Serbia between 1978 and 2016 published by
the Statistical Office of the Republic of Ser-
bia (The Statistical Yearbooks of the Republic of
Serbia for the indicated period can be download-
ed in PDF format from the electronic library of
the Statistical Office of the Republic of Serbia
available at http://www.stat.gov.rs/WebSite/ Pub-
lic/PageView.aspx?pKey=452). Data for Koso-
vo are not included from 1999. We focus on
the levels of domestic aggregates extraction
as in Behrens et al. [9]. We do not make
distinction between used and unused domes-
tic extraction due to data unavailability. [9]
We express the levels of aggregates extrac-
tion in 000 of cubic meters (m3). The con-
version from cubic meters to metric tonnes
is impossible, since we do not know the
exact proportions of particular types of ag-
gregates in the total of aggregates extraction.
More precisely, from 1973-2002, aggregates
encompass broken stone from silicate rocks,
sand and gravel. From 2003-2015, aggre-
gates encompass crushed and broken stone,
round pebbles, natural sand and gravel. Ta-
ble 1 reports our data set. The first column
of the table refers to the levels of aggregates
extraction, while the second column repre-
sents the annual percentage change in ag-
gregates extraction.
Table 1 The extraction of aggregates in Serbia, 1973-2015
Year Levels (000 of m3) Growth rates (%)
1973 9044 NA
1974 10091 11.58
1975 12183 20.73
1976 12421 1.95
1977 12909 3.93
1978 15649 21.22
1979 18268 16.74
1980 15623 -14.48
1981 13781 -11.79
1982 13808 0.20
1983 14043 1.70
1984 11984 -14.66
1985 12619 5.30
1986 11778 -6.66
1987 9580 -18.66

No. 1-2, 2017 Mining & Metallurgy Engineering Bor 44
Continuation Table 1
1988 11209 17.00
1989 10702 -4.52
1990 9068 -15.27
1991 7473 -17.59
1992 5593 -25.16
1993 1783 -68.12
1994 1945 9.09
1995 2230 14.65
1996 3467 55.47
1997 2647 -23.65
1998 3302 24.74
1999 2020 -38.82
2000 2684 32.87
2001 1982 -26.15
2002 2088 5.35
2003 6260 199.81
2004 7058 12.75
2005 7556 7.06
2006 8633 14.25
2007 8734 1.17
2008 8667 -0.78
2009 5789 -33.21
2010 6951 20.07
2011 6533 -6.01
2012 6166 -5.62
2013 4590 -25.56
2014 5307 15.62
2015 6142 15.73
Sources: Authors’ calculations and Statistical Yearbooks of the Republic of Serbia 1978-2016.
Table 2 shows the basic descriptive sta-
tistics for the levels and growth rates of ag-
gregates extraction presented in Table 1. The
mean and median represent the measures of
central tendency of the respective empirical
probability distributions, while the standard
deviation quantifies how much, on average,
the data points deviate from the mean. Max-
imum refers to the largest data point, while
minimum refers to the lowest data point
within our sample. Skewness measures the
asymmetry of the empirical probability dis-
tribution from normal probability distribu
tion, while kurtosis is the descriptor of the
shape of empirical probability distribution
which measures the combined weight of
distributions’ tails relative to the rest of the
distribution. JB statistics combines the val-
ues of skewness and kurtosis to test wheth-
er a particular empirical probability distri-
bution is normally distributed. While the
null hypothesis of normal probability dis-
tribution is accepted in the case of levels of
aggregates extraction (p=0.42), the oppo-
site is true for the time series of growth
rates (p=0.00).
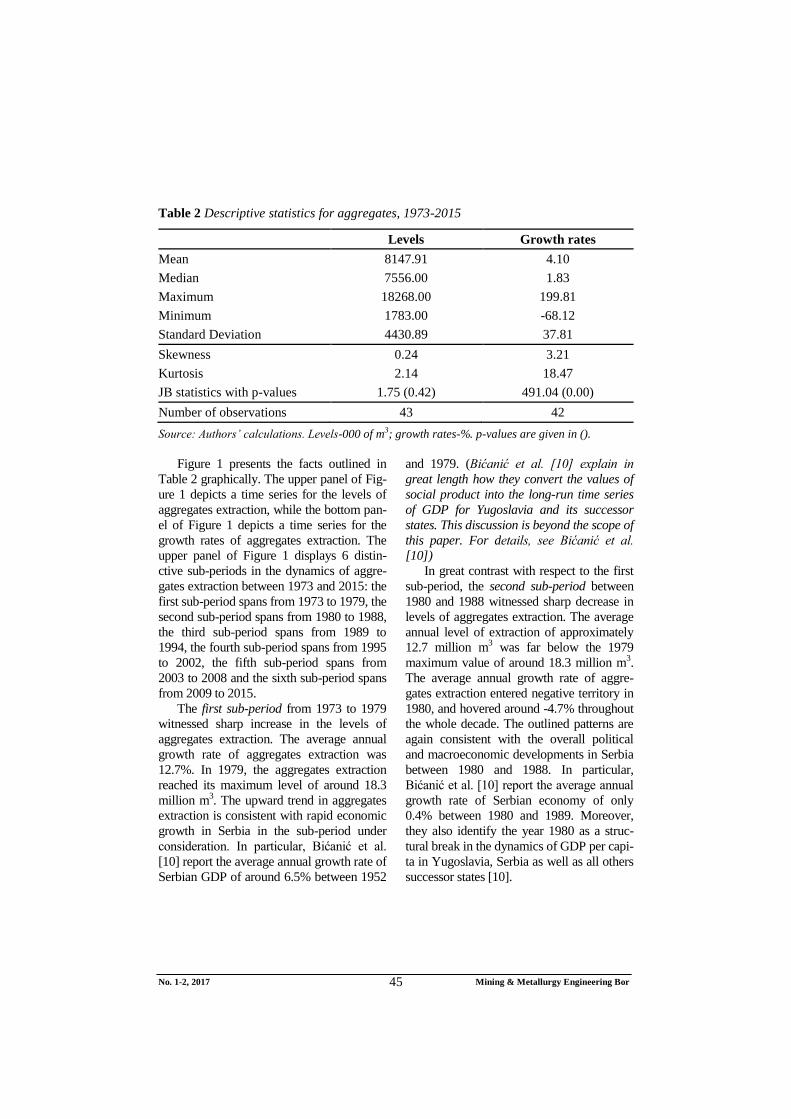
No. 1-2, 2017 Mining & Metallurgy Engineering Bor 45
Table 2 Descriptive statistics for aggregates, 1973-2015
Levels Growth rates
Mean 8147.91 4.10
Median 7556.00 1.83
Maximum 18268.00 199.81
Minimum 1783.00 -68.12
Standard Deviation 4430.89 37.81
Skewness 0.24 3.21
Kurtosis 2.14 18.47
JB statistics with p-values 1.75 (0.42) 491.04 (0.00)
Number of observations 43 42
Source: Authors’ calculations. Levels-000 of m3; growth rates-%. p-values are given in ().
Figure 1 presents the facts outlined in
Table 2 graphically. The upper panel of Fig-
ure 1 depicts a time series for the levels of
aggregates extraction, while the bottom pan-
el of Figure 1 depicts a time series for the
growth rates of aggregates extraction. The
upper panel of Figure 1 displays 6 distin-
ctive sub-periods in the dynamics of aggre-
gates extraction between 1973 and 2015: the
first sub-period spans from 1973 to 1979, the
second sub-period spans from 1980 to 1988,
the third sub-period spans from 1989 to
1994, the fourth sub-period spans from 1995
to 2002, the fifth sub-period spans from
2003 to 2008 and the sixth sub-period spans
from 2009 to 2015.
The first sub-period from 1973 to 1979
witnessed sharp increase in the levels of
aggregates extraction. The average annual
growth rate of aggregates extraction was
12.7%. In 1979, the aggregates extraction
reached its maximum level of around 18.3
million m3. The upward trend in aggregates
extraction is consistent with rapid economic
growth in Serbia in the sub-period under
consideration. In particular, Bićanić et al.
[10] report the average annual growth rate of
Serbian GDP of around 6.5% between 1952
and 1979. (Bićanić et al. [10] explain in
great length how they convert the values of
social product into the long-run time series
of GDP for Yugoslavia and its successor
states. This discussion is beyond the scope of
this paper. For details, see Bićanić et al.
[10])
In great contrast with respect to the first
sub-period, the second sub-period between
1980 and 1988 witnessed sharp decrease in
levels of aggregates extraction. The average
annual level of extraction of approximately
12.7 million m3 was far below the 1979
maximum value of around 18.3 million m3.
The average annual growth rate of aggre-
gates extraction entered negative territory in
1980, and hovered around -4.7% throughout
the whole decade. The outlined patterns are
again consistent with the overall political
and macroeconomic developments in Serbia
between 1980 and 1988. In particular,
Bićanić et al. [10] report the average annual
growth rate of Serbian economy of only
0.4% between 1980 and 1989. Moreover,
they also identify the year 1980 as a struc-
tural break in the dynamics of GDP per capi-
ta in Yugoslavia, Serbia as well as all others
successor states [10].

No. 1-2, 2017 Mining & Metallurgy Engineering Bor 46
0
4,000
8,000
12,000
16,000
20,000
1975 1980 1985 1990 1995 2000 2005 2010 2015
tho
usa
nd
s o
f m3
-100
-50
0
50
100
150
200
250
1975 1980 1985 1990 1995 2000 2005 2010 2015
%
Figure 1 Levels (upper panel) and Growth Rates (bottom panel) of
Aggregates Extraction in Serbia, 1973-2015
The most important political shock was
the institutional power vacuum which
emerged after the death of Josip Broz Tito,
the first and only president of Socialist Fed-
eral Republic of Yugoslavia (SFRY). The
Collective Presidency, which took the con-
trol over SFRY after Tito’s death was unable
to cope with the internal and external imbal-
ances Yugoslav and Serbian economy were
facing at the beginning of the 1980s.
The most important internal imbalance
between 1980 and 1989 was the high cost-
push inflation, which accelerated into a hy-
perinflation in the last quarter of 1989. Pe-
trović and Vujošević [21] identify the public
sector wage hikes as the main culprit behind
the inflationary pressures in Yugoslav econ-
omy in the analyzed sub-period. The de-
mands for higher public-sector wages ste-
mmed from the labour-managed public

No. 1-2, 2017 Mining & Metallurgy Engineering Bor 47
enterprises which were primarily concerned
with the wage maximization and employ-
ment protection (The roots of the labour-
managed, i.e. self-managed, economy lie in
the 1965 economic and social reform. For
details about this reform, and the evaluation
of its impact on overall macroeconomic
performance in Yugoslavia, see Bićanić et
al. [10]). The government then, in order to
prevent potential social unrest, pressed the
state banking system to extend highly subsi-
dized loans at negative real interest rates to
self-managed enterprises. The state banking
sector, hence, monetized a quasi-fiscal defi-
cit of the public enterprise sector violating
the soft-budget constraint of the government. The most important external imbalance
between 1980 and 1989 was the balance of payments and external debt crisis which actually exacerbated already present internal imbalances. Petrović and Vujošević [21] show how the real devaluation of dinar led to a significant pass-through effect to prices, as well as to a decrease in real wages. The drop in real wages, consequently, gave an additional impetus to the demands for higher public-sector wages. The real devaluation of the dinar stemmed from chronic trade bal-ance deficit which emerged in Yugo-slavia after the World War II. The trade balance deficit was a consequence of high absorption gap, since domestic absorption grew more rapidly than domestic production. Higher demand for consumer goods from abroad was the main determinant of absorption gap, since social planners in Yugoslavia were primarily concerned with the production of machinery and investment equipment. High-er demand from abroad was primarily fi-nanced with foreign loans and remittances. When the 1979 oil price shock hit the global economy, the supply of foreign loans dried up due to a world-wide global recession. In addition, central banks from all over the world started pursuing restrictive monetary policies in order to combat oil-induced price increases. Contradictionary monetary poli-cies all around the world led to interest rates hikes, which pushed the costs of foreign
borrowing even further. The maturity struc-ture of foreign loans changed, since inves-tors from abroad were willing to borrow only temporary due to high global economic uncertainty. Since the global borrowing conditions for SFRJ changed, the gove-rnment, under the stand-by arrangement with the IMF, devalued the dinar and intro-duced import quotas to reduce the trade de-ficit as the main culprit behind high external debt. The stabilization program was unsu-ccessful in eliminating the external imba-lances and led to an even deeper recession which spilled over to the construction and aggregates extraction industry.
The third sub-period between 1989 and 1994 witnessed even further deterioration in the levels of aggregates extraction. The av-erage annual level of extraction dropped to only 6 million m
3. In 1993, the annual level
of aggregates extraction reached historical minimum of only 1.8 million m
3. The ave-
rage annual growth rate of aggregates ex-traction fluctuated around -20%, reaching the historical minimum in 1993 of stagge-ring -68%. The devastating developments in the aggregates extraction industry were pri-marily a consequence of Yugoslav wars and international economic embargo. In addi-tion, between 1992 and 1994, Yugoslavia experienced the second-highest and the se-cond-longest hyperinflation in economic history, as documented by Petrović et al. [20]. Petrović et al. [20] state that, as the inflation gained pace, output in Yugoslavia halved leaving no room for any industrial and growth recovery.
The fourth sub-period between 1995 and
2002 witnessed a mild revival of aggregates
extraction in Serbia. The average annual
level of extraction increased above historical
minimum attained in 1993, and oscillated
around 2.6 million m3. The average annual
growth rate of aggregates extraction also
recovered and levelled off around 5%. Un-
fortunately, political and macroeconomic
developments curtailed a more robust reco-
very of Serbian aggregates extraction indus-
try between 1995 and 2002.

No. 1-2, 2017 Mining & Metallurgy Engineering Bor 48
The Kosovo War and the overthrown of
Milošević regime were the main political
shocks that destabilized the economy in
1999 and 2001, respectively. For instance,
the growth rate of aggregates extraction dro-
pped sharply in 1999 to the second lowest
historical value of -39%, while in 2001 it
equalled -26%. Petrović [19] documents th emajor mac-
roeconomic imbalances between 1994 and 2002 which stifled the overall industrial progress, and, hence, the progress of aggre-gates extraction industry. In particular, all nominal magnitudes (M1, base money, wages, inflation and the exchange rate) grew at the average rate between 40-50%. The real money demand, measured as the share of M1 in GDP, was only 6%, indicating how public at large perceived economic policies of the Serbian government. The estimated fiscal deficit was around 10% of GDP, while the tax system was highly distorted with 7 different retail sales tax rates. Approxi-mately 40% of all retail goods and services were kept under direct price control. As a consequence of all aforementioned political and macroeconomic developments, the liv-ing standard during the 1990s decreased by over 50%. The unemployment rate in 2000 was around 30%, while the average net monthly wage was less than 45 euros. Arsić et al. [3] document how 35% of population lived below regional poverty line, and an-other 35% just above the poverty line. Pe-trović [19] finally reports how GDP per cap-ita at the outset of democratic political re-forms in 2001 only slightly exceeded GDP per capita from the second half of the 1980s.
The fifth sub-period between 2003 and
2008 witnessed a sharp recovery of aggre-
gates extraction industry in Serbia. The av-
erage annual level of extraction jumped to
7.8 million m3. The average annual growth
rate of aggregates extraction increased from
its previous sub-period value of 5% to ap-
proximately 39% between 2003 and 2008.
In 2003, the average annual growth rate of
aggregates extraction reached its historical
maximum of 200%, which was related to the
acquisition of three large cement plants by
foreign investors. The sharp revival of Ser-
bian aggregates extraction industry is a di-
rect consequence of macroeconomic re-
forms after the year 2000. The backbone of
macroeconomic stabilization program was
the exchange rate based stabilization which
led to adisinflation and stable currency (For
details see Arsić et al. [3] and Petrović
(2004) [19]). The government also, under
the IMF surveillance, carried out a fiscal
consolidation package of around 5% of GDP
between 2002 and 2005, recording a fiscal
surplus in 2005, as described in Andrić et al.
[1, 2]. The sixth sub-period between 2009 and
2015 witnessed again another decrease in the levels of aggregates extracted. In parti-cular, the average annual level of extraction returned to approximately 6 million m
3, the
average level recorded between 1989 and 1994. The average annual growth rate of aggregates extraction again turned negative and floated around -2.7%, a drop of around 40 percentage points from the average growth rate between 2003 and 2008. In 2009, a year in which the Great Recession hit the Serbian economy, the average annual growth rate of aggregates extraction equalled -33%. After the arrival of the Great Recession to Serbia, the overall economic slowdown affected construction industry and, consequently, spilled over to aggregates extraction industry.
3.2 Results
The time variable in equation (II.1)
serves as a proxy for the combined influence
of all relevant economic factors on aggre-
gates extraction in Serbia between 1973 and
2015. Moore et al. [16] follow a similar ap-
proach when they use linear time trend to
capture the influence of intrasectoral shifts,
material substitution and resource saving
technologies in their study on economic
growth and the demand for construction
materials in the UK and the US between
1960 and 1992 [16]. Nelson and Kang [17]

No. 1-2, 2017 Mining & Metallurgy Engineering Bor 49
explore, however, the errors in regression
models in which time is included as an ex-
planatory variable under the deterministic
trend assumption when in fact the time se-
ries belongs to the class of stochastic trend
processes (If the time series under question
exhibits deterministic time trend, then we
can forecast its value in period t given the
information available in period t-1. On the
other hand, if the time series under question
exhibits stochastic time trend, then we can-
not forecast its value in period t given the
information available in period t-1.) In addi-
tion to inspecting the graph of the series
along with its autocorrelation function, Nel-
son and Kang [17] recommend the use of
formal statistical tests for the nature of parti-
cular time trend (deterministic vs. sto-
chastic).
Following the advice of Nelson and
Kang [17], we first visually inspect the
graph of the series along with its autoco-
rrelation function, and then turn to formal
statistical tests. First, the visual inspection of
Figure 1 points to deterministic segmented
time trend for aggregates extraction in Ser-
bia between 1973 and 2015. Second, the
inspection of autocorrelation function points
to highly persistent temporal dependence,
since the first lag autocorrelation coefficient
equals 0.93. The positive autocorrelation,
however, drops to zero after only 10 years
when it becomes mildly negative. Finally,
Table 3, which summarizes the results of our
formal statistical tests, gives overall support
to the deterministic trend hypothesis. The
table, in particular, shows the results from
tests proposed in Elliott et al. [12], as well as
the results from tests proposed in Ng and
Perron [18]. We detrend the data by the ge-
neralized least squares (GLS), since Eliott et
al. [12] show how GLS detrending yields
power gains for these tests by allowing for a
more precise autoregressive spectral density
estimate that is invariant to the parameters of
the trend function. In addition, we determine
the number of lags in testing regressions in
accordance with the modified Akaike crite-
rion (MAIC) in which we set the maximum
number of lags to 8. (The results are robust
for different values of the maximum number
of lags. They are also robust if we exclude
the time trend from testing regression. All
these findings are available from the authors
upon request). Ng and Perron [18] show
how MAIC leads to size improvements over
standard information criteria since it adapts
to the analyzed sample even if the number of
deterministic components increases.
Table 3 Stochastic trend tests for aggregates, 1973-2015
Tests Statistics Specification Lags Criterion
22.94*** Intercept & Trend 0 MAIC
-4.02 Intercept & Trend 0 MAIC
-1.40 Intercept & Trend 0 MAIC
22.40*** Intercept & Trend 0 MAIC
0.35*** Intercept & Trend 0 MAIC
Notes: *** 1% level significance, ** 5% level significance, * 10% level significance.
Table 4 presents our estimates of the
change point regression model for the period
1973-2015. The model estimates are in great
accordance with major business cycle facts
of the Serbian economy discussed in previ-
ous subsection. The breaks occurred in
1980, 1989, 1995, 2003 and 2009. The cor-
responding trend estimates across breaks
have appropriate size, sign and statistical
significance. The most important policy
implication of our results pertains to the
potential slowdown of aggregates extraction
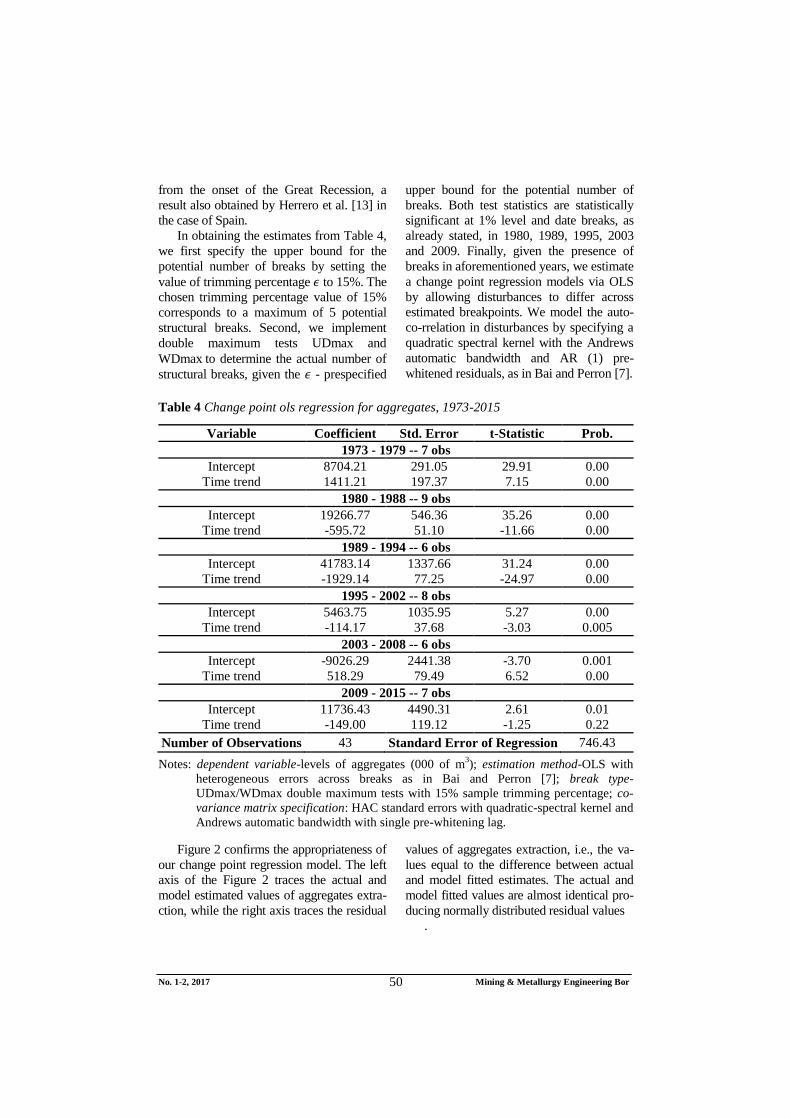
No. 1-2, 2017 Mining & Metallurgy Engineering Bor 50
from the onset of the Great Recession, a
result also obtained by Herrero et al. [13] in
the case of Spain.
In obtaining the estimates from Table 4,
we first specify the upper bound for the
potential number of breaks by setting the
value of trimming percentage to 15%. The
chosen trimming percentage value of 15%
corresponds to a maximum of 5 potential
structural breaks. Second, we implement
double maximum tests UDmax and
WDmax to determine the actual number of
structural breaks, given the - prespecified
upper bound for the potential number of
breaks. Both test statistics are statistically
significant at 1% level and date breaks, as
already stated, in 1980, 1989, 1995, 2003
and 2009. Finally, given the presence of
breaks in aforementioned years, we estimate
a change point regression models via OLS
by allowing disturbances to differ across
estimated breakpoints. We model the auto-
co-rrelation in disturbances by specifying a
quadratic spectral kernel with the Andrews
automatic bandwidth and AR (1) pre-
whitened residuals, as in Bai and Perron [7].
Table 4 Change point ols regression for aggregates, 1973-2015
Variable Coefficient Std. Error t-Statistic Prob.
1973 - 1979 -- 7 obs
Intercept 8704.21 291.05 29.91 0.00
Time trend 1411.21 197.37 7.15 0.00
1980 - 1988 -- 9 obs
Intercept 19266.77 546.36 35.26 0.00
Time trend -595.72 51.10 -11.66 0.00
1989 - 1994 -- 6 obs
Intercept 41783.14 1337.66 31.24 0.00
Time trend -1929.14 77.25 -24.97 0.00
1995 - 2002 -- 8 obs
Intercept 5463.75 1035.95 5.27 0.00
Time trend -114.17 37.68 -3.03 0.005
2003 - 2008 -- 6 obs
Intercept -9026.29 2441.38 -3.70 0.001
Time trend 518.29 79.49 6.52 0.00
2009 - 2015 -- 7 obs
Intercept 11736.43 4490.31 2.61 0.01
Time trend -149.00 119.12 -1.25 0.22
Number of Observations 43 Standard Error of Regression 746.43
Notes: dependent variable-levels of aggregates (000 of m3); estimation method-OLS with
heterogeneous errors across breaks as in Bai and Perron [7]; break type-
UDmax/WDmax double maximum tests with 15% sample trimming percentage; co-
variance matrix specification: HAC standard errors with quadratic-spectral kernel and
Andrews automatic bandwidth with single pre-whitening lag.
Figure 2 confirms the appropriateness of
our change point regression model. The left
axis of the Figure 2 traces the actual and
model estimated values of aggregates extra-
ction, while the right axis traces the residual
values of aggregates extraction, i.e., the va-
lues equal to the difference between actual
and model fitted estimates. The actual and
model fitted values are almost identical pro-
ducing normally distributed residual values
.
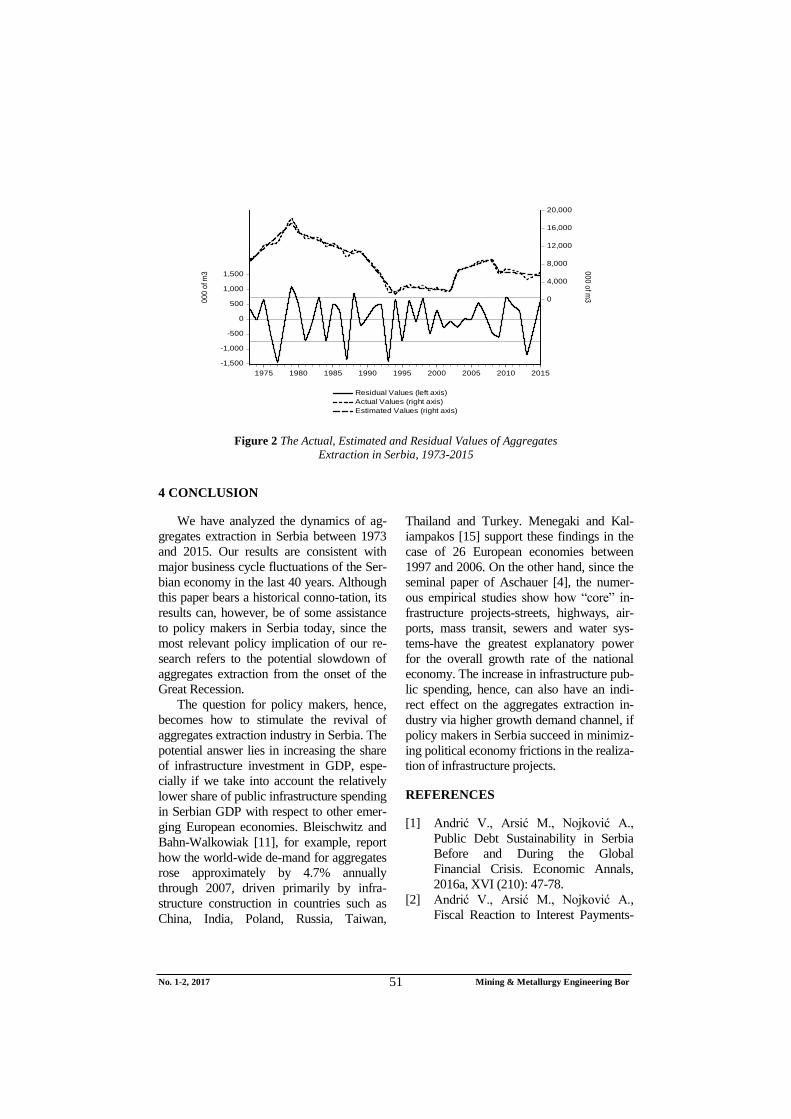
No. 1-2, 2017 Mining & Metallurgy Engineering Bor 51
-1,500
-1,000
-500
0
500
1,000
1,500
0
4,000
8,000
12,000
16,000
20,000
1975 1980 1985 1990 1995 2000 2005 2010 2015
Residual Values (left axis)
Actual Values (right axis)
Estimated Values (right axis)
00
0 o
f m3
00
0 o
f m3
Figure 2 The Actual, Estimated and Residual Values of Aggregates
Extraction in Serbia, 1973-2015
4 CONCLUSION
We have analyzed the dynamics of ag-
gregates extraction in Serbia between 1973
and 2015. Our results are consistent with
major business cycle fluctuations of the Ser-
bian economy in the last 40 years. Although
this paper bears a historical conno-tation, its
results can, however, be of some assistance
to policy makers in Serbia today, since the
most relevant policy implication of our re-
search refers to the potential slowdown of
aggregates extraction from the onset of the
Great Recession.
The question for policy makers, hence,
becomes how to stimulate the revival of
aggregates extraction industry in Serbia. The
potential answer lies in increasing the share
of infrastructure investment in GDP, espe-
cially if we take into account the relatively
lower share of public infrastructure spending
in Serbian GDP with respect to other emer-
ging European economies. Bleischwitz and
Bahn-Walkowiak [11], for example, report
how the world-wide de-mand for aggregates
rose approximately by 4.7% annually
through 2007, driven primarily by infra-
structure construction in countries such as
China, India, Poland, Russia, Taiwan,
Thailand and Turkey. Menegaki and Kal-
iampakos [15] support these findings in the
case of 26 European economies between
1997 and 2006. On the other hand, since the
seminal paper of Aschauer [4], the numer-
ous empirical studies show how “core” in-
frastructure projects-streets, highways, air-
ports, mass transit, sewers and water sys-
tems-have the greatest explanatory power
for the overall growth rate of the national
economy. The increase in infrastructure pub-
lic spending, hence, can also have an indi-
rect effect on the aggregates extraction in-
dustry via higher growth demand channel, if
policy makers in Serbia succeed in minimiz-
ing political economy frictions in the realiza-
tion of infrastructure projects.
REFERENCES
[1] Andrić V., Arsić M., Nojković A.,
Public Debt Sustainability in Serbia
Before and During the Global
Financial Crisis. Economic Annals,
2016a, XVI (210): 47-78.
[2] Andrić V., Arsić M., Nojković A.,
Fiscal Reaction to Interest Payments-

No. 1-2, 2017 Mining & Metallurgy Engineering Bor 52
The Case of Serbia. Industrija, 2016b,
44 (3): 117-144.
[3] Arsić M., Mladenović Z., Petrović P.
(2001) Macroeconomic Stabilization in
the FRY. WIIW Balkan Observatory
Working Paper No. 9, Vienna: The
Vienna Institute for International
Economic Studies.
[4] Aschauer D., Is Public Expenditure
Productive? Journal of Monetary
Economics, 1989, 23 (2): 177-200.
[5] Bai J., Estimation of a Change Point in
Multiple Regression Models. The
Review of Economics and Statistics,
1997, 79 (4): 551-563.
[6] Bai J., Perron P., Estimating and
Testing Linear Models with Multiple
Structural Changes. Econometrica,
1998, 66 (1): 47-78.
[7] Bai J., Perron P., Computation and
Analysis of Multiple Structural Change
Models. Journal of Applied Econo-
metrics, 2003a, 18 (1): 1-22.
[8] Bai J., Perron P., Critical Values for
Multiple Structural Change Tests. Eco-
nometrics Journal, 2003b, 6 (1), 72-78.
[9] Behrens A., Giljum S., Kovanda J.,
Niza S., The Material Basis of the
Global Economy: Worldwide Pa-tterns
of Natural Resource Extraction and
Their Implications for Sustainable
Resource Use Policies. Ecological
Economics, 2007, 64 (2): 444-453.
[10] Bićanić I., Deskar-Škrbić M., Zrnc J.,
A Narrative Explanation of Break
points and Convergence Patterns in
Yugoslavia and its Successor States
1952-2015. WIIW Balkan Observatory
Working Paper No. 122, Vienna: The
Vienna Institute for International
Economic Studies, 2016.
[11] Bleischwitz R., Bahn-Walkowiak B.,
Aggregates and Construction Markets
in Europe: Towards a Sectoral Action
Plan on Sustainable Resource Mana-
gement. Minerals & Energy, 2007, 22
(3-4): 159-176.
[12] Elliott G., Rothenberg T. J., Stock J.
H., Efficient Tests for an Autore-
gressive Unit Root. Econometrica,
1996, 64 (4): 813-836.
[13] Herrero M.J., Escavy J.I., Bustillo M.,
The Spanish Building Crisis and its
Effect in the Gypsum Quarry
Production (1998-2012). Resources
Policy, 2013, 38 (2): 123-129.
[14] Krausmann F., Gingrich S., Eisen-me-
nger N., Erb K-H., Haberl H., Fischer-
Kowalski M., Growth in Global
Materials Use, GDP and Popu-lation
during the 20th Century. Ecolo-gical
Economics, 2009, 68 (10): 2696-2705.
[15] Menegaki M.E., Kaliampakos D.C.,
European Aggregates Production: Dri-
vers, Correlations and Trends. Re-
sources Policy, 2010, 35 (3): 235-244.
[16] Moore D.J., Tilton J.E., Shields D.J.,
Economic Growth and the Demand for
Construction Materials. Resources
Policy, 1996, 22 (3): 197-205.
[17] Nelson C.R., Kang H., Pitfalls in the
Use of Time as an Explanatory
Variable in Regression. Journal of
Business & Economic Statistics, 1984,
2 (1): 73-82.
[18] Ng S., Perron P., Lag Length Selection
and the Construction of Unit Root
Tests with Good Size and Power.
Econometrica, 2001, 69 (6): 1519-1554.
[19] Petrović P., Serbia: Macro-economic
Stabilization and Reform, 2001 to
2003. WIIW Balkan Observa-tory
Working Paper No. 36, Vienna: The
Vienna Institute for International
Economic Studies, 2004.
[20] Petrović P., Bogetić Ž., Vujošević Z.
(1999) The Yugoslav Hyperinflation
of 1992-1994: Causes, Dynamics, and
Money Supply Process. Journal of
Comparative Economics, 27 (2): 335-
353.
[21] Petrović P., Vujošević Z., Monetary
Accommodation in Transition Econo-
mies: Econometric Evidence from
Yugoslavia’s High Inflation in the
1980s. Journal of Development
Economics, 2000, 62 (2): 495-513.

No. 1-2, 2017 Mining & Metallurgy Engineering Bor 53
MINING AND METALLURGY INSTITUTE BOR ISSN: 2334-8836 (Štampano izdanje)
UDK: 622 ISSN: 2406-1395 (Online)
UDK: 331.45:005497.11(045)=111 doi:10.5937/mmeb1702053I
Jelena Ivaz*, Pavle Stojković*, Dejan Petrović*, Vitomir Milić*
THE USE OF DATABASE ON INJURY AT
WORK RECORDS IN SERBIA
Abstract
The risk of an injury at work, occupational disease or damage to the health of employees due to
danger is, lately, the common subject of numerous studies. The appropriate identification of the risks is
the starting point for development the safety and health of the employees in a company. In order to
adequately anticipate the risk based on the statistical data on incidents, e.g. injuries at work, it is ne-
cessary to identify the critical points in the enterprise. It is impossible to start in motion a risk-
management plan without the serious statistics with the elaborately processed data on an injury. Most
companies, conditioned by a strict legal framework in the field of safety and health at work, keep their
records on injuries. However, with development in this domain, the need for a uniform database for all
injuries that occur on the territory of the Republic of Serbia is created. This paper proposes the form,
use and further development of the unified database for injuries at work. The base is modeled after the
existing form of the report on injuries at work, and its possibilities are shown through the example of
injuries that have occurred in the coal mine Bogovina in 2016.
Keywords: database, records, injuries at work
* Technical Faculty Bor, University of Belgrade, Vojske Jugoslavije 12, Bor, Serbia
INTRODUCTION
The direct consequences of the inade-
quate risk management methods in the in-
dustry are: the increased number of injuries
and accidents at work, disabilities and emp-
loyees’ sickness and their absence from
work. The injury occurs as a result of an
uncontrolled event or dangerous situation
that a worker has found himself in. The
injury can be qualified as any mechanical,
physical or chemical damage on the em-
ployee resulting in a disability and causes
physical and mental trauma. [1] The safety
and health protection at work, OH&S, refers
to the control, review of the safety systems
at work and a set of measures aimed at im-
proving the safety of employees. The analy-
sis of the results of an injury can lead to
certain conclusions on the injury cause.
Studying the injuries at work in any area
of industry depends on the quality of input
data from the statistics on injuries at work
that have already occurred. It is important
that this information is processed in a unique
way. A record allowing monitoring the dif-
ferent aspects of injury, such as the number,
type and severity of injury, the injured part
of the body and many more, offers many
possibilities for research. It is necessary to
connect this information to several other
parameters in order to come to a conclusion.
Such an analysis of information is the best
achieved through a database. SQL Server
Management Studio is a free application
from Microsoft, and this software has been
precisely used in this paper to create a data-
base of injuries at work.

No. 1-2, 2017 Mining & Metallurgy Engineering Bor 54
The obtained data processing through
the questionnaires provides conclusions
related to the security of a company, busi-
ness or municipality. The obtained conclu-
sions are essential for improvement the
safety and health of the employees in the
company, as well as for evaluation the safe-
ty measures at the state level. By investment
in such statistics, which would be updated
by the companies, the state would create the
conditions for monitoring the implementa-
tion of the law and regulations, application
the standards and the safety inspection work
in the companies which are essential to the
process. A review of the system by the
competent and responsible persons would
enable OH&S to make decisions, based on
the output data that would level Serbia with
the global trends. Database structure is a complete match
to the Report on the injury at work or Form No. 1, which is filled out by the employer in the case of an accident. As such, it should be available to every employer on the Agency for the Safety and Health at Work website. These data should be also available to the researchers who monitor injuries and risks within the framework of certain activities.
Form No. 1 consists of seven chapters,
each for a different kind of data collected. If
the form is filled out electronically, it is nec-
essary to have a drop-down list for each of
the seven factors. This should be done in
order to prevent the person responsible for
the safety and health at work to fill in the
data randomly and avoid having non-
uniform information due to using a capital
letter, spacing or using letters like č, đ, š, ž
and ć. Of course, the data such as the name
of the injured, the names of the witnesses, a
unique personal identification number and
the name of the person responsible cannot be
uniform. Only the database with data col-
lected this way can be used for further re-
search.
LEGAL REGULATIONS WHICH
REGULATE THE RECORDING OF
INJURIES AT WORK IN SERBIA
Legal basis for keeping the records is al-
ready established by the Act on Safety and
Health at Work (Official Gazette RS,
Nos.101/05 and 91/15), Article 51 says:
“The report on injuries at work, occupa-
tional disease or damage to the health of
employees due to danger which happens at
the place of work, is to be delivered, by the
employer, to the injured or affected by the
disease employee, and to the organizations
responsible for health and pension insur-
ance. The content and method for filling out
the report form, mentioned in paragraph 1
of this Article, is determined by the Minister
of Labour, Employment, and Social Issues
of the Republic of Serbia.
The employer shall, at the request of a
labor inspector or a representative of the
employees, submit a safety report, stating
the health of employee and measures which
have been taken."[3]
The Act on Safety and Health at Work
clearly defines the way of processing the
injury. The Minister of Labor, Employment,
and Social Issues of the Republic of Serbia
issued the Regulations on the content and
methods for filling out and issuing a form
on the injury at work and occupational di-
sease (Official Gazette RS, No.72/2006 and
84/2006 - correction) which states the fo-
llowing forms (Act 5, Paragraph 1):
Form No. 1 THE REPORT OF AN
INJURY AT WORK
Form No. 2 THE REPORT OF AN
OCCUPATIONAL DISEASE.
The employer is obligated to fill in the
form within twenty-four hours of learning
that the injury occurred. [3]
The Regulations stipulates that there
should be five (5) copies of the form prin-
ted/filled out, two copies for the Republic
Health Insurance Fund and three copies for
the employer. [4] The employer is to keep
one copy of the authenticated form, one

No. 1-2, 2017 Mining & Metallurgy Engineering Bor 55
copy is given to the employee, and the third
copy of the form is delivered to the organi-
zation responsible for pension and disability
insurance through the Ministry of Labor,
Employment, and Social Issues- Depart-
ment for Safety and Health at Work.
The main issue is that the most of the
employers do not deliver the form to the
Department for Safety and Health at Work,
instead, it is directly sent to the organiza-
tion responsible for pension and disability
insurance, thus, the processing of the data
and drawing of the conclusions about the
safety in the field of injuries are prevented.
The Department for Safety and Health at
Work has initiated a project to form The
Registry of the injuries at work, but the
data are still unavailable.
Presently, the Republic Health Insu-
rance Fund has recorded and has access to
the information related to the total number
of injuries and gender of the injured emp-
loyees, which is unusable from the point
of studying the safety for the most of ac-
tivities.
CREATING A DATABASE
ACCORDING TO THE REPORT
ON INJURY AT WORK IN THE
REPUBLIC OF SERBIA
The form THE REPORT OF AN IN-
JURY AT WORK was used as a starting
point for creating database because it con-
tains data necessary for the appropriate pro-
cessing of injuries. Based on the form that
was formulated in the Regulations on the
content and method of issuing the report of
injury at work, and occupational disease
forms, the database that fully matches the
look of the REPORT OF AN INJURY AT
WORK is created. After filling in the form
by the OH&S service in the company,
where the incident happened, the user can
print it or send it for further processing. All
data entered in the report are signed a
unique ID number, and they are saved in the
database for further analysis. Filling in this
form is, certainly, the employer’s obligation
in order to fulfill the legal procedure, and
cannot be considered as an additional re-
quirement regarding the database. The data-
base has an option for further data pro-
cessing in the category- injuries at work are
not adequate for the injuries occurring out-
side this category, e.g. transport or agricul-
ture. Such injuries should be processed in
the Registry of injuries.
In order to ease the data entry, an appli-
cation with the appropriate user interface
should be created. The overall idea is to
create the so called drop-down columns
wherever that is possible, so the user could
choose only one indicator, e.g. a code, reg-
istry number, street or a city. All the injury
data would be uniformed by that way.
This is particularly applied to the por-
tion of the form which contains the pre-
scribed codes for identifying the causes and
sources of injuries given in the Records and
notifications of occupational injuries and
occupational diseases determined by the
International Labor Organization (aka. The
ILO), the part of the form which contains
the Code of Practice, as well as the part of
the form which is supposed to be filled by a
doctor and refers to the classification of
violations according to the code diseases
ICD 10. [6]
It is necessary to clearly define the ques-
tionnaire so the user of database cannot, for
example, mark finger or upper arm, because
in the drop-down column there is only "up-
per extremities" as an option. The data base
Injury_at_Work is designed as part of the
tool for the study of the injuries in the min-
ing industry by a person in charge of this
area in an organization and it also requires
an addition of queries which are not set in
the Report of an injury at work. It is, espe-
cially, necessary to separate injuries of
workers engaged directly in the production
process from those which are not, and ena-
ble the option which clearly connects wor-
ker with the production process. However,
the topic of this paper is formulation, dis

No. 1-2, 2017 Mining & Metallurgy Engineering Bor 56
play and analysis of desired data from the
existing Report of an injury at work, and the
possibility of use these records for as many
as possible agencies in Serbia, and the data-
base was designed carrying such a concept
in mind. Still, each industry can add its own
queries for the purposes of their analysis.
Figure 1 shows the database of injuries
at work diagram. There are seven entities in
the database: Injured, Employer, Eyewit-
ness, Manager, Injury, Workplace and Doc-
tor’s findings. Those entities represent the
integral part of the Form No. 1, and contain
columns that match the required items in a
specified form. In addition to these co-
lumns, each entity or a table contains the
so-called primary key, or the primary col-
umn (injured ID or employer ID) with the
automatically generating unique number
that identifies each row in the column or, in
other words, each group of data related to
the specific victim. All groups of data are
related to a specific injured person, so the
table Injured represents the main entity or
the main column. The problem of linking
the groups of data between tables is solved
by introduction a column with a foreign
key constraint. The foreign key can be
found in all tables except in the main table.
As table Injured is the main table, the pri-
mary key of table Injured – injured ID is set
as a foreign key for the rest of tables.
Figure 1 Database of injuries at work - table diagram with their interrelations

No. 1-2, 2017 Mining & Metallurgy Engineering Bor 57
The data of injured workers are entered
directly into the SQL Server Management
Studio database table to the requirements of
each individual column. The improvement
of model will lead to development the user
interface where all data on injured worker
will be entered according to the Report of
an injury at work.
POSSIBILITIES OF SEARCHING
THE DATABASE
Injuries at Work Database was created
in the way that each table represents one set
of data from the form, for example, a group
of data on employer is a table in the data-
base that is linked to other tables. Figure 2
shows the basic table, Injured table which
generates the ID number (injured ID) for
each of the injury that occurs.
Figure 2 The table Injured in SQL Server Management Studio
The table Injured contains basic infor-
mation about the injured worker: name and
surname, personal identity number, address,
job title, gender, qualification and other.
To make a more vivid picture of possi-
bilities for searching the database Injury at
work, the Reports of an injury at work from
the coal mine Bogovina in 2016 were en-
tered into database. [8]
SQL (structured query language) is used
for searching the database, i.e. relational
query language which offers the possibility
for different results, for example, how many
injuries occurred in the coal mine Bogovina
in 2016 that are specified according to:
The qualification of the injured wor-
kers,
Cause of the injury 21- landslides and
caving of earth, rocks and stones [5],
The severity of the injury.
Figure 3 presents the result of men-
tioned request that shows that ten injuries,
caused by the caving of material occurred,
which is a high percentage considering that
in that year the total of 21 injuries hap-
pened. Only one of those injuries was de-
scribed as severe injury, while the remain-
ing nine were evaluated by doctors as the
minor injuries. After studying the first
column in Figure 3, it can be concluded
that the production workers employed
directly at the site are prone to this type of
the injury.

No. 1-2, 2017 Mining & Metallurgy Engineering Bor 58
Figure 3 View from database according to the query:
the qualification of injured workers, cause of injury 21 and severity of injury
If the condition that the severity of in-
jury should be high and caused by 21 is
added to the existing requirement, the re-
sults will be as shown in Figure 4. The
database shows that injury occurred on 3
March 2016 (Monday) at 10.30 am at the
OT4 site, Jama "East Field", Bogovina
and that the injured worker was taken to
ER in Zajecar where he received the S42
diagnosis - fracture of a shoulder and up-
per arm (Fractura regionis deltoideae et
brachi). [6]
Figure 4 The result of execution the query for closer determination of
severe injury by criteria 21
Overview, which is especially interesting
in light of studying the injuries at work in
the mining industry, is linked to description
of injury and location of injury. Figure 5
shows table or query result, which shows the
two above-mentioned parameters. It is clear
that the majority of injuries occurred in the
pit during cleaning the material and support
construction at the site (nine injuries),
movement of workers (four injuries) and
during transport of intermediate goods (five
injuries). Other injuries are located outside
the pit or they are less interesting due to their
frequency and response of the OS&H.

No. 1-2, 2017 Mining & Metallurgy Engineering Bor 59
Figure 5 View from database according to the query relating to the description of
the injury and location of the injury
Based on the data, it can be concluded
that the coal mine Bogovina must conduct
the additional training and introduce better
security measures that would increase the
safety in movement of workers in the pit
during cleaning the working site because
most of injuries occur at these job posi-
tions.
Figure 6 shows an overview of the table
base on the next requirements: the type and
qualification of injured, the source of injury
531 and the minor injury. Source of the
injury 531 is, according to the Records and
notifications of injuries at work, a code for
an injury that occurred due to the block
caving in an underground facility (tunnel,
mine and other). [5] This is the most com-
mon source of injury in the mining industry
that often results in serious and fatal injuries
of workers, and is a direct result of irregu-
larities of the safety and support in corri-
dors. The analysis shows that ten out of
twenty-one injuries in the coal mine Bo-
govina are caused by caving (Figure 3),
seven injuries are caused by block caving,
and the three remaining are the consequence
of caving at the work site. Caving at the
work site during the construction of under-
ground facilities is unpredictable and cannot
be easily influenced.
Figure 6 View from database according to the query relating to the type and qualification of
injured, source of the injury 531 and the minor injury

No. 1-2, 2017 Mining & Metallurgy Engineering Bor 60
The worker’s age are always interesting
for studying, primarily due to a decline of
labor and physical abilities of worker com-
pared to the younger workers without
enough experience. By comparison of these
two categories, a conclusion can be made
concerning the quality of training the wor-
kers at the beginning of their career. Table
in Figure 7 shows that the most of workers
belong to a group older than 35 (90%),
while only two workers were "young", that
is to say, younger than 35.
Figure 7 View from database according to the query: the type and qualification of injured,
age, description of injury and severity of injury
However, if the following table (Figure
8) is considered as it shows the column
Work experience of the injured, it can be
concluded that even if the worker is experi-
enced according to his age, his work expe-
rience suggests otherwise. Only five wor-
kers have an extensive work experience for
over 20 years, two of them have over ten
years, and other thirteen have five years of
experience or less. This indicates that these
workers are inexperienced and poorly
trained for the work they perform, and due
to this fact they are injured in such a large
number. This phenomenon can be also ex-
plained by the prohibition of employment
in the public sector, in which the Coal mine
Bogovina belongs to. The workers are
placed at jobs where their abilities do not
match the requirements, but due to a lack of
adequate personnel, they are provided with
adequate re-training and internal qualifica-
tion where they have to master the new
skills in a relatively short period of time.
Figure 8 shows that the most of inju-
ries occurred in the morning, 15 of them,
which was expected since the mine oper-
ates in two shifts, but the biggest number
of workers works the first shift, such as
maintenance workers, and supervisory
technical staff.
This paper provides an example of ac-
cessible database that would facilitate the
job of data updating on injuries for Serbia
in companies, and would support the regi-

No. 1-2, 2017 Mining & Metallurgy Engineering Bor 61
ster creation. There are no reports from
the previous period in the Safety Mana-
gement Bureau. This provides an oppor-
tunity to the companies to translate the
printed reports into digital reports within
database, and in that way to help the Safe-
ty Management Bureau with data updating
from the previous period.
Figure 8 View from database according to the query: performed work at the moment of injury,
work experience at injured job, location of injury and time of the day of injury occurrence
Combining the all data in a single da-
tabase will provide a clear picture of secu-
rity situation of the safety at work in Ser-
bia. In the event that data are implemented
in the Register of an injury, a clear cost of
an injury at work will be available using
data from the Health Fund.
CONCLUSION
Any injury that occurs, however bi-
zarre, carries a message to the employer
and management of the Safety and Health
Protection Management Bureau of the
Republic of Serbia. Ignoring these events,
such as, for example, a frequent minor fin-
ger injury on a machine can be easy, but, in
the worst case scenario, it can result in a
fatal outcome, varying degrees of disability
and, almost always, in disruption the produc-
tion process, or in additional costs for the
state or company. Although death seems like
an exaggeration, in the underground mining
of mineral raw materials, the miners get hurt
on the drive drum conveyor belt which first
pulls in a finger, than a hand, and then the
whole body of a victim.
Database allows the generation a large
amount of data in a very simple manner,
and without additional hiring or cost to the
employer. A disposal of this kind of data
allows better access to the evaluation and
implementation the laws, regulations and
standards. Also, the advantage of this kind
of data available is ability to identify the
vulnerable groups of interest. Injuries are
typically grouped around a certain accident
situation which happened multiple times.

No. 1-2, 2017 Mining & Metallurgy Engineering Bor 62
Any company that has a way of recording
such injuries can easily study the risk fac-
tors at any time, new needs in the produc-
tion process, the need for change in the act
on risk assessment, new trainings, and
enhanced control and so on.
Direction of further development and
additions to this base would be in a direc-
tion of adjustment to certain jobs, and sup-
plement to the database, related to the ab-
sence from work, for example, the cost of
absence and treatment of workers, length of
disability of the injured, course and out-
come of recovery, and possible degree of
disability as well as development the appli-
cation for easier database manipulation on
injuries at work.
REFERENCES
[1] V. Jovičić, M. Miljković, J. Nujić,
H. Uljić, M. Vukić: Certainty and
Technical Security in Mining, Tuzla
1987 (in Serbian)
[2] R. Maneger: Databases - Script,
Adjusted First Edition, Zagreb 2008;
[3] Act on Safety and Health at Work
(Official Gazette RS, Nos.101/05 and
91/15), (in Serbian)
[4] Regulations on Content and Methods
for Filling out and Issuing a Form on
Injury at Work and Occupational
Disease (Official Gazette RS, Nos.
72/2006 and 84/2006-correction), (in
Serbian)
[5] Records and Notifications of Occupa-
tional Injuries and Occupational Disea-
ses Determined by the International
Labour Organization (aka. The ILO);
[6] Classification of Violations According
to Code Diseases ICD 10;
[7] Report on Injuries at Work in the Coal
Mine Bogovina in 2016 (in Serbian)

No. 1-2, 2017 Mining & Metallurgy Engineering Bor 63
MINING AND METALLURGY INSTITUTE BOR ISSN: 2334-8836 (Štampano izdanje)
UDK: 622 ISSN: 2406-1395 (Online)
UDK: 622.271:621.967(045)=111 doi:10.5937/mmeb1702063R
Branislav Rajković*, Zoran Ilić*, Radmilo Rajković*
DRIVING POWER VERIFICATION OF
THE APRON FEEDER FOR ORE TRANSPORTATION
Abstract
This paper gives the methodology for driving power calculation of an apron feeder for ore transpor-
tation on the example of the apron feeder DO-F in the open pit of the Copper Mine Majdanpek. The
analysis was done by calculation for given operating parameters. The apron feeder layout is also pre-
sented, as well as the technical characteristics of the driving unit elements.
Keywords: apron feeder, power calculation, layout, technical characteristics
* Mining and Metallurgy Institute Bor, [email protected]
1 INTRODUCTION
Within the Complementary Mining Pro-
ject on copper ore mining from the South
Mining District deposit in the Copper Mine
Majdanpek, which predicted an increase in
capacity of ore mining and processing to
8.5 Mt per year, it was necessary to make
the project documentation for verification
the capacities of transportation systems for
ore and overburden in the new operating
conditions. Technical Project on reconstruc-
tion the transportation systems for ore [1]
included the apron feeder DO-F, designed
for ore transportation from the open oresto-
rage for ore under the belt conveyor C1 to
the loading portion of the belt conveyor F in
terms of verification its driving power.
2 TECHNICAL DESCRIPTION
Technical characteristics of apron fee-
der:
- capacity: [
]
- type of material: copper ore
- size of material: [ ]
- bulk density of material:
[
]
- transportation length: [ ]
- maximum inclination angle of con-
veyor: [ ]
- material lift on conveyor:
[ ]
- conveyor speed: [
]
- height of fixed side walls:
[ ]
- width of conveyor-plates length:
[ ]
The apron feeder layout is shown in
Figure 1 and Figure 2.

No. 1-2, 2017 Mining & Metallurgy Engineering Bor 64
Figure 1 Apron feeder DO-F layout in plan view and section views
Figure 2 View of apron feeder DO-F

No. 1-2, 2017 Mining & Metallurgy Engineering Bor 65
The apron feeder consists of a steel con-
struction, driving unit, driving sprocket, tail
sprocket, carrying and return rollers, chain
and plates. The apron feeder is with fixed
side walls.
The driving unit consists of a hydraulic
power unit, hydraulic motor and single stage
reducer.
The hydraulic power unit with label
AF5-72M-21-40H consists of a variable
displacement hydraulic pump driven by
electric motor with an auxiliary charge
pump, tank and pipelines with suitable fit-
tings (pump circuit schematic is shown in
Figure 3 and its view in Figure 4).
Figure 3 Hydraulic scheme of hydro pump PV23
The driving unit has the possibility of
speed regulation thanks to the flow rate
control regulation of the hydraulic pump,
while the hydraulic motor has no possibi-
lity of flow rate regulation (motor circuit
schematic is shown in Figure 5 and its
view in Figure 6).
Technical characteristics of electric mo-
tor:
- installed power of electric motor:
[ ]
- electric motor speed:
[ ]
Technical characteristics of hydraulic
pump:
- label: PV23
- type: axial piston
- maximum pressure:
[ ]
- maximum displacement:
[
]
- speed: [ ]
- working pressure:
[ ]

No. 1-2, 2017 Mining & Metallurgy Engineering Bor 66
Figure 4 View of hydraulic pump PV23
Technical characteristics of hydraulic
motor:
- label: MH187JC
- type: radial piston
- maximum pressure:
[ ]
- displacement: [
]
- nominal torque: [ ] - maximum torque: [ ]
- speed: [ ] - working pressure: [ ]
Technical characteristics of single
stage reducer:
- number of gear teeth on hydraulic
motor shaft:
- number of gear teeth on driving
sprocket shaft:
- ratio:
Figure 5 Hydraulic scheme of hydro motor MH187JC

No. 1-2, 2017 Mining & Metallurgy Engineering Bor 67
Figure 6 View of hydraulic motor MH187JC
3 CALCULATION
Calculation is aimed at determining
the required driving power of apron feeder
and is given by [2] and [3].
- The required conveyor speed is:
[
]
[
]
where
–coefficient of filling
- The required conveyor width with re-
spect to the lump size of load is:
[ ]=
[ ] [ ]
where:
–coefficient for sorted mate-
rial
[ ] –maximum lump size
The conveyor width meets the terms of
lump size of load.
- The maximum static tensile force in
chain is according to [3]:
{ [( ) ]} =
{ [( ) ]} =
[ ]

No. 1-2, 2017 Mining & Metallurgy Engineering Bor 68
where:
[ ] – minimum tensile
force in chain
– resistance coefficient of
chain for sliding bearings and hard working
conditions
[
] [
] – weight of the load per length unit
[
] [
] – weight of floor per
length unit
–coefficient for floor length
over 0.8 m and heavy floor type
- Force due to material friction with
the hopper fixed sides is:
[ ] [ ]
where:
- friction coefficient be-
tween the material and steel
- angle of natural material
falling
[ ] - lateral side length
–
coefficient of lateral pressure
- Pulling force on the drive sprocket is:
[ ] [ ]
- Power required to overcome the re-
sistance forces of apron feeder motion is:
[ ]
[ ]
where:
-mechanical efficiency
- Cross section area of hopper opening
is:
[ ]
[ ]
where:
[ ] - length of hopper opening
- Hydraulic radius of hopper opening is:
( )
( )[ ] [ ]
- Internal friction coefficient of mate-
rial is:
- Coefficient of mobility is:
√ √
No. 1-2, 2017 Mining & Metallurgy Engineering Bor 69
- Pressure force of material column on hopper opening is:
[ ] [ ]
- Power required to overcome losses
due to the friction force caused by
pressure of material column is:
[ ] [ ]
- Total required apron feeder driving power is:
[ ] [ ]
4 DISCUSSION OF CALCULATION
As can be seen from the calculation the
total required apron feeder driving power
consists of the power required to overcome
the resistance forces of apron feeder motion,
and the power required to overcome losses
due to the friction force caused by pressure
of material column. The motion resistance
force consists of the resistance force of car-
rying and return strands of apron feeder, the
force due to raising material which is zero
in this case because it is a horizontal con-
veyor, and force due to material friction
with the hopper fixed sides. The resistance
forces depend on operating parameters of
conveyor, physical properties of material,
and structural characteristics of feeder. The
existing electric motor [ ] is
satisfactory in terms of power.
Considerable speed reduction from elec-
tric motor to drive sprocket is obtained, in
this case, applying the hydrostatic transmis-
sion and one stage reducer. The application
of variable displacement hydraulic pump
enables the speed regulation of apron feeder
so that during start of drive, the apron feeder
works with a minimum speed, and nominal
speed is obtained at the steady operating
conditions. Using the appropriate fittings in
the hydraulic installation, the system over-
load protection is secured, i.e. maintenance
the required operating parameters of oil. The
single stage reducer transmitting the motion
from the shaft driven by the hydraulic motor
to the shaft with drive sprocket is positioned
in such a way that the hydraulic motor shaft
is free from radial force. Low speed of con-
veyor [ ⁄ ] ensures the relief of
inertial forces that occur during operation of
chain conveyors. Thus, the driveline ensures
correct and reliable operation of apron feed-
er in given conditions.
5 CONCLUSION
The exposed methodology for power
calculation of apron feeder is one of the
ways to calculate the verification in selecting
a driveline or driveline verification for oper-
ation in the new working conditions. The
equipment manufacturers also provide their
own methods for calculating the required
power of apron feeder which to a lesser ex-
tent vary from manufacturer to manufactur-
er. Likewise, various examples of power
calculation of apron feeder can be found in
literature, but basically the exposed method
represents the logic of calculation.
No. 1-2, 2017 Mining & Metallurgy Engineering Bor 70
REFERENCES
[1] Complementary Mining Project on
Copper Ore Mining from the South
Mining District Deposit in the Copper
Mine Majdanpek - Technical Project
on Reconstruction the Transportation
Systems for Ore; Mining and Meta-
llurgy Institute Bor - Project Bureau
MECA, 2012 (in Serbian)
[2] Tošić S.: Transportation Devices,
Faculty of Mechanical Engineering
Belgrade, 1990 (in Serbian)
[3] Tošić S.: Calculation of Continuous
Transportation Appliances and Lifting
Devices, Faculty of Mechanical Engi-
neering Belgrade, 1994 (in Serbian)

No. 1-2, 2017 Mining & Metallurgy Engineering Bor 71
MINING AND METALLURGY INSTITUTE BOR ISSN: 2334-8836 (Štampano izdanje)
UDK: 622 ISSN: 2406-1395 (Online)
UDK: 622.271/.33(045)=111 doi:10.5937/mmeb1702071S
Saša Stepanović*, Nikola Stanić*, Miodrag Šešlija**, Miljan Gomilanović*
ANALYSIS OF COAL QUALITY IN A FUNCTION OF
SELECTION LEVEL FOR MINING AT THE OPEN PIT GACKO***
Abstract
This work analyzes the quality of coal in the function level selection for exploitation. A detailed
analysis was carried out for the main coal seam, the first floor seam, the second floor seam and the
overlying coal series of the coal deposit Gacko of 0.5 and 1 m. The analysis was carried out within the
Strategy of mining-technological opening, development, optimization and maintenance the continuity
of coal production with development the Feasibility Study of introducing a dry separation method in
order to determine the amount and quality of coal for TPP Gacko. The analysis included the effects of
natural and technological factors on participation the seam overburden in the run-of-mine coal as well
as a degree of overburden impact on the quality of run-of-mine coal.
Keywords: selective mining, coal quality, TPP, Gacko
* Mining and Metallurgy Institute Bor – Department Coal Engineering Belgrade
e-mail: [email protected] **
Mine and Power Plant Gacko, e-mail: [email protected] ***
This work is derived from the project TR37001 “The Impact of Mining Waste from RTB Bor on the
Pollution of Surrounding Water Systems with the Proposal of Measures and Procedures for Reduc-
tion Harmful Effect on the Environment”, funded by the Ministry of Education, Science and Techno-
logical Development of the Republic of Serbia
INTRODUCTION
The open pit coal mining represents a
large installed capacities for the needs of
energetics and is characterized by a very
extensive and complex production com-
plexes within the exploitation system.
Coal deposits, predisposed for the open
pit mining, are frequently characterized by a
complex structure and operating conditions.
Further development of the open pit mining
is also related to more complex enginee-
ring-geological, and hydrogeological chara-
cteristics of the working environment, the
increased overburden coefficient, more de-
manding environmental conditions, which
all together emphasizes a need for use the
modern technological mining methods, and
even selective mining that becomes more
and more pronounced.
Selective coal mining in these circum-
stances gets more importance from the
standpoint of efficiency of reserves in the
deposit, and in some cases is imposed as the
only possibility of mining. It is often the
case that the use of selective mining allows
the evaluation of those coal reserves that
otherwise could not be balanced as an ener-
gy source.
In any case, whether it is a mass or se-
lective mining, the coal excavation is car-
ried out in a particular work environment
that represents the environment of produ-
ction system, with a group of specific chara-

No. 1-2, 2017 Mining & Metallurgy Engineering Bor 72
cteristics that affect the choice of parame-
ters for operation technology.
SELECTIVE COAL MINING AT
THE OPEN PIT GACKO
Coal mining in the Gacko coal basin is
carried out using the technology of selective
coal mining. Orientation to the selective
mining has been demonstrated in terms of
efficiency and valorization the available
coal reserves, then from the viewpoint of
the needs and possibilities of coal homoge-
nization, and also as the only method of
coal mining with an extremely complex
structure of coal bearing series. The coal deposit Centralno Polje is more
predisposed to the open pit mining, and is characterized by complex mining condi-tions, from the aspect of geological struc-ture of coal bearing seams.
Within this exploration-exploitation
field of the Gacko coal basin, three coal
seams have been developed within the roof
coal series, then the main, the first and the
second floor coal seam (Figure 1).
Figure 1 Lithostratigraphic pillar of the Neogene series of the Gacko coal basin

No. 1-2, 2017 Mining & Metallurgy Engineering Bor
73
All coal seams are complex or stratified
with greater or lesser presence of waste thin
seam.
Coal, mined in this deposit, is intended
to supply the thermo power plant, and the
major limitation in terms of exploitability is
the quality of run-of-mine coal. In the mi-
ning dynamics defining, the quality of run-
off-mine coal was analyzed in the specific
mining conditions. In addition to the other
factors, a dilution of mineral raw material
was observed as the result of the coal seam
structure. Dilution occurs in mining a cer-
tain amount of waste from a contact of coal
seam or thin seam.
This causes a reduction in calorific value
compared to the coal calorific value deter-
mined during the deposit exploration. In a
coal supply to the thermal power plants, as a
condition, there is exactly a certain mini-
mum calorific value that is a limit for the
percentage presence of waste material in
coal, that is, the level or degree of dilution,
in this particular case the followings are
analuzed, such as: the roof, the main, the
first and the second floor coal seam.
Coal dilution is determined for the selec-
tion level during excavation of 0.5 and 1 m.
The selection level is minimum thick-
ness of thin seams or a group of thin
seams which are mined as the run-of-mine
coal. Thins seams of coal are mined as the
run-of-mine coal in two cases, as follows:
1. if their thickness is greater than the
selection level, and
2. if their thickness is less than the se-
lection level wherein the thickness
of waste thin seam between two ad-
jacent coal thin seams is less, and the
sum of thicknesses of adjacent coal
thin seams is greater than the selec-
tion level.
The same is also applied to the waste
thin seams which are mined as the selec-
tive waste material.
If the coal thickness is less than the se-
lection level in mining, the losses occur,
while if the waste thickness is less than
the selection level, a dilution occurs.
The analysis of dilution in a function of
stratigraphic position interlayers of coal thin
seams within the coal seams was carried out
such as the pillars of drill holes were ana-
lyzed, and the presence of coal and waste
thin seams of thickness less than the selected
level, and their mutual position. The basis
for the analysis was the basis of exploration
work results (exploratory drill holes) from
which the waste thin seams were firstly
identified that are mined together with coal,
followed by the calculation the total amount
of run-of-mine coal and degree of presence
the waste in the total weight of coal. Data
regarding the percentage of dilution are con-
nected to the corresponding coal seam and
corresponding exploration work, and the
analyzed data had its coordinates in a real
space. Subsequent interpretation was carried
out using a suitable software package, and
the results are shown in a form of isolines of
dilution percentage. In addition to the pre-
sented spatial arrangement and percentage of
volume dilution, was performed and the
statistical analysis of this data was per-
formed, and the appropriate measures of
tendency and dispersion were given. Further
text presents the analysis results for the se-
lection level of 0.5 and 1 m.
DILUTION FOR THE SELECTION
LEVEL OF 0.5 m
Isolines of coal dilution in% by volume
participation in the coal seam for the roof,
main, first and second floor seam are given
in Figures 2 to 5.
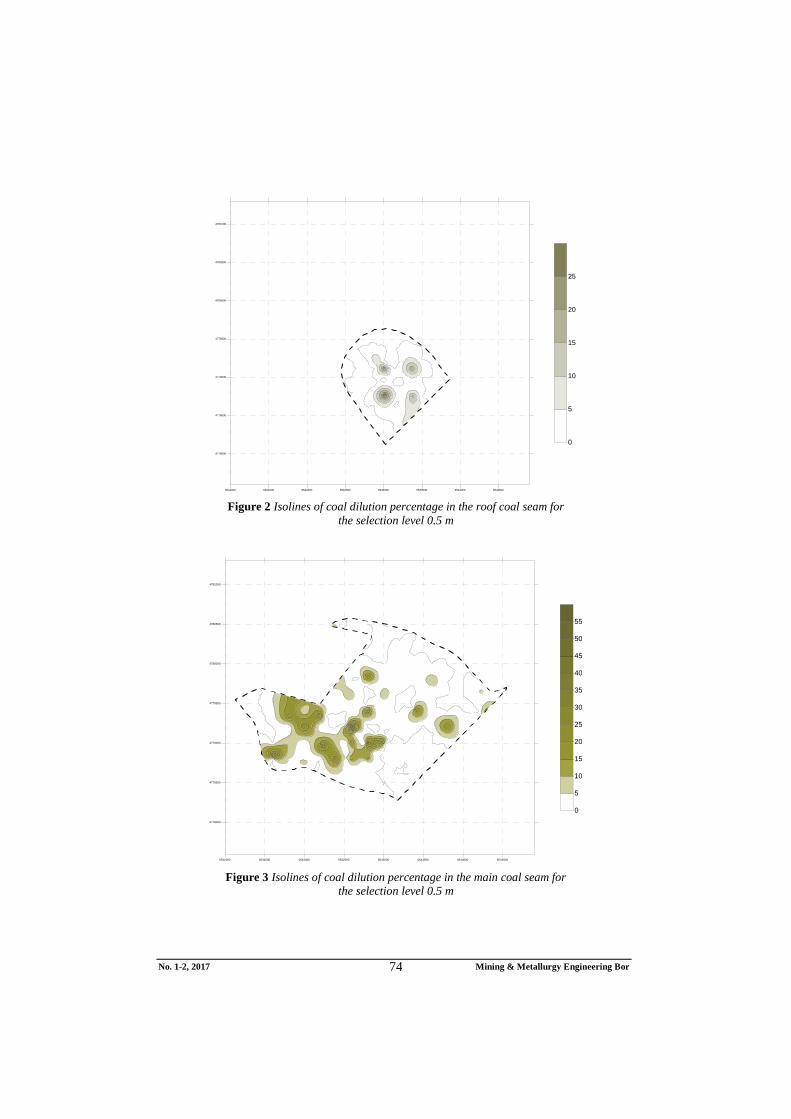
No. 1-2, 2017 Mining & Metallurgy Engineering Bor
74
Figure 2 Isolines of coal dilution percentage in the roof coal seam for
the selection level 0.5 m
Figure 3 Isolines of coal dilution percentage in the main coal seam for
the selection level 0.5 m
6541000 6541500 6542000 6542500 6543000 6543500 6544000 6544500
4778000
4778500
4779000
4779500
4780000
4780500
4781000
0
5
10
15
20
25
6541000 6541500 6542000 6542500 6543000 6543500 6544000 6544500
4778000
4778500
4779000
4779500
4780000
4780500
4781000
0
5
10
15
20
25
30
35
40
45
50
55

No. 1-2, 2017 Mining & Metallurgy Engineering Bor
75
Figure 4 Isolines of coal dilution percentage in the first floor coal seam for
the selection level 0.5 m
Figure 5 Isolines of coal dilution percentage in the second floor coal seam for
the selection level 0.5 m
Histograms of dilution percentage by the coal seams are given in Figure 6.
6541000 6541500 6542000 6542500 6543000 6543500 6544000 6544500
4778000
4778500
4779000
4779500
4780000
4780500
4781000
0
2.5
5
7.5
10
12.5
15
17.5
20
6541000 6541500 6542000 6542500 6543000 6543500 6544000 6544500
4778000
4778500
4779000
4779500
4780000
4780500
4781000
0
5
10
15
20
25
30
35

No. 1-2, 2017 Mining & Metallurgy Engineering Bor
76
a)
b)
0 3 6 9 12 15 18 21 24 27
Razblaženj (%) -Krovinski sloj
0
1000
2000
3000
4000
5000
6000
7000
8000
9000
Bro
j m
inib
loko
va
0 4 8 12 16 20 24 28 32 36 40 44 48 52
Razblaženje (%) - Glavni sloj
0
2000
4000
6000
8000
10000
12000
14000
16000
18000
20000
Bro
j m
inib
loko
va

No. 1-2, 2017 Mining & Metallurgy Engineering Bor
77
c)
d)
Figure 6 Histograms of the dilution percentage by coal seams
(a-roof, b-main, c-first floor and d-second floor coal seam) for the level selection of 0.5 m
0 2 4 6 8 10 12 14 16 18 20
Razblaženje (%) - prvi podinski
0
2000
4000
6000
8000
10000
12000
14000
16000
18000
20000
22000
24000
26000
28000
Bro
j m
inib
loko
va
0 3 6 9 12 15 18 21 24 27 30 33 36
Razblaženje (%) - Drugi podinski
0
2000
4000
6000
8000
10000
12000
14000
16000
18000
20000
22000
24000
26000
Bro
j m
inib
loko
iva

No. 1-2, 2017 Mining & Metallurgy Engineering Bor
78
Table 1 Results of statistical analysis of dilution at the selection level of 0.5 m
Characteristic Roof coal
seam
Main coal
seam
Second floor
coal seam
First floor
coal seam
Arithmetic mean 2.144 3.672 1.823 2.837
Median 0.069 1.227 0.969 0.773
Standard deviation 3.883 5.418 2.405 4.345
Number of miniblocks 12779 39661 51173 47227
Minimum 0.000 0.000 0.000 0.000
Maximum 28.605 54.048 21.739 36.939
I quartile 0.000 0.000 0.048 0.000
II quartile 2.595 4.982 2.674 3.962
DILUTION FOR THE SELECTION
LEVEL OF 1 m
Isolines of coal dilution in % by vol-
ume participation in the coal seam for the
roof, main, first and second floor seam are
given in Figures 7 to 10.
Figure 7 Isolines of coal dilution percentage in the roof coal seam for
the selection level 1 m
6541000 6541500 6542000 6542500 6543000 6543500 6544000 6544500
4778000
4778500
4779000
4779500
4780000
4780500
4781000
0
5
10
15
20
25
30
35

No. 1-2, 2017 Mining & Metallurgy Engineering Bor
79
Figure 8 Isolines of coal dilution percentage in the main coal seam for
the selection level 1 m
Figure 9 Isolines of coal dilution percentage in the first floor coal seam for
the selection level 1 m
6541000 6541500 6542000 6542500 6543000 6543500 6544000 6544500
4778000
4778500
4779000
4779500
4780000
4780500
4781000
0.0
5.0
10.0
15.0
20.0
25.0
30.0
35.0
40.0
45.0
50.0
55.0
6541000 6541500 6542000 6542500 6543000 6543500 6544000 6544500
4778000
4778500
4779000
4779500
4780000
4780500
4781000
0.0
5.0
10.0
15.0
20.0
25.0
30.0

No. 1-2, 2017 Mining & Metallurgy Engineering Bor
80
Figure 10 Isolines of coal dilution percentage in the second floor coal seam for
the selection level 1 m
Histograms of dilution percentage by the coal seams are given in Figure 11.
a)
6541000 6541500 6542000 6542500 6543000 6543500 6544000 6544500
4778000
4778500
4779000
4779500
4780000
4780500
4781000
0.0
5.0
10.0
15.0
20.0
25.0
30.0
0 3 6 9 12 15 18 21 24 27 30 33 36
Razblaženje (%) -Krovinski sloj
0
1000
2000
3000
4000
5000
6000
7000
8000
9000
Bro
j m
inib
loko
va

No. 1-2, 2017 Mining & Metallurgy Engineering Bor
81
b)
c)
0 4 8 12 16 20 24 28 32 36 40 44 48 52
Razblaženje (%) - Glavni sloj
0
2000
4000
6000
8000
10000
12000
14000
16000B
roj m
inib
loko
va
0 4 8 12 16 20 24 28 32 36 40 44
Razblaženje (%) - prvi podinski
0
2000
4000
6000
8000
10000
12000
14000
16000
18000
20000
22000
24000
Bro
j m
inib
loko
va

No. 1-2, 2017 Mining & Metallurgy Engineering Bor
82
d)
Figure 11 Histograms of dilution percentage by coal seams
(a-roof, b-main, c-first floor and d-second floor coal seam) for the level selection of 1 m
Table 2 Results of statistical analysis of dilution (%) at the selection level of 0.5 m
Characteristic Roof coal
seam
Main coal
seam
First floor
coal seam
Second floor
coal seam
Arithmetic mean 2.604 5.701 3.057 3.441
Median 0.172 2.375 1.541 1.505
Standard deviation 4.556 7.535 4.457 4.470
Number of miniblocks 12779 39661 51173 47227
Minimum 0.000 0.000 0.000 0.000
Maximum 36.773 54.046 47.826 30.393
I quartile 0.000 0.094 0.011 0.000
II quartile 3.286 8.185 4.208 5.616
The quality of run-of mine coal is in a
function of dilution degree, or waste per-centage in run-of-mine coal. In order get to the mining coal quality, the following factors have to be taken into account lea-ding to decrease in lower coal heating value, as follows:
The effect of reducing the amount of
clean coal in the total weight of run-
of-mine coal;
The effect of increased amounts of
moisture connected to the clayey and
marl components in coal, and that is
increased with participation the waste
material in coal;
Reducing the heating power of coal
due to the presence of carbonate com-
ponent that in the endothermic process
decomposes to CaO and CO2.
0 3 6 9 12 15 18 21 24 27 30
Razblaženje (%) - Drugi podinski
0
2000
4000
6000
8000
10000
12000
14000
16000
18000
20000
22000
24000B
roj m
inib
loko
va
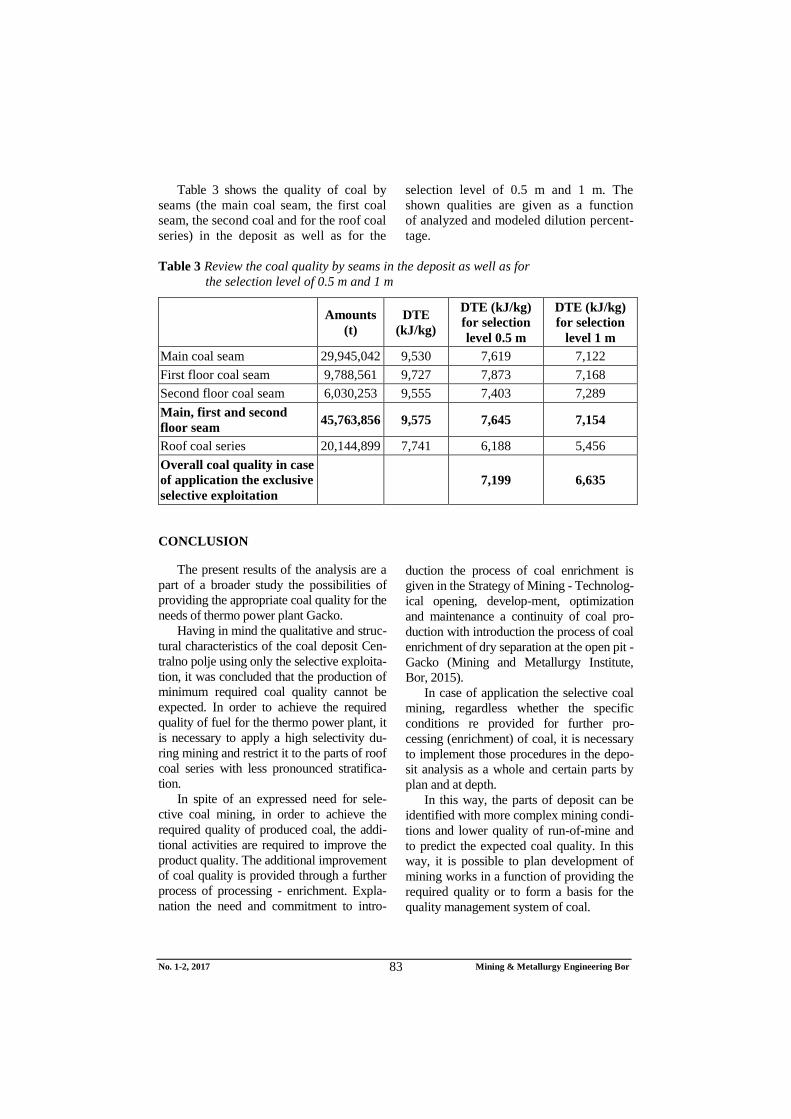
No. 1-2, 2017 Mining & Metallurgy Engineering Bor
83
Table 3 shows the quality of coal by
seams (the main coal seam, the first coal
seam, the second coal and for the roof coal
series) in the deposit as well as for the
selection level of 0.5 m and 1 m. The
shown qualities are given as a function
of analyzed and modeled dilution percent-
tage.
Table 3 Review the coal quality by seams in the deposit as well as for
the selection level of 0.5 m and 1 m
Amounts
(t)
DTE
(kJ/kg)
DTE (kJ/kg)
for selection
level 0.5 m
DTE (kJ/kg)
for selection
level 1 m
Main coal seam 29,945,042 9,530 7,619 7,122
First floor coal seam 9,788,561 9,727 7,873 7,168
Second floor coal seam 6,030,253 9,555 7,403 7,289
Main, first and second
floor seam 45,763,856 9,575 7,645 7,154
Roof coal series 20,144,899 7,741 6,188 5,456
Overall coal quality in case
of application the exclusive
selective exploitation
7,199 6,635
CONCLUSION
The present results of the analysis are a
part of a broader study the possibilities of
providing the appropriate coal quality for the
needs of thermo power plant Gacko.
Having in mind the qualitative and struc-
tural characteristics of the coal deposit Cen-
tralno polje using only the selective exploita-
tion, it was concluded that the production of
minimum required coal quality cannot be
expected. In order to achieve the required
quality of fuel for the thermo power plant, it
is necessary to apply a high selectivity du-
ring mining and restrict it to the parts of roof
coal series with less pronounced stratifica-
tion.
In spite of an expressed need for sele-
ctive coal mining, in order to achieve the
required quality of produced coal, the addi-
tional activities are required to improve the
product quality. The additional improvement
of coal quality is provided through a further
process of processing - enrichment. Expla-
nation the need and commitment to intro-
duction the process of coal enrichment is
given in the Strategy of Mining - Technolog-
ical opening, develop-ment, optimization
and maintenance a continuity of coal pro-
duction with introduction the process of coal
enrichment of dry separation at the open pit -
Gacko (Mining and Metallurgy Institute,
Bor, 2015).
In case of application the selective coal
mining, regardless whether the specific
conditions re provided for further pro-
cessing (enrichment) of coal, it is necessary
to implement those procedures in the depo-
sit analysis as a whole and certain parts by
plan and at depth.
In this way, the parts of deposit can be
identified with more complex mining condi-
tions and lower quality of run-of-mine and
to predict the expected coal quality. In this
way, it is possible to plan development of
mining works in a function of providing the
required quality or to form a basis for the
quality management system of coal.

No. 1-2, 2017 Mining & Metallurgy Engineering Bor
84
REFERENCES
[1] Strategy of Mining - Technological
Opening, Development, Optimization
and Maintenance a Continuity of Coal
Production with Introduction the
Process of Coal Enrichment of Dry
Separation at the Open Pit - Gacko,
Book 1, MMI Bor, Bor, 2015 (in
Serbian)
[2] The Main Mining Project of the Open
Pit Gacko - Central Field for Capacity
of 2.3x10⁶ t/year of Run-og-Mine coal,
Project of the Open Pit Defense of
Water, MMI Bor, Bor, 2016 (in
Serbian)
[3] Simplified Mining Project of
Exploitation a Part of the Field "C"
with Expansion the Existing Work
Front in the Southern Part and Part of
Roof Coal ("Overlaying Zone") of the
Open Pit "Gračanica" - Gacko, MMI
Bor, Bor 2014 (in Serbian)
[4] V. Pavlović, D. Ignjatović: Selective
Open Pit Coal Mining by Continuous
Systems - University of Belgrade,
Faculty of Mining and Geology (in
Serbian)
[5] Lazić A., Bošković S., Klačar R.:
Selective Open Pit Coal Mining,
Monografija, University of Belgrade,
Faculty of Mining and Geology -
(2004); (in Serbian)

No. 1-2, 2017 Mining & Metallurgy Engineering Bor 85
MINING AND METALLURGY INSTITUTE BOR ISSN: 2334-8836 (Štampano izdanje)
UDK: 622 ISSN: 2406-1395 (Online)
UDK: 622.33:550.8(045)=111 doi:10.5937/mmeb1702085T
Vladimir Todorović*, Boban Branković*, Dejan Dramlić**, Silvana Ilić***
A NEW METHOD OF COAL EXCAVATION IN THE COMPLEX
NATURAL-GEOLOGICAL CONDITIONS
Abstract
In the underground coal mines in Serbia, nowadays, only the pillar methods of excavation excava-
tions, which all affect the excavation economy.
This paper presents the solution of a new excavation method foreseen for application in the complex
natural-geological conditions, which are now in all active coal deposits in the Republic of Serbia.
Keywords: coal, excavation method, production, mechanized excavation
* PC UCM Resavica
** Institute for Materials Testing – Belgrade
*** FMZ Zaječar
1 INTRODUCTION
Complexity of the natural-geological
conditions for exploitation of our coal depo-
sits requires systematic research work aimed
at improving the methods and technologies
of excavation, because from this phase de-
pends the technical, safety and economic
parameters of the entire underground exploi-
tation system in a particular ledge.
In countries with developed mining,
developed underground coal mines, the
basic method of excavation of coal seams
is the methods of wide foreheads with
complex mechanization.
In the complex and different conditions
of coal deposits in the Republic of Serbia,
numerous and specific technical and techno-
logical solutions of the underground coal
excavation process were applied, with con-
stant efforts to be adapted to the deposit
conditions. The present conditions of the
working environment influenced the selec-
tion of technological solutions for exploita-
tion, so that in all active mines, the methods
of pillar excavation in different variants are
applied, which generally do not allow eco-
nomic exploitation, and the risk of injuries
and misconduct of employees on such types
of excavation has increased.
The application of mechanized exca-
vation technology on the principle of hori-
zontal and vertical concentration by wide
foreheads method only gave the positive
technical and economic parameters in some
mines and in certain excavation fields.
In order to improve the effects of appli-
cation the pillar excavations in coal mines in
the Republic of Serbia, the need for their
rationalization is imposed, as this method of
excavation will continue to dominate.
The aim of carried out research in this
paper is to give a new approach to the pillar
methods of excavation, and within the
framework of the underground coal mines in
Serbia.
The basic directions of improvement
in these analyses are focused on mechani-

No. 1-2, 2017 Mining & Metallurgy Engineering Bor 86
zation the basic technological phases in
excavation, especially in the production
and loading of the excavation, which is
solved by introduction the combined mul-
tifunctional machines DH L600 and DH
L1200 of the German manufacturer Deil-
mann-Haniel Mining Systems GmbH.
2 GENERAL AND SPECIFIC
CONDITIONS OF EXPLOITATION
Based on the collected and processed
data, the basic natural - geological condi-
tions in active coal mines are characterized
by the following:
- most often these are thick coal seams
with frequent thickness changes;
- coal seams are mostly of the complex
structures with a smaller or larger share
of mullock seams;
- due to intense macro and micro tecto-
nics, the deposits are, as a rule, disrupt-
ted by several systems, which formed
the excavation fields of irregular sha-
pes and relatively small dimensions;
- in relation to the elements of laying,
most of the mines, per depth, belong to
the group of mines with the middle
depth, and according to the fall they
are about inclined and somewhat steep
deposits;
- the stability of the mining access areas
of excavations is directly related to the
physical mechanical properties of the
coal seams and associated deposits
(with the pronounced participation of
clay components) in which conven-
tional sub-systems are applied;
- in terms of wateriness, all deposits, ex-
cept for the coal deposit “Štavalj”, be-
long to a group of poorly watered
mines;
- self-inflammability and explosiveness
of coal dust, as well as the natural ten-
dency towards self-ignition, is the gen-
eral characteristic of all mines, except
for the mine Vrška Čuka;
- active deposits are not pronounced me-
thane carriers, except for the deposit of
the mine “Soko”, where there are some
increased methane values, and there
are also phenomena of gas and materi-
al outbursts.
3 A NEW PILLAR METHOD OF
EXCAVATION WITH THE
APPLICATION OF A
MULTI-LOADER
The novelty of a new pillar method of
excavation consists in obtaining coal during
the construction of the excavation corridor
(I phase - excavation in progress), as well as
in obtaining the roof and lateral coal in
withdrawal (Phase II - excavation in with-
drawal), with one of the modern and highly
efficient combined machinery for working
in the pit, which primarily achieves a large
performance during loading.
The excavation, depending on the ele-
vated coal production, can be planned with
the use of one machine, and after the com-
pletion of the excavation hall (phase I), the
same machine works in phase II - the exca-
vation in withdrawal, and so any subsequent
excavation, or can be planned using two
machines, when the first machine, after
completion the excavation hall (phase I),
continues to the phase II, and the second
machine starts production of the next exca-
vation hall and, upon completion of its con-
struction, works on obtaining roof and lat-
eral coal (phase II - excavation in withdra-
wal). So, there is:
a) Phase I – excavation in progress, it is
actually the construction of a hall-
way with the known technology of
machine building of the corridor
(cutting is done with a cutting head,
and loading of material with a side
spoon in a rake conveyor). It gets
important in the use of maximum
possible and given pit conditions
applicable cross-sectional profile of
the excavation hall with increase the

No. 1-2, 2017 Mining & Metallurgy Engineering Bor 87
effects of progression. Therefore, in
a shorter time interval, greater pro-
gress should be made with the max-
imum possible profile.
b) Phase II – excavation in withdrawal
is a method of obtaining roof and
side coal by cutting and mechani-
cally loading a side spoon in a rake
conveyor, where the amount of pro-
duction depends on the thickness of
the seam. According to the data, the
coal seam is defined with a power of
up to 12 m. The width of the pillar
between the excavation corridors is
determined according to the mine
conditions (pressure, ma-nner of sub
structuring, adjustment of progres-
sion or withdrawal, size of cross-
section profile, etc.). Based on the
experimental data it should be up
to 3 m, and it will be determined in a
test work.
In order to obtain roof and side coal, the
multifunctional modern loader can be fully
expressed with the use of a cutting head,
since the coal after the construction of the
excavation hall is less compact and it is easi-
er to cut it. The test excavation method will
simultaneously be another testing of this
multifunctional loader for such a method of
excavation. The use of construction tools is
especially indicated by the fact that their use
is particularly stimulated by the constructive
novelty of a multi-loader, so called “click”
system, or quick tool change - an average of
10 minutes. Figure 1 shows the position of the exca-
vation corridor in a coal seam, and Fi-gure 2 shows the principled excavation scheme with the new excavation method.
Figure 1 Detail of possible position of the excavation hall 1 (OH-1) in a coal seam

No. 1-2, 2017 Mining & Metallurgy Engineering Bor 88
Figure 2 Principal scheme of excavation with a new excavation method
The advantages of the newly designed
method are as follows:
- the decline, direction of providing the
excavation preparation, but also its
length does not significantly affect
the possibility of applying of this
method, and the change of these ele-
ments does not block its further work;
- the geometry of the method can be
quickly adjusted to the conditions of
seam (by inclination, seam thickness,
etc.), and in case of sudden changes
(water, methane or self-inflamma-
tion) can change;
- there are no special problems related
to self-ignition due to the dynamics
of excavation, and no special protec-
tion measures are foreseen except
the usual ones;
- applied mechanization is easy to
handle, and above all, it has the pos-
sibility of universal application (with
the addition of other essential equip-
ment according to the “click” sys-
tem). The special advantage is that
this mining equipment is universal
for other applications in the pit,
which increases its usefulness;
- the number of engaged labor force
compared to the other classical
methods is small, and the expected
excavation effect is acceptable;
- the multi-loader compensates the
lack of combine that it cannot cut
below its level;
- the utilization of loading the roof
coal is higher, the excavation losses
are smaller. Mechanical loading left
and right in excavation without input
into unprotected space allows it;
- the speed of progress the excavation
preparation using the loading rods is
increased by more than 50% in rela-
tion to the present, which reduces the
accumulation time of pit pressures
and “obtaining” the used substrate
material, of course, less damaged
when extracting or when is under
pressure;
- the excavation losses are expected to
be smaller. An analysis the geometry
of discovery method shows that mo-
re coal can be obtained by better ex-
cavation planning, e.g. for thicker
seams, it is possible to use the meth-
od as with the damping from one
floor, but also for excavation in two
or more belts. With the reduction of
the safety pillars between the excava-
tion corridors, the losses are reduced.

No. 1-2, 2017 Mining & Metallurgy Engineering Bor 89
Table 1 shows the comparative ana-
lysis of the basic parameters of the "V"
methods and the new methods of exca-
vation.
Table 1 Comparative analysis the basic parameters of the “V” method and
the new pillar method of excavation
Basic parameters
“V“
method
(designed)
“V”
method
(real)
Improved
“V”
method
Phase I – Construction of an excavation corridor - Pro-
gress (m/shift) 1.00 1.00 2,00
Phase I – Construction of as excavation corridor - Pro-
gress (m/day) 3.00 3.00 6,00
Phase II – Getting coal - Deviation (m/shift) 2.00 1.50 2,00
Phase II – Getting coal - Deviation (m/day) 6.00 4.50 6,00
Height of the excavation (m) 5.00 5.00 6,00
Excavation width (m) 8.50 8.50 7,70
Surface of cross-sectional area of the excavation in
progress (m2) 8.50 8.50 16,15
Surface of cross-sectional area of the excavation in
deviation (m2) 33.97 33.97 30,05
Volume mass of coal (t/m3) 1.33 1.33 1,33
The coefficient of utilization 0.70 0.70 0,90
The capacity of excavation in progress – phase I
(t/shift) 11.31 11.31 42,96
The capacity of excavation in progress – phase I (t/day) 33.92 33.92 128,88
The capacity of excavation in deviation – phase
II(t/shift) 63.25 47.44 71,94
The capacity of excavation in deviation – phase II
(t/day) 189.76 142.32 215,82
The capacity of excavation in total – phase I+II (t/shift) 74.56 58.74 114,90
The capacity of excavation in total – phase I+II (t/day) 223.67 176.23 344,70
Number of workers per shift on excavation in progress
– phase I (wage) 4 4 4
Daily number of workers on excavation in progress –
phase I (wage) 12 12 12
Number of workers per shift on excavation in deviation
– phase II (wage) 4 4 4
Daily number of workers on excavation in deviation –
phase II (wage) 12 12 12
The effect on excavation in progress – phase I (t/day) 2.83 2.83 10,74
The effect on excavation in deviation – phase II (t/day) 15.81 11.86 17,98
The effect on excavation in total – phase I+II (t/day) 9.32 7.34 14,36
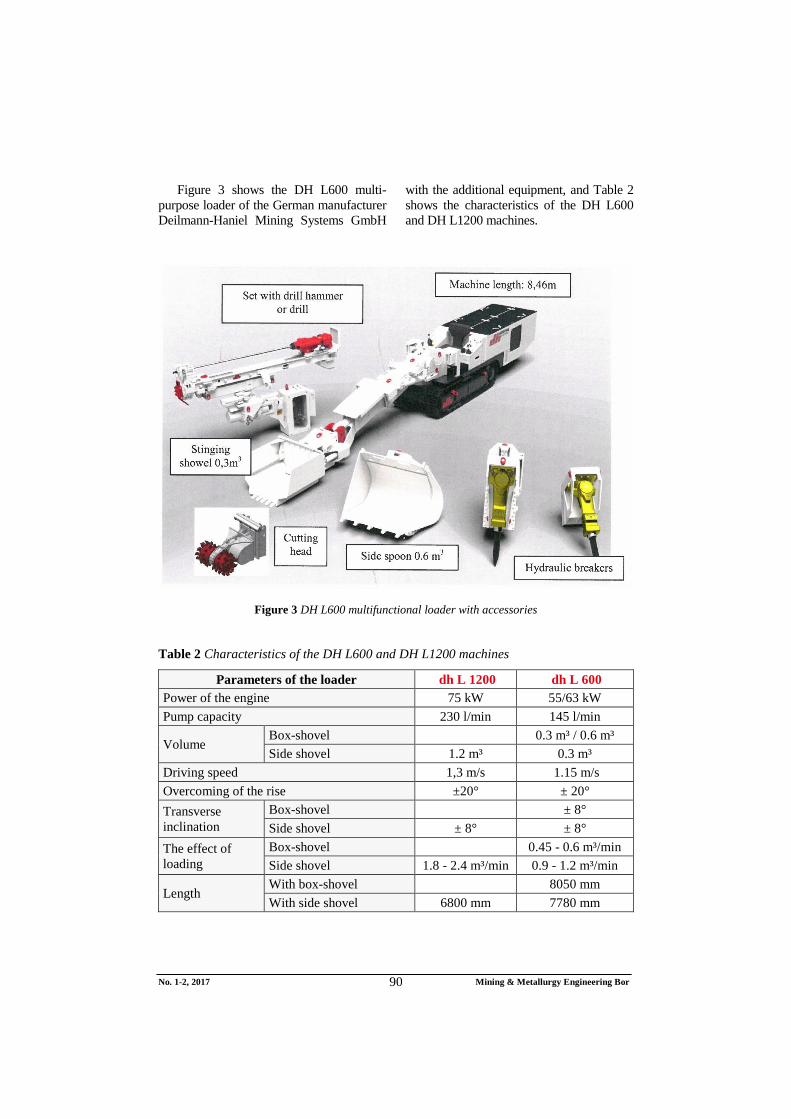
No. 1-2, 2017 Mining & Metallurgy Engineering Bor 90
Figure 3 shows the DH L600 multi-
purpose loader of the German manufacturer
Deilmann-Haniel Mining Systems GmbH
with the additional equipment, and Table 2
shows the characteristics of the DH L600
and DH L1200 machines.
Figure 3 DH L600 multifunctional loader with accessories
Table 2 Characteristics of the DH L600 and DH L1200 machines
Parameters of the loader dh L 1200 dh L 600
Power of the engine 75 kW 55/63 kW
Pump capacity 230 l/min 145 l/min
Volume Box-shovel 0.3 m³ / 0.6 m³
Side shovel 1.2 m³ 0.3 m³
Driving speed 1,3 m/s 1.15 m/s
Overcoming of the rise ±20° ± 20°
Transverse
inclination
Box-shovel ± 8°
Side shovel ± 8° ± 8°
The effect of
loading
Box-shovel 0.45 - 0.6 m³/min
Side shovel 1.8 - 2.4 m³/min 0.9 - 1.2 m³/min
Length With box-shovel 8050 mm
With side shovel 6800 mm 7780 mm

No. 1-2, 2017 Mining & Metallurgy Engineering Bor 91
Continuation Table 2
Width 1560 mm 1200 mm
Height Without a protective roof 1355 mm 1200 mm
With a protective roof 1961 mm 1994 mm
Weight approx. 14000 kg 10800 kg
Ground pressure 0,12 MPa 0,1 MPa
Free height Machine space 350 mm 341 mm
Track shoe 260 mm 250 mm
The angle of deflection of the working branch 2 x 20° 2 x 30°
Pace of telescopic arm 900 mm 700 mm
Unloading height With box-shovel 2899mm
With side shovel 2157 mm 3370mm
Excavation depth Box-shovel 569 mm
Side shovel 600 mm 616 mm
Penetration force Box-shovel ¯ 40 kN
Side shovel 71 kN 59 / 46 kN
Penetration force (horizontal) 150 kN 100 kN
CONCLUSION
Under the complex conditions of exploit-
tation in coal deposits, the excavation of coal
seams of medium and large thickness is car-
ried out, mainly by the pillar excavation
methods, with blasting technology, manual
loading of excavation and its removal with
grass conveyors.
Based on the analysis of the applied ex-
cavation systems in the mines, it is ob-vious
that modernization and modernization the
excavation system must be carried out in
order to be more economically and safely
mined. The acquired excavation experience
in the current active deposits determines the
continued application of pillar excavation
methods, but with the wider introduction of
modern equipment and mechanization of
technological phases on excavations.
A detailed analysis has shown that the
methods of mechanized wide foreheads can
be introduced only in some parts of the coal
deposits of the “Soko” and “Štavalj” mines.
The new method, which is the subject of
this paper, can be applied under the condi-
tions of most of active underground mines,
which will greatly improve technical para-
meters and economic performances.
REFERENCES
[1] Ivković M., Janošević P.: Feasibility
Study for Increase the Coal Produc-
tion, Application of the New Exca-
vation Method – Mine "Strmosten",
Resavica 2016 (in Serbian)

No. 1-2, 2017 Mining & Metallurgy Engineering Bor 92
[2] Miljanović J.: Effective Factors in the
Realization of the Foreseen Coal Pro-
duction in the Mines With Under-
ground Exploitation of the Republic of
Serbia, Jurnal Mining Works No.
1/2001, Bor, 2001.
[3] Stjepanović M.: Strategic Approach to
Planning Development and Production
of Mineral Resources in the Mining
Sector of Serbia, Journal Mining
Works No. 1/2002, Bor, 2002.
[4] Technical Documentation of PC UCM
Resavica (in Serbian)

No. 1-2, 2017 Mining & Metallurgy Engineering Bor 93
MINING AND METALLURGY INSTITUTE BOR ISSN: 2334-8836 (Štampano izdanje)
UDK: 622 ISSN: 2406-1395 (Online)
UDK: 622.235/.33(045)=111 doi:10.5937/mmeb1702093S
Nikola Stanić*, Saša Stepanović*, Milan Nikolić, Aleksandar Doderović*
BENEFITS OF APPLICATION THE MODERN TECHNOLOGY OF
MECHANIZED CHARGING THE BOREHOLES AT
THE OP POTRLICA PLJEVLJA**
Abstract
In order to improve the blasting technology, the Coal Mine Pljevlja bought a vehicle for mechanized
charging of boreholes. The application of this technology has significantly improved the effects and
improved the conditions of blasting at the Open Pit Potrlica. The present work describes the sa-vings of
application the technology of mechanized charging the boreholes. An analysis was carried out for three
variants. Variant 1 involves the use of mechanized charging of boreholes with a nonel system for initia-
tion. Variant 2 involves the use of blasting technology with cartridge explosive and Nonel initiation
system. Variant 3 involves the blasting technology with detonating cord initiation.
Keywords: An-Fo explosives, blasting, mechanized charging, advancement of technology
* Mining and Metallurgy Institute Bor - Department Coal Engineering Belgrade
e-mail: [email protected], [email protected] **
This work is derived from the project TR37001 “The Impact of Mining Waste from RTB Bor on the
Pollution of Surrounding Water Systems with the Proposal of Measures and Procedures for Reduc-
tion Harmful Effect on the Environment”, funded by the Ministry of Education, Science and Techno-
logical Development of the Republic of Serbia
INTRODUCTION
Coal and overburden mining at the OP
Potrlica is carried out in the central and
north-western part of the deposit. The mi-
ning conditions are very complex and expre-
ssed through mining - geological, mining -
technical and techno - economic indicators,
such as:
High dampness of deposit with the
regular water inflow of around 500
l/min to 1000 l/min in the emergency
situations,
Coefficient of overburden 4 cm3/t,
Demanding physical - mechanical pro-
perties; blasting must be carried out to
more than 80% of total weight,
Proximity of building structures, infra-
structure facilities, legal social land,
The environmental impact, proximity
of populated areas, Physical-mechanical characteristics of
the work environment and possible ap-plication only a discontinuous mecha-nization for excavation.
Such complex mining conditions require
studying and improvement the work techno-
logy in all technological operations.
The first working operation in the tech-
nological process is drilling and blasting. In order to modernize this working ope-
rations, the coal mine Pljevlja has done the project documentation and, based on it, pro-cured a vehicle for mechanized charging of boreholes. The vehicle has the ability to produce more types of explosives on the basis of ammonium nitrate.

No. 1-2, 2017 Mining & Metallurgy Engineering Bor 94
REVIEW THE CURRENT
TECHNOLOGY OF COAL
AND OVERBURDEN MINING
Technological system of overburden
mining consists of the following technolo-
gical processes:
Preparation works
Drilling and blasting
Excavation and loading
Internal transport
Overburden crushing
Outer transport
Disposal
Excavation is carried out with the prior
blasting of overburden and coal, except in
the northwestern part of the open pit where,
because of the proximity of town, a direct
excavation is carried out. Overburden is
vertically divided into floors of 15 and 10 m,
which the rope shovel excavators EKG-15,
EKG 12,5, EKG 5. EKG 4.6 and EŠ6/45
operate. Transport of overburden is carried
by trucks from TEREX T100 to the internal
landfill or to the DTO system. DTO system
consists of a crusher Krupp - Fodertehnik,
hour capacity of 2400 t/h, 6 belt conveyors,
width B = 1500 mm and belt spreader
ARS1400/25+30.
Figure 1 Technological system of over burden mining
Technological system of coal mining
consists of the following technological pro-
cesses: Preparation works Drilling and blasting Excavation and loading Truck transport Run-of-mine coal processing
The excavated coal is transported by
the existing truck fleet to a plateau for
coal disposal, with the exception of
amount of 100.000 tons annually from the
northwestern part of the OP Potrlica that is
directly from the site transported to the
facility for coal pre-paration and separa-
tion. The other amounts of coal, with
transshipment on the plateau, are further
transported to the plant for coal crushing
and disposal of the TPP Pljevlja.

No. 1-2, 2017 Mining & Metallurgy Engineering Bor
95
Figure 2 Technological system of coal mining
PHYSICAL-MECHANICAL
CHARACTERISTICS OF THE FIELD
Coal and overburden mining at the open
pit Potrlica are carried out in the central and
northwestern part of the deposit, and the
mining conditions are very complex.
Physico-mechanical characteristics of
the blasting working environment are listed
in Table 1 and Table 2.
Table 1 Physical - mechanical characteristics of marl
Marl
Compressive strength αc = 182 dN/cm2
Bulk density of marl γ = 16.00 – 19.70 kN/m3
Bulk density of marly clay γ = 23.17 kN/m3
Looseness coefficient kr = 1.3
Propagation speed of longitudinal waves Vm = 2.000 m/s
Fissure degree II i III kategorija
Cohesion csr = 1,382.50 kN/m2
Angle of internal friction fsr = 28.80o

No. 1-2, 2017 Mining & Metallurgy Engineering Bor
96
Table 2 Physical-mechanical characteristics of coal
Coal
Compressive strenght αc = 156 dN/cm2
Bulk density in natural state γ = 12.30 – 14.80 kN/m3
Clayey thin seans between the coal seams γ = 23.05 kN/m3
Underlaying clays γ = 23.55 kN/m3
Looseness coefficient kr = 1.3
Propagation speed of longitudinal waves Vm = 1,290 – 1,800 m/s
Cohesion csr = 3,100 – 4,800 kN/m2
Angle of internal friction fsr = 33o – 47
o
DRILLING AND BLASTING AT
THE OP POTRLICA
Review the Drilling Equipment
Drilling of boreholes, diameter of 115
mm, at drilling angle of 70o, as the slope of
floor, are carried at the OP Potrlica. Length
of boreholes is different depending on the
height of floors or thickness of overburden
and coal seam thickness.
At the OP Potrlica, taking into account
the properties of the working environment,
the rotary drilling system is applied.
The following hydraulic rotary drills are
used for this purpose:
BÖHLERR TCD-222
SANDVIK Di 310
ATLAS COPCO ROC L6-25
Types of Explosives and Blasting
Equipment
At the OP Potrlica, four types of explo-sives are used, and the good results are achieved by thei previous applications. The An-Fo and emulsion explosives are produ-ced in-situ in a special vehicle for production of explosives. From catridge explosives, the ammonium nitrate explosives are used of producer Poliex from Berane, as well as the cartridge waterplastic explosives, also Poliex producer. At the open pit, 80% of boreholes consist of dry boreholes, so that the An-Fo and carftridge amonium nitrate explosives have the largest use. Table 3 shows the characteristics of explosive used at the OP Potrlica.
Table 3 Characteristics of explosive used at the OP Potrlica
Characteristics
Explosives– An-Fo
vehicle
CARTRIDGE
EXPLOSIVES
An-Fo
Emulsion
Explosives
(Blendex 70/80)
Powder
Explosives
Waterplastic
Explosives
Density (kg/dm3) 0.85– 0.95 1.14-1.32 1.05-1.15 1.4 – 1.5
Detonation rate (m/s) 3900 5100 4,100 ± 200 5,500 – 5,800
Gustina zapr. (kg/m3) 920-995 1,010 940 1,020
Explosive heat (kJ/kg) 3,661-3,800 +3,000 4,160 3,474
Detonation transmission (cm) contact contact contact contact
Working capacity (cm3)
Trauzl equivalent test 290-300 370-455 360 ± 10 400

No. 1-2, 2017 Mining & Metallurgy Engineering Bor
97
A vehicle is used at the OP Potrlica for
machine charging of explosives (Figure 3).
It is a special vehicle TTT for produc-
tion of explosives based on the mixtures of
ammonium nitrate. The vehicle has a possi-
bility to produce various types of explo-
sives. The produced explosives can be di-
vided into two groups:
1. The first group consists of explosives
used in dry boreholes, i.e. emulsion
explosives. These are explosives that
have more than 60% An-Fo mixture,
and the other part is the emulsion
matrix.
2. The second group consists of explo-
sives used for wet and dampness
boreholes, i.e. pumped explosives.
This group consists the explosives
with the basis of ammonium nitrate
emulsion (over 70%) and the other
part is the An-Fo mixture.
Vehicle capacity and types of explo-
sives are shown in Table 4.
Table 4 Production capacities per types of explosives
Emulsion explosive Pumped explosive
Ratio emulsion
/An-Fo 40/60 30/70 An-Fo 100/0 80/20 70/300
Weight (max) 10,400 kg 12,200 kg 8,600 kg 4,100 kg 5,200 kg 5,900kg
A vehicle chassis is Mercedes Benz,
and vehicle superstructure is an American
manufacturer Tradestar from Utah.
Technical characteristics of vehicle
and reservoir capacity for raw materials
are given in Tables 5 and 6.
Figure 3 An-Fo vehicle for mechanized charging of boreholes

No. 1-2, 2017 Mining & Metallurgy Engineering Bor
98
Table 5 Technical characteristics of vehicle
Model 3341 A 6x6
Capacity 12 t
Inter-wheel base 3600 / 3900 / 4200 / 4500 mm
Engine type V6
Engine power 300 kW /408hp
Max. torque 1850 Nm /1080 min–1
Table 6 Superstructure capacity (raw materials)
Volume Filled Density
Masses for
given% filled
Emulsion tank Cca 3.23 m3 95 % 1250-1350 kg/m
3 4,140 kg
AN bin 10.34 m3 95 % 800 kg/m
3 8,050 kg
Senzibilators/AL 1.00 m3 95 % 200 kg/m
3 195 kg
Diesel fuels 700 m3 95 % 840 kg/m3 560 kg
Additive 1 75 m3 95 % 1000 kg/m3 >75 kg
Additive 2 75 m3 95 % 1000 kg/m3 >75 kg
Water 300 m3 95 % 1000 kg/m3 290 kg
BLASTING PARAMETERS
Since up to 80% of boreholes at the OP
Potrlica are dry boreholes, the An-Fo explo-
sives have have the largest use. A compara-
tive use the An-Fo and cartridge ammonium
nitrate explosives was analyzed.
The calculated blasting parameters are
taken from the current Additional Mining
Project of coal exploitation at the OP Po-
trlica - Pljevlja for the period 2015-2019,
and are given in Table 7.
Table 7 Blasting parameters taken from the AMD DRP 2015-2019.
An-Fo Cartridge explosive
q 0.18 kg/m3 0.107kg/m
3
p 8.82 kg/m' 7.08kg/m'
W 5 m 5 m
a 5 m 5 m
b 4.5 m 4.5 m
Q(H 10) 45 kg 27 kg
Q(H 15) 67.5 kg 40 kg

No. 1-2, 2017 Mining & Metallurgy Engineering Bor
99
The non-electric initiation system, so-
called Nonel system, is used for initiation
the explosive charges in boreholed. A Dual
Delay System is used from many types of
such initiation. Using this type of initiators,
the favorable effects of blasting are achie-
ved. Two Nonel detonators, i.e. one for the
primary and one for the secondary charging,
are used to initiate the blasting charge in
one borehole. In explosive initiation by
Nonel system, a reactive wave extends
through a Nonel tube which does not da-
mage a part of the explosive charge pillar,
what is particularly important for explosives
which are not sensitive to the classic initia-
tion means. When the ANFO, "Slurry" and
other insensitive explosives are initiated
by detonating cord, dead pressing of ex-
plosive charges occur and its combustion
in boreholes. Thereby the effect of frag-
mentation is reduced. A detonating cord is
also used for initiation the cartridge explo-
sives at the OP Potrlica in addition to the
Nonel system.
ANALYSIS OF THE DIRECT
BLASTING COSTS
Consumption of Explosives and
Explosive Means
The prices of explosives and explosive
means from 2016 were used for an analy-
sis. Table 8 presents the calculated norms
of consumption, which are implemented
in the process of exploitation at the open
pit. In addition to the norms, specified in
Table 8, the unit prices of explosives are
also given. The analysis was carried out
for an amount of material of 5,000,000 m3,
which generally corresponds to the annual
production of overburden and coal with
applied these types of explosives.
Table 8 Norms of consumption and unit prices
Normative material Norms of consumption Unit price
Nonel 0.128 m'/m3 0.23 €/m'
Detonating cord 0.072 m'/m3 0.2 €/m'
Retarders 0.004 kom/m3 1.25 €/pcs.
Safety fuse 0.000002 m'/m3 0.2 €/m'
Mining lighter 0.000002 pcs./m3 0.23 €/pcs.
Analysis of direct costs was carried out
for three types of explosives and initiation
means:
Variant 1 - Mechanized charging of
An explosives-Fo – initiation by the
Nonel system
Variant 2 – Cartridge explosives – ini-
tiation by the Nonel system
Variant 3 - Cartridge explosives - ini-
tiation by detonating cord
Values of the specific and in annual
costs of blasting are direct consequences
of the calculated norms of consumption by
certain variants. All relevant parameters
were taken into account in calculation of
norms that influence the consumption of
explosive and initiation devices. First of all,
those are a floor height, length of borehole,
geometry of the minefield, method and
diagram for connection the explosive
charges within the minefield and construc-
tion of blasting charge. Taken all these fac-
tors into account, the specific costs of blas-
ting were calculated by m3 (Figure 4) and
annual blasting costs (Figure 5) by the ana-
lyzed variants.

No. 1-2, 2017 Mining & Metallurgy Engineering Bor
100
Figure 4 Specific costs of blasting for three variant in € per m3
Figure 5 Annual costs of blasting for three variants given in euros
LABOR FORCE ENGAGED IN
BLASTING
Blasting is a complex operation in the
technological process of exploitation. There-
fore it is the first operation in the techno-
logical process of production, the all other
technological operations are dependent on
its success.
According to the current systematization
in the coal mine Pljevljana, 16 workers are
deployed on drilling and blasting operations,
out ofwhich 10 workers are deployed on
blasting. The existing systematization of
jobs in blasting is done in accordance with
0.117
0.135
0.125
0.105
0.110
0.115
0.120
0.125
0.130
0.135
0.140
Varijanta 1 Varijanta 2 Varijanta 3
Troškovi miniranja €/m3 Mining costs €/m3
Variant 1 Variant 2 Variant 3
584,204
676,404
627,454
520,000
540,000
560,000
580,000
600,000
620,000
640,000
660,000
680,000
700,000
Varijanta 1 Varijanta 2 Varijanta 3
Godišnja cena miniranja €
Variant 1 Variant 2 Variant
Annual mining price €

No. 1-2, 2017 Mining & Metallurgy Engineering Bor
101
the technology of blasting that was under-
taken before purchasing a vehicle. By intro-
duction the mechanized charging of bore-
holes, a necessary space is created for ra-
tionalization the labor force.
This primarily refers to the support
workers engaged in heavy physical works
(scheduling the packages of cartridge explo
sives across a minefield, etc.). It is not nec-
essary in mechanized charging of boreholes
because a complete transport of explosives
from the storage to the incorpo-ration into
the borehole is carried out by An-Fo vehicle.
Table 9 presents the existing systematization
of jobs with the number of employees and
the level of income on blasting jobs.
Table 9 Systematization of jobs on blasting
Job position of
employee
Profess.
clasif.
No. of em-
ployee
Gross monthly
wage of
employees
Total
Gross
annual
wage
Bla
stin
g
Chief engineer for
drilling and blasting
Univer.
degree 1 1,530 1,530 18,360
Foreman for drilling
and blasting
High school
ed. 1 1,190 1,190 14,280
Igniter of blasts High school
ed. 2 1,105 2,210 26,520
Driver of vehicle for
explosive
Highly quali-
fied worker 1 1,020 1,020 12,240
Operator of vehicle
for An-Fo explosives
Highly
qualified
worker
1 1,020 1,020 12,240
Assistant of igniter
of blasts
Unqualif.
worker 4 850 3400 40,800
After the analysis of three variants of
blasting, the cost savings were calculated in
implementation the mechanized method of
blasting with explosives An-Fo (Variant 1),
and they are shown in Table 10. The savings
are given in relation to the blasting techno-
logy with cartridge explosives when the
initiation is performed by the Nonel system
(Variant 2), and when the initiation is per-
formed by a detonating cord (Variant 3).
Table 10 Blasting costs per analyzed variants and savings in introduction the
mechanized method of charging the boreholes
Variant 1 Variant 2 Variant 3
Blasting costs 0.117 €/m3 0.135 €/m
3 0.125 €/m
3
Annual price of blasting 584,204 € 676,404 € 627,454 €
Labor costs 86,700 € 131,580 € 131,580 €
Total 670,904 € 807,984 € 759,034 €
Savings by introduction of
mechanized charging
/ 137,080 € 88,130 €
/ 17 % 12 %

No. 1-2, 2017 Mining & Metallurgy Engineering Bor
102
It is seen in Table 10 that the annual
savings in Variant 1 as compared to Variant
22, is € 137.080, and 17% respectively,
and the savings with respect to Variant
3,88,130 € or 12% compared to total costs
of blasting according to Variant 1.
CONCLUSION
In addition to the benefits of application
the mechanized charging relating to the
direct cost savings that have been presented
in the paper, there are also the indirect cost
savings. Applying the An-Fo explosives
achieve better results in blasting (better ma-
terial granulation) what directly affects the
other technological processes.
Granulation of blasted materials directly
affects the process of excavation and load-
ing, as well as the technological process of
crushing, which is expressed by a higher
energy efficiency. The direct impact of blas-
ting effects is also on the extent of enga-
gement the auxiliary mechanization.
The use of mechanized charging the
boreholes enables more economical, safer,
more efficient and easier operation in perfor-
ming the technological process of blasting.
REFERENCES
[1] Additional Mining Project of Coal
Mining at the Open Pit "Potrlica" -
Pljevlja for the Period 2015 – 2019 (in
Serbian)
[2] Simplified Mining Project on Over-
burden Drilling and Blasting at the
Open Pit “Potrlica” - Plevlja 2013(in
Serbian)
[3] Purtić N., Drilling and Blasting, 1991,
Faculty of Mining and Geology,
Belgrade (in Serbian)
[4] Savić M., Blasting at the Open Pits (in
Serbian)

No. 1-2, 2017 Mining & Metallurgy Engineering Bor 103
MINING AND METALLURGY INSTITUTE BOR ISSN: 2334-8836 (Štampano izdanje)
UDK: 622 ISSN: 2406-1395 (Online)
UDK: 546.34:504.06(045)=111 doi:10.5937/mmeb1702103S
Boris Siljković*, Nebojša Denić**, Goran Rakić***
ENVIRONMENTAL AND ECONOMIC ASSESSMENS
THE EFFECT OF CRITICAL MINERAL OF
GREEN REVOLUTION - LITHIUM
Abstract
In this paper, we wanted to explain the phenomenon of economic and environmental effect of
the green mineral lithium in the world and our country. We started with an answer to the question
why the mineral lithium is the future and support for the green revolution in the world. We have
tried to also give a special dimension to tendencies and activities with regard to the usage of green
mineral lithium in the world market. In addition, the paper presents the Jadar project and mineral
lithium as economic and environmental opportunity for Serbia.
Keywords: lithium, green revolution, Jadar project
* The High Economic School of Applied Studies, Peć-Leposavić e-mail: [email protected]
** Priština University, Faculty of Sciences and Mathematics,e-mail: [email protected]
*** Alfa BK University, Belgrade, Faculty of Finance, Banking and Auditing,
e-mail: [email protected]
1 INTRODUCTION
The current world economic crisis and
enormous over-exploitation of crude oil and
petroleum products indicates the untenable
situation in the system of environmental
protection and sustainable development.
Energy reserves on the planet are drastically
reduced and mankind has not found yet a
sufficient and adequate substitute for con-
ventional energy generating products. It was
this very fact that initiated research with the
aim to find the new material and mineral
resources replacing the traditional energy
sources in order to preserve the environ-
ment and sustainable development. This
article strives to demonstrate (taking into
account that the oil was economic energy
source of the 20th century) the environmen-
tal and economic assessment the effect of
lithium as the green revolutionmaterial, and
energy of the 21st century.
Lithium was first discovered by the
Swedish chemist Johan August Arfwedson,
back in 1817.
In this paper, it will be proved that the
presence of lithium mineral is so great that
it has been used everywhere from glass and
ceramics to fat and polymer, and even in
medicine. Through the paper it will be stud-
ied if there are sufficient reserves of lithium
at the global level, but also in Serbia, be-
cause it is estimated that it will be used at
least until the end of the 21st century up to
2100.
In the era of green revolution, a key role
will be taken by the electric cars as a new
green phenomenon with plenty of room in
many economies in the world. This leads us
to an answer to the question whether the
lithium reserves today are sufficient to meet
demand of electric vehicles using lithium-

No. 1-2, 2017 Mining & Metallurgy Engineering Bor 104
ion batteries in the era of green revolution.
A special section will refer to the research
of availability and usefulness of this mineral
in our country.
2 MINERAL LITHIUM,
THE FUTURE AND SUPPORT
FOR THE GREEN REVOLUTION
Lithium with a purity of 99.5% as a
chemical element in perspective will be in
great demand because it is used by the
smart phones, electric cars, hybrid cars, and
so on. Thus, lithium is used in a wide range
of products, from ceramics to the solar cells.
Rechargeable batteries and electric batteries
provide the most room for growth of lithi-
um compounds. According to a recent study
of BMW, depending on the model of bat-
tery, in the world, the average use is from
80 to 130 grams of metallic lithium per kil-
owatt 10. Consumption of lithium batter-
ies has increased significantly in recent
years. Rechargeable lithium batteries are
used in smart phones which have 2-3 grams
of lithium, laptops from 30 to 40 grams,
tablets 20 to 30 grams of lithium, hybrid
and electric vehicles from 0.8 to 2 kg of
lithium, electric cars which have 10 to 63
kilograms of lithium, Tesla model S electric
car has 51 kg of lithium carbonate 12. It is
estimated that demand for lithium will be
even greater, from 160,000 tons today to
570,000 tons in 202519.
It is an interesting data that by 2040,
50% of demand for the new batteries could
be met through recycling the electric batte-
ries for vehicles 21. The market of electric
and hybrid vehicles is growing, from 0.4%
in 2012, to 0.7% in 2014, and this is only in
the United States. Toyota, the Japanese au-
tomaker, has sold eight million hybrid vehi-
cles in the past two decades. In 2015, the
Japanese manufacturer Toyota has taken the
lead in the lowest CO2 emissions of
110.1 g/km. Right behind them is Renault -
Nissan and Fiat Chrysler.
In the very near future, the EU plans to
penalize car owners issuing a fine of 95 eu-
ros for every gram of CO2 above the manu-
facturer’s guideline. The new manufacturer
of electric cars Tesla seeks to increase pro-
duction tenfold, and it is from 50,000 elec-
tric vehicles per year presently to half a mil-
lion vehicles by 2018. It is expected that the
electric cars world market will increase up to
100% of the world production of cars by
2025, and these trends indicate the potential
rapid growth of the market of lithium batter-
ies for a period of 20-30 years, indicating a
momentum of lithium carbonate industry,
which is currently still emerging 5. Thus
the industry of electric cars will meet de-
mand for lithium ion batteries in the 21st
century (Table 1).
Plans of Norway expressed through de-
mand for sodium batteries just confirm this.
Proportionally to the number of 5 million
inhabitants, this country has the largest
number of electric vehicles. The Govern-
ment incentives in Norway are very interest-
ing because the all electric cars are exempt
from traditional fees and taxes (VAT 25% of
the vehicle price without taxes). Oslo, the
capital of Norway, in addition to this, hasla-
nes for electric vehicles, privileged parkings
for electric vehicles and so on. There are
also plans to ban the sale of traditional gaso-
line engines in Norway by 2025. This eco-
nomy went a step further, and the trend is
towards eco-standards of the EU, so that the
vehicles that emit less than 50 g CO2/km are
exempt from the annual taxes. Up to
6,300 US dollars is being allocated for the
purchase of commercial electric vehicles in
the United Kingdom. Electric cars in China
are exempt from excise and purchase taxes
based on engine displacement. Incentives for
the purchase of electric cars in China are in
the range from $6,000 to $10,000 USD. In
2016, China announced its plans to build
12,000 stations for electric vehicles provid-
ing support for five million electric vehicles
by 202020.

No. 1-2, 2017 Mining & Metallurgy Engineering Bor
105
Table 1 Deutsche Bank forecasts and trends of lithium supply and
demand 2015-2025 14
Year 2015 2016 2017 2018 2019 2020 2021 2022 2023 2024 2025
Country
Lithium supply
(in kt)
Chile 63 64 65 75 85 100 110 110 110 110 110
% growth 2% 2% 16% 16% 13% 18% 10% 0% 0% 0% 0%
Australia 57 69 97 112 130 159 181 186 196 206 206
% growth 40% 21% 40% 15% 16% 23% 14% 3% 5% 5% 0%
Argentina 19 31 36 41 46 48 69 103 138 153 153
% growth 4% 63% 16% 14% 12% 5% 44% 49% 34% 11% 0%
China 18 23 28 35 35 35 35 35 37 38 43
% growth -16% 29% 22% 25% O% 0% 0% 0% 6% 3% 13%
SAD 4.5 4.5 6.0 6.0 6.0 6.0 6.0 6.0 6.0 6.0 6.0
% growth 0% 0% 33% 0% % 0% 0% 0% 0% 0% 0%
Rest of the world 10 10 10 10 10 10 10 10 10 10 30
% growth 0% 0% 0% 0% 0% 0% 0% 0% 0% 0% 0%
Total kt 171 201 242 278 311 358 411 450 497 523 548
% growth 9% 18% 20% 15% 12% 15% 15% 9% 10% 5% 5%
Lithiumdemand/
(in kt)
Electricvehicles 25.1 39.7 50.4 68.7 82.4 109.4 128.0 146.9 166.0 185.5 204.8
% growth 152% 58% 27% 36% 20% 33% 17% 15% 13% 12% 10%
Energy storage 0.4 0.7 1.4 2.2 4.3 5.8 7.7 11.1 15.9 23.4 33.8
% growth 0% 62% 96% 57% 92% 36% 32% 45% 43% 47% 45%
Electric bicycles 2.9 7.1 16.9 28.6 41.7 53.6 60.3 67.1 73.8 73.8 73.8
% growth 0% 145% 136% 70% 45% 29% 13% 11% 10% 0% 0%
Glass,ceramics 42.6 44.0 45.7 47.3 49.1 50.9 52.8 54.7 56.8 58.9 61.0
% growth -3 3% 4% 4% 4% 4% 4% 4% 4% 4% 4%
Batteries
(traditional market) 45.6 46.3 48.1 50.2 53.1 55.0 56.4 57.8 59.3 61.0 52.7
% growth 11% 1% 4% 4% 6% 4% 2% 3% 3% 3% 3%
Fat 19.0 19.6 20.3 21.0 21.7 22.5 23.2 23.9 24.7 25.5 26.3
% growth 13% 3% 3% 3% 3% 3% 3% 3% 3% 3% 3%
Air treatment 7.3 7.5 7.8 8.1 8.4 8.7 9.0 9.3 9.7 10.0 10.4
% growth -9 3% 4% 4% 4% 4% 4% 4% 4% 4% 4%
Polymer 6.2 6.3 6.5 6.7 7.0 7.2 7.3 7.5 7.7 7.9 8.1
% growth -4 3% 3% 3% 3% 3% 3% 3% 3% 3% 3%
Medical materials 6.7 6.8 6.9 6.9 7.0 7.1 7.1 7.2 7.3 7.4 7.4
% growth 20% 1% 1% 1% 1% 1% 1% 1% 1% 1% 1%
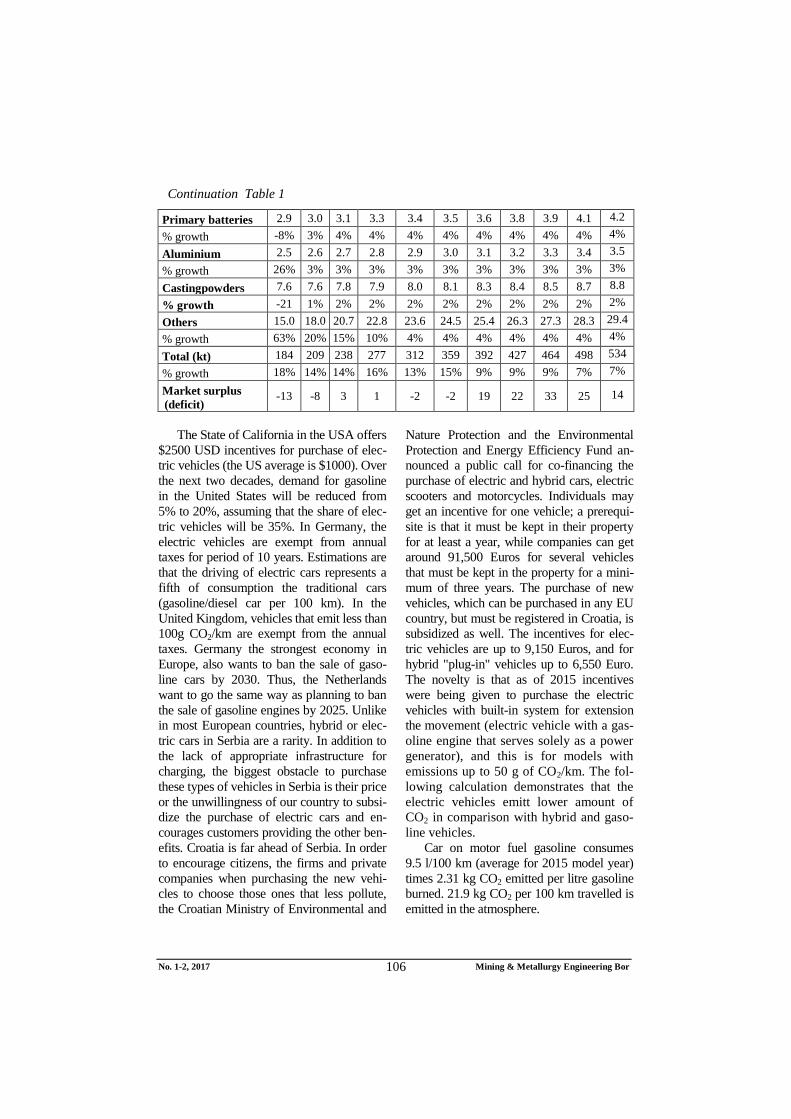
No. 1-2, 2017 Mining & Metallurgy Engineering Bor
106
Continuation Table 1
Primary batteries 2.9 3.0 3.1 3.3 3.4 3.5 3.6 3.8 3.9 4.1 4.2
% growth -8% 3% 4% 4% 4% 4% 4% 4% 4% 4% 4%
Aluminium 2.5 2.6 2.7 2.8 2.9 3.0 3.1 3.2 3.3 3.4 3.5
% growth 26% 3% 3% 3% 3% 3% 3% 3% 3% 3% 3%
Castingpowders 7.6 7.6 7.8 7.9 8.0 8.1 8.3 8.4 8.5 8.7 8.8
% growth -21 1% 2% 2% 2% 2% 2% 2% 2% 2% 2%
Others 15.0 18.0 20.7 22.8 23.6 24.5 25.4 26.3 27.3 28.3 29.4
% growth 63% 20% 15% 10% 4% 4% 4% 4% 4% 4% 4%
Total (kt) 184 209 238 277 312 359 392 427 464 498 534
% growth 18% 14% 14% 16% 13% 15% 9% 9% 9% 7% 7%
Market surplus
(deficit) -13 -8 3 1 -2 -2 19 22 33 25 14
The State of California in the USA offers
$2500 USD incentives for purchase of elec-
tric vehicles (the US average is $1000). Over
the next two decades, demand for gasoline
in the United States will be reduced from
5% to 20%, assuming that the share of elec-
tric vehicles will be 35%. In Germany, the
electric vehicles are exempt from annual
taxes for period of 10 years. Estimations are
that the driving of electric cars represents a
fifth of consumption the traditional cars
(gasoline/diesel car per 100 km). In the
United Kingdom, vehicles that emit less than
100g CO2/km are exempt from the annual
taxes. Germany the strongest economy in
Europe, also wants to ban the sale of gaso-
line cars by 2030. Thus, the Netherlands
want to go the same way as planning to ban
the sale of gasoline engines by 2025. Unlike
in most European countries, hybrid or elec-
tric cars in Serbia are a rarity. In addition to
the lack of appropriate infrastructure for
charging, the biggest obstacle to purchase
these types of vehicles in Serbia is their price
or the unwillingness of our country to subsi-
dize the purchase of electric cars and en-
courages customers providing the other ben-
efits. Croatia is far ahead of Serbia. In order
to encourage citizens, the firms and private
companies when purchasing the new vehi-
cles to choose those ones that less pollute,
the Croatian Ministry of Environmental and
Nature Protection and the Environmental
Protection and Energy Efficiency Fund an-
nounced a public call for co-financing the
purchase of electric and hybrid cars, electric
scooters and motorcycles. Individuals may
get an incentive for one vehicle; a prerequi-
site is that it must be kept in their property
for at least a year, while companies can get
around 91,500 Euros for several vehicles
that must be kept in the property for a mini-
mum of three years. The purchase of new
vehicles, which can be purchased in any EU
country, but must be registered in Croatia, is
subsidized as well. The incentives for elec-
tric vehicles are up to 9,150 Euros, and for
hybrid "plug-in" vehicles up to 6,550 Euro.
The novelty is that as of 2015 incentives
were being given to purchase the electric
vehicles with built-in system for extension
the movement (electric vehicle with a gas-
oline engine that serves solely as a power
generator), and this is for models with
emissions up to 50 g of CO2/km. The fol-
lowing calculation demonstrates that the
electric vehicles emitt lower amount of
CO2 in comparison with hybrid and gaso-
line vehicles.
Car on motor fuel gasoline consumes
9.5 l/100 km (average for 2015 model year)
times 2.31 kg CO2 emitted per litre gasoline
burned. 21.9 kg CO2 per 100 km travelled is
emitted in the atmosphere.

No. 1-2, 2017 Mining & Metallurgy Engineering Bor
107
Electric car: 17.9 kWh/100 km (70 kWh
Tesla Model S), with the charger efficiency
80% (factory of electric cars Tesla claims
that some users report 95%, and some users
report 80%) times 0.527 kg CO2 per kWh
(EPA average, includes line losses on the)
equals 11.8 kg CO2 per 100 km travelled.
The average American using a gaso-
line vehicle emits around 300 g CO2/km,
while the new hybrid, a mixture of electric
and gasoline vehicle emits 180 g CO2/km.
The law requires that the new vehicles
registered in the EU by 2015 do not emit
more than an average of 130 g of CO2/km
16. By 2021, according to the new Euro-
pean standard for CO2 emission, the re-
quirement to be achieved by the new cars
is 95 grams of CO2 per kilometre with a
gradual reduction to 65-70 g/km by 2025
and 65-70 g/km by 203013.
Table 2 Number of registered EV, the EV market share, CO2 emissions, the number of public
and private charging stations, the total number of EVs per million inhabitants in the
world 2014-2015 16
Year 2015 2014 2014 2015 2015
Country
Number of
registered
electric
vehicles
Market
share by
countries
Emissions of new
passenger cars g
CO2/km(*)
Number of
private and public
charging stations
Total number of
electric vehicles
per million
inhabitants*
China 600000 1.0 - 46657
(Pu and Pr) 265
SAD 474000 0.7 225 28150 (Pu) 1340
U.K. 91000 1.0 125 8716 (Pu) 933
Norway 135000 23.3 110 6357 (Pu) 15143
Germany 75000 0.7 132 4787 (Pu) 664
Holland 113000 9.7 108 17786 (Pu) 6280
France 108000 1.2 115 10122
(Pu and Pr) 970
Slovenia 239 - - - -
Croatia 87 - - -, -
Serbia 13 - - - -
3 TENDENCIES AND TRENDS ON
THE WORLD MARKET RELATED
TO THE GREEN MINERAL
LITHIUM
Trends on the world market show that
lithium will be more profitable and that this
mineral is getting epithet as pointed out by
Goldman Sachs – the new gasoline or white
oil. It envisages that its use in electric vehi-
cles will grow 11 times and that is more than
300,000 tonnes by 2025. This calculation
becomes obvious when the fact is taken
into account that hybrid and electric cars
contain 40 to 80 kilograms of lithium 7.
This is confirmed by the price of lithium per
ton which escalated in China from $7,000 in
a mid 2015 to over $20,000 per ton of lit-
hium in March 2016, so that the prices in the
reporting period have grown more than
300% (Graph 1).

No. 1-2, 2017 Mining & Metallurgy Engineering Bor
108
Graph 1 Change the price of lithium in China, January 2015- March 201615
Demand for lithium in the world grew
by 11 percent between 2010 and 2015,
and export price of 99 percent pure lithi-
um carbonate in China has more than
doubled at the end of 2015. It is expected
that theglobal demand for lithium will
grow from 280,000 to 285,000 tons by
2020 (in 2015 was 163,000 tons). A half
of the lithium carbonate world market is
controlled by only two companies. At this
stage during 2016, the market is supplied
by the Greenbushes mine in Western Aus-
tralia, which is the property of Talison
Lithium (51% owned by China Chengdu
Tianqi, and the rest owned by giant che-
mical industry Albemarle based in Baton
Rouge, Louisiana). Australia, Chile, and
Argentina are the largest producers of
lithium with 89% of production in the
world (Figure 1).
Figure 1 Lithium producing countries in the world in 2015 (percentage) 20 (Source: U.S. Geological Survey)
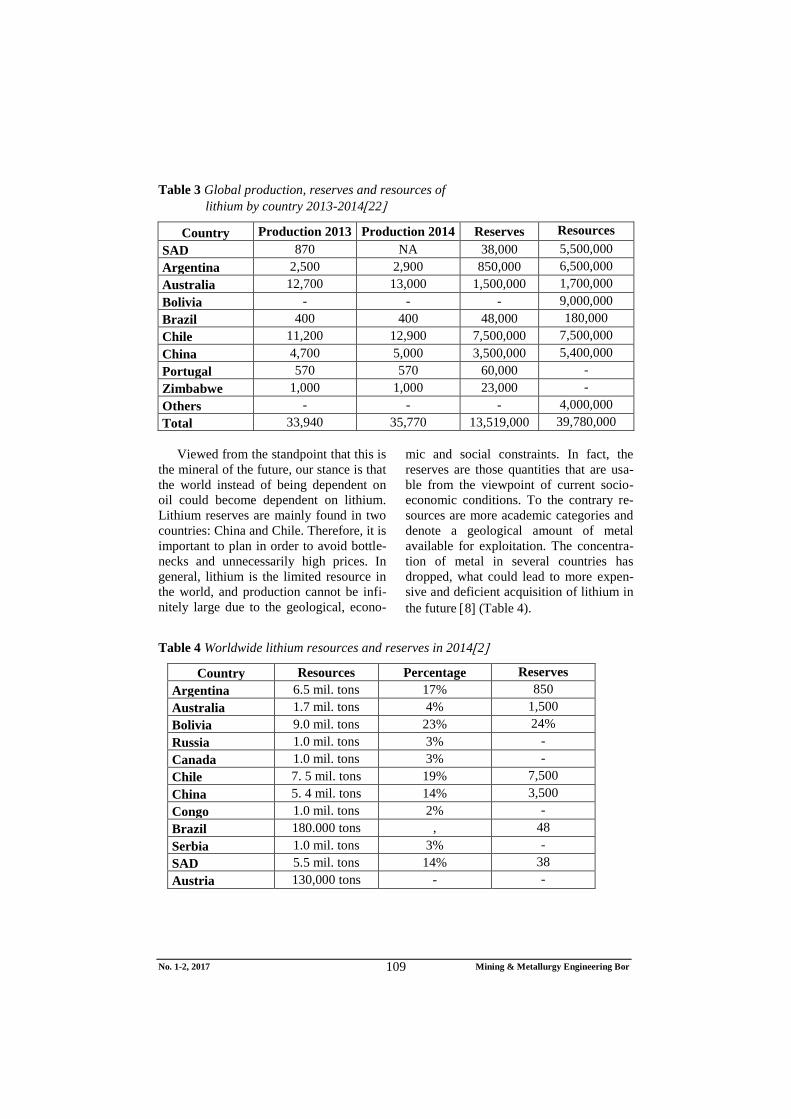
No. 1-2, 2017 Mining & Metallurgy Engineering Bor
109
Table 3 Global production, reserves and resources of
lithium by country 2013-201422
Country Production 2013 Production 2014 Reserves Resources
SAD 870 NA 38,000 5,500,000
Argentina 2,500 2,900 850,000 6,500,000
Australia 12,700 13,000 1,500,000 1,700,000
Bolivia - - - 9,000,000
Brazil 400 400 48,000 180,000
Chile 11,200 12,900 7,500,000 7,500,000
China 4,700 5,000 3,500,000 5,400,000
Portugal 570 570 60,000 -
Zimbabwe 1,000 1,000 23,000 -
Others - - - 4,000,000
Total 33,940 35,770 13,519,000 39,780,000
Viewed from the standpoint that this is
the mineral of the future, our stance is that
the world instead of being dependent on
oil could become dependent on lithium.
Lithium reserves are mainly found in two
countries: China and Chile. Therefore, it is
important to plan in order to avoid bottle-
necks and unnecessarily high prices. In
general, lithium is the limited resource in
the world, and production cannot be infi-
nitely large due to the geological, econo-
mic and social constraints. In fact, the
reserves are those quantities that are usa-
ble from the viewpoint of current socio-
economic conditions. To the contrary re-
sources are more academic categories and
denote a geological amount of metal
available for exploitation. The concentra-
tion of metal in several countries has
dropped, what could lead to more expen-
sive and deficient acquisition of lithium in
the future 8 (Table 4).
Table 4 Worldwide lithium resources and reserves in 20142
Country Resources Percentage Reserves
Argentina 6.5 mil. tons 17% 850
Australia 1.7 mil. tons 4% 1,500
Bolivia 9.0 mil. tons 23% 24%
Russia 1.0 mil. tons 3% -
Canada 1.0 mil. tons 3% -
Chile 7. 5 mil. tons 19% 7,500
China 5. 4 mil. tons 14% 3,500
Congo 1.0 mil. tons 2% -
Brazil 180.000 tons , 48
Serbia 1.0 mil. tons 3% -
SAD 5.5 mil. tons 14% 38
Austria 130,000 tons - -
No. 1-2, 2017 Mining & Metallurgy Engineering Bor
110
4 THE JADAR PROJECT -
ENVIRONMENTAL AND
ECONOMIC OPPORTUNITY FOR
SERBIA AND MINERALS LITHIUM
AND BORATES
A discovery of Jadarite has taken place
relatively recently. It was discovered in 2004
by a geologist Bob Kellie in Jadarit valley
near the village of Draginac in the pictur-
esque valley on the Cer Mountain near the
town of Loznica. Jadarite is an excellent
source of lithium and borate. Lithium is an
important component that is mostly used in
hybrid and electric cars. Borat in jadarite can
be used for products such as glass, ceramics,
fertilizers, detergents and many other prod-
ucts. Serbia with the Jadarit mine covers 3%
of the resources in the world, and 10% of the
world demand for this resource with 80% of
reserves in Europe. Researches, conducted
by Rio Tinto clearly, tell us that this mine is
rich in lithium and borate prompting scien-
tists to name it Jadarit. According to an as-
sertion, made by the company Aker Solu-
tions, the sites at 300-600 meters depth with
approximately 227 million tons of ore Jada-
rite could provide 1.6 million tons equiva-
lent of lithium carbonate, and 8.1 million
tons of boric acid 17. The other studies
support this endeavour and as of 2013 Jada-
rite mineral resources are estimated at 118
million tons at an average grade of 1.6%
lithium oxide, and 18 million tons of re-
sources borate 23. So far, Rio Tinto has
invested about 70 million dollars in the Jadar
project.
Donji Jadarit (Lower Jadarit) zone has
125.3 million tons of Jadarite ore at a
weighted average of lithium oxide LiO2 with
concentration of 1.8%, and 16.2 million tons
of borates B2O3 or 12.9% borate 9. The
Borate project in Serbia comes amid fore-
casts of increase in the global demand for
these minerals on the market in value of
about 4.9 billion dollars annually 3. It is
expected that the global demand for borates
B2O3 will increase up to 2.2 million tons
(Mt) in 2018, compared to 1.5 million tons
(Mt) in 2009. Using fairly conservative cal-
culation for Jadarite ore, it represents a fi-
nancial value of 80 billion dollars for Donji
Jadarit zone1.
Price of boric acid as borate product is in
favour of the Jadar project and ranged from
800 to 1000 dollars per ton in 2015. China is
the biggest borate consuming country with
GDP which generally in this economy is
slowing down, but with a robust demand for
borate. Global consumption in the world is
expected to remain strong, primarily in the
ceramic industry, agriculture and other activ-
ities in which the borate is being used. Un-
like many raw materials such as iron ore and
coal, demand for borate is more correlated
with middle and higher class of durable con-
sumer goods. US are the second largest bo-
rate consuming country in the world. Global
demand for borate will reach 2.2 million
tons in 2018, compared to 1.5 million tons in
2009 4. With this lithium and borate re-
source potential, Serbia could be well posi-
tioned on the green minerals market. The
Jadarit mine would directly employ 450
people and about 800 to 1,000 workers in
the very near future that would be indi-
rectly related to the mine. With a designed
exploitation for 50 years, the Jadarit mine
should ensure not only the long term eco-
nomic prosperity of the region, but the
whole of Serbia. Some estimation show
that the Jadarit mine near Loznica would
bring 30-40% of total re-venues of the
municipality. If the experience of Bolivia
is used, it is very interesting because this
country has large lithium reserves under
the Uyuni salt desert, which is at this point
and tourist attraction of the country. In

No. 1-2, 2017 Mining & Metallurgy Engineering Bor
111
addition to the ore extraction, the Presi-
dent Evo Morales asked investors to open
a lithium battery factory, and even start
producing the electric cars. We suggest
that Serbia just like Bolivia use this ex-
pensive and rare mineral and that this
mineral becomes a way to initiate an in-
vestment here.
Table 5 Jadarite resources in Serbia14
Tons (Mt) Li2O% LCE Compatible
Donji Jadarit 125.3 1.80% 5.58% JORC Compliant
Gornji Jadarit 46 1.50% 1.71 NI 43-101 Compliant
Srednji Jadarit 34 1.50% 1.26 NI 43-101 Compliant
Total 80 1.50% 2.97 NI 43-101 Compliant
Figure 2 Mineralization in Jadarite divided into upper, middle and lower layer of lithium mineral
and sodium borate (Na2B4O7), calcium borate (Ca2B6O11) and sodium-calcium borate
(NaCaB5O9)14 (Source: Rio Tinto Jadar factsheet, September 2011)
Typical lithium minerals have lithium
content from 0.5% to 2% and in some cases
of extremely high-quality content and over
3% as demonstrated by the geological prop-
erties of lithium in Jadarit shown below
(Table 6). The deadline for the exploitation
of this resource in the world is the longest in
Australia, Canada, the United States, the
Democratic Republic of Congo and Serbia
(in Jadarit). The percentage content of lithi-
um and hence the quality of the ore in Ser-
bia is among the highest in the world. Ac-
cording to some studies, better values of
lithium in the world are only in Australia in
its Greenbushes mine, Canada with Bernic
Lake mine (2009 ceased to be exploited),
Namibia and Zimbabwe, with its Bikita
mine 18.
Table 6 Geological properties of lithium mineral in Jadarit–Serbia8
Name Formula Content(% Li) Hardness Density g/cm3]
Jadarite LiNaSiB3O7(OH) 3.16 4-5 2.5

No. 1-2, 2017 Mining & Metallurgy Engineering Bor
112
5 CONCLUSION
There is a tendency for t lithium in the
next period to become the first mineral of
green revolution that awaits us in the future.
Lithium is not part of the global chain like
oil, coal, iron, copper and other metals, but
it is certainly on its way to become the first
resource of energy supply in the world. The
four main producers Chile, Argentina, USA
and China are controlling 85% of world
supply, and the main reserves of this mine-
ral are located there. Therefore, the price of
lithium will continue to be exerted, and it
will be under continuous exertion by the
major producers, after all, and due to poor
utilization of capacity. The fact confirming
this statement is that today many prices of
goods are in the recession while only the
lithium price is on the rise.
This can lead to the onset of the crisis in
supply of lithium due to a bottleneck, and
that is the reason why prices are high in
perspective, even more than before. In addi-
tion to the above mentioned economies,
Bolivia, Chile and Argentina, in the future
will become the key players in lit-hium in-
dustry. The result of green revolution indi-
cates a shift towards hybrid and electric cars
and thus lithium batteries. As estimated all
these electric cars factories will require
100,000 tons of lithium carbonate by 2021.
This initiative with regard to the use of elec-
tric cars has been continuously supported by
the government initiatives of the major
economies of the world. All this contributed
to the fact that lithium batteries denote
green energy in the world today, and espe-
cially in the future. Many countries are fo-
cused at reducing carbon dioxide emissions
and the use of clean energy has become a
basic question of European and internatio-
nal enviromental policy.
However, the structuring of reserves and
resources in the world, carried out by four
major producers,raises a question of oligo-
poly position of those countries, because
there is a limited number of suppliers and
thus challenged projection of the electric car
factory succes in the world. Due to these
dominant producers, our opinion is that the
potential Jadarit mine in Serbia should be
seeking opportunities. The final goods con-
taining boric acid and sodium carbonate
could meet demand not only in the region,
but wider in Europe and the world. This is
undoubtedly an opportunity for growth in
exports through lithium processing and pro-
duction of final goods.
As per mining and lithium minerals, the
effects of ore processing are visible in three
to five years, and even longer. Money turn-
over in the mining industry is very slow.
Estimatations of Rio Tinto for Jadarit mine
near Loznica show that, although the lit-
hium and boron mine fields in Serbia are
profitable, it takes about six years to orga-
nize the exploitation. Hence, it raises a
question whether the assessments of eco-
nomic and environmental effect of this min-
eral in our country are cost-effective just
from the viewpoint of our economy, be-
cause investments in mining are visible only
in a few years.
REFERENCES
1 B. Moriarty, Lithiumis Sexy, MGX
(2012), http://www.321gold.com.
2 Cui Rongguo, Guo Juan, Yin Liwen,
Dieter Huy, Maren Liedtke, Supply
and Demand of Lithiumand Gallium,
Information Center of Ministry of
Landand Resources, Hanover, May
2016, p.p.12-13.
3 D. Stringer, Rio Unit Bornin Death
Valley Retooled for Battery Boom,
(30.01.2017)
http://www.bloomberg.com/news/artic
les/2017-01-30/rio-unit-born-... (Date
of access: 25.2.2017).

No. 1-2, 2017 Mining & Metallurgy Engineering Bor
113
4 E. Ronald, Boratesin a Nutshell,
Mining Geology, The Global
Headquarters for Applied and Practical
Mining Geology Solutions,
http://www.mininggeology/hq.com/bor
ates-in-a-nutshell/ (Date of access:
24.02.3017).
5 Iron Gigants Go Separate Lithium
Ways, (21.07.2016),
http://investorintel.com/sectors/techno-
logy-metals/technology-metal, (Date
of access: 17.01.2017).
6 Global EV Outlook in 2016, Beyond
One Million Electric Cars,
International Energy Agency, Paris,
p.p. 29 -37 and* ICCT, 2015.
7 H. Sanderson, Material Revo-lution:
Tech Drives A New Resource Era
(14.12.2015)
http://Www.Irishtimes.Com/Business/
Matrerial-Revolution-Tech-Drives-A
(Date of access: 7.3.2017).
8 H. Vikström, S. Davidsson, M. Höök,
Lithium Availability and Future
Production Outlooks, Applied Energy,
110(10), 2013, p.p. 252-256
http://www.journals.elsevier.com/app-
lied-energy/ .
9 I. Krumov, Z. Nanov, J. Kuncheva,
D. Todorovа, S. Stоyanova, S. Simeo-
nova, Porphyry Cu and Epithermal Au
Systems in Serbia and Macedonia.
Sofia University SEG Student Chapter
Field Trip – 2014, National Confe-
rence with International Participation,
Bulgarian Geological Society,
”GEOSCIENCES 2014”, p.p.78.
10 J. Staiger, Lithium – the Substance of
the 21st Century is just Gaining
Momentum, Lithium Report 2016,
(24.08.2016), Swiss Resource Capital
AG, p.p. 11,
http://www.resource-capital.ch.
11 Jadarite Feeds Rio Tinto's Lithium
Battery Powered Future, (18.05. 2016),
http://www.afr.com/business/mining/ja
darite-feeds-rio-tintos-lithium (Date of
access: 8.3.2017).
12 Lithium: The Fuel of the Green
Revolution (14.02.2017),
http://www.visualcapitalist.com/lithiu
m.fuel-green-revolution/ (Date of
access: 9.3.2017).
13 Lovcarboncarsinthe 2020s, Consumer
Impactsand EU Policy Implications,
BEUC, November 2016, Bruxelles,
pp.15.
14 M. Hocking, J. Kan, P. Young, C.
Terry, D. Begleiter, F.I.T.T. for
Investors, Welcome to the Lithium-Ion
Age, Global Lithium S&D Analysis
High Lights Opportunity for High
Quality Assets, 09.05.2016, Deutsche
bank Market research, pp.13.
15 M. Bohisen, Thelithium Boom-An
Analysis Of future Demand vs. Supply
(Date of access: 27.07.2016),
http://seekingalpha.com/article/398465
4-lithium-boom-analysis-futur (Date of
access: 26.2.2017).
16 P. Mock, European Vehicle Market
Statistics, The International Council on
Clean Transportation, Berlin, pp.27.
17 Proposal of Strategy for Management
the Mineral Resources in the Republic
of Serbia up to 2030 (Official Gazette
of RS, No.88/11), Belgrade, 2011, pp.
6 (in Serbian)
18 S. H. Mohr, G. M. Mudd, D. Giurco,
Lithium Resources and Production:
Critical Assessmentand Global Projec-
tions, Minerals, (2), 2012, pp. 70-71
www.mdpi.com/journal/minerals.
19 S. Wang, B. Mukhjejri, Tesla Motor
Shake Supmetals Market with Lithium
Ion Batteries, (07.05.2016),
http://www.theaustralian.com.au/busin
ess/wall-street-journal/tesla-m (Date of
access: 22.2.2017).
20 S. Curose, Lithiumrally Sputters but
Prices Expected to Remain High
(21.10.2016),
http://asia.nikkei.com/Markets/Com
modities/Lithium-rally-sputtersb
(Date of access: 25.2.2017).

No. 1-2, 2017 Mining & Metallurgy Engineering Bor
114
21 Thomas G., Goonan, Lithium USE
inbatteries, U.S. Department of the
Interior, U.S. Geological Survey,
Circural 1371, Reston, Virginia, 2012,
p.p. 10.
22 White oil: A History and Overview of
Lithium Production (14.02.2017),
http.//www.linkedin.com/pulselithium-
productions-overview-cris-gi (Date of
access: 26.02.2017).
23 Yadira Soto Viruet, The Mineral
Industry of Serbia, 2013 Minerals Year
book, Serbia Advance Release, US
Department Interier, US Geological
Survey, Decembar 2014, pp. 4.

No. 1-2, 2017 Mining & Metallurgy Engineering Bor 115
MINING AND METALLURGY INSTITUTE BOR ISSN: 2334-8836 (Štampano izdanje)
UDK: 622 ISSN: 2406-1395 (Online)
UDK: 379.85:006(045)=111 doi:10.5937/mmeb1702115K
Zoran Katanić*, Snežana Todosijević Lazović**, Radmilo Todosijević***
QUALITY MANAGEMENT IN THE TOURISM INDUSTRY
Abstract
The traditional approach to the management in the function of quality the tourist industry has not
offered the high quality product or service. Namely, dissatisfaction is a response to the managerial
approach, reduced customer satisfaction, and small profit. This work points out to a continued access
to the quality, necessity of total quality management, levels of TQM implementation and benchmar-
king. Furthermore, it analyzes the monitoring of quality control to be allocated and coordinated in the
organization.
Keywords: quality, benchmarking, monitoring, TQM
* PhD Student at University Singidunum Belgrade, e-mail: [email protected]
** Faculty of Economics Pristina in Kos. Mitrovica, e-mail: [email protected]
*** Emeritus, e-mail: [email protected]
INTRODUCTION
The issue of quality is a very important
issue in the management theory nowa-
days. Quality, in this sense, is commonly
defined as the ability to meet the needs of
consumers in 100% of time. Undoubtedly,
managers in truly progressive organiza-
tions are concerned about quality. They
understand the basic relationship between
a competitive advantage and ability to
always deliver quality products and ser-
vices to its customers.
Total quality management is a com-
prehensive approach to a continuous im-
provement the whole organization quality.
Every effort done in a context of the total
quality management is focused on build-
ing quality into all aspects of process,
starting from the initial acquisition of re-
sources through the processes and work
systems, along the road to the final deli-
very of products and services to the con
sumers. What is important is that this app-
roach invites all to commit to a continuous
improvement in all aspects of their work.
Not only is the total quality management
focused on the needs and interests of con-
sumers, but it also emphasizes the im-
portance of employee involvement in all
aspects of improving the quality and de-
livery. There is no doubt that the total
quality management will remain an inte-
gral part of the success of the organization
in the future.
1 QUALITY
According to the well-known project
"Profit Impact of Market Strategy", also
known as PIMS program,1 the quality, in
addition to the market share, is the most
important determinant of profitability.
According to this study, in addition to the

No. 1-2, 2017 Mining & Metallurgy Engineering Bor 116
market share, amongst 30 identified fac-
tors, it was shown that the quality is in the
strongest positive correlation with the re-
turn on investment.
Literature defines the term quality very
differently. Thus, a well-known researcher
in this field, W. Edwards Deming, went so
far that the quality is defined as a new
religion.2 However, all these different def-
initions and approaches regarding the
quality, according to PIMS concept can be
summarized in two versions. According to
the first version, the definition of quality
is based on the internal view on quality.
This practically means that the quality is
measured by the internal requirements set
out in the pre-defined specifications. All
activities in this context are aimed at
meeting these internal requirements, de-
fined specifications. Hence, this approach
to the quality is often treated as an internal
view of quality. This approach to the qual-
ity usually results by reducing costs
through an emphasized control of produc-
tion, and other activities in the company.
The second, more important approach
to defining the quality is the so called ex-
ternal perception of quality. It is based on
the consumer's attitude, perception of
product value. According to prof. Charles
Hill, the quality products in the goods and
services are those that are able to satisfy
the sense in which they are designed (de-
signed) to do so3 In the other words, the
quality of products (services) is deter-
mined by a degree of its ability to meet the
needs for which it was manufactured and
offered. Of course, the ultimate judgment
on this possibility, on degree of satisfac-
tion, is given by the consumer himself as
incorruptible arbiter whose needs are met
by your product or service.
The impact of high-quality products on
a competitive advantage of the company is
twofold. First, by providing the high
quality products, the value of such pro-
ducts is increased in the eyes of custo-
mers. In this way, the goal is to gain the
customer’s loyalty, which is in a direct
proportion to the level of product quality.
Bidders, who enjoy consumer loyalty
have, of course, lower marketing costs,
because the customers-service users come
back again even without an extensive ad-
vertising. Loyalty to a particular company
- the hotel is a very effective entry barrier
to the other similar customers, which
leaves the company rooms in the industry
to increase the price of such products, the
more it produces services that are differ-
entiated by the quality of the other, have a
lower price-elasticity.
Another effect of the high quality
companies at a competitive advantage
stems from the high efficiency, i.e. lower
costs realized from a concern about the
quality and content of the offer. The quali-
ty hotel offer provides the twofold way
contribution to a competitive advantage of
the company: through the market situa-
tion, that provides a high sales price, and
through the internal efficiency, which
provides the low operating costs.3
Quality management will predominantly
determine in the future the attitude of the
legal entity towards given future, including
the overall quality in itself, benchmarking,
attitudes toward competition and a complete
and complex attitude to the customer-
defined content offerings. This essentially
means having an active attitude and affirma-
tion of overall business performance inter-
connections.
Due to the intensity changes, be they
quantitative in terms of offer content that
continuous change or increase, or qualita-
tively competitive emphasis on TQM, it is
necessary more than anywhere else, in

No. 1-2, 2017 Mining & Metallurgy Engineering Bor 117
tourism as a propulsive activity, to provide
the business process reengineering, which
appears as a dynamic tool for renewal,
maintenance and increase the economic
power of the entity.
Technical and technological develop-
ment is the result of materialization the re-
sults of scientific research activities and we
are free, despite the views of some promi-
nent authors, to say that the creative innova-
tion and qualitative relationship to it, is the
core of all, where the management activities
implement the innovative and research ac-
tivities into development achievements in
the business processes. Information tech-
nologies that contribute to the acceleration
of scientific, technical and technological
progress, have enabled the effective cross-
functional connectivity, organization and
business processes, where many activities
take place according to a pre-defined soft-
ware. Thus established - networked pro-
cesses, carry with them the presumption
predefined start and continuous quality.
This is applied to the primary, secondary
and tertiary sector. Deterioration in the qua-
lity and processes is only possible by the
controller and manager - a man, because in
case of any discontinuity in the activities,
the system stops and prevents breakdown.
Through the quality, we actually enter into
the process of reversibility when things and
processes are put back to their original state.
Neither innovation nor imitation must
not forget the emphasis on the quality,
because the customers, regardless what is
the object of purchase or sale, are not
ready to respect deviations in the quality.
In terms of development and in terms of
business success, it is necessary to give the
answers to the Latin next questions: Why?
What? How? When? What? Where? Ever?
If we, from the control technology po-
sition, being a key to everything even
business success, delivered high-quality
solutions as a form of answers to the pre-
vious questions, we would approach the
theoretical concept of absolute organiza-
tion. But there is no absolute organization,
due to the fact that we have an intense
effect of changes that occur under the in-
fluence of two upcoming operating pro-
cesses: the competition and technical and
technological progress.
Most theories of economic develop-
ment emphasizes the necessity of technical
progress as well as increase the technical
progress rate. Certain records of accelera-
ting the technical progressis necessary.
This category of development typically
requires the capital, entrepreneurial skills,
managerial and technical skills and trained
labor force, which is generally limited in
the underdeveloped countries. Balance of
payments problems often prevent the im-
port of these factors to a significant extent,
so we have that many less developed coun-
tries depend on the assistance program to
provide some starting points.4 Technical
and technological knowledge and skills,
complemented by experience, appear as the
prerequisites for successful innovation and
development response. Here it is necessary
to add the need for assimilation and expan-
sion the marketing efforts, which may also
occur as a function of business success.
Quality is the position of the present,
but it is necessary that the blocks on offer
and over the content output bears the vi-
sion that should be based on a system of
complex social as well as business fore-
casts, which in turn should serve as an
information base for its operational and
strategic planning which basically causes
planned future. Prognostic futurological
attitudes and the strategic choices of ca-
rriers of operating activities present a
challenge to the intended future, because

No. 1-2, 2017 Mining & Metallurgy Engineering Bor 118
they synchronize with social realities and
makes the process of steady functioning
whole.
According to a broader understanding
the quality, we can present so that TQM is
an opportunity to fundamentally improve
business functions and business processes
in the company, which will result in the
superior products that meet thecustomer
needs and business results that meet the
needs of the top all other stakeholders.5
2 QUALITY AS THE BASIC
ASSUMPTION OF THE TOURISM
DESTINATION MANAGEMENT
Quality as a characteristic of not only
output, but of the overall course of business
activities is a precondition for duration the
continuous innovation. By disregarding the
quality of the commitments of strategic
management, the future of business subject
is at risks. Quality becomes the dominant
approach to the company future.
The need for continuation the opera-
tion alignment and harmonization the
management activities, is conditioned by
the challenges that come from the envi-
ronment, and efforts to address these chal-
lenges as a chance to reply.
Cultural and historical realities as an ex-
pressive and familial tourism resources, and
their environment appear as two main fac-
tors of success the tourist destinations, tak-
ing into account the fact that each branch
and each company is a case for itself.
The prescriptive approach views quali-
ty as a factor to "create", so as to obtain
the maximum strategic advantage.
Modern approach still does not have a
unique view on this question. The results
will be presented in this work. What is
characteristic for it is the emphasis on
human resources in tourism, being hardly
predictable factors of great importance,
because it affects the success of achieving
the goals, in particular the quality strategy
goals. This should affirm the need for
companies to create a close correlation
relationship between their resources, their
exploitation through the process of putting
into use, quality of output and the envi-
ronment.
Due to its specificity, the prescriptive
approach has been more processed and
represented in literature, but it will be
proven that the solution is an optimal if a
successful combination of both approach-
es is achieved. By combination the re-
search methods, the adequate results will
be got, and d the key factors of success
will be determined on the basis of the
quality as the dominant approach to the
modern management.
In the business world, no one is longer
prepared to tolerate lack or deviations from
quality. An offer, process and its structure,
content and outputs on one hand, and as-
sumed demand dynamic on the other side,
are subject to defining, standardizing, plan-
ning and operationalization the quality sys-
tem. The quality, inputs and outputs appear
as a prerequisite of potential business system
success. Starting from the fact that tourism is
primarily a business which uses the existing
structure design offers of tourist destinations
to achieve the positive business success.
Science has found that there is an in-
teraction between system and environ-
ment, but it also exists between parts with-
in a single whole. This interaction leads to
communication informing each other on
the status and changes taking place within
them, that leads to the operation of each

No. 1-2, 2017 Mining & Metallurgy Engineering Bor 119
other. Components organized like this and
their relationship is an organization, as an
organized whole of individual parts.
Science has found that the quality of the
whole and its way of functioning is condi-
tioned by the way of structuring and linking
its parts, as a dynamic structure. This dy-
namic moves within certain limits, since no
system can come into a state of absolute
perfection, only chaos is absolute.
Holistic system concept takes into ac-
count the objective reality of change. It
assumes that the changes are a result of
movement, which objectively changes the
existing balance, or condition. Therefore,
it is determined that everything that exists
in the world, is the result of movement,
and that nothing is created out of nothing,
but out of something. This fact is im-
portant to be able to look for the cause of
certain changes and directing the move-
ment towards change, which will lead to
the specific goals.
Identification of diversity parts in the
system, makes it easy to explore the whole.
Researchers and designers have to make a
grouping of individual differences in the
system, but also of certain similarities. So
grouped similarities and differences change
over time, appear and repeat status changes
in the individual segments or parts of the
whole. This leads to the conclusion that
everything that exists in the world is in all
of the changes, which imposes the need for
researchers to learn about the characteris-
tics of repeatability, or ways, dynamics and
consequences of change.
Holistic is based on the originality of re-
search and findings the most efficient and
most effective ways to achieve the set goals.
3 BENCHMARKING AS AN
EXTERNAL COMPONENT OF TQM
Benchmarking provides a continuous
process of comparison the organization
with the others aimed at finding and exe-
cuting the best practices to ensure the
long-term competitive advantage.9 Quality
revolution or phase in the history of ma-
nagement called the Total Quality Ma-
nagement is based on several important
assumptions:
• labeling the consumer and buyer of
product, i.e. service users, as the
main partner of the business chain;
• orientation towards constant impro-
vement of business, products, services
and attitudes towards work;
• active participation of staff in flows of
value creation and the use of modern
methods and techniques for measu-
ring the business results.
TQM is a special approach to the or-
ganization of business based on quality
management.12
TQM helps to concentrate
on what we do wrong and to find ways to
improve, but always looking at what and
how others are doing, which aims to set
the maximum targets that must be achie-
ved. Disorientation on the market repre-
sents a failure.10
Thus, TQM, which has
primarily an internal character, gets from
benchmarking a comparable foreign com-
ponent. It follows that the benchmarking
is an integral element of the philosophy of
total quality management and continuous
improvement the business culture. It is
this philosophy and approach to that com-
ponent of the development of character
which is essential to any organization.
Differentiation of products and services
through the quality leads to competitive-
ness in designing the best products, ser-

No. 1-2, 2017 Mining & Metallurgy Engineering Bor 120
vices, flexibility and versatility, innova-
tion and time. In both cases, the quality
stands as an essential attribute, as the first
factor that will lead the company or any
organizational system to desired position
in the market. Increasing competitiveness
of the business system represents one of
the ten goals of the business system,
which is achieved by introduction the
quality systems. These objectives are:6
- Design, implementation and certifi-
cation the quality systems provide a full
development of business system and its
subsystems. This means that at any mo-
ment it is known who, how, when and
where activities are carried out related to
the optimal functioning of the business
system to ensure the quality;
- An increase in profits of the business
system;
- Reduction the operating costs;
- Satisfaction and increase the quality
of products and services that achieve
greater economic effects;
- Provision the quality management
from the idea phase to the after use
product phase;
- Reducing the risk that the business
system does not turnout and fail on
domestic and international markets;
- The ability to increase the selling pric-
es on domestic and international mar-
kets based on quality;
- An increase in the price of business
system when changing the ownership;
- Reduction the cost of products and
services that can be realized through
the cost reduction
For quality:
- The meeting market demands, and
- Increasing competitiveness of the
business system.
Regardless the fact that the emphasis of
work is on the control technology in the
tourism industry, the validity of this techno-
logy will be at a much higher and preferred
level if the quality system is included.
Contrary to our views on the evident
benefits of TQM, there are also contro-
versies: investing in quality are unprofit-
able; quality and productivity are incom-
patible; You cannot have both, let alone
to gain the quality over an competitive
advantage.
Historically speaking, it was impossi-
ble to imagine that they will improve the
quality of the way that will increase
productivity, because it was thought that it
had just to decrease !? Quality begins with
the aim of defining management, and is of
great importance for the management,
because it is, if not the only, then the saf-
est way to evaluate the products and ser-
vices.
Given that the business in restaurants
is one of the infrastructure components of
tourism destinations, the previous chart
shows the relationships that are character-
istic for the spinal column or fish skeleton.
This is a diagram “cause – effect” that
typically draw teams of people, usually
members from the ranks of quality, who
are familiar with this problem. Displaying
possible causes of the problem in the form
allows the team to analyze the problem
and find a way of overcoming it.

No. 1-2, 2017 Mining & Metallurgy Engineering Bor 121
Figure 1 Diagram "cause - effect" to appeal to a hamburger restaurant
4 QUALITY CONTROL
MONITORING
A lot of efforts are invested in the
quality control of tourism and its accom-
panying activities, especially in hotels and
restaurants, especially during provision of
services, taking into account the all di-
mensions of time and stages of the pro-
cess: before, during and after. It would be
reasonable if all the deficiencies were
found during a large control. However, the
longer faulty process, more time is needed
for its detection and much more invest-
ment in type and process control.
5 LEVELS OF APPLYING TQM
The acceptance of total quality man-
agement carries with it a presumption of
its application at three levels: the organi-
zational level, process level and business
(executive) level.7
At the organizational level, the quality
refers to meet the basic demands of cus-
tomers or users of services. Organizations
need to seek the answers to the questions
used to assist in defining the quality at this
level:
What products and services meet
customer expectations?
Which are not met?
What products and services are nec-
essary for the guests, and which are
not accepted?
Do guests use the products and ser-
vices they do not need?
The level of processes (functions) in-
cludes the organization functions such as
marketing, design and type of service, ope-
rations, finance, procurement, sales, etc. As
these functions are not independent organi-

No. 1-2, 2017 Mining & Metallurgy Engineering Bor 122
zations and interact, there is a risk to the
quality of management and optimization of
their activities individually in the company
(in the case of a complex enterprise) that
can lead to a de-optimization. Managers at
this level have to answer the questions such
as:
What are the most important prod-
ucts and services for a guest as a
consumer?
Which processes result in these
products and services?
What are the main inputs into the
process?
In which processes are the most sig-
nificant effects on the target consum-
er performance standards?
What are the most important guests –
consumers, and what are their needs?
The executive level (level of task de-
terminations) have already certain stand-
ards based on the quality and compliance
with the customer requirements previously
established at the organizational and func-
tional level. These standards include re-
quirements such as the accuracy, com-
pleteness, innovation, timeliness, and cost
price. For each output of each execution
of the tasks may be to ask the question:
What is common to the requirements
of all types of guests - the consumer?
How will these requirements be
measured (standardized for the pos-
sibility of planning and control)?
What are the specific standards for
each request?
From the perspective of responsibility,
the quality managers for respective level
are responsible for it, as the delegation of
a task delegated the responsibility. The
organizational level focuses on the top
management, level of function or proce-
sses of middle level managers, level of
enforceability or missions of all employ-
ees and managers of that level. It may be
no-ted that all employees in the organiza-
tion are involved in the total quality man-
agement process.
Acceptance of the concept of total
quality helps companies to: 8
• clearly focus on the needs of their
markets,
• achieve superior quality performance
in all areas, not only in the quality of
products and services,
• simple handling procedures necessary
to achieve the quality,
• critically and continuously examine all
processes to eliminate the non-
productive activities and losses,
• witness required improvements and
develop a performance evaluation,
• understand, in whole and in detail
their competitiveness and to develop
the effective competitive strategies,
• develop a team approach to the prob-
lem solving, develop a good commu-
nication and procedures for improve-
ment or confirmation the good work,
• continuous review processes to deve-
lop a strategy of continuous im-
provement - benchmarking.
Quality as a kind of output is essential-
ly a synthesis of a multitude the synchro-
nized activities of a business process.
6 CONCLUSION
Quality is the result of technical equip-
ment of operation and technical contempo-
rary means of production, but also the skill
and knowledge of workers. Achieving the
total quality is a strategic decision, which
involves the entire organization. Quality
management ceases to be a special function,
because it becomes an integral part of the
process, so that the structure and organiza

No. 1-2, 2017 Mining & Metallurgy Engineering Bor 123
tion of the whole take responsibility for
their quality.
The extent of possible changes in the
environment, as a rule, is controlled by a
flow of defined scenarios. It is the infor-
mation that the system - the country - the
company receives from the institutional
environment in which the macro level is
obliged to offer the stability and dynamic
environment in which the existence and
operations are implemented. The challenges
of technological progress and competition,
as a rule find their implementation, depend-
ing on the characteristics of the created en-
vironment. The state usually appears as a
synonym for the environment.
None of models or a group of models
will reveal the truth about the future, but
they can still discover the useful differences
regarding our operating environment and
certain limitations of our capacity to under-
stand this environment. As we do so, we
can make more choices.
It is important to evaluate the synergy
effects resulting from the combination of at
least two dependencies that amplify or
weaken the influential factors. Quality ap-
pears as as assumed constant, dependent on
several variables.
In addition to the synergistic effects of
influential areas, through the control sys-
tem, the reflection effects may be achieved.
These are generally the information society-
state system emitted to the environment,
impacts and other activities that reflect the
environment in another form, and to each
other. Reflecting impacts of the system on
the environment and the environment on the
system should be constantly checked. The
extent of possible changes must be analyzed
and elaborated in order to be able to prepare
and take a position in the strategic orienta-
tions that time beyond the fact of ongoing
changes.
Quality certainly performs reflection
effect and thus affects on gaining the com-
petitive advantages and create the additional
value.
The starting assumption of the need
quality planning is in the functions of gov-
ernment - in the management organizational
system. Quality planning should be viewed
as a continuous process and as part of a
systematic approach in the company func-
tioning as an organizational system.11
The management activities cannot be
carried out without a good planning. Plan-
ning define ex ante situation, one in which
we want to get, and to extend its duration.
For management in the tourism industry, it
is deemed that the project approach would
be suitable, due to the fact that no matter
what such heritage constitutes a whole, it
must be considered individually, because
the act of uniqueness, that each cultural and
historical property has and affirms.
REFERENCES
[1] F. F. Neubauer, Portfolio Manage-
ment, Concept of Profit Potentials and
its Application, Svetlost, Sarajevo,
1991, pp. 73-116 (in Serbian)
[2] M. Walten, The Deming Management
Method, A Perigee Book, 1986, pp. 58
[3] C. W. L. Hill, G. R Jones, Strategic
Management Theory, An Integrated,
Approach, Fourth Edition, Houghton
Mifflin Company, Boston, 1998, pp.
116, pp.130.
[4] Pearce D. W. MacMillan Dictionary of
Modern Economics, 4 Ed. 2003,
pp. 480
[5] Heleta M., Quality Management,
Sigidunum, Belgrade, 2008, pp.28 (in
Serbian)
[6] Mitrović Ž., Quality and Management,
Institute of Agricultural Research,
Belgrade, 1996, pp.19 (in Serbian)

No. 1-2, 2017 Mining & Metallurgy Engineering Bor 124
[7] Brache A.P. and Rummler G.A. Three
Levels of Quality, Quality progress 21,
No. 10, October 1988.
[8] Oakland J.: Total Quality Mana-
gement, Grower Handbook of Quality
Management, Edt. Denis Lock, Gower
Press, London, 2005.
[9] Đuričić Z., Jovanović K., Đuričić R.,
Benchmarking as an Instrument of
Modern Management, International
Scientific Conference on Management
2010, Kruševac, pp.138 (in Serbian)
[10] Todosijević R., Todosijević-Lazović
S., Global Strategies in a Function of
the Hotel Business Quality, IXth Inter-
national Scientific – Expert Sympo-
sium, Hotel House 2013, Zlatibor,
pp. 42 (in Serbian)
[11] Glušica Z., Implementation of TQM,
Quality Mobes, (2001), pp. 71 (in
Serbian)
[12] http://www.cqm.rs/2010/pdf/37/04.pdf

No. 1-2, 2017 Mining & Metallurgy Engineering Bor 125
MINING AND METALLURGY INSTITUTE BOR ISSN: 2334-8836 (Štampano izdanje)
UDK: 622 ISSN: 2406-1395 (Online)
UDK: 622:006(045)=111 doi:10.5937/mmeb1702125D
Aleksandar Djokić*, Nebojša Djokić**, Miša Ivanović***
OPTIONS OF IMPLEMENTATION THE MODERN BUSINESS
QUALITY MANAGEMENT METHODS IN MINING
Abstract
Modern business conditions, which are reflected in the process of the world market globalization, in-
evitably influence all spheres of business. With the aim of continued existence, the growth and develop-
ment, companies in all sectors are required to follow the modern tendencies in business processes. Mi-
ning, as a base business operation, with all its specificities is not excluded from this process. Further-
more, the modern technological processes are based on scientific research in all segments of business,
as well as on implementation the innovative scientific accomplishments in all areas of scientific activity.
This paper is based on consideration the economic aspect of application the modern business methods,
through implementation of methods for the business process improvement regarding to the mining com-
plex, in actual work on presenting the effects of innovative procedures in the lead-zinc ore flotation in
the ‘Kopaonik’ – RMHK ‘Trepca’ facility.
Keywords: innovation, production, management, reengineering, system performance
* Faculty of Technical Sciences - Kosovska Mitrovica
** Faculty of Economics - Kosovska Mitrovica
*** Flotation facility “Kopaonik” Leposavić - RMHK “Trepča”
INTRODUCTION
The modern world, economic environ-ment and companies themselves undergo the constant changes. Restructuring, reorganiza-tion and other great changes are necessary frequently, with the aim of improving the company, or at least, ensuring its survival in increasingly harsher market competition. The mining complex, as a very intricate sys-tem, is not spared from these influences. If anything, it is even more affected by the technical - technological innovative changes. Keeping in mind that an ‘economic - value indicator of mining reserves and mining production indicate that lead reserves on the territory of Serbia amount to 6% of the world reserves, or 20% of the European reserves and zinc reserves are 4% of the world and 14% of the European reserves
1,
focus on exploitation of this potential through implementation the modern eco-nomic - technological methods is the im
perative of the modern mining production. Adapting companies to modern business conditions is a prerequisite for implemen-tation a growth and development strategy, as well as recovery and survival, with se-rious implications to the national econo-mic activity. This conclusion is derived from the fact that the ‘foreign trade, ena-bled by mining operations production, was of strategic importance for national eco-nomy of Serbia. Non-ferrous and precious metals, non-ferrous metals concentrates and products held the top positions in ex-port.
2 Precisely, due to this reason, the
managers and experts have been dealing with problems related to a transformation as a special phenomenon since the nine-teen-nineties of the twentieth century until today, although the various enterprise re-structuring models existed before that time. In this sense, the organizational – technolo-

No. 1-2, 2017 Mining & Metallurgy Engineering Bor 126
gical changes are among the most delicate, considering they affect the entire company, so the role of these changes in the overall company performance is particularly empha-sized. The effective ness of these changes can be viewed in the context of effect the organizational changes on various aspects of business, primarily on the business efficien-cy in terms of cost reduction and manage-ment’s reaction in crisis situations and un-derstanding of changes and manner of their influence on workforce performance.
INNOVATIVENESS A AS
PRECONDITION FOR
HIGHER BUSINESS QUALITY
Considering the fact that innovation im-plies a process of introduction the new fin-dings in economy, investments in the new technology and employees are necessary for its realization. This leads to the conclusion that, in order to execute decisions for im-plementation of innovations, a significant investment of capital is necessary for obtain-ning the new technology and workforce trainings. Implementation of innovations in the base industry, such as mining, is a pre-condition for business success of a company. Creative thinking should be an integral part of a long - term capability of a company, which is the foundation of innovation. Ana-lyses show that companies which grow fast-er are those that implement the new know-ledge and innovations. The difference bet-ween the successful and less successful ones lies in different approach to innovations.
Companies that wish to keep the existing and win the new markets must innovate more efficiently than their competitors, as well as secure human and material resources for the purpose of innovative activities. The most important thing about innovations and innovators is creating an aspiration for achievement the desired results.
In the modern business context, scien-tific laws and manners of their practical app-lication are the primary and decisive for successful business dealings of a company. Scientific laws are the basis for development of innovations. All innovations are the result
of human creative processes. It would be difficult to find an innovation which is not based on the already known scientific law, more or less modified. Each innovation in-volves a number of changes which need to be executed in an organization. The modern scientific research has shown that the actual knowledge and skills that people possess and using that knowledge in practice are the principal and decisive condition for deve-lopment the work productivity. The only successful management systems are those with strong intellectual base.
The latest approaches to innovation sup-plement the models which see its origins in connecting the technical capabilities with the market needs. Innovative companies serve as a model, influenced by two main groups of environmental factors: current use of products and processes on one hand, and needs, i.e. demand for the new products and processes, on the other.
SELECTION OF METHODS
FOR THE BUSINESS QUALITY
IMPROVEMENT
Quality improvement is conditioned by application the adequate methods which are either already known, or the strategic ma-nagement of a company needs to create them. In that Sense, the management has several, already tested methods on its dis-posal, such as the following:
Business Process Reengineering Production System Just in time (JIT) Balanced Scorecard (BSC) Total Productive Maintenance (TPM) Total Quality Management (TQM) ISO System Method Six Sigma Lean Manufacturing European Foundation for Quality
Management (EFQM)
The Twenty Keys Method
Considering the specific nature of their application in the quality improvement pro-cess, each of these methods must be consi-dered separately, so that the company mana-gement could decide for the ones that will secure the highest possible level of efficien

No. 1-2, 2017 Mining & Metallurgy Engineering Bor 127
cy the managerial activity. One of potential strategic options involves the processes reengineering, which is the focus of this pa-per, with consideration of reengineering application in the mining - processing com-plex, with presentation the actual results of this concept application in the floatation facility “Kopaonik” Leposavic.
AN EXAMPLE OF BUSINESS
PROCESS REENGINEERING IN THE
FACILITY FOR FLOTATION OF
LEAD-ZINC ORE “KOPAONIK”
LEPOSAVIC – RMHK “TREPCA”
In the ever more competitive environ-ment in which the companies operate, there is a requirement for continual development and innovation. One of the possibilities for achieving that is the application of reengi-neering as a radical approach. Constant changes in the world markets and applica-tion the new technologies lead to the new dynamic objectives and strategies and chan-ges at all company levels. One of the mana-gement concepts for achieving the new strategy goals is the business process reengi-neering. Reengineering is a new beginning, i.e. an attempt to do the business differently than before. The reasons which indicate the need for reengineering are the sharp compe-tition, constant changes and more deman-ding customers.
Practical illustration of reengineering as
the company management’s strategic option
from the perspective of mining - processing
industry with all its specificities is shown in
an example of operative section of the
RMHK Trepca - flotation of lead-zinc ore in
the ‘Kopaonik’ facility, located in Lepo-
savic. The ‘Kopaonik’ Leposavic facility is a
part of RMHK Trepca – North, and its main operation is related to the processing (flota-tion) of lead-zinc ore from the capacity of the following mines:
‘Belo Brdo’, ‘Crnac’, ‘Zuta Prla’ and open pit ‘Koporic’. The main facility, which is the focus of this paper, possesses 375.000 t of annual capacity. During exploi-tation, this facility processed approximately 7.5 million tons of lead-zinc ore, out of which 333.000 t was lead concentrate with 70-72% lead content (Pb) and around 390.000 t of zinc concentrate with 47-49% content (ZN). The current market flows, technical - technological characteristics of production process, as well as more stable, social and political climate, lead to a mana-gement’s decision on reengineering the pro-duction capacities in terms of improvement the technical - technological features of pro-duction facility. The main goal of these measures is to modernize the technological process, which will lead to better use of ore reserves, as well as an increase in processing capacities. Comparative analysis of pro-cessing quality of the old and new, techno-logically more advanced facility, are pre-sented in Tables 1 and 1a.
Table 1 Grain size distribution of KMD 1200T crusher (old crusher)
Particle size class, mm M% M%↓ M%↑
20 33.3 33.3 100
-5 16.1 49.4 66.7
-5 20.3 69.7 50.6
-10+0,3 28 97.7 30.3
-0.3 2.3 100 2.3
Table 1a Grain size distribution of CH 420 crusher (new crusher)
Particle size class, mm M% M%↓ M%↑
20 4 4 100
-5 11.5 15.5 96
-5 41.5 57 84.5
-10+0,3 38.2 95.2 43
-0.3 4.8 100 4.8
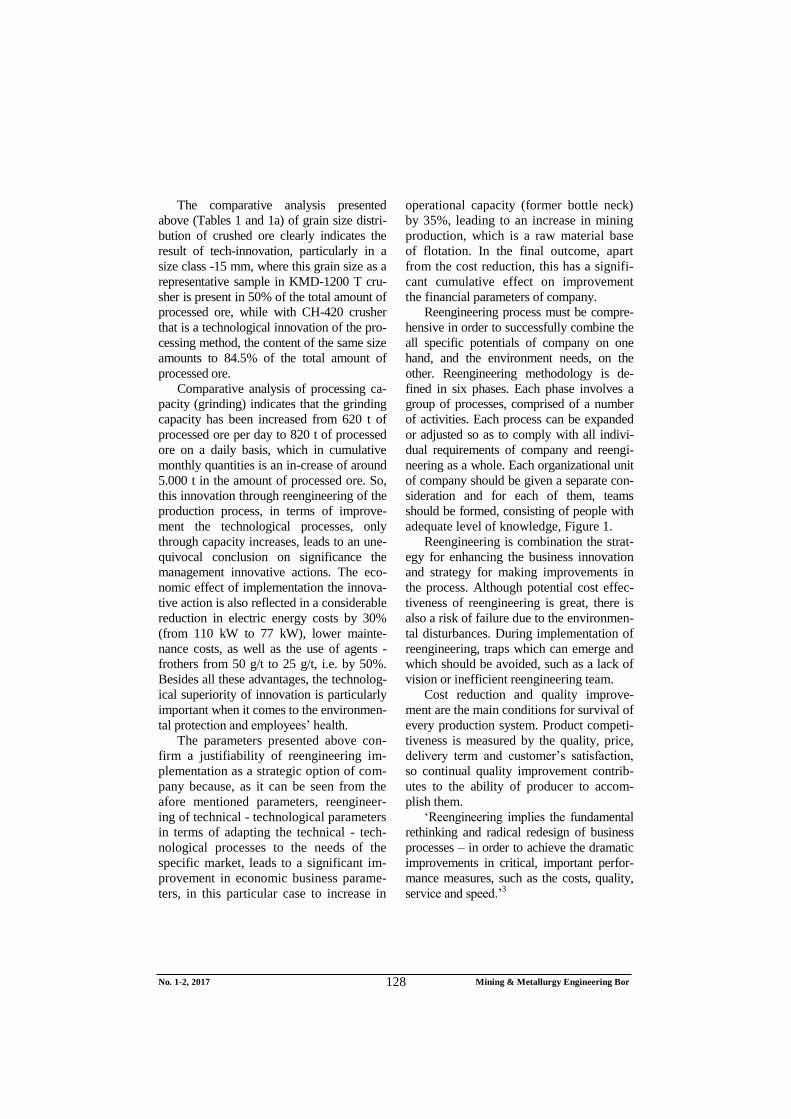
No. 1-2, 2017 Mining & Metallurgy Engineering Bor 128
The comparative analysis presented
above (Tables 1 and 1a) of grain size distri-
bution of crushed ore clearly indicates the
result of tech-innovation, particularly in a
size class -15 mm, where this grain size as a
representative sample in KMD-1200 T cru-
sher is present in 50% of the total amount of
processed ore, while with CH-420 crusher
that is a technological innovation of the pro-
cessing method, the content of the same size
amounts to 84.5% of the total amount of
processed ore.
Comparative analysis of processing ca-
pacity (grinding) indicates that the grinding
capacity has been increased from 620 t of
processed ore per day to 820 t of processed
ore on a daily basis, which in cumulative
monthly quantities is an in-crease of around
5.000 t in the amount of processed ore. So,
this innovation through reengineering of the
production process, in terms of improve-
ment the technological processes, only
through capacity increases, leads to an une-
quivocal conclusion on significance the
management innovative actions. The eco-
nomic effect of implementation the innova-
tive action is also reflected in a considerable
reduction in electric energy costs by 30%
(from 110 kW to 77 kW), lower mainte-
nance costs, as well as the use of agents -
frothers from 50 g/t to 25 g/t, i.e. by 50%.
Besides all these advantages, the technolog-
ical superiority of innovation is particularly
important when it comes to the environmen-
tal protection and employees’ health.
The parameters presented above con-
firm a justifiability of reengineering im-
plementation as a strategic option of com-
pany because, as it can be seen from the
afore mentioned parameters, reengineer-
ing of technical - technological parameters
in terms of adapting the technical - tech-
nological processes to the needs of the
specific market, leads to a significant im-
provement in economic business parame-
ters, in this particular case to increase in
operational capacity (former bottle neck)
by 35%, leading to an increase in mining
production, which is a raw material base
of flotation. In the final outcome, apart
from the cost reduction, this has a signifi-
cant cumulative effect on improvement
the financial parameters of company.
Reengineering process must be compre-
hensive in order to successfully combine the
all specific potentials of company on one
hand, and the environment needs, on the
other. Reengineering methodology is de-
fined in six phases. Each phase involves a
group of processes, comprised of a number
of activities. Each process can be expanded
or adjusted so as to comply with all indivi-
dual requirements of company and reengi-
neering as a whole. Each organizational unit
of company should be given a separate con-
sideration and for each of them, teams
should be formed, consisting of people with
adequate level of knowledge, Figure 1.
Reengineering is combination the strat-
egy for enhancing the business innovation
and strategy for making improvements in
the process. Although potential cost effec-
tiveness of reengineering is great, there is
also a risk of failure due to the environmen-
tal disturbances. During implementation of
reengineering, traps which can emerge and
which should be avoided, such as a lack of
vision or inefficient reengineering team.
Cost reduction and quality improve-
ment are the main conditions for survival of
every production system. Product competi-
tiveness is measured by the quality, price,
delivery term and customer’s satisfaction,
so continual quality improvement contrib-
utes to the ability of producer to accom-
plish them.
‘Reengineering implies the fundamental
rethinking and radical redesign of business
processes – in order to achieve the dramatic
improvements in critical, important perfor-
mance measures, such as the costs, quality,
service and speed.’3

No. 1-2, 2017 Mining & Metallurgy Engineering Bor 129
Figure 1 Reengineering methodology presentation
(Source: Miladinović, Ž., Adamović, Ž., Impact of Reengineering on Improving Companies’
Business Quality, International Scientific Conference on Management 2010, p. 341)
Even in times of economic crisis, reen-
gineering is interesting because it offers fast and efficient solutions. Modern economic crisis indicates that, apart from efficiency, social criteria must be taken into considera-tion, as well as interests of employees, cus-tomers, public services, etc. Interest in engi-neering is also present in the financial sector, education system, judiciary system, military and other branches of economy, which, of course, includes mining and ore processing. Reengineering should be additionally en-hanced, so that it can achieve the certain new goals which were not that pronounced origi-nally. This primarily involves a new consid-eration for demand for product quality and need for prompter response to the market demands, both of which require a constant acknowledgement and support of the new knowledge and creativity.
Success of reengineering implementa-tion calls for definition the key processes. Key processes carriers are responsible for the process implementation, monitoring and correction, if necessary. These are, most frequently, leaders, managers, teams and consultants. They are the company members with special knowledge and skills, indivi-
duals with authority and experience in im-plementation of certain changes. Further-more, they need to be people of trust, with charisma and influence on behavior of their employees, team work oriented and acting within the accepted reengineering concept. Leaders’ role in the reengineering process is to create a vision, motivate the employees, define key values and createteams for design and implementation the radical changes.
Apart from the top manager, who initi-ates the change process, leads and motivates the employees during the transition phase, as potential change management agents, litera-ture mentions the groups or individuals who plan and implement changes, and consult-ants, comprised of groups of people with a vision of necessary changes, but without authority and control of resources required for initiating the changes.
4
Business processes reengineering is a
transition into a new technological model
without division of business processes into
sectors or functions, but the organization is
based on the business processes, the main
goal of which is to meet the customers’
needs. Reengineering at the process level
implies radical changes of certain business

No. 1-2, 2017 Mining & Metallurgy Engineering Bor 130
processes, in the area of material processing
or information.
Competition makes impact on the busi-
ness system with the aim of protection their
customers and market position. Systems
behave in two manners – some implement
reengineering as a preventive measure,
which enables them to keep current position
or expand within the existing or new mar-
kets, while the others act when their market
position is threatened, and when advantages
of the competitor are visible.
CONCLUSION
Monitoring and implementation the
modern trends in the business process organ-
ization, today is the foundation of growth
and development the successful company.
Monitoring and implementation dynamics
should certainly be adjusted to the dynamics
of the field in which the business operates,
but being in the specific economic branch
does not reduce the need for participation in
the modern business flows. Business process
of reengineering, as one of the strategic op-
tions for management action, is one of the
most efficient options, especially when it
comes to the production industry, and then it
involves technical and technological aspect
of business.
Mining, being the base industry, is cha-
racterized by not so fast technical and tech-
nological changes, i.e. environments’ de-
mands for change. However, the main mo-
tive for innovativeness of the business pro-
cess arises from the economic parameters
which, even with the specificities of the base
industry, are observed through the lens of
financial results.
Considering the all specificities of mi-
ning and ore processing on one hand, and
business process requirements, on the other,
‘the lowest common denominator’ must be
found which would drive the overall busi-
ness towards growth and development. This
common denominator are business costs, i.e.
inclination towards their reduction because
they are the latent basis for business success.
Based on that, the business process of reen-
gineering is viewed as a formula of choice
when it comes to implement the mentioned
inclinations, which can be clearly seen in
description and presented results of the rep-
resentative example of the ‘Kopaonik’ flota-
tion, stated in this paper. This strategic op-
tion certainly requires securing the adequate
conditions, technical, as well as financial,
and conditions regarding to the human re-
source. However, it is important to empha-
size that reengineering can be successfully
applied in the business processes of the base
industry, what was the purpose of this paper
work.
REFERENCES
[1] Bahtijarevic - Shiber F.: Managing
Organizational Changes, Economic
Analyst, 1993.
[2] Vujić S. et al: Mineral Raw Materials
Complex of Serbia and Montenegro at
the Cross-Road of Two Millenniums,
Faculty of Mining and Geology Bel-
grade, Engineering Academy of Yugo-
slavia, Association of Mining and
Geological Engineers, Belgrade, 2003,
p. 632 (in Serbian)
[3] Goodbody Alibhe: Floating on Air,
Mining Magazine, November 2011 .
[4] Hammer M., Champy J.: Reengi-
neering the Corporation A Manifesto
for Business Revolution, 1997.
[5] Miladinović Ž., Adamović Ž., The
Impact of Re-engineering to Improve
the Quality of Operations in Compa-
nies, International Scientific Confe-
rence Management, 2010.

No. 1-2, 2017 Mining & Metallurgy Engineering Bor 131
MINING AND METALLURGY INSTITUTE BOR ISSN: 2334-8836 (Štampano izdanje)
UDK: 622 ISSN: 2406-1395 (Online)
UDK: 622.271:621.967(045)=111 doi:10.5937/mmeb1702131I
Aleksandra T. Ivanović*, Biserka T. Trumić*, Svetlana Lj. Ivanov**, Saša R. Marjanović**
PdNi5 ALLOY: EFFECT OF THERMO-MECHANICAL
TREATMENT ON MECHANICAL AND
MICROSTRUCTURAL PROPERTIES***
Abstract
In this paper, the effect of thermomechanical processing on microstructure and mechanical proper-
ties of cold rolled samples of PdNi5 alloy was investigated for the purpose of its characterization. After
melting and casting in a vacuum, a thermomechanical treatment was applied including the homogeniza-
tion annealing in temperature range 800-1000oC for 30, 60 and 90 minutes, cold rolling with defor-
mation degrees of 60, 85 and 97%, recrystallization annealing in the temperature range of 200-1000oC
for 20, 30 and 40 minutes and electroresistant annealing at speed of 14, 16 and 24 meters per minute for
the PdNi5 wire with diameter of 0.15 mm, and at speed of 18, 22 and 24 meters per minute for the
PdNi5 wire with diameters of 0.111 and 0.08 mm with measurement of hardness, tensile strength, rela-
tive elongation and observing the structural changes using optical and SEM microscopy
The test results of influence of parameters of thermomechanical processing on the mechanical and
structural properties of the PdNi5 alloy show that the process should be led in strictly defined conditions
in order to be able to use this alloy for making catalyst-catchers in high-temperature catalytic processes
in the production of nitric acid.
Keywords: PdNi5 wires, catchment gauze, thermo-mechanical treatment
* Mining and Metallurgy Institute Bor, Zeleni bulevar 35, Bor, Serbia
** University of Belgrade, Technical faculty in Bor, VJ 12, Bor, Serbia
*** The research results presented in this paper are the result of technological development the Project
TR 34029 "Development of Production Technology of Pd Catalyst-Catchers to Reduce Losses of
Platinum in High Temperature Catalysis Processes", funded by the Ministry of Education, Science
and Technological Development of the Republic of Serbia
INTRODUCTION
The high price of palladium is a limiting
factor in the study of Pd-Ni alloys, so the
number of scientific papers which include
their characterization is relatively small.
However, a widespread application of the
platinum based alloys in the processes of
catalysis, electronics industry, the jewelry
industry, for production the medical and
dental equipment, has led to a fact that re-
searchers in many countries make the signi-
ficant efforts to study this system alloys
[1-7]. The binary phase diagram of the Pd-
Ni system is shown in Fig. 1 [8]. It shows a
complete solubility of components in the
solid state, with minimum on the liquidus
and solidus curve (1273oC at 45at.% Pd) [8]
without superlattices or intermediate phases
[9]. In the alloys of Ni-Pd system, at cooling,
surface-centered cubic α-solid solution is
formed. As soon as is reached at cooling the
area of interruption in solubility in the solid
state is reached, at cooling, the surface-

No. 1-2, 2017 Mining & Metallurgy Engineering Bor 132
centered cubic α-solid solution decomposes
into two also surface-centered cubic α - sol-
id solutions of different composition: -
solid solution is richer in nickel, and -
solid solution is richer in palladium than it
fits the overall composition of the alloy.
Decomposition of surface-centered cubic α-
solid solution on the two solid solutions of
different composition but the same lattice,
is the result of different lattice constants of
the Ni (a = 0.35238 nm), and Pd (a =
0.38902 nm).
Figure 1 The binary phase diagram of the system Pd-Ni
Only a few papers have been found
[10, 11] by the authors who dealt with Pd-
Ni and thermo-mechanical treatment on
the properties of PdNi5 alloy, and that is
why this alloy was selected for the study
in order to determine the optimal condi-
tions for thermo-mechanical processing
regime, so it could be used for making
catalyst-catchers to capture the platinum
in catalysis process at high temperatures.
Therefore, the object of this paper is to
study the effect of the complex thermo-
mechanical treatment on improvement the
mechanical properties and electrical con-
ductivity, as well as the structural changes
occuring in the alloy. Keeping in mind the
complex influence of deformation degree,
annealing time, annealing temperature and
texture on the recrystallization rate, and
also on the recrystallized grain size and
mechanical characteristics, the experi-
ments with annealing time and annealing
temperature change on the alloy Pd-5%
mass Ni with different degree of defor-
mation for further plastic processing in
order to make yhe Pd-catalyst-traps, was
carried out in this work.
EXPERIMENTAL
The binary Ni-Pd alloy with 5% mass
nickel was obtained by melting of 99,99%
purity palladium powder and 99,95% puri-
ty nickel as a sheet metal in the medium
frequency induction furnace, in a MgO
casting pot, sized h1xh2 = 85x80 mm,

No. 1-2, 2017 Mining & Metallurgy Engineering Bor 133
d1xd2 = 65x55 mm. In order to achieve
better compacting of materials, Pd-powder
and Ni-sheet metal were pressed on a hy-
draulic press with a force of 270 daN/cm2.
Casting temperature of PdNi5 alloy was
1520oC. Molten batch was overheated
before casting of 150-170oC. Casting was
done in a graphite mold, pre-heated at
temperature of 350-400ºC. Samples were
melted and cast in vacuum. All cast sam-
ples with a circular cross-section (Ø20 mm)
were homogenized at 800, 900 and 1000oC
during 30, 60 and 90 minutes in an electric
resistance furnace of chamber type LP08.
All samples were quenched in water. After
quenching, the samples were cold rolled on
the stand rolls with calibrated rollers, sys-
tem square-square, to the calculated dimen-
sions of 11.2 mm; 6.8 mm and 2.3 mm with 60%, 85% and 97% reductions, re-
spectively, with the inter-phase annealing
for 15 minutes at 900°C followed by
quenching in water. Heat treatment after
rolling consisted of the recrystallization
annealing the samples of PdNi5 alloy, in a
wire form, in the electric resistance furnace
of chamber type LP08 without protective
atmosphere, at temperatures in the range
200-1000oC during 20-40 minutes interval.
All samples were quenched in water after
annealing. The final wire drawing dimen-
sions (Ø 0.15 mm, 0.11 mm and 0.08 mm)
were achieved by drawing with 99% reduc-
tion. After reduction, all samples were ex-
posed to the recrystallization annealing at
the electrical resistance annealing speed
from 14 m/min to 24 m/min for different
annealing voltages from 20 V to 36 V.
After the thermo-mechanical treatment,
the values of hardness, tensile strength,
elongation and electrical conductivity were
measured and structural changes were ob-
served by the optical and scanning electron
microscopy. Hardness measurement was
done on the combined device for measuring
the hardness of Vickers and Brinell, WPM,
Leipzig, Germany, at a load of 5 kgf and
load duration of 15 s according to
ASTM:E384, taking the 3-point average.
Tensile strength and elongation were meas-
ured using a universal device for tensile
testing, type „Mohr + Federhaf + Losen-
hansen“ – Manheim and testing machine
Otto Wolpert up to 100 kg with the extent to
5 kg. Before testing, all samples were cut to
a length of 150 mm. Electrical conductivity
was measured using the Wheatstone bridge.
Microstructural changes in the course of
thermo-mechanical treatment were ob-
served on a metallographic microscope
EPYTIP 2, with magnification of 80 to 400
times and on a JEOL JSM-6610LV scan-
ning electron microscope with an EDS de-
tector. For the metallographic testing, sam-
ples were prepared according to the stand-
ard procedure - grinding, polishing (polish-
ing machines ROWA E-KG) with 0.05 μm
Al2O3 powder, and etched a few seconds
with solution of 1 g CrO3 +20 ml HCl to
obtain a microstructure.
RESULTS AND DISCUSSION
I The effect of homogenization
annealing on mechanical
properties and microstructure
Figure 2 shows the optical microphoto-
graphs, while Figure 3 shows the scanning
electron microphotographs of the alloy after
different thermo-mechanical treatment. Mi-
crosrtucture of the alloy after homogeniza-
tion annealing at 800oC for 30 minutes is
shown in Figures 2a and 3a. It is noted that
the used heat treatment did not lead to deg-
radation of cast dendritic structure. Homo-
genization annealing was carried out in
order to eliminate a segregation and obtain
a homogeneous structure [12]. Further
increasing of the annealing temperature to
900ºC for 30 minutes (Figures 2b and 3b)
led to some equalization of concentrations
of alloying element. Dendrites form and
their boundaries to the areas that solidified
last, still exist, but the contrasts have de

No. 1-2, 2017 Mining & Metallurgy Engineering Bor 134
creased and dendrites are just discernible.
It is noticeable that duration of homogeni-
zation annealing (30 minutes at 900oC)
was not sufficient for complete homogeni-
zation of the structure, or complete break-
down of the dendritic branches. Furtherin-
creasing of the annealing temperature to
1000ºC, Figures 2c and 3c , leads to a so-
lid solution grain boundaries become
clearly marked. It can also be seen that the
orientation of dendrites inside a grain is
always the same, but considerably varies
from grain to grain, showing a good
agreement with the literature data [13,14.
a) b) c)
Figure 2 Optical microphotographs of the alloy after homogenization annealing during 30 minute
at: (a)8000C, (b) 9000C, (c) 10000C, 80x. The samples are quenched in water
a) b) c)
Figure 3 Scanning electron micrographs of the alloy after homogenization annealing during
30 minute at: (a)8000C, (b) 9000C, (c) 10000C
Figure 4 shows the effect of different
parameters of homogenization annealing on
hardness values. An increase in the tem-
peratures values contributes to a decrease in
hardness values due to the equalization of
concentration difference in the structure.
Temperature influence in comparison with
influence the time of homogenization an
nealing on a change of hardness values
(Figures 4a and 4b) is significant. The cast
samples have a highest hardness value 98
HV 10 and the annealed samples at 800oC
for 30 minutes have 86.6 HV 10. Further
increase of temperature to 900oC and
1000oC leads to a decrease to 84.1 HV 10
and to 83.3 HV 10, respectively.

No. 1-2, 2017 Mining & Metallurgy Engineering Bor 135
a) b)
Figure 4 Effect of parameters of homogenization annealing on hardness values
Figure 5 shows the effect of parame-
ters of homogenization annealing on mi-
crohardness values. It can be observed that
th microhardness values of homogenized
samples decrease with increase of temper-
ature and time of homogenization anneal-
ing. A sample after homogenization
annealing at 1000oC for 90 minutes has
minimum microhardness value (102.56
HV 0.15). According to the microhardness
value of sample after homogenization an-
nealing, it can be concluded that the mi-
crohardness at 800oC for 30 minutes de-
creases for 36%.
Figure 5 Effect of parameters of homogenization annealing on microhardness values
The effect of homogenization anneling
on electrical conductivity values is shown
in Figure 6. Pure metals have a proper and
uniform crystal lattice, and therefore have
a small electrical resistance. Additives in
small quantities distort the crystal lattice,
and increases electrical resistance. The
same is also with the alloys from a solid
solution, i.e. which together with the so-
lidification are crystallized, and atoms are
incorporated in a crystal lattice of the oth-
er element. The temperature increase leads
to the intense thermal vibrations of atoms
in the crystal lattice, but the mobility of
conductive electrons is less due to the col-
lisions with atoms of the crystal lattice.
Comparative effect of these factors affects
the electrical conductivity values as shown
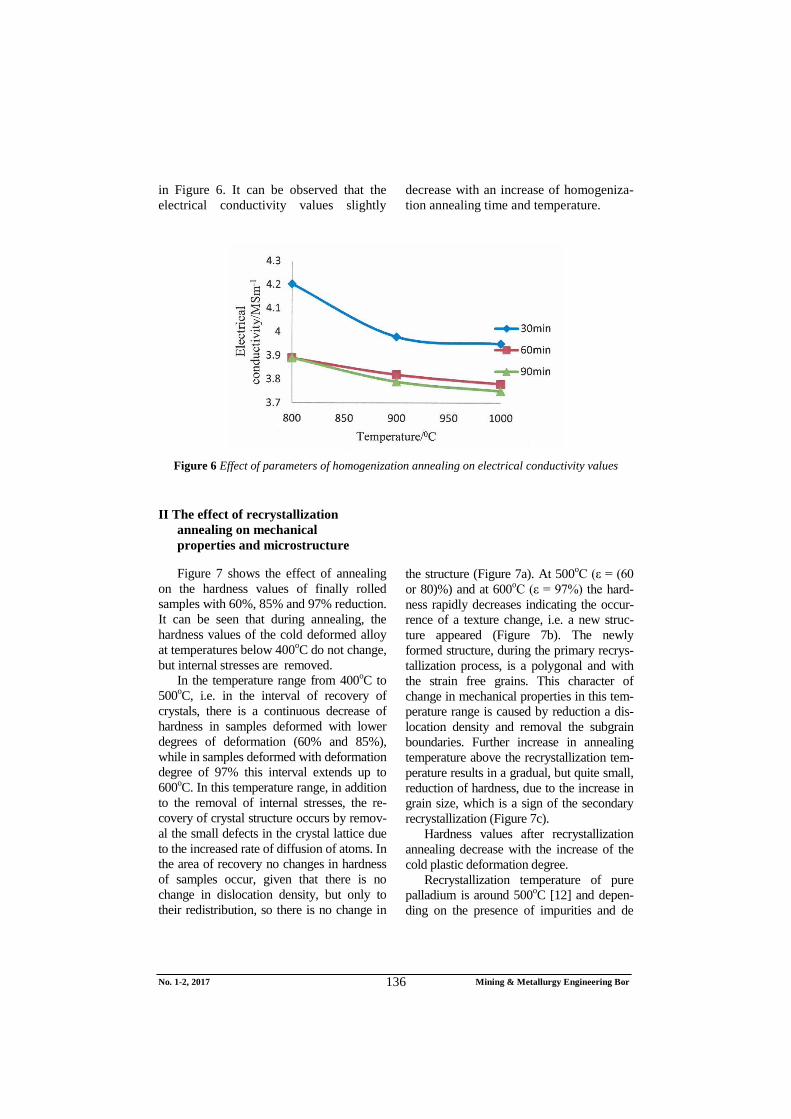
No. 1-2, 2017 Mining & Metallurgy Engineering Bor 136
in Figure 6. It can be observed that the
electrical conductivity values slightly
decrease with an increase of homogeniza-
tion annealing time and temperature.
Figure 6 Effect of parameters of homogenization annealing on electrical conductivity values
II The effect of recrystallization
annealing on mechanical
properties and microstructure
Figure 7 shows the effect of annealing
on the hardness values of finally rolled
samples with 60%, 85% and 97% reduction.
It can be seen that during annealing, the
hardness values of the cold deformed alloy
at temperatures below 400oC do not change,
but internal stresses are removed.
In the temperature range from 400oC to
500oC, i.e. in the interval of recovery of
crystals, there is a continuous decrease of
hardness in samples deformed with lower
degrees of deformation (60% and 85%),
while in samples deformed with deformation
degree of 97% this interval extends up to
600oC. In this temperature range, in addition
to the removal of internal stresses, the re-
covery of crystal structure occurs by remov-
al the small defects in the crystal lattice due
to the increased rate of diffusion of atoms. In
the area of recovery no changes in hardness
of samples occur, given that there is no
change in dislocation density, but only to
their redistribution, so there is no change in
the structure (Figure 7a). At 500oC (ε = (60
or 80)%) and at 600oC (ε = 97%) the hard-
ness rapidly decreases indicating the occur-
rence of a texture change, i.e. a new struc-
ture appeared (Figure 7b). The newly
formed structure, during the primary recrys-
tallization process, is a polygonal and with
the strain free grains. This character of
change in mechanical properties in this tem-
perature range is caused by reduction a dis-
location density and removal the subgrain
boundaries. Further increase in annealing
temperature above the recrystallization tem-
perature results in a gradual, but quite small,
reduction of hardness, due to the increase in
grain size, which is a sign of the secondary
recrystallization (Figure 7c).
Hardness values after recrystallization
annealing decrease with the increase of the
cold plastic deformation degree.
Recrystallization temperature of pure
palladium is around 500oC [12] and depen-
ding on the presence of impurities and de

No. 1-2, 2017 Mining & Metallurgy Engineering Bor 137
formation degree. It is noted (Figure 6), that
the joint effect of the alloying palladium
with nickel and deformation degree effect in
the Pd-Ni alloy, shifts the recrystallization
temperature to even 600oC. With increasing
deformation degree, recrystallization tem-
perature shifts to the lower temperature val-
ues, as a results of the increased stored ener-
gy, which causes a smaller critical size of the
nucleus and decrease in the activation ener-
gy for recrystallization, i.e., nucleation and
growth of recrystallized grains become easi-
er [12,15].
Microstructure of the PdNi5 alloy with
97% reduction after annealing at different
temperatures for 30 minute is given in Fi-
gure 8. It was noted that to the annealing
temperature of 500oC oriented deformation
structure retains, in all samples (Figure 8a).
Comparing to the structure of the cold-
deformed samples of PdNi5 alloy, no
change can be observed in the structure. The
shape and size of grains correspond to the
state after the end of the plastic deformation,
and also the grid orientation of individual
grains remains the basically retained [16].
By increasing the annealing temperature to
700oC, the elongated grains vanished, and
the new polygonal grains were formed (Fig-
ure 8b). This is a distinctive sign of recrys-
tallization. The increase in the annealing
temperature at 900oC causes further growth
of the grains (Figure 8c).
a) b)
c)
Figure 7 Dependence of hardness, HV, PdNi5 alloy of deformation degree, annealing
temperature and time: a) 20 minutes; b) 30 minutes; c) 40 minutes

No. 1-2, 2017 Mining & Metallurgy Engineering Bor 138
a) b) c)
Figure 8 Optical microphotographs of the alloy with a deformation degree 97%, after annealing for
30 minutes at: (a)5000C, (b) 7000C, (c) 9000C, 400x. The samples are quenched in water
Figure 9. shows an effect of annealing
on the tensile strength values of finally
rolled samples with 60%, 85% and 97%
reduction.
a) b)
c)
Figure 9 Dependence of tensile strength PdNi5 alloy of deformation degree, annealing
temperature and time: a) 20 minutes; b) 30 minutes; c) 40 minutes
From the study results it can be seen that
the tensile strength of cold-deformed and
differently heated PdNi5 alloy samples in
the form of wire, does not change continu

No. 1-2, 2017 Mining & Metallurgy Engineering Bor 139
ously with increasing annealing temperature.
Tensile strength virtually does not change to
a temperature of 400oC, while in the temper-
ature range 400-500oC there is a slight de-
cline in Rm. This is a consequence of reduc-
ing the concentration and redistribution the
errors in a lattice. At 500oC, there is a rapid
decrease of tensile strength in samples de-
formed with a greater deformation degree
(85% and 97%), while in samples deformed
with adeformation degree of 60%, this
change occurs at 600oC. This change takes
place in a very narrow temperature range
(500-600oC) or (600-700
oC), and is a result
of advancement the recrystallization process
and formation of a new, undeformed struc-
ture, which is noted by metallographic ex-
amination (Figure 8). Further increase of
annealing temperature above 600oC or
above 700oC leads to grain growth, which
causes a further slight decrease in tensile
strength, due to occurrence the secondary
recrystallization, or structure enlargement.
Figure 10 shows an effect of annealing
on elongation values the finally rolled sam-
ples with 60%, 85% and 97% reduction.
a) b)
c)
Figure 10 Dependence of elongation PdNi5 alloy of deformation degree, annealing
temperature and time: a) 20 minutes; b) 30 minutes; c) 40 minutes
III The effect of electrical resisatnce
annealing on mechanical properties
Figures 11 and 12 graphically present
the dependence of tensile strength (Rm)
and elongation (A) of drawn PdNi5 wires
produced by high deformation (97%), on
annealing voltage and speed after cold
work.

No. 1-2, 2017 Mining & Metallurgy Engineering Bor 140
It can be concluded from the results,
shown in Figures 11a) and 12a), for the wire
diameter 0.15 mm, that with the increase of
voltage and resistance annealing speed, the
values of tensile strength slightly decrease,
while, at the same time, the relative elonga-
tion values slowly increase. The maximum
values of elongation (46.5%) with accepta-
ble value of tensile strength (321,45 MPa)
for the aforementioned wire is achieved by
annealing at voltage of 24V and speed of
24 m/min.
For the wire with diameter 0.11 mm
(Figures 11.b) and 12.b)) values of tensile
strength and elongation show a similar be-
haviour as for the wires of 0.15 mm in di-
ameter. The maximum value of elongation
(36.5%) with acceptable value of tensile
strength (313.5 MPa) was achieved by
annealing at voltage of 28V and speed of
18 m/min.
For the wire with diameter 0.08 mm with
increasing voltage and resistance annealing
speed, the values of tensile strength also
slightly decrease while the relative elonga-
tion values rapidly increase (Figures 11c)
and 12c)). The maximum value of elonga-
tion (35.5%) with acceptable value of tensile
strength (286 MPa) was achieved by anneal-
ing at voltage of 32 V and speed of 18
m/min. This character of change the me-
chanical properties was caused by the con-
solidation of recrystallized structure.
For voltage values lower than 20 V, for
wire of , and 28 V for wires of
, as well as for the
voltage values higher than 24 V and 36 V,
the tensile strength and elongation show the
values unsuitable for further use of wires for
making palladium catalysts-catchers. Name-
ly, the insufficient or excessive annealing of
wire occurs, which results in the low values
of tensile strength and elongation.
a) b)
c)
Figure 11 Dependence of tensile strength drawn PdNi5 wire of different diameter of
resistance annealing parameters: a) 0.15; b) 0.111; c) 0.08 mm

No. 1-2, 2017 Mining & Metallurgy Engineering Bor 141
a) b)
c)
Figure 12 Dependence of elongation drawn PdNi5 wire of different diameter of resistance
annealing parameters: a) 0.15; b) 0.111; c) 0.08 mm
CONCLUSION
Based on the study of the effect of ther-
mo-mechanical treatment on the properties
improvement and structural changes in the
Pd-5 wt.% Ni alloy, it can be concluded that
the best combination of properties of the
final wire (diameter 0.08, 0.111 and 0.15
mm) was achieved in the following regimes
of thermomechanical treatment:
Regime of homogenization annealing
(900oC for 30 minute). With the selec-
ted regime of homogenization annea-
ling, the values of hardness (84,1 HV),
microhardness (133,32 HV) and elec-
trical conductivity (3,9 MSm-1) allows
further plastic processing.
Regime of recrystallization annealing
(900oC for 30 minutes). With the se-
lected regime of recrystallization an-
nealing for sample deformed with the
highest deformation degree (97%), the
highest value of relative elongation
(45%) is achieved, with very satisfac-
tory values of tensile strength (310
MPa) and hardness (90,8 HV). For the
samples deformed with lower defor-
mation degrees, under the same an-
nealing conditions, the relative elon-
gation values are lower, while the va-
lues of tensile strength and hardness
are slightly higher.

No. 1-2, 2017 Mining & Metallurgy Engineering Bor 142
Regimes of resistance annealing (U
and v) are different depending on the
final wire diameter. So,
for Ø 0.15 mm U = 24 V and
v = 24 m/min;
for Ø 0.111 mm U = 28 V and
v = 18 m/min;
for Ø 0.08 mm U = 32 V and
v = 18 m/min.
REFERENCES
[1 P. V. Petrenko, A. V. Gavrilyuk, N. P.
Kulish, N. A. Mel’nikova, Yu. E.
Grabovskii, The Physics of Metals and
Metallography, 2009, 108, (5), 449-
454.;
[2 S. Helfensteyn, J. Luyten, L. Feyaerts,
C. Creemers, Applied Surface Science,
2003, 212–213,844–849.
[3 A. I. Thomson, J. M. Winterbottom,
Journal of Chemical Technology and
Biotechnology, 1987, 37, (4), 257–
270.
[4 A Tari, B. R. Coles, Journal of Physics
F: Metal Physics, 1971, 1, (6), L69.
[5 H. Takahashi, S. Fukatsu, S.
Tsunashima, S. Uchiyama, Journal of
Magnetism and Magnetic Materials,
1992, 104–107, (3), 1831–1832.
[6 R. Kraehnert, M. Baerns, Applied
Catalysis A: General, 2007, 327, 73–
81.
[7 L. R Bidwell, R Speiser, Acta
Metallurgica, 1965, 13, (2), 61–70.
[8 http://resource.npl.co.uk/mtdata/
phdiagrams/nipd.htm 454541
[9 Y. Ning, Z. Yang, H. Zhao, Platinum
Metals Review, 1996, 40, (2), 80-87.
[10 A. Ivanovic, B. Trumic, S. Ivanov, S.
Marjanovic, Hem.ind., 2014, 68, (5),
597-603.
[11 A. Ivanovic, B. Trumic, S. Ivanov, S.
Marjanovic, Journal of Trends in the
Development of Machinery and
Associated Technology, 2013, 17, (1),
61-64.
[12] I. Marković, S. Nestorović, D. Mar-
ković, Materials and Design 2014, 53,
137-144.
[13] A. Ivanović, B. Trumić, S. Ivanov,
S. Marjanović, M.Zrilić, T. Volkov-
Husović, B. Petković, Johnson
Matthey Technology Review, 2016,
60, (1), 31-38
[14 H.Schumann, “Metallographie”,
Leipzig, VEB Deutscher Verlag für
Grundstoffindustrie, 1975.
[15 C .Rehrl, S. Kleber, O. Renk, R. Pi-
ppan, Materials Science and Engi-
neering A, 2011, 528, (19), 6163-6172.
[16 M. Jovanović, V. Lazić, D. Adamović,
N. Ratković, Machine Materials
Kragujevac, University in Kragujevac,
Faculty of Mechanical Engineering,
2003 (in Serbian).

No. 1-2, 2017 Mining & Metallurgy Engineering Bor 143
MINING AND METALLURGY INSTITUTE BOR ISSN: 2334-8836 (Štampano izdanje)
UDK: 622 ISSN: 2406-1395 (Online)
UDK: 622.33:662.613(045)=111 doi:10.5937/mmeb1702143T
Vladimir Todorović*, Zlatko Dragosavljević**, Dejan Dramlić***, Boban Branković*
ELECTRO - FILTER ASH USE IN
THE UNDERGROUND COAL MINES
Abstract
Thermal power plants in the Republic of Serbia spend 35-40 million tons of coal annually, mostly
lignite, with about 6 million tons of ash or slag as a by-product of electricity and heat production, de-
posited on the landfills. The Law on Waste Management defines the possibility of reusing of ash and
slag. The Rulebook on categories, testing and classification of waste, as well as the Decree on technical
and other requirements for ash, as building material intended for use in the construction, reconstruc-
tion, rehabilitation and maintenance of infrastructure facilities of public purpose, electro-filter ash and
slag are characterized as the non-hazardous waste for a wide range of use. In recent decades, the elec-
tro-filter ash has been used in several fields in the coal mines, increasingly gaining in importance, and
what is the subject of this work in order to demonstrate the efficiency of its use and at the same time
contribute to the environmental protection.
Keywords: mines, coal, electro-filter ash, fire insulation
*PC UCM - Resavica
**University Singidunum, Belgrade
*** Institute for Material Testing – Belgrade
1 INTRODUCTION
Electro-filter ash and slag are the most commonly used secondary waste in the Re-public of Serbia. About 200 million tons of ash and slag are deposited on the current landfills of over 1,600 ha of fertile land, located in the immediate vicinity of the thermal power plants, large river flows and settlements. This significantly affects the deterioration of environmental conditions and it is imperative to find a solution for using of this ash to meet both the environ-mental and economic parameters.
Ash consumption in construction grows increasingly, and ash is most commonly used in the industrialized countries as the Great Britain, the United States, France, the Netherlands, Czech Republic and Poland. There is no problem of disposal the electro-filter ash in the EU countries. The amount of generated electro-filter ash is insufficient to undermine the needs of an ever-increasing
demand. According to data from developed countries of the European Union, 18 million tons of ash are used, primarily, in the con-struction industry and road construction.
In the mines of the Republic of Serbia, the electro-filter ash is now used to fill the excavated free space behind the fire isolation barriers, where it has a number of ad-vantages compared to the other conventional ways of isolating the oxidation and fire pro-cesses. In the first place, it made the process of filling in the faster procedure, reduced the number of engaged workers and enabled continuous filling.
In some mines, filling of excavated emp-ty spaces on a larger surface was done in order to prevent deformation of the surface of the terrain. Also, in some cases filling with electro-filter ash was carried out on the excavation fields where several cave rooms were made and through which the working

No. 1-2, 2017 Mining & Metallurgy Engineering Bor 144
front was passed from the mechanized long wall excavation, and these rooms had to be filled previously.
2 ELECTRO - FILTER ASH
PROPERTIES
Electro-filter ash, which is obtained by combustion in the coal combustion boilers, is a finely ground, powdered material that is transferred by flue gas. The ash is usually collected by the electrostatic precipitators, dust collectors or mechanical collection de-vices, such as cyclones.
In the production of energy, three meth-ods of ash removal from the boiler plant are applied: dry, wet and cyclone, where a dry process is most commonly used in thermo-objects in Serbia.
The ash consists of full or hollow partic-ulate particles, mainly ball-shaped, and is mostly of glass (amorphous) nature. The specific gravity of electro-filter ash usually ranges from 2.1 to 3.0, while the specific area (measured by the Blaine's method of air per-meability) can vary from 170 to 1000 m²/kg.
The chemical properties of electro-filter ash depend on coal composition, the meth-ods of controlling the air pollution in the thermal power plants, and the techniques used for transport and storage on the land-fills.
Lignite ash has a higher content of cal-cium oxide and a lower loss by ignition (LO1) than that from bituminous coal. Elec-tro-filters ash from lignite and partially bi-tuminous coal may have a higher amount of sulphate compounds compared to ash ob-tained from bituminous coal.
The ignition loss (LO1), which repre-sents a measure of the amount of residual carbon retained in the electro-filter ash, is one of the most significant of its chemical properties.
In the classified ash, the loss of ignition can be from 5% to 6% according to the AASHTO or ASMT specifications. Loss by ignition indicates the similarity of using the ash as a substitute for cement in concrete, which is an important feature of it.
In addition to the chemical composition and loss of ignition, the quality of electro-filter ash is primarily determined by fineness and consistency. Fineness affects the reactiv-ity of ash, as well as the levels of carbon content. The electro-filter ash has a greater fineness than the Portland cement and lime, and its grain size ranges between 10 and 100 microns. Ashes used for the production of concrete and solid mass for filling should be consistent, respectively resistant to the changes allowing the mixture to be tested.
Previous research on the use of electro-filter ash in Serbia has been almost exclu-sively related to the field of construction. It has been established that, as a raw material for the production of building materials, the electro-filter ash has application inproduc-tion: building elements - blocks of brick, ceramics, concrete prefabricates, light con-crete, light aggregates, pucolan - metallurgi-cal cements, hydraulic lime and cement.
As a material that is directly installed at the locations of application, it is used for: masses for stabilization the pavement struc-tures; as a filler in the asphalt mixtures and bitumen masses, for mechanical and chemi-cal stabilization in the construction of roads, as a filler for asphalt, in the embankment, etc.
Electro-filter ash is useful for a wide va-riety of applications, because it is a pucolan, or silicate or alumina-silicate material that in isolated form and in the presence of water, combined with calcium hydroxide (from lime, Portland cement or dust from an an-nealing furnace) and forms mixtures with the characteristics of binder.
3 EXTINGUISHING OF MINE FIELD
FIRES WITH THE SYSTEM FOR
FILLING WITH ELECTRO-FILTER
ASH
Endogenous oxidation processes and jam fires are a specific phenomenon in the underground coal mining and often follow the mining processes. Namely, endogenous fires are created by the joint operation of natural - geological and technical - technolo-

No. 1-2, 2017 Mining & Metallurgy Engineering Bor 145
gical conditions in a particular cave object. From the natural-geological conditions, the most influential are: propensity of coal to self-ignition, thickness of the coal layers that are mined, tectonics in the excavation area, inclination and depth of recovery, character-istics of the accompanying rocks and pres-ence of water.
The second group of conditions, i.e. technical and technological are: inadequate preparation and elaboration, applied excava-tion system, losses of coal during excava-tion, poor untimely isolation of excavated areas, inadequate rate of progress of excava-tion works, irregular ventilation scheme, high depression of the excavation field and pits, air flow losses, poorly defined location of tubular sewage fans and others.
The occurrence of an endogenous fire in a mining cave usually endangers the em-ployees and equipment and leads to a tem-porary interruption of mining operations until it is eliminated.
Experience has shown that the excava-tion system, no matter how efficient and economical is, make conditions for devel-opment the oxidation processes that can turn into open fires.
Prevention of oxidation processes enters the technological system of underground coal mining and affects all its stages of work from: opening, preparation, excavation, ven-tilation, drainage and maintenance.
The first degree of protection against oxidation processes and cave fires are pre-ventive measures. If the preventive mea-sures are not adequate and sufficient, as the second level of protection, the measures of remediation or liquidation the occurrence can be used.
Recovery itself includes active and ven-tilation methods. Active methods include all active fire extinguishing operations with water and removal of heated and ignited coal, isolation of the fire endangered areas by temporary and permanent bulkheads, injection and interventions with inert ga-ses.
The most commonly applied method of active procedures is the isolation of oxida-tion or fire area, and its goal is to stop the
oxygen supply to the fire source, and the success of extinguishing depends on the isolation quality. Isolation barriers must meet a range of conditions to be effective: to be impermeable, to be able to withstand any additional water inlet, to be heat-resistant and resistant to the aggressive environmental performance, easy to maintain, to have as long life as possible, and to be able to be quickly and efficiently to built-in.
The aforementioned conditions are most-ly satisfied by the so-called "sludge plugs”, i.e. barrier with electro-filter ash which are in practice proven as efficient.
Also, special attention is required, which must be applied in the case of fire isolation of the area in the so-called methane condi-tions when there is a potential risk of igni-tion and explosion of methane.
The electro-filter ash filling system can be applied after the preparatory work has been carried out which fit into a fur-ther concept of exploration work in the mining cave.
At the preparatory stage, on the surface area near one of the cavities, a working plate has to be built and silos to be mounted (usu-ally two blocks) so that the ash dispensing valve is at a height of 1.5-2.5 m in order to ash flow by gravity through the length of pipe. Below the silo, a mixer connected to both silos has to be installed, as well as and the water inlet pipe connected to the bottom of the ash inlet valve. The ash and water flow gravitating through the tube into a mi-xer for making a mixture of water and ash. At the outlet pipe from the mixer, a pump for transporting a mixture of water and ash is installed, and the main pipeline for the pit is installed behind it.
The description of a caving plant for fill-ing with electro-filter ash is given below. On the plateau next to the cave entrance, the following equipment was installed:
Two silos volumes of 20 m3 and 18 m
3;
For the water supply to the silos, a plastic tube diameter of 75 mm is used, and the valves of 75 mm for flow con-trol of water filling;
For dosing of oven ash, 200 mm ovals are installed;

No. 1-2, 2017 Mining & Metallurgy Engineering Bor 146
For acceptance the sludge, a mixer - tank was built - with dimensions of 1.0 x 0.8 x 0.8 m;
Pump for suppression of the mixture; Water supply, from the water supply
network to the silos through a distribu-tion for each silo.
For controlling of water consumption, the water meter is installed in the water supply connection.
The appearance of the filling station with equipment availability is shown in Figure 1.
A plastic pipeline is used for the hydrau-lic transport of sludge from the tank at the surface to the production part of the cave, or to the objects that being built. At the site of the construction of the isolation facility, a
prefabricated filter barrier is made and the part of the pipeline is installed behind it. The appearance of a typical solution of an isola-ting object from electro-filter ash is shown in Figure 2.
The construction of a sludge barrier must be well-done and thus ensured that there is no relaxation. The filling in the initial phase is carried out gradually with certain breaks necessary for water discharge.
In sludge treatment, the most important is the good ratio of water and ash, because in the case of higher mixture density, there is the possibility of clogging the pipeline, while too sparse mixture extend the time of buckling and water clearing. The most common mixing ratio of water and ash is 1: 2 and 1: 4 by weight.
Legend: 1. Ash storage silos, 2. Ash dosing valve Ø 200 mm, 3. Dosing valve Ø 75 mm, 4. Water
supply tube Ø 75 mm, 5. Tube for finished mass drainage of Ø 75 mm, 6. Mixer - sludge reservoir,
7. Slit tube for Ø 75 mm, 8. Transition to tube Ø 200/100 x 200 mm, 9. Silage filling tube Ø 90 mm
Figure 1 Filling station with equipment availability

No. 1-2, 2017 Mining & Metallurgy Engineering Bor 147
Legend: 1. Lifting pipe Ø 100 mm, 2. Sampling tube Ø 20 mm, 3. Drainage pipe Ø 100 mm - 150 mm,
4. Wooden columns for reinforcement, 5. Wooden partitions, 6. Jut, 7. Glass wool, 8. Filter ash
Figure 2 Isolation object of filter ash

No. 1-2, 2017 Mining & Metallurgy Engineering Bor 148
CONCLUSION
The use of electro-filter ash and slag is
an example of sustainable development.
Waste that burdens the operation of thermal
power plants is now becoming useful and
gaining the usable value. The use of ash
generates savings, increases profits and re-
moves substantially negative effects on the
environment.
In the underground coal mines, the use
of electro-filter ash, in the first place for
the construction of stable isolation facili-
ties and for filling up the excavated areas,
becomes increasingly widespread, accord-
ing to the demonstrated efficiency in ap-
plication.
REFERENCES
[1] Dramlić D., Ecological and Economic
Significance of Adoption and Appli-
cation the Legislation on Electro-Filter
Ash in the Civil Engineering, Master
work, University Singidunum, Bel-
grade, 2015 (in Serbian)
[2] Tanasijević Lj., Use of Electro-Filter
Ash and Slag in the Construction Indu-
stry, Road Construction and Wider,
Serbian Chamber of Commerce, Bel-
grade, 2011 (in Serbian)
[3] Miljkovic M. et al., Safety and Venti-
lation of Mines, Monograph, Mining
and Metallurgy Institute Bor, Bor,
2009 (in Serbian)

INSTRUCTIONS FOR THE AUTHORS
Journal MINING AND METALLURGY ENGINEERING BOR is published four times per a year and
publishes the scientific, technical and review paper works. Only original works, not previously published and not
simultaneously submitted for publication elsewhere, are accepted for publication in the journal. The papers should
be submitted in both, Serbian and English language. The papers are anonymously reviewed by the reviewers after
that the editors decided to publish. The submitted work for publication should be prepared according to the
instructions below as to be included in the procedure of reviewing. Inadequate prepared manuscripts will be
returned to the author for finishing.
Volume and Font size. The work needs to be written on A4 paper (210x297 mm), margins (left, right, upper
and bottom) with each 25 mm, in the Microsoft Word later version, font Times New Roman, size 12, with 1.5 line
spacing, justified to the left and right margins. It is recommended that the entire manuscript cannot be less than 5
pages and not exceed 10 pages.
Title of Work should be written in capital letters, bold, in Serbian and English. Under the title, the names of
authors and institutions where they work are written under the title. The author of work, responsible for
correspondence with the editorial staff, must provide his/her e-mail address for contact in a footnote.
Abstract is at the beginning of work and should be up to 200 words, include the aim of the work, the applied
methods, the main results and conclusions. The font size is 10, italic.
Key words are listed below abstract. They should be minimum 3 and maximum of 6. The font size is 10,
italic.
Basic text. The papers should be written concisely, in understandable style and logical order that, as a rule,
including the introductory section with a definition of the aim or problem, a description of the methodology,
presentation of the results as well as a discussion of the results with conclusions and implications.
Main titles should be done with the font size 12, bold, all capital letters and aligned with the left margin.
Subtitles are written with the font size 12, bold, aligned to the left margin, large and small letters.
Figure and Tables. Each figure and table must be understandable without reading the text, i.e., must have a
serial number, title and legend (explanation of marks, codes, abbreviations, etc.). The text is stated below the figure
and above the table. Serial numbers of figures and tables are given in Arabic numbers.
References in the text are referred to in angle brackets, exp. [1, 3]. References are enclosed at the end in the
following way:
[1] Willis B. A., Mineral Procesing Technology, Oxford, Pergamon Press, 1979, pg. 35. (for the chapter in a
book)
[2] Ernst H., Research Policy, 30 (2001) 143–157. (for the article in a journal)
[3] www: http://www.vanguard.edu/psychology/apa.pdf (for web document)
Specifying the unpublished works is not desirable and, if it is necessary, as much as possible data on the
source should be listed.
Acknowledgement is given where appropriate, at the end of the work and should include the name of
institution that funded the given results in the work, with the name and number of project, or if the work is derived
from the master theses or doctoral dissertation, it should give the name of thesis / dissertation, place, year and
faculty where it was defended. Font size is 10, italic.
The paper works are primarily sent by e-mail or in other electronic form.
Editorial address : Journal MINING AND METALLURGY ENGINEERING BOR
Mining and Metallurgy Institute
35 Zeleni bulevar, 19210 Bor
E-mail: [email protected]; [email protected]
Telephone: +381 (0) 30/435-164; +381 (0) 30/454-110
We are thankful for all authors on cooperation