Minimizing True-Ups - A Technical Analysis of Alternative ... · PDF fileA Technical Analysis...
22
Minimizing True-Ups: A Technical Analysis of Alternative Methods of Applying Forfeiture Assumptions Executive Summary In their 2006 fiscal reporting year, companies began recognizing compensation expense under FAS 123(R), now ASC Topic 718, using either a “straight-line” method or the “front-loaded” method prescribed. Each method has its advantages, but the majority of companies adopted the straight-line method. Issuers, who are responsible for the accuracy of their financial statements, have asked for additional detail regarding the choice between these two methods. In this paper, Fidelity Stock Plan Services and Radford, each of which provides services to Issuers in connection with Issuers’ equity compensation plans, analyze two alternatives for incorporating actual forfeitures into expense attribution: as they occur (the Dynamic method) or only at vesting events (the Static method). In addition, we describe the difference between applying the Dynamic method with grant level proration (“Grant at a Time”) or proration on the actively vesting tranche only (“Tranche at a Time”). Based on the analysis presented in this paper, both Radford and Fidelity have determined to utilize in their product and service offerings the Dynamic method for applying forfeitures, and we each use the Tranche at a Time approach when calculating expense on a straight-line basis for evenly graded awards with multiple tranches and for most front-loaded awards. This paper explains the mathematics behind our shared approach and the rationale for identifying it as a best practice supported in our product and service offerings. Of course, Issuers should consult with their legal and accounting advisers with respect to the preparation of their own financial statements, and in identifying service providers and offerings and integrating the company’s data into its own financial statements. ASC Topic 718 is silent in a prescribed approach to reconciling actual prevesting forfeitures with earlier estimates, except that it “shall be revised if subsequent information indicates that the actual number of instruments is likely to differ from previous estimates.” 1 Generally, two methodologies have evolved in practice: 1) Static (sometimes described as True-Up at Vest): Unless a company actively adjusts its assumed forfeiture rate at interim measurement dates, this method treats estimated forfeitures as entirely accurate over the service period. At the point of vesting, a cumulative charge (in the event of continued employment) or a cumulative credit (in the event of termination) will occur to reflect the reconciliation to actual experience. 2) Dynamic (sometimes described as True-up at Termination): This method credits back expense for actual forfeits and adjusts the effect of forfeiture rates for grants that have not forfeited as of each measurement date. The approach therefore systematically incorporates actual forfeiture experience throughout the requisite service period. The mathematics of this approach are provided in Appendix 1. Published by: Fidelity Stock Plan Services and Radford
Transcript of Minimizing True-Ups - A Technical Analysis of Alternative ... · PDF fileA Technical Analysis...
Minimizing True-Ups:
A Technical Analysis of Alternative Methods of Applying Forfeiture Assumptions
Executive Summary
In their 2006 fi scal reporting year, companies began recognizing compensation expense under FAS 123(R),
now ASC Topic 718, using either a “straight-line” method or the “front-loaded” method prescribed. Each
method has its advantages, but the majority of companies adopted the straight-line method.
Issuers, who are responsible for the accuracy of their fi nancial statements, have asked for additional
detail regarding the choice between these two methods. In this paper, Fidelity Stock Plan Services and
Radford, each of which provides services to Issuers in connection with Issuers’ equity compensation
plans, analyze two alternatives for incorporating actual forfeitures into expense attribution: as they
occur (the Dynamic method) or only at vesting events (the Static method). In addition, we describe
the difference between applying the Dynamic method with grant level proration (“Grant at a Time”)
or proration on the actively vesting tranche only (“Tranche at a Time”).
Based on the analysis presented in this paper, both Radford and Fidelity have determined to utilize in
their product and service offerings the Dynamic method for applying forfeitures, and we each use the
Tranche at a Time approach when calculating expense on a straight-line basis for evenly graded awards
with multiple tranches and for most front-loaded awards. This paper explains the mathematics behind
our shared approach and the rationale for identifying it as a best practice supported in our product and
service offerings. Of course, Issuers should consult with their legal and accounting advisers with respect
to the preparation of their own fi nancial statements, and in identifying service providers and offerings
and integrating the company’s data into its own fi nancial statements.
ASC Topic 718 is silent in a prescribed approach to reconciling actual prevesting forfeitures with
earlier estimates, except that it “shall be revised if subsequent information indicates that the actual
number of instruments is likely to differ from previous estimates.”1 Generally, two methodologies
have evolved in practice:
1) Static (sometimes described as True-Up at Vest): Unless a company actively adjusts its assumed
forfeiture rate at interim measurement dates, this method treats estimated forfeitures as entirely
accurate over the service period. At the point of vesting, a cumulative charge (in the event of
continued employment) or a cumulative credit (in the event of termination) will occur to refl ect
the reconciliation to actual experience.
2) Dynamic (sometimes described as True-up at Termination): This method credits back expense for
actual forfeits and adjusts the effect of forfeiture rates for grants that have not forfeited as of each
measurement date. The approach therefore systematically incorporates actual forfeiture experience
throughout the requisite service period. The mathematics of this approach are provided in
Appendix 1.
Published by: Fidelity Stock
Plan Services and Radford

2
Section 1 of this paper provides a summary of the distinction between the Static and Dynamic approaches and specifi c
research highlighting the differences in expense recognition between these two approaches. Ultimately, for many reasons,
we believe that most Issuers and their advisers will determine that the Dynamic approach complies more effectively with
the standard set in ASC Topic 718 and creates more appropriate expense recognition patterns, and we have adopted that
method in our own product and service offerings.
Section 2 discusses the differences between two approaches to applying the straight-line method of expense attribution:
(a) applying Dynamic estimates and recognizing expense based on the grant life and (b) applying Dynamic estimates and
focusing on the currently vesting tranche only.2 The latter “Tranche at a Time” approach prorates the awards expected
to vest for the currently vesting tranche only, while the “Grant at a Time” approach considers the total awards expected
to vest and prorates expense relative to the total vesting life of the grant. We will discuss how these approaches diverge,
and the pros and cons of each. For most awards, we believe that most Issuers and their advisers will determine that the
Tranche at a Time approach leads to more intuitive and consistent expense amortization throughout the vesting schedule,
and we have adopted that approach in our own product and service offerings.
In this section, we take a brief look at the expense
amortization example provided in the Standard.3 This
example is widely believed to be oversimplifi ed in its
treatment of truing up expected and actual forfeitures,
and this oversimplifi cation explains the existence of
alternative methods for applying estimated forfeitures.
The fi rst example covered in the Standard is an award
with three-year cliff vesting. In that example, the company
begins with an annual forfeiture assumption of 3% and
revises that rate to 6% after two years. The primary
simplifi cation in this example is that the eventual vested
shares correspond exactly to the revised estimate. Even
so, it is worth noting that a Dynamic forfeiture application
would yield a 68% smaller adjustment at the end of the
second year than the true-up calculated in the example.4
Section 1 covers in more detail the effect of applying
forfeiture rates using a Static versus a Dynamic calculation
in situations where actual forfeitures diverge from estimates.
The second example is a back-loaded award in which 25%
of the shares vest in the fi rst and second years, followed
by 50% of the shares vesting in the third year. This extreme
back-loading allows the example to sidestep the issue of
true-ups at vesting in the fi rst and second years because
the annual expense of $4M is greater than the total
expense for all shares scheduled to vest in each of the
fi rst two years. In our experience, evenly graded vesting
is much more commonly used by Issuers than back-
loading, and as Section 2 will cover in detail, prorating
expense based on the total grant life generally leads to
expected and unnecessary true-ups at vesting events. The
methodology we have determined to utilize in our product
and service offerings automatically applies Grant at a Time
amortization when back-loading demands it, as in this
second example, and in most other cases uses Tranche
at a Time amortization (see Section 2 for more details).
1 ASC Topic 718-10-35-3.2 “Tranche” is a term frequently used to describe equity awards with graded vesting; a tranche represents a single vesting portion of the full award.3 ASC Topic 718-20-55-6 and following.4 Assuming actual forfeitures in the second year are 7%, which seems reasonable given the revision to a 6% annual forfeiture rate for the grant life.
See Appendix 3 for details.
Background: Examples Provided in ASC 718-20-55

3
In this section, we compare the expense accruals produced
by the Static and the Dynamic methods when each is
applied to two sample grant populations. The Dynamic
method credits back expense for actual forfeitures in
the period they occur and adjusts the effect of expected
forfeitures for active grants based on the time remaining
until vest. As we will discuss in Section 2, the Dynamic
method can be used at a tranche level or grant level; our
analysis uses the Tranche at a Time approach described
in detail in Appendix 1. Under either the Dynamic or the
Static method, quarterly expense is determined based
on the number of days the grant was outstanding in each
quarter divided by the number of days in the vesting life
of the tranche or tranches considered.
The Static method used in our examples treats expected
forfeitures (in the aggregate) as a constant until the actual
number of awards to vest is known on the date of vesting.
In the period of each vesting event, the expense for each
tranche that vests will be trued up to the full grant date
fair value of vested awards. If the tranche has forfeited,
the expense recorded to date is reversed and no future
expense is recognized.
In practice, some companies using the Static method
manually revise their forfeiture rates to account for
actual forfeitures, allowing the results of the Static
method and the Dynamic method to converge to some
extent. The following analysis assumes that true-ups
take place only at vesting events, since our focus is on
which method produces results that will be viewed as
appropriate by most Issuers and their advisers without
manual intervention. Under either method, we expect
that companies would revise forfeiture rates if future
forfeiture rates are expected to diverge materially from
prior estimates, but our examples hold future forfeiture
assumptions constant — both for the sake of simplicity
and because our experience shows this to be the most
common practice.
We studied two historical grant populations using actual
data, each with four-year annual graded vesting (25% per
year). In selecting grant populations for this study, we
applied the following criteria: we wanted a reasonably small
population; the fi nal vesting needed to be in the past; we
needed access to all history; and we wanted one population
with a low forfeiture rate and another with a higher rate.
Otherwise, the populations were chosen at random.
Company A realized a low annual forfeiture rate (3.08%)
and Company B realized a high annual forfeiture rate
(11.1%) during the sample periods. In Appendix 4, we have
summarized grant and forfeiture data for each company.
Our analysis calculated expense using the Dynamic
and Static methods as described above. Expense was
calculated in each scenario using multiple forfeiture rate
assumptions, since a primary goal of our analysis was
to understand the effect on expense when forfeiture
estimates are not exactly on target. In the charts following
this section, we present two views of the data: The fi rst
four charts show quarterly expense under three different
forfeiture assumptions; the remaining two charts compare
the calculated expense to what would have been
recognized if the exact forfeiture rates for each vesting
date had been known in advance. See Appendix 5 for
the quarterly expense details of each method.
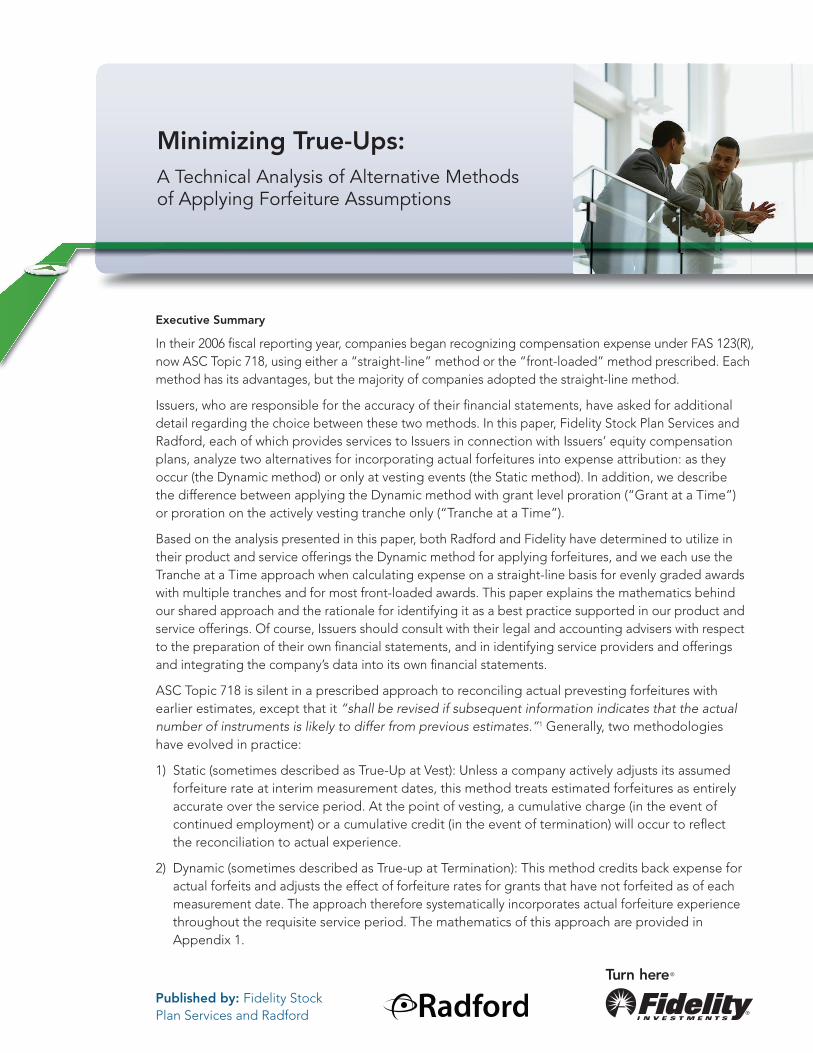
We start with charts 1 and 2, which compare quarterly
expense results for Company A’s grant population, which
had a grant date of 7/15/2004 and a four-year, 25% per
year graded vesting schedule. Under each method, results
are calculated as if the company had assumed a 0%, 3.08%
(actual), and 6% expected forfeiture rate.
Section 1: Analysis of Static Versus Dynamic Methods
4
Chart 1: Quarterly Expense Accruals for Company A Using the Static Method. Note that the spikes in expense
correspond with the annual vesting dates. In between vesting events, periodic expense is fl at, since all grants are included
in expense calculations and assume a constant forfeiture rate. The trail-off at the end represents the fi nal partial quarter
expense, where expense has been fully recognized and a fi nal true-up is taken.
Chart 2: Quarterly Expense Accruals for Company A Using the Dynamic Method. There is some variability due to
actual forfeitures or varying days in the period, but otherwise the period expense is consistent from period to period.
Expense generally declines from period to period, because each forfeit in a period reduces the total shares expected
to vest in all future periods. As before, the fi nal period is a partial period and includes any fi nal true-up.
0% Too Low 3.08% Actual 6% Too High$60,000
$50,000
$40,000
$30,000
$20,000
$10,000
$ –
$(10,000)
$(20,000)
Exp
ense
Sep-04
Dec-04
Mar-0
5
Jun-0
5
Sep-05
Dec-05
Mar-0
6
Jun-0
6
Sep-06
Dec-06
Mar-0
7
Jun-0
7
Sep-07
Dec-07
Mar-0
8
Jun-0
8
Sep-08
Quarter Ending
Grant Date: 7/15/2004
Vesting Schedule: four-year 25% graded
Actual Forfeiture Rate: 3.08%
5
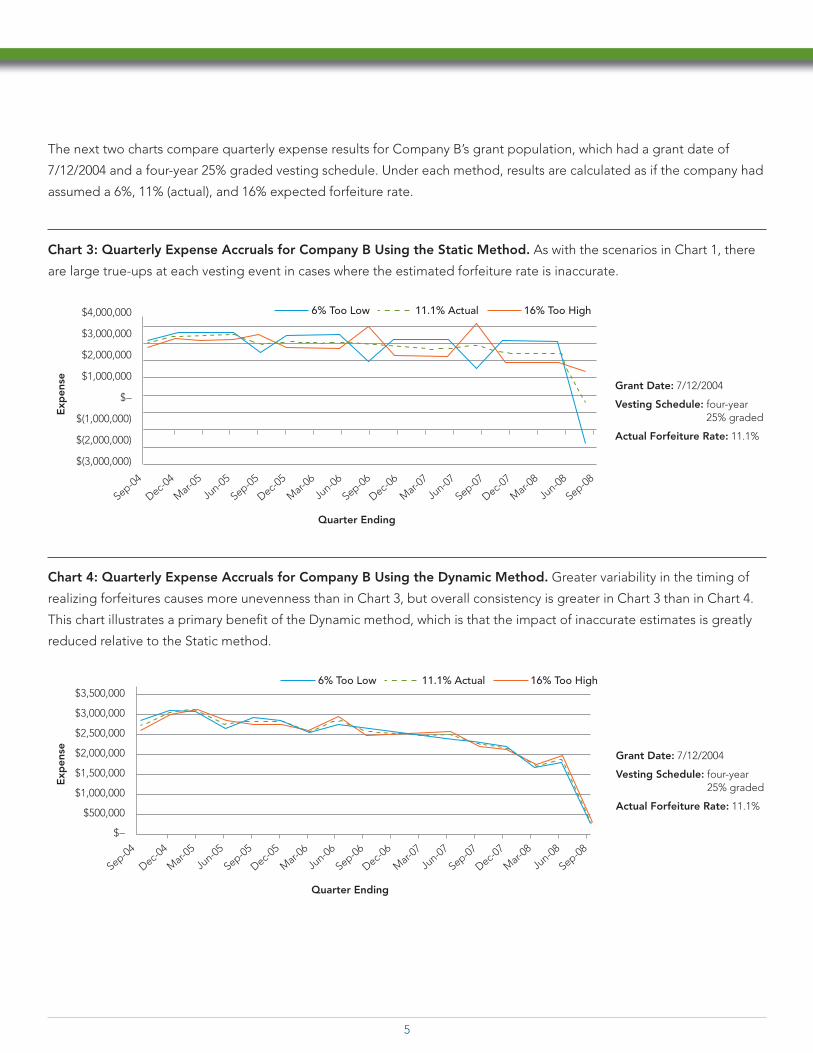
Chart 3: Quarterly Expense Accruals for Company B Using the Static Method. As with the scenarios in Chart 1, there
are large true-ups at each vesting event in cases where the estimated forfeiture rate is inaccurate.
Chart 4: Quarterly Expense Accruals for Company B Using the Dynamic Method. Greater variability in the timing of
realizing forfeitures causes more unevenness than in Chart 3, but overall consistency is greater in Chart 3 than in Chart 4.
This chart illustrates a primary benefi t of the Dynamic method, which is that the impact of inaccurate estimates is greatly
reduced relative to the Static method.
The next two charts compare quarterly expense results for Company B’s grant population, which had a grant date of
7/12/2004 and a four-year 25% graded vesting schedule. Under each method, results are calculated as if the company had
assumed a 6%, 11% (actual), and 16% expected forfeiture rate.
6% Too Low 11.1% Actual 16% Too High$4,000,000
$3,000,000
$2,000,000
$1,000,000
$ –
$(1,000,000)
$(2,000,000)
$(3,000,000)
Exp
ense
Sep-04
Dec-04
Mar-0
5
Jun-0
5
Sep-05
Dec-05
Mar-0
6
Jun-0
6
Sep-06
Dec-06
Mar-0
7
Jun-0
7
Sep-07
Dec-07
Mar-0
8
Jun-0
8
Sep-08
Quarter Ending
Grant Date: 7/12/2004
Vesting Schedule: four-year 25% graded
Actual Forfeiture Rate: 11.1%
6% Too Low 11.1% Actual 16% Too High$3,500,000
$3,000,000
$2,500,000
$2,000,000
$1,500,000
$1,000,000
$500,000
$ –
Exp
ense
Sep-04
Dec-04
Mar-0
5
Jun-0
5
Sep-05
Dec-05
Mar-0
6
Jun-0
6
Sep-06
Dec-06
Mar-0
7
Jun-0
7
Sep-07
Dec-07
Mar-0
8
Jun-0
8
Sep-08
Quarter Ending
Grant Date: 7/12/2004
Vesting Schedule: four-year 25% graded
Actual Forfeiture Rate: 11.1%

6
Charts 5 and 6 are intended to illustrate tolerance to inaccurate estimates, using deviation from exact knowledge as a
measure of variance. The lines for Company A and Company B each represent the standard deviation at each estimated
forfeiture rate, where the deviation is calculated as the difference between expense calculated using the assumed rate
and expense calculated using actual forfeiture rates for each tranche.
Chart 5: The Impact of the Expected Forfeiture Rate for Company A. Note that the actual annualized forfeiture rate
for the grant was 3.08%. The Dynamic method is highly tolerant of inaccurate estimates because it incorporates forfeitures
as they take place, and it pulls forfeited awards out of future calculations.
Chart 6: The Impact of the Expected Forfeiture Rate for Company B. Note that the actual annualized forfeiture rate
for the grant was 11.08% and that the Dynamic rate again shows a much narrower range of deviation as the estimated
forfeitures decrease in accuracy.
Sta
nd
ard
Devia
tio
n a
s a %
o
f To
tal E
xp
ense
Company A: Standard Deviation of Quarterly Expense
Dynamic Method Static Method
2.5%
2.0%
1.5%
1.0%
0.5%
0.0%
Forfeiture Rate Estimates
0% 1.00% 2.00% 3.00% 4.00% 5.00% 6.00% 7.00% 8.00% 9.00% 10.00%
Sta
nd
ard
Devia
tio
n a
s a %
o
f To
tal E
xp
ense
Company B: Standard Deviation of Quarterly Expense
Dynamic Method Static Method3.5%
3.0%
2.5%
2.0%
1.5%
1.0%
0.5%
0.0%
Forfeiture Rate Estimates
5% 6% 7% 8% 9% 10% 11% 12% 13% 14% 15% 16% 17% 18% 19% 20% 21% 22%
7
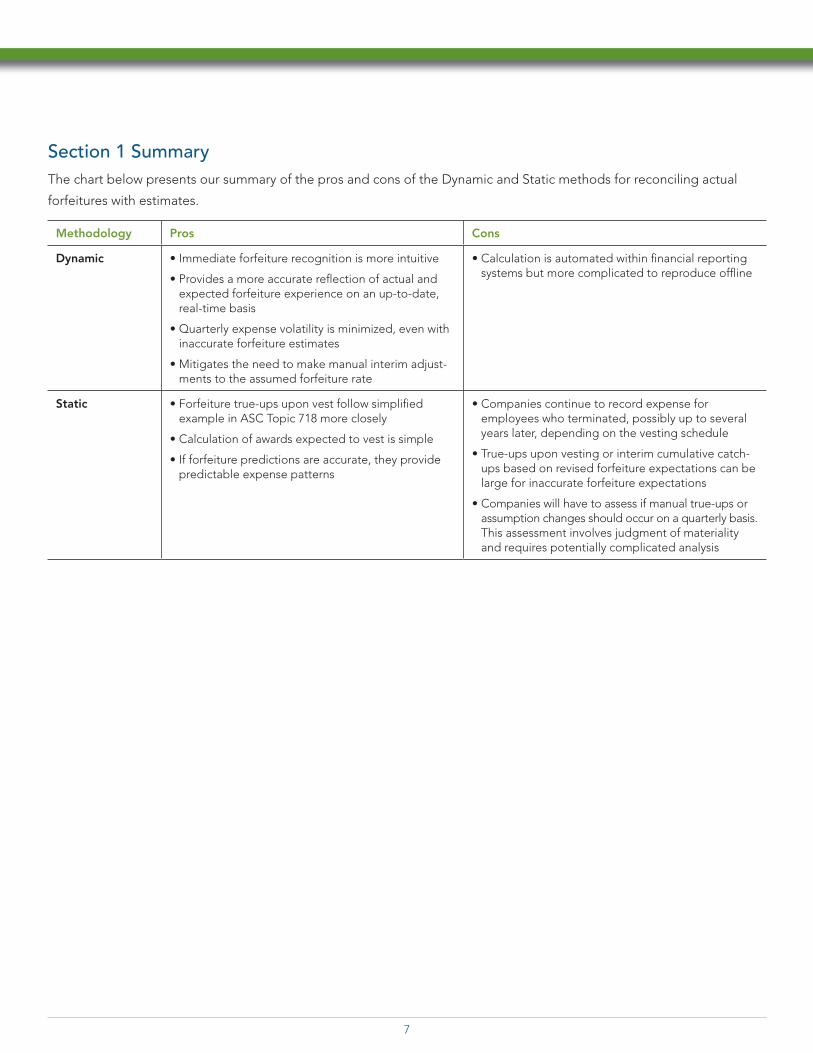
Section 1 Summary
The chart below presents our summary of the pros and cons of the Dynamic and Static methods for reconciling actual
forfeitures with estimates.
Methodology Pros Cons
Dynamic • Immediate forfeiture recognition is more intuitive
• Provides a more accurate refl ection of actual and expected forfeiture experience on an up-to-date, real-time basis
• Quarterly expense volatility is minimized, even with inaccurate forfeiture estimates
• Mitigates the need to make manual interim adjust-ments to the assumed forfeiture rate
• Calculation is automated within fi nancial reporting systems but more complicated to reproduce offl ine
Static • Forfeiture true-ups upon vest follow simplifi ed example in ASC Topic 718 more closely
• Calculation of awards expected to vest is simple
• If forfeiture predictions are accurate, they provide predictable expense patterns
• Companies continue to record expense for employees who terminated, possibly up to several years later, depending on the vesting schedule
• True-ups upon vesting or interim cumulative catch-ups based on revised forfeiture expectations can be large for inaccurate forfeiture expectations
• Companies will have to assess if manual true-ups or assumption changes should occur on a quarterly basis. This assessment involves judgment of materiality and requires potentially complicated analysis

8
Section 2: Analysis of Dynamic Method for Awards with Graded VestingThe following section provides greater detail regarding the Dynamic method for graded vesting schedules under two
approaches: Grant at a Time and Tranche at a Time. The illustration below shows a sample four-year graded vesting
schedule that can be considered in whole (Grant at a Time) or as individual tranches that are expensed sequentially (Tranche
at a Time). The two approaches are, of course, identical for awards with cliff vesting because they have only one tranche.
Chart 7: Illustration of Expense Spreading Methods
Approach 1 (Grant at a Time)
The Grant at a Time approach calculates the number of awards expected to vest on a tranche-by-tranche basis for all
tranches and totals them. The total shares expected to vest at a grant level, multiplied by the per share value, yields a
total expense net of forfeits, which is then prorated based on the total grant-level vesting life to determine a cumulative
expense through the period-end. If necessary, the cumulative expense is trued up to at least equal the expense for vested
shares at each measurement date. The quarterly expense is the difference between the new cumulative expense and the
prior period’s cumulative expense.
The main diffi culty with this approach is that the effect of forfeitures is averaged forward into earlier years, causing
a known or expected true-up at vesting. This is especially visible when vesting schedules are long or estimated forfeiture
rates are high. A simple example illustrates why:
Shares 100
Grant Date 01/01/2010
Final Vesting 01/01/2014
Estimated Annual Forfeiture Rate
10%
Vest Dates Shares Expected to Vest as of Grant Date
01/01/2011 25 22.50
01/01/2012 25 20.25
01/01/2013 25 18.23
01/01/2014 25 16.40
77.38
Grant at a Time Year 1 Year 2 Year 3 Year 4
All Tranches
Tranche at a Time
Tranche 1Tranche 2Tranche 3Tranche 4
Sample calculation for the third tranche:25 Shares x (1–10% forfeiture rate) raised to 3 years remaining to vest = 18.23.
The likelihood of vesting decreases as time until vest increases, so later tranches have progressively fewer shares expected to vest for any forfeiture rate >0.
See Appendix 1, Step 1, for details on calculating these numbers.
9
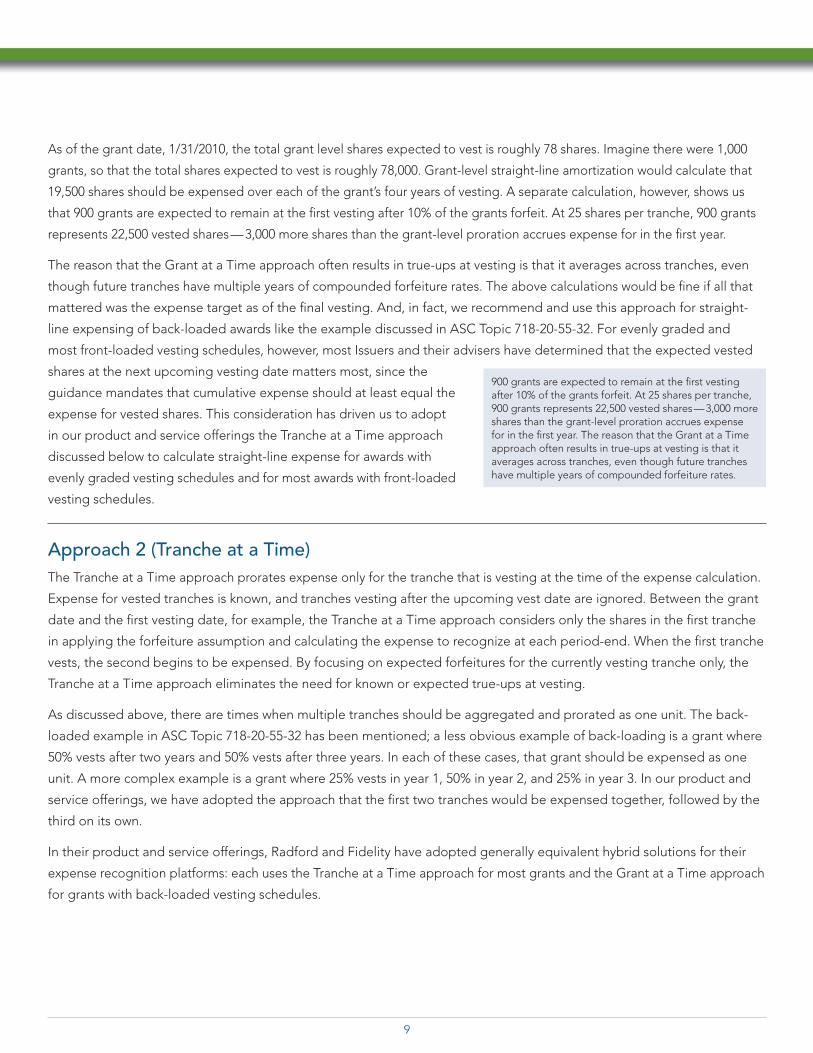
As of the grant date, 1/31/2010, the total grant level shares expected to vest is roughly 78 shares. Imagine there were 1,000
grants, so that the total shares expected to vest is roughly 78,000. Grant-level straight-line amortization would calculate that
19,500 shares should be expensed over each of the grant’s four years of vesting. A separate calculation, however, shows us
that 900 grants are expected to remain at the fi rst vesting after 10% of the grants forfeit. At 25 shares per tranche, 900 grants
represents 22,500 vested shares — 3,000 more shares than the grant-level proration accrues expense for in the fi rst year.
The reason that the Grant at a Time approach often results in true-ups at vesting is that it averages across tranches, even
though future tranches have multiple years of compounded forfeiture rates. The above calculations would be fi ne if all that
mattered was the expense target as of the fi nal vesting. And, in fact, we recommend and use this approach for straight-
line expensing of back-loaded awards like the example discussed in ASC Topic 718-20-55-32. For evenly graded and
most front-loaded vesting schedules, however, most Issuers and their advisers have determined that the expected vested
shares at the next upcoming vesting date matters most, since the
guidance mandates that cumulative expense should at least equal the
expense for vested shares. This consideration has driven us to adopt
in our product and service offerings the Tranche at a Time approach
discussed below to calculate straight-line expense for awards with
evenly graded vesting schedules and for most awards with front-loaded
vesting schedules.
Approach 2 (Tranche at a Time)
The Tranche at a Time approach prorates expense only for the tranche that is vesting at the time of the expense calculation.
Expense for vested tranches is known, and tranches vesting after the upcoming vest date are ignored. Between the grant
date and the fi rst vesting date, for example, the Tranche at a Time approach considers only the shares in the fi rst tranche
in applying the forfeiture assumption and calculating the expense to recognize at each period-end. When the fi rst tranche
vests, the second begins to be expensed. By focusing on expected forfeitures for the currently vesting tranche only, the
Tranche at a Time approach eliminates the need for known or expected true-ups at vesting.
As discussed above, there are times when multiple tranches should be aggregated and prorated as one unit. The back-
loaded example in ASC Topic 718-20-55-32 has been mentioned; a less obvious example of back-loading is a grant where
50% vests after two years and 50% vests after three years. In each of these cases, that grant should be expensed as one
unit. A more complex example is a grant where 25% vests in year 1, 50% in year 2, and 25% in year 3. In our product and
service offerings, we have adopted the approach that the fi rst two tranches would be expensed together, followed by the
third on its own.
In their product and service offerings, Radford and Fidelity have adopted generally equivalent hybrid solutions for their
expense recognition platforms: each uses the Tranche at a Time approach for most grants and the Grant at a Time approach
for grants with back-loaded vesting schedules.
900 grants are expected to remain at the fi rst vesting after 10% of the grants forfeit. At 25 shares per tranche, 900 grants represents 22,500 vested shares — 3,000 more shares than the grant-level proration accrues expense for in the fi rst year. The reason that the Grant at a Time approach often results in true-ups at vesting is that it averages across tranches, even though future tranches have multiple years of compounded forfeiture rates.

10
Methodology Pros Cons
Tranche at a Time Proration
• Predictable, intuitive expense amortization results
• Eliminates known or expected true-ups that would otherwise result at each vest date
• Deviates from the simplifi ed example in ASC Topic 718, though it is still compliant
Grant at a Time Proration
• Most consistent with simplifi ed example provided in ASC Topic 718 and classic straight-line attribution
• Required when back-loaded vesting schedules demand it
• Requires known or expected true-ups at vesting events and, therefore, volatility of expense recognition within each vesting tranche and over the total vesting life of the grant, even if the assumed forfeiture rate is accurate
Conclusion
There are multiple decisions to be made when establishing a compliant process to amortize equity compensation, and
best practices have evolved since the initial release of FAS 123(R). The two primary decisions involve choosing a method
for truing up to actual forfeitures — either Static or Dynamic — and choosing whether to calculate expense for graded
vesting schedules using the Grant at a Time or the Tranche at a Time approach.
Fidelity and Radford have each adopted the Dynamic method in their product and service offerings, based upon their
judgment that most Issuers and their advisers will determine that this method provides the least volatile expense while also
minimizing the impact of having an inaccurate forfeiture rate. Although the swings in expense associated with the Static
method may be diminished with a series of manual interim adjustments to the forfeiture rate or by having multiple grants
spread throughout the year, we believe most Issuers and their advisers will fi nd that the Dynamic method delivers more
reliable and consistent results with less manual effort, and that this method will therefore become a clear best practice in
the marketplace.
We have further concluded that most Issuers and their advisers will determine that Tranche at a Time proration of evenly
graded vesting awards reduces true-ups while meeting ASC 718 minimum level of recognition requirements under a
straight-line allocation methodology, and we have therefore adopted that methodology in our product and service offerings.
At the same time, however, we believe that most Issuers and their advisers will determine that Grant at a Time allocation is
still more appropriate for back-loaded vesting schedules, but since the majority of awards are evenly graded, Tranche at
a Time proration should be used in most cases, and we have therefore adopted those methodologies in our product and
service offerings. We believe that most Issuers and their advisers will determine that a hybrid approach using Tranche at a
Time whenever possible and Grant at a Time when necessary delivers expense accruals that are as even as possible under
the requirements of ASC 718.

11
Appendix 1 — Mathematical Formulas Behind Dynamic Forfeiture Rates
In 2007, Radford published the mathematics behind Dynamic forfeiture reconciliation using the Grant at a Time approach
in Steps 1 through 3 of the white paper linked here: http://www.radford.com/home/ccg/valuation_services/Whitepaper_
Aon_Expense_Allocation_082207.pdf. The current Appendix summarizes the mathematics for the Tranche at a Time
approach. Note that both Radford and Fidelity use this expense recognition pattern for our respective client bases.5
Step 1: Determining the Expected Awards to Vest
The fi rst step in the process is determining the expected number of awards to vest. This determination should consider all
relevant characteristics, such as vesting schedules, change in control provisions, retirement eligibility, and other provisions.
To calculate the compensation expense at any Measurement Date (MD) at time t after grant date, the projected awards to
vest, PVt, must be estimated. Further, the vested shares, VS
t, at time t can be determined, and the fair value per share (FV)
is assumed to be known. As mentioned earlier and in ASC 718-10-35-8, at no time can the expense recognized be less
than the aggregate fair value of vested awards, and therefore VSt x FV can be viewed as a minimum expense fl oor.
Again, this calculation should consider the possibility of early vesting (when the award becomes non-forfeitable) for
reasons such as retirement eligibility. Therefore, if awards become non-forfeitable upon retirement eligibility, and the
nominal service Vesting Date (VD) is in a period later than the retirement eligibility date, the expected awards to vest
should refl ect this. It may be necessary to calculate an adjusted Vesting Date (VD) to refl ect an early recognition of vesting
provisions. For simplicity purposes, the forthcoming examples do not adjust the Vesting Date (VD) to refl ect any early
vesting provisions.
For each vesting tranche i at a particular Measurement Date (MDt), PV
t
i should be estimated as:
= Number of Options in Tranche (1 Forfeiture Rate) 365.25
Max i - ,0)(VD MDt
t
iPV i
The above formula could be skipped for vested tranches, since vested shares is generally a known quantity. The formula
will work for vested tranches, though, since the exponent resolves to zero when MDt is after the vesting date.
5 Please note that the exact formulas follow Radford’s calculations, which were used to generate the data in the examples used. Fidelity uses 365 days per year instead of 365.25, and is grant date exclusive, while the formulas shown are grant date inclusive. Note also that the process calculates expense at the individual award level. This differs from the standard display of examples in the accounting guidance but is in our understanding the standard and preferred practice for all major providers. It is beyond the scope of this paper to analyze possible methods for calculating expense schedules at an aggregate level and how that could affect results.

12
Step 2: Expense Recognition
For each Measurement Date (MDt) the projected required expense is based on the shares expected to vest times a
cumulative amortization ratio for that date. This calculation will be at the tranche level or an aggregate level, depending
on whether the Tranche at a Time or the Grant at a Time approach is used. A complicated variety of formulas is needed,
but the concept is simple: determine the period over which each block of shares should be amortized and calculate a
Cumulative Amortization Ratio (CAR) for each measurement date based on where it falls relative to the overall service
period for the block of shares. If MDt is before the amortization period’s start date, then CAR
t will be equal to 0%; if after
the amortization period’s end date, then CARt will be equal to 100%; and otherwise CAR
t will be between 0% and 100%.
The level at which the CAR is calculated will vary depending on the vesting schedule and the expense recognition policy
(straight-line or FIN28).
Using a straight-line attribution method for even or front-loaded vesting schedules, the vesting dates are used to
determine the current CAR for each tranche:
= Maximum(Minimum( 1))+1
( 1))+1,100%),0%) CAR
t
iMD
tiMaximum(GD,VD
VD i iMaximum(GD,VD
Vested tranches will have a CAR of 100% so no extra work is needed to ensure that all vested shares are expensed at any
time t. For a grant with n tranches, the grant level Amortized Expense (AEt) to be accrued through MD
t is calculated as:
==1
CAR PV FVAEt t t
n
ii i
Using a straight-line attribution method, for back-loaded vesting schedules, the CAR is calculated for the grant as a
whole, consistent with the Grant at a Time approach.6
= Maximum(Minimum( ,100%),0%) CARt VD GD +1
MD GD +1t
Max
For a back-loaded grant with n tranches, expected forfeitures could push calculated expense below vested expense, so
the grant level AEt is calculated as:
= Maximum ,=1=1i i
FV FVVSAEt
CARt
PVt
i
t
nn
i
Using a front-loaded attribution method, it will be necessary to calculate the CAR for each respective vesting tranche i
from the Grant Date (GD):
=Maximum(Minimum( 100%),0%)CARMD
VD GD +1
GD +1t
i t
i
The grant level AEt is calculated as the sum of the expense for each of the grant’s n tranches:
==1
t
ii
t
n
i
tAE CAR PV iFV
6 For simplicity, we have focused on a fully back-loaded grant. As discussed in Section 2, there are much rarer examples, such as a grant where 25% vests in year 1, 50% in year 2, and 25% in year 3. Such grants would be expensed using the same process as with even vesting schedules, but grouping two or more tranches together (the fi rst and second tranches in the example mentioned).
13
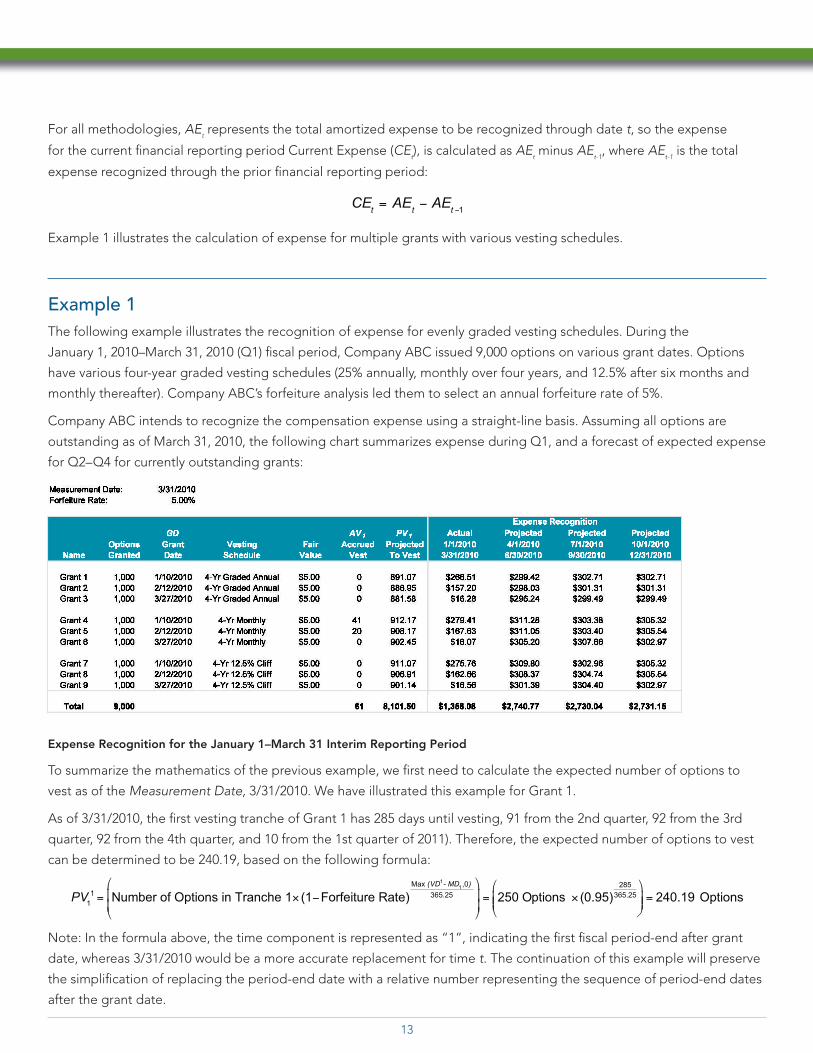
For all methodologies, AEt represents the total amortized expense to be recognized through date t, so the expense
for the current fi nancial reporting period Current Expense (CEt), is calculated as AE
t minus AE
t-1, where AE
t-1 is the total
expense recognized through the prior fi nancial reporting period:
=1
CE AE AEt t t
Example 1 illustrates the calculation of expense for multiple grants with various vesting schedules.
Example 1
The following example illustrates the recognition of expense for evenly graded vesting schedules. During the
January 1, 2010–March 31, 2010 (Q1) fi scal period, Company ABC issued 9,000 options on various grant dates. Options
have various four-year graded vesting schedules (25% annually, monthly over four years, and 12.5% after six months and
monthly thereafter). Company ABC’s forfeiture analysis led them to select an annual forfeiture rate of 5%.
Company ABC intends to recognize the compensation expense using a straight-line basis. Assuming all options are
outstanding as of March 31, 2010, the following chart summarizes expense during Q1, and a forecast of expected expense
for Q2– Q4 for currently outstanding grants:
Expense Recognition for the January 1–March 31 Interim Reporting Period
To summarize the mathematics of the previous example, we fi rst need to calculate the expected number of options to
vest as of the Measurement Date, 3/31/2010. We have illustrated this example for Grant 1.
As of 3/31/2010, the fi rst vesting tranche of Grant 1 has 285 days until vesting, 91 from the 2nd quarter, 92 from the 3rd
quarter, 92 from the 4th quarter, and 10 from the 1st quarter of 2011). Therefore, the expected number of options to vest
can be determined to be 240.19, based on the following formula:
1
1= Number of Options in Tranche 1 (1 Forfeiture Rate)
Max 1 - ,0)
365.25 = 250 Options (0.95)285
365.25 = 240.19 OptionsPV
(VD MD1
Note: In the formula above, the time component is represented as “1”, indicating the fi rst fi scal period-end after grant
date, whereas 3/31/2010 would be a more accurate replacement for time t. The continuation of this example will preserve
the simplifi cation of replacing the period-end date with a relative number representing the sequence of period-end dates
after the grant date.
14
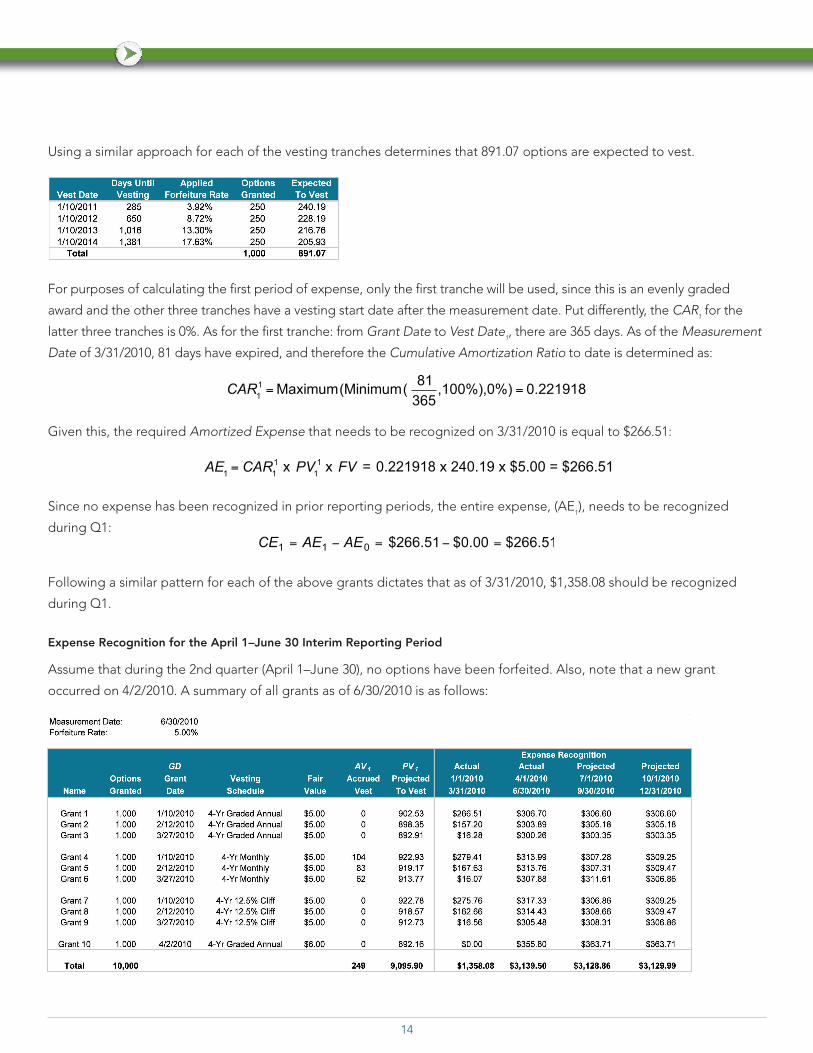
Using a similar approach for each of the vesting tranches determines that 891.07 options are expected to vest.
For purposes of calculating the fi rst period of expense, only the fi rst tranche will be used, since this is an evenly graded
award and the other three tranches have a vesting start date after the measurement date. Put differently, the CAR1 for the
latter three tranches is 0%. As for the fi rst tranche: from Grant Date to Vest Date1, there are 365 days. As of the Measurement
Date of 3/31/2010, 81 days have expired, and therefore the Cumulative Amortization Ratio to date is determined as:
1
1=Maximum(Minimum(
81
365,100%),0%) = 0.221918CAR
Given this, the required Amortized Expense that needs to be recognized on 3/31/2010 is equal to $266.51:
1=
1
1 x 1
1 x = 0.221918 x 240.19 x $5.00 = $266.51AE CAR PV FV
Since no expense has been recognized in prior reporting periods, the entire expense, (AE1), needs to be recognized
during Q1:
Following a similar pattern for each of the above grants dictates that as of 3/31/2010, $1,358.08 should be recognized
during Q1.
Expense Recognition for the April 1–June 30 Interim Reporting Period
Assume that during the 2nd quarter (April 1–June 30), no options have been forfeited. Also, note that a new grant
occurred on 4/2/2010. A summary of all grants as of 6/30/2010 is as follows:

15
Note that the expense recognition for Q1 has not changed, as the amount accrued was fi xed.
Again, it is necessary to calculate the expected number of options to vest, given the experience to date. As of 6/30/2010,
the fi rst vesting tranche of Grant 1 has 194 days until vesting. Therefore, the expected number of options can be
determined to be 243.28, based on the following formula:
1
2= Number of Options in Tranche 1 (1 Forfeiture Rate)
Max
365.25 = 250 Options (0.95)194
365.25 = 243.28 OptionsPV 1 - ,0)(VD MD
2
Using a similar approach for each of the vesting tranches determines that 902.53 options are expected to vest. (Note that
after three months of experience, 11.46 more options are expected to vest, due to decreased risk of forfeiture.)
Again, only the fi rst tranche will be considered in the second period’s expense calculation. From Grant Date to Vest Date1,
there are 365 days. As of the Measurement Date of 6/30/2010, 171 days have expired, and therefore the Cumulative
Amortization Ratio to date is determined as:
1
2= Maximum (Minimum (
172
365,100%),0%) = 0.471233CAR
Therefore, as of 6/30/2010, the required Amortized Expense that needs to be recognized is equal to $573.21.
2=
1
2 1
2 = 0.471233 243.28 $5.00 = $573.21CAR PV FVAE
Since during Q1 (see page 14), $266.51 was accrued, then the current expense required to be recognized is equal to
$306.70.
2=
2 1= $573.21 $266.51= $306.70AEAECE
Following a similar pattern for each of the above grants, $3,139.50 should be recognized during Q2.
Reconciliation of Actual Q2 Expense against Projected Q2 Expense
During Q1, it was projected that Q2 expense would be equal to $2,740.77. As of 6/30/2010, we now see that Q2 expense
is equal to $3,139.50. Why the difference? Following our approach for reconciling changes in expense, we note:
16
Note that an additional $355.80 of current expense was recognized in Q2 due to a new grant, which was not projected in Q1.
Further, an increase of $42.93 was recognized to refl ect that 102.24 more options are now expected to vest in the aggregate
(9,095.90 options expected during Q2 less the new grant of 892.16 less the prior estimate of 8,101.50).
9,095.90 – 892.16 – 8,101.50 = 102.24
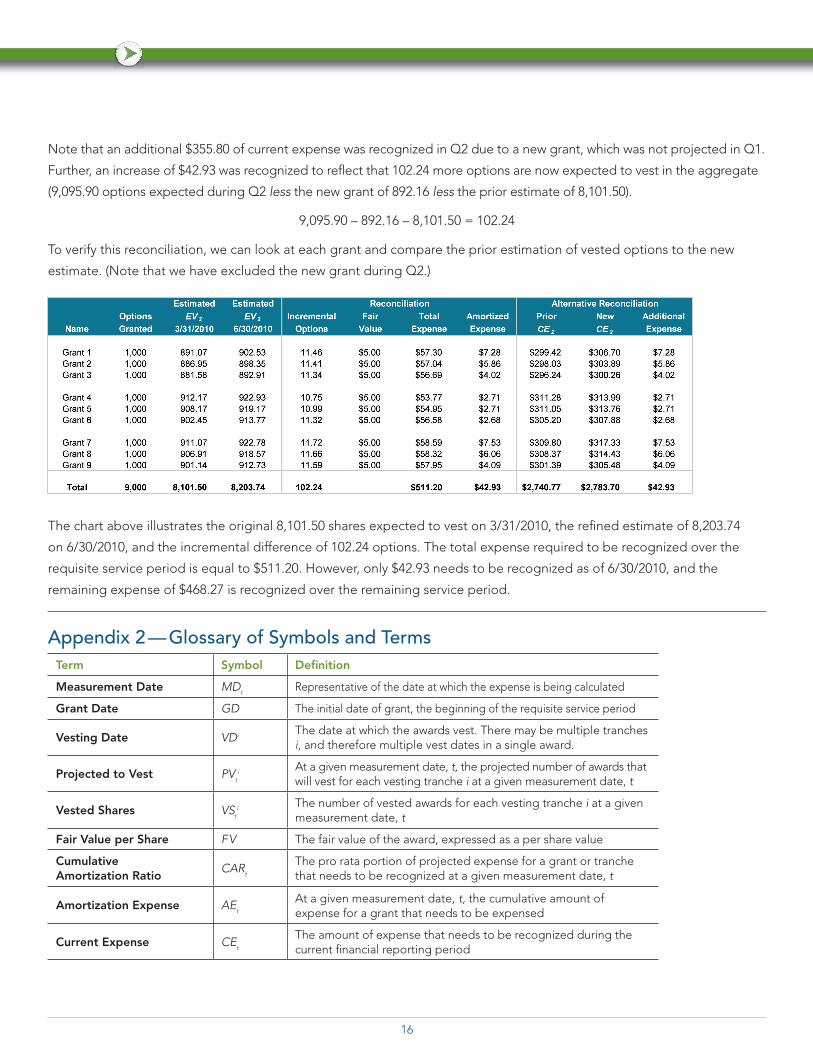
To verify this reconciliation, we can look at each grant and compare the prior estimation of vested options to the new
estimate. (Note that we have excluded the new grant during Q2.)
The chart above illustrates the original 8,101.50 shares expected to vest on 3/31/2010, the refi ned estimate of 8,203.74
on 6/30/2010, and the incremental difference of 102.24 options. The total expense required to be recognized over the
requisite service period is equal to $511.20. However, only $42.93 needs to be recognized as of 6/30/2010, and the
remaining expense of $468.27 is recognized over the remaining service period.
Appendix 2 — Glossary of Symbols and Terms
Term Symbol Defi nition
Measurement Date MDt
Representative of the date at which the expense is being calculated
Grant Date GD The initial date of grant, the beginning of the requisite service period
Vesting Date VDiThe date at which the awards vest. There may be multiple tranches i, and therefore multiple vest dates in a single award.
Projected to Vest PVt
iAt a given measurement date, t, the projected number of awards that will vest for each vesting tranche i at a given measurement date, t
Vested Shares VSt
iThe number of vested awards for each vesting tranche i at a given measurement date, t
Fair Value per Share FV The fair value of the award, expressed as a per share value
Cumulative Amortization Ratio
CARt
The pro rata portion of projected expense for a grant or tranche that needs to be recognized at a given measurement date, t
Amortization Expense AEt
At a given measurement date, t, the cumulative amount of expense for a grant that needs to be expensed
Current Expense CEt
The amount of expense that needs to be recognized during the current fi nancial reporting period
17
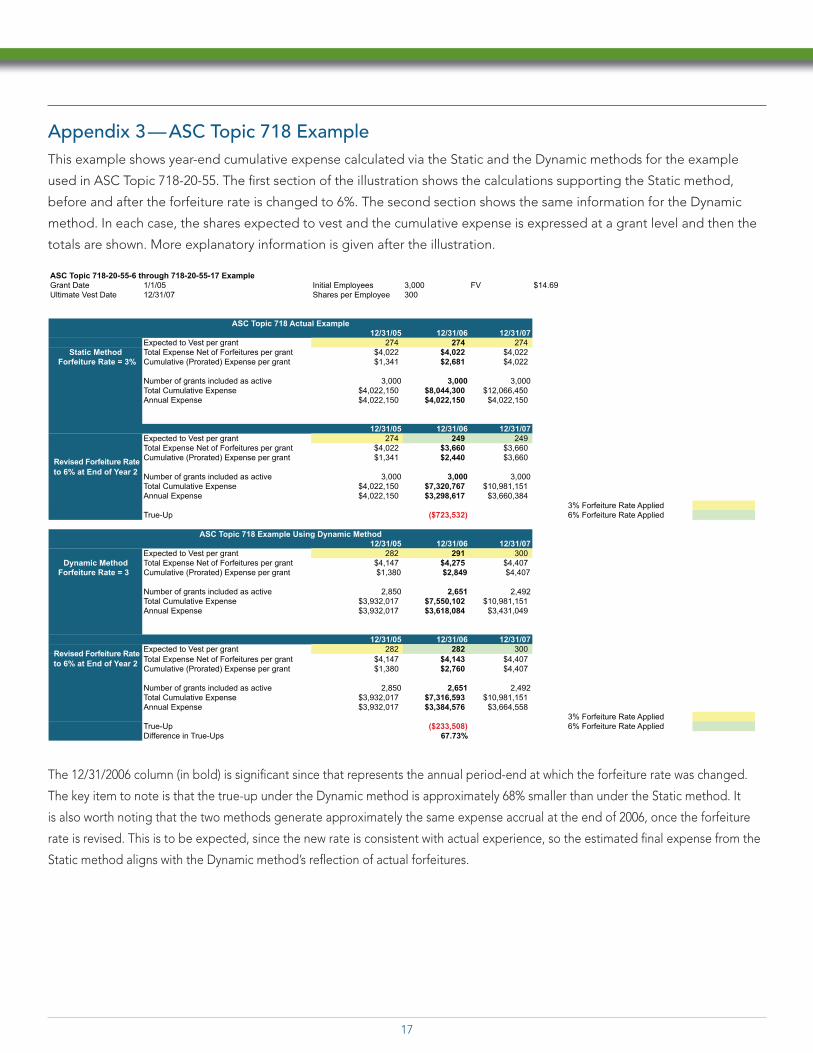
Appendix 3 — ASC Topic 718 Example
This example shows year-end cumulative expense calculated via the Static and the Dynamic methods for the example
used in ASC Topic 718-20-55. The fi rst section of the illustration shows the calculations supporting the Static method,
before and after the forfeiture rate is changed to 6%. The second section shows the same information for the Dynamic
method. In each case, the shares expected to vest and the cumulative expense is expressed at a grant level and then the
totals are shown. More explanatory information is given after the illustration.
ASC Topic 718-20-55-6 through 718-20-55-17 ExampleGrant Date 1/1/05 Initial Employees 3,000 FV $14.69Ultimate Vest Date 12/31/07 Shares per Employee 300
12/31/05 12/31/06 12/31/07Expected to Vest per grant 274 274 274 Total Expense Net of Forfeitures per grant $4,022 $4,022 $4,022Cumulative (Prorated) Expense per grant $1,341 $2,681 $4,022
Number of grants included as active 3,000 3,000 3,000Total Cumulative Expense $4,022,150 $8,044,300 $12,066,450Annual Expense $4,022,150 $4,022,150 $4,022,150
12/31/05 12/31/06 12/31/07Expected to Vest per grant 274 249 249 Total Expense Net of Forfeitures per grant $4,022 $3,660 $3,660Cumulative (Prorated) Expense per grant $1,341 $2,440 $3,660
Number of grants included as active 3,000 3,000 3,000Total Cumulative Expense $4,022,150 $7,320,767 $10,981,151Annual Expense $4,022,150 $3,298,617 $3,660,384
3% Forfeiture Rate AppliedTrue-Up ($723,532) 6% Forfeiture Rate Applied
12/31/05 12/31/06 12/31/07Expected to Vest per grant 282 291 300 Total Expense Net of Forfeitures per grant $4,147 $4,275 $4,407
For eiture Rate = 3 Cumulative (Prorated) Expense per grant $1,380 $2,849 $4,407
Number of grants included as active 2,850 2,651 2,492Total Cumulative Expense $3,932,017 $7,550,102 $10,981,151Annual Expense $3,932,017 $3,618,084 $3,431,049
12/31/05 12/31/06 12/31/07Expected to Vest per grant 282 282 300
Total Expense Net of Forfeitures per grant $4,147 $4,143 $4,407Cumulative (Prorated) Expense per grant $1,380 $2,760 $4,407
Number of grants included as active 2,850 2,651 2,492Total Cumulative Expense $3,932,017 $7,316,593 $10,981,151Annual Expense $3,932,017 $3,384,576 $3,664,558
3% Forfeiture Rate AppliedTrue-Up ($233,508) 6% Forfeiture Rate AppliedDifference in True-Ups 67.73%
to 6% at End of Year 2
Static MethodFor eiture Rate = 3%
ASC Topic 718 Actual Example
to 6% at End of Year 2
ASC Topic 718 Example Using Dynamic Method
Dynamic Method
The 12/31/2006 column (in bold) is signifi cant since that represents the annual period-end at which the forfeiture rate was changed.
The key item to note is that the true-up under the Dynamic method is approximately 68% smaller than under the Static method. It
is also worth noting that the two methods generate approximately the same expense accrual at the end of 2006, once the forfeiture
rate is revised. This is to be expected, since the new rate is consistent with actual experience, so the estimated fi nal expense from the
Static method aligns with the Dynamic method’s refl ection of actual forfeitures.
Revised Forfeiture Rate
Revised Forfeiture Rate

18
The difference in the true-up is due to the fact that the Static method produces a higher cumulative expense amount under the
3% forfeiture assumption. Under both methods, of course, the shares expected to vest is overstated using the original forfeiture
assumption of 3%:
• The Static method applies the forfeiture assumption to all grants over the entire grant life and, therefore, with a 3% rate it generates
a static calculation of 274 shares expected to vest for each grant, versus 249 shares at 6%.
• The Dynamic method adjusts the time remaining to vest in applying the forfeiture assumption, so with a 3% rate it calculates that
291 shares are expected to vest for each grant at the end of 2006, versus 282 shares at 6%.
In each case, then, the shares expected to vest are overstated prior to the forfeiture adjustment, but the Dynamic method produces
a lower total cumulative expense under the 3% assumption. This is because it effectively ignores all grants that have already forfeited
by reducing their expense to zero: the 12/31/06 calculation includes only 2,651 grants under the Dynamic method, not the 2,823
grants that a 3% forfeiture rate would have predicted to be active on that date.7 The Static method, on the other hand, includes all 300
grants, so the effect of the inaccurate forfeiture assumption is greater.
7 As mentioned previously in footnote 4 above, this calculation assumes actual forfeitures in the second year are 7%, which seems reasonable given that 5% of the grants forfeited in year 1 and that the recalculated annual forfeiture rate for the grant life is 6%. As for the prediction of total grants at 3%, the calculation is as follows: Assuming forfeitures are evenly distributed, 90 grants would forfeit in year 1 (3,000 x 3%) and 87 grants would forfeit in year 2 (2,910 remaining grants x 3%), leaving 2,823 grants.
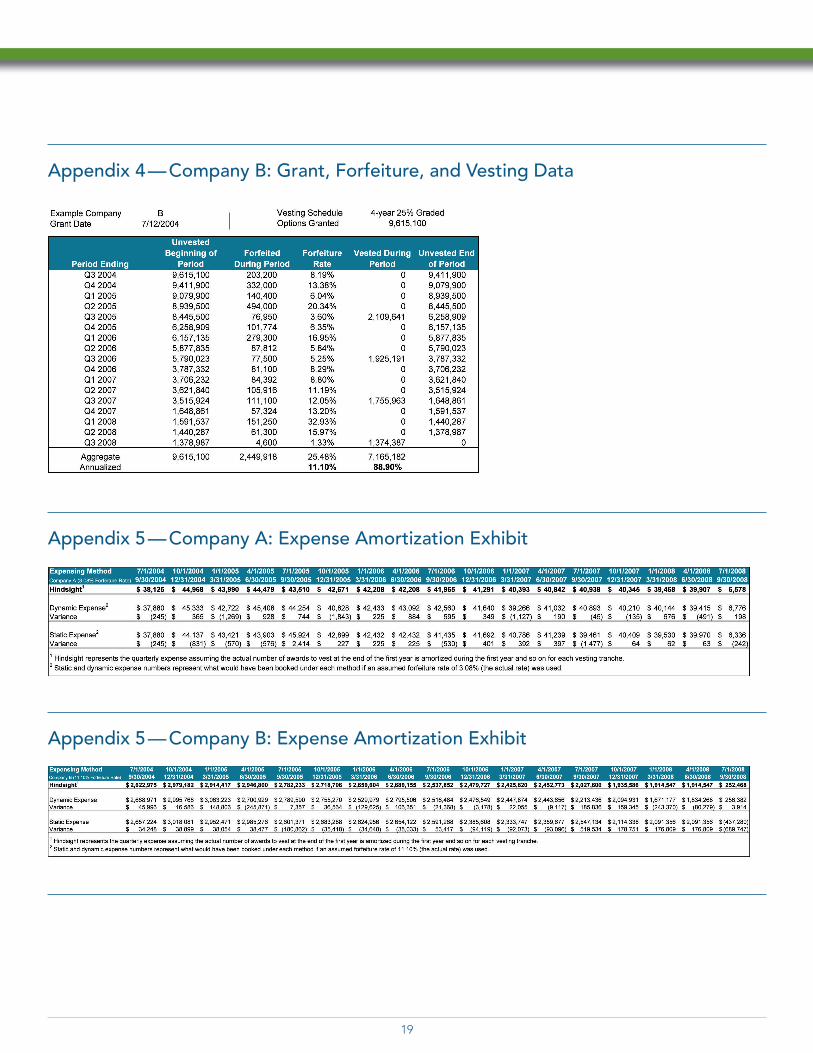
Appendix 4 — Company A: Grant, Forfeiture, and Vesting Data
19
Appendix 4 — Company B: Grant, Forfeiture, and Vesting Data
Appendix 5 — Company A: Expense Amortization Exhibit
Appendix 5 — Company B: Expense Amortization Exhibit

20
About the Authors
Matt Roberts is the Vice President of Financial Reporting and Industry Relations with Fidelity Stock Plan Services LLC (SPS).
He has managed SPS’s fi nancial reporting service offering since its inception in 2003. Within the equity compensation
industry, Matt serves on the GEO Boston Chapter Advisory Board and the Certifi ed Equity Professional Institute’s (CEPI)
Advisory Board. Matt has supported the CEPI’s efforts in educating Issuers, Service Providers, and Consultants by serving on
the Technical Oversight Committee for each of the Guidance Procedures and Systems (GPS) publications.
Derek Sanger is a Director of Product Management within the Fidelity Stock Plan Services group. He has oversight of
a number of product offerings, primarily the Financial Reporting offering. He has led the design and rollout of SPS’s
Financial Reporting capabilities for the past four years, including the development of the methodology outlined in this
paper and the development of end-to-end capabilities supporting acquired grants, modifi cations, option exchanges, and
performance plan accounting.
Terry Adamson serves as the National Practice Leader for Radford Valuation Services (RVS), the equity consulting group
of Radford. In this role, Terry leads the Topic 718 practice and advises over 300 public companies with regard to equity
design, valuation, and accounting. Terry was on the FASB Round Table on Employee Share Options, is the Chairperson of
the Society of Actuaries task force on stock option valuation, and is on the Curriculum Committee of the
Certifi ed Equity Professional Institute (CEPI).
Liz Stoudt, ASA, CEP, is the Director of Operations for Radford Valuation Services (RVS), the equity valuation group of
Radford. She has more than eight years of benefi t and compensation consulting experience. In addition to overseeing
workfl ow for the consulting team, she is a project leader responsible for quarterly valuations and producing fi nancial
reporting information under Topic 718. Liz has attained the Associate of the Society of Actuaries (ASA) and CEP
designations. Since becoming a CEP in 2007, Liz has volunteered on numerous test development activities for the CEPI.
Jacob Peters, CEP, is a Senior Consultant with Radford Valuation Services (RVS). He has more than fi ve years of benefi ts
and compensation consulting experience. Jacob consults on a variety of employee benefi ts and compensation issues,
including valuation and accounting for Employee Stock Option plans, Employee Stock Purchase plans, and other equity-
based compensation under Topic 718; valuation of compensatory arrangements for purposes of a change in control under
IRC 280G; and valuation and accounting for equity programs in mergers, acquisitions, and divestitures under Topic 805.

21
About Fidelity
Fidelity Investments is one of the most trusted providers of lifetime fi nancial solutions. Our Stock Plan Services bring you
industry-leading, global outsourcing solutions for Stock Option, Restricted Stock, Stock Appreciation, and Employee
Stock Purchase plans.
One single, consolidated platform for all your equity compensation plans, total benefi ts, and personal fi nance means you
can easily access and manage all your programs anytime, anywhere with real-time, free upgrades. Our online tools help
you turn your plan data into useful information, and help your employees make smart equity compensation decisions.
Our proven solutions can help you meet your fi nancial reporting and Sarbanes-Oxley compliance obligations, reduce plan
administration costs, and realize a higher return on your plan investment.
As a leading equity solutions provider, Fidelity Stock Plan Services provides recordkeeping and administrative services for
over 225 clients, representing over 1.4 million participants, located in more than 150 countries.* For more information on
Fidelity Stock Plan Services, please visit www.Fidelity.com/workplace.
* As of December 31, 2010.
About Radford
For more than 35 years, Radford has provided compensation market intelligence to the technology and life sciences
industries. Global survey databases, which include 4.2 million incumbents, offer current, reliable data to nearly 2,000
clients. Leveraging Radford survey data, our thought-leading global Radford Consulting team creates tailored solutions
for the toughest global business and compensation challenges facing companies at all stages of development. In
addition to our consulting team, we also offer tailored equity award solutions via Radford Valuation Services, with
expertise spanning the design, valuation and fi nancial reporting for equity awards. Radford’s suite of surveys includes the
Global Technology, Sales, and Life Sciences Surveys, as well as the Pre-IPO/Venture-Backed Survey and the US Benefi ts
Survey. For more information on Radford, please visit http://www.radford.com/.

FOR PLAN SPONSOR USE ONLY.
Radford and Fidelity Investments are not affi liated.
Investment and workplace savings plan products and services offered directly to investors and plan sponsors are provided byFidelity Brokerage Services LLC, Member NYSE, SIPC, 900 Salem Street, Smithfi eld, RI 02917.
583810.2.0 1.923339.101 Radford/Fidelity-White-Paper-0811