MINIMISATION OF TORQUE RIPPLE INDUCED ACOUSTIC …60797/Thesis_CDU_60797_Hill_D.pdfMinimisation of...
180
MINIMISATION OF TORQUE RIPPLE-INDUCED ACOUSTIC EMISSIONS IN PERMANENT MAGNET SYNCHRONOUS MOTORS Damien Hill A thesis submitted in part fulfilment of the requirements for the degree of Master of Engineering by research School of Engineering and Information Technology Faculty of Engineering, Health, Science and the Environment Charles Darwin University Darwin 2016
Transcript of MINIMISATION OF TORQUE RIPPLE INDUCED ACOUSTIC …60797/Thesis_CDU_60797_Hill_D.pdfMinimisation of...
MINIMISATION OF TORQUE RIPPLE-INDUCED
ACOUSTIC EMISSIONS IN PERMANENT
MAGNET SYNCHRONOUS MOTORS
Damien Hill
A thesis submitted in part fulfilment of the requirements for the degree of
Master of Engineering by research
School of Engineering and Information Technology
Faculty of Engineering, Health, Science and the Environment
Charles Darwin University
Darwin
2016

Minimisation of torque ripple-induced acoustic emissions from permanent magnet synchronous motors
ii

Minimisation of torque ripple-induced acoustic emissions from permanent magnet synchronous motors
iii
Declaration
I hereby declare that the work herein, now submitted as a thesis for the degree of
Masters by research, is the result of my own investigations, and all references to the
ideas and work of other researchers have been specifically acknowledged. I hereby
certify that the work embodied in this thesis has not already been accepted in
substance for any degree, and is not being currently submitted in candidature for any
other degree.
I give consent to this copy of my thesis, when deposited in the University Library,
being made available for loan and photocopying online via the University’s Open
Access repository eSpace.
Damien Hill

Minimisation of torque ripple-induced acoustic emissions from permanent magnet synchronous motors
iv

Minimisation of torque ripple-induced acoustic emissions from permanent magnet synchronous motors
v
Abstract
Torque ripple exists at the output of permanent magnet synchronous motors
(PMSMs) as a result of current measurement error, non-sinusoidal back-
electromotive force (EMF) and cogging torque. Vibrations caused by torque ripple
are transmitted through the mechanical system and then interact with the motor
housing and cause acoustic emissions. These acoustic emissions limit the
applications available to PMSMs. Since part of the cogging torque component is
based on manufacturing error, motor design alone cannot eliminate all of the torque
ripple. However, torque ripple and hence acoustic emissions can be reduced via
control of the output torque. If an estimate of the torque ripple can be determined,
and its inverse then added to the torque reference used as the input to the motor
controller, the motor will produce a torque to counter the torque ripple generated.
To determine an estimate of the torque ripple and then minimise the acoustic
emissions, this thesis proposes a control method that uses a microphone to sample
the acoustic emissions and then determines the relationship between the measured
emissions and the torque ripple, for a number of orders (position dependant
frequencies) simultaneously. Experimental results show that there is good coherence
between torque ripple and acoustic emissions at the orders associated with torque
ripple. The method was tested using both a high quality microphone and a low cost
electret microphone.
The motor used in this research was a surface magnet or non-salient machine. The
proposed compensation method would work equally well on a salient PMSM as the
compensation signal is applied to the reference torque signal for the motor controller
and is independent of the motors saliency.
The proposed method was shown to be effective in significantly reducing the
acoustic emissions caused by torque ripple, using both the high quality microphone
and the electret microphone. After reduction, the magnitude of the acoustic emissions
was similar to that of the background noise at other frequencies. This represents a
reduction of between 68% to over 99% of the original signal.

Minimisation of torque ripple-induced acoustic emissions from permanent magnet synchronous motors
vi

Minimisation of torque ripple-induced acoustic emissions from permanent magnet synchronous motors
vii
Acknowledgment
I would first like to thank, and acknowledge the help of my supervisors; Friso de
Boer, Greg Heins and Jai Singh. Their help and dedication played a large part in my
journey to bring this work to completion.
I would also like to than Ben Saunders and Mark Thiele for their guidance, support
and for listening to my crazy ideas.

Minimisation of torque ripple-induced acoustic emissions from permanent magnet synchronous motors
viii

Minimisation of torque ripple-induced acoustic emissions from permanent magnet synchronous motors
ix
Contents
1 Introduction ......................................................................................................... 1
Introduction .................................................................................................... 1 1.1
Contributing factors ....................................................................................... 1 1.2
Torque ripple-induced acoustic emissions ..................................................... 2 1.3
Measurement of acoustic emissions............................................................... 2 1.4
Use of current to influence torque ................................................................. 3 1.5
Motor control methods ................................................................................... 3 1.6
Dominant frequencies of permanent magnet synchronous motors ................ 4 1.7
Motor saliency ............................................................................................... 4 1.8
Aim of the research ........................................................................................ 5 1.9
Chapter overview ........................................................................................... 5 1.10
2 Review: Torque control of permanent magnet synchronous motors ............. 7
PMSM structure ............................................................................................. 7 2.1
2.1.1 Motor geometry ...................................................................................... 8
2.1.2 Basic configuration ................................................................................. 8
2.1.3 Multi-pole configuration ....................................................................... 11
2.1.4 Motor configuration .............................................................................. 13
Mathematical model..................................................................................... 16 2.2
2.2.1 Electromagnetic torque ......................................................................... 16
PMSM control .............................................................................................. 20 2.3
2.3.1 Open loop control ................................................................................. 21
2.3.2 Closed loop current control ................................................................... 22
2.3.3 Closed loop current and closed loop position control ........................... 27
2.3.4 Torque control ....................................................................................... 29
Field oriented control ................................................................................... 30 2.4
2.4.1 Current transforms ................................................................................ 31
2.4.2 Current control ...................................................................................... 34
2.4.3 Voltage transform ................................................................................. 35
2.4.4 Phase currents and torque ..................................................................... 35
Summary: Torque control of PMSMs.......................................................... 38 2.5
Minimisation of torque ripple-induced acoustic emissions from permanent magnet synchronous motors
x
3 Review: Sources of torque ripple-induced acoustic emissions in permanent
magnet synchronous motors............................................................................. 39
System block diagram of a PMSM .............................................................. 39 3.1
Additional torque components ..................................................................... 42 3.2
Order based analysis .................................................................................... 43 3.3
Causes of torque ripple ................................................................................ 44 3.4
3.4.1 Torque ripple caused by non-sinusoidal back-EMF ............................. 45
3.4.2 Torque ripple caused by cogging torque ............................................... 45
3.4.3 Torque ripple caused by current measurement error ............................ 49
Combined effects of torque ripple components ........................................... 55 3.5
Effects of operating condition on torque ripple ........................................... 59 3.6
Noise and Vibration Caused by Torque Ripple ........................................... 60 3.7
Chapter summary ......................................................................................... 61 3.8
4 Review: mitigation methods for torque ripple ............................................... 63
Methods used in the reduction of torque ripple ........................................... 63 4.1
Open loop compensation .............................................................................. 65 4.2
Closed loop feedback control ....................................................................... 67 4.3
Adaptive feed forward compensation .......................................................... 69 4.4
Determining the compensation signal .......................................................... 72 4.5
Use of order domain to simplify the system. ............................................... 74 4.6
Chapter summary ......................................................................................... 76 4.7
5 Theory: Proposed methods for determining the compensation system
parameters ......................................................................................................... 77
Approach ...................................................................................................... 77 5.1
Parameter estimation of compensation system – two step approach ........... 79 5.2
Proposed method for parameter estimation of the compensation system .... 81 5.3
5.3.1 Version 1 - multi-step iterative approach .............................................. 81
5.3.2 Version 2 - multi-step iterative approach with forgetting factor .......... 82
Chapter summary ......................................................................................... 83 5.4

Minimisation of torque ripple-induced acoustic emissions from permanent magnet synchronous motors
xi
6 Experimental setup ........................................................................................... 85
Test rig ......................................................................................................... 86 6.1
6.1.1 Motor .................................................................................................... 86
6.1.2 Fan and housing .................................................................................... 86
6.1.3 Additional load ..................................................................................... 87
Sensors ......................................................................................................... 89 6.2
6.2.1 Encoder ................................................................................................. 89
6.2.2 High quality microphone ...................................................................... 89
6.2.3 Electret Microphone ............................................................................. 90
Electronics for control and data acquisition ................................................. 91 6.3
6.3.1 DSP and power board ........................................................................... 91
6.3.2 Current sensing board ........................................................................... 92
6.3.3 Signal interface board ........................................................................... 93
6.3.4 Data acquisition board .......................................................................... 93
Software ....................................................................................................... 94 6.4
6.4.1 LABVIEW – data acquisition ............................................................... 94
6.4.2 MATLAB – data processing and parameter estimation method .......... 95
6.4.1 SIMULINK – motor control ................................................................. 96
Chapter summary ......................................................................................... 97 6.5
7 Experiments ....................................................................................................... 99
Sinusoidal nature of the back-EMF ............................................................. 99 7.1
Measurement of torque ripple and acoustic emissions .............................. 102 7.2
7.2.1 Spectra ................................................................................................ 102
7.2.2 Coherence of signals ........................................................................... 105
7.2.3 Compensating orders and set point ..................................................... 107
7.2.4 Peaks at other orders ........................................................................... 107
Current Controller ...................................................................................... 108 7.3
Linearity of system .................................................................................... 110 7.4
7.4.1 Second order effects ............................................................................ 111
Test of parameter estimation method ......................................................... 114 7.5
7.5.1 Test 1 – Compensation using rotational velocity ................................ 114
7.5.2 Test 2 – Compensation using high quality microphone ..................... 118
7.5.3 Test 3 – Compensation using electret microphone ............................. 121

Minimisation of torque ripple-induced acoustic emissions from permanent magnet synchronous motors
xii
7.5.4 Test 4 – Compensation using electret microphone using forgetting
factor ................................................................................................... 123
7.5.5 Test 5 – Compensation using electret microphone using forgetting
factor at new set point ......................................................................... 126
Comparison of test results .......................................................................... 128 7.6
7.6.1 Comparison of sensor signals ............................................................. 128
7.6.2 Comparison of methods wit and without forgetting factor ................. 130
Chapter summary ....................................................................................... 131 7.7
8 Conclusion ........................................................................................................ 133
9 Recommendations for future research .......................................................... 137
Pre-filtering of the measured signals ......................................................... 137 9.1
Simplification of the method used to determine the coefficients ............... 138 9.2
Higher rotational velocity .......................................................................... 138 9.3
Removal of the encoder signal ................................................................... 139 9.4
Microphone on motor controller ................................................................ 140 9.5
Selective cancellation method .................................................................... 140 9.6

Minimisation of torque ripple-induced acoustic emissions from permanent magnet synchronous motors
xiii
List of figures
Figure 1. Simplified diagram of a PMSM ................................................................... 8
Figure 2. Back-EMF measured phase to phase for: .................................................. 10
Figure 3. 24 slot 20 pole fractional pitch PMSM ...................................................... 12
Figure 4. Rotor (a) and stator (b) of an axial flux motor........................................... 15
Figure 5. Torque over one electrical cycle (a) per phase current and back-EMF (b)
per phase torque (c) electromagnetic torque .............................................................. 19
Figure 6. Schematic of open loop control of a PMSM. ............................................ 20
Figure 7. Closed loop current control ....................................................................... 22
Figure 8. Reduction of torque due to phase current lag of 45˚ electrical .................. 25
Figure 9. Phase current lag of 180˚ electrical ........................................................... 26
Figure 10. Closed loop current and position control ................................................. 27
Figure 11. Torque control of a PMSM ...................................................................... 29
Figure 12. Field oriented control ............................................................................... 33
Figure 13. Generated torque ...................................................................................... 40
Figure 14. Torque output versus position for one mechanical cycle ........................ 43
Figure 15. Spectrum of torque versus order for the first 50 orders ........................... 44
Figure 16. PMSM stator core, phase windings removed .......................................... 46
Figure 17. Model of PMSM including cogging torque. ............................................ 48
Figure 18. The effect of current measurement offset error (one phase winding) on
electromagnetic torque ............................................................................................... 50

Minimisation of torque ripple-induced acoustic emissions from permanent magnet synchronous motors
xiv
Figure 19. The effect of current measurement scaling error (one phase winding) on
electromagnetic torque ............................................................................................... 52
Figure 20. Model of PMSM including torque ripple due to current measurement
error ............................................................................................................................ 54
Figure 21. Order based spectrum of a typical PMSM (first 80 orders) ..................... 56
Figure 22. Revised motor model ............................................................................... 57
Figure 23. Further simplification of FOC and motor model ..................................... 58
Figure 24. Model of FOC and PMSM ....................................................................... 64
Figure 25. Removal of disturbance ........................................................................... 65
Figure 26. Programmed reference current waveform control ................................... 66
Figure 27. Closed loop feedback control .................................................................. 67
Figure 28. Adaptive feed forward cancellation [70] ................................................. 70
Figure 29. Adaptive feed forward compensation for Torque ripple ......................... 70
Figure 30. Position based feed forward compensation of torque ripple.................... 73
Figure 31. Order based closed loop compensation ................................................... 75
Figure 32. Order based closed loop compensation ................................................... 78
Figure 33. Motor installed in fan housing ................................................................. 87
Figure 34. Magnets providing aditional load ............................................................ 88
Figure 35. Electret microphone on breakout board [75] ........................................... 90
Figure 36. DSP and power boards. ............................................................................ 91
Figure 37. LABVIEW program screen capture ........................................................ 95
Figure 38. Per-phase back-EMF for one rotation of the motor ............................... 100

Minimisation of torque ripple-induced acoustic emissions from permanent magnet synchronous motors
xv
Figure 39. Spectra of per-phase back-EMF ............................................................ 101
Figure 40. Spectrum of rotational velocity ............................................................. 103
Figure 41. Spectrum of high quality microphone signal ......................................... 103
Figure 42. Spectrum of electret microphone signal ................................................ 104
Figure 43. Coherence of rotational velocity to high quality microphone signal ..... 105
Figure 44. Coherence of rotational velocity to electret microphone signal ............ 106
Figure 45. Magnitude of current controller ............................................................. 109
Figure 46. Phase of current controller ..................................................................... 109
Figure 47. Linearity of rotational velocity at the 15th
order to current command at
15th
order .................................................................................................................. 111
Figure 48. Linearity of rotational velocity at the 35th
order to current command at
15th
order .................................................................................................................. 112
Figure 49. Comparison of linearity of rotational velocities at the 15th
and 35th
order
to command current at the 15th
order ....................................................................... 113
Figure 50. Rotational velocity spectrum before and after compensation using
rotational velocity as feedback ................................................................................. 115
Figure 51. Magnitudes per step of rotational velocity based compensation ........... 116
Figure 52. High quality microphone spectrum before and after compensation using
rotational velocity as feedback ................................................................................. 117
Figure 53. High quality microphone spectrum before and after compensation using
high quality microphone as feedback ....................................................................... 119
Figure 54. Magnitudes per step of high quality microphone based compensation . 120
Figure 55. Electret microphone spectrum before and after compensation using
electret microphone as feedback .............................................................................. 121

Minimisation of torque ripple-induced acoustic emissions from permanent magnet synchronous motors
xvi
Figure 56. Magnitudes per step of electret microphone based compensation ........ 123
Figure 57. Electret microphone spectrum before and after compensation using
electret microphone as feedback using forgetting factor ......................................... 124
Figure 58. Magnitudes per step of electret microphone based compensation using
forgetting factor ........................................................................................................ 125
Figure 59. Electret microphone spectrum before and after compensation using
electret microphone as feedback using forgetting factor at new set point ............... 127
Figure 60. Percentage of remaining RMS value, of waveform constructed from the
measured high quality microphone signal, after compensation for each of the 3
possible reference signals ......................................................................................... 129
Figure 61. Percentage of remaining RMS value, of waveform constructed from the
measured high quality microphone signal, after compensation using the electret
microphone, with and without forgetting factor. ...................................................... 130

Minimisation of torque ripple-induced acoustic emissions from permanent magnet synchronous motors
xvii
List of tables
Table 1. Reduction in rotational velocity orders ...................................................... 116
Table 2. Reduction of orders in high quality microphone signal when rotational
velocity is used for compensation ............................................................................ 118
Table 3. Reduction of orders using high quality microphone signal for compensation
.................................................................................................................................. 119
Table 4. Reduction of orders using electret microphone signal for compensation .. 121
Table 5. Reduction of orders observed by high quality microphone when using
electret microphone signal for compensation .......................................................... 122
Table 6. Reduction of orders observed by high quality microphone when using
electret microphone signal for compensation, including forgetting factor. ............. 124
Table 7. Reduction of orders using electret microphone signal at the new set point for
compensation including forgetting factor. ............................................................... 127

Minimisation of torque ripple-induced acoustic emissions from permanent magnet synchronous motors
xviii

Minimisation of torque ripple-induced acoustic emissions from permanent magnet synchronous motors
xix
List of symbols
𝜃𝑒 Electrical angle of the motor, in degrees
𝜃𝑚 Mechanical angle of the motor, in degrees
𝜙𝑚 Offset between electrical and mechanical angle, in degrees
𝑝 The pole count of the motor
𝑇 Torque, in newton metres
𝜔𝑚 Mechanical rotational velocity of the motor, radians per second
𝑖𝑥 Current in a given phase, x (A)
𝑒𝑥 Per-phase back-EMF in phase x (V)
𝑇𝑒𝑚 Electromagnetic torque (Nm)
𝒌𝒆,𝒂𝒃𝒄(𝜽)
A 3x1 matrix containing the speed normalised, per-phase back-
EMF for each phase (a, b and c) as a function of position
(V sec rad-1
)
𝐾𝑒 The speed normalised, per-phase back-EMF constant for the
motor (V sec rad-1
)
𝜔𝑒 Electrical rotational velocity of the motor (rad sec-1
)
𝑇𝑒𝑚(𝜃𝑒) Electromagnetic torque as a function of electrical position (Nm)
𝑘𝑒,𝑎(𝜃𝑒) Speed normalised, per-phase back-EMF for phase a, as a function
of electrical position (V)
𝑘𝑒,𝑏(𝜃𝑒) Speed normalised, per-phase back-EMF for phase b, as a function
of electrical position (V)
𝑘𝑒,𝑐(𝜃𝑒) Speed normalised, per-phase back-EMF for phase c, as a function

Minimisation of torque ripple-induced acoustic emissions from permanent magnet synchronous motors
xx
of electrical position (V)
𝑖𝑎(𝜃𝑒) Current in phase a, as a function of electrical position (A)
𝑖𝑏(𝜃𝑒) Current in phase b, as a function of electrical position (A)
𝑖𝑐(𝜃𝑒) Current in phase c, as a function of electrical position (A)
𝐼𝑎 Magnitude of the sinusoidal current in phase a
𝐼𝑏 Magnitude of the sinusoidal current in phase b
𝐼𝑐 Magnitude of the sinusoidal current in phase c
𝒊𝒂𝒃𝒄(𝜽) A 3x1 matrix containing the current in each phase as a function of
position (A)
𝑣𝑎 Voltage at the input of phase a with respect to the star connection
point (V)
𝑣𝑏 Voltage at the input of phase b with respect to the star connection
point, in volts
𝑣𝑐 Voltage at the input of phase c with respect to the star connection
point (V)
𝒗𝒂𝒃𝒄 A 3x1 matrix containing the above three voltages
𝑓𝑒 Electrical frequency of the motor (Hz)
𝑋𝑟𝑒𝑓 A superscript that denotes that variable X is a reference value,
used as input to a controller
𝑋∗ A superscript that denotes that variable X is a command value
𝑋𝑚𝑒𝑎𝑠 A superscript that denotes that variable X is a measured value
𝑋𝑖𝑑𝑒𝑎𝑙 A superscript that denotes that variable X is a theoretically ideal
value

Minimisation of torque ripple-induced acoustic emissions from permanent magnet synchronous motors
xxi
𝑖𝑑 The component of the stator current in the d axis
𝑖𝑞 The component of the stator current in the q axis
𝑖𝛼 The component of the stator current in the 𝛼 axis
𝑖𝛽 The component of the stator current in the 𝛽 axis
𝑣𝛼 The component of the stator voltage in the 𝛼 axis
𝑣𝛽 The component of the stator voltage in the 𝛽 axis
P−1 Inverse Park transform
P Park transform
C−1 Inverse Clark transform
C Clark transform
𝐾𝑇 Motor torque constant, in amps per newton metre
𝑇𝐿 Additional load torque on motor (N)
𝒆𝒂𝒃𝒄 A 3x1 matrix containing the per-phase back-EMF for each phase
(a, b and c) , (V)
𝑇𝑒𝑚𝑖𝑑𝑒𝑎𝑙(𝑖𝑞) The ideal electromagnetic torque as a function of 𝑖𝑞 (Nm)
𝑇𝑒𝑚(𝑖𝑞 , 𝜃) The total electromagnetic torque as a function of 𝑖𝑞 and position
(Nm)
𝑇𝑐𝑜𝑔(𝜃) The cogging torque as a function of position (Nm)
휀𝑥 Current measurement gain for the current in phase x
𝛿𝑥 Current measurement offset for the current in phase x
𝐼𝑥 Instantaneous current in phase x (A)

Minimisation of torque ripple-induced acoustic emissions from permanent magnet synchronous motors
xxii
𝑇𝑒𝑚,𝑎 The electromagnetic torque developed by phase winding a (Nm)
𝑇𝑒𝑚,𝑏 The electromagnetic torque developed by phase winding b (Nm)
𝑇𝑒𝑚,𝑐 The electromagnetic torque developed by phase winding c (Nm)
Δ𝑇𝑒𝑚(𝑖𝑞 , 𝜃) The additional electromagnetic torque component caused by
current measurement error, as a function of 𝑖𝑞 and position (Nm)
𝑇𝑟𝑖𝑝(𝑖𝑞, 𝜃) The torque ripple, as a function of 𝑖𝑞 and position (Nm)
Gem A block representing the electromagnetic component of a PMSM
Gm A block representing the mechanical component of a PMSM
�̂�𝑟𝑖𝑝 An estimate of the torque ripple
𝜃 Rotational position of the motor (degrees)
𝜔 Rotational velocity of the motor (rad sec-1
)
𝑢(𝜃) The derived compensation signal as a function of position
𝑦(𝜃) The measured value as a function of position
P A block representing the system that couples torque ripple to a
measured value
ℎ A variable to denote the order
𝑇𝑒𝑚𝑖𝑑𝑒𝑎𝑙(ℎ) The ideal electromagnetic torque as a function of order
Gem(ℎ) The order response of Gem
𝑇𝑟𝑒𝑓(ℎ) The reference torque as a function of order
𝑈(ℎ) The derived compensation signal as a function of order
𝑌(ℎ) The measured value as a function of order

Minimisation of torque ripple-induced acoustic emissions from permanent magnet synchronous motors
xxiii
𝑃(ℎ) The order response of P
𝛾2(ℎ) Coherence
𝐺𝐴𝐵(ℎ) Cross spectrum
𝐺𝐴𝐴(ℎ) Input auto spectrum
𝐺𝐵𝐵(ℎ) Input auto spectrum

Minimisation of torque ripple-induced acoustic emissions from permanent magnet synchronous motors
xxiv

Minimisation of torque ripple-induced acoustic emissions from permanent magnet synchronous motors
xxv
Acronyms
HVAC Heating, ventilation and air-conditioning
CNC Computerised numerical control
AC Alternating current
DC Direct current
EMF Electromotive force
FFT Fast Fourier transform
PMSM Permanent magnet synchronous motor
DSP Digital signal processor
RPS Revolutions per second
dB Decibel
RMS Root mean square


Minimisation of torque ripple-induced acoustic emissions from permanent magnet synchronous motors
1
1 Introduction
Introduction 1.1
Rotating permanent magnet synchronous motors (PMSMs) are increasingly finding
applications in industry and consumer applications as they offer benefits over other
types of motors, particularly induction motors. These benefits include high
efficiency, a high energy density and reliability.
Ideally, rotating PMSMs should provide smooth torque output over a range of
speeds. In reality, harmonic fluctuations caused by various design, manufacturing
and control factors significantly affect the output torque. These fluctuations are
referred to as torque ripple [1]. While torque ripple does not affect the operation of
PMSMs for some applications, in others it can cause undesirable acoustic emissions
(audible noise), vibration and speed fluctuations.
Contributing factors 1.2
There are three main factors contributing to torque ripple in a PMSM: cogging
torque, non-sinusoidal back-EMF and sensor inaccuracy [1-5].
Two approaches can be used to reduce the effect of torque ripple in a PMSM:
1) Improvements can be made in the design, better components can be selected
and better manufacturing processes can be used [6, 7].
2) The motor controller can be used to reduce torque ripple [5].
Approach 1 has been studied elsewhere [6-10] and was found to be effective in
minimising torque ripple. The approach, however is shown to be expensive and
potentially unachievable for mass production (cost and tolerance issues being the key
hurdles faced). Approach 2 could be achieved using modern, readily available,

Minimisation of torque ripple-induced acoustic emissions from permanent magnet synchronous motors
2
inexpensive processors and power electronics. This approach is more likely suitable
for mass production as compensation can be based on the characteristics of an
individual motor if desired. As such, approach 2 will be the focus of this thesis and
approach 1 will not be considered.
Torque ripple-induced acoustic emissions 1.3
One of the major reasons that torque ripple in PMSMs is undesirable is that it results
in acoustic emissions [11]. The vibrations caused by the torque ripple excite different
parts of the motor, which can produce audible noise. Acoustic emissions are often
detrimental for applications of these motors, such as air-handling fans, where this
noise would be distracting or annoying.
This thesis investigates the possibility of using the acoustic emissions generated by a
rotating PMSM to reduce the cogging torque that causes them. Like active noise
control, this method will use only measured data and will not depend on the
predetermined structure of a physical model or its parameters.
Measurement of acoustic emissions 1.4
Microphones are commonly used to measure undesirable acoustic emissions as they
are made for the audible range of frequencies. Ideally, the microphone should be
placed at the point of origin of the acoustic emissions so that there is no time delay
for which the controller would later need to compensate. This is however not
possible due to physical constraints; the sensor cannot be placed inside the motor. In
practice, the microphone must therefore be placed some distance away from the
source of the noise, which will introduce a time delay between the source and the
sensor signal.
The acoustic emissions from a PMSM are repetitive, hence information recorded
based on acoustic emissions from one rotation of the motor can be used to reduce
acoustic emissions generated by successive rotations using active noise control

Minimisation of torque ripple-induced acoustic emissions from permanent magnet synchronous motors
3
methods. The time delay will cause a phase difference in the frequencies observed
between the noise being produced by the motor and the signal recorded by the
microphone. This phase difference will be different for each frequency as it is a
function of the wavelength and the distance of the microphone from the noise source;
this however can be easily modelled.
Use of current to influence torque 1.5
To reduce the cogging torque of the PMSM, the control scheme will need to be able
to adjust the output torque of the motor. Current waveform control is widely used to
control the output torque of PMSMs because of the relatively straight forward
relationship between current and torque [4]. To use the current to reduce acoustic
emissions, the relationship between current and acoustic emissions – in particular at
the dominant orders in the audible range we wish to reduce – needs to be known.
Motor control methods 1.6
Some methods described in the literature to control PMSMs and reduce torque ripple
make use of pre-programed reference current control [12-14]. Accurate information
about the PMSM parameters is necessary for these methods to be successful and
small errors or variations in these parameters can produce higher torque ripple due to
the open loop nature of this control method [5, 15].
As an alternative to such methods, closed loop controllers with online parameter
estimation and adaptive control algorithms can be used. Various methods used
include repetitive control techniques [16-18], iterative learning control [19, 20] and
active noise control [21, 22].
Such methods can take advantage of the periodic nature of the system. Information
required for parameter determination can be collected over one or several rotations of
the motor. An encoder, attached to the motor for use with the primary controller,
allows measurements to be taken based on motor position. Processing of the data and

Minimisation of torque ripple-induced acoustic emissions from permanent magnet synchronous motors
4
development of compensation values can then take place during further rotations of
the motor. Compensation can then be applied, synchronised with the position of the
motor, and the motor allowed to continue through a number of revolutions such that
the effect of the current compensation estimate stabilises before the process starts
again.
Dominant frequencies of permanent magnet 1.7
synchronous motors
A motor control scheme designed to reduce torque ripple does not need to cover a
wide range of frequencies. There are certain dominant orders in the torque ripple and
subsequent acoustic emissions of a PMSM [5, 23] that are of particular interest.
Determining parameters and developing compensation for only these orders further
simplifies the development of such methods.
Motor saliency 1.8
The motor used in this research can be characterised as non-salient [7, 24], the
magnets on the rotor sit on the surface of the rotor’s steel plate and are not embedded
in it. This configuration is known as surface mount magnets [25].
The compensation method proposed in later chapters would work equally well on a
salient PMSM, such as an embedded magnet machine, as the compensation signal is
applied to the reference torque signal for the motor controller. While the controller
configuration may differ for the two types of motors, the compensation method is
independent of the motors saliency.

Minimisation of torque ripple-induced acoustic emissions from permanent magnet synchronous motors
5
Aim of the research 1.9
The aim of this research is to develop a method of reducing the acoustic emissions of
a PMSM caused by torque ripple. The method will take advantage of the periodic
nature of the system as well as the need to compensate only for specific orders of the
torque ripple.
Chapter overview 1.10
Chapter 2 provides a brief review of PMSMs, their applications, and operation. It
outlines the approach used to provide closed loop control of output torque for the
motor and concludes with an ideal representation of torque controller that does not
take into account torque ripple.
In Chapter 3, a model of a PMSM is introduced and then used to discuss the various
interactions that result in the development of electromagnetic torque as well as
torque ripple. Sources of torque ripple are discussed and it is shown that torque ripple
can mechanically couple through the motor and, under certain circumstances, cause
acoustic emissions.
In Chapter 4, methods for reduction of the torque ripple that causes these acoustic
emissions are discussed. The discussion focuses on control based approaches. It is
shown that many of these control methods can be summarised by the following
approach: the addition of sinusoids at set frequencies to the input in order to cancel
sinusoids at the same frequencies in the output.
In Chapter 5, a proposed novel method for determining the required parameters of
the cancellation signal is discussed. Starting with the adaptive approach detailed in
Chapter 4, it is shown that reduction of the acoustic emissions produced by the
torque ripple can be achieved by first characterising the system through which the
torque ripple propagates.
Chapter 6 describes the experimental setup used to test the method from the previous
chapter.

Minimisation of torque ripple-induced acoustic emissions from permanent magnet synchronous motors
6
In Chapter 7, various experiments are described and the results discussed. The
experiments first check that assumptions made in earlier chapters about the operation
of the controller and the effect of torque ripple on the acoustic emissions are correct.
Later, experiments that test the proposed cancellation method are discussed.
Chapter 8, the conclusion, is a summary of the major findings produced in Chapter 7
Chapter 9 is a discussion of proposed future work to extend the findings of this
thesis.

Minimisation of torque ripple-induced acoustic emissions from permanent magnet synchronous motors
7
2 Review: Torque control of permanent
magnet synchronous motors
To understand the causes of torque ripple it is necessary to be familiar with the
operation of permanent magnet synchronous motors (PMSMs). In this chapter, the
theory behind PMSM operation, under what may be deemed ideal conditions, will be
discussed. In subsequent chapters, causes of torque ripple will be discussed along
with the associated production of acoustic emissions.
This chapter will be presented in three sections: PMSM structure, PMSM
mathematical model and PMSM control.
PMSM structure 2.1
PMSMs are increasingly used in industrial applications as they offer a number of
advantages over more commonly used asynchronous alternating current (AC)
induction motors [26]. These advantages include high efficiencies and high power
densities combined with the ability to vary motor velocity while maintaining high
efficiency.
Applications of PMSMs include, for example, small- and large-scale air-handling
fans for heating, ventilation, and air-conditioning (HVAC) applications, and pool
pump motors. PMSMs are also finding increased use as servo-motors in industrial
robots and computerised numerical control (CNC) machines [27]. In these
applications, the strong magnets and adaptable control of these motors offer
advantages over conventional brushed direct current (DC) motors and stepper motors
[28].
The use of strong permanent magnets on the stator means that less electrical power
needs to be supplied to the motor to achieve a given mechanical power output.
Having a rotor that does not incorporate electrical windings eliminates copper losses

Minimisation of torque ripple-induced acoustic emissions from permanent magnet synchronous motors
8
in the rotor making the motor more efficient. By removing the need to apply power
to the rotor through either a commutator/brush arrangement or slip rings another
source of electrical loss is eliminated along with the associated maintenance
requirement of these components [29].
2.1.1 Motor geometry
PMSMs are composed of permanent magnets that move past stationary current
carrying conductors. In the case of rotating PMSMs, the magnets are attached to the
rotor and the conductors are situated in the stator.
2.1.2 Basic configuration
Figure 1 shows the basic construction of a PMSM.
Figure 1. Simplified diagram of a PMSM
Three coils, or phase windings (A, B, and C) are shown in the stator in the above
image. Each phase winding has been marked to show the direction in which the

Minimisation of torque ripple-induced acoustic emissions from permanent magnet synchronous motors
9
copper has been coiled. The dot represents the current in the copper that is coming
out of the page while the cross means that the current is going into the page. Each
phase winding is embedded in two slots in the stator. In the above figure, a PMSM
with three electrical phases is shown. While PMSMs can be constructed with more
than three electrical phases [30, 31], the control methods and issues of torque ripple
remain and only three phase PMSMs will be discussed in this thesis.
As the voltage supplied to these electromagnets is varied, an alternating current will
flow through the conductors and a magnetic field is induced. By controlling the
current in each of the windings, the interaction of the magnetic fields from each
phase winding can be such that a rotating magnetic field is created within the PMSM.
The induced magnetic field interacts with that of the permanent magnets on the rotor,
creating torque. The rotor will begin to turn so that the magnetic field of the
permanent magnets aligns as much as is possible with the stator’s rotating magnetic
field.
As the motor rotates, magnetic flux from the moving magnets on the rotor interacts
with the stationary coils or phase windings on the stator. A voltage is induced in each
phase winding as the magnets pair move past it. This induced voltage is referred to as
the back electromotive force (or back-EMF). The magnets on the rotor of a PMSM,
and the coils on the stator, are configured such that the per-phase back-EMF is
sinusoidal [25]. This differs from brushless DC (BLDC) motors which have a per-
phase back-EMF that is trapezoidal but is otherwise similar in design to a PMSM
[25].
Figure 2 below, is an illustration of the shape of the phase-to-phase back-EMF for
these two different classifications of motors for one complete mechanical revolution.
Part (a) shows the shape of the phase-to-phase back-EMF for a typical BLDC motor,
which is characteristically trapezoidal. Part (b) shows that the shape of the phase-to-
phase back-EMF for a typical PMSM that is sinusoidal. The difference in shape of
the back-EMF for the two types of motors is due to the design of the motors and the
way in which the magnetic flux of the permanent magnets interacts with the stator
coils [25].

Minimisation of torque ripple-induced acoustic emissions from permanent magnet synchronous motors
10
Figure 2. Back-EMF measured phase to phase for:
(a) a typical BLDC motor (b) a typical PMSM.

Minimisation of torque ripple-induced acoustic emissions from permanent magnet synchronous motors
11
2.1.3 Multi-pole configuration
Figure 1 is a simplified diagram of a PMSM showing only a single magnet on the
rotor and one set of three phase windings on the stator. In practice, PMSMs are
constructed with a number of magnet pairs, also known as pole pairs on the rotor.
The three phases that make up the stator are also repeated a number of times around
the stator. In such multi-pole machines, the alternating current in each phase winding
must complete a full cycle for each magnet pair on the rotor for the motor to
complete one full mechanical cycle. The mechanical position of the motor at any
given time can be represented by the mechanical angle, 𝜃𝑚, while its position in the
electrical cycle is given by the electrical angle, 𝜃𝑒. The relationship between these
two angles can be written as:
𝜃𝑒 =𝑝
2𝜃𝑚 2-1
where p is the number of poles of the machine.
A schematic illustration of a multi-pole PMSM is shown in Figure 3.

Minimisation of torque ripple-induced acoustic emissions from permanent magnet synchronous motors
12
Figure 3. 24 slot 20 pole fractional pitch PMSM
In the configuration shown above in Figure 3, the three sets of phase windings have
been repeated four times around the stator, and are embedded in 24 separate slots. A
total of 10 magnet pairs (20 poles) make up the rotor of this multi-pole machine. The
labels on each magnet designate the pole of that magnet that is facing outwards,
towards the stator. This particular configuration of poles and slots , where the
number of poles divided by the number of slots is a fraction, rather than an integer, is
known as fractional pitch topology. This topology is used over conventional integer
pitch topology (where the number of poles divided by the number of slots results in
an integer) as it has been shown to reduce torque ripple [1, 32, 33]. Advantages of
this structure include a reduction in cogging torque (discussed later in chapter 3) and
are detailed in [34-36].

Minimisation of torque ripple-induced acoustic emissions from permanent magnet synchronous motors
13
Due to the configuration of the magnets on the rotor, it is necessary to reverse the
direction of every second winding for each phase around the stator. For example, the
polarity of the magnet nearest to the phase A winding in the twelve o’clock position
is the opposite to that of the same phase winding at the 3 o’clock position. As a
consequence, the direction of these two windings needs to be mutually opposed to
create the correct magnetic field to move the rotor. This is illustrated by the dot and
cross notations in Figure 3. The phase windings are wrapped around alternate stator
teeth, with an unwrapped tooth between each. This type winding is known as single
layer, or non-overlapping alternate teeth winding [37].
2.1.4 Motor configuration
PMSMs can be structured a number of different ways. One distinction between the
various structures is their flux orientations; radial flux or axial flux [7, 38-40]. Radial
flux motors consist of a cylindrical rotor which fits inside a cylindrical stator, the
lines of magnetic flux from both the permanent magnets and the electromagnets are
oriented in a radial direction. Most PMSMs are of radial flux type, largely due to the
ease of manufacture [7]. Figure 1 and Figure 3 are both examples of radial flux
machines. In axial flux motors, both the rotor and stator are constructed as discs.
These discs are located concentrically with a small gap in between and the direction
of the flux lines is in the axial direction. The advantages of an axial flux design over
the more traditional radial flux type are described in [38]. These include:
Volumetric advantages, axial flux PMSMs can be smaller than those with
radial flux geometries for the same output power.
Mass and cost advantages, axial flux PMSMs require less electrical steel in
their construction.
A larger effective torque arm, compared with a radial flux motor with the
same outer radius.
The flat back of the stator allows easy mounting to ensure good heat paths for
cooling.

Minimisation of torque ripple-induced acoustic emissions from permanent magnet synchronous motors
14
Regardless of the type of motor, groups of electromagnets on the stator are connected
together to form a phase winding. Nominally, three such phase windings make up a
PMSM with electromagnets from each phase occurring one after the other on the
stator. The rotor similarly consists of magnets, placed so that alternating poles
provide magnetic flux in the desired direction. Figure 4 shows the stator (a) and the
rotor (b) of the motor, an axial flux PMSM, as used in this research.
The motor shown below in Figure 4 has 10 pole pairs on the rotor and four sets of
phase windings in 24 separate slots on the stator. The magnets on the rotor sit on the
surface of the rotor’s steel plate and are not embedded in it. This configuration is
known as surface mount magnets [25] and means that the motor can be characterised
as non-salient [7, 24], which simplifies its analysis as described later in this section.

Minimisation of torque ripple-induced acoustic emissions from permanent magnet synchronous motors
15
(a)
(b)
Figure 4. Rotor (a) and stator (b) of an axial flux motor.

Minimisation of torque ripple-induced acoustic emissions from permanent magnet synchronous motors
16
Mathematical model 2.2
2.2.1 Electromagnetic torque
For any machine, the power input balances the power output plus the inevitable
losses. For the case of a PMSM, the power input can be considered as the electrical
power supplied to the motor (a function of current and voltage), and the power output
as the mechanical power delivered at the rotor of the motor, which is a function of
the torque produced by the rotor and its rotational velocity. In [41] the authors
demonstrate that the output power of a PMSM is a function of the phase currents and
induced back-EMF in each phase. They start by considering the following three
facts:
i. The Lorentz force equation states that the instantaneous torque produced
by a particular winding is proportional to the magnetic field and the
phase current;
ii. Maxwell’s equation states that the voltage, or back-EMF, induced in a
phase winding is proportional to the magnetic field and the velocity ω of
the machine; and
iii. The total instantaneous torque developed by the machine is the sum of the
torques produced by all phases.
The product of the total instantaneous torque, 𝑇 (Nm), and the mechanical rotational
velocity, 𝜔𝑚 (rad sec-1
), can therefore be expressed, for a three phase system, in
terms of the current in each phase, 𝑖𝑥 (A), and the back-EMFs 𝑒𝑥 (V) as:
𝑇𝜔𝑚 = ∑ 𝑒𝑥𝑖𝑥𝑥=𝑎,𝑏,𝑐
2-2
To differentiate this torque, created by the electromagnetic interactions between the
permanent magnets and the stator coils, from other torques effecting the motor, it can
be referred to as the electromagnetic torque, 𝑇𝑒𝑚. Equation 2-2 can be rewritten as:
𝑇𝑒𝑚 =𝑒𝑎𝜔𝑚
𝑖𝑎 +𝑒𝑏𝜔𝑚
𝑖𝑏 +𝑒𝑐𝜔𝑚
𝑖𝑐 2-3

Minimisation of torque ripple-induced acoustic emissions from permanent magnet synchronous motors
17
In other words, the electromagnetic torque produced by the motor is the sum of the
currents in each phase multiplied by a so called speed-normalised value of the back-
EMF for that phase. At this stage of the analysis of electromagnetic torque, torque
ripple will not be considered. The addition of torque ripple to the electromagnetic
torque will be discussed further in chapter 3.
The magnitude of the back-EMF developed in each phase is proportional to the
rotational velocity of the motor and a number of physical properties of the motor
such as the number of turns in each phase winding, the magnetic flux density of the
permanent magnets and the size of the air gap between the stator and the rotor
magnets. The magnitude of the speed-normalised back-EMF for a given motor is a
constant, which is dependent on these various physical characteristics. As stated
previously, the back-EMF induced in each phase winding for a PMSM is assumed to
be sinusoidal in shape and can be derived in terms of electrical position 𝜃𝑒 as:
𝒌𝒆,𝒂𝒃𝒄(𝜽𝒆) = [
−𝐾𝑒sin (𝜃𝑒)−𝐾𝑒sin (𝜃𝑒 − 120°)−𝐾𝑒sin (𝜃𝑒 + 120°)
] 2-4
For the equation above, 𝐾𝑒 is the speed-normalised back-EMF constant and is equal
to the magnitude of the back-EMF once it has been normalised by the electrical
rotational velocity of the motor, 𝜔𝑒 where:
𝜔𝑒 =𝑝
2𝜔𝑚 2-5
In the above equation 𝑝 is the number of poles (or magnets) of the PMSM rotor and
𝜔𝑚 is the mechanical rotational velocity of the motor in radians per second.
Since the back-EMF is sinusoidal, for a non-salient motor such as the one used in
this research, maximum torque is achieved if the current in its stator coil is also a
sinusoid of the same frequency and phase as the back-EMF being induced in that coil
[24]. For salient motors, additional magnetic interactions with the steel surrounding
the embedded magnets influence the derivation of the electromagnetic torque and the
optimal phase difference between the back-EMF and stator currents for maximum
torque may therefore be something other than zero.

Minimisation of torque ripple-induced acoustic emissions from permanent magnet synchronous motors
18
The current in each phase can be expressed as:
𝒊𝒂𝒃𝒄(𝜽𝒆) = [
Iasin (𝜃𝑒 + 𝜙)Ibsin (𝜃𝑒 − 120° + 𝜙)Icsin (𝜃𝑒 + 120° + 𝜙)
] 2-6
Where 𝐼𝑥 is the magnitude of the current in a given phase 𝑥 . The formula for
electromagnetic torque, 𝑇𝑒𝑚, can now be re written as:
𝑇𝑒𝑚(𝜃𝑒) = 𝑘𝑒,𝑎(𝜃𝑒)𝑖𝑎(𝜃𝑒) + 𝑘𝑒,𝑏(𝜃𝑒)𝑖𝑏(𝜃𝑒)
+ 𝑘𝑒,𝑐(𝜃𝑒)𝑖𝑐(𝜃𝑒) 2-7
Figure 5 is an illustration of how the electromagnetic torque is developed over one
complete electrical cycle for a non-salient motor. Figure 5(a) shows the current and
back-EMF for each phase. In this figure, the current is assumed to be controlled to be
a perfect sinusoid that is of the same frequency, and in phase with the back-EMF.
The magnitudes assigned to the phase current and back-EMF waveforms are shown
merely as examples and do not necessarily reflect actual values. Figure 5(b) shows
the torque developed by each phase, which is a product of the current in a phase
winding and the corresponding back-EMF waveform for that winding. Figure 5(c)
shows the total or electromagnetic torque developed by the motor: this is the sum of
the three waveforms shown in Figure 5(b).

Minimisation of torque ripple-induced acoustic emissions from permanent magnet synchronous motors
19
Figure 5. Torque over one electrical cycle (a) per phase current and back-EMF
(b) per phase torque (c) electromagnetic torque

Minimisation of torque ripple-induced acoustic emissions from permanent magnet synchronous motors
20
PMSM control 2.3
Figure 6 shows schematic of the open loop controller, power switching electronics
and electrical coils, or phase windings, of the motor.
Figure 6. Schematic of open loop control of a PMSM.
The three phases of the PMSM stator (a, b, and c) are connected to the power
switching electronics, which control the order and polarity with which each phase is
connected to a DC voltage bus (V bus). The switching devices (Q1 through to Q6)
can be transistors, field effect transistors (FETs), insulated gate bipolar transistors
(IGBTs) or other similar devices. The choice of devices is usually determined by the
voltage and current expected in each phase. A capacitor bank (C1) is added to the DC
voltage bus to reduce current ripple from the power supply.
To achieve the desired phase voltages ( 𝑣𝑎 , 𝑣𝑏 , and 𝑣𝑐 ), the power switching
electronics are often controlled using pulse width modulation (PWM). A signal of the
desired shape is sent from the digital signal processor (DSP) to the PWM module and
a square wave of a set frequency, but of varying duty cycle is then sent to each of the
six switching devices. The PWM signals needs to be of a much higher than that of
Minimisation of torque ripple-induced acoustic emissions from permanent magnet synchronous motors
21
the signal sent from the DSP to produce a smooth current signal in each phase
winding. As the voltage across each phase is varied, the filtering effect of the
inductors that make up the stator coils smooths the signal to one matching the
original signal generated by the DSP.
2.3.1 Open loop control
A PMSM can be operated using an open loop control system, such as that shown in
Figure 6. If the DSP sends a signal to the PWM to generate a sinusoidal current in
each stator coil, with a phase difference of 120° electrically per phase, the resulting
rotating magnetic field will cause the rotor to turn. PMSMs are, as their name
suggests, synchronous motors. As the permanent magnets on the rotor must maintain
their alignment with the rotating magnetic field of the stator, the rotor must have the
same rotational velocity as the magnetic field of the stator. If the permanent magnets
lose synchronicity with the stator’s magnetic field, the motor will not operate as
intended [42].
For open loop control, provided that the frequency of the rotating magnetic field is
low enough to begin with, the rotor and magnetic field will be synchronous. The
frequency of rotation can be increased as long as the current in each phase is high
enough to produce sufficient torque for the rotor to overcome static and dynamic
friction, inertial loads, and any imposed loads. If the frequency is increased too
rapidly for the conditions, or the current is insufficient, the rotor will lose
synchronisation and the motor will not operate as desired.
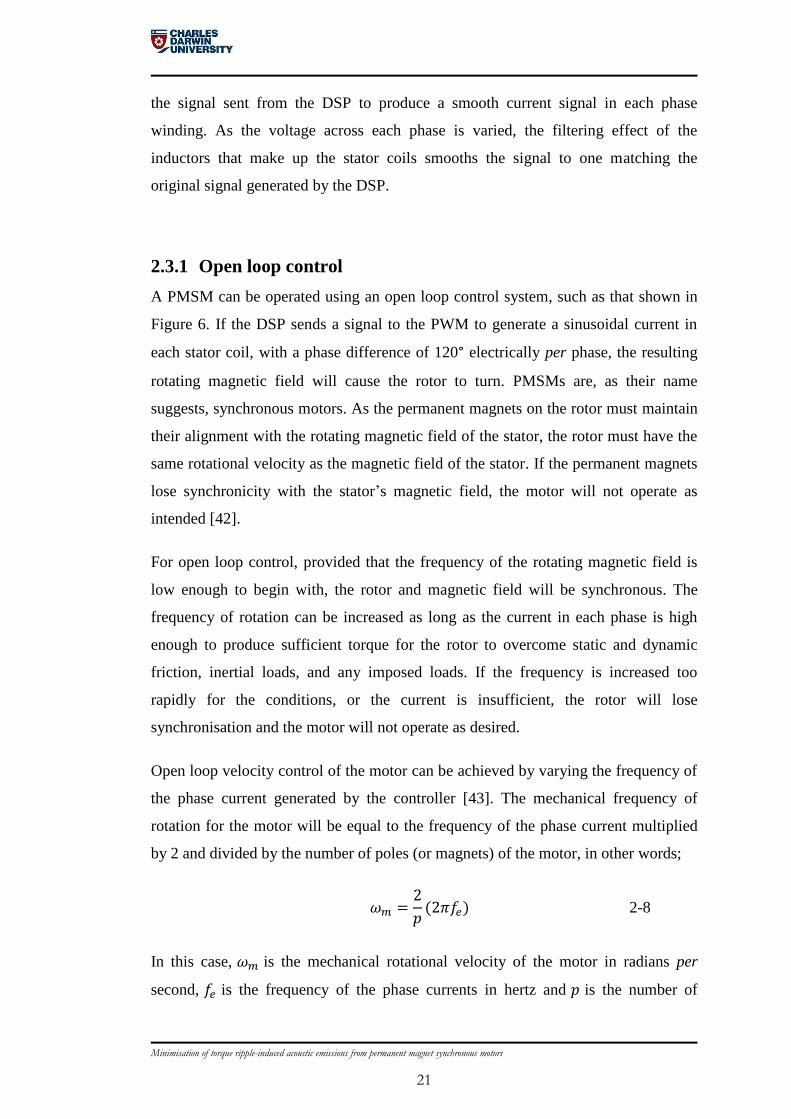
Open loop velocity control of the motor can be achieved by varying the frequency of
the phase current generated by the controller [43]. The mechanical frequency of
rotation for the motor will be equal to the frequency of the phase current multiplied
by 2 and divided by the number of poles (or magnets) of the motor, in other words;
𝜔𝑚 =
2
𝑝(2𝜋𝑓𝑒) 2-8
In this case, 𝜔𝑚 is the mechanical rotational velocity of the motor in radians per
second, 𝑓𝑒 is the frequency of the phase currents in hertz and 𝑝 is the number of

Minimisation of torque ripple-induced acoustic emissions from permanent magnet synchronous motors
22
poles. Again, the magnitude of the phase currents must be kept sufficiently high for
the torque produced to overcome all friction and imposed loads or the motor will lose
synchronisation and fail to work correctly.
2.3.2 Closed loop current control
While open loop control may be sufficient for many applications, better control of a
PMSM, including control of the output torque, can be achieved using closed loop
control. One method of closed loop control is current control. It can be implemented
as shown in Figure 7 below.
Figure 7. Closed loop current control
Figure 7 is similar to Figure 6 with the addition of a reference current, 𝑖𝑟𝑒𝑓, which
becomes an input to the controller, and current sensors on phases A and B. For
simplicity, the controller and the power switching electronics have been drawn as
blocks. The output of the controller is three pairs of PWM signals which act as inputs
to the power switching block. The output of the power switching block are the three
phase voltages, 𝑣𝑎, 𝑣𝑏, and 𝑣𝑐, which cause current to flow in the three phases of the
motor’s stator windings. Two current sensors, represented in Figure 7 as a loop
around the wires leading to phase A and B of the motor, provide the measured values

Minimisation of torque ripple-induced acoustic emissions from permanent magnet synchronous motors
23
of these two phase currents, 𝑖𝑎 𝑚𝑒𝑎𝑠 and 𝑖𝑏
𝑚𝑒𝑎𝑠 as feedback to the controller. As these
phase windings are star connected, Kirchhoff’s current law (KCL) can be used at the
point of connection to determine the current in the third phase as the sum of all
currents into a node is zero;
𝑖𝑎 + 𝑖𝑏 + 𝑖𝑐 = 0
or 𝑖𝑐 = −(𝑖𝑎 + 𝑖𝑏) 2-9
The output of two current sensors, at any given time, are all that are required to
control this motor as the system would be over constrained if simultaneous control of
all three phases was attempted. For the closed loop current controller, shown in
Figure 7, the reference current, 𝑖𝑟𝑒𝑓, could be either of the following;
a constant representing a magnitude
a single sinusoid (that could be used by the controller to generate three
sinusoids offset by 120°)
three sinusoids, each a reference for a different phase current
The current controller actively adjusts the PWM signals going to the power
switching electronics such that the phase voltages cause the desired currents to flow
in phase a and phase b of the motor. Under these conditions, the measured currents,
𝑖𝑎𝑏𝑐𝑚𝑒𝑎𝑠 , should match the desired characteristic of the reference current, 𝐼𝑟𝑒𝑓 . This
type of control is often referred to as ideal current control.
In the case where 𝑖𝑟𝑒𝑓 is a constant, the controller would still need to generate the
frequency for the three sinusoidal voltage signals required to create the desired phase
currents, hence only open loop velocity control could be achieved. If the reference
current, 𝑖𝑟𝑒𝑓 , is sinusoidal, the phase currents are controlled to match the
instantaneous magnitude of the reference sinusoids. As long as the bandwidth of the
current controller is sufficiently high, the rotational velocity of the motor can be
controlled by varying the frequency of a sinusoidal reference current.
One disadvantage of using current feedback alone is that the closed loop controller
does not necessarily produce a phase current that is in phase with the back-EMF. A

Minimisation of torque ripple-induced acoustic emissions from permanent magnet synchronous motors
24
lower output torque will be produced if the phase currents, and corresponding back-
EMFs, are not in phase compared to that produced when they are in phase as shown
below in Figure 8. As can be seen in the figure, the electromagnetic torque developed
by the motor is reduced if the phase currents and back-EMF are not in phase. In
Figure 8(a) the magnitude of both the back-EMF and phase currents are the same as
in Figure 5, however the phase currents lag the back-EMF for each phase by 45°
electrical. As a result the electromagnetic torque developed by each phase, shown in
Figure 8(b) is offset such that it is, at times, negative, meaning that torque is being
developed at that point acts in the direction opposite to that of the rotation of the
motor. The total electromagnetic torque developed shown in Figure 8(c) is therefore
reduced compared to that shown in part Figure 5(c) where both phase currents and
their respective back-EMFs are in phase with each other.

Minimisation of torque ripple-induced acoustic emissions from permanent magnet synchronous motors
25
Figure 8. Reduction of torque due to phase current lag of 45˚ electrical
Further increasing the phase difference will decrease the total torque produced even
further until it reduces to zero when the phase difference is 90° electrical: it then
becomes negative for any greater phase difference. Figure 9 shows waveforms for
the back-EMF and phase currents with the same magnitude as Figure 5 but now with
the phase current lagging by 180° electrical.

Minimisation of torque ripple-induced acoustic emissions from permanent magnet synchronous motors
26
Figure 9. Phase current lag of 180˚ electrical
The electromagnetic torque developed per phase is now offset to the point where it is
always negative, see Figure 9(b), resulting in a total electromagnetic torque
developed, see Figure 9(c), is the same magnitude as that in Figure 5(c) but negative.

Minimisation of torque ripple-induced acoustic emissions from permanent magnet synchronous motors
27
In both cases, although the magnitude of the phase currents is unchanged, the amount
of electromagnetic torque produced by the motor is reduced, or even reversed,
because of a phase difference between each of the phase currents and their
corresponding per phase back-EMF.
2.3.3 Closed loop current and closed loop position control
To ensure that the phase currents of a PMSM are always aligned with the relevant
back-EMF, additional feedback is required [43]. As shown in Figure 10, a rotary
encoder can be added to provide the controller with a measurement of the mechanical
position of the motor, 𝜃𝑚𝑚𝑒𝑎𝑠 . The velocity, 𝜔𝑚, may also be calculated from this
measurement.
Figure 10. Closed loop current and position control
The shape and phase of the back-EMF, relative to the position of the motor must be
determined before using the closed loop controller. This enables the controller to
produce currents in each phase of the stator windings to match the back-EMF, as
long as the frequencies required are within the bandwidth of the current controller.
To determine the characteristics of the back-EMF, the motor can be rotated by an
Minimisation of torque ripple-induced acoustic emissions from permanent magnet synchronous motors
28
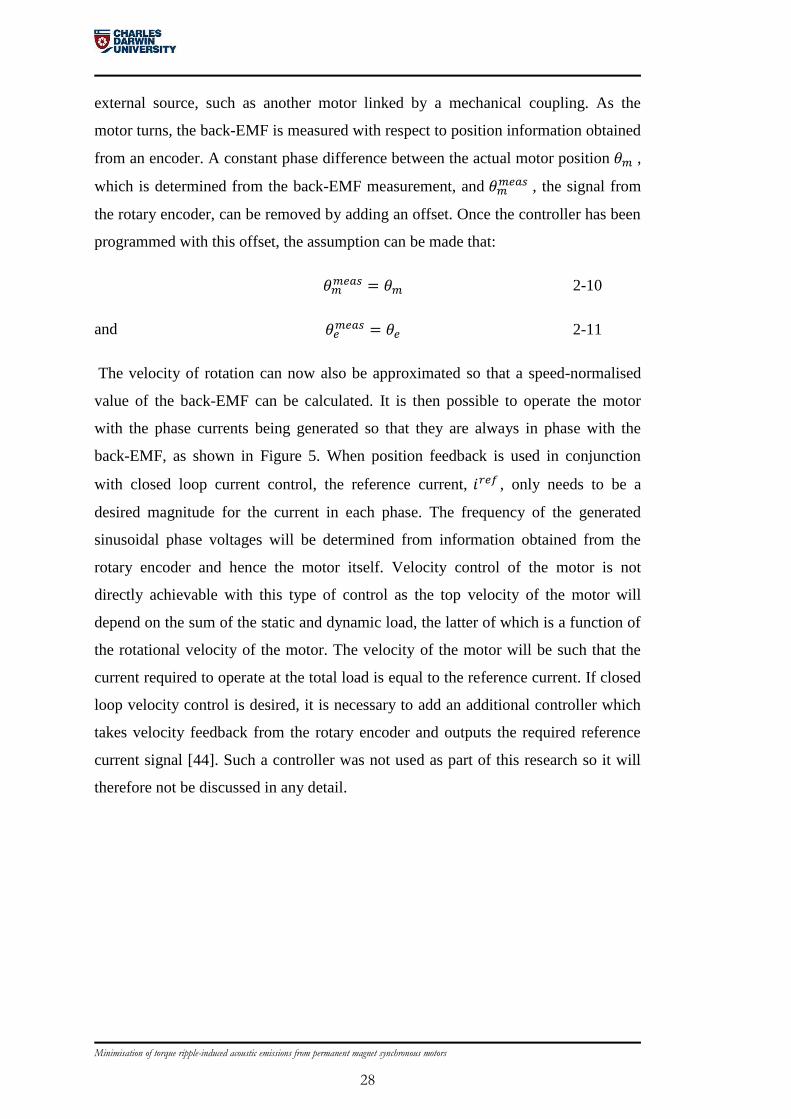
external source, such as another motor linked by a mechanical coupling. As the
motor turns, the back-EMF is measured with respect to position information obtained
from an encoder. A constant phase difference between the actual motor position 𝜃𝑚 ,
which is determined from the back-EMF measurement, and 𝜃𝑚𝑚𝑒𝑎𝑠 , the signal from
the rotary encoder, can be removed by adding an offset. Once the controller has been
programmed with this offset, the assumption can be made that:
𝜃𝑚𝑚𝑒𝑎𝑠 = 𝜃𝑚 2-10
and 𝜃𝑒𝑚𝑒𝑎𝑠 = 𝜃𝑒 2-11
The velocity of rotation can now also be approximated so that a speed-normalised
value of the back-EMF can be calculated. It is then possible to operate the motor
with the phase currents being generated so that they are always in phase with the
back-EMF, as shown in Figure 5. When position feedback is used in conjunction
with closed loop current control, the reference current, 𝑖𝑟𝑒𝑓 , only needs to be a
desired magnitude for the current in each phase. The frequency of the generated
sinusoidal phase voltages will be determined from information obtained from the
rotary encoder and hence the motor itself. Velocity control of the motor is not
directly achievable with this type of control as the top velocity of the motor will
depend on the sum of the static and dynamic load, the latter of which is a function of
the rotational velocity of the motor. The velocity of the motor will be such that the
current required to operate at the total load is equal to the reference current. If closed
loop velocity control is desired, it is necessary to add an additional controller which
takes velocity feedback from the rotary encoder and outputs the required reference
current signal [44]. Such a controller was not used as part of this research so it will
therefore not be discussed in any detail.

Minimisation of torque ripple-induced acoustic emissions from permanent magnet synchronous motors
29
2.3.4 Torque control
With the addition of both current and position feedback it is now possible to control a
motor so that it produces a specific output torque. A desired output torque, 𝑇𝑟𝑒𝑓, can
be supplied to the controller as shown in Figure 11.
Figure 11. Torque control of a PMSM
Output torque
As stated earlier, the torque produced by the motor is proportional to the magnitude
of the sinusoidal phase currents. In a torque control scheme, feedback from the
current sensors is used by the controller which adjusts the magnitude of the current in
each phase such that the resultant output torque matches the desired torque set-point.
This is similar to the closed loop current controller described previously as the torque
signal, 𝑇𝑟𝑒𝑓 , is directly proportional to the current signal required ( 𝑖𝑟𝑒𝑓 ). The
constant of proportionality between torque and current can be calculated or measured
experimentally before being set in the controller.

Minimisation of torque ripple-induced acoustic emissions from permanent magnet synchronous motors
30
Motor velocity
When using torque control, the velocity of the motor is no longer controlled, but is
determined by the output torque of the motor and the characteristics of the load on
the motor. The dynamic load on the motor will usually be a function of the rotational
velocity of the motor. The velocity of the motor will increase until the torque
produced equals the load applied to the motor or the back-EMF being produced in
each phase (which is proportional to velocity) reaches its upper limit as determined
by the bus voltage Vbus. The frequency of the phase currents is no longer being
determined directly by the controller, but rather by the load on the motor. The current
in each phase can be written as;
𝑖𝑎(𝜃𝑒𝑚𝑒𝑎𝑠) = −𝐼𝑎 sin(𝜃𝑒
𝑚𝑒𝑎𝑠)
𝑖𝑏(𝜃𝑒𝑚𝑒𝑎𝑠) = −𝐼𝑏 sin(𝜃𝑒
𝑚𝑒𝑎𝑠 − 120°)
𝑖𝑐(𝜃𝑒𝑚𝑒𝑎𝑠) = −𝐼𝑐 sin(𝜃𝑒
𝑚𝑒𝑎𝑠 + 120°) 2-12
where 𝜃𝑒𝑚𝑒𝑎𝑠 =
𝑝
2𝜃𝑚𝑚𝑒𝑎𝑠 2-13
If velocity control is required for a PMSM using the kind of controller shown in
Figure 11, this can still be achieved by controlling the torque input 𝑇𝑟𝑒𝑓 via an
additional velocity loop.
Torque input
When using torque control, the input torque 𝑇𝑟𝑒𝑓, need not be a constant but can be a
waveform of any desired shape or frequency as long as the motor controller has the
ability to adjust the current in each phase fast enough to keep up with the desired
input. In other words, the bandwidth of 𝑇𝑟𝑒𝑓 should be restricted to the bandwidth of
the current controller.
Field oriented control 2.4
As described in previous sections, in order to achieve the desired performance from a
PMSM is it necessary to directly control the currents in the phase windings of the
stator. In order to achieve the required level of control, a form of vector control,

Minimisation of torque ripple-induced acoustic emissions from permanent magnet synchronous motors
31
often referred to as field oriented control (FOC) can be used [45]. FOC is commonly
used in conjunction with PMSMs [46-48] and allows a PMSM to be controlled as
outlined in section 2.3.4. and uses measurements of the phase currents in a PMSM
(𝑖𝑎𝑏𝑐𝑚𝑒𝑎𝑠) as feedback, as well as position information such as 𝜃𝑚
𝑚𝑒𝑎𝑠 of the motor to
control the phase current in the motor such that output torque matches the reference
torque, 𝑇𝑟𝑒𝑓. Maximum torque is achieved by controlling the phase currents (𝑖𝑎𝑏𝑐)
such that their shape and phase match that of the assumed sinusoidal shape of the
back-EMF (𝑘𝑒,𝑎𝑏𝑐) of the PMSM [49]. Mathematical transforms are used to convert
measured phase currents from their fixed reference frame relative to the stator to a
rotating reference frame that it synchronous to the permanent magnetic field of the
rotor. Two new current signals are produced, 𝑖𝑑 (direct) and 𝑖𝑞 (quadrature). The
advantage of these transforms is that even though the phase currents are sinusoidal,
both 𝑖𝑑 and 𝑖𝑞 are constant for steady state operation of the motor, making the motor
easier to control.
2.4.1 Current transforms
As detailed earlier in section 2.2.1, the three phase currents in the PMSM’s windings
each create a magnetic field. As these phase currents are sinusoidal and offset by
120° (electrical) from each other, the combined magnetic fields from all three coils
create a magnetic field that rotates with respect to the reference frame of the stator.
Interaction between the stator magnetic field and that of the rotor’s permanent
magnets induces torque on the rotor . Under normal operation, the rotor will maintain
the same alignment with the stators magnetic field as they both rotate. From the
reference frame of the rotor, the stators magnetic field has a fixed magnitude and
angle for steady state operation of the PMSM.
FOC uses two mathematical transforms, applied to the measured phase currents, to
produce two new current signals, 𝑖𝑑 and 𝑖𝑞 [48]. Like the 3 phase currents, these two
new current signals can be used to represent the stator magnetic field, but this time
from the rotors reference frame. The first is called the direct current component, or
𝑖𝑑 , and is proportional the component of the stator magnetic field that is always
aligned with, but has opposite polarity, to the rotor magnetic field. The second

Minimisation of torque ripple-induced acoustic emissions from permanent magnet synchronous motors
32
current, known as the quadrature current component, or 𝑖𝑞 , is proportional to the
component of the stators magnetic field that is always at 90° to the rotor magnetic
field.
Figure 12 below illustrates FOC being applied to the control of a PMSM. Measured
currents, 𝑖𝑎𝑏𝑐𝑚𝑒𝑎𝑠 , from current sensors at the motor are first transformed to a two
vector representation in the stator reference frame by the so called Clarke transform
(𝑖𝛼 and 𝑖𝛽), shown in the figure as block C. Only two phase current, 𝑖𝑎 and 𝑖𝑏, need
be measured and the third current can be derived from equation 2-9. Next, a so called
Park transform, shown in the figure as block P, is used to move the two vectors from
the reference frame of the stator to the reference frame of the motor.

Minimisation of torque ripple-induced acoustic emissions from permanent magnet synchronous motors
33
Fig
ure
12. F
ield
ori
ente
d c
on
trol

Minimisation of torque ripple-induced acoustic emissions from permanent magnet synchronous motors
34
2.4.2 Current control
For steady state operation of the motor, 𝑖𝑑 and 𝑖𝑞 are constant. The output of FOC is
such that these two currents match, as close as possible, their desired reference
values. This is usually achieved using conventional proportional-integral (PI)
controllers [48, 50], which can be seen in Figure 12. The difference, or error,
between the reference value and the measured value are used as inputs to the two PI
controllers. The output of the controllers, two voltage signals, 𝑣𝑑 and 𝑣𝑞, will be used
to create the phase voltages in the motor necessary to generate the desired phase
currents. The ability of the current controller to create the desired currents in the
phase requires that the system is operating within the bandwidth of the current
controller.
The magnetic field proportional to the direct current, 𝑖𝑑, acts in an opposite direction
to that of the permanent magnets on the rotor, weakening it, and is sometimes
referred to as the de-magnetization current. For maximum torque it must be
controlled to zero.
𝑖𝑑𝑟𝑒𝑓
= 0 2-14
The quadrature current, 𝑖𝑞, is proportional to the component of the stator’s magnetic
fields that is orthogonal to that of the rotor, which induces the torque on the rotor. As
such, 𝑖𝑞 is proportional to the electromagnetic torque produced by the PMSM. The
reference signal for the quadrature current PI controller, 𝑖𝑞𝑟𝑒𝑓
, is derived from the
torque reference signal, 𝑇𝑟𝑒𝑓 by:
𝑖𝑞𝑟𝑒𝑓
=𝑇𝑟𝑒𝑓
𝐾𝑇 2-15
where 𝐾𝑇 is the torque constant for the motor, with units of newton metres per amp.
The constant, 𝐾𝑇 can be determined experimentally when first configuring the FOC.

Minimisation of torque ripple-induced acoustic emissions from permanent magnet synchronous motors
35
2.4.3 Voltage transform
The two voltage signals that are created by the PI controllers are in the rotor
reference frame. Before they can be applied to the PMSM they must first be
transformed back to the stator’s reference frame. This is done in two stages:
First the two vectors in the rotor reference frame are transformed to two
vectors in the stator reference frame (𝒗𝜶 and 𝒗𝜷 ) by the inverse Park
transform, shown in Figure 12 by the P-1
block
Next, the two vectors are transformed into three vectors, one per phase, by
the inverse Clarke transform (𝑣𝑑 and 𝑣𝑞), shown in the diagram by the C-1
block
At this point, the three phase voltages are still signals in the controller. In order to
apply these voltages to the motor, the controller must convert them to signals suitable
to be used as inputs to the PWM block shown in the diagram. The output from the
PWM block drives the power switching block such that the desired phase voltages
(𝑉𝑎, 𝑉𝑏 and 𝑉𝑐) are created. Once applied to the motor, these voltages will cause the
desired currents to flow in each phase of the motor. The shape of the waveform for
these three voltages is such that the error seen by the PI controllers is reduced
towards zero.
2.4.4 Phase currents and torque
It is possible to derive a magnitude for the required phase currents, and a value for
the electromagnetic torque developed by the motor in terms of the quadrature
current, 𝑖𝑞 of the FOC [48]. If the assumption is made that the control of 𝑖𝑑 and 𝑖𝑞
are ideal, then:
𝑖𝑑𝑟𝑒𝑓− 𝑖𝑑 = 0
𝑖𝑞𝑟𝑒𝑓
− 𝑖𝑞 = 0⇒𝑖𝑑 = 𝑖𝑑
𝑟𝑒𝑓= 0
𝑖𝑞 = 𝑖𝑞𝑟𝑒𝑓 2-16

Minimisation of torque ripple-induced acoustic emissions from permanent magnet synchronous motors
36
The inverse Park transform 𝑃−1 can be applied to 𝑖𝑑 and 𝑖𝑞 to obtain 𝑖𝛼 and 𝑖𝛽
𝑖𝛼𝛽 = P−1𝑖𝑑𝑞
𝑖𝛼𝛽(𝜃𝑒) = [
cos (𝜃𝑒) −sin (𝜃𝑒)sin (𝜃𝑒) cos (𝜃𝑒)
]⏟
P−1
[𝑖𝑑𝑖𝑞]
2-17
This gives:
𝑖𝛼(𝜃𝑒) = 𝑖𝑑 cos(𝜃𝑒) + 𝑖𝑞sin (𝜃𝑒)
𝑖𝛽(𝜃𝑒) = −𝑖𝑑 sin(𝜃𝑒) + 𝑖𝑞cos (𝜃𝑒) 2-18
The measured phase currents can now be found by applying the inverse Clarke
transform, 𝐶−1, to the result from equation 2-18.
𝑖𝑎𝑏𝑐𝑚𝑒𝑎𝑠 = 𝐶−1𝑖𝛼𝛽
𝑖𝑎𝑏𝑐𝑚𝑒𝑎𝑠(𝜃𝑒) =
3
2
[ 2
30
−1
3
1
√3
−1
3−1
√3]
⏟ C−1
[𝑖𝑑 cos(𝜃𝑒) − 𝑖𝑞 sin(𝜃𝑒)
𝑖𝑑 sin(𝜃𝑒) + 𝑖𝑞 cos(𝜃𝑒)]
2-19
From equation 2-16, 𝑖𝑑 = 0 and 𝑖𝑞 = 𝑖𝑞𝑟𝑒𝑓
, then:
𝑖𝑎𝑏𝑐𝑚𝑒𝑎𝑠(𝜃𝑒) =
3
2
[ −
2
3𝑖𝑞 sin(𝜃𝑒)
1
3𝑖𝑞 sin(𝜃𝑒) +
1
√3𝑖𝑞 cos(𝜃𝑒)
1
3𝑖𝑞 sin(𝜃𝑒) −
1
√3𝑖𝑞 cos(𝜃𝑒)]

Minimisation of torque ripple-induced acoustic emissions from permanent magnet synchronous motors
37
This can be simplified to:
𝑖𝑎𝑏𝑐𝑚𝑒𝑎𝑠(𝜃𝑒) =
3
2
[ −
2
3𝑖𝑞sin (𝜃𝑒)
−2
3𝑖𝑞sin(𝜃𝑒 − 120°)
−2
3𝑖𝑞sin (𝜃𝑒 + 120°)]
𝑖𝑎𝑏𝑐𝑚𝑒𝑎𝑠(𝜃𝑒) = [
−𝑖𝑞sin (𝜃𝑒)
−𝑖𝑞sin(𝜃𝑒 − 120°)
−𝑖𝑞sin (𝜃𝑒 + 120°)
] 2-20
It can be seen that, by using FOC, the current in each phase will be controlled such
that the corresponding measured current will have a magnitude equal to the
controller’s reference current, 𝑖𝑞𝑟𝑒𝑓
. Given equation 2-20, and at this stage of analysis
assuming that the measure current it a true representation of the actual current in
each phase ( 𝑖𝑎𝑏𝑐(𝜃𝑒) = 𝑖𝑎𝑏𝑐𝑚𝑒𝑎𝑠(𝜃𝑒) ), the electromagnetic torque generated in a
PMSM can be found by re-writing equation 2-7 as:
𝑇𝑒𝑚 = −𝐾𝑒 sin(𝜃𝑒) . −𝑖𝑞 sin(𝜃𝑒)
−𝐾𝑒 sin(𝜃𝑒 − 120°) . −𝑖𝑞 sin(𝜃𝑒 − 120°)
−𝐾𝑒 sin(𝜃𝑒 + 120°) . −𝑖𝑞 sin(𝜃𝑒 + 120°)
= 𝐾𝑒𝑖𝑞(sin2(𝜃𝑒) + sin
2(𝜃𝑒 − 120°) + sin2(𝜃𝑒))
𝑇𝑒𝑚 =
3
2𝐾𝑒𝑖𝑞 2-21
Again, assuming the system is operating within the bandwidth of the current
controller, 𝑖𝑞𝑟𝑒𝑓
= 𝑖𝑞. The electromagnetic torque created by the PMSM, 𝑇𝑒𝑚, can be
seen to be a function of the current, 𝑖𝑞 and hence of the reference current, 𝑖𝑞𝑟𝑒𝑓
, where
𝐾𝑒 is the magnitude of the per-phase, speed-normalised back-EMF for the motor, in
volts seconds per radian. Since from equation 2-15 the reference torque signal, 𝑇𝑟𝑒𝑓,
is also a function of the reference current, 𝑖𝑞𝑟𝑒𝑓
, it can be seen that in this case:

Minimisation of torque ripple-induced acoustic emissions from permanent magnet synchronous motors
38
𝑇𝑒𝑚 = 𝑇𝑟𝑒𝑓 2-22
and 𝐾𝑇 =3
2𝐾𝑒
Summary: Torque control of PMSMs 2.5
In this chapter, PMSMs have been described in terms of their physical construction.
Two different topologies, axial flux and radial flux were also discussed. PMSMs
were defined as AC synchronous motors which have a characteristically sinusoidal
shape to their back-EMF. It was shown that the electromagnetic torque developed by
a PMSM is the sum of the products of the per-phase back-EMF and the individual
phase current. By using closed loop control, specifically field oriented control
(FOC), feedback obtained from the measured phase currents and the position of the
motor can be used to control a PMSM such that the electromagnetic torque
developed by the motor is equal to the torque control signal, 𝑇𝑟𝑒𝑓, assuming the
system is operating within the bandwidth of the current controller.

Minimisation of torque ripple-induced acoustic emissions from permanent magnet synchronous motors
39
3 Review: Sources of torque ripple-
induced acoustic emissions in
permanent magnet synchronous
motors.
In the previous chapter, it was shown that the electromagnetic torque developed by a
PMSM is the sum of the products of the per-phase speed normalised back-EMF and
the individual phase current. Using field oriented control (FOC), feedback obtained
from the measured phase currents and the position of the motor can be utilised to
control a PMSM such that the electromagnetic torque developed by the motor is
equal to the torque control signal, 𝑇𝑟𝑒𝑓 . In this chapter, a model of a PMSM is
introduced and then used to discuss the various interactions that result in the
development of electromagnetic torque. Later in the chapter, it will be shown that as
well as producing a torque, 𝑇𝑒𝑚 , to match the desired reference torque, 𝑇𝑟𝑒𝑓 ,
additional torque harmonics are also produced. Sources of these additional torque
harmonics will be discussed. Finally it is shown that torque ripple can mechanically
couple through the motor and, under certain circumstances, cause acoustic emissions.
System block diagram of a PMSM 3.1
When the excitation or control of a PMSM was discussed in earlier chapters, the
PMSM was represented as either a single block, such as in Figure 12, or only the
phase windings were shown. Figure 13 below again shows how FOC can be used to
control the torque produced by a PMSM. In this new figure, the model for the PMSM
is now a system block diagram.

Minimisation of torque ripple-induced acoustic emissions from permanent magnet synchronous motors
40
Fig
ure
13. G
enera
ted
torq
ue

Minimisation of torque ripple-induced acoustic emissions from permanent magnet synchronous motors
41
The field oriented controller is represented by a single block on the left hand side of
the figure. This one block incorporates the command block and the FOC block from
Figure 12, as well as the PWM and power switching blocks. This new FOC block
takes the reference torque, 𝑇𝑟𝑒𝑓, and controls the output voltages,𝑣𝑎, 𝑣𝑏, and 𝑣𝑐, such
that the measured currents in each phase, 𝑖𝑎𝑚𝑒𝑎𝑠 , 𝑖𝑏
𝑚𝑒𝑎𝑠 and 𝑖𝑐𝑚𝑒𝑎𝑠 are the desired
values, as described in section 2.4 previously.
The voltages, 𝒗𝒂𝒃𝒄, generated by the FOC block are applied to the corresponding
phase of the PMSM winding. When the motor is rotating, there will also be back-
EMF induced on these windings, shown in the diagram as 𝒆𝒂𝒃𝒄 . The resulting
difference of these voltages causes a current to flow in each phase winding due to the
fact that each phase has an electrical impedance. The electrical impedance for each
phase winding is represented by the transfer function, 1/(𝐿𝑠 + 𝑅), in the diagram. In
this block, L represents the inductance of a particular phase winding and R is its
corresponding resistance.
It is these resulting currents that interact with the speed-normalised back-EMF to
produce the electromagnetic torque, 𝑇𝑒𝑚 . As shown in equation 2-7, the resulting
electromagnetic torque is the vector dot product of 𝒊𝒂𝒃𝒄 and 𝒌𝒆,𝒂𝒃𝒄. As the derivation
of electromagnetic torque does not yet consider any additional torque components,
the value derived in equation 2-7 will be henceforth referred to as the ideal
electromagnetic torque, 𝑇𝑒𝑚𝑖𝑑𝑒𝑎𝑙. The net electromagnetic torque, 𝑇𝑒𝑚, is equal to the
ideal electromagnetic torque, 𝑇𝑒𝑚𝑖𝑑𝑒𝑎𝑙, plus or minus any additional torque components
internal to the motor. These additional components will be discussed later in the
chapter but for now they are considered not to be present and therefore 𝑇𝑒𝑚𝑖𝑑𝑒𝑎𝑙 =
𝑇𝑒𝑚.
Any retarding torque provided by loads attached to the motor are modelled by a load
torque, 𝑇𝐿 . In Chapter 0, it is shown that additional loads directly coupled to the
shaft, such as a fan and an eddy current break, can be considered as part of the total
mechanical transfer function which will be discussed in the next paragraph. The load
torque, 𝑇𝐿, can then be taken to be zero.
The net electromagnetic torque, 𝑇𝑒𝑚, acts on the mechanical system of the motor.
The mechanical system is represented in the diagram by the transfer function,

Minimisation of torque ripple-induced acoustic emissions from permanent magnet synchronous motors
42
1/(𝐽𝑠 + 𝑏) in the diagram. In the transfer function, J represents the moment of
inertia of the rotor about the axis of rotation. Also used in the mechanical systems
transfer function is b which models the viscous friction, predominantly from the
bearings. The output of this transfer function is mechanical rotational velocity, 𝜔,
which is integrated by the next block in the diagram and mechanical rotational
displacement, 𝜃 result.
The vector representing speed-normalised back-EMF, 𝒌𝒆,𝒂𝒃𝒄 , is multiplied by the
electrical rotational velocity to produce the back-EMF, 𝒆𝒂𝒃𝒄 . Current sensors
measure the currents flowing in the phase windings, 𝒊𝒂𝒃𝒄, and produce the measured
current, 𝒊𝒂𝒃𝒄𝒎𝒆𝒂𝒔, which act as feedback to the FOC block. A rotary encoder measures 𝜃
to produce 𝜃𝑚𝑒𝑎𝑠 The measured angle is used by the FOC block as part of the
mathematical transforms described in section 2.4. Offsets in position can be derived
at the same time as determining speed normalised back-EMF, enabling us to write:
𝜃 = 𝜃𝑚𝑒𝑎𝑠.
Additional torque components 3.2
As discussed in the introduction, PMSMs provide smooth torque outputs over a
range of rotational velocities. In general, these motors exhibit torque ripple;
unintended harmonic fluctuations of the output torque. In order to better illustrate
torque ripple, a typical PMSM, controlled via FOC was given a constant torque
reference signal and the output torque was measured. The output torque for one
revolution of the motor is shown below in Figure 14. The output torque, which has a
steady state value of approximately 0.91 Nm, is seen to have fluctuations of more
than ±50% of this value.

Minimisation of torque ripple-induced acoustic emissions from permanent magnet synchronous motors
43
Figure 14. Torque output versus position for one mechanical cycle
Order based analysis 3.3
While the presence of torque ripple is clearly shown in Figure 14, the structure of it
is not. Torque ripple is comprised of a number of dominant frequencies that are
sinusoidal and which repeat an integer number of times per revolution of the motor.
If data, such as that represented in Figure 14, are processed by a fast Fourier
transform (FFT), it is possible to view the position based orders of the torque ripple
present.
The harmonic components of torque ripple occur at integer multiples of times per
revolution. As such they are potentially time variant if the rotational velocity of the
motor is changing and, as a consequence, a time based FFT would not provide a clear
picture. Since the data have been sampled on the basis of encoder counts and not
time, and because the disturbances occur relative to position, a position based FFT is
ideal. This is a commonly used practice to analyse the characteristics of rotating
machines and is referred to as order tracking analysis [51]. The result is an order
domain representation of the torque ripple, where the number of the order represents
the number of times per revolution of the motor that a particular component of the

Minimisation of torque ripple-induced acoustic emissions from permanent magnet synchronous motors
44
torque ripple repeats. Figure 15 shows the torque spectrum, for the first 50 orders, of
the same motor as above.
Figure 15. Spectrum of torque versus order for the first 50 orders
It can be seen that the torque ripple is not present at all frequencies and does indeed
consist of a number of dominant orders. For this particular motor, dominant torque
ripple can be seen at the: 10th
, 20th
, 24th
, 40th
, and 48th
orders.
Causes of torque ripple 3.4
The principal causes of torque ripple are well-documented [1, 2, 8, 52]. They can be
summarised as: cogging torque, the presence of non-sinusoidal back-EMF, and
current measurement errors. One additional cause of torque ripple in PMSMs,
reluctance torque (which is due to the saliency of the rotor), will not be discussed as
the motor used for this research has magnets placed on the surface of the rotor. In
this configuration, reluctance torque is negligible [2].

Minimisation of torque ripple-induced acoustic emissions from permanent magnet synchronous motors
45
3.4.1 Torque ripple caused by non-sinusoidal back-EMF
The back-EMF for any given phase in a PMSM is assumed to be sinusoidal.
Imperfections in magnet strength and placement as well as dimensional variations in
electromagnet cores and impedances mean that this is not always the case. In reality,
the back-EMF may not be sinusoidal and may include variations in phase and
amplitude which are dependent on position, as well as additional harmonics.
Interactions between the current and the non-ideal back-EMF could cause position
dependent variations on the output torque, i.e. torque ripple. These additional
frequencies are particular to the defect that caused them and differ from motor to
motor.
Design techniques exist to minimise the additional harmonic components generated
in a PMSM [1]. These include beneficial magnet shape and magnet skewing as
described in [2]. The motor used in this research has been designed with this in mind
and will be considered to have back-EMF that is a pure sinusoid of one frequency.
This will be confirmed in chapter 0, which discusses the experimental setup. Further
analysis of torque ripple due to non-sinusoidal back-EMF will be considered outside
of the scope of this thesis.
3.4.2 Torque ripple caused by cogging torque
Cogging torque is the component of torque ripple caused by interaction between the
permanent magnets of the rotor and the magnetic material that makes up the stator [8,
53]. In an axial flux PMSM the stator is essentially a torus of electrical steel with a
rectangular cross-section and slots cut radially on one face to hold the phase
windings. The result is a number of teeth of electrical steel that sit close to the
magnets on the rotor. An example of a stator can be seen in Figure 16. The stator
windings have been removed for clarity.

Minimisation of torque ripple-induced acoustic emissions from permanent magnet synchronous motors
46
Figure 16. PMSM stator core, phase windings removed
As the rotor turns and a magnet nears the edge of a slot in the stator, the attraction
between the magnet and the next tooth increases the torque on the rotor. As the rotor
continues to move, the magnet and core become aligned and the additional torque is
then reduced to zero. The magnet will then start to move away from the core, and the
magnetic attraction will then result in a reduction of torque on the rotor. This
interaction and the subsequent variation of torque happen a number of times per
revolution as each magnet on the rotor passes a tooth on the stator. The total cogging
torque on the rotor is the sum of all of these various interactions and contains
frequencies that are integer multiples of either the number of magnets multiplied by
the fundamental frequency of the motor or the number of teeth (or slots) on the stator
multiplied by the motor’s fundamental frequency. Order based analysis of the
cogging torque for a PMSM should result in peaks being present at an order equal to
the number of the magnets on the rotor as well as another at an order equal to the
number of teeth (or slots) on the stator. Peaks should also be present at integer
multiples of these orders [8].

Minimisation of torque ripple-induced acoustic emissions from permanent magnet synchronous motors
47
The cogging torque for a given motor is independent of stator excitation hence it
exists even if the motor is not being powered. The magnitude of the cogging torque
is a function of the motors position. The effect of the cogging torque can be added to
the system block diagram presented in Figure 13 with the addition of 𝑇𝑐𝑜𝑔(𝜃) to the
ideal electromagnetic torque, 𝑇𝑒𝑚𝑖𝑑𝑒𝑎𝑙(𝑖𝑞). An updated diagram with this addition can
be seen below in Figure 17. The additional load torque, 𝑇𝐿, has been removed as it is
zero.
The following equation can now be written for 𝑇𝑒𝑚:
𝑇𝑒𝑚(𝜃) = 𝑇𝑒𝑚𝑖𝑑𝑒𝑎𝑙 + 𝑇𝑐𝑜𝑔(𝜃) 3-1
Since the ideal electromagnetic torque is a function of the quadrature current in the
current controller and the cogging torque is a function of position, the
electromagnetic torque produced by the motor is a function of both.

Minimisation of torque ripple-induced acoustic emissions from permanent magnet synchronous motors
48
Fig
ure
17. M
od
el o
f P
MS
M i
ncl
ud
ing c
oggin
g t
orq
ue.

Minimisation of torque ripple-induced acoustic emissions from permanent magnet synchronous motors
49
3.4.3 Torque ripple caused by current measurement error
As mentioned in Section 2.7, closed loop torque control of a PMSM requires the
measurement and control of the current of each of the phase windings in the stator.
The accuracy of the control of these phase currents is dependent on the accuracy of
their measurement and measurement errors will contribute to the creation of torque
ripple [53-57]. As the controller act to keep the measured current the desired
magnitude and phase, any error in the measurement of these phase currents will have
the effect of adding error to the current supplied to the stator and hence the torque on
the rotor. Since stator current is proportional to the torque produced (see equation
2-21) an error in the applied stator current will result in an incorrect torque.
The measured current can potentially contain a scaling error, or gain, as well as an
offset. In [54, 55] it is shown that the offset error will add an additional frequency to
the torque that occurs once per electrical cycle while the scaling error is responsible
for an additional frequency in the torque occurring twice per electrical cycle. The
measured current, obtained for the current sensor for a given phase can be expressed
as:
𝐼𝑥𝑚𝑒𝑎𝑠 = 휀𝑥(𝐼𝑥 + 𝛿𝑥) 3-2
where 𝐼𝑥𝑚𝑒𝑎𝑠 is the measured current for sensor 𝑥, 𝐼𝑥 is the current to be measured, 𝛿𝑥
is the offset error of the current sensor and 휀𝑥 is its gain. In [57] the author shows
that offset error will result in additional torque harmonics that will occur once per
electrical cycle and twice per electrical cycle.
The additional harmonic component which occurs once per electrical cycle is shown
to be caused only by the offsets internal to the current sensors, where both the
magnitude and phase is dependent on their values. The magnitude of the current
reference, 𝑖𝑞, has no effect on the magnitude of this harmonic. Under the worst case
scenarios, a 1% offset error can result in a peak to peak torque ripple of 4% [57].
Figure 18 shows the effect on the output torque produced when the measured current
for phase A contains an offset error 10% of its amplitude.

Minimisation of torque ripple-induced acoustic emissions from permanent magnet synchronous motors
50
Figure 18. The effect of current measurement offset error (one phase winding)
on electromagnetic torque
In Figure 18(a), the current and back-EMF for each phase are shown (again, the
magnitudes have been chosen for demonstration purposes only): all three of the
phase currents have the same magnitude, but phase A has been offset by 10 % in the
positive direction this offset is barely perceptible on the first plot, but the effect on

Minimisation of torque ripple-induced acoustic emissions from permanent magnet synchronous motors
51
the developed torque is visible in the next two plots. Figure 18(b) shows the torque
developed in each phase: the torque due to phase windings A and C (𝑇𝑒𝑚,𝑎 and 𝑇𝑒𝑚,𝑐
respectively) are reduced for part of the cycle while increased for part of the cycle.
Additionally, the phase of the torque due to phase winding C, 𝑇𝑒𝑚,𝑐, has changed.
Figure 18(c) shows the total torque developed for one cycle which is the sum of the
torque in all of the three phases. In this case the offset error results in a fluctuation of
torque once per electrical cycle. Torque ripple caused by an offset error will occur at
a frequency equal to the electrical frequency and at integer multiples thereof.
The additional harmonic component which occurs twice per electrical cycle is due to
only the scaling error of the current sensors. The magnitude of this harmonic is
dependent on the mismatch of the two gain errors and is also influenced by the
magnitude of the current, 𝑖𝑞. A 1% mismatch in current measurement gain can result
in a peak to peak torque ripple of 2.13% [57].
The effects on the electromagnetic torque produced by the motor, due to current
sensor errors, are illustrated below in Figure 19. This shows the effect on the torque
developed over one electrical cycle when a gain of 1.2 is applied to the current
sensor for phase winding A while a gain of 1 is applied to the current sensor for
phase winding B. This gain mismatch of 20% was chosen so that it was sufficiently
large so as to demonstrate the effect clearly.

Minimisation of torque ripple-induced acoustic emissions from permanent magnet synchronous motors
52
Figure 19. The effect of current measurement scaling error (one phase winding)
on electromagnetic torque

Minimisation of torque ripple-induced acoustic emissions from permanent magnet synchronous motors
53
In Figure 19(a) the current and back-EMF for each phase are shown: the magnitudes
of the current and back-EMF in each phase have been chosen arbitrarily for
demonstration purposes only and are not necessarily indicative of actual values. The
same parameters have been used as were presented for Figure 5 except for the gain
applied to the sensor used to measure the current on phase winding A. This results in
a reduced magnitude of the current in that winding as well as a reduced magnitude
and change of phase for the current flowing through phase winding C.
Figure 19(b) shows the torque developed in each phase: the torque due to phase
windings A and C (𝑇𝑒𝑚,𝑎 and 𝑇𝑒𝑚,𝑐 ) are reduced and the phase of 𝑇𝑒𝑚,𝑐has been
altered. Figure 19(c) shows the total torque developed for the cycle which is a sum of
the torques in each phase. The effect of scaling error in the current measurement is a
fluctuation in the torque that occurs twice per electrical cycle of the motor as well as
a reduction in the steady state value of the torque. Torque ripple caused by gain error
will occur at two times the electrical frequency and at integer multiples thereof.
Rather than add the current measurement gain and offset errors to the model PMSM,
their effect on the electromagnetic torque can be added to 𝑇𝑒𝑚𝑖𝑑𝑒𝑎𝑙 in the model
instead. The term Δ𝑇𝑒𝑚 will represent both additional torque harmonics and the
addition of the term to the diagram enables the measured currents 𝒊𝒂𝒃𝒄𝒎𝒆𝒂𝒔 to be shown
to be equal to the actual phase currents 𝒊𝒂𝒃𝒄, the effect on electromagnetic torque
produced by the motor would be the same. Figure 20 below shows the new model
PMSM including Δ𝑇𝑒𝑚. This additional torque component is shown in Figure 20.

Minimisation of torque ripple-induced acoustic emissions from permanent magnet synchronous motors
54
Fig
ure
20
. M
od
el o
f P
MS
M i
ncl
ud
ing t
orq
ue
rip
ple
du
e to
cu
rren
t m
easu
rem
ent
erro
r

Minimisation of torque ripple-induced acoustic emissions from permanent magnet synchronous motors
55
Combined effects of torque ripple components 3.5
The combined effect of the major torque ripple for a PMSM can be predicted from
known characteristics of the motor. If an order based analysis of the torque ripple
were performed, peaks caused by the torque ripple would be expected to occur at
orders equal to the number of magnets on the rotor and the number of slots (or teeth)
on the stator. Additional cogging torque harmonics will also be present at integer
multiples of all of these orders [8, 53].
Current measurement scaling error will result in a peak at the order equal to twice the
electrical frequency of the motor and current measurement offset error a peak at the
order equal to the electrical frequency where the electrical frequency is the
mechanical frequency of the motor multiplied by the number of pole pairs on the
rotor.
Figure 21 shows the order based spectrum for the torque ripple measured for a
typical PMSM. The motor has 24 slots on the stator and a rotor containing 20
magnets (10 pole pairs) which means that there are 10 electrical cycles per
mechanical cycles for this particular motor.
From this it is expected that order based analysis of the torque ripple should show
peaks at the 20th
and 24th
orders due to cogging torque, a peak at the 10th
harmonic
due to current offset error and additional amplitude at the 20th
order due to current
gain error. Additional harmonics should then be present at integer multiples of these
orders [8, 53].

Minimisation of torque ripple-induced acoustic emissions from permanent magnet synchronous motors
56
Figure 21. Order based spectrum of a typical PMSM (first 80 orders)
As expected peaks can be seen in Figure 21 at the 10th
, 20th
, and 24th
orders as well
as at their integer multiples.
The different causes of torque ripple can be combined into a single additional torque,
𝑇𝑟𝑖𝑝, where:
𝑇𝑟𝑖𝑝(𝑖𝑞, 𝜃) = 𝑇𝑐𝑜𝑔(𝜃) + Δ𝑇𝑒𝑚(𝑖𝑞, 𝜃) 3-3
𝑇𝑟𝑖𝑝 will vary with the position of the motor and is hence still a function of either the
electrical or mechanical position. As Δ𝑇𝑒𝑚 is a function of 𝑖𝑞 , 𝑇𝑟𝑖𝑝 is similarly
dependant on the value of 𝑖𝑞 [57]. The equation for the electromagnetic torque
generated by the motor can be written as:
𝑇𝑒𝑚(𝑖𝑞, 𝜃) = 𝑇𝑒𝑚𝑖𝑑𝑒𝑎𝑙 + 𝑇𝑟𝑖𝑝(𝑖𝑞, 𝜃) 3-4
The model PMSM shown in Figure 20 can be redrawn as shown in Figure 22 below.

Minimisation of torque ripple-induced acoustic emissions from permanent magnet synchronous motors
57
Fig
ure
22. R
evis
ed m
oto
r m
od
el

Minimisation of torque ripple-induced acoustic emissions from permanent magnet synchronous motors
58
In this revised motor model, all of the various parts of the motor and FOC have been
grouped together into two functional block, Gem and Gm . The first of these two
blocks, Gem , contains the parts of the system responsible for generating the
electromagnetic torque. These include the FOC block and all of the components
associated with the stator such as the current sensors and the motor phase windings.
The output of this block is the ideal electromagnetic torque, 𝑇𝑒𝑚𝑖𝑑𝑒𝑎𝑙. The input to this
block is the reference torque signal, 𝑇𝑟𝑒𝑓 , which could be either a function of
mechanical position or a constant value. Assuming that the system is operating
within the bandwidth of the current controller, the measured current can be
controlled to match the reference current. Equation 2-22 shows that if this is the case,
the output of this block, 𝑇𝑒𝑚𝑖𝑑𝑒𝑎𝑙, is equal to the input, 𝑇𝑟𝑒𝑓.
The torque ripple is then added to the ideal electromagnetic torque. The result is the
net electromagnetic torque, 𝑇𝑒𝑚 . The second functional block in Figure 22, Gm ,
contains the mechanical system of the motor, the rotor and rotary encoder. The
output from this second block is rotational displacement and velocity. These signals
are used by various parts of the first block to control the motor and produce the ideal
electromagnetic torque. This diagram can be simplified further as shown below in
Figure 23.
Figure 23. Further simplification of FOC and motor model

Minimisation of torque ripple-induced acoustic emissions from permanent magnet synchronous motors
59
Effects of operating condition on torque ripple 3.6
Many applications of PMSMs require them to function at various operating points
and at a range of environmental conditions. To achieve different operating points, the
input to the FOC, 𝑇𝑟𝑒𝑓 is varied which in turn changes the command current 𝑖𝑞. The
component of 𝑇𝑟𝑖𝑝 due to cogging torque will not change as it is independent of 𝑇𝑟𝑒𝑓,
and hence 𝑖𝑞 . Some of the components of 𝑇𝑟𝑖𝑝 caused by error in the current
measurement will vary as 𝑖𝑞 is changed while others will not [57].
Torque ripple due to current measurement offset error is independent of 𝑖𝑞 while the
component due to scaling error of the current measurement is not. The magnitude of
this torque ripple component, a harmonic that occurs twice every electrical cycle,
will vary proportionally to a change in 𝑖𝑞. The net result is that as the operating point
of the motor changes, only the component of torque ripple occurring twice per
electrical cycle will vary. If this harmonic is caused only by current sensor scaling
error, it will vary proportionally with 𝑖𝑞, however if cogging torque also exists at this
order, as it does with the motor with the order based as shown in Figure 21, the
amplitude will not be entirely dependent on 𝑖𝑞.
Changes in the operating temperature of the motor could potentially lead to
variations in the torque ripple. As the magnets on the rotor heat up their magnetic
field strength will decrease [58-60]. As cogging torque is caused by the interactions
of these magnets and the steel of the stator, a change in the strength of these magnets
will have an effect on the magnitude of the cogging torque. In [53] it is seen that as
the temperature of a particular motor’s environment is increased from 25°C to 55°C
a 6% reduction in cogging torque was observed for that motor.
For this research both the load on the motor and the reference torque signal, 𝑇𝑟𝑒𝑓,
will be considered to be either constant or slow to change, as will the temperature of
the motor. As long as the rate of change of these is much slower than any
compensation scheme implemented, all of the components of torque ripple could be
considered to be independent of a specific operating point and be considered as one
disturbance made up of all of the various components of torque ripple.

Minimisation of torque ripple-induced acoustic emissions from permanent magnet synchronous motors
60
Noise and Vibration Caused by Torque Ripple 3.7
For some applications of PMSMs, torque ripple does not pose a problem. However
as more and more uses are found for these motors, these unwanted fluctuations on
the output torque can have some undesirable side effects. Newtons 3rd law suggests
that any force on the rotor must also be experienced by the stator so any torque ripple
present on the rotor means that there is an equal but opposite torque ripple on the
stator. When radial vibration of the stator occurs, this leads to radial displacement of
the stator structure and machine vibration. Vibrations on either the rotor or stator can
in turn lead to noise being created. This problem is not new [61] and is common to
all rotating electric machines.
Noise and vibration from a PMSM can originate from a number of sources. In [11]
the authors classify noise and vibration from a PMSM into 3 main categories based
on its source;
1. Aerodynamic.
2. Mechanical.
3. Electromagnetic.
The authors then go on to state the electromagnetic source, i.e. torque ripple, is the
dominating source in low to medium power rated machines.
Acoustic noise will be generated when the sound created by the radial vibration of
the machine exceed a certain threshold. The radial vibration will be at its maximum
if one or more of the frequencies present in the torque ripple match with the natural
mode frequencies of the machine or the structure to which it is attached. A
comparison of the order based spectrum of both the torque ripple and the acoustic
emissions for the PMSM used in this research will be shown later in chapter 7.
The reduction of acoustic emissions from PMSMs can be achieved, as with any
rotating machine, by either reducing the vibrating forces, in this case, 𝑇𝑟𝑖𝑝, or by
modifying the transmission paths of the noise [61]. Modification of the transmission
paths is difficult to achieve simultaneously for the various frequencies that will be
produced at many different operating points. Additionally, the lower the frequency,
the larger the amount of damping material is required and the greater its density. A

Minimisation of torque ripple-induced acoustic emissions from permanent magnet synchronous motors
61
better approach is to remove the components of the torque ripple that are the cause of
much of the acoustic emissions [11].
Chapter summary 3.8
In this chapter, a model of a PMSM is introduced and then refined as the concepts of
additional torque harmonics and their production were introduced. Sources of these
additional torque harmonics were discussed. The various components of torque
ripple were combined into a single disturbance, 𝑇𝑟𝑖𝑝 , which was added to the
electromagnetic torque and the model of the PMSM was reduced further. It was
shown that torque ripple can mechanically couple through the motor and, under
certain circumstances, cause acoustic emissions.

Minimisation of torque ripple-induced acoustic emissions from permanent magnet synchronous motors
62

Minimisation of torque ripple-induced acoustic emissions from permanent magnet synchronous motors
63
4 Review: mitigation methods for
torque ripple
In the previous chapter, the concept of torque ripple (unwanted fluctuations of the
output torque) was introduced. Major contributing factors causing torque ripple were
discussed as was their combined effect on torque ripple. It was shown that torque
ripple acts on the rotor and stator and is coupled through the motor housing and
mounting, it results in acoustic emissions.
In this chapter, methods for reduction of the torque ripple that cause acoustic
emissions will be discussed. The discussion will focus on control based approaches.
It will be shown that many of these control methods can be summarised by the
following approach: the addition of sinusoids at set frequencies to the input in order
to cancel sinusoids at the same frequencies in the output.
Methods used in the reduction of torque ripple 4.1
Methods used to reduce torque ripple in permanent magnets machines (PMSMs) can
be broadly categorised into two approaches; motor design and motor control. In
chapter 1, it was shown that although design methods can reduce the effect of torque
ripple, it is not possible due to manufacturing tolerances to produce motors with no
torque ripple [8-10].
Control approaches that involve reference models of the motor and the mechanical
systems they are attached to will not be discussed due to the reasons also outlined in
chapter 1. The following approaches, including examples, will be examined; open
loop compensation, closed loop feedback control, and adaptive feed forward
compensation. In order to better discuss these methods, the starting point for all of
them can be discussed first as it is the same for all methods.

Minimisation of torque ripple-induced acoustic emissions from permanent magnet synchronous motors
64
A revised model for a PMSM was introduced at the end of chapter 3 as is shown
again below in Figure 24. The torque ripple, 𝑇𝑟𝑖𝑝, is present on the mechanical torque
produced by the motor. This then couples through the mounting system of the motor
and produces acoustic emissions.
Figure 24. Model of FOC and PMSM
Given the model proposed in Figure 24, an approach for removing the torque ripple
would be to devise a method to estimate the torque ripple and to subtract the
estimated disturbance, �̂�𝑟𝑖𝑝 , from the torque as shown below in Figure 25(a).
However, it is not possible to directly affect the torque produced by the motor in this
way. Since the relationship between 𝑇𝑟𝑒𝑓 and 𝑇𝑒𝑚𝑖𝑑𝑒𝑎𝑙 is said to be one as long as 𝑇𝑟𝑒𝑓
is within the bandwidth of the system, Gem, then an alternative would be to subtract
the estimate of the disturbance, �̂�𝑟𝑖𝑝 , from the reference torque signal, 𝑇𝑟𝑒𝑓 , and
apply the difference as the input of the system. In this way it would be possible to
compensate for the disturbance that is added to the output of Gem. This is shown
below in Figure 25(b).

Minimisation of torque ripple-induced acoustic emissions from permanent magnet synchronous motors
65
(a)
(b)
Figure 25. Removal of disturbance
Open loop compensation 4.2
One approach to achieve the compensation discussed above would be formulate a
pre-determined function for the estimated disturbance, �̂�𝑟𝑖𝑝 . This could be done
experimentally or via analysis of the known motor system and the causes of torque
ripple. The same estimated disturbance could then be subtracted from the reference

Minimisation of torque ripple-induced acoustic emissions from permanent magnet synchronous motors
66
signal each time the motor is used. This is often referred to as a programmed
reference current waveform control [12, 14] and is shown below in Figure 26.
Figure 26. Programmed reference current waveform control
To use this approach, the frequencies or orders of the disturbance as well as an
estimate of their magnitudes must be known. From this, an estimate signal is
generated and stored in the memory of a micro controller. This is shown in Figure 26
as the memory block. This estimate signal could be in the time domain [14] (or
position domain) and stored as a look up table [62]. Alternatively, compensation data
could be stored as order domain data, a magnitude and phase per order [63].
Regardless of the method, data from the motor, such as measured mechanical
position (shown in the diagram), is used by the programmed reference current
waveform block to generate 𝑢(𝜃), a compensation signal based on pre-determined
and pre-configured parameters. As the magnitude of the torque ripple harmonic
caused by gain mismatch error is dependent on 𝑖𝑞 and hence 𝑇𝑟𝑒𝑓 (see section 3.4.3),
𝑇𝑟𝑒𝑓 is also a necessary input to the memory block to compensate for this harmonic.
Experimental comparison of published PRWC techniques are discussed in [13].
From this comparison, the author found that time domain methods were most
effective and able to reduce torque ripple to ≈ 9%. Order, or sinusoidal current
reference methods were able to reduce torque ripple to ≈ 12%.

Minimisation of torque ripple-induced acoustic emissions from permanent magnet synchronous motors
67
Closed loop feedback control 4.3
Rather than a predetermined compensation, the estimated disturbance, �̂�𝑟𝑖𝑝, can be
found via feedback from a motor output [23]. Sensors can be utilised to measure
motor output such as the mechanical torque (torque sensor) or the acoustic emissions
(microphone) can be used as input to the controller. As the effects of torque ripple
can also be observed in the rotational velocity of the motor [23, 44, 64], this signal
could similarly be used as feedback to a controller. With the additional input of a
reference signal, the controller can be made to generate a new torque reference, 𝑇𝑟𝑒𝑓,
such that the measured value will match the reference value. To do this, the new
torque reference must contain the required compensation in order to reduce the effect
of 𝑇𝑟𝑖𝑝 observed on the feedback signal, towards zero. Figure 27 below shows the
possible closed loop feedback diagrams.
(a)
(b)
Figure 27. Closed loop feedback control

Minimisation of torque ripple-induced acoustic emissions from permanent magnet synchronous motors
68
Figure 27(a) shows a feedback system using either the measured torque or acoustic
emissions. In order to obtain a measurement for the actual mechanical torque of the
motor, either the reaction torque on the stator is measured via a torque sensor [65], or
the acoustic emissions, generated by the same reaction torque, is measured via a
microphone [66]. In either case, the measured quantity is represented in Figure 27(a)
as the output of system, P, where P accounts for the coupling of 𝑇𝑒𝑚 to the measured
quantity as well as the system inherent to the sensor. The output of 𝑃 is fed back to
the controller and compared to a relevant reference and the output of the controller
will be the new torque reference. In Figure 27(b) the measured rotational velocity, 𝜔,
which is already available due to the use of the rotary encoder, is used as feedback
to the controller, such as was used in [67]. A reference rotational velocity, 𝜔𝑟𝑒𝑓
is
also input to the system and again the output is a torque reference.
A controller such as that shown in Figure 27 would require setup as well as tuning of
its parameters in order to work as desired. The bandwidth of the implemented
controller would limit the frequencies in the torque ripple that it is able to
compensate for and would need to be designed to have a bandwidth equal to or
greater than the motor controller, Gem, to maximise its usefulness. There would also
be an inherent delay with such a controller and its implementation would need to
include methods to reduce this delay.
If a microphone is used to create the feedback signal to the controller, additional
filtering may be needed so that frequencies not being produced by the torque ripple
are not passed to the controller. Failure to remove these frequencies may result in the
controller producing additional torque ripple harmonics in response to them. Any
such filtering would be difficult in the time domain if the motor rotational velocity is
allowed to vary as the time domain frequencies of torque ripple are multiples
fundamental frequency of the motors rotation. It is also worth noting that acoustic
emissions measured by the microphone will not contain any information about the
steady state torque. The reference to the controller would need to account for this of
no steady state torque would be produced and the motor would not turn. A reaction
torque sensor, especially one with an adequate bandwidth, could not easily be added
to a production PMSM if cost was a factor as such sensors are expensive.
Minimisation of torque ripple-induced acoustic emissions from permanent magnet synchronous motors
69
Whilst the effects of torque ripple are present in the motor’s rotational velocity at
lower rates of revolution, at higher rates they may not be present. The mechanical
system between motor torque and rotational velocity, shown in Figure 13, act as a
low pass filter. After a given frequency, based on the motor’s mechanical
characteristics, the magnitude of the torque ripple effect will be attenuated to the
point where it is no longer possible to remove torque ripple using the measured
rotational velocity as feedback. Because of the potential bandwidth limit imposed by
both the PI controller and the inertial of the mechanical system, closed loop feedback
control will not be investigated further as part of this research.
Adaptive feed forward compensation 4.4
Feed forward compensation is achieved by adding a compensation signal to the input
of a system in order to cancel a disturbance at its output. This is similar to
programmed reference current waveform control, except that the input, rather than
being predetermined and fixed, is updated over time based on measurements of the
output of the system. Many types of feed forward techniques exist and their used to
reduce torque ripple in PMSMs are well documented. These include but are not
limited to repetitive control [16-18], iterative learning control [19, 20, 27] and active
noise control [21, 22]. Other researchers have compared the effectiveness of these
various techniques [22, 68, 69] and whilst each may offer advantages in specific
application, they are all shown to be effective.
In [70] it is shown that the various forms of adaptive feed forward compensation can
be summarised as the cancellation of a sinusoidal disturbance at the output of a
system by the addition of the same frequency to the input. The magnitude and phase
of the sinusoid at the input are adjusted by a compensation method so that at the
output this sinusoid has the same magnitude but is 180° out of phase with the
disturbance such that they combine destructively and reduce the effect disturbance.
The summary is illustrated below in Figure 28.

Minimisation of torque ripple-induced acoustic emissions from permanent magnet synchronous motors
70
Figure 28. Adaptive feed forward cancellation [70]
In Figure 28, a linear, time invariant system has a disturbance, 𝑑(𝑡), added to input,
where 𝑑(𝑡) is of the form:
𝑑(𝑡) = 𝐴 sin(𝜔1𝑡 + 𝜙) = 𝑎1 cos(𝜔1𝑡) + 𝑏1 sin(𝜔1𝑡) 4-1
The effect of the disturbance on the output, 𝑦(𝑡), is compensated for by the addition
of a sine and a cosine function of the same frequency as the disturbance, 𝑑(𝑡). The
gains of these sinusoids, 𝑚1and 𝑚2 are adjusted such that 𝑢(𝑡) is equal to 𝑑(𝑡).
The approach outlined in Figure 28 can be applied to the input of the system shown
above in Figure 24. The result is shown below in Figure 29.
Figure 29. Adaptive feed forward compensation for Torque ripple

Minimisation of torque ripple-induced acoustic emissions from permanent magnet synchronous motors
71
In Figure 29 a sensor is used to measure the effect of the reaction torque on the
stator. The system block, P, represents the coupling of 𝑇𝑒𝑚 to the measured quantity
as well as the system inherent to the sensor, as it did in section 4.3. The measured
value, 𝑦(𝜃), is used by a parameter estimation method, along with the mechanical
position, 𝜃𝑚 , to adjust the values of the adaptive compensation block. The
parameters determined by the parameter estimation method are dependent on the
structure of the adaptive compensation block. The compensation signal, 𝑢(𝜃), is the
output from the adaptive compensation block and is subtracted from the torque
reference. The electromagnetic torque generated by the motor will be the torque
reference minus the compensation signal, as the transfer function of the block Gem is
assumed to be one as long as the input signal is within its bandwidth. The
compensation signal is effectively subtracted from the torque ripple at the output of
Gem. If the compensation signal contains the required frequencies, this should result
in complete cancellation of the torque ripple, before its effects are transferred
through P and on to 𝑦(𝜃).

Minimisation of torque ripple-induced acoustic emissions from permanent magnet synchronous motors
72
Determining the compensation signal 4.5
Regardless of the method used, adaptive feed forward compensation is achieved by
first sampling the output of the system and analysing the size and nature of the
disturbance present. The parameters determined by the parameter estimation method
are used to adjust the adaptive compensation block, which then generates a new input
to the system, designed to reduce the disturbance and the process is repeated. The
new output from the system should now contain less of the disturbance. If the
process is repeated, the disturbance present on the output should be further reduced
after each of the iterations until it is below an acceptable level.
Due to the time required to analyse the output and then generate the new input, a
delay exits between the compensator and the system. Depending on the causes of the
disturbance, the parameter estimation method may also need to account for all
possible frequencies within its bandwidth when creating the new input, further
complicating its design.
Advantages exist when applying such methods to the reduction of torque ripple from
PMSMs. Firstly, the disturbance caused by the torque ripple will be narrow band in
nature, just as the torque ripple is. Rather than an infinite range of frequencies, the
parameter estimation method need only deal with a finite number of frequencies. As
the cause of torque ripple can be linked to specific motor characteristics, as discussed
in chapter 3, these frequencies are know in advance of the design of the parameter
estimation method. A compensation signal, existing of a fixed number of set
frequencies, can be generated by a synthesizer, and added to the reference input to
the system. The chosen parameter estimation method needs only to determine the
magnitude and phase of each of these frequencies to be compensated and adjust the
synthesizer to produce the desired output.
The time delay required for deriving the parameters of the compensation signal can
affectively be removed by taking advantage of the repetitive nature of the torque
ripple. For any given mechanical rotation of the motor, the order of the torque ripple
components will not change. If the operating point of the motor is fixed, the
magnitude and phase of these components will also remain constant. This allows any
parameter estimation method to first measure the output for one or more revolutions

Minimisation of torque ripple-induced acoustic emissions from permanent magnet synchronous motors
73
of the motor, then over the time of a number of further revolutions, determine the
parameters of the compensation signal. The compensation signal can then be updated
and applied to the input in time to coincide with the beginning of a new revolution of
the motor.
The synthesizer, used to generate the compensation signal, as well as the parameter
estimation method can make use of the measured mechanical system of the motor.
All of the signals required for the compensation can be processed in the position
domain. This allows the parameter estimation method to be used at a number of
different operating points as the torque ripple is dependent on the position invariant
but time variant. A diagram of the proposed feed forward compensation scheme can
be seem below in Figure 30.
Figure 30. Position based feed forward compensation of torque ripple
Figure 30 is similar to Figure 29 with the addition of a synthesiser block. The
synthesiser generates the compensation signal, 𝑢(𝜃), which is a sum of sinusoids,
one for each frequency component of the torque ripple. The phase and magnitude for
each of these sinusoids is adjusted, once per update, by the parameter estimation
method.

Minimisation of torque ripple-induced acoustic emissions from permanent magnet synchronous motors
74
Use of order domain to simplify the system. 4.6
The compensation system can be further simplified by the use of the order domain
[71]. Analysis of periodic disturbances on rotating machines are often performed
after first collecting data based on the position of the rotor shaft and then performing
a fast Fourier transform (FFT) on these data [63]. This method, referred to as order
tracking analysis [51], creates a spectrum of the various harmonic components. An
FFT performed on data taken over a number of revolutions has the added effect of
filtering out short duration random noise that may occur at the same frequencies as
the torque ripple components.
If the output of the system is recorded at a number of discrete positions of the rotor,
this FFT is an approximation of the discrete time Fourier transform:
𝑋(ℎ) = ∑ 𝑥[𝑛]𝑒(−2𝜋𝑗𝑁
ℎ𝑛) for ℎ = 0,… , 𝑁 − 1
𝑁−1
𝑛=0
4-2
From the result, information about harmonics can be determined. If the original
signal contains a sinusoid that repeats an integer number of times per revolution of
the motor, such as those associated with torque ripple, then magnitude and phase
information about that sinusoid can be obtained from the order domain. The order of
a particular sinusoid is the same as the number of times it repeats per revolution of
the motor. From equation 4-2, 𝑋(ℎ) is a complex number representing the magnitude
and phase for a particular harmonic at order ℎ of the position based data 𝑥𝑛 (from a
sensor such as the torque sensor or microphone) and N is the number of samples.
As the torque ripple, 𝑇𝑟𝑖𝑝 , is of a known structure and contains waveforms of
particular orders, an order based approach can be used to determine a compensation
signal at these orders only. This is also of a benefit if 𝑇𝑟𝑒𝑓 does not contain any of
the same orders as 𝑇𝑟𝑖𝑝, as this removes the risk of the compensation signal removing
the desired torque along with the disturbance. The system can be redrawn with all of
the signals written as functions of ℎ, where ℎ is a particular order of interest.

Minimisation of torque ripple-induced acoustic emissions from permanent magnet synchronous motors
75
Figure 31. Order based closed loop compensation
The compensation signal, 𝑈(𝑘), is a single sinusoid of order ℎ with an amplitude and
phased tuned to approximate 𝑇𝑟𝑖𝑝(ℎ). The capitalisation of the compensation signal
and the measured signal is so as to further distinguish the order based versions from
their position based counterparts. Not yet taking into account how the parameter
estimation of the compensation system method tunes the synthesiser to develop
𝑈(ℎ), the following equations for the diagram can be written.
𝑇𝑒𝑚𝑖𝑑𝑒𝑎𝑙(ℎ) = Gem(ℎ) (𝑇
𝑟𝑒𝑓(ℎ) − 𝑈(ℎ)) 4-3
𝑌(ℎ) = 𝑃(ℎ) (𝑇𝑒𝑚𝑖𝑑𝑒𝑎𝑙(ℎ) + 𝑇𝑟𝑖𝑝(ℎ)) 4-4
where Gem(ℎ) is the transfer function of Gem at order ℎ and P(ℎ) is the transfer
function of P, again at order ℎ.
This becomes:
𝑌(ℎ) = P(ℎ) (Gem(ℎ) (𝑇𝑟𝑒𝑓(ℎ) − 𝑈(ℎ)) + 𝑇𝑟𝑖𝑝(ℎ)) 4-5
Assuming that the torque operating point is constant in time (𝑇𝑟𝑒𝑓 contains steady
state signals only) then for all ℎ > 0, 𝑇𝑟𝑒𝑓(ℎ) = 0. Additionally, as long as ℎ is

Minimisation of torque ripple-induced acoustic emissions from permanent magnet synchronous motors
76
within the bandwidth of the current controller, then the order can be compensated for
and Gem(ℎ) = 1. This simplifies equation 4-5 for ℎ > 0 to:
𝑌(ℎ) = P(ℎ)𝑇𝑟𝑖𝑝(ℎ) − P(ℎ)𝑈(ℎ) 4-6
If the compensation for a particular order is equal to the component of the torque
ripple at that order, then the measured torque output, at the same order, will be equal
to zero. In this way, it is possible to calculate the required compensation signal for
each of the unwanted orders in the torque ripple.
Chapter summary 4.7
In this chapter, control based approaches to reduce torque ripple were discussed. It
was shown that one group of these methods, adaptive feed forward compensation has
been effective. The approach used by the different forms of adaptive feed forward
control was shown to have a common form, which was then discussed in the context
of torque ripple reduction using the model of the PMSM developed in chapter 3. The
advantages gained from the repetitive nature of torque ripple were shown to simplify
the method, as was the order domain approach.

Minimisation of torque ripple-induced acoustic emissions from permanent magnet synchronous motors
77
5 Theory: Proposed methods for
determining the compensation system
parameters
In the previous review chapters, the cause of torque ripple created by permanent
magnet synchronous motors (PMSMs) was described. Chapter 2 outlined the
physical characteristics as well as the control of PMSMs. In chapter 3 it was shown
that unwanted fluctuations of the torque, torque ripple, are present on the torque
generated by PMSMs. The major causes of torque ripple were described as was the
concept that the torque ripple could couple through the mechanical system of the
motor, exciting the system and causes acoustic emissions. Chapter 4 outlined
previously published control based approaches for reducing torque ripple. The
advantages gained from the repetitive nature of torque ripple were shown to simplify
the method, as was the position based order domain approach.
In this chapter, a novel method for determining the required parameters of the
cancellation signal will be discussed. Adaptive feed forward compensation, detailed
in chapter 4, will be used along with the model of the PMSM developed in chapter 3.
It will be shown that reduction of the acoustic emissions produced by the torque
ripple can be achieved by first characterising the system through which the torque
ripple propagates. The system includes not only the propagation path of the torque
ripple and the generation of acoustic emissions, but also the sensor used to measure
the disturbance.
Approach 5.1
The approach used in this research to cancel dominant orders in the torque ripple-
induced acoustic emissions of a PMSM is based on the structure outlined in sections
4.4 to 4.6 and is shown again in Figure 32 below.

Minimisation of torque ripple-induced acoustic emissions from permanent magnet synchronous motors
78
Figure 32. Order based closed loop compensation
For each order to be reduced, a compensation signal of the same order, 𝑈(ℎ), is
subtracted from the torque reference, 𝑇𝑟𝑒𝑓(ℎ) and the difference is used as the input
to the motor controller, where ℎ denotes the order being cancelled. The resulting
electromagnetic torque produced by the motor, 𝑇𝑒𝑚(ℎ), is the sum of the unwanted
torque ripple, 𝑇𝑟𝑖𝑝(ℎ), and the electromagnetic torque created based on the reference
input to the controller, 𝑇𝑒𝑚𝑖𝑑𝑒𝑎𝑙(ℎ).
The electromagnetic torque, including torque ripple, acts on the motor system where
the torque ripple creates acoustic emissions which are measured by a sensor. The
system block P represents the coupling of the electromagnetic torque to the sensors
input as well as the sensor transfer function. The signal 𝑌(ℎ) is the output of the
sensor.
If the torque reference signal given to the motor controller does not contain a given
harmonic, ℎ, then for these orders we can write:
𝑇𝑟𝑒𝑓(ℎ) = 0 5-1
The following can now be written for the output of the sensor:
𝑌(ℎ) = P(ℎ)𝑇𝑟𝑖𝑝(ℎ) − P(ℎ)Gem(ℎ)𝑈(ℎ) 5-2

Minimisation of torque ripple-induced acoustic emissions from permanent magnet synchronous motors
79
The parameter estimation method used in this research involves identifying the
system that exists between 𝑈(ℎ) and 𝑌(ℎ). If this system can be approximated, then
𝑈(ℎ) can be chosen such that,
P(ℎ)𝑇𝑟𝑖𝑝(ℎ) ≈ P(ℎ)Gem(ℎ)𝑈(ℎ) 5-3
which will act to reduce the disturbance caused by torque ripple, and measured by
the sensor, for a given harmonic. Equation 5-2 effectively has two unknown values,
P(ℎ), and 𝑇𝑟𝑖𝑝(ℎ)/Gem(h), the value that mut be used for 𝑈(ℎ) in the equation so
that 𝑌(ℎ) = 0.
Parameter estimation of compensation system – two 5.2
step approach
The desired order based system identification, for a given order ℎ , can be
theoretically achieved by making two measurements of the output, 𝑌(ℎ), for two
different values of the input, 𝑈(ℎ). For each measurement, a subscript number will
be used to denote the measurement step such that the input 𝑈1(ℎ) results in the
measurement 𝑌1(ℎ) and 𝑈2(ℎ) in 𝑌2(ℎ).
First 𝑈1(ℎ) is set to zero and 𝑌1(ℎ) is measured for each of the orders to be reduced
by collecting data from the sensor over multiple revolutions of the motor and then
applying the fast Fourier transform (FFT) algorithm to the data. Magnitude and phase
information for each dominant harmonic can then be recorded. Since 𝑈1(ℎ) is equal
to zero, the measured values are due to the motor torque ripple, 𝑇𝑟𝑖𝑝(ℎ). By
collecting data over many revolutions, the FFT can be used to filter out random noise
that may occur at the orders of interest.
Next, an arbitrary value is assigned to 𝑈2(ℎ) for each order and 𝑌2(ℎ) measured in
the same way as before. The measured value, 𝑌2(ℎ), will now be influenced by both
the torque ripple of the motor and the additional torque ripple produced by 𝑈2(ℎ).
From these two measurement steps we can write the following:
Minimisation of torque ripple-induced acoustic emissions from permanent magnet synchronous motors
80
𝑌1(ℎ) = P(ℎ)𝑇𝑟𝑖𝑝(ℎ) − P(ℎ)Gem(ℎ)𝑈1(ℎ) and
𝑌2(ℎ) = P(ℎ)𝑇𝑟𝑖𝑝(ℎ) − P(ℎ)Gem(ℎ)𝑈2(ℎ) 5-4
These two equations could be solved by re-arranging and back substitution. Similarly
they can be arranged into matrix form:
[1 𝑈1(ℎ)
1 𝑈2(ℎ)] . [P(ℎ)𝑇𝑟𝑖𝑝(ℎ)
P(ℎ)Gem(ℎ)] = [
𝑌1(ℎ)
𝑌1(ℎ)] 5-5
Which can be solved to find the matrix:
[P(ℎ)𝑇𝑟𝑖𝑝(ℎ)
P(ℎ)Gem(ℎ)] 5-6
The above calculation step takes place while the motor is allowed to continue to
rotate with the previous settings. A number of revolutions may occur before a result
is computed. A value for the next input to the system, 𝑈3(ℎ) can now be found by
dividing the first element of this matrix by the second, resulting in:
𝑈3(ℎ) =
𝑇𝑟𝑖𝑝(ℎ)
Gem(ℎ) 5-7
given 𝑌3(ℎ) = P(ℎ)𝑇𝑟𝑖𝑝(ℎ) − P(ℎ)Gem(ℎ)𝑈3(ℎ)
then 𝑌3(ℎ) = P(ℎ)𝑇𝑟𝑖𝑝(ℎ) − P(ℎ)Gem(ℎ) ×
𝑇𝑟𝑖𝑝(ℎ)
Gem(ℎ) 5-8
In the previous chapter it was assumed that since the motor system was operating
within the bandwidth of the current controller, the value of Gem could be taken to be
equal to 1. As shown later in chapter 7, this is not the case and the current controller
provides some additional gain and phase change to the torque produced. Equation
5-8 shows that Gem does not affect the result and as long as 𝑈3(ℎ) is a good
approximation of 𝑇𝑟𝑖𝑝(ℎ) divided by Gem(ℎ) then the measured value, 𝑌3(ℎ) should
be approximately equal to zero.

Minimisation of torque ripple-induced acoustic emissions from permanent magnet synchronous motors
81
Proposed method for parameter estimation of the 5.3
compensation system
Building on information presented earlier in this chapter, a parameter estimation
method for the compensation system was developed. Two versions were tested, a
multi-step iterative approach, and a multi-step iterative approach with forgetting
factor. These two versions are detailed below.
5.3.1 Version 1 - multi-step iterative approach
Theoretically, the approach detailed above should result in the cancellation of the
torque ripple-induced acoustic emissions after 2 measurements. In practice, noise on
or inaccuracies of the measured value, 𝑌(ℎ), or other disturbances to the system
could result in a less than perfect estimation of the cancellation signal 𝑈(ℎ). Later in
chapter 7 it can be seen that in some situations, the initial estimate of the cancelation
signal results in a higher magnitude of the disturbance than was present without any
cancellation. Similar to the methods discussed in section 4.4, an iterative approach
can be used to produce a more accurate estimate. This approach is also outlined in a
paper written by this author [72].
Following on from the method outlined in section 5.2, the value determined for
𝑈3(ℎ) could be used as the input to the controlled and a corresponding measurement,
𝑌3(ℎ) made. This result, along with the results from the previous two steps could be
used to determine the next cancellation signal and the process repeated a number of
times. For a given step number, n, the next cancellation signal estimate, 𝑈𝑛+1(ℎ), can
be found by first constructing an equation similar to equation 5-5 but including all
previous cancellation signals and their corresponding measurements:
[ 1 𝑈1(ℎ)
1 𝑈2(ℎ)
| |
1 𝑈𝑛−1(ℎ)
1 𝑈𝑛(ℎ) ]
∙ [P(ℎ)𝑇𝑟𝑖𝑝(ℎ)
P(ℎ)Gem(ℎ)] =
[ 𝑌1(ℎ)𝑌2(ℎ)|
𝑌𝑛−1(ℎ)𝑌𝑛(ℎ) ]
5-9
The system is now over determined [73], there are now more equations than are
needed to find the solution. The above equation can be expressed in the following
form:

Minimisation of torque ripple-induced acoustic emissions from permanent magnet synchronous motors
82
𝐴𝑥 = 𝑏 5-10
where A is a non-square matrix with more rows than columns. Such an equation can
be solved for 𝑥, which in turn can be used to determine an estimate of the torque
ripple, by solving the normal equation sown below:
[𝐴𝑇𝐴]𝑥 = 𝐴𝑇𝑏 5-11
where 𝐴𝑇 is the transpose of matrix. The above equation could be solved using
methods such as Cholesky factorization or QR factorization [73] to produce a least
mean squares solution.
Once this matrix 𝑥 has been determined, the new cancellation signal, 𝑈𝑛+1(ℎ) can be
calculated by dividing the first element of the matrix, P(ℎ)𝑇𝑟𝑖𝑝(ℎ), by the second,
P(ℎ)Gem(ℎ). As stated above, each new signal is calculated based on a linear least
squares approach. By using an over determined set of equations and solving as
shown, the solution will be a matrix that “best fits” all of the available sets of
cancellation signals and their corresponding measurements hence minimising the
effects of random errors in the measurement.
The process is continued multiple times using all previous values measured to
calculate new cancellation signal estimates at each step. Later in chapter 7, 12 steps
are used to show this process. As each successive estimate becomes more accurate,
further reduction of the signal 𝑌(ℎ) should be observed.
5.3.2 Version 2 - multi-step iterative approach with forgetting factor
As the number of iterations for the parameter estimation method is increased, the
amount of system memory required also increases. Additionally, as the effects of
torque ripple are reduced, the invers matrix used to determine the next compensating
value will contain large numbers from the initial measurements and small values
from later measurements meaning that the matrix becomes ill conditioned, as
described in [73]. One solution to both problems would be to use only a finite
number of the most recent cancellation signals and their corresponding sensor values
to determine the next cancellation signal. An integer, 𝑞 , known as the forgetting

Minimisation of torque ripple-induced acoustic emissions from permanent magnet synchronous motors
83
factor could be chosen and input and output signals which occurred more than q
steps previous are not included in the current calculation..
Similar to equation 5-9, a system over determined equations, this time using the last
q equations, can be written in matrix form:
[ 1 𝑈𝑛−(𝑞−1)(ℎ)
1 𝑈𝑛−(𝑞−2)(ℎ)
| |
1 𝑈𝑛−1(ℎ)
1 𝑈𝑛(ℎ) ]
∙ [P(ℎ)𝑇𝑟𝑖𝑝(ℎ)
P(ℎ)Gem(ℎ)] =
[ 𝑌𝑛−(𝑞−1)(ℎ)
𝑌𝑛−(𝑞−2)(ℎ)
|𝑌𝑛−1(ℎ)𝑌𝑛(ℎ) ]
5-12
This equation is in the same form as equation 5-9 and can be solved the same way by
using methods such as Cholesky factorization or QR factorization. The next
cancellation signal, 𝑈𝑛+1(ℎ), can be found as before and the measurement 𝑌𝑛+1(ℎ)
recorded. For the next step, these new values and the q – 1 previous values yielding
the following equation:
[ 1 𝑈𝑛−(𝑞−2)(ℎ)
1 𝑈𝑛−(𝑞−3)(ℎ)
| |
1 𝑈𝑛(ℎ)
1 𝑈𝑛+1(ℎ) ]
∙ [P(ℎ)𝑇𝑟𝑖𝑝(ℎ)
P(ℎ)Gem(ℎ)] =
[ 𝑌𝑛−(𝑞−2)(ℎ)
𝑌𝑛−(𝑞−3)(ℎ)
|𝑌𝑛(ℎ)𝑌𝑛+1(ℎ) ]
5-13
The above equation can again be solved using factorization methods to obtain a
solution for the matrix containing P(ℎ)𝑇𝑟𝑖𝑝(ℎ) and P(ℎ)Gem(ℎ).
Chapter summary 5.4
In this chapter, a method of minimisation of torque ripple-induced acoustic emissions
base on the determination of system parameters has been discussed. The method
relies on the proposed structure developed in previous chapters. Two versions of a
proposed cancellation method, the multi-step iterative approach detailed in section
5.3.1 and the multi-step iterative approach with forgetting factor described in section
5.3.2 will be implemented and tested. The number of steps to be used by the second
of these two methods will be determined after initial testing.

Minimisation of torque ripple-induced acoustic emissions from permanent magnet synchronous motors
84

Minimisation of torque ripple-induced acoustic emissions from permanent magnet synchronous motors
85
6 Experimental setup
In the previous chapter, a method of reducing the torque ripple-induced acoustic
emissions from a permanent magnet synchronous motor (PMSM) was presented. In
order to test this method experimentally, the following was required:
A test motor coupled to a load.
Sensors, including an encoder for mechanical position and rotational velocity
information from the motor and a microphone to record the acoustic
emissions.
Electronics, including power electronics and a digital signal processor (DSP)
to control the motor, current sensors to provide feedback to the controller and
other data acquisition electronics.
Software, for the DSP in order to control the motor, to acquire and process
the data and to calculate the required compensation signal.
Most of the electronics chosen had already been developed and commissioned by
other researchers. An existing SIMULINK ™ program to control the motor was also
obtained and modified by the author to work with the cancellation method. The
motor test rig, the selection of sensors as well as the MATLABTM
and LABVIEWTM
programs used to sample data and perform the parameter estimation all constitute
original work as part of this research.

Minimisation of torque ripple-induced acoustic emissions from permanent magnet synchronous motors
86
Test rig 6.1
A commercially available axial flux PMSM was used in this research. The motor
was attached to a fan and installed in the fan housing. Additional load was required
to achieve the desired operating speeds at the required torque operating point
6.1.1 Motor
The motor is an axial flux motor with 10 pole-pairs (20 magnets in total) on the rotor
and 12 coils (four per electrical phase) arranged evenly around the 24 slots of the
stator. The motor was nominally a 0.75 kW motor and capable of producing 3 Nm of
torque. In general, the motor is capable of operating speeds of up to 3000 revolutions
per minute but was operated at significantly lower speed for this research (around
420 rpm or less, due to the bandwidth limit of the current controller. See section 7.3
for more details).
The expected orders of torque ripple present at the output of the test motor can be
determined from the characteristics of the motor, as outlined in chapter 3. Due to the
number magnets on the rotor as well as the number of slots on the stator, the test
motor should have cogging torque present on the 20th
and 24th
orders as well as
integer multiples of these orders. As the motor is a 20 pole motor (10 magnet pairs),
it exhibits 10 electrical cycles per mechanical cycle. Torque ripple due to current
measurement offset error should be present at the 10th
order (once per electrical
cycle) and torque ripple due to current measurement gain mismatch will be present at
the 20th
(twice per electrical cycle).
6.1.2 Fan and housing
Installing the motor in the fan housing, as seen in Figure 33, served two purposes.
Firstly, vibrations from the motor, including those created by torque ripple would in
turn cause the fan housing to vibrate and emit acoustic noise. Second, the fan applied
a load to the motor. As a torque controller was used in this research, the rotational
velocity of the motor would exceed the desired rate of 430 rpm or less, when even a
small steady state torque command was given to the motor controller without this
additional load.

Minimisation of torque ripple-induced acoustic emissions from permanent magnet synchronous motors
87
It was desired that the motor could be operated at up to 1.5 newton meter of torque
(half of the motors rated torque) and at a rotational velocity such that the frequency
of the 48th
harmonic was still within the bandwidth of the current controller. After
analysis (see section 7.3) it was found that this meant the rotational velocity should
be in the order of 7 Hz.
Figure 33. Motor installed in fan housing
6.1.3 Additional load
An additional load was required to further reduce the rotational velocity of the motor
for the desired range of torque inputs to the controller as the fan alone was not
sufficient. Typically, this fan and motor would operate at rotational velocities in the
order of 1000 to 1300 rmp. Due to the bandwidth limitations of the current
controller, it was not possible to operate at this velocity and still cancel the orders of
Motor
Eddy current break disc
Fan Housing
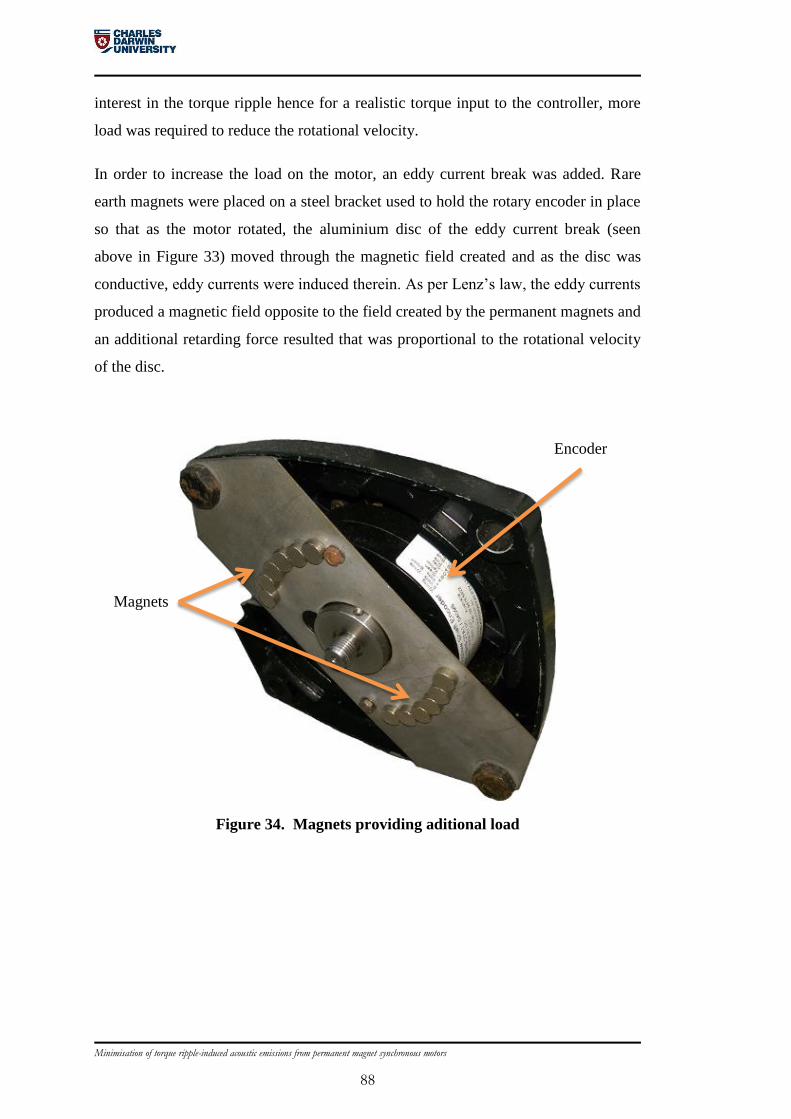
Minimisation of torque ripple-induced acoustic emissions from permanent magnet synchronous motors
88
interest in the torque ripple hence for a realistic torque input to the controller, more
load was required to reduce the rotational velocity.
In order to increase the load on the motor, an eddy current break was added. Rare
earth magnets were placed on a steel bracket used to hold the rotary encoder in place
so that as the motor rotated, the aluminium disc of the eddy current break (seen
above in Figure 33) moved through the magnetic field created and as the disc was
conductive, eddy currents were induced therein. As per Lenz’s law, the eddy currents
produced a magnetic field opposite to the field created by the permanent magnets and
an additional retarding force resulted that was proportional to the rotational velocity
of the disc.
Figure 34. Magnets providing aditional load
Magnets
Encoder

Minimisation of torque ripple-induced acoustic emissions from permanent magnet synchronous motors
89
Sensors 6.2
A number of sensors were used, both to control the motor and to measure the effect
of torque ripple on the motor system. A rotary encoder provided the position and
rotational velocity of the motor as well as to measure the effect of torque ripple on
the rotational velocity. A high quality microphone and amplifier was used to measure
acoustic emissions from the motor. For comparison, a low cost, commercially
available electret type microphone was also used.
6.2.1 Encoder
The encoder used in this research, an INHK 15HS 27A1/04096, is an incremental
encoder with 4096 counts per revolution. The encoder can be seen in Figure 34 and
provided a resolution of 8.79×10⁻²
degrees (mechanical) per encoder count. As there
were 10 pole pairs and hence 10 electrical cycles per mechanical cycle this gave a
resolution of 8.79×10⁻¹
degrees (electrical) per encoder count. Since the analysis of
torque ripple in this research was order based, sampling was driven by encoder
position. According to the Nyquist-Shannon sampling theorem this equated to a
sampling bandwidth of 2048 orders, however in order to reduce the need to pass the
signal through a low pass filter before sampling (in order to avoid aliasing), it is
preferable that the signal be over sampled for greater accuracy, as discussed in [74].
In this research, only torque ripples at the 48th
order or lower was considered, which
were well below this maximum to avoid aliasing.
6.2.2 High quality microphone
To measure the acoustic emissions of the PMSM as accurately as possible, a high
quality microphone was obtained. The microphone (a PCB Piezoelectronics (PCBP)
337B11 ½” pre-polarized pressure microphone) was supplied with a preamplifier
module (PCBP 426E01) ½” ICP preamplifier) and together they had a gain of
between +0.03 to -1.61 dB for a frequency range from 10 Hz to 12.6 kHz. Before
being sent to the signal distribution board, the voltage output from the preamplifier
was amplified further by a PCBP amplifier (model number 482A16) which was set to

Minimisation of torque ripple-induced acoustic emissions from permanent magnet synchronous motors
90
10 times gain. The signal was then passed to one of the analogue channels on the
signal distribution board.
6.2.3 Electret Microphone
A low cost, commercially available electret microphone and amplifier module was
used as a secondary measurement of acoustic emissions. The board, shown below in
Figure 35 is manufactured by Sparkfun [75]. It was chosen to test the proposed
cancellation methods described in chapter 5 using low cost hardware that could
easily be added to the control board of a commercial motor. Similar microphones, in
the quantities required for mass production, are expected to cost less than AUD$1.
This would represent a cost that is a fraction of a per cent of the cost of the high
quality microphone and preamplifier.
Figure 35. Electret microphone on breakout board [75]
The electret microphone signal was already large enough due to the on board
amplifier circuit to be sent directly to the second analogue channel of the signal
distribution board.

Minimisation of torque ripple-induced acoustic emissions from permanent magnet synchronous motors
91
Electronics for control and data acquisition 6.3
The various electronics required for control of the motor, as well as to acquire data,
are listed below. The DSP and power board were purchased and commissioned by
previous researchers and all of the other boards discussed in this section were
designed and constructed by other researchers prior to the commencement of this
work. As they were a proven functioning system, it was decided that they would be
adequate for the purposes of this research.
6.3.1 DSP and power board
Commercially available DPS and power boards were used to power and control the
motor. The DSP was a Texas Instruments TMS320F2812 and the power board is
Spectrum Digital DMC1500. An image of these two boards can be seen below in
Figure 36; the DSP board is in the top left corner.
Figure 36. DSP and power boards.

Minimisation of torque ripple-induced acoustic emissions from permanent magnet synchronous motors
92
The DSP board can be programmed by first constructing a model in SIMULINK,
compiled using a program supplied by the manufacturer, CODE COMPOSER, and
then loaded onto the DSP. While the program is running on the DSP it is possible to
update some values via a Texas Instruments data transfer protocol known as real time
data exchange (RTDX), enabling the noise cancelling routine to update the values for
the injected torque without the need to halt and recompile the program.
The DSP connects directly to the power board via a custom socket. The power board
incorporates the switching electronics, bus capacitor, power supply regulation, and
some signal routing including the encoder signals. The pulse width modulation
(PWM) module on the DSP sends signals to the gate driver chips, which in turn
switches the phases of the motor to either side of the bus voltage. The filtering effect
of the motors inductance means that as the duty cycle of the PWM signal changes, a
current will flow in the motor phase proportional to the change in duty cycle. A
variable voltage direct current supply is connected to the power board to supply
motor voltage.
Additional PMW outputs were used in testing, in order to output signals within the
SIMULINK program, such as the reference and measured quadrature currents, 𝑖𝑞𝑟𝑒𝑓
and 𝑖𝑞 (see section 7.3). These PWM signals, filter via a low pass, passive resistor
capacitor filter, could be input to the signal interface board and logged by the data
acquisition software.
6.3.2 Current sensing board
Current in each phase of the motor was measured and sent to the DSP via this board.
Conductors for each of the three electrical phases of the motor, connect from the
power board to the current sensor board and then to the motor. Current in each of the
three electrical phases pass through a hall-effect type current sensor, LTSR6-NP
made by LEM. As discussed in section 2.3.2, only the current in two phase is
required to control the motor, however this board enable measurement of all three
phase currents should the data be required. The output from the LEM LTSR6-NP is a
voltage that proportional to the current flowing through it. The voltage signal is
conditioned by and operational amplifier circuit before being passed to the analogue

Minimisation of torque ripple-induced acoustic emissions from permanent magnet synchronous motors
93
to digital converter of the DSP. The LEM LTSR6-NP current sensors were used on
this board. These current sensors have a measurement range of ±25A with accuracy
over this range of 0.7% and a bandwidth of 100 kHz (-0.5dB).
6.3.3 Signal interface board
This signal interface board connects the sensors to the Labview acquisition board.
The analogue signals from two sensors as well as the encoder are routed through this
board. The signals from the encoder are also routed out of this board to the DSP.
6.3.4 Data acquisition board
Data acquisition was performed via Labview and a DAC-MX card. Two analogue
signals from the signal distribution board, as well as the relative position of the
encoder were sampled by the data acquisition board.

Minimisation of torque ripple-induced acoustic emissions from permanent magnet synchronous motors
94
Software 6.4
Three separate programs were required to control the motor, acquire data from the
various sensors and to process the data in order to calculate the compensation signal.
The LABVIEW and MATLAB programs detailed below were developed by the
author while and existing SIMULINK program was further modified for used in this
research.
6.4.1 LABVIEW – data acquisition
Data acquisition was performed via a LABVIEW program that accessed the DAC-
MX card. Data from the high quality microphone and the electret microphone were
sampled once per encoder increment. The relative position of the encoder and the
time between each sample were also recorded. Data from a number of revolutions at
a time were recorded sequentially in a single file.
The recorded file is comprised of five columns of data. The first is the relative
encoder position, the second it the time that the sample was taken. The third and
fourth columns are the samples from the two analogue signals from the signal
distribution board. The fifth column is the rotational velocity, in revolutions per
second, calculated by the LABVIEW program using data from the first two columns.
Prior to sampling, the system was initialised at the index of the encoder meaning that
the data began at position zero of the encoder. The recording of data by Labview was
triggered by a program running in Matlab. The recorded data is a text file with 4
columns, position, time, sensor 1 (the torque sensor) and sensor 2.
The LABVIEW program process the data it acquires and displays the position based
data for all of the signals as well as the order based spectrum for the two sensor
signals and the rotational velocity. The spectra processed by LABVIEW were not
recorded but by displaying this information as the parameter estimation method was
running, it was possible to monitor the progress of the MATLAB program as it ran.
A screen capture of the program can be seen below in Figure 37.

Minimisation of torque ripple-induced acoustic emissions from permanent magnet synchronous motors
95
Figure 37. LABVIEW program screen capture
6.4.2 MATLAB – data processing and parameter estimation
method
The proposed parameter estimation method, discussed later in section 5, was
implemented in a MATLAB program that ran simultaneous to the data sampling
program on LABVIEW. For each iteration of the parameter estimation method,
MATLAB triggered the LABVIEW program to record a file of position based data,
as discussed above. The MATLAB program performs a position based FFT on the
data, converting it to the order domain. The magnitude and phase of a number of
orders were processed, as discussed in Chapter 5 and the magnitude and phase of the
required compensation signal at those orders estimated. The MATLAB program then
sends a signal for the magnitude and phase for the compensation signals to the motor
controller running on the DSP via the RTDX interface.
As part of this program, MATLAB is used to find the solution for an over
determined system of equations, as discussed in sections 5.3 and 5.3.2. In order to do

Minimisation of torque ripple-induced acoustic emissions from permanent magnet synchronous motors
96
this, the MATAB left divide operator, \, was used. Starting with the matrix equation
shown below:
𝐴𝑥 = 𝑏 6-1
a solution for 𝑥 can be found in MATLAB with the following:
𝑥 = 𝐴\𝑏 6-2
When the matrix 𝐴 is a non-square matrix, as in this case, a least squares solution is
obtained using QR factorization [73].
This program can be configured to use information obtained from either of the two
sampled analogue signals or the rotational velocity data as the measured data to be
compensated. As the other two sets of data are also recorded by MATLAB, it is
possible to observe the effect on these as the first is used to determine the parameters
of the compensation signal. A copy of the MATLAB files for the two versions of the
program used can be found in appendix 1.
6.4.1 SIMULINK – motor control
The Simulink model used to control the motor was based on one already
implemented by other researchers and further modified by the author. It was
constructed to implement field oriented control, as described in section 2.4. The
model was built using standard blocks available in Simulink and suitable for the
DSP. The Simulink model contains two proportional/integral (PI) controllers that
required configuration to enable control of the test motor. These PI controllers were
tuned using the second Zeigler Nichols method.
To properly configure the controller, the torque constant (see section 2.3.4) needed to
be determined experimentally from the back-electro motive force (back-EMF) as
described in section 7.1. The same experiment enables the offset between the
measured position from the controller and the relative position of the motor with
respect to the back-EMF to be calculated and applied to the controller. This means
that the effective measured position is the same as the motor relative position as
Minimisation of torque ripple-induced acoustic emissions from permanent magnet synchronous motors
97
described in equations 2-10 and 2-11. The result was a torque controller with a
bandwidth of approximately 1390 Hz (see section 7.3).
Two version of the Simulink program were developed by the author for this research.
The first, constructed to test the function of the controller, had a functional block that
would generate a sinusoid (cosine) with h cycles per revolution of the motor where h
is the desired order. The output of this block is added to the reference torque. The
cosine block is driven from the position data of the controller and 3 inputs, one each
for magnitude, phase and order. Each of these three inputs are provided to the
controller from the MATLAB program via RTDX. This version also permits the
connection of internal signals to the secondary PWM output of the DSP so that they
can be recorded using the data acquisition program.
The second version developed for this research was used in conjunction with the
proposed cancellation method. This version contains five cosine blocks, similar to
the one described above, with the output of all five added to the reference torque
signal. The order input to each block is fixed so as correspond to an order in the
torque ripple which was to be reduced (in this case the 10th
, 20th
, 24th
, 40th
and 48th
).
The magnitude and phase of each of the cosine blocks is updated once per iteration
of the cancellation method running on MATLAB via the RTDX interface.
Chapter summary 6.5
In this chapter, the experimental setup required to test the cancellation method has
been described. The cancellation method, described in chapter 5, is implemented as a
program running on MATLAB. Data required for the method is obtained from
signals routed via the signal distribution board and acquired using LABVIEW
software and hardware. The motor is controlled by a SIMULINK program that has
been compiled and run on the DSP, which in turn provides the signals required by
the power boards to apply the required voltage to each of the electrical phases of the
motor. Current in each phase is measured via the current sensor board. The program
running on MATLAB is able to update the magnitude and phase of each order of the
cancellation signal, generated in the motor controller, via the RTDX interface.

Minimisation of torque ripple-induced acoustic emissions from permanent magnet synchronous motors
98
In the following chapter various experiments are described and the results discussed.
These experiments first confirm the operation of the controller and the effect of
torque ripple on the acoustic emissions. Later, experiments that test the proposed
cancellation method are discussed.

Minimisation of torque ripple-induced acoustic emissions from permanent magnet synchronous motors
99
7 Experiments
In chapters 2 and 3, the control of permanent magnet synchronous motors (PMSMs)
was discussed as well as the creation of torque ripple and associated acoustic
emissions. In these chapters, assumptions about the bandwidth of the current
controller and the sinusoidal nature of the back-Electro Motive Force (back-EMF)
were made. In chapter 5, a method of reducing the torque ripple-induced acoustic
emissions from a PMSM was presented and, in chapter 0, the experimental setup
used for this research was described.
In this chapter various experiments are described and the results discussed. These
experiments first check that assumptions made in chapters 2 and 3 about the
operation of the controller and the effect of torque ripple on the acoustic emissions
are correct. Thereafter, experiments that test the proposed cancellation methods are
discussed.
Sinusoidal nature of the back-EMF 7.1
As discussed in chapter 2, the setup of field oriented control (FOC) required the
torque constant of the motor to be determined as well as an offset between measured
position and motor relative position to be determined. This is achieved by rotating
the motor to be tested via an external mechanical source and measuring the phase to
phase voltage.
The test rig used in this research was equipped with an aluminium pulley directly
coupled to the rotor shaft of the motor. A drive belt was used to couple this pulley to
a second motor which was energised so that the test motor rotated at approximately 3
revolutions per second. The phase to phase voltages were recorded and processed to
determine the per-phase back-EMF, from which the per-phase, speed normalised
back-EMF constant for the test motor could be determined (in volt seconds per

Minimisation of torque ripple-induced acoustic emissions from permanent magnet synchronous motors
100
radian). This constant is identical to the torque constant, 𝐾𝑇 (in newton metres per
amp).
Analysis of the per-phase back-EMF was performed to test the assumption that the
back-EMF of the test motor was sinusoidal and hence did not contribute to the
creation of torque ripple. Figure 38 below shows the per-phase back-EMF, for each
of the three electrical phases, recorded for one revolution of the motor.
Figure 38. Per-phase back-EMF for one rotation of the motor
As can be seen in Figure 38, the per-phase back-EMF appears to be sinusoidal, with
10 cycles per revolution. However the magnitude measured in each phase appears to
vary over the span of one revolution. This indicated to possible presence of
additional frequencies, a better form of analysis is the order based spectrum as shown
below in Figure 39 which shows the order based spectrum of the per-phase back-
EMF of all three electrical phases on the same plot.

Minimisation of torque ripple-induced acoustic emissions from permanent magnet synchronous motors
101
Figure 39. Spectra of per-phase back-EMF
The data lines from all three electrical phases stack almost exactly which implies that
the magnitudes of the various sinusoidal components of the back-EMF are
approximately equal. A peak of approximately 4 volts can be seen in the figure at the
10th
order, which is expected based on the fact that the back-EMF has 10 cycles per
revolution. A second, much smaller peak can be observed at the 14th
order.
Magnitude data from 2048 orders was calculated by a fast Fourier transform (FFT),
however, as the magnitude of all but the two orders mentioned was approximately
zero, only the first 50 orders are displayed in the figure for clarity.
The presence of a non-zero magnitude at the 14th
goes towards explaining the
difference in the position based magnitudes of the per-phase back-EMFs in Figure
38. The magnitude of the 14th
order is approximately of 1% of that of the 10th
and as
such could only account for a torque ripple in the same order compared to the torque
set point. For the set points used later in this chapter (0.8 Nm and 1.5 Nm), this does
not represent a large magnitude. Due to interactions with the per-phase current,
which oscillates 10 times per motor revolution, a component of the 14th
order of the
back-EMF would create torque ripple that occurred 24 times per revolution (at the
24th
order). As cogging torque also contains a component at the 24th
order, any

Minimisation of torque ripple-induced acoustic emissions from permanent magnet synchronous motors
102
additional torque ripple that may be present at this harmonic will be cancelled, along
with that of the cogging torque, by the proposed method.
Measurement of torque ripple and acoustic emissions 7.2
The similarities between the spectra of torque ripple and measured noise were
discussed in section 3.7 however no analysis was done to confirm that the acoustic
emissions were in fact caused by the torque ripple and not some other disturbance on
the motor and frame with the same order components. As the test rig used did not
include a torque sensor, it was not possible to compare torque ripple directly with the
observed acoustic emissions. Rotational velocity information was present and as
rotational velocity is a direct product of the torque applied to the mechanical system
of the motor (see Figure 13), all possible sources of torque ripple are observable in
the rotational velocity of the motor [71].
7.2.1 Spectra
The motor was run with a reference torque of 0.8 Nm (about 27% of the rated torque
of the motor) which resulted in an average rotational velocity 4.7 revolution per
second (RPS). No compensation signal was applied and the rotational velocities as
well as the signals from both microphones were recorded once per encoder count for
32 revolutions. Each of the three signals were processed by a FFT and order based
spectra determined. The first 50 orders of these spectra are shown below in Figure
40, Figure 41 and Figure 42.

Minimisation of torque ripple-induced acoustic emissions from permanent magnet synchronous motors
103
Figure 40. Spectrum of rotational velocity
In Figure 40 the spectrum derived from the rotational velocity signal is shown. peaks
can be seen at a number of orders, including those associated with the expected
torque ripple of the motor, the 10th
, 20th
, 24th
, 40th
and 48th (see section 6.1.1),
however the peak at the 40th
order is of lower magnitude than the others.
Figure 41. Spectrum of high quality microphone signal

Minimisation of torque ripple-induced acoustic emissions from permanent magnet synchronous motors
104
In Figure 41 the spectrum derived from the high quality microphone signal is shown.
Peaks can be seen at the 10th
, 20th
, 24th
and 48th
orders. The 40th
order, which was
already small in the rotational velocity spectrum, is not clearly visible above the
background noise in this spectrum.
Figure 42. Spectrum of electret microphone signal
The spectrum derived from the electret microphone signal is shown above in Figure
42. As with the previous spectrum, peaks are present at the 10th
, 20th
, 24th
and 48th
orders, while the response at the 40th
is negligible.
In all three spectra, a response can be observed at peaks of the orders associated with
torque ripple. The peaks from the rotational velocity, which is derived from the
electromagnetic torque acting on the rotor, are caused by the torque ripple. While the
peaks in the spectra derived from the microphone signals occur at the same orders as
the torque ripple, this in not necessarily an indication that the response is caused by
the torque ripple and not another disturbance that occurs at the same integer multiple
of the rotational velocity. A measurement of the relationship between the ripple on
the rotational velocity at a given order, and the microphone signal at the same order,
is the coherence of the signal.

Minimisation of torque ripple-induced acoustic emissions from permanent magnet synchronous motors
105
7.2.2 Coherence of signals
The coherence, as described in [51] (page 230), “gives a measurement of the degree
of linear dependence between the two signals, as a function of frequency”. As the
signals derived above are measured per encoder count rather than time based, the
coherence can instead be calculated for these signals as a function of order. The
formula for coherence, 𝛾2(ℎ), is:
𝛾2(ℎ) =
|𝐺𝐴𝐵(ℎ)|2
𝐺𝐴𝐴(ℎ). 𝐺𝐵𝐵(ℎ) 7-1
where 𝐺𝐴𝐵(ℎ) is the cross spectrum of signals A and B, 𝐺𝐴𝐴(ℎ) and 𝐺𝐵𝐵(ℎ) are the
autospectra of signal A and signal B respectively. The resulting coherence for a given
order will be a dimensionless number such that: 0 ≤ 𝛾2 ≤ 1. A coherence close to
one, at a given order, suggests that there is a largely linear relationship between the
two signals at that order.
The coherence calculation for this research was performed using the built in
MATLAB command mscohere, which finds the coherence using Welch's averaged
modified periodogram method. The coherence, between the rotational velocity and
the high quality microphone signal discussed above, was calculated and the results
for the first 50 orders are shown below in Figure 43.
Figure 43. Coherence of rotational velocity to high quality microphone signal

Minimisation of torque ripple-induced acoustic emissions from permanent magnet synchronous motors
106
In Figure 43 the coherence between the two signals has clear peaks, above 0.8,
including at some of the orders associated with the torque ripple. At the 10th
order,
the coherence is above 0.9 and at the 20th
and 24th
orders; the result is almost 1.These
results suggest a linear relationship between ripple on the rotational velocity and the
response on the microphone signal at these orders and therefore between torque
ripple and the microphone signal. At the 48th
order, the coherence is approximately
0.85 which suggests that while there is some linear relationship at this order, there is
an additional component on one of the signals that cannot be explained by the other
signal. The coherence at the 40th
order is approximately 0.1, this is a result of the
absence of a peak at the 40th
order in the high quality microphone spectrum as seen
in Figure 41.
The coherence between the rotational velocity and signal from the electret
microphone was also calculated and the results for the first 50 orders shown below in
Figure 44.
Figure 44. Coherence of rotational velocity to electret microphone signal
The results seen in Figure 44 are similar to the previous analysis. The coherence
between the two signals has clear peaks, above 0.8, including at some of the orders
associated with the torque ripple. At the 10th
order, the coherence is approximately

Minimisation of torque ripple-induced acoustic emissions from permanent magnet synchronous motors
107
0.95 and at the 20th
and 24th
orders; the result is almost 1. Again these results suggest
a linear relationship between ripple on the rotational velocity and the response on the
microphone signal at these orders and therefore between torque ripple and the
electret microphone signal. At the 48th
order, the coherence is approximately 0.9. A
similar result for the coherence at the 40th
order, approximately 0.1, is again a result
of the absence of a peak at the 40th
order in the electret microphone spectrum as seen
in Figure 42.
7.2.3 Compensating orders and set point
While the suggested parameter estimation method is potentially capable of
minimising several orders at once, for the purposes of demonstrating this method,
only the first 3 orders of torque ripple will be used. Since the 10th
and part of the 20th
orders are caused by current measurement error and the rest of the 20th
as well as all
of the 24th
are caused by cogging torque, they are representative of the various types
of torque ripple present and will be the orders of interest for further analysis.
Additionally coherence of close to one can be calculated at all three orders between
the rotational velocity and the signal from both microphones hence the acoustic
emissions at these orders are likely caused entirely by torque ripple.
The magnitude of the torque ripple at the 24th
order and the rotational velocity of the
motor will change depending on the magnitude of the reference torque signal. As
such, the parameter estimation method will be tested at two set points; one where the
torque reference signal will be set to 0.8 Nm and the other at 1.5 Nm. The first set
point results in an average rotational velocity of 4.7 RPS and the second set point 7.1
RPS.
7.2.4 Peaks at other orders
In Figure 40 above, peaks can be seen at a number of orders with magnitudes as large
as those of the orders of interest described in chapter 3. the most notable of these
occurs at the 21st order. Peaks can be observed at the same orders, albeit of lower
relative magnitude, in Figure 41 and Figure 42. The causes for these additional peaks

Minimisation of torque ripple-induced acoustic emissions from permanent magnet synchronous motors
108
is described in [9]. These additional peaks could potentially be compensated for in
the same manner as the orders of interest as future work but for the purposes of this
research no attempt will be made to compensate for any order other than those
specified in the previous section.
Current Controller 7.3
In order to measure the bandwidth of the current controller, the first of the two
SIMULINK programs described in section 6.4.1 was used. This version of the motor
control program allows magnitude and order information for a single cosine block to
be passed from MATLAB to the digital signal processor (DSP) via the real time data
exchange (RTDX) interface. The output from this cosine block is added to the
reference torque signal inside the motor controller. This allowed the construction of a
MATLAB program which was able to apply an additional sinusoidal signal to the
reference torque and measure the response via the data acquisition hardware and
software detailed in the previous chapter.
The motor controller was given a torque reference of 1.5 Nm which due to the
applied mechanical load, cause the motor to rotate at approximately 7.1 revolutions
per second (7.1 Hz). The MATLAB program sent the command to add a cosine to
this reference torque, with fixed amplitude and varying order starting at the 3rd
order
and then increasing by 2 orders each iteration until sufficient data points were taken.
This meant that only odd orders were tested and any orders containing the dominant
torque ripple, which were all even, were avoided.
To test the bandwidth of the current controller, the internal signals for the reference
quadrature current, 𝑖𝑞𝑟𝑒𝑓
, and the motor quadrature current, 𝑖𝑞 , were passed to the
secondary pulse width modulation (PWM) module of the DSP. These signals could
then be filtered and recorded as discussed in section 6.3.1.
For each iteration of the MATLAB program, the two current signals were recorded,
once per encoder count, for 16 revolutions of the motor. Both current signals were
then processed by a FFT and the magnitude and phase for the test order was recorded
for each signal. The gain of the current controller was calculated at each order by

Minimisation of torque ripple-induced acoustic emissions from permanent magnet synchronous motors
109
dividing the magnitude of 𝑖𝑞 by the magnitude of 𝑖𝑞𝑟𝑒𝑓
and the phase of the current
controller as the difference between the phases of the two currents. The magnitude
and phase of the current controller are shown below in Figure 45 and Figure 46. Both
are plotted verses frequency where the frequency value was determined by
multiplying the order being tested by the average frequency of rotation of the motor
for the 16 revolutions of recorded data.
Figure 45. Magnitude of current controller
Figure 46. Phase of current controller

Minimisation of torque ripple-induced acoustic emissions from permanent magnet synchronous motors
110
In Figure 45 the magnitude of the current controller can be seen to stat very close to
zero decibels (dB) at the lowest frequencies and increases along with the frequency
until it reaches a peak of 6.45 dB at about 692 Hz. The gain then decreases as
frequency decreases, reaching -3 dB at about 1392 Hz, the bandwidth of the
controller. The phase of the current controller, shown in Figure 46, starts at
approximately 0° at the lowest frequency and then decreases further as the frequency
increases, passing through -90° at about 692 Hz, the same frequency at the peak
value of the gain.
At the highest rotational velocity to be tested, 7.1 RPS, the 24th
order would occur at
approximately 170 Hz. At this and lower frequencies, the gain of the current
controller is 1 dB or less. There will be a phase change at the output of the current
controller of -9° or less for frequencies equal to or less than 170 Hz.
Linearity of system 7.4
In order for the parameter estimation method discussed in chapter 5 to operate as
described, it is necessary that the relationship between the compensation signal for a
given order, 𝑈(ℎ), has a linear relationship to its corresponding measured output,
𝑌(ℎ) . The linearity of the system between these two signals was determined
experimentally as part of this research. The reference torque signal sent to the
controller for this experiment was 0.17 Nm, which resulted in a motor rotational
velocity of approximately 0.58 RPS.
Using similar MATLAB and SIMULINK programs to those in the previous section,
an additional cosine component was added to the torque reference signal. Rather than
varying the order of this additional component, the order was set at 15 (as no torque
ripple is present at this order), and the amplitude varied at each step. The amplitude
was varied from 0 to 0.1 Nm, in steps of 0.01 Nm. At each amplitude, the rotational
velocity and the reference current, 𝑖𝑞, were recorded, once per encoder count, for 16
revolution of the motor and processed by a FFT. The magnitude of the 15th
order of
both signals were compared as shown below in Figure 47 where the reference current

Minimisation of torque ripple-induced acoustic emissions from permanent magnet synchronous motors
111
represents the input to the system and the rotational velocity the output. Linear
regression was applied to the data and displayed on the same plot.
Figure 47. Linearity of rotational velocity at the 15th
order to current command
at 15th
order
In Figure 47, the magnitude of measured reference current at the 15th
order is shown
as the x-axis while the resulting rotational velocity magnitude, also at the 15th
order
is indicated by the points on the plot. The dashed line represents the line of best fit
determined by linear regression. As can be seen in the above figure, a strong linear
relationship exists between the input and output. The line of best fit has a coefficient
of determination (r2) of 0.9992 (shown on the plot as r2) which indicates a good fit of
the data sets to the linear model, which has a slope and intercept shown on the plot as
m and c respectively.
7.4.1 Second order effects
The proposed parameter estimation method works by adding sinusoidal components
to the torque reference, and hence the reference current. As torque ripple caused by
gain mismatch error is proportional to the quadrature current, 𝑖𝑞 (see section 3.2), the
addition of these sinusoids to 𝑖𝑞 may cause torque ripple at orders equal to the 20th

Minimisation of torque ripple-induced acoustic emissions from permanent magnet synchronous motors
112
(from gain mismatch error) plus the order of the compensation order. While the
potential magnitude of these second order effects were assumed to be of a much
smaller amplitude than the torque ripple to be cancelled, the experiment shown above
to test the linearity of the system provided an opportunity to test for their presence.
Since the signal of the 15th
order was used to test the linearity, this signal would
combine with the gain mismatch error to create and additional torque ripple at the
35th
order. As the above experiment was conducted, the magnitude of the 35th
order
was also calculated. The result was plotted against the reference current at the 15th
order and the result shown below in Figure 48. Linear regression was applied to the
data to get an indication of the linearity.
Figure 48. Linearity of rotational velocity at the 35th
order to current command
at 15th
order
In Figure 48, the magnitude of the reference current signal at the 15th
order is shown
along the x-axis while the corresponding magnitude of the rotational velocity at the
35th
order is shown as data point on the plot. The dashed line represents the line of
bets fit calculated via linear regression. The result of the linear regression this time
yielded a coefficient of determination of about 0.61, meaning that only about 61% of
the variability of the data can be explained by the liner model [73](page 298), the rest
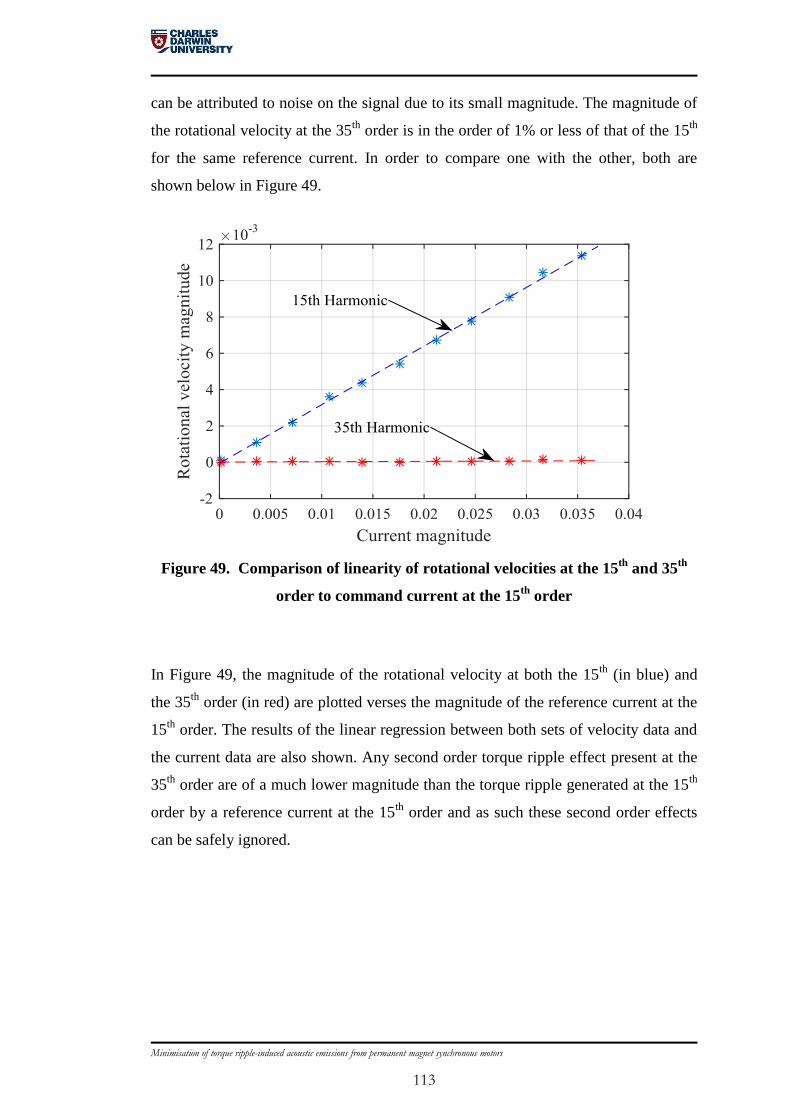
Minimisation of torque ripple-induced acoustic emissions from permanent magnet synchronous motors
113
can be attributed to noise on the signal due to its small magnitude. The magnitude of
the rotational velocity at the 35th
order is in the order of 1% or less of that of the 15th
for the same reference current. In order to compare one with the other, both are
shown below in Figure 49.
Figure 49. Comparison of linearity of rotational velocities at the 15th
and 35th
order to command current at the 15th
order
In Figure 49, the magnitude of the rotational velocity at both the 15th
(in blue) and
the 35th
order (in red) are plotted verses the magnitude of the reference current at the
15th
order. The results of the linear regression between both sets of velocity data and
the current data are also shown. Any second order torque ripple effect present at the
35th
order are of a much lower magnitude than the torque ripple generated at the 15th
order by a reference current at the 15th
order and as such these second order effects
can be safely ignored.

Minimisation of torque ripple-induced acoustic emissions from permanent magnet synchronous motors
114
Test of parameter estimation method 7.5
A number of experiments were conducted to test the effectiveness of the proposed
parameter estimation method. Both microphones were placed approximately two
centimetres away from the fan housing and positioned so that a clear responses were
seen on the data acquisition software display. The position was then maintained for
all of the tests. At each step of the parameter estimation method, the rotational
velocity and the signals from both microphones recorded once per encoder count for
16 revolution of the motor. Sufficient time was given between each step so that the
effect of a new compensation signal could reach a steady state before new data was
recorded.
The parameter estimation method was allowed to run for 12 steps for each test. Step
1 involves the measurement of the signal 𝑌(ℎ) when the compensation signal, 𝑈(ℎ)
is zero for all orders. In step 2, a predefined value was applied to the compensation
signal, 𝑈(ℎ) and the new 𝑌(ℎ) measured. The magnitude of the selected values was
in the order of 0.1-0.01% of the maximum rated torque of the motor (3 newton
meter) and were chosen based on preliminary testing of the method. The phases were
chosen such that no two orders had the same phase offset. For steps 3 to 12, the
compensation signal was determined by the cancellation method and applied to the
controller and the resulting 𝑌(ℎ) measured.
7.5.1 Test 1 – Compensation using rotational velocity
For the first test, the rotational velocity was used as the measured value, 𝑌(ℎ), and
the compensation signal was determined using all previous values of 𝑌(ℎ) and 𝑈(ℎ)
as per the multi-step iterative approach (without forgetting factor), as described in
section 5.3.1. Rotational velocity was chosen for the first test as unlike the transfer
function between torque ripple and acoustic noise which is unknown and potentially
complex, the transfer function between electromagnetic torque and rotational
velocity is that of the mechanical system of the motor shown in previous chapters as
1/(𝐽𝑠 + 𝑏).
The torque reference was set to 0.8 Nm and an average rotational velocity of 4.7 RPS
was observed. The measured rotational velocity before any compensation was

Minimisation of torque ripple-induced acoustic emissions from permanent magnet synchronous motors
115
compared to the rotational velocity after 12 steps and the plot of the order-based
spectra between the 8th
and 25th
order can be seen below in Figure 50.
Figure 50. Rotational velocity spectrum before and after compensation using
rotational velocity as feedback
It can be seen in Figure 50 that the magnitude of the 10th
, 20th
and 24th
orders of the
rotational velocity were greatly reduced by the parameter estimation method; over
99% reduction for the 10th
and 24th
and over 97% for the 20th
order. The magnitudes
of each order before and after reduction, as well as the percentage of reduction of the
original signal are seen below in Table 1.

Minimisation of torque ripple-induced acoustic emissions from permanent magnet synchronous motors
116
Table 1. Reduction in rotational velocity orders
Order
Magnitude before
(RPS)
Magnitude after
(RPS) Percentage reduction
10th
1.993E-3 1.01E-5 99.5%
20th
6.113E-3 1.48E-4 97.6%
24th
8.926E-3 4.94E-5 99.4%
This method of calculating the compensation signal to reduce the peaks in the
rotational velocity is shown to be very effective. The magnitudes of all three orders
were measured for each step of the test so that the rate of reduction in the orders
could be observed. Figure 51 below shows a plot of the resulting magnitudes.
Figure 51. Magnitudes per step of rotational velocity based compensation
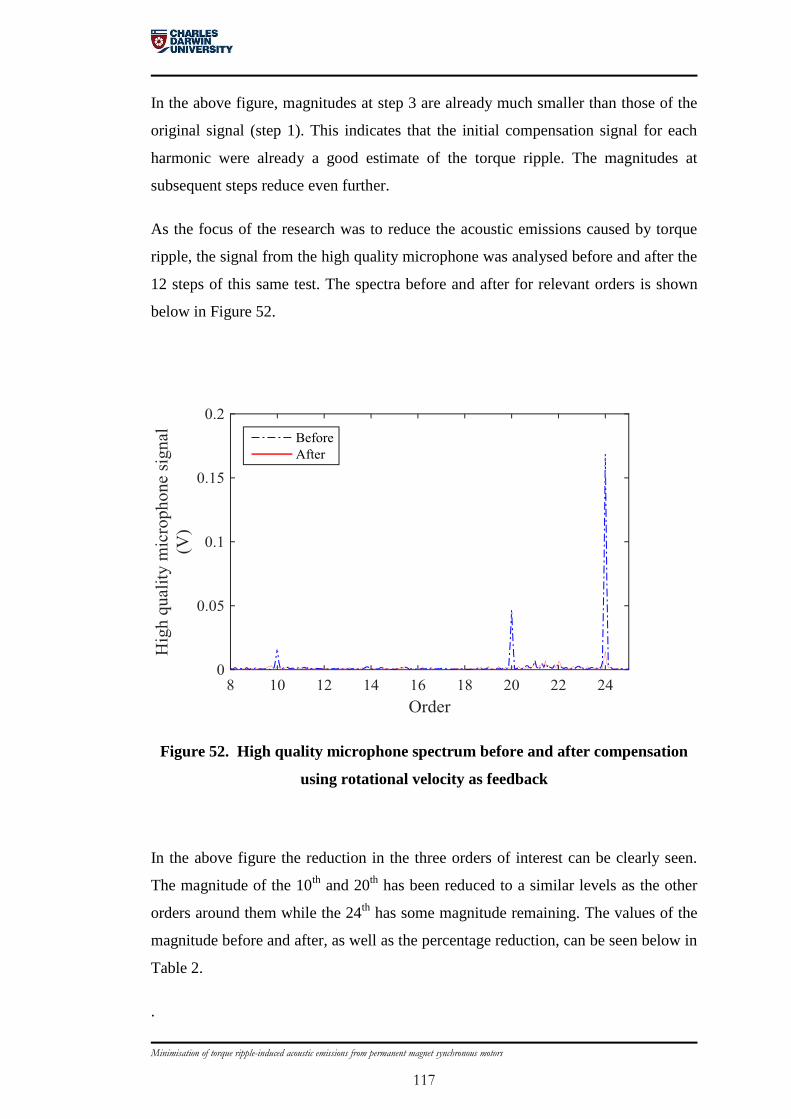
Minimisation of torque ripple-induced acoustic emissions from permanent magnet synchronous motors
117
In the above figure, magnitudes at step 3 are already much smaller than those of the
original signal (step 1). This indicates that the initial compensation signal for each
harmonic were already a good estimate of the torque ripple. The magnitudes at
subsequent steps reduce even further.
As the focus of the research was to reduce the acoustic emissions caused by torque
ripple, the signal from the high quality microphone was analysed before and after the
12 steps of this same test. The spectra before and after for relevant orders is shown
below in Figure 52.
Figure 52. High quality microphone spectrum before and after compensation
using rotational velocity as feedback
In the above figure the reduction in the three orders of interest can be clearly seen.
The magnitude of the 10th
and 20th
has been reduced to a similar levels as the other
orders around them while the 24th
has some magnitude remaining. The values of the
magnitude before and after, as well as the percentage reduction, can be seen below in
Table 2.
.

Minimisation of torque ripple-induced acoustic emissions from permanent magnet synchronous motors
118
Table 2. Reduction of orders in high quality microphone signal when rotational
velocity is used for compensation
Order
Magnitude before
(V)
Magnitude after
(V) Percentage reduction
10th
1.552E-2 2.096E-3 86.5%
20th
4.452E-2 2.507E-3 94.4%
24th
1.637E-1 1.302E-2 92.0%
The proposed cancellation method is show to work well at this set point when
rotational velocity is the measured signal, reducing the magnitude of the orders of
interest by more than 97% in the rotational velocity and by as much as 94% in the
acoustic emissions recorded by the high quality microphone. At higher rotational
velocities, speed may not be able to provide suitable data for this compensation.
Inertia in the mechanical system acts to filter out higher frequencies in the rotational
velocity, so as the rotational velocity of the motor increases, the magnitudes at the
order of interest may be too small to use. This effect is already observable in the
results shown above. Whilst the magnitude of the 24th
order has been reduced by
99.4% in the rotational velocity, a peak can still be seen in the microphone signal.
There is not enough information present in the rotational velocity data to fully reduce
the acoustic emission at the 24th
order.
7.5.2 Test 2 – Compensation using high quality microphone
For this test, experimental setup was identical to that in test 1 except that the signal
from the high quality microphone was used as the measured signal for the parameter
estimation method’s calculation. The spectra of this signal before and after 12 steps
of the parameter estimation method can be seen below in Figure 53 and the
magnitude of the orders of interest before and after 12 steps, as well as the
percentage reduction is shown in Table 3.

Minimisation of torque ripple-induced acoustic emissions from permanent magnet synchronous motors
119
Figure 53. High quality microphone spectrum before and after compensation
using high quality microphone as feedback
Table 3. Reduction of orders using high quality microphone signal for
compensation
Order
Magnitude before
(V)
Magnitude after
(V) Percentage reduction
10th
1.67E-2 6.15E-4 96.3%
20th
4.083E-2 3.41E-3 91.6%
24th
1.14E-1 4.235E-3 96.3%
Again in the above figure it can be seen that the magnitudes of the orders of interest
have been significantly reduced; the 10th
and 24th
orders by more than 96% and the
20th
by almost 92%. For the 10th
and 24th
order, this represents a higher reduction in

Minimisation of torque ripple-induced acoustic emissions from permanent magnet synchronous motors
120
the microphone signal in this test than in test 1. All three orders have been reduced to
the point where their magnitudes are similar to those of the other orders around them.
The magnitudes of the orders at each step of the parameter estimation method are
seen below in Figure 54.
Figure 54. Magnitudes per step of high quality microphone based compensation
The results in the above figure were similar to those in test 1 with the exception of
the magnitude of the 24th
order at the step 3. Rather than reducing the magnitude, the
first compensation signal, based on the two initial measurements, greatly increased
the magnitude of this order. This is likely due to background noise at this order
influencing the measured value and leading to the wrong magnitude and phase being
calculated at this step. This was the reason given in section 5.2 for not using the two
step approach to calculate the compensation signal.
It can also be seen in Figure 54 that rather than get continually worse, the result at
step 4 shows a reduction in the 24th
order; the parameter estimation method has
corrected for the error at step 3. By step 5 and onwards, all three orders have been
significantly reduced.

Minimisation of torque ripple-induced acoustic emissions from permanent magnet synchronous motors
121
7.5.3 Test 3 – Compensation using electret microphone
The experimental setup for this test is again the same as in test 1 and test 2 except
that the signal from the electret microphone was used as the measure signal. The
spectra before and after 12 steps of the compensation algorithm are plotted in Figure
55 and the magnitude of the orders of interest before and after 12 steps, as well as the
percentage reduction is shown in Table 4.
Figure 55. Electret microphone spectrum before and after compensation using
electret microphone as feedback
Table 4. Reduction of orders using electret microphone signal for compensation
Order
Magnitude before
(V)
Magnitude after
(V) Percentage reduction
10th
1.245E-2 1.102E-3 91.1%
20th
2.77E-2 4.76E-4 98.3%
24th
8.429E-2 1.353E-3 98.4%

Minimisation of torque ripple-induced acoustic emissions from permanent magnet synchronous motors
122
The results in Figure 55 show that all three orders of interest were significantly
reduced in the electret microphone signal. The 20th
and 24th
orders have been reduced
by over 98% and the 10th
by approximately 91% while the percentage reduction in
the 10th
is lower, it is worth noting that the magnitudes of all 3 orders were reduced
to the point that they are similar to the other orders around them. The magnitude of
the 10th
was reduced to near the same value as the 24th
and it is only the magnitude of
the initial value of the 10th
that affects the percentage of reduction.
As the signal from the high quality microphone was also recorded during this
experiment, it is possible to show the reduction observed by this microphone and
compare it to the results in the previous test. The magnitude of the orders of interest
before and after 12 steps, as well as the percentage reduction for the high quality
microphone is shown in Table 5.
Table 5. Reduction of orders observed by high quality microphone when using
electret microphone signal for compensation
Order
Magnitude before
(V)
Magnitude after
(V) Percentage reduction
10th
1.63E-2 2.1E-3 87.2%
20th
4.68E-2 1.1E-3 97.7%
24th
1.42E-1 7.63E-4 99.4%
These results are within a few per cent of those from the previous test which suggests
that the low cost electret microphone is a suitable substitute for the much higher cost,
high quality microphone.
The magnitude of each order of interest of the electret microphone signal was plotted
at each step of the cancellation method, and the results shown below in Figure 56.

Minimisation of torque ripple-induced acoustic emissions from permanent magnet synchronous motors
123
Figure 56. Magnitudes per step of electret microphone based compensation
In Figure 56, the magnitude of all three orders reduce over the first 4 steps until by
step 5 they are reduced to a value very close to that of step 12.
7.5.4 Test 4 – Compensation using electret microphone using
forgetting factor
Rather than use all previous measured values to calculate the next compensation
signal, the multi-step iterative approach with forgetting factor in section 5.3.2 utilises
only the past q measurements. Test 5 uses this approach and the measured signal
from the electret microphone. The results of test 1, test 2 and test 3 show that by step
5 the magnitude of all three orders of interest have been reduced to a level very close
to that of step 12. For this reason, the implementation of this method was such that
from step 5 onwards, only the results from the past 4 steps were used to calculate the
next compensation signal. The torque reference signal was again set to 0.8 Nm which
resulted in an average rotational velocity of 4.7 RPS.
The spectra of the electret microphone signal before and after the parameter
estimation method were plotted in Figure 57 and the magnitude of the orders of

Minimisation of torque ripple-induced acoustic emissions from permanent magnet synchronous motors
124
interest before and after 12 steps, as well as the percentage reduction is shown in
Table 6.
Figure 57. Electret microphone spectrum before and after compensation using
electret microphone as feedback using forgetting factor
Table 6. Reduction of orders observed by high quality microphone when using
electret microphone signal for compensation, including forgetting factor.
Order
Magnitude before
(V)
Magnitude after
(V) Percentage reduction
10th
1.046E-2 3.336E-3 68.1%
20th
2.704E-2 2.255E-3 91.7%
24th
8.664E-2 4.74E-4 99.5%

Minimisation of torque ripple-induced acoustic emissions from permanent magnet synchronous motors
125
In Figure 57 the peaks of all 3 of the orders of interest are greatly reduced and are of
a similar level as the other orders around them. The 10th
order is reduced by 68% of
its original value, the 20th
by almost 92% and the 24th
by more than 99%. The result
for the 10th
order is not as significant as those of the previous test, where a reduction
of 87.2% was achieved, the resulting signal was still reduced to a level similar to the
background noise. The magnitude of the 10th
order before compensation was lower
for this test compared to the previous one, hence the calculation of percentage
reduction yields a smaller result. The results for the other two orders are similar to
that for the previous test.
The magnitude of each order of interest of the electret microphone signal was plotted
at each step of the cancellation method, and the results shown below in Figure 58
Figure 58. Magnitudes per step of electret microphone based compensation
using forgetting factor
In the figure above, the magnitudes of all 3 orders begin reducing at step 3 and by
step 5 they are greatly reduced. While they remain small, the magnitudes are seen to
increase a little at step 10 and then again at step 12. When the values were analysed,

Minimisation of torque ripple-induced acoustic emissions from permanent magnet synchronous motors
126
it was found that the reduction at steps 8, 9 and 11 were better than at step 12 with
step 11 showing a greater than 96% reduction for the 10th
and 20th
order and greater
than 98% for the 24th
. This variation throughout the steps is likely caused by the
increased effect of background noise on the signal as only 4 measured values are
used to calculate the next compensation signal.
7.5.5 Test 5 – Compensation using electret microphone using
forgetting factor at new set point
For the last test, the same experiment as test 4 was run with the measured value
coming from the electret microphone signal and the compensation signal generated
from the past 4 measured values. The torque reference signal was this time set to 1.5
Nm which resulted in an average rotational velocity of 7.1 RPS. The higher torque
set point increased the component of the 20th
order due to gain mismatch error and
the new rotational velocity would alter the coupling of the torque ripple frequencies
to the motor housing and provide a different level of acoustic emissions at the orders
of interest.
The spectra of the electret microphone signal before and after the parameter
estimation method were plotted in Figure 59 and the magnitude of the orders of
interest before and after 12 steps, as well as the percentage reduction is shown in
Table 7.

Minimisation of torque ripple-induced acoustic emissions from permanent magnet synchronous motors
127
Figure 59. Electret microphone spectrum before and after compensation using
electret microphone as feedback using forgetting factor at new set point
Table 7. Reduction of orders using electret microphone signal at the new set
point for compensation including forgetting factor.
Order
Magnitude before
(V)
Magnitude after
(V) Percentage reduction
10th
4.12E-2 1.979E-3 95.2%
20th
3.219E-3 7.57E-4 76.5%
24th
3.39E-3 3.62E-4 89.3%
The magnitude of the three orders of interest are again reduced. The 10th
order was
reduced by more than 95%, the 20th
by 76.5% and the 24th
by more than 83%. The
reduction of the 20th
and 24th
are not as high in this test as was seen in test 4,
however the initial magnitude of both of these two orders was much lower in this test
than in the previous. The magnitudes of all three orders were reduced to a value

Minimisation of torque ripple-induced acoustic emissions from permanent magnet synchronous motors
128
similar to that of the other orders around them and the percentage reduction is lower
due to the lower initial value.
Comparison of test results 7.6
As the aim of the research was to reduce the acoustic noise produced by torque
ripple, the effectiveness of the methods from each test are best compared by
analysing the reduction in the acoustic noise measured by the high quality
microphone for all three orders of interest. To do this, magnitude and phase
information from the three orders was used to reconstruct a waveform as shown in
equation 7-2 before and after compensation.
∑ |𝑌(ℎ)| cos(2𝜋ℎ𝑡 + ∠𝑌(ℎ))
ℎ=10,20 𝑎𝑛𝑑 24
𝑓𝑜𝑟 0 < 𝑡 ≤ 1 7-2
In the above equation |𝑌(ℎ)| is the magnitude of the measured signal for a given
order and ∠𝑌(ℎ) is the corresponding phase. The root mean squared (RMS) value of
the constructed waveform before and after the parameter estimation method were
calculated and the RMS value of the waveform after expressed as a percentage of the
waveform before compensation.
7.6.1 Comparison of sensor signals
Figure 60 below shows the RMS value of the remaining waveform, as a percentage
of the value before compensation, recorded by the high quality microphone for the
three possible signals used for compensation. For all three experiments, the motor
controller was given a torque reference of 0.8 Nm. No forgetting factor was used for
these three compensation experiments.

Minimisation of torque ripple-induced acoustic emissions from permanent magnet synchronous motors
129
Figure 60. Percentage of remaining RMS value, of waveform constructed from
the measured high quality microphone signal, after compensation for each of
the 3 possible reference signals
It can be seen in the above figure that the RMS values after each test are
approximately 8% or less than that of the signals before compensation. Of the three,
the result after compensation using speed has the highest remaining RMS value at
7.89% followed by compensation using high quality microphone at 4.48%
remaining. Compensation using the electret microphone yields the largest reduction
with only 1.64% remaining.
Whilst the reason for the better response from the electret microphone, when
compared to the high quality microphone, is not known, one possible reason is the
difference in the bandwidth between the two devices. The high quality microphone
has a higher bandwidth and has a more uniform gain within it bandwidth compared
to that of the electret microphone. Higher frequencies measured by the high quality
microphone could be aliased back on to the lower frequencies causing interference to
the calculation of the compensation signal. This hypothesis could be tested as part of
future work by applying a low pass filter to the output of both microphone signals
that is designed such that only frequencies lower than the Nyquist frequency for the
acquisition system are recorded.
7.89%
4.48%
1.64%
Speed High quality mic Electret mic
RM
S v
alu
e of
rem
ain
ing w
avef
orm
(% o
f ori
gin
al)

Minimisation of torque ripple-induced acoustic emissions from permanent magnet synchronous motors
130
7.6.2 Comparison of methods wit and without forgetting factor
Figure 61 below shows the RMS value of the remaining waveform, as a percentage
of the value before compensation, recorded by the high quality microphone when the
electret microphone output is used for the compensation signal. The first result is
from the compensation method that does not apply a forgetting factor and the second
is from the compensation method that uses only the past 4 values to determine the
compensation parameters. Again, for both experiments, the motor controller was
given a torque reference of 0.8 Nm.
Figure 61. Percentage of remaining RMS value, of waveform constructed from
the measured high quality microphone signal, after compensation using the
electret microphone, with and without forgetting factor.
It can be seen in the above figure that the compensation method that uses all previous
measurements has a smaller remaining signal at 1.64% of the original RMS value
compared to the method that uses only the past four measurements, with 3.96% of
the original RMS value remaining.
1.64%
3.96%
Without forgetting factor With forgetting factor
RM
S v
alu
e of
rem
ain
ing w
avef
orm
(% o
f ori
gin
al)

Minimisation of torque ripple-induced acoustic emissions from permanent magnet synchronous motors
131
Chapter summary 7.7
In this chapter experiments to test assumptions made about the motor and the
controller were discussed. The results show that assumptions made about the
sinusoidal nature of the back-EMF were confirmed and the system was shown to be
able to operate within the bandwidth of the current controller when the 10th
, 20th
and
24th
orders were cancelled at the chosen set point.
Two cancellation methods propose in chapter 5 were tested using the rotational
velocity and signals from two different types of microphones. Reductions of up to
99.5% of the initial values of the orders of interest were observed. The various tests
show that the proposed methods were capable of reducing the magnitude of the
torque ripple-induced acoustic emissions to levels similar to those of the orders
around them. This is equivalent of reducing the level of these acoustic emissions to
something similar to that of the background noise at other orders or frequencies.
The results from the low cost electret microphone were seen to be of a similar level
as that of the high quality microphone. When the RMS values of a reconstructed
waveform, before and after compensation, were compared, the compensation via the
electret microphone showed the lowest remaining value in the signal measured by
the high quality microphone at 1.64% of the pre-compensated waveform. These
results suggest the possibility of future implementation of such a microphone directly
on the control board of a production PMSM.

Minimisation of torque ripple-induced acoustic emissions from permanent magnet synchronous motors
132

Minimisation of torque ripple-induced acoustic emissions from permanent magnet synchronous motors
133
8 Conclusion
Permanent magnet synchronous motors (PMSMs) can be controlled to produce an
output torque over a range of rotational velocities where the output torque matches
the torque reference supplied to the controller. In reality, additional harmonic
fluctuations, along with the reference torque, are present on the output torque. These
additional torque components, which are harmonic in nature and significantly affect
the output torque, are referred to as torque ripple and are caused by various design,
manufacturing and control factors.
Vibrations in the rotor and stator, resulting from torque ripple, couple through the
motor’s housing and mounting and can result in acoustic emission. These acoustic
emissions can limit the usefulness of PMSMs as it may make them unsuitable for a
number of applications. While efforts to minimise the acoustic emissions by damping
the vibrations may be effective when the motor is operated at a constant rotational
velocity, it is not possible to apply this technique when the motor is operated at
varying velocities. As the frequencies of the torque ripple-induced acoustic emissions
are a multiple of the rotational frequency of the motor, a wide range of frequencies
would need to be taken into account.
Rather than compensate for the resulting vibrations, a better approach is to remove
the torque ripple from the output torque of the PMSM. Two approaches have been
shown to be effective in the past to reduce the torque ripple produced. The first is
that improvements can be made to the design, better components can be selected and
better manufacturing processes can be used. This method has been shown to be
costly as it requires a high level of accuracy and is not appropriate for cost effective,
mass production of PMSMs. The second approach, which was the focus of this
thesis, is to use the motor controller to reduce the torque ripple produced by the
PMSM.
The output torque from a PMSM can be defined as the torque reference supplied to
the controller plus the unwanted torque ripple. If an estimate of the torque ripple can
be determined, the inverse of this estimate could then be added to the torque

Minimisation of torque ripple-induced acoustic emissions from permanent magnet synchronous motors
134
reference supplied to the controller. The motor would then produce a torque to
counter the torque ripple generated and, depending on the accuracy of the torque
ripple estimate and the bandwidth of the motor controller, the torque ripple produced
by the motor can be significantly reduced. Torque ripple does not occur across a
wide range of frequencies, there are certain dominant frequencies (or position based
orders) in the torque ripple and subsequent acoustic emissions of a PMSM that are of
particular interest. The primary focus of a method used to reduce torque ripple can
therefore be limited to these dominant orders.
As a direct measurement of the torque ripple is not possible in most PMSMs, an
alternative signal must be used. In this thesis, a control method was developed where
by a microphone was used to measure the acoustic emission of a PMSM. A
relationship between the measured emissions and the torque ripple that caused them
could then be determined. This relationship was used to derive an estimate of the
torque ripple responsible for the production of the acoustic emissions. The inverse of
this estimate was then added to the input of the motor controller in order to reduce
the torque ripple produced by the PMSM and hence reduce the acoustic emissions.
The motor used in this research is non-salient as the magnets are place on the surface
of the rotor’s steel. This is different from salient motors, also known as embedded
magnet motors, where the magnets are embedded in the steel. The compensation
method proposed in this thesis would work equally well on a salient PMSM, as the
compensation signal is applied to the reference torque signal for the motor controller.
While the controller configuration may differ for the two types of motors, the
compensation method is independent of the motors saliency.
Two types of microphones were used in this research. The first was an expensive,
high quality microphone chosen for its linearity across audible frequencies. The
second microphone was a low cost electret microphone that, if found suitable, could
be incorporated into the design of a mass produced motor controller.
Prior to testing any parameter estimation method, it was necessary to determine that
the acoustic emissions being measured were caused by torque ripple and not some
other source. Rotational velocity data, measured as part of this research, contains
harmonics caused by torque ripple. A coherence calculation was performed between

Minimisation of torque ripple-induced acoustic emissions from permanent magnet synchronous motors
135
the rotational velocity and the signal measured by each of the two microphones. The
results show a coefficient of coherence between 0.9 and 1.0 for the rotational
velocity and the high quality microphone and between 0.8 and 1.0 for the rotational
velocity and the electret microphone at the orders to be cancelled. This shows that
there is a high coherence between the signals at these orders indicating that the
acoustic emissions at these orders are caused by torque ripple.
Two versions of the proposed parameter estimation method were tested
experimentally; a multi-step iterative approach and a multi-step iterative approach
with forgetting factor. Experimental results have shown that the multi-step iterative
approach (without forgetting factor), which uses data from all previous steps to
determine the next torque ripple estimate, was effective in reducing the torque ripple-
induced acoustic emissions. Torque ripple-induced acoustic emissions, measured by
the high quality microphone, were reduced by 91% – 96% when the high quality
microphone was used to provide the measured signal to the parameter estimation
method. When the electret microphone was used to measure the acoustic emissions
and provide input to the cancellation method, reductions of 87 – 99% of the orders of
interest were achieved in the signal measured by the high quality microphone. The
use of a low cost microphone has been shown to reduce the acoustic emissions to a
similar level or better than that of the much more expensive, high quality
microphone. The cheaper electret microphone would be suitable if this method were
to be implemented in a commercial, mass produced motor controller. The possibility
that the lower performance of the high quality microphone, compared to that of the
electret microphone, may be due to aliasing of higher frequencies could be
investigated as part of future work.
A second version of the proposed parameter estimation method, a multi-step iterative
approach with forgetting factor where results from up to the last 4 steps are used to
calculate the torque ripple estimate, was also tested. This version was found to be
effective in reducing the acoustic emissions with a reduction of between 68% and
99% of the orders of interest. The lower limit for this reduction compared to that of
the previous method can be attributed to the lower magnitude of the 10th
order during
this test. This result indicates that if memory size or matrix ill conditioning are
factors in the implementation of the parameter estimation method, the version with

Minimisation of torque ripple-induced acoustic emissions from permanent magnet synchronous motors
136
forgetting factor could be used. Similar result compared to the version without
forgetting factor can be achieved.
The various tests show that both versions of the proposed parameter estimation
method were capable of reducing the magnitude of the torque ripple-induced acoustic
emissions to levels similar to those of the orders around them. Acoustic emissions of
the orders targeted by the method are reduced to something similar to the level of the
background noise.
Both versions of the proposed parameter estimation method, the multi-step iterative
approach and the multi-step iterative approach with forgetting factor, have been
shown to reduce the magnitude of the torque ripple-induced acoustic emissions for
three different orders simultaneously. These three order, the 10th
, 20th
and 24th
were
chosen as they are representative of torque ripple caused by current offset error,
current gain error and cogging torque. The method could be further expanded to
reduce a higher number of orders if desired for a particular application.

Minimisation of torque ripple-induced acoustic emissions from permanent magnet synchronous motors
137
9 Recommendations for future
research
Following the work detailed in this thesis, there are a number of areas which could
be investigated further.
Pre-filtering of the measured signals.
Simplification of the method used to find the coefficients of orders of interest.
Application of the compensation method proposed at a higher rotational
velocity.
Expanding the proposed method for use with a position estimator rather than
an encoder.
Design of a motor controller board that incorporates a microphone.
Modification of the proposed method so that it selectively start and stops
based on the level of the acoustic emissions.
Pre-filtering of the measured signals 9.1
For the experiments conducted as part of this research, no filtering was done to the
measured signals before they were sampled. Aliasing of higher frequencies onto the
frequencies being measured may account for the lower reduction of acoustic
emissions when the high quality microphone was used as compare to the results from
the electret microphone. Application of a low pass filter to the output of both
microphones could limit the sampled frequencies to below the Nyquist sampling rate
for the acquisition system and eliminate any aliasing.

Minimisation of torque ripple-induced acoustic emissions from permanent magnet synchronous motors
138
Simplification of the method used to determine the 9.2
coefficients
To determine the magnitude and phase of the acoustic emissions, a fast Fourier
transform (FFT) was applied to data taken over 16 revolutions of the motor. Given
that 4096 data points were collected per revolution, the magnitude and phase of
32768 orders were contained in the results. A FFT was used as it is easily
implemented in MATLAB and as calculation time was not an issue, neither was the
large number of required calculations. As information is only required for the orders
of interest, a discrete Fourier transform, or a Goertzel transform would be a
computationally less intensive way to provide these results. This simplification
would make it easier to implement the methods described on a microcontroller such
as those already used for commercial motor control.
The number of calculations required could be reduced even further by reducing the
number of data points measured per revolution. As 4096 points were measured,
orders up to the 2047th
could be accurately measured. As the orders due to torque
ripple are generally much lower, typically less than 200, a sampling rate of 512
samples per revolution could be used.
Higher rotational velocity 9.3
Due to the bandwidth of the current controller, the motor used in this research was
tested at a much lower rotational velocity to that at which it would typically operate.
To keep the orders of interest well below the resonant frequency of approximately
692 Hz for the controller used, the motor was operated at or less than 7.1Hz.
Typically, a motor of the kind used in this research would operate up to 25Hz or
50Hz, depending on its application. In order to test the proposed methods at such
rotational velocities it would be first necessary to increase the bandwidth of the
current controller.

Minimisation of torque ripple-induced acoustic emissions from permanent magnet synchronous motors
139
The proposed method may work at frequencies much closer to the resonant
frequency and this should also be investigated. If this is found to be the case, it will
lower the required bandwidth for the current controller.
The last consideration for operating at higher rotational velocities would be the rate
at which the position based data would be required to be sampled. At 4096 samples
per revolution and 50 revolutions per second, this would require a sampling rate of
over 200k samples per second, which is in excess of what can be achieved with the
laboratory setup used in this research. If the number of samples per revolution were
lowered, as suggested in the section above, to a rate of 512 per revolution, the
required data sampling rate would be reduced to just over 26k samples per second
which is less than the rate used in this research.
Removal of the encoder signal 9.4
The requirement of the proposed methods of position based measurements means an
encoder was a necessary part of the test equipment. The encoder was already present
on the motor as it was also required by the controller. Position based sensors, such as
encoders, are seldom used in commercially available PMSMs as they represent an
additional cost and an additional component to maintain or repair. Such
commercially available motors utilise a so called sensorless control method [76-78]
where an approximation of the position of the motor is calculated by the controller
based on other available parameters.
Modifications could be made to the way that methods proposed in this thesis make
the position based measurements or to the way the order based magnitudes and
phases are calculated so that the method could run without an encoder. This would
enable the proposed methods to work in conjunction with a sensorless motor
controller.

Minimisation of torque ripple-induced acoustic emissions from permanent magnet synchronous motors
140
Microphone on motor controller 9.5
As it was demonstrated in this thesis that a low cost electret microphone was suitable
to reduce the torque ripple-induced acoustic emissions, it would be possible to design
a control board that incorporates the microphone and any associated components.
The design of such a board would be so that it fits in a conventional motor and could
also be designed to utilise the other recommendations in this section.
Selective cancellation method 9.6
The last area of investigation would be to modify either of the two suggested
cancellation methods so that they stop calculating new cancellation signals at a given
order if the magnitude of that order drops below a set threshold. As seen in section
7.5.4, the magnitude of a given order can fluctuate at each step and the magnitude at
later steps could be more than at a previous one. The cancellation method could be
configured such that when the magnitude of an order drops below a given threshold,
the current value of the compensation signal for that order, 𝑈(ℎ), is maintained for
future steps. The measured signal, 𝑌(ℎ), could be monitored at subsequent steps and
the parameter estimation method restarted if it increases above another set threshold.

References
[1] T. M. Jahns and W. L. Soong, "Pulsating torque minimization techniques for
permanent magnet AC motor drives-a review," Industrial Electronics, IEEE
Transactions on, vol. 43, pp. 321-330, 1996.
[2] R. Islam, I. Husain, A. Fardoun, and K. McLaughlin, "Permanent-magnet
synchronous motor magnet designs with skewing for torque ripple and
cogging torque reduction," Industry Applications, IEEE Transactions on, vol.
45, pp. 152-160, 2009.
[3] A. Gebregergis, M. H. Chowdhury, M. S. Islam, and T. Sebastian, "Modeling
of Permanent-Magnet Synchronous Machine Including Torque Ripple
Effects," Industry Applications, IEEE Transactions on, vol. 51, pp. 232-239,
2015.
[4] M. Aydin, S. Huang, and T. Lipo, "Torque quality and comparison of internal
and external rotor axial flux surface-magnet disc machines," Industrial
Electronics, IEEE Transactions on, vol. 53, pp. 822-830, 2006.
[5] W. Qian, J. Xu, and S. Panda, "Periodic torque ripples minimization in
PMSM using learning variable structure control based on a torque observer,"
in Industrial Electronics Society, 2003. IECON'03. The 29th Annual
Conference of the IEEE, 2003, pp. 2983-2988.
[6] S.-H. Han, T. M. Jahns, and W. L. Soong, "Torque ripple reduction in interior
permanent magnet synchronous machines using the principle of mutual
harmonics exclusion," in Industry Applications Conference, 2007. 42nd IAS
Annual Meeting. Conference Record of the 2007 IEEE, 2007, pp. 558-565.
[7] D. G. Dorrell, M.-F. Hsieh, M. Popescu, L. Evans, D. A. Staton, and V.
Grout, "A review of the design issues and techniques for radial-flux brushless
surface and internal rare-earth permanent-magnet motors," Industrial
Electronics, IEEE Transactions on, vol. 58, pp. 3741-3757, 2011.
[8] L. Gasparin, A. Cernigoj, S. Markic, and R. Fiser, "Additional cogging torque
components in permanent-magnet motors due to manufacturing
imperfections," Magnetics, IEEE Transactions on, vol. 45, pp. 1210-1213,
2009.
[9] M. Thiele, G. Heins, and D. Patterson, "Identifying manufacturing induced
rotor and stator misalignment in brushless permanent magnet motors," in
Electrical Machines (ICEM), 2014 International Conference on, 2014, pp.
2728-2733.
[10] G. Heins, T. Brown, and M. Thiele, "Statistical analysis of the effect of
magnet placement on cogging torque in fractional pitch permanent magnet
motors," Magnetics, IEEE Transactions on, vol. 47, pp. 2142-2148, 2011.
[11] R. Islam and I. Husain, "Analytical model for predicting noise and vibration
in permanent-magnet synchronous motors," Industry Applications, IEEE
Transactions on, vol. 46, pp. 2346-2354, 2010.
[12] G. Heins, Control methods for smooth operation of permanent magnet
synchronous AC motors: Charles Darwin University, 2008.
[13] G. Heins, F. De Boer, J. Wouters, and R. Bruns, "Experimental comparison
of reference current waveform techniques for pulsating torque minimization
in PMAC motors," in Electric Machines & Drives Conference, 2007.
IEMDC'07. IEEE International, 2007, pp. 1031-1036.

Minimisation of torque ripple-induced acoustic emissions from permanent magnet synchronous motors
142
[14] A. P. Wu and P. L. Chapman, "Simple expressions for optimal current
waveforms for permanent-magnet synchronous machine drives," Energy
Conversion, IEEE Transactions on, vol. 20, pp. 151-157, 2005.
[15] A. Gómez-Espinosa, V. M. Hernández-Guzmán, M. Bandala-Sánchez, H.
Jiménez-Hernández, E. A. Rivas-Araiza, J. Rodríguez-Reséndiz, et al., "A
new adaptive self-tuning Fourier coefficients algorithm for periodic torque
ripple minimization in permanent magnet synchronous motors (PMSM),"
Sensors, vol. 13, pp. 3831-3847, 2013.
[16] S. Hattori, M. Ishida, and T. Hori, "Vibration suppression control method for
PMSM utilizing repetitive control with auto-tuning function and Fourier
transform," in Industrial Electronics Society, 2001. IECON'01. The 27th
Annual Conference of the IEEE, 2001, pp. 1673-1679.
[17] P. Mattavelli, L. Tubiana, and M. Zigliotto, "Torque-ripple reduction in PM
synchronous motor drives using repetitive current control," Power
Electronics, IEEE Transactions on, vol. 20, pp. 1423-1431, 2005.
[18] T. Su, S. Hattori, M. Ishida, and T. Hori, "Suppression control method for
torque vibration of AC motor utilizing repetitive controller with fourier
transform," Industry Applications, IEEE Transactions on, vol. 38, pp. 1316-
1325, 2002.
[19] B. Lam, S. Panda, J. Xu, and K. Lim, "Torque ripple minimization in PM
synchronous motor using iterative learning control," in Industrial Electronics
Society, 1999. IECON'99 Proceedings. The 25th Annual Conference of the
IEEE, 1999, pp. 1458-1463.
[20] J. P. Yun, C. Lee, S. Choi, and S. W. Kim, "Torque ripples minimization in
PMSM using variable step-size normalized iterative learning control," in
Robotics, Automation and Mechatronics, 2006 IEEE Conference on, 2006,
pp. 1-6.
[21] S. Maier, J. Bals, and M. Bodson, "Periodic disturbance rejection of a PMSM
with adaptive control algorithms," in Electric Machines & Drives Conference
(IEMDC), 2011 IEEE International, 2011, pp. 1070-1075.
[22] B. Stallaert, G. Pinte, S. Devos, W. Symens, J. Swevers, and P. Sas,
"Filtered-X LMS vs repetitive control for active structural acoustic control of
periodic disturbances," in Proc. ISMA, 2009.
[23] J.-X. Xu, S. K. Panda, Y.-J. Pan, T. H. Lee, and B. Lam, "A modular control
scheme for PMSM speed control with pulsating torque minimization,"
Industrial Electronics, IEEE Transactions on, vol. 51, pp. 526-536, 2004.
[24] H. Murakami, Y. Honda, H. Kiriyama, S. Morimoto, and Y. Takeda, "The
performance comparison of SPMSM, IPMSM and SynRM in use as air-
conditioning compressor," in Industry Applications Conference, 1999. Thirty-
Fourth IAS Annual Meeting. Conference Record of the 1999 IEEE, 1999, pp.
840-845.
[25] H. A. Toliyat, "Recent advances and applications of power electronics and
Motor Drives-Electric machines and motor drives," in Industrial Electronics,
2008. IECON 2008. 34th Annual Conference of IEEE, 2008, pp. 34-36.
[26] M. S. Islam, S. Mir, and T. Sebastian, "Issues in reducing the cogging torque
of mass-produced permanent-magnet brushless DC motor," Industry
Applications, IEEE Transactions on, vol. 40, pp. 813-820, 2004.
[27] W. Qian, S. K. Panda, and J.-X. Xu, "Torque ripple minimization in PM
synchronous motors using iterative learning control," Power Electronics,
IEEE Transactions on, vol. 19, pp. 272-279, 2004.

Minimisation of torque ripple-induced acoustic emissions from permanent magnet synchronous motors
143
[28] C. Rusu, B. Enikö, and A. Bara, "DSP Based Controller of PMSM Drive for
Robot Axis Applications," Journal of Computer Science, vol. 2, 2009.
[29] V. Petrovic, R. Ortega, A. M. Stankovic, and G. Tadmor, "Design and
implementation of an adaptive controller for torque ripple minimization in
PM synchronous motors," Power Electronics, IEEE Transactions on, vol. 15,
pp. 871-880, 2000.
[30] F. Meinguet, N.-K. Nguyen, P. Sandulescu, X. Kestelyn, and E. Semail,
"Fault-tolerant operation of an open-end winding five-phase PMSM drive
with inverter faults," in Industrial Electronics Society, IECON 2013-39th
Annual Conference of the IEEE, 2013, pp. 5191-5196.
[31] O.-S. Park, J.-W. Park, C.-B. Bae, and J.-M. Kim, "A dead time
compensation algorithm of independent multi-phase PMSM with three-
dimensional space vector control," Journal of Power Electronics, vol. 13, pp.
77-85, 2013.
[32] Z. Zhu, L. Wu, and M. Mohd Jamil, "Influence of Pole and Slot Number
Combinations on Cogging Torque in Permanent-Magnet Machines With
Static and Rotating Eccentricities," Industry Applications, IEEE Transactions
on, vol. 50, pp. 3265-3277, 2014.
[33] M. Thiele and G. Heins, "Identifying cogging torque harmonics affected by
misalignment in axial flux fractional pitch PMSM," in Electrical Machines
(ICEM), 2012 XXth International Conference on, 2012, pp. 2969-2974.
[34] Y. Luo, Y. Chen, H.-S. Ahn, and Y. Pi, "Fractional order robust control for
cogging effect compensation in PMSM position servo systems: stability
analysis and experiments," Control Engineering Practice, vol. 18, pp. 1022-
1036, 2010.
[35] M. Thiele, G. Heins, and T. Brown, "Decoupling manufacturing sources of
cogging torque in fractional pitch PMSM," in Electric Machines & Drives
Conference (IEMDC), 2011 IEEE International, 2011, pp. 924-929.
[36] E. M. Tsampouris, M. E. Beniakar, and A. G. Kladas, "Geometry
optimization of PMSMs comparing full and fractional pitch winding
configurations for aerospace actuation applications," Magnetics, IEEE
Transactions on, vol. 48, pp. 943-946, 2012.
[37] A. M. El-Refaie, "Fractional-slot concentrated-windings synchronous
permanent magnet machines: Opportunities and challenges," Industrial
electronics, IEEE Transactions on, vol. 57, pp. 107-121, 2010.
[38] D. J. Patterson, J. L. Colton, B. Mularcik, B. J. Kennedy, S. Camilleri, and R.
Rohoza, "A comparison of radial and axial flux structures in electrical
machines," in Electric Machines and Drives Conference, 2009. IEMDC'09.
IEEE International, 2009, pp. 1029-1035.
[39] A. Cavagnino, M. Lazzari, F. Profumo, and A. Tenconi, "A comparison
between the axial flux and the radial flux structures for PM synchronous
motors," in Industry Applications Conference, 2001. Thirty-Sixth IAS Annual
Meeting. Conference Record of the 2001 IEEE, 2001, pp. 1611-1618.
[40] A. Parviainen, M. Niemela, J. Pyrhonen, and J. Mantere, "Performance
comparison between low-speed axial-flux and radial-flux permanent-magnet
machines including mechanical constraints," in IEEE International
Conference on Electric Machines and Drives, 2005., 2005.
[41] J. Hung and Z. Ding, "Design of currents to reduce torque ripple in brushless
permanent magnet motors," Electric Power Applications, IEE Proceedings B,
vol. 140, pp. 260-266, 1993.

Minimisation of torque ripple-induced acoustic emissions from permanent magnet synchronous motors
144
[42] J. Liu, T. A. Nondahl, P. B. Schmidt, S. Royak, and T. M. Rowan,
"Generalized stability control for open loop operation of motor drives," in
Industry Applications Society Annual Meeting, 2015 IEEE, 2015, pp. 1-8.
[43] P. C. Sen, "Electric motor drives and control-past, present, and future,"
Industrial Electronics, IEEE Transactions on, vol. 37, pp. 562-575, 1990.
[44] H. Mehta, V. Joshi, U. Thakar, M. Kuber, and P. Kurulkar, "Speed control of
PMSM with Hall sensors using DSP TMS320F2812," in Power Electronics
and Drive Systems (PEDS), 2015 IEEE 11th International Conference on,
2015, pp. 295-300.
[45] M. Marufuzzaman, M. Reaz, M. Rahman, and M. Ali, "Hardware prototyping
of an intelligent current dq PI controller for FOC PMSM drive," in Electrical
and Computer Engineering (ICECE), 2010 International Conference on,
2010, pp. 86-88.
[46] R. Krishnan, Electric motor drives: modeling, analysis, and control vol. 626:
Prentice Hall New Jersey, 2001.
[47] D. W. Novotny and T. A. Lipo, Vector control and dynamics of AC drives
vol. 2007: Clarendon Press Oxford, 1996.
[48] T. Sun, C. Liu, N. Lu, D. Gao, and S. Xu, "Design of PMSM vector control
system based on TMS320F2812 DSP," in Power Electronics and Motion
Control Conference (IPEMC), 2012 7th International, 2012, pp. 2602-2606.
[49] T. M. Jahns, G. B. Kliman, and T. W. Neumann, "Interior permanent-magnet
synchronous motors for adjustable-speed drives," Industry Applications,
IEEE Transactions on, pp. 738-747, 1986.
[50] K. Chikh, A. Saad, M. Khafallah, and D. Yousfi, "PMSM vector control
performance improvement by using pulse with modulation and anti-windup
PI controller," in Multimedia Computing and Systems (ICMCS), 2011
International Conference on, 2011, pp. 1-7.
[51] R. B. Randall, Frequency Analysis: Brüel & Kjaer, 1987.
[52] Y. Chen, Z. Zhu, and D. Howe, "Vibration of PM brushless machines having
a fractional number of slots per pole," Magnetics, IEEE Transactions on, vol.
42, pp. 3395-3397, 2006.
[53] K. C. Yeo, G. Heins, F. De Boer, and B. Saunders, "Adaptive feedforward
control to compensate cogging torque and current measurement errors for
PMSMs," in Electric Machines & Drives Conference (IEMDC), 2011 IEEE
International, 2011, pp. 942-947.
[54] D.-W. Chung and S.-K. Sul, "Analysis and compensation of current
measurement error in vector-controlled AC motor drives," Industry
Applications, IEEE Transactions on, vol. 34, pp. 340-345, 1998.
[55] H.-S. Jung, S.-H. Hwang, J.-M. Kim, C.-U. Kim, and C. Choi, "Diminution
of current-measurement error for vector-controlled AC motor drives,"
Industry Applications, IEEE Transactions on, vol. 42, pp. 1249-1256, 2006.
[56] B. Nahid-Mobarakeh, F. Meibody-Tabar, and F.-M. Sargos, "Back EMF
estimation-based sensorless control of PMSM: robustness with respect to
measurement errors and inverter irregularities," Industry Applications, IEEE
Transactions on, vol. 43, pp. 485-494, 2007.
[57] S. Chen, C. Namuduri, and S. Mir, "Controller-induced parasitic torque
ripples in a PM synchronous motor," Industry Applications, IEEE
Transactions on, vol. 38, pp. 1273-1281, 2002.
[58] A. Krings, S. Mousavi, O. Wallmark, and J. Soulard, "Temperature influence
of NiFe steel laminations on the characteristics of small slotless permanent
Minimisation of torque ripple-induced acoustic emissions from permanent magnet synchronous motors
145
magnet machines," Magnetics, IEEE Transactions on, vol. 49, pp. 4064-
4067, 2013.
[59] S. Ruoho, J. Kolehmainen, J. Ikaheimo, and A. Arkkio, "Interdependence of
Demagnetization, Loading, and Temperature Rise in a Permanent-Magnet
Synchronous Motor," Magnetics, IEEE Transactions on, vol. 46, pp. 949-
953, 2010.
[60] M. Popescu, D. Staton, D. Dorrell, F. Marignetti, and D. Hawkins, "Study of
the thermal aspects in brushless permanent magnet machines performance,"
in IEEE Workshop on Electrical Machines Design Control and Diagnosis,
2013, pp. 60-69.
[61] A. Ellison and C. Moore, "Acoustic noise and vibration of rotating electric
machines," in Proceedings of the Institution of Electrical Engineers, 1968,
pp. 1633-1640.
[62] N. Moehle and S. Boyd, "Optimal current waveforms for brushless
permanent magnet motors," International Journal of Control, pp. 1-11, 2015.
[63] J. Y. Hung and Z. Ding, "Minimization of torque ripple in permanent magnet
motors: a closed form solution," in Industrial Electronics, Control,
Instrumentation, and Automation, 1992. Power Electronics and Motion
Control., Proceedings of the 1992 International Conference on, 1992, pp.
459-463.
[64] W. Qian, S. K. Panda, and J. X. Xu, "Torque ripple minimization in PM
synchronous motors using iterative learning control," Power Electronics,
IEEE Transactions on, vol. 19, pp. 272-279, 2004.
[65] G. Heins, M. Thiele, and T. Brown, "Accurate torque ripple measurement for
PMSM," Instrumentation and Measurement, IEEE Transactions on, vol. 60,
pp. 3868-3874, 2011.
[66] P. Beccue, J. Neely, S. Pekarek, and D. Stutts, "Measurement and control of
torque ripple-induced frame torsional vibration in a surface mount permanent
magnet machine," Power Electronics, IEEE Transactions on, vol. 20, pp.
182-191, 2005.
[67] M. Akar, S. Taskin, S. SEker, and I. CAnkaya, "Detection of static
eccentricity for permanent magnet synchronous motors using the coherence
analysis," J Electrical Engineering & Comp Science, vol. 18, 2010.
[68] L. A. Sievers and A. H. von Flotow, "Comparison and extensions of control
methods for narrow-band disturbance rejection," Signal Processing, IEEE
Transactions on, vol. 40, pp. 2377-2391, 1992.
[69] G. De Nicolao, F. Lorito, and S. Strada, "OnComparison and extensions of
control methods for narrow-band disturbance rejection'," Speech and Audio
Processing, IEEE Transactions on, vol. 2, pp. 459-461, 1994.
[70] M. Bodson, A. Sacks, and P. Khosla, "Harmonic generation in adaptive
feedforward cancellation schemes," Automatic Control, IEEE Transactions
on, vol. 39, pp. 1939-1944, 1994.
[71] W. Qian, S. Panda, and J. Xu, "Torque ripples reduction in PM synchronous
motor using frequency-domain iterative learning control," in Power
Electronics and Drive Systems, 2003. PEDS 2003. The Fifth International
Conference on, 2003, pp. 1636-1641.
[72] D. J. Hill, G. Heins, F. De Boer, and B. Saunders, "Torque ripple estimation
and minimisation independent of sensor type," in Electric Machines & Drives
Conference (IEMDC), 2011 IEEE International, 2011, pp. 463-468.

Minimisation of torque ripple-induced acoustic emissions from permanent magnet synchronous motors
146
[73] S. C. Chapra, Applied Numerical Methods with MATLAB for Engineers and
Scientists: McGraw-Hill Higher Education, 2008.
[74] R. Schilling and S. Harris, Fundamentals of digital signal processing using
MATLAB: Cengage Learning, 2011.
[75] Sparkfun. (2015). Sparkfun electret microphone breakout board. Available:
https://www.sparkfun.com/products/9964
[76] J. Kim, I. Jeong, K. Nam, J. Yang, and T. Hwang, "Sensorless Control of
PMSM in a High-Speed Region Considering Iron Loss," Industrial
Electronics, IEEE Transactions on, vol. 62, pp. 6151-6159, 2015.
[77] M. Seilmeier and B. Piepenbreier, "Sensorless Control of PMSM for the
Whole Speed Range Using Two-Degree-of-Freedom Current Control and HF
Test Current Injection for Low-Speed Range," Power Electronics, IEEE
Transactions on, vol. 30, pp. 4394-4403, 2015.
[78] B. Saunders, G. Heins, F. De Boer, and M. Thiele, "Cogging torque
estimation for sensorless PMSM," in Electrical Machines (ICEM), 2012 XXth
International Conference on, 2012, pp. 2949-2954.

Minimisation of torque ripple-induced acoustic emissions from permanent magnet synchronous motors
147
Appendix 1
MATLAB program used for iterative parameter estimation
close all; clear all; clc
% Magnitude and phase for the first two steps for 5 harmonics
TImag=[0 0.01; 0 0.05;0 0.05;0 0.05;0 0.05]; TIangle=[0 pi; 0 0; 0 pi/2; 0 -pi/2; 0 0];
% Set paths for temporary files required by the program trig = 'F:\Motor Research\Damien\Damien
AUD14005s6_internal\Labview\Data\TF_Data\Trigger.txt'; data = 'F:\Motor Research\Damien\Damien
AUD14005s6_internal\Labview\Data\alldat.txt';
%Set initial values and constants ENCR = 4096; %samples per revolution RPS = 10; %rev per saved data
TorqueMag=[]; TorqueAng=[];
TMmag=[]; TMangle=[];
%% Channel Selection
%choose channel to use for cancellation
%Microphone = 3 %electret = 4 %Speed= 5
%Source of data used for cancellation can be selected
Channel = 5;
%% Start trigwrite =
fopen(trig,'w');fprintf(trigwrite,'0');fclose(trigwrite); Harmonics = [10 20 24 40 48];
%Send TInject(1,:) to DSP then read Mic_Data
Mag = TImag(:,1)*65536; Angle = (TIangle(:,1)/(2*pi))*65536;
T10 = round([Mag(1) Angle(1)]); T20 = round([Mag(2) Angle(2)]); T24 = round([Mag(3) Angle(3)]); T40 = round([Mag(4) Angle(4)]); T48 = round([Mag(5) Angle(5)]);

Minimisation of torque ripple-induced acoustic emissions from permanent magnet synchronous motors
148
[T10; T20; T24; T40; T48]
cc=ticcs; rx = cc.rtdx; configure(cc.rtdx,1024,4);
open(rx,'TI_ichan','w'); % Could use rx.open('ichannel','w') enable(rx,'TI_ichan');
inputdata=[T10 T20 T24 T40 T48]; %inputdata=[0 0 T20 T24 T40 T48]; writemsg(rx,'TI_ichan',int32(inputdata));
disp('Reading Mic for Zero');
pause(5) trigwrite =
fopen(trig,'w');fprintf(trigwrite,'1');fclose(trigwrite); pause(5) trigwrite =
fopen(trig,'w');fprintf(trigwrite,'0');fclose(trigwrite); pause(5)
Mic_Data(:,:,1)=textread(data);
[TM1, TM2] = fftdat(Mic_Data(:,Channel,1),ENCR,Harmonics); TMmag = [TMmag TM1']; TMangle = [TMangle TM2'];
%Send TInject(2,:) to DSP and read second line of Mic_Data
Mag = TImag(:,2)*65536; Angle = (TIangle(:,2)/(2*pi))*65536;
T10 = round([Mag(1) Angle(1)]); T20 = round([Mag(2) Angle(2)]); T24 = round([Mag(3) Angle(3)]); T40 = round([Mag(4) Angle(4)]); T48 = round([Mag(5) Angle(5)]);
TIangle(:,2)= (Angle/65536)*2*pi;
[T10; T20; T24; T40; T48]
inputdata=[T10 T20 T24 T40 T48]; writemsg(rx,'TI_ichan',int32(inputdata));
disp('Reading Mic for Offset');
pause(5) trigwrite =
fopen(trig,'w');fprintf(trigwrite,'1');fclose(trigwrite); pause(5)

Minimisation of torque ripple-induced acoustic emissions from permanent magnet synchronous motors
149
trigwrite =
fopen(trig,'w');fprintf(trigwrite,'0');fclose(trigwrite); pause(5)
Mic_Data(:,:,2)=textread(data);
[TM1, TM2] = fftdat(Mic_Data(:,Channel,2),ENCR,Harmonics); TMmag = [TMmag TM1']; TMangle = [TMangle TM2'];
for xx=3:12 %Set ultimate number of steps required.
TI=TImag.*cos(TIangle)+1j*TImag.*sin(TIangle); TM=TMmag.*cos(TMangle)+1j*TMmag.*sin(TMangle);
for kk=1:5
TT = TI(kk,:);
MM = TM(kk,:);
A4 = [TT.' ones(length(TT),1)];
b4 = MM.';
v4 = pinv(A4)*b4;
TR(kk) = (v4(2)/v4(1));
%Matlab left divide operator used calculate result TF(kk)=v4(1);
end
TImag=[TImag [-1*abs(TR(1)); -1*abs(TR(2)); -1*abs(TR(3)); -
1*abs(TR(4)); -1*abs(TR(5))] ]; TIangle=[TIangle [angle(TR(1)); angle(TR(2)); angle(TR(3));
angle(TR(4)); angle(TR(5))]];
%Inject new TI and record
Mag = TImag(:,xx)*65536; Angle = (TIangle(:,xx)/(2*pi))*65536;
T10 = round([Mag(1) Angle(1)]); T20 = round([Mag(2) Angle(2)]); T24 = round([Mag(3) Angle(3)]); T40 = round([Mag(4) Angle(4)]); T48 = round([Mag(5) Angle(5)]);
TIangle(:,xx)= (Angle/65536)*2*pi;

Minimisation of torque ripple-induced acoustic emissions from permanent magnet synchronous motors
150
[T10; T20; T24; T40; T48]
cc=ticcs; rx = cc.rtdx; configure(cc.rtdx,1024,4);
open(rx,'TI_ichan','w'); % Could use rx.open('ichannel','w') enable(rx,'TI_ichan');
inputdata=[T10 T20 T24 T40 T48]; %inputdata=[0 0 T20 T24 T40 T48]; writemsg(rx,'TI_ichan',int32(inputdata));
disp(['Reading itteration ',num2str(xx),' Data'])
pause(5)
trigwrite =
fopen(trig,'w');fprintf(trigwrite,'1');fclose(trigwrite); pause(5) trigwrite =
fopen(trig,'w');fprintf(trigwrite,'0');fclose(trigwrite); pause(5)
Mic_Data(:,:,xx)=textread(data);
[TM1, TM2] = fftdat(Mic_Data(:,Channel,xx),ENCR,Harmonics); TMmag = [TMmag TM1']; TMangle = [TMangle TM2'];
end
disp('END')

Minimisation of torque ripple-induced acoustic emissions from permanent magnet synchronous motors
151
MATLAB program used for iterative parameter estimation including forgetting
factor.
close all; clear all; clc
% Magnitude and phase for the first two steps for 5 harmonics
TImag=[0 0.01; 0 0.05;0 0.05;0 0.05;0 0.05]; TIangle=[0 pi; 0 0; 0 pi/2; 0 -pi/2; 0 0];
% Set paths for temporary files required by the program trig = 'F:\Motor Research\Damien\Damien
AUD14005s6_internal\Labview\Data\TF_Data\Trigger.txt'; data = 'F:\Motor Research\Damien\Damien
AUD14005s6_internal\Labview\Data\alldat.txt';
%Set initial values and constants ENCR = 4096; %samples per revolution RPS = 10; %rev per saved data
TorqueMag=[]; TorqueAng=[];
TMmag=[]; TMangle=[];
%% Channel Selection
%choose channel to use for cancellation
%Microphone = 3 %electret = 4 %Speed= 5
%Source of data used for cancellation can be selected
Channel = 5;
%% Start trigwrite =
fopen(trig,'w');fprintf(trigwrite,'0');fclose(trigwrite); Harmonics = [10 20 24 40 48];
%Send TInject(1,:) to DSP then read Mic_Data
Mag = TImag(:,1)*65536; Angle = (TIangle(:,1)/(2*pi))*65536;
T10 = round([Mag(1) Angle(1)]); T20 = round([Mag(2) Angle(2)]); T24 = round([Mag(3) Angle(3)]); T40 = round([Mag(4) Angle(4)]); T48 = round([Mag(5) Angle(5)]);

Minimisation of torque ripple-induced acoustic emissions from permanent magnet synchronous motors
152
[T10; T20; T24; T40; T48]
cc=ticcs; rx = cc.rtdx; configure(cc.rtdx,1024,4);
open(rx,'TI_ichan','w'); % Could use rx.open('ichannel','w') enable(rx,'TI_ichan');
inputdata=[T10 T20 T24 T40 T48];
writemsg(rx,'TI_ichan',int32(inputdata));
disp('Reading Mic for Zero');
pause(5)
trigwrite =
fopen(trig,'w');fprintf(trigwrite,'1');fclose(trigwrite); pause(5) trigwrite =
fopen(trig,'w');fprintf(trigwrite,'0');fclose(trigwrite); pause(5)
Mic_Data(:,:,1)=textread(data);
[TM1, TM2] = fftdat(Mic_Data(:,Channel,1),ENCR,Harmonics); TMmag = [TMmag TM1']; TMangle = [TMangle TM2'];
Mag = TImag(:,2)*65536; Angle = (TIangle(:,2)/(2*pi))*65536;
T10 = round([Mag(1) Angle(1)]); T20 = round([Mag(2) Angle(2)]); T24 = round([Mag(3) Angle(3)]); T40 = round([Mag(4) Angle(4)]); T48 = round([Mag(5) Angle(5)]);
TIangle(:,2)= (Angle/65536)*2*pi;
[T10; T20; T24; T40; T48]
inputdata=[T10 T20 T24 T40 T48]; %inputdata=[0 0 T20 T24 T40 T48]; writemsg(rx,'TI_ichan',int32(inputdata));
disp('Reading Mic for Offset');
pause(5)
trigwrite =
fopen(trig,'w');fprintf(trigwrite,'1');fclose(trigwrite); pause(5) trigwrite =
fopen(trig,'w');fprintf(trigwrite,'0');fclose(trigwrite);

Minimisation of torque ripple-induced acoustic emissions from permanent magnet synchronous motors
153
pause(5)
Mic_Data(:,:,2)=textread(data);
[TM1, TM2] = fftdat(Mic_Data(:,Channel,2),ENCR,Harmonics); TMmag = [TMmag TM1']; TMangle = [TMangle TM2'];
n=1;
for xx=3:12 %Set ultimate number of steps required.
TI=TImag.*cos(TIangle)+1j*TImag.*sin(TIangle); TM=TMmag.*cos(TMangle)+1j*TMmag.*sin(TMangle);
n=(xx>4)*(xx-5)+1;
%Counter such that data from only the previous 4 steps is used
for kk=1:5
TT = TI(kk,n:xx-1); MM = TM(kk,n:xx-1); A4 = [TT.' ones(length(TT),1)]; b4 = MM.'; v4 = pinv(A4)*b4; TR(kk) = (v4(2)/v4(1));
%Matlab left divide operator used calculate result
TF(kk)=v4(1);
end
TImag=[TImag [-1*abs(TR(1)); -1*abs(TR(2)); -1*abs(TR(3)); -
1*abs(TR(4)); -1*abs(TR(5))] ]; TIangle=[TIangle [angle(TR(1)); angle(TR(2)); angle(TR(3));
angle(TR(4)); angle(TR(5))]];
%Inject new TI and record
Mag = TImag(:,xx)*65536; Angle = (TIangle(:,xx)/(2*pi))*65536;
T10 = round([Mag(1) Angle(1)]); T20 = round([Mag(2) Angle(2)]); T24 = round([Mag(3) Angle(3)]); T40 = round([Mag(4) Angle(4)]); T48 = round([Mag(5) Angle(5)]);
TIangle(:,xx)= (Angle/65536)*2*pi;

Minimisation of torque ripple-induced acoustic emissions from permanent magnet synchronous motors
154
[T10; T20; T24; T40; T48]
cc=ticcs; rx = cc.rtdx; configure(cc.rtdx,1024,4);
open(rx,'TI_ichan','w'); % Could use rx.open('ichannel','w') enable(rx,'TI_ichan');
inputdata=[T10 T20 T24 T40 T48]; %inputdata=[0 0 T20 T24 T40 T48]; writemsg(rx,'TI_ichan',int32(inputdata));
disp(['Reading itteration ',num2str(xx),' Data'])
pause(5)
trigwrite =
fopen(trig,'w');fprintf(trigwrite,'1');fclose(trigwrite); pause(5) trigwrite =
fopen(trig,'w');fprintf(trigwrite,'0');fclose(trigwrite); pause(5)
Mic_Data(:,:,xx)=textread(data);
[TM1, TM2] = fftdat(Mic_Data(:,Channel,xx),ENCR,Harmonics); TMmag = [TMmag TM1']; TMangle = [TMangle TM2'];
end
disp('END')