MINI-SPECTROMETERS - HamamatsuMini-spectrometers such as the C9404CA, C9405CB and C10082CA...
44
Integrating a HAMAMATSU image sensor, its driver circuit, and optical elements into a compact case MINI-SPECTROMETERS MINI-SPECTROMETERS Selection Guide Mar. 2013
Transcript of MINI-SPECTROMETERS - HamamatsuMini-spectrometers such as the C9404CA, C9405CB and C10082CA...

Integrating a HAMAMATSU image sensor, its driver circuit, and optical elements into a compact case
MINI-SPECTROMETERSMINI-SPECTROMETERS
Selection GuideM a r. 2 0 1 3

HAMAMATSU mini-spectrometers are compact polychro-mators made up of optical elements such as a grating, an image sensor and its driver circuit, all integrated into a compact case. By guiding light with an optical fiber into a mini-spectrometer, the light spectrum can be measured and then output from the USB port to a PC for data acqui-sition and analysis.High-performance spectrophotometers are used in a wide range of fields, such as chemical analysis. However, those spectrophotometers are usually large and expensive. More-over, the sample has to be brought into a laboratory where the spectrometer is installed. By merging our unique image sensor technology accumu-lated over many years with advanced MEMS technology such as holographic processing, HAMAMATSU has devel-oped mini-spectrometers featuring a compact size and low cost. Mini-spectrometers can be used in diverse applications in-cluding chemical analysis, color measurement, environ-mental measurement, and process control on production lines. HAMAMATSU also provides OEM models designed for installation into portable measuring devices.
Contents
1
Image sensor technology 3
Selection guide 51
Lineup of mini-spectrometers 722-1. For UV to near IR [TM series]
C10082CA, C10083CA C10082CAH, C10083CAH7
2-2. For UV to near IR [TM series] C10082MD, C10083MD 9
2-5. High resolution type [TG series] C11713CA, C11714CA 15
2-7. For near IR (up to 2.55 m) [TG series] C11118GA 19
2-3. For visible to near IR [TM series] C11697MA 11
2-6. For near IR [TG series] C9406GC, C9913GC, C9914GB 17
High sensitivity type High resolution type
Trigger-compatible
2-4. For UV or near IR [TG series] C9404CA, C9405CB C9404CAH
13High sensitivity type High resolution type
Compact and low costmini-spectrometers
Structure 263
2-8. Ultra-compact type [MS series]
232-9. Compact, low cost type [RC series] C11007MA, C11008MA C11009MA, C11010MAFor installation into measurement equipment
21For installation into measurement equipment C10988MA-01, C11708MA

* Micro-opto-electro-mechanical systems
MOEMS* technology supports mini-spectrometers
A grating is an optical element that disperses light into a spectrum. Grat-ings for mini-spectrometers (TG/TM series) use a transmission type (made of quartz) fabricated by a holographic process. The holographic process is an excellent technique ideal for mass production as it allows the grating to be fabricated directly onto the sub-strate, instead of fabricating a replica from the master grating. This makes it possible to separate light into a pre-cise spectrum and improves meas-urement throughput. It also reduces stray light levels to obtain high dif-fraction efficiency with low noise.
MEMS technology
� Excellent technology ideal for mass production� Low stray light level� High diffraction efficiency
Features
Features
Entrance slit
Collimatingmirror
Imagesensor
Transmissiongrating
Focusmirror
The detector that is the heart of the mini-spectrometer is a HAMAMATSU image sensor. It holds a well-earned, long-standing reputation among users in analysis and measurement fields.
Image sensor technology
� Back-thinned CCD image sensors� CMOS linear image sensors� InGaAs linear image sensors
SEM (Scanning Electron Microscope) image of grating
Image sensors used in mini-spectrometers
KACCC0287EA
2
27Characteristics4
Operation mode5 31
274-1. Spectral resolution294-2. Stray light304-3. Sensitivity
3737
37Related products8
35Measurement examples7
Dedicated software6 33
373737
8-1. Optical fibers for light input A9762-01, A9763-018-2. Coaxial cable for external trigger A106708-3. Compact UV-VIS S2D2 fiber light source L106718-4. High power UV-VIS fiber light source L102908-5. Compact 5 W xenon flash lamp module L9455-11/-12/-13, L11035-11/-12/-13
388-6. 2 W xenon flash lamp module L12336 series

3
Back-thinned CCD image sensors
Mini-spectrometers such as the C9404CA, C9405CB and C10082CA incor-porate a back-thinned CCD image sensor designed by HAMAMATSU for mini-spectrometers. Back-thinned CCD image sensors have high quantum efficiency in the UV region and are highly stable under UV light. They also operate in MPP mode to ensure a low dark current with no afterimage. All these features make mini-spectrometers with back-thinned CCD image sen-sors ideal for low-light-level photometry such as fluorescence measure-ment. IR-enhanced back-thinned CCD image sensor has high infrared sensi-tivity.
Image sensor technology
Features
HAMAMATSU image sensors built into mini-spectrometers
Spectral response
KMPDB0265EB
Pixel size (H × V)Number of active pixelsActive area (H × V)Spectral response rangeHorizontal clock phaseVertical clock phaseCCD node sensitivityDark current (MPP mode)Readout noise
Full wellcapacity
VerticalHorizontal
Dynamic rangeAnti-blooming
Window
m pixels
mmnm
--
V/e-
e-/pixel/se- rms
ke-
ke-
--
-
-
Parameter UnitS10420-1006-01 S10420-1106-01 S11510-100614 × 14
1024 × 6414.336 × 0.896
2048 × 6428.672 × 0.896
1024 × 6414.336 × 0.896
200 to 11004-phase2-phase
6.550660300
50000With anti-blooming
Quartz
C9404CAC9404CAHC11713CA
C9405CB
C10082CAC10082CAHC10083CA
C10083CAHC11714CA
Mini-spectrometerswith CCD mounted
S10420-1106-01
(1) Our unique process technology yields a high CCD node sensitivity (6.5 V/e-)
(2) High full well capacity and wide dynamic range, with anti-blooming function
(3) High sensitivity over a wide spectral range and nearly flat spectral response characteristics
(4) Pixel size and number of pixels optimized by taking resolution and stray light characteristics into account
(Typ. Ta=25 ˚C)
Mini-spectrometer Built-in image sensor
C10082MD, C10083MD
C10082CA, C10082CAH C10083CA, C10083CAH
S8378-1024Q
C11697MA
C11714CA
C11713CA
C9406GCC9913GC
C9914GB
C11007MA, C11009MA
-
C9405CB S11510-1006S10420-1006-01
G9204-512DG9204-512S
-
S8378-256N
TE-cooled typeNon-cooled type
Long wavelength type (peak sensitivity wavelength 1.95 m),TE-cooled type
Long wavelength type (peak sensitivity wavelength 2.3 m),TE-cooled type
InGaAs linear image sensor
CMOS linear image sensorC11008MA, C11010MA -IR-enhanced CMOS linear image sensor
C10988MA-01, C11708MA -CMOS linear image sensor
C11118GA G9208-256W
CMOS image sensor with amp array
IR-enhanced back-thinned CCD image sensorC9404CA, C9404CAH Back-thinned CCD image sensor
Back-thinned CCD image sensor
Back-thinned CCD image sensor
CMOS linear image sensor
S10420-1106-01
S10420-1106-01
S10420-1006-01
Qu
antu
m e
ffic
ien
cy (
%)
Wavelength (nm)
(Typ. Ta=25 ˚C)
0200 400 600 800 1000 1200
20
40
60
80
100
S10420-01 series
S11510-1006

4
CMOS linear image sensors
CMOS linear image sensors achieve excellent linearity due to a high-per-formance charge amplifier formed on-chip. They also offer high sensitivity in the UV to near infrared region while ensuring low noise. Compared to back-thinned CCD image sensors, CMOS linear image sensors can handle a large charge and are more suited for use in applications involving higher light intensity. High light level mini-spectrometers are ideal for spectropho-tometry, such as light source spectrum and absorbance measurements.
Spectral response (typical example)
KMIRB0037EC
KMPDB0213EB
InGaAs linear image sensors
Spectral response
UnitG9204-512D G9204-512SBuilt-in
image sensorof C9914GB
G9208-256WParameter
Pixel size (H × V)
Pixel pitch
Number of pixels
Peak sensitivity wavelength
Saturation charge*2
RMS noise voltage*3
(readout noise)
Cooling
25 × 500
25
512
1550
30
180
50 × 250
50
256
50 × 250
50
256
1950
30
180
2300
30
180
One-stageTE-cooled
Non-cooled Two-stageTE-cooled
Two-stageTE-cooled
m
m
pixels
nm
pC
V rms
-
*2: Vφ=5 V, CE=16 nV/e-, Vp=5 V*3: Standard deviation, Number of integration: 50
S8378-1024Q
G9204-512D
UnitS8378-256N S8378-1024QParameterPixel size (H × V)
Pixel pitch
Number of pixels
Spectral response range
Peak sensitivity wavelength
Dark current
Saturation charge
High gain
Low gain
High gain
Low gain
Feedback capacitanceof charge amplifier *1
Readoutnoise
Cooling
25 × 500 m
m
pixels
nm
nm
pA
pC
pF
mV rms
-
1024
2.1
256
0.9
0.2 0.4
200 to 1000
25
500
0.04
6.3
0.5
2.5
Non-cooled*1: Vg=0 V (High gain), Vg=5 V (Low gain)
InGaAs linear image sensors contain a CMOS charge amplifier array that accu-mulates the generated charge to provide a large output signal. InGaAs linear image sensors are preferably used for low-light-level detection in the near infra-red region. The C9913GC, C9914GB and C11118GA mini-spectrometers use a TE-cooled InGaAs linear image sensor and feature low noise operation. The In-GaAs linear image sensor (G9208-256W) used in the C11118GA is a long wave-length type that allows measurement of long-wavelength light up to 2.55 m.
(Typ. Ta=25 ˚C)
(Typ. Ta=25 ˚C)
Wavelength ( m)
0
0.2
0.8 1.0 1.2 1.6 2.0 2.21.4 1.8 2.62.4
0.4
0.6
0.8
1.0
1.2
1.4
Ph
oto
sen
siti
vity
(A
/W)
Wavelength (nm)
Rel
ativ
e se
nsiti
vity
(%)
200 4000
40
20
(Typ. Ta=25 ˚C)100
80
60
1000800600
(Typ.)
G9204-512S(TE-cooled)
G9204-512D(Non-cooled)
G9208-256WLong wavelengthtype (TE-cooled)
Built-inimage sensorof C9914GB
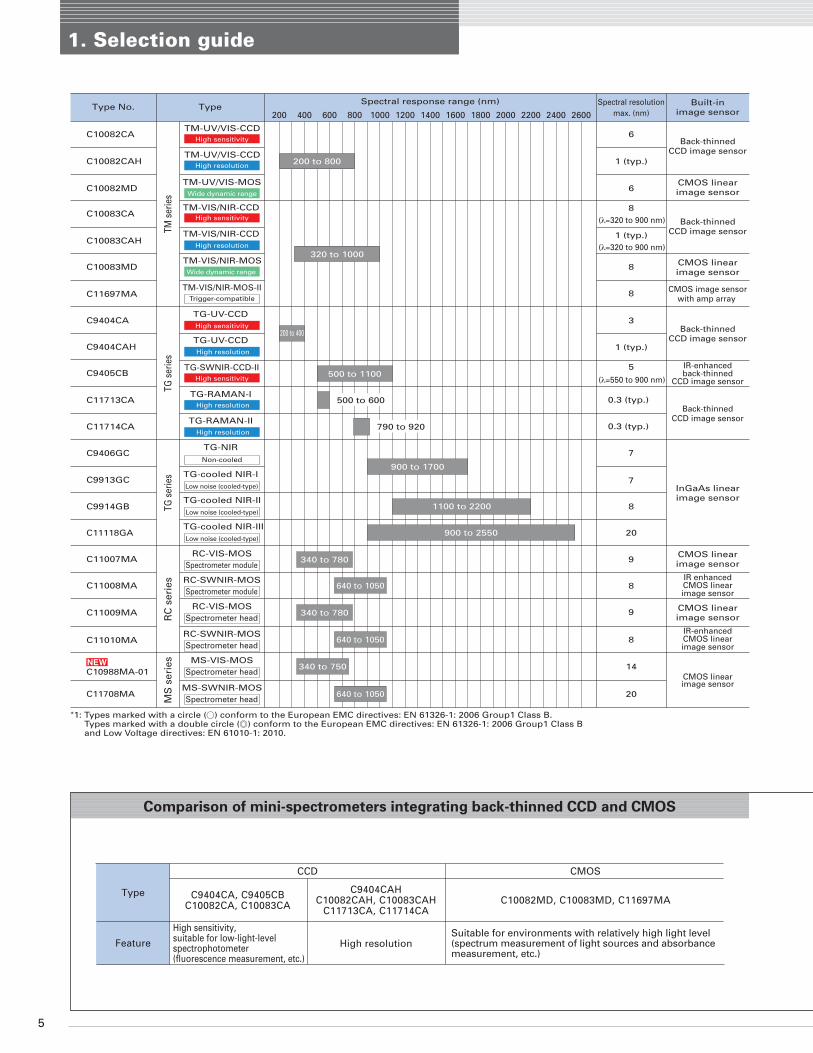
1. Selection guide
5
Type No. TypeSpectral response range (nm) Spectral resolution
max. (nm)
C10082CA
TM s
erie
sTG
ser
ies
TG s
erie
sC10082CAH
C10082MD
C10083CA
C10083CAH
C10083MD
C9404CA
C9404CAH
C9405CB
C9406GC
C9913GC
C9914GB
TM-UV/VIS-CCD
TM-VIS/NIR-CCD
TM-VIS/NIR-CCD
TM-VIS/NIR-MOS
TG-UV-CCD
TM-UV/VIS-CCD
TM-UV/VIS-MOS
High sensitivity
Wide dynamic range
High resolution
High sensitivity
TG-SWNIR-CCD-IIHigh sensitivity
High sensitivity
C11697MATM-VIS/NIR-MOS-II
Trigger-compatible
Wide dynamic range
High resolution
TG-UV-CCDHigh resolution
High resolution
High resolution
200 400 600 800 1000 1200 1400 1600 1800 22002000 26002400
200 to 800
320 to 1000
200 to 400
500 to 1100
900 to 1700
6
1 (typ.)
6
8(λ=320 to 900 nm)
(λ=320 to 900 nm)
(λ=550 to 900 nm)
1 (typ.)
1 (typ.)
8
8
3
5
7
7
8
20
Non-cooled
TG-NIR
C11714CA 0.3 (typ.)TG-RAMAN-II
C11713CA 0.3 (typ.)TG-RAMAN-I
TG-cooled NIR-ILow noise (cooled-type)
TG-cooled NIR-IILow noise (cooled-type)
TG-cooled NIR-IIILow noise (cooled-type)
RC-VIS-MOSSpectrometer module
RC-VIS-MOSSpectrometer head
RC-SWNIR-MOSSpectrometer head
9
9
RC
ser
ies
MS
ser
ies
RC-SWNIR-MOSSpectrometer module
8
8
14
20
340 to 780
340 to 780
340 to 750
640 to 1050
640 to 1050
640 to 1050
Built-inimage sensor
Back-thinnedCCD image sensor
CMOS linearimage sensor
CMOS linearimage sensor
CMOS image sensorwith amp array
Back-thinnedCCD image sensor
Back-thinnedCCD image sensor
IR-enhancedback-thinned
CCD image sensor
Back-thinnedCCD image sensor
InGaAs linearimage sensor
CMOS linearimage sensor
IR enhancedCMOS linearimage sensor
CMOS linearimage sensor
CMOS linearimage sensor
IR-enhancedCMOS linearimage sensor
*1: Types marked with a circle ( ) conform to the European EMC directives: EN 61326-1: 2006 Group1 Class B.Types marked with a double circle ( ) conform to the European EMC directives: EN 61326-1: 2006 Group1 Class B and Low Voltage directives: EN 61010-1: 2010.
C11007MA
C11008MA
C11118GA
C10988MA-01
C11708MA
C11009MA
C11010MA
MS-VIS-MOSSpectrometer head
MS-SWNIR-MOSSpectrometer head
1100 to 2200
900 to 2550
Comparison of mini-spectrometers integrating back-thinned CCD and CMOS
Feature
CCD CMOS
High sensitivity, suitable for low-light-level spectrophotometer(fluorescence measurement, etc.)
Suitable for environments with relatively high light level(spectrum measurement of light sources and absorbancemeasurement, etc.)
C9404CA, C9405CB C10082CA, C10083CA C10082MD, C10083MD, C11697MA
High resolution
C9404CAHC10082CAH, C10083CAH
C11713CA, C11714CA
Type
500 to 600
790 to 920

6
FeaturePageno.
P.9
P.9
P.13
P.13
P.7
P.17
P.19
P.7
● High sensitivity● Ideal for low-light-level measurement
(fluorescence measurement, etc.)● C10082CAH: High resolution of 1 nm
● High sensitivity● Ideal for low-light-level measurement
(fluorescence measurement, etc.)● C10083CAH: High resolution of 1 nm
● Trigger function included● Ideal for measurement of pulsed light
emission
● High sensitivity● Ideal for low-light-level measurement
(fluorescence measurement, etc.)● C9404CAH: High resolution of 1 nm
● For NIR (near infrared) band● Low-noise cooled type available● C9914GB: Extended IR sensitivity
up to 2.2 m
● Extended IR sensitivity up to 2.55 m
● High infrared sensitivity● Ideal for low-light-level measurement
(fluorescence measurement, etc.)
● Suitable for environments with relativelyhigh light intensity (spectrum measurement of light sources, absorbance measurement, etc.)
● Suitable for environments with relativelyhigh light intensity (spectrum measurement of light sources, absorbance measurement, etc.)
● High sensitivity● High resolution: 0.3 nm● Ideal for raman spectrophotometry
Number ofpixels
2048
1024
2048
1024
1024
1024
512
256
256
-
-
-● For installation into measurement
equipment
● Tumb size● Slit input
P.23
P.21
A/Dconversion
16-bit
16-bit
16-bit
16-bit
16-bit
16-bit
16-bit
16-bit
Interface
USB 1.1
USB 1.1
USB 1.1
USB 2.0
USB 1.1
USB 1.1
USB 1.1
USB 2.0
USB 1.1
Integrationtime(ms)
5 to 10000
5 to 1000
6 s to40000 s
4 s to100000 s
5 to 10000
10 to 10000
5 to 10000
10 to 10000
10 to 10000
10 to 10000
5 to 10000
External powersupply
-
+5 V
-
+5 V
+5 V
-
+5 V
+5 V
+5 V/+12 V
-
External trigger(reference page)
CE *1
marking
(P.31)
(P.32)P.111024 -
P.15
1024
2048
10 to 10000
-
-
-
-
● Compact and low price P.23
256 - - -
256 - - -
-
-
KACCB0146EB
Measurable optical power entering optical fiber
10-14 10-12 10-10 10-8 10-6
Light power * (W)
C10082CA (CCD type)
C10082MD (CMOS type)
KACCB0133EE
Output comparison
Wavelength (nm)
Rel
ativ
e se
nsi
tivi
ty*
200 300 400 500 600 700 800 90010-5
10-4
10-3
10-2
10-1
100
101
1000
C10083CA(Slit width 70 m, NA 0.22)C10082CA(Slit width 70 m, NA 0.22)C10083CAH(Slit width 10 m, NA 0.11)C10082CAH(Slit width 10 m, NA 0.11)C10083MDC10082MD
* A/D count when constant light level enters optical fiber. (Fiber core diameter: 600 m, assuming no attenuation in optical fiber)
* Fiber core diameter: 600 m, assumingno attenuation in optical fiber
(Typ. Ta=25 ˚C)
(P.31)
(P.31)
(P.31)
(P.32)

2. Lineup of mini-spectrometers
7
2-1. For UV to near IR [TM series]
● Built-in back-thinned CCD image sensor:Sensitivity is about two orders of magnitude higherthan CMOS image sensor types.
● C10082CAH, C10083CAH: High resolution of 1 nm
● High throughput due to transmission grating made of quartz
● Highly accurate optical characteristics
● Wide spectral response range
● Easy to install into equipment
● Wavelength conversion factor* 1 is recorded in internal memory
● Supports external trigger input* 2
Application examples
● Low-light-level measurement such as fluorescence measurement
● Semiconductor process control
● Evaluation of light source characteristics
KACCB0161ED
These are high sensitivity mini-spectrometers using a back-thinned CCD image sensor as the detector. Their sensitivity is about two or-ders of magnitude higher than mini-spectrometers using a CMOS linear image sensor. This makes these mini-spectrometers ideal for low-light-level photometry such as fluorescence measurement.The C10082CAH and C10083CAH are high resolution types that de-liver a spectral resolution of 1 nm.
C10082CA, C10083CA
C10082CAH, C10083CAH
High sensitivity type
High resolution type
*1: A conversion factor for converting the image sensor pixel number into a wavelength is recorded in the module.A calculation factor for converting the A/D converted count into the input light intensity is not provided.
*2: Coaxial cable for external trigger is sold separately.
Features
Built-inCCD image sensor
S10420-1106-01
200 400 1000
Wavelength (nm)
600 800 1200 1400 1600 1800 2000 2200
TG-NIR C9406GC
TG-cooled NIR-I C9913GC
TG-cooled NIR-II C9914GB
TG-UV-CCD C9404CA, C9404CAH
TM-UV/VIS-CCDC10082CA, C10082CAH
TM-VIS/NIR-CCDC10083CA, C10083CAH
TM-VIS/NIR-MOS C10083MD
TM-UV/VIS-MOS C10082MD
TG-cooled NIR-III C11118GA
2400 2600
TM-VIS/NIR-MOS-II C11697MA
TG-RAMAN-I C11713CA
TG-RAMAN-II C11714CA
TG-SWNIR-CCD-II C9405CB

8
KACCB0168EC
KACCA0188EE
Output comparison(relative value)
Spectral resolution Dimensional outline (unit: mm, tolerance unless otherwise noted: ±0.5)
KACCB0169EC
Wavelength (nm)
Sp
ectr
al r
eso
luti
on
(n
m)
200 300 400 500 600 700 800 900 1000
8.0
7.0
6.0
5.0
4.0
3.0
2.0
1.0
0.0
C10083CA (Slit width 70 m, NA 0.22)C10082CA (Slit width 70 m, NA 0.22)C10083CAH (Slit width 10 m, NA 0.11)C10082CAH (Slit width 10 m, NA 0.11)
C10082CAC10082CAHC10082MD
C10083CAC10083CAHC10083MD
Spectral response range nm
Spectral resolution (FWHM)*3 nm
Wavelength reproducibility*5 nm
Wavelength temperature dependence nm/˚C
Parameter
320 to 1000200 to 800
-33 max. -30 max.
6 max. 1 typ. 8*4 max. 1*4 typ.
-0.2 to +0.2
-0.04 to +0.04
Spectral stray light*3 *6 dB
UnitTM-UV/VIS-CCD TM-VIS/NIR-CCD
C10082CA C10082CAH C10083CA C10083CAH
■ Optical characteristics
A/D conversion bits
Integration time ms
Interface -
Consumption current of USB bus power mA
Parameter
16
10 to 10000
USB 1.1
100 max.
External power supply V5
UnitC10083CAC10082CA C10083CAHC10082CAH
■ Electrical characteristics
Dimensions (W × D × H) mm
Image sensor -
Number of pixels pixels
Slit*7 (H × V) m
Parameter
95 × 92 × 76
Weight g685
Back-thinned CCD image sensor (S10420-1106-01)
2048
70 × 800
NA*8 -
Connector for optical fiber -
Operating temperature*9 ˚C
Storage temperature*9 ˚C
0.22
10 × 1000
0.11
70 × 800
0.22
10 × 1000
0.11
SMA905D
+5 to +40
-20 to +70
Unit
■ Structure/Absolute maximum ratings
C10083CAC10082CA C10083CAHC10082CAH
*3: Depends on the slit opening. Values were measured with the slit listed in the table “■ Structure/Absolute maximum ratings”*4: λ = 320 to 900 nm*5: Measured under constant light input conditions*6: When monochromatic light of the following wavelengths is input, spectral stray light is defined as the ratio of the count measured at the input wave-
length, to the count measured in a region of the input wavelength ±40 nm.C10082CA, C10082CAH: 500 nm, C10083CA, C10083CAH: 650 nm
*7: Entrance slit aperture size*8: Numeric aperture (solid angle)*9: No condensation
Wavelength (nm)
Rel
ativ
e se
nsi
tivi
ty*
200 300 400 500 600 700 800 90010-5
10-4
10-3
10-2
10-1
100
101
1000
(Typ. Ta=25 ˚C) (Typ. Ta=25 ˚C)
76
95
Weight: 685 g
3117 ± 0.2
(2 ×) M3 tap depth 5(from backside)
92
1740
± 0
.2
* A/D count when constant light level entersoptical fiber.(Fiber core diameter: 600 m, assumingno attenuation in optical fiber)
Note: C10082CA/C10083CA series can change the spectral resolution by selectingthe slit width and optical NA. Refer to page 30 for details of product lineup.

9
2-2. For UV to near IR
● High throughput due to transmission grating made of quartz
● Highly accurate optical characteristics
● No external power supply required: Uses USB bus power
● Wide spectral response range
● Compact design for easy assembly
● Wavelength conversion factor * 1 is recorded in internal memory
● Supports external trigger input * 2
● Light source spectrum measurement
● Sunlight or illumination analysis
● Absorbance measurement
C10082MD, C10083MD
*1: A conversion factor for converting the image sensor pixel number into a wavelength is recorded in the module.A calculation factor for converting the A/D converted count into the input light intensity is not provided.
*2: Coaxial cable for external trigger is sold separately.
The C10082MD and C10083MD mini-spectrometers employ a CMOS linear image sensor as the detector. These are well suited for spectrophotometry at relatively high light levels such as ab-sorbance measurement and light source spectrum evaluation.
Built-inCMOS linear image sensor
S8378-1024Q
Features Application examples
[TM series]
KACCB0162ED
400 1000200
Wavelength (nm)
600 800 1200 1400 1600 1800 2000 2200
TG-NIR C9406GC
TG-cooled NIR-I C9913GC
TG-cooled NIR-II C9914GB
TG-UV-CCD C9404CA, C9404CAH
TM-UV/VIS-CCDC10082CA, C10082CAH
TM-VIS/NIR-CCDC10083CA, C10083CAH
TM-VIS/NIR-MOS C10083MD
TM-UV/VIS-MOS C10082MD
TG-cooled NIR-III C11118GA
2400 2600
TM-VIS/NIR-MOS-II C11697MA
TG-SWNIR-CCD-II C9405CB
TG-RAMAN-I C11713CA
TG-RAMAN-II C11714CA

10
2. Lineup of mini-spectrometers
Spectral response range nm
Spectral resolution (FWHM)*3 nm
Wavelength reproducibility*4 nm
Wavelength temperature dependence nm/˚C
Parameter
320 to 1000
8 max.
200 to 800
6 max.
-0.2 to +0.2
-0.04 to +0.04
Spectral stray light*3 *5 dB-35 max. -33 max.
UnitTM-UV/VIS-MOS TM-VIS/NIR-MOS
C10082MD C10083MD
■ Optical characteristics
A/D conversion bits
Integration time ms
Interface -
Consumption current of USB bus power mA
Parameter
16
5 to 10000
USB 1.1
100 max.
UnitC10083MD
■ Electrical characteristics
Dimensions (W × D × H) mm
Image sensor -
Number of pixels pixels
Slit*6 (H x V) m
Parameter
94 × 90 × 55
Weight g470
CMOS linear image sensor (S8378-1024Q)
1024
70 × 800
NA*7 -
Connector for optical fiber -
Operating temperature*8 ˚C
Storage temperature*8 ˚C
0.22
SMA905D
+5 to +40
-20 to +70
UnitC10083MD
C10082MD
C10082MD
■ Structure/Absolute maximum ratings
*3: Depends on the slit opening. Values were measured with the slit listed in the table “■ Structure/Absolute maximum ratings”*4: Measured under constant light input conditions*5: When monochromatic light of the following wavelengths is input, spectral stray light is defined as the ratio of the count measured at the input wave-
length, to the count measured in a region of the input wavelength ±40 nm.C10082MD: 500 nm, C10083MD: 650 nm
*6: Entrance slit aperture size*7: Numeric aperture (solid angle)*8: No condensation
Measurable optical power entering optical fiber
KACCA0171ED
Dimensional outline (unit: mm, tolerance unless otherwise noted: ±0.5)
KACCB0146EB
10-14 10-12 10-10 10-8 10-6
Light power * (W)
C10082CA (CCD type)
C10082MD (CMOS type)
* Fiber core diameter: 600 m, assumingno attenuation in optical fiber
Weight: 470 g
94
30.5
55
90
40 ±
0.2
15.5
17 ± 0.2
(2 ×) M3 tap depth 5(from backside)

11
2-3. For visible to near IR
● Trigger function included (reter to page 34 for details)
● High sensitivity(compared with the previous CMOS image sensor type)
● High-speed readout (2 ms approx.)
● Simultaneous charge integration type
● Wavelength conversion factor*1 is recorded in internal memory.
● Quality check on LED test line
● Measurement of pulsed light emission
C11697MA
*1: A conversion factor for converting the image sensor pixel number into a wavelength is recorded in the module.A calculation factor for converting the A/D converted count into the input light intensity is not provided.
The C11697MA is a mini-spectrometer with a newly developed CMOS image sensor with amp array mounted on the optical sys-tem platform of the previous type C10083MD. The trigger func-tion accepts even short-time integration so emission spectra from pulsed light can be measured. The significantly reduced readout time makes the C11697MA suitable for the testing of LED, etc. on production lines.
Built-in CMOS image sensorwith amp array
Features Application examples
[TM series]
KACCB0227EB
Wavelength (nm)
Trigger-compatible
400 1000200 600 800 1200 1400 1600 1800 2000 2200
TG-NIR C9406GC
TG-cooled NIR-I C9913GC
TG-cooled NIR-II C9914GB
TG-UV-CCD C9404CA, C9404CAH
TM-UV/VIS-CCDC10082CA, C10082CAH
TM-VIS/NIR-CCDC10083CA, C10083CAH
TM-VIS/NIR-MOS C10083MD
TM-UV/VIS-MOS C10082MD
TG-cooled NIR-III C11118GA
2400 2600
TM-VIS/NIR-MOS-II C11697MA
TG-SWNIR-CCD-II C9405CB
TG-RAMAN-I C11713CA
TG-RAMAN-II C11714CA

12
2. Lineup of mini-spectrometers
Spectral response range nm
Spectral resolution (FWHM)*2 nm
Wavelength reproducibility*3 nm
Wavelength temperature dependence nm/˚C
Parameter
320 to 1000
8 max.
-0.2 to +0.2
-0.04 to +0.04
Spectral stray light*2 *4 dB-33 max.
UnitTM-VIS/NIR-MOS-II
C11697MA
■ Optical characteristics
A/D conversion bits
Integration time s
Interface -
Consumption current of USB bus power mA
Parameter
16
4 to 100000
USB 2.0
250 max.
UnitC11697MA
■ Electrical characteristics
Dimensions (W × D × H) mm
Image sensor -
Number of pixels pixels
Slit (H × V)*5 m
Parameter
94 × 90 × 55
Weight g470
CMOS image sensor with amp array
1024
70 × 800
NA*6 -
Connector for optical fiber -
Operating temperature*7 ˚C
Storage temperature*7 ˚C
0.22
SMA905D
+5 to +40
-20 to +70
Unit
■ Structure/Absolute maximum ratings
*2: Depends on the slit opening. Values were measured with the slit listed in the table “■ Structure/Absolute maximum ratings”.*3: Measured under constant light input conditions*4: When monochromatic light of 650 nm is input, spectral stray light is defined as the ratio of the count measured at the input wavelength, to the count
measured in a region of the input wavelength ±40 nm.
*5: Entrance slit aperture size*6: Numeric aperture (solid angle)*7: No condensation
*8: An example of trigger function. See page 34 for details.
Trigger function
KACCA0171ED
Dimensional outline (unit: mm, tolerance unless otherwise noted: ±0.5)
KACCC0569EAWeight: 470 g
94
30.5
55
90
40 ±
0.2
15.5
17 ± 0.2
(2 ×) M3 tap depth 5(from backside)
Measurement period
Charge integration
Charge readout(A/D conversion)
Trigger input(at falling edge)
Digital data
Sensor operation (charge integration) starts with a trigger sig-nal and digital data is acquired*8.
This mode starts sensor operation (integration) at the edge (rising or falling edge selectable) of an external trigger input to the external trigger terminal, and acquires digital data.
Data measurement at external trigger input (synchronous)
C11697MA

13
2-4. For UV or near IR
● Built-in back-thinned CCD image sensor: Sensitivity is about two orders of magnitude higher than CMOS image sensor types.(C9404CA, C9404CAH)
● Enhanced near infrared sensitivity (C9405CB)
● C9404CAH: High resolution of 1 nm
● High throughput due to transmission grating made of quartz
● Highly accurate optical characteristics
● Wavelength conversion factor *1 is recorded in internal memory
● Supports external trigger input * 2
*1: A conversion factor for converting the image sensor pixel number into a wavelength is recorded in the module.A calculation factor for converting the A/D converted count into the input light intensity is not provided.
*2: Coaxial cable for external trigger is sold separately.
Built-in CCD image sensor
S11510-1006
Built-in CCD image sensor
S10420-1006-01
These are high sensitivity mini-spectrometers using a back-thin-ned CCD image sensor as the detector. The C9404CA is designed exclusively for photometry in the UV region (spectral response range 200 to 400 nm), while C9405CB has a spectral response range from 500 to 1100 nm. The C9404CAH is a high resolution type that delivers high spectral resolution down to 1 nm.
C9404CA, C9405CB
C9404CAH
High sensitivity type
High resolution type
● Low-light-level measurement such as fluorescence measurement
● Spectrum evaluation of UV light sources
C9404CA, C9404CAH (TG-UV-CCD)
● Detection of saccharic acids in foods
● Plastic sorting
● Film thickness meter
C9405CB (TG-SWNIR-CCD-II)
Features Application examples
[TG series]
KACCB0163ED
Wavelength (nm)
400 1000200 600 800 1200 1400 1600 1800 2000 2200
TG-NIR C9406GC
TG-cooled NIR-I C9913GC
TG-cooled NIR-II C9914GB
TG-UV-CCD C9404CA, C9404CAH
TM-UV/VIS-CCDC10082CA, C10082CAH
TM-VIS/NIR-CCDC10083CA, C10083CAH
TM-VIS/NIR-MOS C10083MD
TM-UV/VIS-MOS C10082MD
TG-cooled NIR-III C11118GA
2400 2600
TM-VIS/NIR-MOS-II C11697MA
TG-SWNIR-CCD-II C9405CB
TG-RAMAN-I C11713CA
TG-RAMAN-II C11714CA

14
2. Lineup of mini-spectrometers
*6: Entrance slit aperture size*7: Numeric aperture (solid angle)*8: No condensation
■ Optical characteristics
■ Structure/Absolute maximum ratings
■ Electrical characteristics
KACCA0202EC
A/D conversion bits
Integration time ms
Interface -
Consumption current of USB bus power mA
Parameter
16
10 to 10000
USB 1.1
150 max.
5
UnitC9404CA C9404CAH C9405CB
External power supply V
Dimensions (W × D × H) mm
Image sensor -
Number of pixels pixels
Slit*6 (H × V) m
Parameter
Back-thinned CCD image sensor(S10420-1006-01)
IR-enhanced back-thinnedCCD image sensor
(S11510-1006)
125.7 × 115.7 × 75
Weight g670
140 × 500 10 × 1000 70 × 800
NA*7 -
Connector for optical fiber -
Operating temperature*8 ˚C
Storage temperature*8 ˚C
0.220.11
SMA905D
+5 to +40
-20 to +70
UnitC9404CA C9404CAH C9405CB
1024
KACCB0292EA
Dimensional outline (unit: mm, tolerance unless otherwise noted: ±0.5)
KACCB0291EA
Output comparison Resolution
Spectral response range nm
Spectral resolution (FWHM)*3 nm
Wavelength reproducibility*4 nm
Wavelength temperature dependence nm/˚C
Parameter
500 to 1100
5 max.[550 to 900 nm]
200 to 400
3 max. 1 typ.
-0.1 to +0.1 -0.2 to +0.2
-0.02 to +0.02
Spectral stray light*3 *5 dB-35 max.
UnitTG-UV-CCD TG-SWNIR-CCD-II
C9404CA C9404CAH C9405CB
*3: Depends on the slit opening. Values were measured with the slit listed in the table “■ Structure/Absolute maximum ratings”*4: Measured under constant light input conditions*5: When monochromatic light of the following wavelengths is input, spectral stray light is defined as the ratio of the count measured at the input wave-
length, to the count measured in a region of the input wavelength ±20 nm (C9404CA, C9404CAH) or ±40 nm (C9405CB).C9404CA, C9404CAH: 300 nm, C9405CB: 800 nm
Note) The C9405CB generates high-order light due to the structure, because the following condition is met:
.To eliminate this high-order light, use a long-pass filter with the C9405CB as needed.
* A/D count when constant light level entersoptical fiber.(Fiber core diameter: 600 m, assumingno attenuation in optical fiber)
Upper limit of spectral response range> 2Lower limit of spectral response range
(Typ. Ta=25 ˚C)
Wavelength (nm)
Sp
ectr
al r
eso
luti
on
(n
m)
200 300 400 500 600 700 800 900 11001000
4
5
6
7
3
2
1
0
C9404CA (Slit width 140 m, NA 0.11)
C9404CAH (Slit width 10 m, NA 0.11)
C9405CB (Slit width 70 m, NA 0.22)
125.7
35
115.
7
75.0
20 ± 0.2
2045
± 0
.2
(2 ×) M3 tap depth 5(from backside)
Weight: 670 g
200 300 500400 600 700 900800 1000 1100
Wavelength (nm)
10-3
10-2
10-1
100
Rel
ativ
e se
nsi
tivi
ty
(Typ. Ta=25 ˚C)
C9405CB500 to 1100 nm
C9404CAH200 to 400 nm
C9404CA200 to 400 nm

15
Built-in CCD image sensor Built-in CCD image sensor
S10420-1106-01 S10420-1006-01
2-5. High resolution type
Features
● High accuracy optical characteristics: spectral resolution 0.3 nm
● Integrated with back-thinned type CCD image sensor with improved etaloning characteristics
● High throughput due to transmission grating made of quartz
● Easy to install into equipment due to compact design
● Wavelength conversion factor is recorded in internal memory *1
*1: A conversion factor for converting the image sensor pixel number into a wavelength is recorded in the module. A calculation factor for converting the A/D converted count into the input light intensity is not provided.
These mini-spectrometers incorporate a back-thinned CCD image sensor with improved etaloning characteristics which we have de-veloped using our unique sensor technology, and are able to make stable measurement with high efficiency. The C11713CA has sensi-tivity in a wavelength range of 500 to 600 nm, while the C11714CA covers a range of 790 to 920 nm. Both types offer a spectral resolu-tion of 0.3 nm.
C11713CA, C11714CA
● Raman spectrophotometry
Application examples
[TG series]
KACCB0228EB
Wavelength (nm)
400 1000200 600 800 1200 1400 1600 1800 2000 2200
TG-NIR C9406GC
TG-cooled NIR-I C9913GC
TG-cooled NIR-II C9914GB
TG-UV-CCD C9404CA, C9404CAH
TM-UV/VIS-CCDC10082CA, C10082CAH
TM-VIS/NIR-CCDC10083CA, C10083CAH
TM-VIS/NIR-MOS C10083MD
TM-UV/VIS-MOS C10082MD
TG-cooled NIR-III C11118GA
2400 2600
TM-VIS/NIR-MOS-II C11697MA
TG-SWNIR-CCD-II C9405CB
TG-RAMAN-I C11713CA
TG-RAMAN-II C11714CA

16
2. Lineup of mini-spectrometers
*5: Entrance slit aperture size*6: Numeric aperture (solid angle)*7: No condensation
■ Optical characteristics
A/D conversion bits
Integration time ms
Interface -
Consumption current of USB bus power
Consumption current of external power supply
mA
A
Parameter
16
10 to 10000
USB 1.1
150 max.
0.8 max.
External power supply V5
UnitC11713CA
■ Electrical characteristics
Dimensions (W × D × H) mm
Image sensor -
Number of pixels pixels
Slit*5 (H × V) m
Parameter
120 × 70 × 60
Weight g592
Back-thinned CCD image sensor(S10420-1106-01)
Back-thinned CCD image sensor(S10420-1006-01)
10 × 1000
NA*6 -
Connector for optical fiber -
Operating temperature*7 ˚C
Storage temperature*7 ˚C
1024
0.11
2048
SMA905D
+5 to +40
-20 to +70
UnitC11713CA
C11714CA
C11714CA
■ Structure/Absolute maximum ratings
Spectral response range nm
Spectral resolution (FWHM)*2 nm
Wavelength reproducibility*3 nm
Wavelength temperature dependence nm/˚C
Parameter
790 to 920
0.3 typ., 0.5 max.
500 to 600
-0.1 to +0.1
-0.04 to +0.04
Spectral stray light*2 *4 dB-30 max.
UnitTG-RAMAN-I TG-RAMAN-II
C11713CA C11714CA
*2: Depends on the slit opening. Values were measured with the slit listed in the table “■ Structure/Absolute maximum ratings”.*3: Measured under constant light input conditions*4: When monocharomatic light of the following wavelengths is input, spectral stray light is defined as the ratio of the count measured at the input wave-
length, to the count measured in a region of the input wavelength ±10 nmC11713CA: 550 nm, C11714CA: 860 nm
Dark output vs. temperature
KACCB0224EA
C11713CA
KACCB0226EA
C11714CA
KACCA0281EA
Dimensional outline (unit: mm, unless otherwise noted: ±0.5)
Wavelength (nm)
Sp
ectr
al r
eso
luti
on
(n
m)
450 550 600500 650
0.1
0
0.2
0.3
0.4(Typ. Ta=25 ˚C)
750 950800 850 900
0.1
0
0.2
0.3
0.4
Wavelength (nm)
Sp
ectr
al r
eso
luti
on
(n
m)
(Typ. Ta=25 ˚C)
(4 ×) M3.0 tap depth 5(from backside)
60.0
120.0
70.0
110.0 ± 0.2
50.0
± 0
.2
Weight: 592 g

17
2-6. For near IR
Features
● Built-in near infrared InGaAs linear image sensor
● High throughput due to transmission grating made of quartz
● Highly accurate optical characteristics
● C9406GC: No external power supply required (Uses USB bus power)(C9913GC, C9914GB: Each requires 5 V and 12 V power supplies)
● Low noise measurement (C9913GC, C9914GB)
● Compact design for easy assembly
● Wavelength conversion factor *1 is recorded in internal memory
*1: A conversion factor for converting the image sensor pixel number into a wavelength is recorded in the module. A calculation factor for converting the A/D converted count into the input light intensity is not provided.
C9406GC, C9913GC, C9914GB
● Water content measurement
● Optical communication component testing
● Film thickness measurement
C9406GC (TG-NIR)
● Water content measurement
● Component analysis in food, agriculture fields, etc.
● Process control for chemical products
C9913GC (TG-cooled NIR- I), C9914GB (TG-cooled NIR-II)
These mini-spectrometers use an InGaAs linear image sensor designed for near infrared detection. Their spectral response range is from 0.9 to 1.7 m or from 1.1 to 2.2 m. TE-cooled and low noise types are also provided.
Application examples
[TG series]
G9204-512D
Built-in InGaAs linearimage sensor
Built-in TE-cooled typeInGaAs linear image sensor
G9204-512S
C9406GC
C9914GB
KACCB0165ED
Wavelength (nm)
400 1000200 600 800 1200 1400 1600 1800 2000 2200
TG-NIR C9406GC
TG-cooled NIR-I C9913GC
TG-cooled NIR-II C9914GB
TG-UV-CCD C9404CA, C9404CAH
TM-UV/VIS-CCDC10082CA, C10082CAH
TM-VIS/NIR-CCDC10083CA, C10083CAH
TM-VIS/NIR-MOS C10083MD
TM-UV/VIS-MOS C10082MD
TG-cooled NIR-III C11118GA
2400 2600
TM-VIS/NIR-MOS-II C11697MA
TG-SWNIR-CCD-II C9405CB
TG-RAMAN-I C11713CA
TG-RAMAN-II C11714CA

18
2. Lineup of mini-spectrometers
*2: Depends on the slit opening. Values were measured with the slit listed in the table “■ Structure/Absolute maximum ratings”.*3: Measured under constant light input conditions*4: When monochromatic light of the following wavelengths is input, spectral stray light is defined as the ratio of the count measured at the input wave-
length, to the count measured in a region of the input wavelength ±40 nm.C9406GC, C9913GC: 1300 nm, C9914GB: 1650 nm
KACCA0146EC
KACCA0158EC
C9406GC
C9913GC, C9914GB218 142
80
COOLED NIR-II (l: 2.2)Spectrometer
COOLED NIR-II (l: 2.2)Spectrometer
Spectral response range nm
Spectral resolution (FWHM)*2 nm
Wavelength reproducibility*3 nm
Wavelength temperature dependence nm/˚C
Parameter
1100 to 2200
8 max.
900 to 1700
7 max.
-0.2 to +0.2 -0.4 to +0.4
900 to 1700
7 max.
-0.2 to +0.2
-0.02 to +0.02 -0.04 to +0.04-0.02 to +0.02
Spectral stray light*2 *4 dB-35 max.
UnitTG-NIR TG-cooled NIR-II
C9406GC C9914GB
TG-cooled NIR-I
C9913GC
■ Optical characteristics
A/D conversion bits
Integration time ms
Interface -
Consumption current of USB bus power mA
Parameter
16
5 to 10000 5 to 1000
USB 1.1
250 max.
UnitC9913GC
■ Electrical characteristics
C9406GC C9914GB
*5: No defective pixel (at low gain). Defective pixels are those whose electrical and optical characteristics do not meet our specifications.*6: Entrance slit aperture size *7: Numeric aperture (solid angle)*8: No condensation*9: For controllable cooling temperature*10: Maximum value in steady state. Note that inrush current flows at start-up.
AC adapter for external power supply is attached (C9913GC, C9914GB).
Dimensions (W × D × H) mm
Image sensor -
Number of pixels*5 pixels
Slit*6 (H × V) m
Parameter
38.5 × 106 × 86 142 × 218 × 80
InGaAs linear image sensor(G9204-512D)
TE-cooled type InGaAs linear image sensor (G9204-512S)
TE-cooled type InGaAs linearimage sensor
512 512 256
Weight g270 1700 1700
70 × 500 70 × 500 70 × 500
NA*7 -
Connector for optical fiber -
Operating temperature*8 ˚C
Storage temperature*8 ˚C
0.22
SMA905D
+5 to +35 (+5 to +30*9)+5 to +40
-20 to +70
Power supply for cooling element max.*10 V/A5/1.8- 5/2.8
Power supply for cooling fan V/A12/0.2-
UnitC9913GCC9406GC C9914GB
■ Structure/Absolute maximum ratings
Dimensional outline (unit: mm, tolerance unless otherwise noted: ±0.5)
38.5
16.0
105.5
41.8
68.6
85.6
49.7
(40.
0)
20.0
85.6
(2×) M3 tap depth 5.0from backside
Weight: 270 g
Weight: 1.7 kg
Spectral response of InGaAs linear image sensors
KMIRB0060EAWavelength ( m)
0
0.2
0.8 1.0 1.2 1.6 2.0 2.21.4 1.8 2.4
(Typ.)
0.4
0.6
0.8
1.0
1.2
1.4
Ph
oto
sen
siti
vity
(A
/W)
G9204-512S(TE-cooled)
G9204-512D(Non-cooled)
Built-inimage sensorof C9914GB

19
2-7. For near IR (up to 2.55 m)
Features
● Spectral response range: 0.9 to 2.55 m
● Compatible with USB 2.0 interface
● High throughput due to transmission grating made of quartz
● Highly accurate optical characteristics
● Low noise: cooled type
● Compact design for easy assembly
● Wavelength conversion factor *1 is recorded in internal memory
● Compatible with external trigger *2 (refer to page 34 for details)
*1: A conversion factor for converting the image sensor pixel number into a wavelength is recorded in the module. A calculation factor for converting the A/D converted count into the input light intensity is not provided.
*2: Coaxial cable for external trigger is sold separately.
C11118GA
● Measurement of C-H group absorption (2.3 m band)
● Component analysis in food, agriculture fields, etc.
The C11118GA is a near infrared mini-spectrometer with a spectral response range extending to 2.55 m.USB 2.0 is newly employed as the interface. The C11118GA also allows operation by external trigger.
Application examples
[TG series]
KACCB0212EC
Wavelength (nm)
Built-in TE-cooled typeInGaAs linear image sensor
G9208-256W
400 1000200 600 800 1200 1400 1600 1800 2000 2200
TG-NIR C9406GC
TG-cooled NIR-I C9913GC
TG-cooled NIR-II C9914GB
TG-UV-CCD C9404CA, C9404CAH
TM-UV/VIS-CCDC10082CA, C10082CAH
TM-VIS/NIR-CCDC10083CA, C10083CAH
TM-VIS/NIR-MOS C10083MD
TM-UV/VIS-MOS C10082MD
TG-cooled NIR-III C11118GA
2400 2600
TM-VIS/NIR-MOS-II C11697MA
TG-SWNIR-CCD-II C9405CB
TG-RAMAN-I C11713CA
TG-RAMAN-II C11714CA

20
2. Lineup of mini-spectrometers
*6: Excluding defective pixels*7: Maximum value in steady state. Note that inrush current flows at start-up.
Spectral response range m
Spectral resolution (FWHM)*3 nm
Wavelength reproducibility*4 nm
Wavelength temperature dependence nm/˚C
Parameter
0.9 to 2.55
20 max.
-0.8 to +0.8
-0.08 to +0.08
Spectral stray light*3 *5 dB-30 max.
UnitTG-cooled NIR-III
C11118GA
■ Optical characteristics
A/D conversion bits
Integration time*6 s
Interface -
Consumption current of USB bus power mA
Parameter
16
6 to 40000*7
USB 2.0
250 max.
UnitC11118GA
■ Electrical characteristics
*8: Up to 3 discontinuous defective pixels might exist (at low gain). Defective pixels are those whose electrical and optical characteristics do not meet our specifications.*9: Entrance slit aperture size*10: Numeric aperture (solid angle)*11: No condensation*12: Operating temperature capable of cooling control*13: Maximum value in steady state. Note that inrush current flows at start-up. Connector for external power supply is attached.
Dimensions (W × D × H) mm
Image sensor -
Number of pixels*8 pixels
Slit*9 (H × V) m
Parameter
142 × 218 × 80
Weight kg1.7
TE-cooled type InGaAs linear image sensor (G9208-256W)
256
140 × 500
NA*10 -
Connector for optical fiber -
Operating temperature*11 ˚C
Storage temperature*11 ˚C
0.22
SMA905D
+5 to +35 (+5 to +30*12)
-20 to +70
Power supply for cooling element max.*13 V/A5/2.8
Power supply for cooling fan*13 V/A12/0.2
UnitC11118GA
■ Structure/Absolute maximum ratings
Dimensional outline (unit: mm, tolerance unless otherwise noted: ±0.5)Spectral response of InGaAs linear image sensor (G9208-256W)
KMIRB0048EAWavelength ( m)
Ph
oto
sen
siti
vity
(A
/W)
1.0 1.4 2.00
0.2
1.0
0.8 1.81.61.2 2.62.42.2
0.6
0.4
0.8
1.2
1.4
(Typ.)
KACCA0258EC
218
COOLED NIR-III (l: 2.55)Spectrometer
142
80
COOLED NIR-III (l: 2.55)Spectrometer
Weight: 1.7 kg
*3: Depends on the slit opening. Values were measured with the slit opening listed in the table "■ Structure/Absolute maximum ratings".*4: Measured under constant light input conditions*5: When monochromatic light of λ=1700 nm is input, spectral stray light is defined as the ratio of the count measured at the input wavelength, to the
count measured in a region of the input wavelength ±80 nm.

21
C10988MA-01, C11708MAThese are thumb-sized, ultra-compact spectrometer heads devel-oped by our advanced MOEMS technology. A CMOS image sensor integrated with an entrance slit is combined with a grating formed on a convex lens by nano-imprint. They have a package that is easy to be mounted on a circuit board, so it can be used like a sensor.
Ultra-compact type2-8.
KACCC0458EA
Optical component layout in mini-spectrometer (C10988MA-01)
For installation into measurement equipment
[MS series]
CMOS linear image sensor is built-in.(C10988MA-01)
Slit
CMOS chip
Features
● Thumb size: 27.6 × 13 × 16.8 mm
● Weight: 9 g
● Spectral response range: 340 to 750 nm (C10988MA-01)640 to 1050 nm (C11708MA)
● Spectral resolution: 14 nm (C10988MA-01)20 nm (C11708MA)
● Installation into mobile measurement equipment
● Wavelength conversion factor*1 is listed on test result sheet.
● Color monitoring, for printers and printing machines
● Installation into large size display (color control device)
● Fruit brix measurement/cereal taste test
● Component analysis
Application examples
Image sensor Through-hole slitInputlight
Bump electrode
Glass wiring board
Diffracted light Lens
Grating made by nano-imprint
Spectrum by grating
C10988MA-01
C11708MA
*1: A conversion factor for converting the image sensor pixel number into a wavelength is recorded in the module. A calculation factor for converting the A/D converted count into the input light intensity is not provided.

2. Lineup of mini-spectrometers
22
*2: Depends on the slit opening. Values were measured with the slit listed in the table "■ Structure/Absolute maximum ratings".*3: Measured under constant light input conditions*4: When monochromatic light of the following wavelength is input, spectral stray light is defined as the ratio of the count measured at the input wave-
length, to the count measured at the input wavelength ±40 nm.C10988MA-01: 550 nm, C11708MA: 850 nm
*5: An increase in the current consumption of the video output terminal also increases the chip temperature, which causes the dark current to rise. To avoid this, connect a buffer amplifier to the video output terminal to minimize the current consumption.
Spectral response range nm
Spectral resolution (FWHM)*2 nm
Wavelength reproducibility*3
Wavelength temperature dependence
nm
nm/˚C
Parameter
340 to 750
14 max.
640 to 1050
20 max.
-0.5 to +0.5
-0.05 to +0.05
Spectral stray light*2 *4 dB-25 max.
UnitMS-VIS-MOS
C10988MA-01
MS-SWNIR-MOS
C11708MA
■ Optical characteristics
Supply voltage V
Power consumption mW
Video rate kHz
Parameter
5
30
0.25 to 200
Output impedance 150*5
UnitC10988MA-01 C11708MA
■ Electrical characteristics
*6: Entrance slit aperture size*7: Numeric aperture (solid angle)*8: No condensation
Dimensions (W × D × H) mm
Image sensor -
Number of slit pixels
Slit*6 (H × V) m
Parameter
27.6 × 13 × 16.8
Weight g9
CMOS linear image sensor
256
75 × 750
NA*7 -
Operating temperature*8 ˚C
Storage temperature*8 ˚C
0.22
+5 to +40
-20 to +70
UnitC10988MA-01 C11708MA
■ Structure/Absolute maximum ratings
Dimensional outline (unit: mm, tolerance unless otherwise noted: ±0.2)
KACCA0257EC
Electrical connections with an external circuitMake electrical connections to an external circuit using the lead pins.
Evaluation circuit C11351 (sold separately)The C11351 is a circuit board designed to simply evaluate characteristics of mini-spectrometer MS series. By using the C11351 with the MS series (sold separately) and a USB cable A9160 (AB type; sold separately), the MS series characteristics can be evaluated with the dedicated software.
Note: For information on drive specifications, refer to "Mini-spectrometer C10988MA-01, C11708MA" datasheet.
Note: The C11351 comes with a DLL.However, the DLL function specifications are not available to users since the C11351 is an evaluationcircuit.
SymbolPin no.
CLK
GND
NC
ST
NC
Gain
EOS
NC
Vdd
Video
I/O
I
I
I
O
I
O
Name of pin Description
Clock pulse
Ground
Start pulse
Gain
End of scan
Supply voltage
Video output
Sensor scan sync signal
GND
No connection
Start pulse
No connection
Image sensor: gain setting
EOS (end of scan) signal
No connection
Power supply of image sensor: 5 V
Video output signal
1
2
3
4
5
6
7
8
9
10
C11351
2.6
16.8
Slit position
2.54
Slit0.075 × 0.75
Index mark
0.2
1.0
29.6
0.511.5
1.0
5.0
CLKGNDNCSTNCGainEOS NC VddVideo
Weight: 9 g
16
27.6
13
13
A
AB
C10988MA-01 3
0.75
C11708MA 2.80.5
B

23
Built-ininfrared enhanced type
CMOS linear image sensor
Built-inCMOS linear image sensor
S8378-256N
Features
*1: A conversion factor for converting the image sensor pixel number into a wavelength is recorded in the module. A calculation factor for converting the A/D converted count into the input light intensity is not provided.
C11007MA, C11008MA, C11009MA, C11010MA
● Installation into measurement equipment● Chemical measurement● Visible light source testing● Color measurement
These are mini-spectrometers that integrate a reflective grating and a CMOS linear image sensor into a compact case. Two models are provided: the C11007MA and C11008MA spectrometer mod-ules with a built-in driver circuit and USB output port, and the C11009MA and C11010MA OEM model spectrometer heads.
Compact, low cost type2-9.
KACCC0348EB
Optical layout in mini-spectrometer (RC series)
● Integrated driver circuit and spectrometer head● No external power supply required: Uses USB bus power● A/D conversion: 16 bits● Wavelength conversion factor *1 is recorded in internal memory
C11007MA, C11008MA (Spectrometer module) C11007MA, C11009MA
● Installation into measurement equipment● Chemical measurement● Measurement of saccharic in fruits● Various industrial measurements
C11008MA, C11010MA● For installation into measurement equipment● Optical system and image sensor are assembled into a compact case
C11009MA: 28 × 28 × 28 mmC11010MA: 35 × 20 × 28 mm
● Low cost● Wavelength conversion factor*1 is listed on test result sheet.
C11009MA, C11010MA (Spectrometer head)
For installation into measurement equipment
Application examples
[RC series]
GratingImage sensor
Focusing functionCollimating function
Glass body
Fiber
Slit
C11010MA C11009MA C11007MA

24
2. Lineup of mini-spectrometers
KACCC0261EB
Electrical connection with an external circuit (C11009MA, C11010MA)
When connecting to an external circuit, use the flexible printed circuit board coming out of the spectrometer head.
*2: Depends on the slit opening. Values were measured with the slit listed in the table “■ Structure/Absolute maximum ratings”.*3: Measured under constant light input conditions*4: When monochromatic light of λ=550 nm (C11007MA, C11009MA) or λ=850 nm (C11008MA, C11010MA) is input, spectral stray light is defined as the ratio of the
count measured at the input wavelength, to the count measured at the input wavelength ±40 nm.
■ Optical characteristics
*5: Entrance slit aperture size*6: Numeric aperture (solid angle)*7: No condensation
nm
nm
nm
nm/˚C
dB
Parameter
340 to 780
9 max.
640 to 1050
8 max.
-0.5 to +0.5
-0.05 to +0.05
-30 max.
UnitRC-VIS-MOS RC-SWNIR-MOS
C11007MA(Spectrometer module)
C11008MA(Spectrometer module)
Spectral response range
Spectral resolution (FWHM)*2
Wavelength reproducibility*3
Wavelength temperature dependence
Spectral stray light*2 *4
C11009MA(Spectrometer head)
C11010MA(Spectrometer head)
■ Electrical characteristics
bits
ms
-
Parameter
16
5 to 10000
USB 1.1
16
5 to 10000
USB 1.1
-
-
-
-
-
-
Unit
A/D conversion
Integration time
Interface
■ Structure/Absolute maximum ratings
mm
g
-
-
Parameter
180
C11009MA
168
C11010MA
45
-
52
55 × 100 × 48 55 × 100 × 48 35 × 28 × 2028 × 28 × 28
-
CMOS linear image sensor (S8378-256N) IR-enhanced CMOS linear image sensor
Unit
Dimensions (W × D × H)
Weight
Built-in head
Image sensor
pixels256Number of pixels
m
m
70 × 250070 × 550Slit*5 (H × V)
-0.22NA*6
-SMA905Optical fiber connector
600Fiber core diameter
˚C+5 to +40Operating temperature*7
˚C-20 to +70Storage temperature*7
DescriptionI/OTerminalname
Pinno.
NC
NC
NC
EOS
A.GND
A.GND
VIDEO
A.GND
A.GND
+5 V
-
-
-
O
-
-
O
-
-
I
No connection
No connection
No connection
EOS (end of scan) signal
Analog GND
Analog GND
Video output signal
Analog GND
Analog GND
Power supply of image sensor: +5 V
DescriptionI/OTerminalname
Pinno.
NC
GAIN
A.GND
A.GND
ST
CLK
SDA
SCL
D. GND
VCC
-
I
-
-
I
I
O
I
-
I
No connection
Gain setting
Analog GND
Analog GND
Sensor scan start signal
Sensor scan sync signal
Thermosensor output signal
Thermosensor driver signal
Thermosensor digital GND
Thermosensor: +3.3 V
C11007MA(Spectrometer module)
C11008MA(Spectrometer module)
C11009MA(Spectrometer head)
C11010MA(Spectrometer head)
C11007MA(Spectrometer module)
C11008MA(Spectrometer module)
C11009MA(Spectrometer head)
C11010MA(Spectrometer head)
4 ± 0.5
6 ± 0.5
Thickness: 0.3
Unit: mm
10.5
± 0
.2
Black cover
Note:· Pins 4 to 10 and 12 to 16 are connected to the image sensor.
For information on drive specifications, refer to "CMOS linear image sensor S8377/S8378 series" datasheet.
· Pins 17 to 20 are connected to the internal thermosensor (DALLAS DC1775R).

25
KACCA0242EB
KACCA0240EB
C11007MA
C11008MA
Dimensional outlines (unit: mm, tolerance unless otherwise noted: ±0.5)
KACCA0243EB
KACCA0241EB
C11009MA
C11010MA
2. Lineup of mini-spectrometers
48
C11009MA (4 ×) M2.6 depth 3 C11009MA
3545
100
3510
55
VISSpectrometer
110 ± 5
28
14
10.5
± 0
.2
28
2821
88 ± 3.5
Flexible board
Fiber
(2 ×) M2.6 depth 5
48
C11010MA (4 ×) M2.6 depth 3 C11010MA
3545
100
3510
55
SWNIRSpectrometer
20
35
110 ± 5
28
10
88 ± 3.5
Flexible board
Fiber
(2 ×) M2.6 depth 5
28
10.5
± 0
.2
Weight: 180 g
Weight: 52 g
Weight: 168 g
Weight: 45 g

3. Structure
26
Wavelength dispersive spectroscopes are broadly grouped into monochromator and polychromator types. Monochro-mators use a grating as the wavelength dispersing element for separating incident light into a monochromatic spec-trum. Polychromators operate on the same principle as monochromators but are designed to allow simultaneous detection of multiple spectra. Mini-spectrometers fall under the polychromator type. In a monochromator, there is usu-ally an exit slit formed on the focal plane of a focusing lens, while in polychromators, an array type detector (image sensor) is placed along the focal plane of the focusing lens. To make mini-spectrometers compact and portable, the fo-cal lengths of the collimating lens and focusing lens are shorter than monochromators.
The function of each element used in mini-spectrometers is explained in the right.
■ Entrance slit
This is an aperture through which light to be measured is guided inside. The entrance slit restricts the spatial spread of the measurement light entering the mini-spectrometer. Since the slit image of the incident light is eventually fo-cused on the image sensor, the slit aperture size is a major factor in determining the optical system resolution and throughput. An optical fiber is connected to the entrance slit of mini-spectrometers.
■ Collimating lens, focusing lens
The light passing through the entrance slit usually spreads at a certain angle. The collimating lens collimates this transmitted light and guides it onto the grating. An aperture (aperture mask) is used along with the collimating lens to limit the NA (numerical aperture) of the light flux entering the mini-spectrometer. On the other hand, the focusing lens forms light passing through the grating onto an image sensor in order of wavelength.
■ Grating
The grating disperses the light guided through the collimating lens according to its wavelength and lets the light at each wavelength pass at a different diffraction angle.
■ Image sensor
The image sensor converts the spectrum of light focused by the focusing lens into electrical signals, and then outputs them. Cooled mini-spectrometers incorporate a TE-cooled image sensor for reducing image sensor noise.
[Figure 1] Optical system layout in TG series
KACCC0256EA
Entrance slit
Focus lens
Image sensorCollimating lens
Transmission grating
[Figure 2] Optical component layout (C10988MA-01)
■ StructureA CMOS image sensor integrated with an entrance slit by deep etch-
ing technology is used. The grating is directly formed on the convex
lens by nano-imprint. These MOEMS technologies have made it pos-
sible to develop a thumb-sized, ultra-compact spectrometer head.
KACCC0458EA
Image sensor Through-hole slitInputlight
Bump electrode
Glass wiring board
Diffracted light Lens
Grating made by nano-imprint
SEM image of grating
Slit
CMOS chip
MS series (C10988MA-01) structure

27
4-1 Spectral resolution
■ Definition
The spectral resolution of mini-spectrometers is defined as FWHM (full width at half maximum). This is the spectral width at 50 % of the peak power value as shown in Figure 3. Figure 4 shows examples of spectral resolution measured with mini-spectrometers.
[Figure 3] Definition of spectral resolution
KACCC0320EA
[Figure 5] Spectral resolution vs. wavelength
(typical example when slit width and NA for C10082CA were changed)
KACCB0147EB
[Figure 4] Spectral resolution vs. wavelength (measurement examples)
Wavelength
Rel
ativ
e lig
ht
leve
l
FWHM
50%
50%
Wavelength (nm)
Sp
ectr
al r
eso
luti
on
(n
m)
200 3000
1.0
0.5
800
3.5
3.0
2.5
2.0
1.5
600 700500400
■ Changing the spectral resolution
The spectral resolution of mini-spectrometers varies depend-ing on the slit width and NA. In the C10082CA, for example, the slit width is 70 m and the NA is 0.22. If the NA is changed to 0.11 and the slit width is narrowed, the spectral resolution changes as shown in Figure 5. This proves that the spectral resolution can be improved down to 1 nm by changing operating conditions.
However, narrowing the slit width and reducing the NA will limit the light incident on the mini-spectrometer. The light in-tensity reaching the image sensor will therefore drop. When, for example, comparing the C10082CA with the C10082CAH, the slit width of the C10082CA is 70 m while that of the C10082CAH is 10 m. This means the amount of light enter-ing the C10082CAH is 1/7 of the C10082CA.On the other hand, due to differences in the internal NA of each mini-spectrometer, the amount of light incident on the sensor in the C10082CAH is 1/4 that of the C10082CA. How-ever, because the resolution of the C10082CAH is 1/4 of the C10082CA, the A/D count obtained from the C10082CAH will be 4 times greater than the C10082CA. Taking these facts into account, when the same amount of light enters the optical fiber, the A/D count of the C10082CAH will be 1/7 that of the C10082CA because of differences in the slit width.
4. Characteristics
(NA 0.11)
Slit width 10 m
Slit width 70 m
Slit width 25 m
KACCB0139EG Wavelength (nm)
Sp
ectr
al r
eso
luti
on
(n
m)
0200 400 600 800 1000 1200 1400 1600 1800 2000 2400 2600
2
4
6
8
10
12
16
18
14
C11708MA
C10988MA-01
C9913GC
C9404CAH
C11007MAC10083MD
C11008MA
C10083CA
C11697MA
C11713CA C11714CA
C10082CAH
C9406GCC9405CBC10082CA
C10083CAH
C9404CAC10082MD
C11118GA
C9914GB

28
The C10082CA/C10083CA series mini-spectrometers allow selecting a combination of NA and slit width from those shown in Table 1.Spectral resolution can therefore be changed as appropriate.
[Figure 6] Spectral resolution vs. wavelength (C10082CA series)
KACCB0194EA
200 300 400 500 600 700 800
1
0
2
5
6
7
4
3
8
9
Wavelength (nm)
Sp
ectr
al r
eso
luti
on
(n
m)
C10082CA-2200
C10082CA-1025
C10082CA-2050
C10082CAH
C10082CA-2100
C10082CA
C10082CA-1050
(Typ. Ta=25 ˚C)
[Figure 7] Spectral resolution vs. wavelength (C10083CA series)
KACCB0195EA
300 400 500 600 700 800 900 1000
2
0
8
10
6
4
12
14
Wavelength (nm)
Sp
ectr
al r
eso
luti
on
(n
m)
C10083CA-2200
C10083CA-2100
C10083CA-1025C10083CAH
C10083CA-1050
C10083CAC10083CA-2050
(Typ. Ta=25 ˚C)
[Figure 8] Output characteristics (C10082CA series)
KACCB0196EA
[Figure 9] Output characteristics (C10083CA series)
KACCB0197EA
200 300 400 500 600 700 800
40
20
0
80
60
100
Wavelength (nm)
Rel
ativ
e se
nsi
tivi
ty (
%)
C10082CA-2050
C10082CAH
C10082CA-2100
C10082CA-1025
C10082CA-2200
C10082CA
C10082CA-1050
(Typ. Ta=25 ˚C)
300 400 500 600 700 900 1000800
40
20
0
80
60
100
Wavelength (nm)
Rel
ativ
e se
nsi
tivi
ty (
%)
C10083CA-2200
C10083CA-2100
C10083CA
C10083CA-2050
(Typ. Ta=25 ˚C)
C10083CA-1025
C10083CAH
C10083CA-1050
Type no.
Spectral response range200 to 800 nm
Spectral response range320 to 1000 nm
NA Slit width
C10082CA-2200
C10082CA-2100
C10082CA
C10082CA-2050
C10082CA-1050
C10082CA-1025
C10082CAH
C10083CA-2200
C10083CA-2100
C10083CA
C10083CA-2050
C10083CA-1050
C10083CA-1025
C10083CAH
0.22
0.11
200 m
100 m
70 m
50 m
50 m
25 m
10 m
[Table 1] Product lineup (C10082/C10083 series)

29
■ Pixel bandwidth
This section describes the pixel bandwidth of the image sensor mounted in a mini-spectrometer. Pixel bandwidth is different from spectral resolution. The approximate spectral detection bandwidth assigned per pixel is obtained by dividing the spectral response range by the number of pixels.
Example: C10082MD (spectral response range: 200 to 800 nm, number of pixels: 1024)
The detection wavelength of any given pixel is calculated from the following equation using the wavelength conver-sion factor written in the EEPROM in the mini-spectrometer. This allows obtaining the spectral width assigned to a pixel.
HAMAMATSU mini-spectrometers are designed so that the spectral detection width assigned per pixel in the image sensor is small relative to the spectral resolution. The output is divided to multiple pixels when a spectral line is meas-ured with a mini-spectrometer as shown in Figure 10. The center wavelength of the spectral line can be found by ap-proximating this measurement result with a Gaussian curve.
Stray light is generated if extraneous light enters the detec-tor (image sensor). The following factors often generate stray light.⋅ Fluctuating background light
⋅ Imperfections in the grating⋅ Surface reflection from lens, detector window, detector
photosensitive surface
■ Definition
There are two methods to measure and define stray light. One method measures stray light using a long-pass filter and the other method uses reference light in a narrow spec-tral range (light output from a line spectra emitted from a spectral line lamp, etc.).The long-pass filter method measures stray light using white light passed through the long-pass filter for constant wave-length. In this case, the stray light is defined as the ratio of transmittance in the “transmitting” region to transmittance in the “blocking” region. Stray light (SL) is defined by the follow-ing equation. (See Figure 11 for the definitions of Tl and Th.)
This definition allows measuring the effects of stray light over a broader spectrum range, so this method is more sui-ted for evaluating actual applications such as fluorescence measurement. However, be aware that the intensity profile of white light used as reference light will affect the meas-urement value.In the other method using reference light in a narrow spec-tral range, the stray light (SL) is defined as follows:
In this definition of stray light, the measurement conditions are simple and so can easily be evaluated at constant val-ues.In both methods using a long-pass filter or using a narrow spectrum, the stray light conditions will differ depending on the wavelength of the light being measured. The stray light should therefore be measured on multiple wavelengths.
[Figure 10] Approximating the center wavelength of spectral line
Wavelength
Tran
smit
tan
ce
Tl
Th
4-2 Stray light
KACCC0335EA
Wavelength
Cente
r wave
length
of sp
ectral
line
Dat
a of
eac
h pi
xel
Lig
ht
leve
l
[Figure 11] Definitions of Tl and Th
Detection wavelength of any given pixel [nm] = a0 + a1pix + a2pix2 + a3pix3 + a4pix4 + a5pix5 ... (2)
a0 to a5: Wavelength conversion factorpix: Image sensor pixel number (from 1 to the last pixel)
SL = 10 × log (Tl / Th) ............ (3)
............ (4)SL = 10 × (log IM / IR)
IM : Unnecessary light intensity that was output at wavelengths deviating from the reference light spectrum
IR : Reference light intensity
Spectral detection width per pixel = (800 - 200) / 1024 0.6 [nm] ... (1)

KACCB0275EA
30
4. Characteristics
The output charge Q(λ) [C] of an image sensor used in mini-spectrometers is given by the following equation.
[Figure 12] Examples of stray light measurement using spectral lines (C9406GC) The output charge Q(λ) of an image sensor is converted into a voltage by the charge-to-voltage converter circuit and then converted into a digital signal by the A/D converter. This is finally derived from the mini-spectrometer as an out-put value I(λ) [counts]. The output value of a mini-spectr-ometer is expressed by the following equation.
Meanwhile, the sensitivity E(λ) [counts / (W ⋅ s)] of a mini-spectrometer is given by the following equation.
Substituting equation (6) into equation (7) becomes:
4-3 Sensitivity
Q(λ) = k(λ) ⋅ P(λ) ⋅ Texp ............ (5)
I(λ) = ε ⋅ Q(λ) = ε ⋅ k(λ) ⋅ P(λ) ⋅ Texp ............ (6)
E(λ) = l(λ) / {P(λ) ⋅ Texp} ............ (7)
E(λ) = ε ⋅ k(λ) [counts / (W ⋅ s)] ............ (8)
k(λ) : Conversion factor for converting light intensity incident on a mini-spectrometer into image sensor output charge. (Equals the product of the optical system efficiency, diffraction efficiency of grating, and prod-uct of the image sensor sensitivities.)
P(λ) : Power of light [W] at each wavelength incident on mini-spectrometer Texp: Integration time [s]
ε : Conversion factor for converting image sensor output charge into a mini-spectrometer output value (Equals the product of the charge-to-voltage converter circuit and the A/D converter resolution.)
[Table 2] Wavelength dependence of parameters that determine conversion factor
Optical system efficiency
Diffraction efficiency of grating
Image sensor sensitivity
Charge-to-voltage converter circuit constant
A/D converter resolution
Yes
Yes
Yes
No
No
Parameters determining conversion factor Wavelength dependence
[Figure 13] Spectral response (relative data)
KACCB0137EG
* A/D count when constant light level enters optical fiber. (Fiber core diameter: 600 m, assuming no attenuation in optical fiber)
Wavelength (nm)
Rel
ativ
e se
nsi
tivi
ty*
200 400 600 800 1000 1200 1400 1600 1800 2000 2200 2400 260010-5
10-4
10-3
10-2
10-1
100
C9405CB
C9914GB
C9406GC
C9913GC
C10082MDC10083MD
C11007MA
C11697MA
C10082CAH
C9404CAH
C11713CA
C11714CA
C10082CA
C10083CA
C10083CAH
C11008MA
C11118GA
950 nm 1100 nm 1300 nm 1500 nm
1650 nm
Rel
ativ
e o
utp
ut 10-2
10-1
10
10-4
10-6
10-3
10-5
900 1000 1100 1200 1300 1400 1500 1600 1700
Wavelength (nm)
C9404CA

31
5. Operation mode
■ Free-run operation (normal operation mode)When light enters an image sensor, an electrical charge is generated in each pixel of the image sensor according to the incident light intensity. This charge accumulates in each pixel during the integration time and is cleared to zero dur-ing readout. This means that the charge must be read out before accumulating a newly generated charge. In mini-spectrometers, this cycle of "charge integration" → "charge readout (A/D conversion)" → "digital data hold" repeats continuously. Digital data is constantly updated with data obtained in the last integration time. When a data request is received from the PC, the mini-spectrometer sends the most recent data at that point to the PC. Figure 14 shows a typical free-run operation mode.
■ Operation mode during external trigger input
Operation mode in the following mini-spectrometers can be changed by external trigger input.
Note:· The following mini-spectrometers do not support the external
trigger input function: C9406GC, C9913GC, C9914GB, C11007MA, C11008MA, C11009MA, C11010MA, C10988MA-01, C11708MA.
· The external trigger input function works with DLL, but does not function on the supplied evaluation software. If using an external trigger input, the user software must be configured to support that function.
Using A10670 external trigger coaxial cable (sold separate-ly), connect the mini-spectrometer to a device that outputs digital signals at 0 to 5 V levels.
Operation modes using external trigger input are described below.
(1) Data hold by trigger inputThis operation mode differs from free-run operation in that data to be held is controlled by trigger input. The mini-spectrometer internally holds digital data accumulated in the integration time that begins just after a trigger input edge (rising or falling edge selectable) is detected. This data being held is then reset when it is read out from the PC. If the next trigger is input while the data is still being held, then that data is updated to new digital data.For example, when a mini-spectrometer is used to detect light emitted from a DC mode light source with a shutter in-stalled, then data accumulated in a predetermined integra-tion time can be held by supplying the mini-spectrometer with a shutter open signal as a trigger input. High repeat-ability measurements can be made by setting a shutter-open period that is sufficiently longer than the integration time.
KACCC0378EA
Charge readout(A/D conversion)
Charge integration
ClearIntegration
Digital data
Digital data is constantly updated by dataobtained in the last integration time.
(2) Data labeling during trigger inputThis operation mode attaches a label to digital data during the gate period for external trigger input. When a trigger (High level or Low level selectable) is input, a label corre-sponding to data accumulated during trigger input is at-tached to the digital data. When each digital data is read out from the PC, that label information is obtained at the same time.When acquiring data under different measurement condi-tions, this mode is suitable for finding which measurement condition applies to which measurement data. For example, suppose measurements are made under condition A and condition B. Condition A uses no trigger input to make measurement, so there is no labeling. In contrast, condition B uses a trigger input, so a label is attached to the acquired data. Labeling the acquired data in this way during trigger input makes it possible to distinguish between acquired data measurement conditions.
C9404CA, C9404CAH, C9405CBC10082CA, C10082CAH, C10082MDC10083CA, C10083CAH, C10083MDC11713CA, C11714CA
KACCC0377EB
KACCC0379EA
Digital data
Chargeintegration
Trigger inputAsynchronous
Data is cleared whenread out from PC.
KACCC0380EB
Chargeintegration
Digital data
Trigger inputAsynchronous
Labeling data
Asynchronous
[Figure 14] Free-run operation
[Figure 16] Data hold responding to trigger input
[Figure 17] Data labeling at trigger input[Figure 15] Mini-spectrometer connectors (C10082CA)
Power inputconnector
Trigger connector
USB connector
Optical connector

32
■ Trigger operation mode (C11118GA, C11697MA)The C11118GA and C11697MA have trigger operation modes as shown below. These operation modes can be selected on the evaluation software that comes with the C11118GA or C11697MA.
(1) Data measurement at software trigger input (asynchronous)This mode acquires digital data that is first converted after a software trigger input from a PC.
In either of the above modes (1) to (6), the input trigger is ignored if the trigger input interval is shorter than the mini-spectrometer measurement period.
(7) Trigger signal outputAn integration start timing (pulse width: 10 s) can be output from the external trigger terminal. (trigger output edge: ris-ing or falling edge selectable)
(2) Data measurement at software trigger input (synchronous)This mode starts sensor operation (integration) after a soft-ware trigger input from a PC.
(5) Measurement by external trigger input level (asynchronous)This mode acquires digital data when an external trigger (high or low level selectable) is input to the external trigger terminal.
(6) Measurement by external trigger input level (synchronous)This mode starts sensor operation (integration) when an ex-ternal trigger (high or low level selectable) is input to the external trigger terminal, and acquires digital data.
(3) Data measurement at external trigger input (asynchronous)This mode acquires digital data that is first converted after the edge (rising or falling edge selectable) of an external trigger input to the external trigger terminal.
(4) Data measurement at external trigger input (synchronous)This mode starts sensor operation (integration) at the edge (rising or falling edge selectable) of an external trigger in-put to the external trigger terminal, and acquires digital data.
[Figure 18] Data measurement at software trigger input (asynchronous)
KACCC0503EC
[Figure 20] Data measurement at external trigger input (asynchronous)
KACCC0508EA
[Figure 19] Data measurement at software trigger input (synchronous)
KACCC0505EB
[Figure 21] Data measurement at external trigger input (synchronous)
KACCC0569EA
[Figure 22] Measurement by external trigger input level (asynchronous)
KACCC0504EB
[Figure 23] Measurement by external trigger input level (synchronous)
[Figure 24] Trigger signal output
KACCC0506EB
KACCC0507EC
Measurement period
Software trigger
Charge integration
Charge readout(A/D conversion)
Digital data
Software trigger
Measurement period
Software trigger Software trigger
Charge integration
Charge readout(A/D conversion)
Digital data
Measurement period
Charge integration
Charge readout(A/D conversion)
Trigger input(at falling edge)
Digital data
Measurement period
Charge integration
Charge readout(A/D conversion)
Trigger input(at falling edge)
Digital data
Measurement period
Charge integration
Charge readout(A/D conversion)
Trigger input(at high level input)
Digital data
Measurement period
Charge integration
Charge readout(A/D conversion)
Trigger input(at low level input)
Digital data
Measurement period
Charge integration
Charge readout(A/D conversion)
Trigger input (at rising edge)
Digital data

6. Dedicated software
33
[Table 3] Measurement modes of dedicated software
Mode Description Feature
Reference mode*2
Trigger mode*3
Continuousmeasurementmode*3
*2: “Dark” mode and “Reference” mode are not provided for the C11118GA, C11697MA and C11351. “Measure” mode has equivalent functions.*3: Only supported by C11118GA and C11697MA.
Monitor mode
Measure mode
Dark mode*2
Measurement mode for monitoring without saving it
Measurement mode for acquiring and saving data
Measurement mode for acquiring dark data (used for dark subtraction)
Measurement mode for acquiring reference data
Measurement mode for acquiring data by trigger signal
Continuous data acquisition by batch data transfer
HAMAMATSU mini-spectrometers come with an evaluation software (CD-ROM).
■ Evaluation software functionsInstalling the evaluation software into your PC allows run-ning the following basic tasks.
⋅ Measurement data acquisition and save⋅ Measurement condition setup ⋅ Module information acquisition (wavelength conversion fac-
tor*1, mini-spectrometer type, etc.)⋅ Graphic display⋅ Arithmetic functions
[Pixel number to wavelength conversion / calculation in comparison with reference data (transmit-tance, reflectance) / dark subtraction / Gaussian approximation (peak position and count, FWHM)]
*1: A conversion factor for converting the image sensor pixel number into a wavelength. A calculation factor for converting the A/D conver-ted count into the input light intensity is not provided.
The evaluation software operates in measurement modes: “Monitor” mode, “Measure” mode, “Dark” mode and “Reference” mode, etc. Table 3 shows features in each mode. Data measured in “Measure” mode, “Dark” mode*2 and “Reference” mode*2 can be saved in csv format (loaded into Microsoft Excel ®).The arithmetic functions of the evaluation software are shown in Table 4, and the calculation limitations during measurement in Table 5.
[Figure 25] Display examples of evaluation software
Graphically displays “pixel number vs. A/D output count” data in real time
Graphically displays “wavelength vs. A/D output count” data in real time
Graphically displays time-series data at a selected wavelength*3
Cannot save measurement data
Performs dark subtraction
Displays reference data
Cannot set the number of measurement scans (No limit on scan count)
Graphically displays “pixel number vs. A/D output count” data in real time
Graphically displays “wavelength vs. A/D output count” data in real time
Graphically displays time-series data at a selected wavelength*3
Saves measurement data
Performs dark subtraction
Displays reference data
Specifies the number of measurement scans
Graphically displays “pixel number vs. A/D output count” data in real time
Graphically displays “wavelength vs. A/D output count” data in real time
Saves measurement data
Graphically displays “pixel number vs. A/D output count” data in real time
Graphically displays “wavelength vs. A/D output count” data in real time
Saves measurement data
Software trigger, asynchronous measurement
Software trigger, synchronous measurement
External trigger, asynchronous edge
External trigger, asynchronous level
External trigger, synchronous edge
External trigger, synchronous level
Graphically displays “pixel number vs. A/D output count” data at completion of data transfer
Graphically displays “wavelength vs. A/D output count” data at completion of data transfer
Saves measurement data

34
[Table 4] Arithmetic functions of dedicated software
[Table 5] Limitations on dedicated parameter
■ Interface
HAMAMATSU mini-spectrometers come with a DLL. By using the DLL in a software development environment such as Mi-crosoft ® Visual C++ ® and Visual Basic ®*5, you can create your own application software that supports Windows*6. Because Windows ®-compatible application software can-not directly access a USB host controller, the DLL calls the necessary functions to allow the software to access the USB host controller via the device driver and USB driver and to control the mini-spectrometer. (See Figure 26.) The DLL provides functions such as USB port open/close, meas-urement condition setup, measurement data and module information acquisition.
*5: Operation was verified with Microsoft® VisualStudio® 2008 (SP1) Visual C++® and Microsoft® Visual Studio® 2008 (SP1) Visual Basic® on .NET Framework 2.0 and 3.0 (Microsoft® Windows® XP/Vista/7).
*6: The C11351 comes with a DLL. However, the DLL function specifica-tions are not available to users since the C11351 is an evaluation cir-cuit.
Note:· Microsoft, Windows, Visual Stadio, Visual C++ are either registered
trademarks or trademarks of Microsoft Corporation in the United States and/or other countries.
■ Types of evaluation softwareThe following four types of evaluation software are available. Each type of sample software can only be used for the specified mini-spectrometers. · For TM/TG series (interface: USB 1.1)· For TM/TG series (interface: USB 2.0)· For RC series· For MS series
[Figure 26] Software configuration example
Sample software
DLL
Device driver
USB driver
USB host controller
Application software
USB connection
Mini-spectrometer
Supplied CD-ROM
Can be configured by users.
Function specifications available to users*5
Parameter Limitation
C10082MD, C10083MD, C9406GC, C9913GC, C9914GB, C11007MA, C11008MA, C11351
C10082CA, C10082CAH, C10083CA, C10083CAH, C9404CA, C9404CAH, C9405CB, C11713CA, C11714CA
C10082MD, C10083MD, C9406GC, C9913GC, C9914GB, C11007MA, C11008MA, C11118GA
Number of scans depends on the memory size and operating environment of your PC. (Not limited during “Monitor” mode)
Integration time
Gain High/Low
10 ms to 10000 ms*4
5 ms to 10000 ms*4
C9914GB5 ms to 1000 ms*4
C11118GA
C11697MA
6 s to 40 ms*4
4 s to 100 ms*4
Scan count
Function Feature
Measures dark data and subtracts it from measurement data
Measures reference data and displays it graphically
Fits data in a specified range to Gaussian function
Dark subtraction
Reference data measurement and display
Gaussian fitting
*4: Specified in 1 s steps
Parameter RC seriesMS series(C11351)
TM/TG series
USB 1.1 USB 2.0
Compatible OS
Availability of DLL function specifications to users
Connection and operation of multiple units with one PC
Windows 7 Professional SP1 (64-bit)
Visual Basic
Visual C++
Windows 7 Professional SP1 (32-bit)
Windows Vista Business SP2 (32-bit)
Windows XP Professional SP3 (32-bit)
Supported development environment
[Table 6] Software quick reference table
KACCC0658EA

7. Measurement examples
35
Line spectra from visible LED were measured with C10082MD (TM-UV/VIS-MOS).
Transmittance of 1 mm thick optical window plate was measured with C9406GC (TG-NIR).⋅ Measurement value
⋅ Calculation result
[Figure 29] LED light measurement
[Figure 30] Transmittance measurement
KACCB0145EA
KACCC0288EF
KACCB0126EA
KACCB0276EA
KACCB0277EA
C10083CA (TM-VIS/NIR-CCD) is used to measure
fluorescence of 1000 ppm quinine solution (buffer
solution is dilute sulfuric acid).
USBcable
PC
Mini-spectrometer
Quarz cell(For holding liquid sample)
Fiber
UV-VIS fiber light source(Deuterium lamp and Halogen lamp)
L10290
[Figure 27] Connection example
[Figure 28] Fluorescence measurement
300
Wavelength (nm)
A/D
co
un
t
400
2500
2000
1500
1000
500
0500 600 700 800 900 1000
Wavelength (nm)
2000
10000
20000
30000
40000
A/D
co
un
t
400 600300 500 700 800
Blue LED
Orange LED Red LED
A/D
co
un
t
0
50000
45000
40000
35000
30000
25000
20000
15000
10000
5000
Wavelength (nm)
900 1000 170016001300 1400 15001100 1200
Reference light
Transmitted light
Tra
nsm
itta
nce
(%
)
0
100
20
30
10
40
50
60
70
80
90
Wavelength (nm)
900 170016001300 1400 15001000 1100 1200

36
KACCB0280EA
KACCB0278EA
KACCB0279EA
KACCB0095EB
KACCB0100EA
[Figure 31] Line spectrum measurement
[Figure 32] Reflectance measurement
Line spectra from low-pressure mercury lamp were meas-ured with C11714CA (TG-RAMAN- ).
[Figure 33] Film thickness measurement
Spectral reflectance of reflecting mirror was measured with C9405CB (TG-SWNIR-CCD).⋅ Measurement value
Calculation result
Thickness of 10 m thick food wrapping film (polyvinylidene chloride) was measured with C9406GC (TG-NIR) by princi-ple of film thickness measurement *1.
*1: Principle of film thickness measurement (white light interferometry)In film thickness measurement utilizing white light interferometry, an interference spectrum resulting from reflections between the front and back surfaces of a film is obtained.The film thickness can then be determined by calculation from the spectral peak count, wa-velength range, refractive index of film and incident light angle.
White LED and 3-color LED were measured with C11007MA (RC-VIS-MOS).
[Figure 34] White LED and 3-color LED measurements
A/D
co
un
t
0
40000
30000
20000
10000
Pixels
0 100 200 300 400 500
Wavelength (nm)
A/D
co
un
t
3400
35000
30000
25000
20000
15000
10000
5000
390 440 490 540 590 640 690 740
White LED
3-color LED
KACCB0229EA
Raman spectrum of naphthalene sample were measured with C11714CA (TG-RAMAN-II).
[Figure 35] Raman spectrophotometry
790800 820 840 860 900880 920
12000
10000
8000
6000
4000
2000
0
14000
Wavelength (nm)
A/D
co
un
ts
(Pump laser: 785 nm/60 mW, connection fiber: 200 m core dia., integration time: 5000 ms)
A/D
co
un
t
0
40000
30000
20000
10000
Wavelength (nm)
600 700 800 900 1000 1100
Reflected light
Reference light
750 800
Wavelength (nm)
A/D
co
un
t
0
50000
40000
10000
20000
30000
60000
850 900 950
Ref
lect
ance
(%
)
0
100
60
50
80
90
70
40
30
20
10
Wavelength (nm)
600 700 800 900 1000 1100

8. Related products
37
8-1 Optical fibers for light input A9762-01, A9763-01
8-2 Coaxial cable for external trigger A10670
[Table 7] Optical fibers for mini-spectrometers
As optional accessories for use with mini-spectrometers, HAMAMATSU provides UV-VIS (UV resistant) and VIS-NIR optical fib-ers (core diameter 600 m). RC series (C11009MA, C11010MA) mini-spectrometers integrate an optical fiber.
Type no. Product name Applicable mini-spectrometer Core diameter( m)
Specification
A9762-01
A9763-01
600
600
NA=0.22Length 1.5 m, both ends terminated with SMA905D connector
NA=0.22Length 1.5 m, both ends terminated with SMA905D connector
C10082CA, C10082CAHC10083CA, C10083CAHC10082MD, C10083MDC9404CA, C9404CAHC11007MA, C11697MA
C9405CB, C9406GCC9913GC, C9914GBC11008MA, C11118GAC11713CA, C11714CA
UV-VIS optical fiber (UV resistant)
VIS-NIR optical fiber
KACCA0220EA
Cable length: 1.5 mCable specification: 1.5D-2V
LEMO connectorFFA00S250 (made by LEMO)
BNC connectorBNC-P-1.5V-CR (made by DDK)
26.0 31.7
6.4
14.5
[Figure 36] Dimensional outline (unit: mm)
L10671 is a UV-VIS (ultra-violet to visible) fiber light source using a compact deuterium lamp (S2D2 lamp). It provides stable light output over a wavelength range from 200 nm to 1600 nm through an optical fiber light guide (sold separately).Designed with an emphasis on compactness, portability, and ease of use, L10671 is ideal for various types of portable instruments.
● Compact: 72 × 40 × 90 mm (1/25 the size of our previous products)● High stability: Fluctuation 0.004 % p-p Typ. (equivalent to 2 × 10 -5 A.U.)● High output: Uses a high-efficiency compact deuterium lamp.
8-3 Compact UV-VIS S2D2 fiber light source L10671
Features
Note: Light guide is sold separately.
L10290 emits light from 200 nm to 1600 nm through an optical fiber light guide (sold separately). Using a "high-brightness deuterium lamp", L10290 produces high radiant intensity, which is twice that of its predecessor light source (30 W deuterium lamp light source).
● High output: Twice intensity (compared to conventional type)● High stability: Fluctuation 0.004 % p-p Typ. (equivalent to 2 × 10 -5 A.U.)● Long life lamp: 2000 hours
8-4 High power UV-VIS fiber light source L10290
Features
Note: Light guide is sold separately.
L9455 series and L11035 series are xenon flash lamp modules that integrate a 5 W xenon flash lamp, a trigger socket, and a power supply into a compact case. These flash lamp modules generate less heat and offer easy use.Fiber adapter type simply connects to an SMA light guide (sold separately) and emits a spectrum of light from 200 nm to 1600 nm through the fiber end. This makes it suitable for use in various types of analytical equipment.
● Compact: 98 × 35 × 44 mm (L9455 series), 120 × 35 × 44 mm (L11035 series)● Long service life: 1.0 × 10 9 flash (about 28000 hours of lighting at 10 Hz)● Repetition rate: 530 Hz Max.
8-5 Compact 5 W xenon flash lamp module L9455-11/-12/-13,
L11035-11/-12/-13 (SMA fiber adapter type)
Features Note: Light guide is sold separately.

38
Note: SMA fiber is optional (sold separately).
This module is the world’s smallest in its wattage class by integrating the circuit efficiently, and battery operation type is also available.It is ideal light source for small analytical instrument such as environmental analysis and medical inspection. Also, it will be installed in the portable analytical instrument such as highly precise environmental monitoring and POCT, which are expected to be developed in the future.
● High stability: 0.5 % CV typ. Long life: 1 × 10 9 flashes● Repetition rate: 1250 Hz Max.● Broad radiant spectrum: Ultraviolet to near infrared range
8-6 2 W xenon flash lamp module L12336 series
Features


We welcome your access to our web site
www.hamamatsu.comPlease access our web site to check various information about our latest productcatalogues, news, technology introduction and corporate outline.Some of the new/developmental products in this catalogue may not be available onour web site. Please consult your local sales office for more information.
Copies of the full warranty can be obtained prior to the purchase of products by contacting your local Hamamatsu sales office.
Hamamatsu makes no other warranties, and any and all implied warranties of merchantability, or fitness for a particular purpose, are hereby disclaimed. The customer is responsible for use of the product in accordance with Hamamatsu's instructions and within the operating specifications and ratings listed in this catalogue. Hamamatsu shall not be responsible for the customer's improper selection of a product for a particular application or otherwise. No warranty will apply if the products are in any way altered or modified after delivery by Hamamatsu or for any intentional misuse or abuse of the products. Proper design safety rules should be followed when incorporating these products into devices that could potentially cause bodily injury.
Hamamatsu's liability on any claim for loss or damage arising out of the supplying of any products, whether based on contract, warranty, tort (including negligence and for property damage or death and bodily injury) or other grounds, shall not in any event exceed the price allocable to such products or a part thereof involved in the claim, regardless of cause or fault. In no event shall Hamamatsu be responsible to the customer or any third party for any consequential, incidental or indirect damages, including but not limited to loss of profits, revenues, sales, data, business, goodwill or use, even if the company has been advised of the possibility of such loss or damage. The limitation of liability set forth herein applies both to products and services purchased or otherwise provided hereunder. This warranty is limited to repair or replacement, at the sole option of Hamamatsu, of any product which is defective in workmanship or materials used in manufacture. All warranty claims must be made within 1 year from the date of purchase or provision of the products or services.
Products that are amenable to repair shall be done so either under warranty or pursuant to a separate repair agreement. Some products cannot be repaired either because of the nature or age of the product, the unavailability of spare parts, or the extent of the damage is too great. Please contact your local Hamamatsu office for more details.
The products described in this catalogue should be used by persons who are accustomed to the properties of photoelectronics devices, and have expertise in handling and operating them. They should not be used by persons who are not experienced or trained in the necessary precautions surrounding their use.
The information in this catalogue is subject to change without prior notice.
Information furnished by Hamamatsu is believed to be reliable. However, no responsibility is assumed for possible inaccuracies or omissions.
No patent rights are granted to any of the circuits described herein.

Cat. No. KACC0002E07Mar. 2013 DNPrinted in Japan (2,500)
HAMAMATSU PHOTONICS K.K., Solid State Division1126-1, Ichino-cho, Higashi-ku, Hamamatsu City, 435-8558, JapanTelephone: (81)53-434-3311, Fax: (81)53-434-5184
www.hamamatsu.com
Main ProductsSi photodiodesAPDMPPCPhoto ICImage sensorsX-ray flat panel sensorsPSDInfrared detectorsLEDOptical communication devicesAutomotive devicesMini-spectrometers High energy particle/X-ray detectorsOpto-semiconductor modules
Hamamatsu also supplies:Photoelectric tubesImaging tubesLight sourcesImaging and processing systems
Information in this catalogue isbelieved to be reliable. However,no responsibility is assumed forpossible inaccuracies or omissions.Specifications are subject tochange without notice. No patentrights are granted to any of thecircuits described herein.
© 2013 Hamamatsu Photonics K.K.
Quality, technology, and serviceare part of every product.
JAPAN:HAMAMATSU PHOTONICS K.K.325-6, Sunayama-cho, Naka-kuHamamatsu City, 430-8587, JapanTelephone: (81)53-452-2141, Fax: (81)53-456-7889
China:HAMAMATSU PHOTONICS (CHINA) CO., LTD.1201 Tower B, Jiaming Center, No.27 Dongsanhuan Beilu,Chaoyang District, Beijing 100020, ChinaTelephone: (86)10-6586-6006, Fax: (86)10-6586-2866E-mail: [email protected]
U.S.A.:HAMAMATSU CORPORATIONMain Office360 Foothill Road, P.O. BOX 6910,Bridgewater, N.J. 08807-0910, U.S.A.Telephone: (1)908-231-0960, Fax: (1)908-231-1218E-mail: [email protected]
Western U.S.A. Office:Suite 200, 2875 Moorpark Avenue San Jose, CA 95128, U.S.A.Telephone: (1)408-261-2022, Fax: (1)408-261-2522E-mail: [email protected]
United Kingdom, South Africa:HAMAMATSU PHOTONICS UK LIMITEDMain Office2 Howard Court, 10 Tewin Road, Welwyn Garden City,Hertfordshire AL7 1BW, United KingdomTelephone: (44)1707-294888, Fax: (44)1707-325777E-mail: [email protected]
South Africa office:PO Box 1112Buccleuch 2066Johannesburg, South AfricaTelephone/Fax: (27)11-802-5505
France, Portugal, Belgium, Switzerland, Spain:HAMAMATSU PHOTONICS FRANCE S.A.R.L.19, Rue du Saule Trapu, Parc du Moulin de Massy, 91882 Massy Cedex, FranceTelephone: (33)1 69 53 71 00 Fax: (33)1 69 53 71 10E-mail: [email protected]
Swiss Office:Dornacherplatz 74500 Solothurn, SwitzerlandTelephone: (41)32/625 60 60, Fax: (41)32/625 60 61E-mail: [email protected]
Belgian Office:Scientific Park,7, Rue du BosquetB-1348 Louvain-La-Neuve, BelgiumTelephone: (32)10 45 63 34Fax: (32)10 45 63 67E-mail: [email protected]
Spanish Office:C. Argenters, 4 edif 2Parque Tecnologico del Valles E-08290 CERDANYOLA, (Barcelona) SpainTelephone: (34)93 582 44 30Fax: (34)93 582 44 31E-mail: [email protected]
Germany, Denmark, Netherlands, Poland:HAMAMATSU PHOTONICS DEUTSCHLAND GmbHArzbergerstr. 10,D-82211 Herrsching am Ammersee, GermanyTelephone: (49)8152-375-0, Fax: (49)8152-265-8E-mail: [email protected]
Danish Office:Lautruphoj 1-3DK-2750 Ballerup, DenmarkTelephone: (45)70 20 93 69, Fax: (45)44 20 99 10E-mail: [email protected]
Netherlands Office:Televisieweg 2NL-1322 AC Almere, The NetherlandsTelephone: (31)36-5405384, Fax: (31)36-5244948E-mail: [email protected]
Poland Office:02-525 Warsaw,8 St. A. Boboli Str., PolandTelephone: (48)22-646-0016, Fax: (48)22-646-0018E-mail: [email protected]
North Europe and CIS:HAMAMATSU PHOTONICS NORDEN ABMain OfficeThorshamnsgatan 35 16440 Kista, SwedenTelephone: (46)8-509-031-00, Fax: (46)8-509-031-01E-mail: [email protected]
Russian Office:Vyatskaya St. 27, bld. 15Kosmodamianskaya nab. 52/1, 14th floorRU-127015 Moscow, RussiaTelephone: (7) 495 258 85 18, Fax: (7) 495 258 85 19E-mail: [email protected]
Italy:HAMAMATSU PHOTONICS ITALIA S.R.L.Strada della Moia, 1 int. 620020 Arese, (Milano), ItalyTelephone: (39)02-935 81 733Fax: (39)02-935 81 741E-mail: [email protected]
Rome Office:Viale Cesare Pavese, 43500144 Roma, ItalyTelephone: (39)06-50513454, Fax: (39)06-50513460E-mail: [email protected]
Taiwan:HAKUTO TAIWAN LTD.6F, No.308, Pa teh Road, Sec, 2,Taipei, Taiwan R.O.C.Telephone: (886)2-8772-8910Fax: (886)2-8772-8918
KORYO ELECTRONICS CO., LTD.9F-7, No.79, Hsin Tai Wu Road Sec.1, Hsi-Chih, Taipei, Taiwan, R.O.C.Telephone: (886)2-2698-1143, Fax: (886)2-2698-1147
Republic of Korea:SANGKI CORPORATIONSuite 431, World Vision BLDG.24-2 Yoido-DongYoungdeungpo-KuSeoul, 150-877Telephone: (82)2-780-8515Fax: (82)2-784-6062
Singapore:HAKUTO SINGAPORE PTE LTD.Block 2, Kaki Bukit Avenue 1, #04-01 to #04-04Kaki Bukit Industrial Estate, Singapore 417938Telephone: (65)67458910, Fax: (65)67418200
Sales Offices