Mingling in mafic magma chambers replenished by light...
16
ELSEVIER Earth and Planetary Science Letters 157 ( 1998) 4 l-56 EPSL Mingling in mafic magma chambers replenished by light felsic inputs: fluid dynamical experiments Roberto F. Weinberg ‘, Alison M. Leitch * Research School of Earth Sciences, Australian National UniversiQ, Cunherra, ACT 0200, Australiu Received 7 April 1997; revised version received 12 January 1998: accepted 30 January 1998 Abstract We investigate, by means of laboratory analogues, the fluid dynamics of magma hybridisation caused by the intrusion of felsic magma into a mafic magma chamber. The ‘input’ felsic magma is modelled by a cold, low density fluid and the ‘resident’ mafic magma by a layer of fluid wax close to its solidification point. The cold, rising input drives convection and solidification in the resident fluid, and the solidification causes significant perturbations to an otherwise simple input flow, greatly enhancing mixing and mingling between the two model magmas. The dimensionless parameters controlling the evolution of the system are determined and different morphologies of the solid mass fit into clearly defined fields in the parameter space. The most important implication of the experiments is that the freezing of mafic chambers due to felsic intrusion may give rise to intense hybridization of large volumes of magma. This potentially important mechanism for hybridization has, to date, received little attention in the literature. 0 1998 Elsevier Science B.V. All rights reserved. Keywords: felsic composition; mafic magmas; fluid dynamics; models 1. Introduction Hybridisation of magmas through mixing and mingling has now become established as a major petrogenetic process [l]. The mixing of magmas re- sults in a homogenous rock of intermediate compo- sition, whereas in a mingled rock, the end-members are dispersed or intertwined in each other, typically on a centimetre to decimetre scale, but retain their compositional identities. Using fluid dynamical ex- periments, we investigate hybridisation caused by the intrusion from below of low density, cold felsic magma into a mafic magma chamber. Most past work on magma hybridisation has con- sidered the replenishment of a felsic magma chamber by intruding mafic magmas; however, the intrusion of felsic magmas into mafic chambers may be more common than so far realised [2]. It is well known that the order of emplacement of magmas in many large batholiths is from more primitive magmas to more felsic magmas [2-4], providing the appropriate conditions for felsic intrusions into mafic chambers, and a few examples of granite intrusion into dioritic magma chambers have been described [2,5,6]. Iden- tifying the intrusion of felsic magmas into mafic chambers in the field is difficult because: (a) the dispersion of mafic enclaves in the felsic intruder *Corresponding author. Tel.:+61 (6) 249-3242; Fax: +61 (6) 249-0738; E-mail: [email protected] ’ Present address: Department of Earth Sciences, Oxford Univer- sity, Parks Road, Oxford OXI 3PR, UK. 0012-821X/98/$19.00 0 1998 Elsevier Science B.V. All rights reserved PII SOO12-821X(98)00025-9
Transcript of Mingling in mafic magma chambers replenished by light...

ELSEVIER Earth and Planetary Science Letters 157 ( 1998) 4 l-56
EPSL
Mingling in mafic magma chambers replenished by light felsic inputs: fluid dynamical experiments
Roberto F. Weinberg ‘, Alison M. Leitch *
Research School of Earth Sciences, Australian National UniversiQ, Cunherra, ACT 0200, Australiu
Received 7 April 1997; revised version received 12 January 1998: accepted 30 January 1998
Abstract
We investigate, by means of laboratory analogues, the fluid dynamics of magma hybridisation caused by the intrusion of felsic magma into a mafic magma chamber. The ‘input’ felsic magma is modelled by a cold, low density fluid and the ‘resident’ mafic magma by a layer of fluid wax close to its solidification point. The cold, rising input drives convection and solidification in the resident fluid, and the solidification causes significant perturbations to an otherwise simple input flow, greatly enhancing mixing and mingling between the two model magmas. The dimensionless parameters controlling the evolution of the system are determined and different morphologies of the solid mass fit into clearly defined fields in the parameter space. The most important implication of the experiments is that the freezing of mafic chambers due to felsic intrusion may give rise to intense hybridization of large volumes of magma. This potentially important mechanism for hybridization has, to date, received little attention in the literature. 0 1998 Elsevier Science B.V. All rights reserved.
Keywords: felsic composition; mafic magmas; fluid dynamics; models
1. Introduction
Hybridisation of magmas through mixing and
mingling has now become established as a major petrogenetic process [l]. The mixing of magmas re- sults in a homogenous rock of intermediate compo- sition, whereas in a mingled rock, the end-members are dispersed or intertwined in each other, typically on a centimetre to decimetre scale, but retain their
compositional identities. Using fluid dynamical ex- periments, we investigate hybridisation caused by
the intrusion from below of low density, cold felsic
magma into a mafic magma chamber.
Most past work on magma hybridisation has con-
sidered the replenishment of a felsic magma chamber by intruding mafic magmas; however, the intrusion
of felsic magmas into mafic chambers may be more common than so far realised [2]. It is well known that the order of emplacement of magmas in many
large batholiths is from more primitive magmas to more felsic magmas [2-4], providing the appropriate conditions for felsic intrusions into mafic chambers,
and a few examples of granite intrusion into dioritic magma chambers have been described [2,5,6]. Iden- tifying the intrusion of felsic magmas into mafic chambers in the field is difficult because: (a) the dispersion of mafic enclaves in the felsic intruder
*Corresponding author. Tel.:+61 (6) 249-3242; Fax: +61 (6)
249-0738; E-mail: [email protected] ’ Present address: Department of Earth Sciences, Oxford Univer- sity, Parks Road, Oxford OXI 3PR, UK.
0012-821X/98/$19.00 0 1998 Elsevier Science B.V. All rights reserved
PII SOO12-821X(98)00025-9
42 R.E Weinberg, A.M. Leitch/Earth and Planetaq Science Letters 157 (1998) 41-56
SURFACE
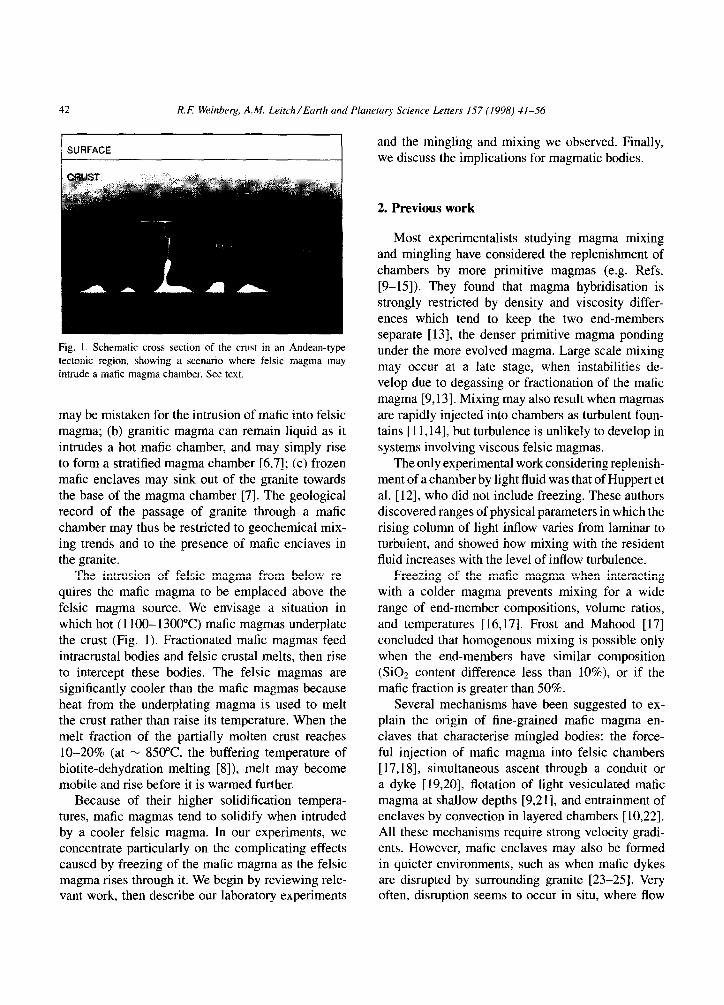
Fig. I. Schematic cross section of the crust in an Andean-type
tectonic region, showing a scenario where felsic magma may
intrude a mafic magma chamber. See text.
may be mistaken for the intrusion of mafic into felsic
magma; (b) granitic magma can remain liquid as it
intrudes a hot mafic chamber, and may simply rise to form a stratified magma chamber [6,7]; (c) frozen
mafic enclaves may sink out of the granite towards the base of the magma chamber [7]. The geological record of the passage of granite through a mafic chamber may thus be restricted to geochemical mix-
ing trends and to the presence of mafic enclaves in the granite.
The intrusion of felsic magma from below re- quires the mafic magma to be emplaced above the
felsic magma source. We envisage a situation in
which hot (1 lOO- 1300°C) mafic magmas underplate the crust (Fig. 1). Fractionated mafic magmas feed
intracrustal bodies and felsic crustal melts, then rise to intercept these bodies. The felsic magmas are significantly cooler than the mafic magmas because
heat from the underplating magma is used to melt the crust rather than raise its temperature. When the
melt fraction of the partially molten crust reaches lo-20% (at - 850°C the buffering temperature of
biotite-dehydration melting [S]), melt may become mobile and rise before it is warmed further.
Because of their higher solidification tempera- tures, mafic magmas tend to solidify when intruded by a cooler felsic magma. In our experiments, we concentrate particularly on the complicating effects caused by freezing of the mafic magma as the felsic magma rises through it. We begin by reviewing rele- vant work, then describe our laboratory experiments
and the mingling and mixing we observed. Finally,
we discuss the implications for magmatic bodies.
2. Previous work
Most experimentalists studying magma mixing
and mingling have considered the replenishment of chambers by more primitive magmas (e.g. Refs.
[9-151). They found that magma hybridisation is strongly restricted by density and viscosity differ-
ences which tend to keep the two end-members separate [13], the denser primitive magma ponding under the more evolved magma. Large scale mixing may occur at a late stage, when instabilities de- velop due to degassing or fractionation of the mafic
magma [9,13]. Mixing may also result when magmas are rapidly injected into chambers as turbulent foun-
tains [ 11,141, but turbulence is unlikely to develop in
systems involving viscous felsic magmas. The only experimental work considering replenish-
ment of a chamber by light fluid was that of Huppert et al. [ 121, who did not include freezing. These authors discovered ranges of physical parameters in which the rising column of light inflow varies from laminar to turbulent, and showed how mixing with the resident
fluid increases with the level of inflow turbulence. Freezing of the mafic magma when interacting
with a colder magma prevents mixing for a wide range of end-member compositions, volume ratios,
and temperatures [ 16,171. Frost and Mahood [ 171
concluded that homogenous mixing is possible only when the end-members have similar composition
(SiO2 content difference less than lo%), or if the mafic fraction is greater than 50%.
Several mechanisms have been suggested to ex- plain the origin of fine-grained mafic magma en-
claves that characterise mingled bodies: the force- ful injection of mafic magma into felsic chambers
[17,18], simultaneous ascent through a conduit or a dyke [ 19,201, flotation of light vesiculated mafic magma at shallow depths [9,21], and entrainment of enclaves by convection in layered chambers [ 10,221. All these mechanisms require strong velocity gradi- ents. However, mafic enclaves may also be formed in quieter environments, such as when mafic dykes are disrupted by surrounding granite [23-2.51. Very often, disruption seems to occur in situ, where flow
R.FI Weinberg, A.M. Leitch/Earth and Planetary Science Letters 157 (1998) 41-56 43
shearing plays a minor role [2,24]: in this case, it
could result from the contraction of mafic magma that accompanies freezing [2,23].
Most experimental studies on mingling have con- sidered simultaneous flow of magmas in volcanic con- duits [ 19,20,26]. Weinberg [27] discusses the possi-
bility of slow magma mingling and mixing during ascent of a diapir. Snyder and Tait [ 151 report on min-
gling during slow replenishment of magma chambers,
where disruption of the dense, less viscous intruding fluid was caused by buoyancy and flow instabilities at
the contact between the fluids. Fink and Griffiths [28] look at the solidification of lava flows under air and
water. Their experiments also apply to the quenching of dense mafic magmas ponding in a colder magma chamber: in this case, freezing inhibits magma inter-
action.
To our knowledge, no previous experimental work has been carried out on the freezing of mafic magma
due to cold felsic intrusion.
3. Procedure and methodology
The key properties of the resident mafic and in- truding felsic magmas are that the mafic magma is close to its solidification temperature and the felsic
magma is colder, lighter, more viscous and miscible. To model the resident magma, we chose polyethy-
lene glycol (PEG600) wax because it is transparent
when melted, and has a melting temperature close to room temperature. Finding an analogue to the
intruding magma was problematical. Water-based materials have an unacceptable high heat of mixing
with wax [29], and hydrocarbon oils are immiscible
with PEG. Glycerine and ethanol are miscible and do not have large heats of mixing, but glycerine is heavier than PEG and ethanol is much less viscous.
We compromised with a 3 : 2 by volume mix of glycerine and ethanol [30]. This has a lower viscos-
ity than PEG at the same temperature (30 cf. 180
mPa s at 2O”C), but the viscosity increases strongly as temperature decreases, to about 100 mPa s at 0°C
and 220 mPa s at -10°C. Our input fluid was recy- cled several times, and it became denser and more viscous due to evaporation of alcohol and contami- nation by PEG, so there was some variation of input density and viscosity in our experiments.
This input fluid rose as a smooth, laminar column.
To investigate the effect of an unstable column, we used a 1 : 3 volume ratio of glycerine and ethanol. This had a viscosity of 9 mPa s at 20°C 25 mPa s at 0°C and 40 mPa s at -10°C. Physical properties of the materials are given in Table 1.
Most experiments were performed in a perspex tank with dimensions shown in Fig. 2b. To gauge
the importance of wall effects, we also carried out
some experiments in a larger tank (30 x 30 x 30
cm). The tank was filled to depth h with the resident fluid, just above its solidification temperature T,, and the cold intruding fluid was injected through a
0.6-cm-diameter hole centred in the base of the tank. The input fluid was controlled at several degrees below T, by a refrigeration unit and heat exchanger
as shown in Fig. 2a. The input how was maintained
at volume flux Q by a peristaltic pump. Q was measured before each experiment and checked by
monitoring the rate at which the tank filled.
The experiments were observed using the shad-
owgraph technique, diffuse back lighting or front lighting from an arc lamp, and recorded on still photographs and video films. Thermistors monitored
the temperature within the overlying layer of input fluid and at the discharge point (Fig. 2b). Tempera-
tures were logged onto a computer every 2 s. Fluid samples were taken with syringes attached to hypo- dermic tubing and densities measured by a precision
digital densimeter. Viscosity was measured with a
Haake roto-viscometer.
4. System and controlling parameters
The input fluid affects the system in two basic ways: rising through the layer it drives convection and it causes solidification of the resident liquid. Thus, we expect the system evolution to be controlled by the rates of deformation and solidification. These, in turn,
are determined by the buoyancy flux of the input and its temperature deficit. We also expect the viscosity
ratio between input and resident fluids to play a role,
since this is a key factor in the way the fluids interact. From the variables in Table 1, we can construct di-
mensionless parameters which characterise the sys- tem. We neglect the buoyancy of the solid as it was usually of secondary importance, and while strength
44 R.R Weinberg, A.M. Leitch/Eatih and Planetary Science Letters 157 (1998) 41-56
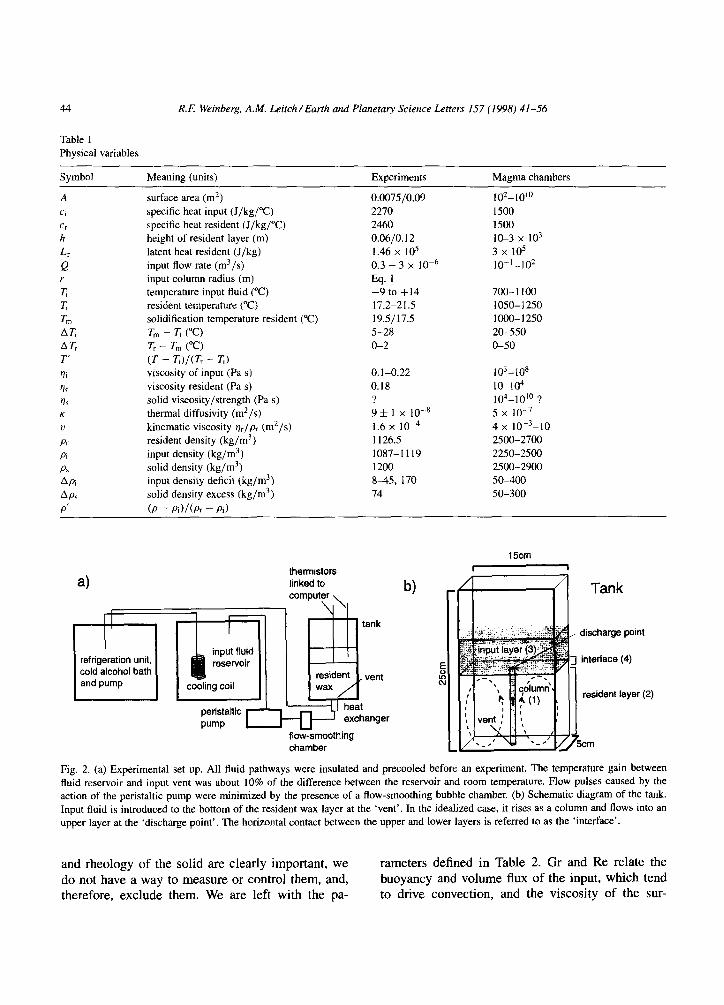
Table 1 Physical variables
Meaning (units)
surface area (m*)
specific heat input (J/kg/W
specific heat resident (J/kg/“C)
height of resident layer (m)
latent heat resident (J/kg)
input flow rate (m3/s)
input column radius (m)
temperature input fluid (“C)
resident temperature (“C)
solidification temperature resident (“C)
Gl - 7; (“C)
Tr - L (“C)
(T - W(T, - K) viscosity of input (Pa s)
viscosity resident (Pa s)
solid viscosity/strength (Pa s)
thermal diffusivity (m2/s)
kinematic viscosity r),/pr (m’/s)
resident density (kg/m3)
input density (kg/m3)
solid density (kg/m3)
input density deficit (kg/m3)
solid density excess (kg/m3)
(P - Pi)l(Pr - PI)
Experiments
0.0075/0.09
2270
2460
0.06/O. I2
1.46 x IO5
0.3 - 3 x 10-s
Eq. 1
-9 to +14
17.2-21.5
19.5/17.5
5-28
o-2
0.1-0.22
0.18
?
9 f 1 x 10-s
1.6 x 1O-4
1126.5
1087-l 119
1200
8-4.5, 170
74
Magma chambers
1oz-10’0
1500
1500
It&3 x 10³
3 X 10s
lo-‘-102
700-l 100
1050-1250
1000-1250
20-550
O-50
103-10s
10-104
104-10’0 ?
5 X 10⁻⁷
4 X 10-s-10
2500-2700
2250-2500
2500-2900
50-400
50-300
a)
thermistors linked to computer ,
I ;
flow-smoothing chamber
b)
15cm
m Tank
Fig. 2. (a) Experimental set up. All fluid pathways were insulated and precooled before an experiment. The temperature gain between
fluid reservoir and input vent was about 10% of the difference between the reservoir and room temperature. Flow pulses caused by the
action of the peristaltic pump were minimized by the presence of a flow-smoothing bubble chamber. (b) Schematic diagram of the tank.
Input fluid is introduced to the bottom of the resident wax layer at the ‘vent’. In the idealized case, it rises as a column and ROWS into an
upper Layer at the ‘discharge point’. The horizontal contact between the upper and lower layers is referred to as the ‘interface’.
and rheology of the solid are clearly important, we do not have a way to measure or control them, and, therefore, exclude them. We are left with the pa-
rameters defined in Table 2. Gr and Re relate the buoyancy and volume flux of the input, which tend to drive convection, and the viscosity of the sur-
R.F: Weinberg, A.M. Leitch/Earth and Planeta? Science Letters 157 (1998) 41-56 45
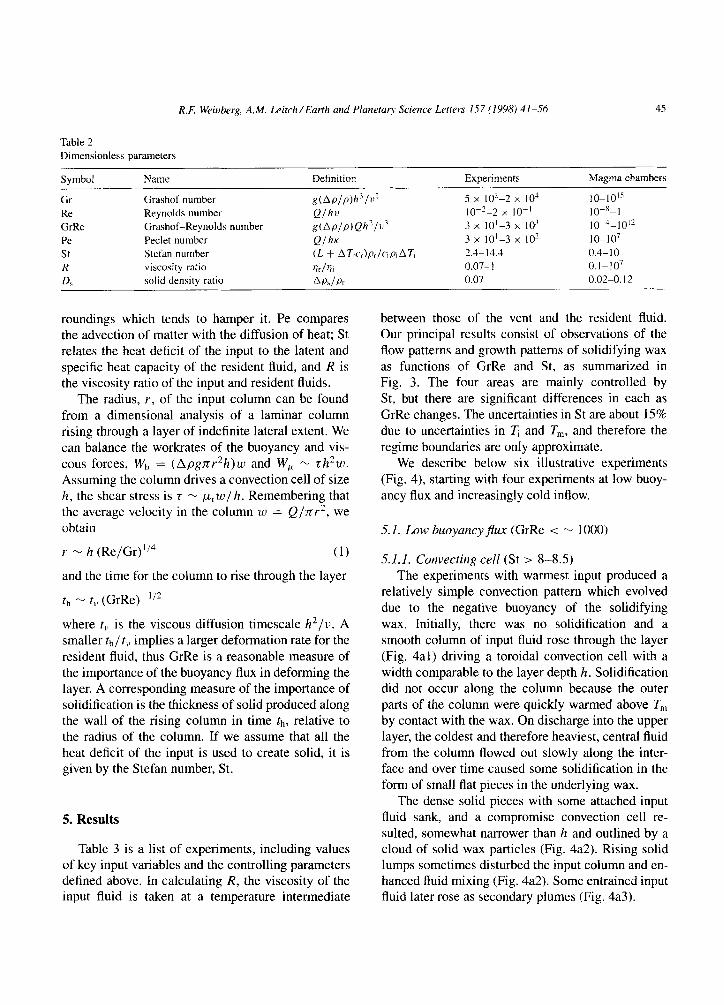
Table 2
Dimensionless parameters
Symbol Name
Gr Grashof number
Re Reynolds number
GrRe Grashof-Reynolds number
Pe Peclet number
St Stefan number R viscosity ratio
D, solid density ratio
Definition
g(Wp)h’lv’
Qlhv g(Aplp)Qh’lu” Q/hK CL + AT~,)prlc’,p,AT, Or/%
APJPF
Experiments
5 X IO’-2 X IO/’
lo-‘-2 X 10-l
3 x IO’-3 X IO3
3 x IO’-3 x 10”
?.3- 14.4 0.07- 1 0.07
Magma chambers
1o-1o’5
1 o-x- I ]o-J-]()”
IO-IO’ 0.4-10 0.1-10’
0.02-O. I2
roundings which tends to hamper it. Pe compares the advection of matter with the diffusion of heat; St relates the heat deficit of the input to the latent and
specific heat capacity of the resident fluid, and R is the viscosity ratio of the input and resident fluids.
The radius, r, of the input column can be found
from a dimensional analysis of a laminar column rising through a layer of indefinite lateral extent. We
can balance the workrates of the buoyancy and vis-
cous forces, W, = (Apgnr2h)w and W, - th’w. Assuming the column drives a convection cell of size
h, the shear stress is 5 - pr w / h . Remembering that the average velocity in the column w = Q/nr2, we obtain
r - h (Re/Gr)“’ (1)
and the time for the column to rise through the layer
th - t,, (GrRe)-“2
where t,, is the viscous diffusion timescale h’/u. A smaller th/ t,, implies a larger deformation rate for the
resident fluid, thus GrRe is a reasonable measure of the importance of the buoyancy flux in deforming the
layer. A corresponding measure of the importance of solidification is the thickness of solid produced along the Wall of the rising column in time th, relative to the radius of the column. If we assume that all the
heat deficit of the input is used to create solid, it is given by the Stefan number, St.
5. Results
Table 3 is a list of experiments, including values of key input variables and the controlling parameters defined above. In calculating R, the viscosity of the input fluid is taken at a temperature intermediate
between those of the vent and the resident fluid. Our principal results consist of observations of the
flow patterns and growth patterns of solidifying wax
as functions of GrRe and St, as summarized in Fig. 3. The four areas are mainly controlled by St, but there are significant differences in each as
GrRe changes. The uncertainties in St are about 15% due to uncertainties in T and T,, and therefore the
regime boundaries are only approximate. We describe below six illustrative experiments
(Fig. 4), starting with four experiments at low buoy-
ancy flux and increasingly cold inflow.
5.1. Low buoyuncyjux (GrRe < - 1000)
5.1.1. Convecting cell (St > S-8.5) The experiments with warmest input produced a
relatively simple convection pattern which evolved
due to the negative buoyancy of the solidifying
wax. Initially, there was no solidification and a smooth column of input fluid rose through the layer
(Fig, 4al) driving a toroidal convection cell with a
width comparable to the layer depth h. Solidification did not occur along the column because the outer parts of the column were quickly warmed above T,
by contact with the wax. On discharge into the upper layer, the coldest and therefore heaviest, central fluid from the column flowed out slowly along the inter-
face and over time caused some solidification in the form of small flat pieces in the underlying wax.
The dense solid pieces with some attached input
fluid sank, and a compromise convection cell re-
sulted, somewhat narrower than h and outlined by a cloud of solid wax particles (Fig. 4a2). Rising solid lumps sometimes disturbed the input column and en- hanced fluid mixing (Fig. 4a2). Some entrained input fluid later rose as secondary plumes (Fig. 4a3).
46 R.E Weinberg, A.M. Leitch/ Earfh and P lanrfaty Science Letters 157 ( 1998) 41-56
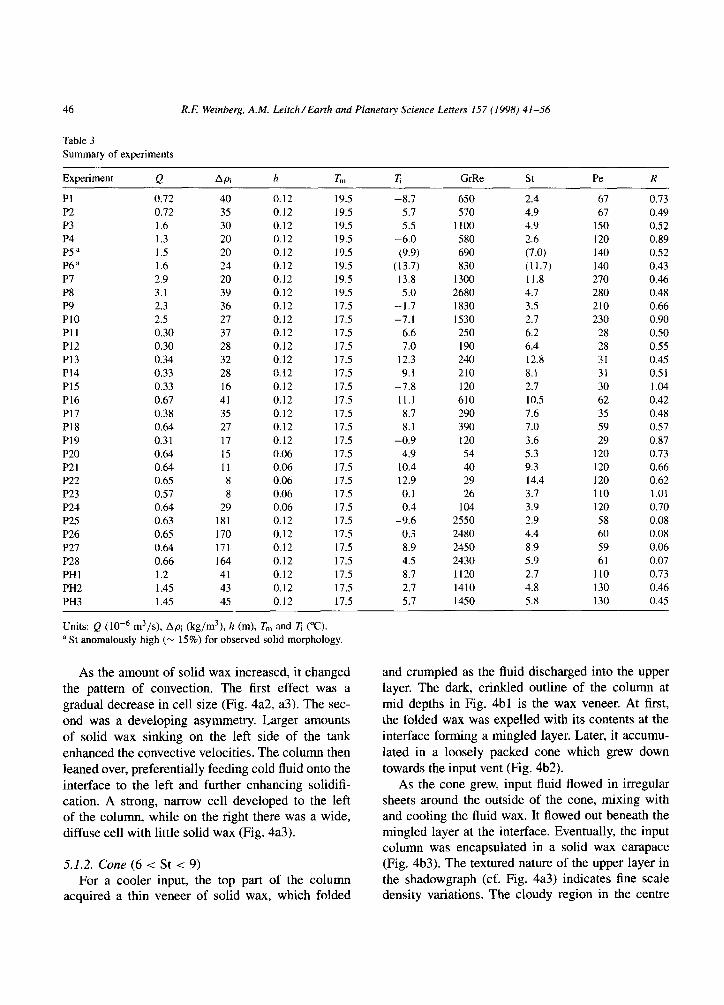
Table 3
Summary of experiments
Experiment Q API h Till Ti GrRe St Pe R
PI 0.12 40 0.12 19.5 -8.7 650 2.4 67
P2 0.12 35 0.12 19.5 5.7 570 4.9 67
P3 1.6 30 0.12 19.5 5.5 1100 4.9 150
P4 1.3 20 0.12 19.5 -6.0 580 2.6 120
P5” 1.5 20 0.12 19.5 (9.9) 690 (7.0) 140
P6” 1.6 24 0.12 19.5 (13.7) 830 (11.7) 140
P7 2.9 20 0.12 19.5 13.8 1300 Il.8 210
P8 3.1 39 0.12 19.5 5.0 2680 4.7 280
P9 2.3 36 0.12 17.5 -1.7 1830 3.5 210
PI0 2.5 27 0.12 17.5 -7.1 1530 2.7 230
PI1 0.30 37 0.12 17.5 6.6 250 6.2 28
P12 0.30 28 0.12 17.5 1.0 190 6.4 28
PI3 0.34 32 0.12 17.5 12.3 240 12.8 31
PI4 0.33 28 0.12 17.5 9.1 210 8.1 31
PI5 0.33 16 0.12 17.5 -7.8 120 2.7 30
P16 0.67 41 0.12 17.5 11.1 610 10.5 62
PI7 0.38 35 0.12 17.5 8.7 290 7.6 35
PI8 0.64 21 0.12 17.5 8.1 390 7.0 59
PI9 0.31 17 0.12 17.5 -0.9 120 3.6 29
P20 0.64 15 0.06 17.5 4.9 54 5.3 120
P21 0.64 11 0.06 17.5 10.4 40 9.3 120
P22 0.65 8 0.06 17.5 12.9 29 14.4 120
P23 0.57 8 0.06 17.5 0.1 26 3.7 110
P24 0.64 29 0.06 17.5 0.4 104 3.9 120
P25 0.63 181 0.12 11.5 -9.6 2550 2.9 58
P26 0.65 170 0.12 17.5 0.3 2480 4.4 60
P2-l 0.64 171 0.12 17.5 8.9 2450 8.9 59
P28 0.66 164 0.12 17.5 4.5 2430 5.9 61
PHI 1.2 41 0.12 17.5 -8.1 1120 2.7 110
PH2 1.45 43 0.12 11.5 2.1 1410 4.8 130
PH3 1.45 45 0.12 17.5 5.7 1450 5.8 130 -
0.73
0.49
0.52
0.89
0.52
0.43
0.46
0.48
0.66
0.90
0.50
0.55
0.45
0.5 1
1.04
0.42
0.48
0.57
0.87
0.73
0.66
0.62
1.01
0.70
0.08
0.08
0.06
0.07
0.73
0.46
0.45
Units: Q (10e6 m3/s), Api (kg/m3), h (m), Tm and T (“C).
‘St anomalously high (- 15%) for observed solid morphology.
As the amount of solid wax increased, it changed the pattern of convection. The first effect was a
gradual decrease in cell size (Fig. 4a2, a3). The sec- ond was a developing asymmetry. Larger amounts
of solid wax sinking on the left side of the tank enhanced the convective velocities. The column then
leaned over, preferentially feeding cold fluid onto the interface to the left and further enhancing solidifi- cation. A strong, narrow cell developed to the left of the column, while on the right there was a wide, diffuse cell with little solid wax (Fig. 4a3).
5.1.2. Cone (6 c St < 9) For a cooler input, the top part of the column
acquired a thin veneer of solid wax, which folded
and crumpled as the fluid discharged into the upper layer. The dark, crinkled outline of the column at
mid depths in Fig. 4bl is the wax veneer. At first, the folded wax was expelled with its contents at the interface forming a mingled layer, Later, it accumu-
lated in a loosely packed cone which grew down
towards the input vent (Fig. 4b2). As the cone grew, input fluid flowed in irregular
sheets around the outside of the cone, mixing with and cooling the fluid wax. It flowed out beneath the mingled layer at the interface. Eventually, the input column was encapsulated in a solid wax carapace (Fig. 4b3). The textured nature of the upper layer in the shadowgraph (cf. Fig. 4a3) indicates fine scale density variations. The cloudy region in the centre

R.E Weirlberg, A.M. Leiich/Earth and Planetary Science Letters 157 (1998) 41-56
/ . P22
14 t
convecting l P13
12 cell
l P7
10 convecting cell
0 P27
41
8 cone P14.
. P18 weak
0 PH3
2
cone 0 P26
0 P26
strong
cone 0 P25
1000 lo4 1000 1 o4
GrRe Fig. 3. Solid wax morphology observed in the experiments in the parameter space St versus GrRe. Experiment numbers given next to
points. Open symbols on the right for experiments with low input viscosity. P5 and P6 (not shown) were anomalous due, we judge. to
inaccuracies in the measurement of T,.
of the upper layer is the input fluid discharging from its many pathways through the permeable solid
structure. It rises up through a thick layer of denser, contaminated input fluid and then Aows sideways.
Once solid wax encapsulated most of the input
flow, for this and colder experiments, thermal buoy- ancy drove downflow in the resident layer on the
outside of the encapsulated column.
5.1.3. Cylinder (St < - 5) For a still colder input, a vertical pipe of solid
formed around the input column before it reached the top of the layer. The pipe then tilted and ruptured near the top and base where the walls were thinnest
(Fig. 4~1) giving rise to a number of small plumes. These small extrusions were encapsulated in their
turn (Fig. 4~2). The solidified region thickened, pro- ducing a column of solid wax permeated by irregular tubes and sheets of input fluid (Fig. 4~3).
5.1.4. Bulb (St 5 3) With very cold input and low buoyancy flux,
a thick carapace of solid wax formed around the input column before it had risen far from the vent.
Fractures near its thinnest regions allowed input
fluid to escape and rise up in sheets on the outside, building another layer of solid in a structure like an onion bulb (Fig. 4dl). In Fig. 4d1, the fluid
rising in narrow plumes from the top of the bulb
had lost most of its heat deficit and so generated only small slivers of solid on its way to the top of the layer. Because of its long contact time with the
resident fluid, the first fluid into the upper layer was relatively warm and contaminated with wax, and its presence hindered solidification at the interface. At a later time, solidification occurred in irregular upright sheets between the vent and the interface (Fig. 4d2).
Still later, small wax slivers carried to the interface at early times dissolved into the mixed interface region (cf. Fig. 4d2, d3). Note that here and in Fig. 4f,
we see a cross section of the wax structure where it intersects the tank walls.
5.2. Large buoyancy flux (GrRe > - 1000)
5.2.1. Convecting cell
Experiment P7 (Fig. 4e) was similar to P13 (Fig. 4a), but had a much higher buoyancy flux.

48 R.E Weinberg, A.M. Leitch/Earth and Planelay Science Letters 157 (1998) 41-56
Cold material was introduced 8.5 times faster in P7, so that Fig. 4a3 should be compared with a snapshot intermediate between Fig. 4el and e2. Faster flow
(higher Pe) in P7 also means that heat transfer ef- ficiency between column and resident Auid is lower than for P13, so that there is a greater tendency in
P7 for the input to cool and solidify the resident layer from above. A thicker, more cohesive solid layer formed on the interface and it was swept into
the convection cell further from the discharge point (Fig. 4el). The negative buoyancy of the solid had a smaller influence on the more vigorously convecting
cell, which was also able to carry pieces of solid wax into the upper layer. Larger pieces of solid within
the resident fluid disrupted the column, and partially blocked the discharge point. In Fig. 4e2, a tongue
of input fluid is emplacing to the left below the
dark solid layer. Such outflows eventually generated a series of layers of solid and glycerine (Fig. 4e3).
5.2.2. Cylinder Experiment PlO (Fig. 4f) had a higher input buoy-
ancy flux than P19 (Fig. 4~). The development of the solid was similar to P19, but the solid structure
was more disrupted, and small pieces of solid wax
(dark specks near top of figure) were carried into the upper layer by the more vigorous flow. Compare the
position of the top of the solid in Fig. 4f and 4~3: because the solid encasing the input flow was broken more at higher GrRe, the ‘hold-up’ of input fluid within the solid structure is much greater.
5.3. Large tank experiments
Experiments in the narrow tank (Fig. 2b) were
economical in fluids, easy to regulate, and allowed good visualization. However, the closeness of the front and back walls meant that the walls intersected
the convection cell in the resident layer and the solid structure at long times, and may have hindered the sinking of solid structures. We carried out three
experiments (PHI-PH3) in a larger tank and found that patterns of convection and solidification were qualitatively the same at similar values of St and
GrRe, and that solidified wax at the interface or around the input column did not sink even when it was not attached to the tank boundaries. Solid
at the interface grew as a shallow dish. This and the attached cone floated like a boat on the resident
layer. In the larger tank, the input fluid discharged over
a much larger surface area, therefore the upper layer
was much thinner, there was more contact between the layers and more solidification at the interface.
5.4. Low viscosiQ ratio experiments
For the experiments above, in the absence of so-
lidification effects, the input always occurred as a laminar column: parameters Rei and Re, of Huppert et al. [ 121 were between 0.5 and 4.5, in their laminar flow regime. Since increasing the buoyancy flux fur-
ther was difficult, we generated an unstable column by reducing the viscosity of the input. Experiments P25-P28 had R - 0.07, Re, - 1.2 and Rei - 14,
and were in the region for varicose instability of the column [12] (see Fig. 5). The column instability
led to an increased contact area and some mechan- ical mixing between input and resident fluids, so
that a thick mixed region formed at the interface. Solid formed in thin flakes and tubes around the column, further disrupting the flow. ‘Cone’ struc- tures built from the solid pieces were loosely packed
and porous. For the warmest input, many tiny solid pieces were carried into the upper layer, forming an inverted cone (Fig. 5), and then tumbled back to- wards the interface, where some dissolved and some
entrained into the lower layer. The results in Fig. 3 (right) show some continuity
with results at higher R; however, R is clearly an important parameter in defining solid morphology.
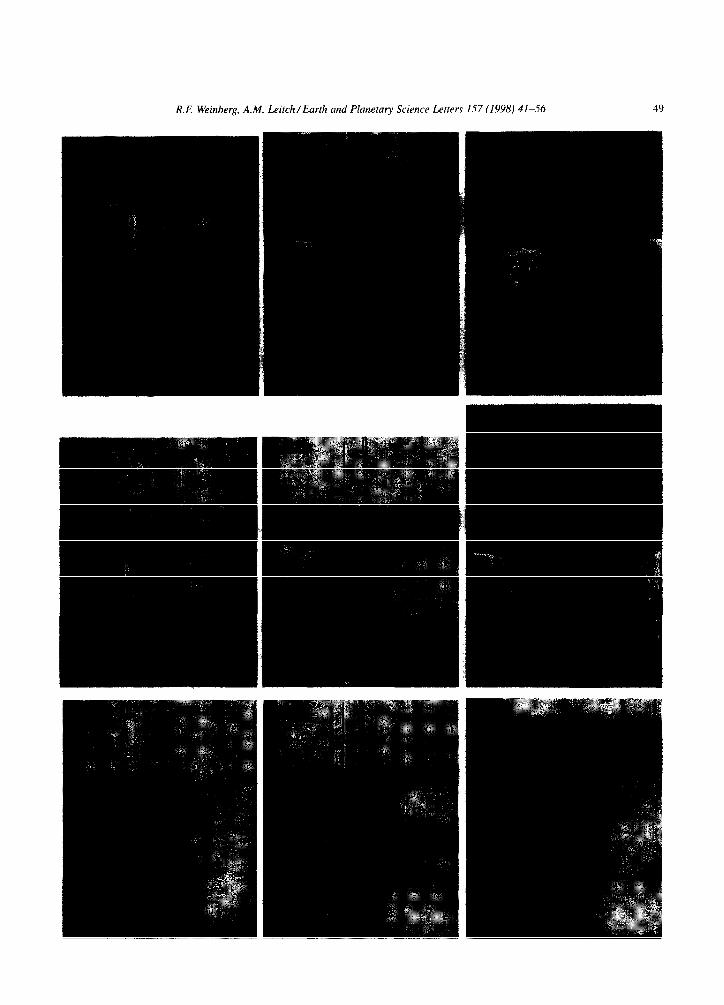
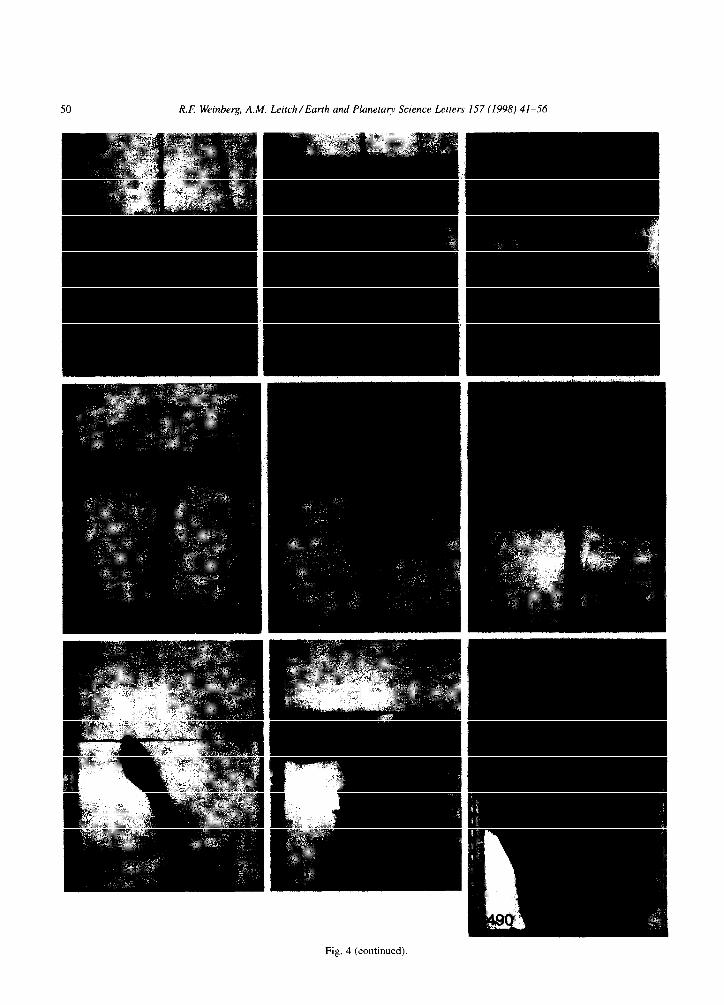
Fig. 4. Snapshots at three different times (time in seconds at lower left) from six selected experiments (experiment number on first
snapshot of each series), showing the markedly different solid structures that result as St and GrRe are varied. (a-d) Increasingly cold
input fluids at low input buoyancy flux. (e-f) Warm and cold input fluids at higher buoyancy flux. (a) Pl3. St = 12.8. GrRe = 242:
al, back lighting; a2, a3, shadowgraph. (b) P14, St = 8.1, GrRe = 207: bl, backlighting; b2. front lighting; b3. shadowgraph. (c) Pl9. St = 3.6. GrRe = 118, front lighting. (d) P15. St = 2.7. GrRe = 117. front lighting. (e) P7, St = 11.8. GrRe = 1300: el, e2, back
lighting: e3, front lighting. (f) PIO, St = 2.7, GrRe = 1525, front lighting.
R.E Weinberg, A.M. Leitch/Earth and Planetary Science Letters 1.57 (1998) 41-56 49
50 RX Weinberg, A.M. Leiich/Eanh and Planetap Science Letters 157 (1998) 41-56
Fig. 4
R.F: Weinberg, A.M. Leitch/Earth and Planetary Science Letters 157 (1998) 41-56 51
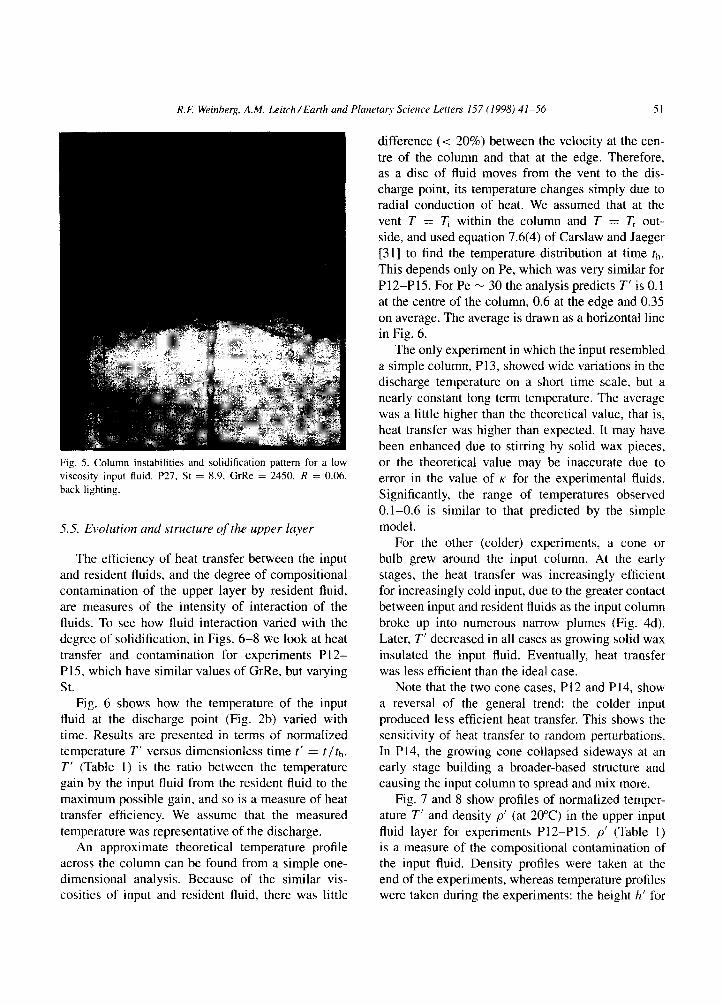
Fig. 5. Column instabilities and solidification pattern for a low
viscosity input fluid. P27, St = 8.9, GrRe = 2450. R = 0.06,
back lighting.
5.5. Evolution and structure of the upper layer
The efficiency of heat transfer between the input
and resident fluids, and the degree of compositional contamination of the upper layer by resident fluid, are measures of the intensity of interaction of the fluids. To see how fluid interaction varied with the
degree of solidification, in Figs. 6-8 we look at heat
transfer and contamination for experiments P12- P15, which have similar values of GrRe, but varying St.
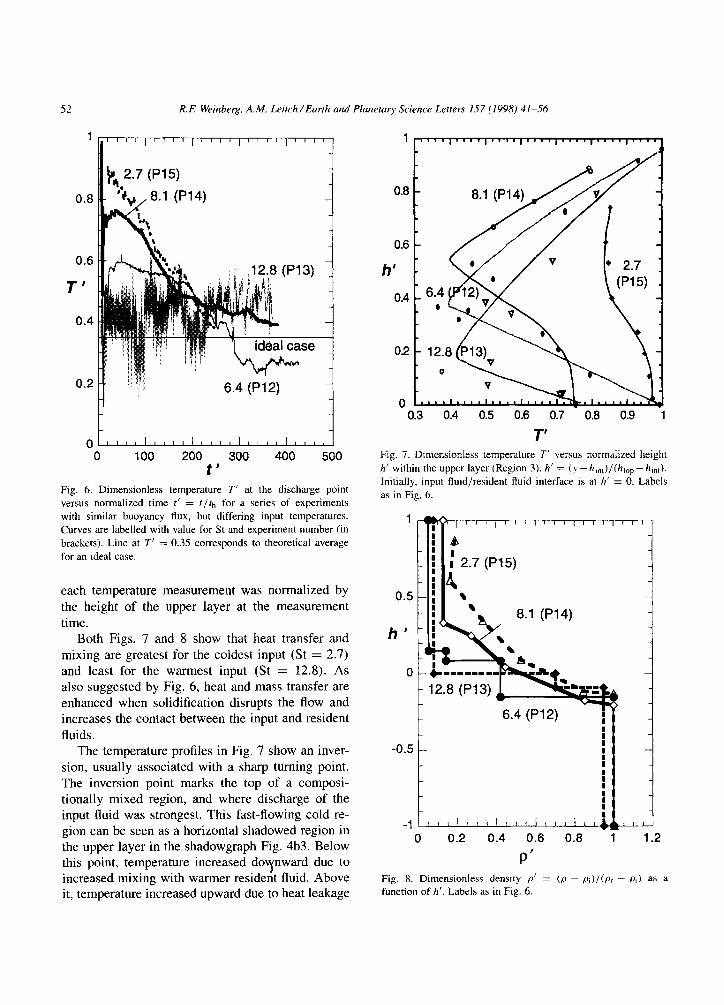
Fig. 6 shows how the temperature of the input fluid at the discharge point (Fig. 2b) varied with time. Results are presented in terms of normalized temperature T’ versus dimensionless time t’ = t/th. T’ (Table 1) is the ratio between the temperature gain by the input fluid from the resident fluid to the
maximum possible gain. and so is a measure of heat transfer efficiency. We assume that the measured
temperature was representative of the discharge. An approximate theoretical temperature profile
across the column can be found from a simple one- dimensional analysis. Because of the similar vis- cosities of input and resident fluid, there was little
difference (< 20%) between the velocity at the cen-
tre of the column and that at the edge. Therefore, as a disc of fluid moves from the vent to the dis- charge point, its temperature changes simply due to radial conduction of heat. We assumed that at the
vent T = T, within the column and T = T, out- side, and used equation 7.6(4) of Carslaw and Jaeger
[31] to find the temperature distribution at time th. This depends only on Pe, which was very similar for P12-P15. For Pe - 30 the analysis predicts T’ is 0.1 at the centre of the column, 0.6 at the edge and 0.35
on average. The average is drawn as a horizontal line in Fig. 6.
The only experiment in which the input resembled
a simple column, P13, showed wide variations in the discharge temperature on a short time scale, but a
nearly constant long term temperature. The average
was a little higher than the theoretical value, that is, heat transfer was higher than expected. It may have been enhanced due to stirring by solid wax pieces,
or the theoretical value may be inaccurate due to error in the value of K for the experimental fluids.
Significantly, the range of temperatures observed 0.1-0.6 is similar to that predicted by the simple model.
For the other (colder) experiments, a cone or bulb grew around the input column. At the early stages, the heat transfer was increasingly efficient for increasingly cold input, due to the greater contact between input and resident fluids as the input column
broke up into numerous narrow plumes (Fig. 4d). Later, T’ decreased in all cases as growing solid wax
insulated the input fluid. Eventually, heat transfer
was less efficient than the ideal case. Note that the two cone cases, PI 2 and P14, show
a reversal of the general trend: the colder input produced less efficient heat transfer. This shows the sensitivity of heat transfer to random perturbations. In P14, the growing cone collapsed sideways at an early stage building a broader-based structure and
causing the input column to spread and mix more. Fig. 7 and 8 show profiles of normalized temper-
ature T’ and density p’ (at 20°C) in the upper input
fluid layer for experiments Pl2-P15. p’ (Table 1) is a measure of the compositional contamination of
the input fluid. Density profiles were taken at the end of the experiments, whereas temperature profiles were taken during the experiments: the height h’ for
52 R.E Weinberg, A.M. hitch/Earth and Planetary Science Letters 157 (1998) 41-56
0.6
T’
0.4
0.2
0 0 100 200 300 400 500
t’
Fig. 6. Dimensionless temperature T’ at the discharge point
versus normalized time t’ = t/tt, for a series of experiments
with similar buoyancy flux, but differing input temperatures.
Curves are labelled with value for St and experiment number (in
brackets). Line at 7” = 0.35 corresponds to theoretical average
for an ideal case.
each temperature measurement was normalized by the height of the upper layer at the measurement
time. Both Figs. 7 and 8 show that heat transfer and
mixing are greatest for the coldest input (St = 2.7) and least for the warmest input (St = 12.8). As also suggested by Fig. 6, heat and mass transfer are enhanced when solidification disrupts the flow and increases the contact between the input and resident
fluids. The temperature profiles in Fig. 7 show an inver-
sion, usually associated with a sharp turning point. The inversion point marks the top of a composi- tionally mixed region, and where discharge of the input fluid was strongest. This fast-flowing cold re- gion can be seen as a horizontal shadowed region in the upper layer in the shadowgraph Fig. 4b3. Below this point, temperature increased doynward due to increased mixing with warmer resident fluid. Above it, temperature increased upward due to heat leakage
0.3 0.4 0.5 0.6 0.7 0.8 0.9 1
T Fig. 7. Dimensionless temperature T’ versus normalized height
h’ within the upper layer (Region 3). h’ = (y - h,,,)/(htop - h,,,). Initially, input fluid/resident fluid interface is at h’ = 0. Labels
as in Fig. 6.
1
0.5
h’
0
12.8 (P13) &
6.4 (P12)
I I I
0 0.2 0.4 0.6 0.8 1 1.2
P’
Fig. 8. Dimensionless density p’ = (p - pi)/(pl - pi) as a
function of h’. Labels as in Fig. 6.

R.F: Weinberg, A.M. Leitch/Earth and Planeta? Science Letters 157 (1998) 41-56 53
from the laboratory and because fluid discharged at
earlier times was warmer (Fig. 6). For the warmest input (St = 12.8), the inversion point is close to the interface, indicating that the compositionally mixed layer is thin. For the other cases inversion occurs
near the centre of the layer suggesting that a large fraction of the input fluid was contaminated.
All of the curves in Fig. 8 show some degree of
contamination of the input fluid by the resident fluid.
Only the ‘convecting cell’ case shows contamination of the resident liquid: this occurred as fluid from the interface was dragged down with solid wax pieces.
5.6. End stages
The evolution of the system after we turned off the
input flux depended on the morphology of the solid.
If the input column was completely encapsulated, we observed melting and dissolution of the solid on a timescale of hours. For cones which were not totally
encapsulated, input fluid within the solid slowly drained into the upper layer. For experiments in the
convecting cell regime, without the dynamic support of the rising input fluid, the dense solid slowly sank, carrying trapped input fluid with it. The trapped fluid was slowly released and mixed as it rose. For a low viscosity input, the solid pieces were smaller and
surrounded with lower viscosity fluid, and so the solid-rich layer sank quickly leaving a broad zone of mixed fluid.
5.7. Overview
Our experimental system may be divided into the four areas of Fig. 2b, with different mixing and mingling processes occurring in each. In region 1, the input column rose, causing solidification which, in turn, disturbed the column on mm to cm scales. The physical barrier of the solid hindered mixing by chemical diffusion, but the multiscale perturbation of
the laminar flow led to physical mingling and mixing
of the fluids. When the column itself was unstable (in the absence of solidification), its fluctuations led
to increased mixing and mingling. We observed a systematic change in solid structure reflecting where solidification first occurred: at the interface, produc- ing pieces circulating within the wax layer; near the top of the column, leading to a crumpled cone
growing downwards; or near the vent, producing an
intricate maze of vertical sheets and tubes. Fluids and solid particles from region 1 fed into
the upper layer, region 3. The nature of fluid dis- charged into region 3 changed with time, generally becoming colder and less contaminated as the in-
put became thermally and chemically insulated from the resident fluid by encapsulating solid. Denser,
warmer mixed fluids spread at the interface, while
less contaminated input fluid was expelled higher in the layer.
Region 2 (the resident layer) convected upwards in the centre due to viscous coupling with the rising
input fluid. If the column became encapsulated, ther- mal buoyancy drove convection down at the centre. Solid pieces originating at the interface might sink
and modify the convection, and particularly when a
mixed layer existed at the interface, input fluid might be dragged into the resident layer attached to these solid pieces. Plumes of incompletely mixed input
fluid might then rise slowly back to the interface.
Region 4, the interface, was nearly always char- acterized by a mixed layer which originated mainly from mixing during the rise of the input fluid in re-
gion 1 and from the dissolution of solid carried into the upper layer. This last effect was observed in all experiments and became increasingly important the longer the experiment progressed. Particularly for the tank with the large surface area, solidification of
the resident fluid from above was an important pro-
cess. In relatively wide, shallow systems we might
expect it to be the dominant process, especially once region 1 is encapsulated by solid.
6. Discussion
In relating our results to magmatic systems, we must identify the range of values taken by the con- trolling dimensionless numbers in natural systems,
and also consider the influence of additional factors
not modelled in our experimental system. Complex- ities in geometry, rheology and flow history fall into this latter category.
In Table 1, we have assembled representative ranges for the physical variables in magmatic sys- tems. The most uncertain of these is the input flow rate, Q. Rates between lop4 and 1 kn-?/yr (3x lo-‘-
54 R.E Weinberg, A.M. bitch/Earth and Planeta? Science Letters 157 (1998) 41-56
30 m3/s) are probably reasonable in the long term (tens to thousands of years), but may not reflect typ- ical conditions of a single inflow event (F. Spera,
personal communication). Assuming that the felsic magma rises from its source region in a dyke, and
that dykes pinch off into columns which focus flow
from between 3 and 30 dyke widths, from the analy- sis of Petford et al. [32] we find flow Q for a magma pulse in the range lo-‘-lo2 m”/s.
Due to the variability in h, r and Q in natural systems, the values of GrRe, St and R in Table 2
span a vast range, extending far beyond that of our experiments. To match the values of R in our
experiments, the viscosities of input and resident magmas would be 103-lo4 Pa s. To match GrRe, we
require very high Q into a small system (h - 10 m)
or very low Q into a large system (h - 1000 m).
6.1. Magma properties
In nature, the viscosity of felsic magmas is usu- ally larger than that of basic magmas. However, in
our experiments, the viscosity ratio R of input to resident fluids was around unity or much less. The viscosity ratio is important in determining the type
of instabilities which form at the interface of two fluids which, in turn, has a bearing on the mixing
[12]. Therefore, as far as mixing is concerned, R is not important when the inflow is laminar, as it
was in the beginning of most of our experiments, or when fluid-fluid contact is prevented, as it was at later times when frozen wax encased the input. We reduced R in experiments P24-P28 to investigate the effect of column instabilities (which might occur at higher buoyancy flux) on solidification and mixing.
An important difference between experiments and
nature is that PEG wax solidifies over a small tem-
perature range (OS-l”C), whereas magmas crystal- lize over a range of 100°C or more. As the melt
fraction in magmas decreases, they become increas- ingly viscous, until a critical melt fraction (CMF,
[33]) is reached, generally at 30-45% melt, where viscosity increases sharply. For melt fractions below the CMF, the magma will behave essentially as a solid. Thus, for natural systems, it may be appropri- ate to consider the solidification temperature to be the temperature at the CMF and to use a reduced value of latent heat. If cooling were fast enough,
the solid created could be a glass and very little la- tent heat would be involved. However, crystallization rates are so fast in mafic magmas [34] that this is
very unlikely to happen. An important parameter that we have been unable
to explore is the strength of the solid relative to the
pressure of the intruding magma. This has bearing on how readily the inflow can break the solid structure. For a weak solid, such structures as cylinders and
bulbs would be disrupted before they could prop- erly form. A solid strength parameter will generate another dimension in our parameter field of Fig. 3.
6.2. Magma chambers
Magma chambers occur in a variety of shapes
and sizes, some rather dissimilar to our experimental tank. The main region of fluid interaction is between the vent and discharge point over the scale of the
resident layer depth, h. This scale also controls the size of the convection cell in the resident fluid and the size of the main region of mixing. Therefore, we would expect most hybridisation, as a percentage of the total volume, when the magma chamber is not
too wide compared to its depth. We do not expect the horizontal dimensions of flat magma chambers to have direct importance in the formation of min-
gled structures; however, they will have bearing on whether mingled structures survive. In the experi-
ments of Huppert et al. [12], mixing of the resident
fluid continues as long as the input lasts. By contrast, in our cold experiments, fluid interaction is limited
by encapsulation of the input fluid, and the encapsu- lation time rather than the inflow time, controls the extent of mixing.
6.3. Preservation of mingling and mixing structures
If the mingling and mixing structures formed dur- ing the experiments were to be found in the geolog- ical record they would provide important constraints on the physical conditions during intrusion of the felsic magma. Since it is difficult to unmix magmas, we would expect to find evidence of mixing, per- haps overprinted by subsequent processes. Mingled structures are harder to preserve. When one or both mingled components are liquid, it is always possible to unmingle them before they solidify and are pre-
R.F: Weinberg, A.M. Lritch/Earth and Planetap Science Letters 157 (1998) 41-56 55
served as rocks. Observations of the late stages of
our experiments show several ways in which this can occur once input has ceased.
First, the input fluid trapped within the solid will slowly escape upwards and join the overlying layer.
Second, the solid mass may be partly or totally reabsorbed by the warmer surrounding liquid. If the chamber was much wider than the layer depth, then there may be heat available to completely remelt
the newly formed solid. Depending on how this occurred, the remelted resident fluid could disengage
from the trapped input with minimal interaction, and the result may then be a mixed region only. Third, the solid mass may become unstable and fall to the bottom of the chamber. Fourth, in nature, the
solid mass may contain up to 40% interstitial melt,
which may crystallize slowly after the replenishment
process is over and erase evidence of its initial rapid cooling. Thus, evidence of the intrusion of
felsic magma into a mafic chamber may only be the presence of hybrid rocks defining a typical mixing geochemical trend, associated with the presence of mafic enclaves in the felsic end-members. These features are ambiguous inasmuch as they could result
from a variety of different igneous processes.
7. Conclusions
We carried out experiments simulating the intru-
sion of cold, low density felsic magma into a mafic magma chamber, and found that solidification of
the model mafic magma introduced perturbations on many scales to an otherwise monotonous rising col- umn of model felsic magma, considerably enhancing magma hybridisation (mingling and mixing). Dif- ferent degrees and styles of mixing and mingling were identified based on the controlling dimension-
less parameters St, GrRe and R, which measure the undercooling, buoyancy flux and viscosity ratio of the input.
The experiments could be divided into four groups based on the morphology of the solid mass which grew around the input column. As the input became colder, the solid wax developed from circu- lating pieces within a convection cell, to a crumpled cone growing down from the discharge point, to a cylinder around the input column, to an onion-bulb
above the vent. These transformations were based on
how much solidification could take place in the time the input fluid crossed the layer, which was con- trolled mainly by the Stefan number, St. Generally, colder inputs resulted in more hybridization because
a greater amount of solidification caused more in- tense disruption of the inflow. As the dimensionless
buoyancy flux GrRe increased, the input drove more vigorous convection and was better able to break
the solid structure. For a lower viscosity ratio R, the input column became unstable and small solid
fragments formed within contortions of the column. Natural geological systems cover a parameter
range much greater than that of the experiments
and they include processes such as the formation of individual crystals within a liquidus-solidus interval
that we were unable to model in our experiments.
Thus our experiments may reveal only a subset of a wealth of mixing processes which occur when felsic
and mafic magmas interact in this geometry.
Acknowledgements
We would like to thank Ross Kerr and Ross Griffiths for enlightening discussions on magmatic
processes, Frank Spera and Kathy Cashman for advice on magmatic flow and crystallization rates,
and Stewart Turner for recommendations on dealing
with anomalies. We also thank Natalie Thomas for help with the experiments, and Tony Beasley and Derek Corrigan for their excellent technical assis-
tance. [RO]
References
R. Bateman, The interplay between crystallization, replen-
ishment and hybridization in large felsic magma chambers,
Earth-&i. Rev. 39 ( 1995) 9 1 - 106.
R.F. Weinberg, The disruption of a diorite magma pool by
intruding granite: the Sobu body. Ladakh Batholith, Indian
Himalayas, J. Geol. 105 (1997) 87-98.
P.C. Bateman, A summary of critical relations in the central
part of the Sierra Nevada batholith. California, U.S.A..
Geol. Sot. Am. Mem. 159 (1983) 241-254.
W.S. Pitcher. M.P. Atherton, E.J. Cobbing, R.D. Beckinsale,
Magmatism at a Plate Edge - The Peruvian Andes. Blackie
and Sons, London. 1985.
R.A. Wiebe, T. Wild, Fractional crystallization and
56 R.E Weinberg. A.M. Leitch/Earth and Planetar) Science Letters 157 (1998) 41-56
magma mixing in the Tigalak layered intrusion, the Nain
anorthosite complex, Labrador, Contrib. Mineral. Petrol. 84
(I 983) 327-344.
[6] R.A. Wiebe, Rupture and inflation of a basic magma cham-
ber by silicic liquid, Nature 326 (1987) 69-7 1.
[7] R. Wiebe, Comingling of contrasted magmas and genera-
tion of mafic enclaves in granitic rocks, in: J. Didier, B.
Barbarin (Ed.), Enclaves and Granite Petrology, Vol. 13,
Elsevier, Amsterdam, 199 I, pp. 393-402.
[8] D. Vielzeuf, J.R. Holloway, Experimental determination of
the fluid-absent melting relations in the pellitic system.
Contrib. Mineral. Petrol. 98 (1988) 257-276.
[9] H.E. Huppert, R.S.J. Sparks, J.S. Turner, Effects of volatiles
on mixing in talc-alkaline magma systems, Nature 297
(1982) 554-557.
[IO] H.E. Huppert. R.S.J. Sparks, J.S. Turner. Some effects of
viscosity on the dynamics of replenished magma chambers,
J. Geophys. Res. 89 (1984) 6857-6877.
[I I] I.H. Campbell, J.S. Turner, Turbulent mixing between fluids
with different viscosities, Nature 3 13 (1985) 39-42.
[12] H.E. Huppert, R.S.J. Sparks, J.A. Whitehead, M.A. Hall-
worth, Replenishment of magma chambers by light inputs,
I. Geophys. Res. 91 (1986) 6113-6122.
[ 131 I.H. Campbell, J.S. Turner, A laboratory investigation of
assimilation at the top of a basaltic magma chamber. J.
Geol. 95 (1987) 155-172.
[ 141 I.H. Campbell, J.S. Turner, Fountains in magma chambers.
J. Petrol. 30 (1989) 885-923.
[15] D. Snyder, S. Tait, Replenishment of magma chambers:
comparison of fluid-mechanic experiments with field rela-
tions, Co&b. Mineral. Petrol. 122 (1995) 230-240.
[ 161 R.S.J. Sparks, L.A. Marshall, Thermal and mechanical con-
straints on mixing between mafic and silicic magmas, J.
Volcanol. Geothenn. Res. 29 (1986) 99-124.
[ 171 T.P. Frost, G.A. Mahood, Field, chemical, and physical con-
straints on mafic-felsic magma interaction in the Lamarck
Granodiorite. Sierra Nevada, California. Geol. Sot. Am.
Bull. 99 (1987) 272-291.
1181 RI. Hill, San Jacinto Intrusive Complex 1. Geology and
mineral chemistry, and a model for intermittent recharge
of tonalitic magma chambers, J. Geophys. Res. 93 (1988)
10325-10348.
[19] S. Blake, I.H. Campbell, The dynamics of magma-mixing
during flow in volcanic conduits, Contrib. Mineral. Petrol.
94 ( 1986) 72-8 1. [20] A. Freundt, S.R. Tait, The entrainment of high-viscosity
magma into low-viscosity magma in eruption conduit, Bull.
Volcanol. 48 (1986) 325-339.
[21] J.C. Eichelberger, Vesiculation of a mafic magma during re-
plenishment of silicic magma reservoirs, Nature 288 (1980)
450-466.
[22] H.E. Huppert, R.S.J. Sparks, The generation of granitic
melts by intrusion of basalt into continental crust, J. Petrol.
29 ( 1988) 599-624.
[23] R. Wlebe, Relations between coexisting basaltic and
granitic magmas in a composite dike, Am. J. Sci. 273
(1973) 130-151.
[24] T. Furman, F.J. Spera, Co-mingling of acid and basic
magma with implications for the origin of mafic I-type
xenoliths: field and petrochemical relations of an unusual
dike complex at Eagle Lake, Sequoia National Park, Cali-
fornia, USA, J. Volcanol. Geoth. Res. 24 (1985) 151-178.
12.51 C.G. Barnes, CM. Allen, J.B. Saleeby, Open- and closed-
system characteristics of a tilted plutonic system, Klamath
Mountains, California, J. Geophys. Res. 91 (1986) 6073-
6090.
[26] T. Koyaguchi, Magma mixing in a conduit, J. Volcanol.
Geoth. Res. 25 (1985) 365-369.
[27] R.F. Weinberg, Internal circulation in a buoyant two-fluid
Newtonian sphere: implications for composed magmatic
diapirs, Earth Planet. Sci. Lett. 110 (1992) 77-94.
[28] J.H. Fink, R.W. Griffiths, Radial spreading of viscous-
gravity currents with solidifying crust, J. Fluid Mech. 221
(1990) 485-509.
[29] R.C. Kerr, Melting driven by vigorous compositional con-
vection, J. Fluid Mech. 280 (I 994) 255-285.
[30] C.S. Miner, N.N. Dalton, Glycerol, Reinhold, New York.
1953,460 pp.
[31] H.S. Carslaw, J.C. Jaeger, Conduction of Heat in Solids,
Clarendon Press, Oxford, 1986,5 10 pp.
[32] N. Petford, R.C. Kerr, J.R. Lister, Dike transport of grani-
toid magmas, Geology 2 1 (1993) 845-848.
[33] A.A. Arzi, Critical phenomena in the rheology of partially
melted rocks, Tectonophysics (1978) 173-184.
[34] K.V. Cashman, Relationship between plagioclase crystal-
lization and cooling rate in basaltic melts, Contrib. Mineral.
Petrol. 113 (1978) 126-142.