Minerals & Metals Presented by: Albert Chou Davis (Jinqiu) Wei Mike Bergmann Xin Lu.
170
Minerals & Metals Minerals & Metals Presented by: Presented by: Albert Chou Albert Chou Davis (Jinqiu) Wei Davis (Jinqiu) Wei Mike Bergmann Mike Bergmann Xin Lu Xin Lu
-
Upload
briana-mccarthy -
Category
Documents
-
view
214 -
download
0
Transcript of Minerals & Metals Presented by: Albert Chou Davis (Jinqiu) Wei Mike Bergmann Xin Lu.
Minerals & MetalsMinerals & Metals
Presented by:Presented by:
Albert ChouAlbert Chou
Davis (Jinqiu) WeiDavis (Jinqiu) Wei
Mike BergmannMike Bergmann
Xin LuXin Lu
Copper Mining IndustryCopper Mining Industry
Overall IntroductionOverall Introduction Product UseProduct Use Production ProcessProduction Process Structure of IndustryStructure of Industry Financial StructureFinancial Structure Risk AssessmentRisk Assessment Recommended StrategyRecommended Strategy

Overall Introduction-1Overall Introduction-1
Oldest metal known to humansOldest metal known to humans Infinite recyclable lifeInfinite recyclable life 33rdrd most widely used metal most widely used metal Sensitive to political situationSensitive to political situation Producers store copper in Producers store copper in
warehouses until it is sold and warehouses until it is sold and shipped to buyershipped to buyer
Overall Introduction-2Overall Introduction-2
Known resource 5.8 trillion poundsKnown resource 5.8 trillion pounds
Only 0.7 trillion pounds (12%) are Only 0.7 trillion pounds (12%) are minedmined
Also essential to human healthAlso essential to human health

ProductsProducts
SourcesSources OreOre ScrapsScraps
FormsForms RodsRods CathodesCathodes ConcentrateConcentrate
ProductsProducts
WiresWires SubstitutionSubstitution
Fiber OpticsFiber Optics
Pipes/TubesPipes/Tubes SubstitutionSubstitution
SteelSteel PlasticsPlastics AluminumAluminum
Copper UseCopper Use
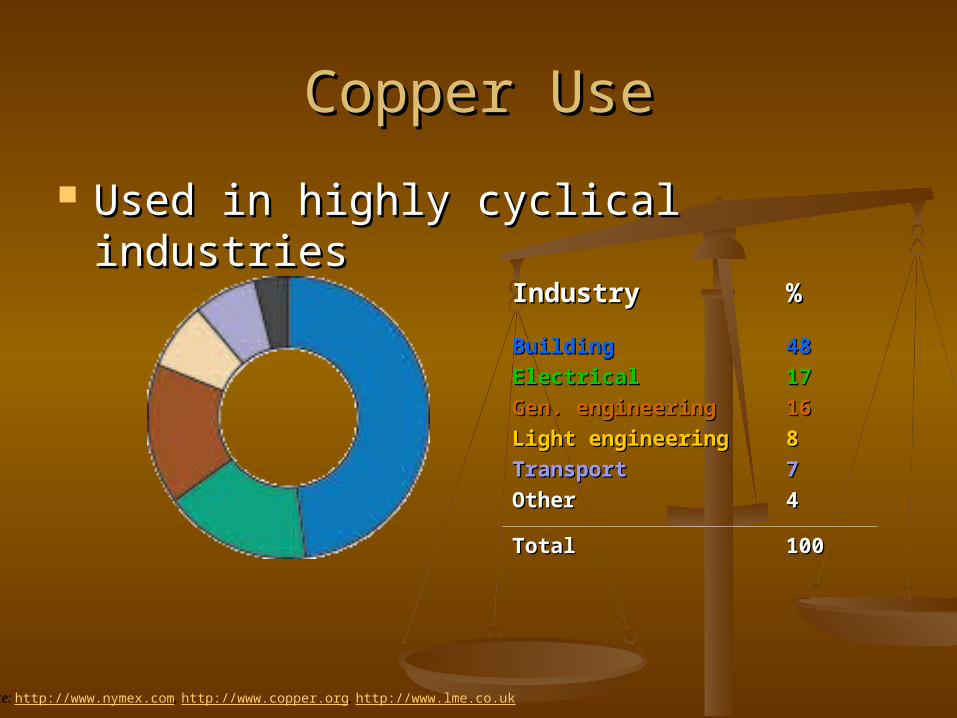
Used in highly cyclical industriesUsed in highly cyclical industries
Source: http://www.nymex.com, http://www.copper.org, http://www.lme.co.uk
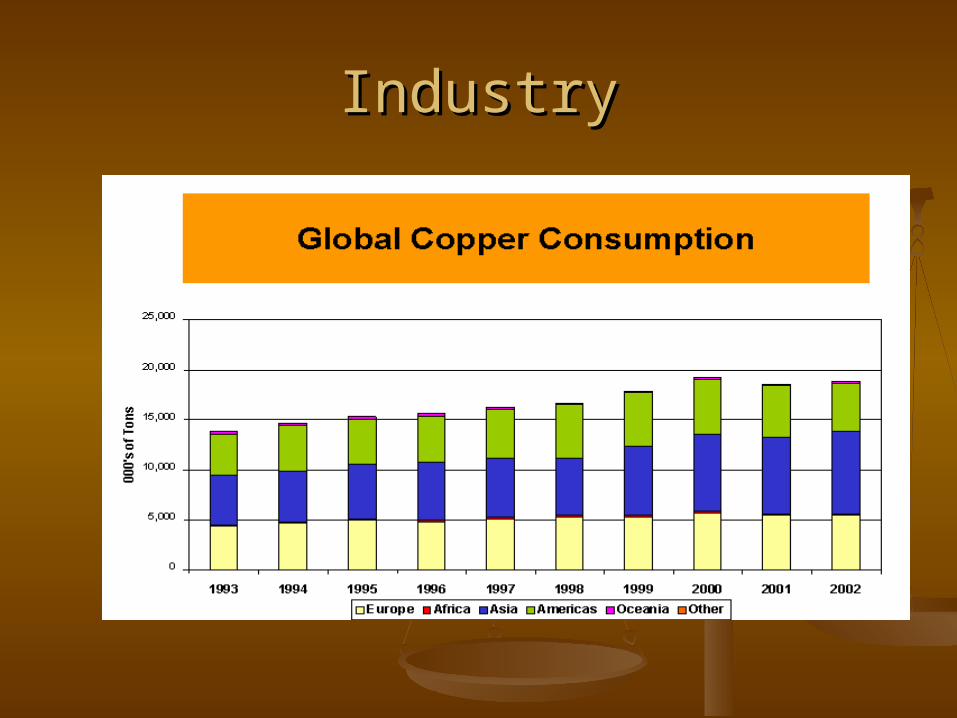
IndustryIndustry
BuildingBuilding
ElectricalElectrical
Gen. engineeringGen. engineering
Light engineeringLight engineering
TransportTransport
OtherOther
%%
4848
1717
1616
88
77
44
TotalTotal 100100
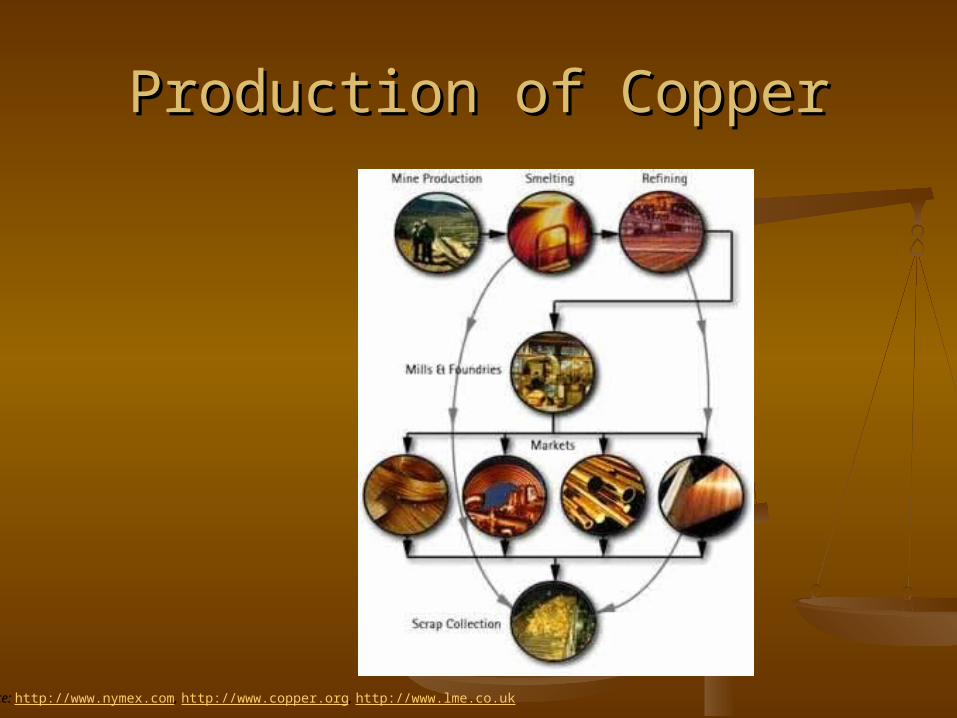
Production of CopperProduction of Copper
Source: http://www.nymex.com, http://www.copper.org, http://www.lme.co.uk
IndustryIndustry
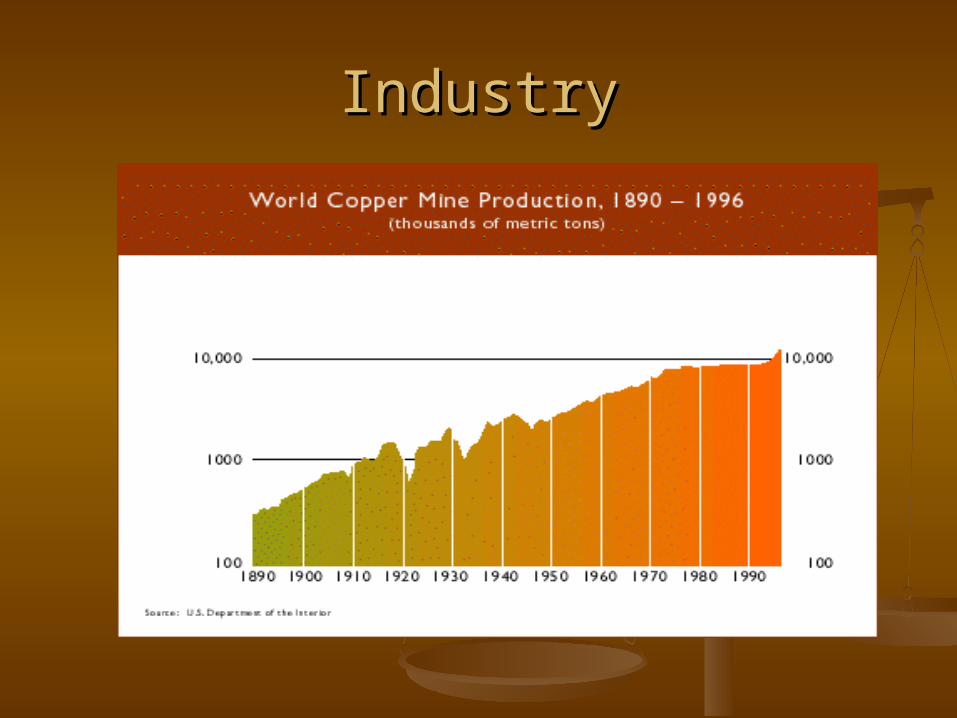
IndustryIndustry
RivalsRivals
77 firms internationally competing77 firms internationally competing
Compete on price/low cost Compete on price/low cost productionproduction
Product QualityProduct Quality
Customer ServiceCustomer Service
Key Success FactorsKey Success Factors
Economies of ScaleEconomies of Scale
Refining technologiesRefining technologies
LocationLocation

Cost StructureCost Structure
Research and DevelopmentResearch and Development
ExplorationExploration
TransportationTransportation
StorageStorage
Cost StructureCost Structure
General Operation CostGeneral Operation Cost
Sales and AdministrativeSales and Administrative
Interest expensesInterest expenses
Depreciation, Depletion and Depreciation, Depletion and AmortizationAmortization
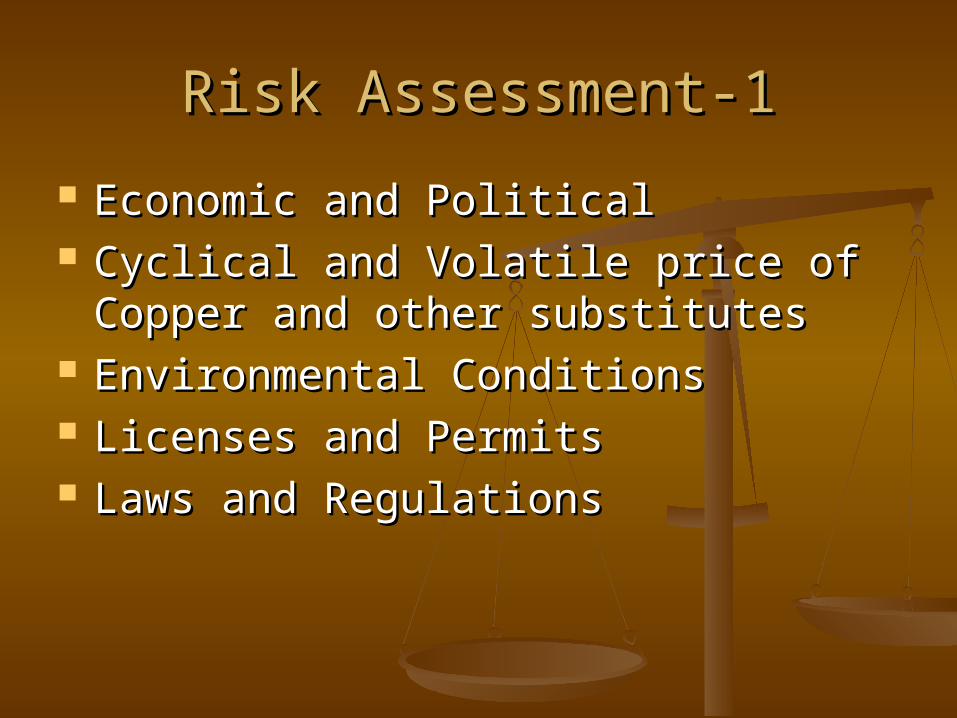
Risk Assessment-1Risk Assessment-1
Economic and PoliticalEconomic and Political Cyclical and Volatile price of Copper Cyclical and Volatile price of Copper
and other substitutesand other substitutes Environmental ConditionsEnvironmental Conditions Licenses and PermitsLicenses and Permits Laws and RegulationsLaws and Regulations
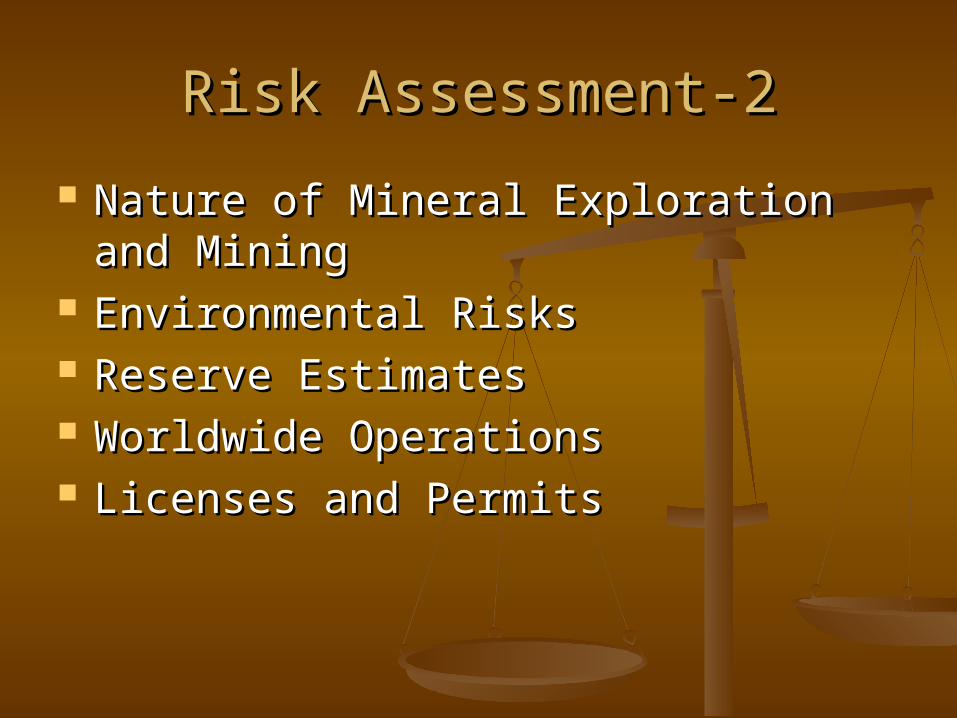
Risk Assessment-2Risk Assessment-2
Nature of Mineral Exploration and Nature of Mineral Exploration and MiningMining
Environmental RisksEnvironmental Risks Reserve EstimatesReserve Estimates Worldwide OperationsWorldwide Operations Licenses and PermitsLicenses and Permits
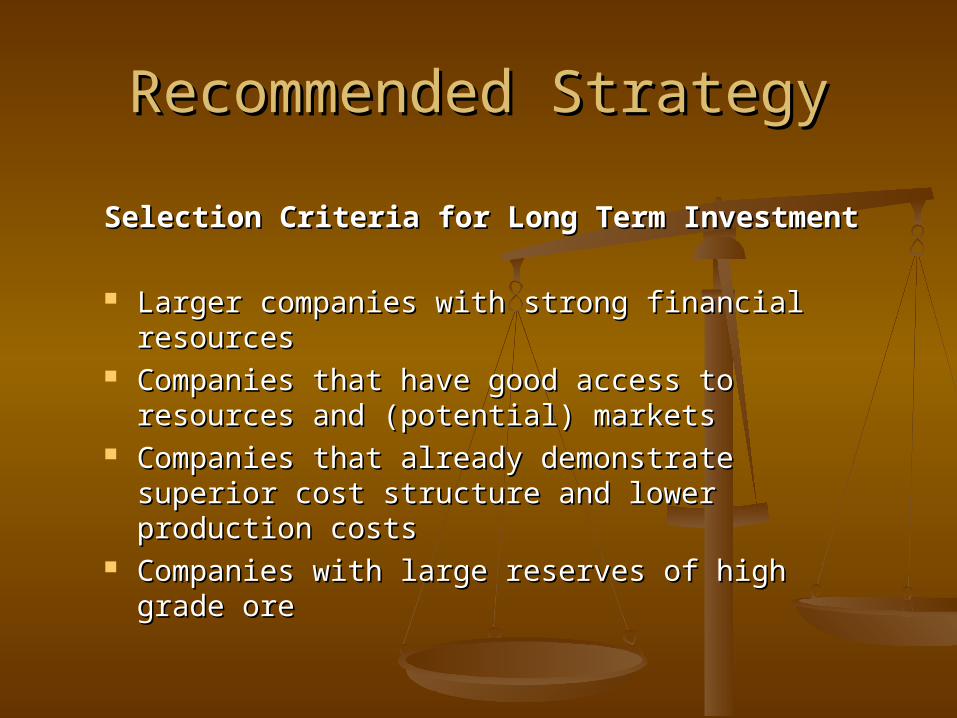
Recommended StrategyRecommended Strategy
Selection Criteria for Long Term InvestmentSelection Criteria for Long Term Investment
Larger companies with strong financial Larger companies with strong financial resourcesresources
Companies that have good access to resources Companies that have good access to resources and (potential) marketsand (potential) markets
Companies that already demonstrate superior Companies that already demonstrate superior cost structure and lower production costscost structure and lower production costs
Companies with large reserves of high grade Companies with large reserves of high grade oreore
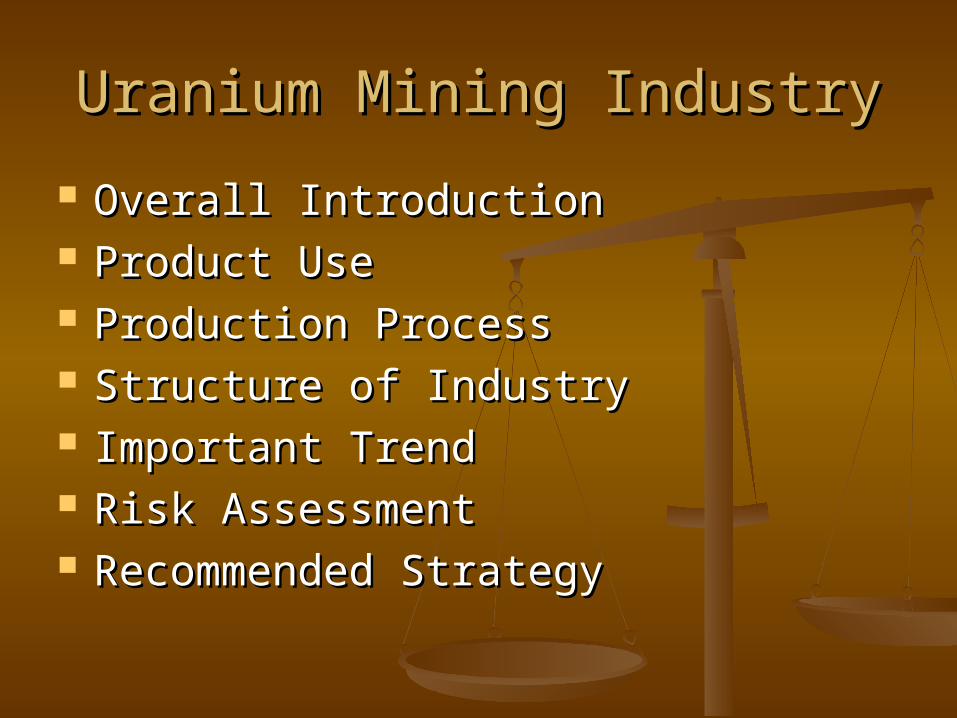
Uranium Mining IndustryUranium Mining Industry
Overall IntroductionOverall Introduction Product UseProduct Use Production ProcessProduction Process Structure of IndustryStructure of Industry Important TrendImportant Trend Risk AssessmentRisk Assessment Recommended StrategyRecommended Strategy
Overall IntroductionOverall Introduction
15% of Canada's electricity comes 15% of Canada's electricity comes from nuclear powerfrom nuclear power
Increasing demand for nuclear fuelIncreasing demand for nuclear fuel Uranium is most commonly found in Uranium is most commonly found in
nature as an oxide, and usually as an nature as an oxide, and usually as an ore in a chemically complex bodyore in a chemically complex body
A significant amount can be found in A significant amount can be found in the oceans of the world the oceans of the world
Overall IntroductionOverall Introduction Uranium (U):Uranium (U): A mildly radioactive element with A mildly radioactive element with
two isotopes which are fissile (U-235 and U-233) two isotopes which are fissile (U-235 and U-233) and two which are fertile (U-238 and U-234). and two which are fertile (U-238 and U-234). Uranium is the basic fuel of nuclear energy. Uranium is the basic fuel of nuclear energy.
Uranium hexafluoride (UFUranium hexafluoride (UF66): ): A compound of A compound of uranium which is a gas above 56oC and is thus a uranium which is a gas above 56oC and is thus a suitable form in which to enrich the uranium. suitable form in which to enrich the uranium.
Uranium oxide concentrate (UUranium oxide concentrate (U33OO88): ): The The mixture of uranium oxides produced after milling mixture of uranium oxides produced after milling uranium ore from a mine. Sometimes loosely uranium ore from a mine. Sometimes loosely called yellowcake. It is khaki in colour and is called yellowcake. It is khaki in colour and is usually represented by the empirical formula usually represented by the empirical formula U3O8. Uranium is sold in this form. U3O8. Uranium is sold in this form.
ProductProduct ApplicationApplication
Providing electricityProviding electricity Producing medical isotopesProducing medical isotopes Using it as a weapon & armour (depleted Using it as a weapon & armour (depleted
uranium)uranium) Co-productCo-product
a co-product with copper (at Olympic a co-product with copper (at Olympic Dam in Australia)Dam in Australia)
a by-product from the treatment of other a by-product from the treatment of other ores, such as the gold-bearing ores of ores, such as the gold-bearing ores of South Africa (low concentration of South Africa (low concentration of uranium) uranium)
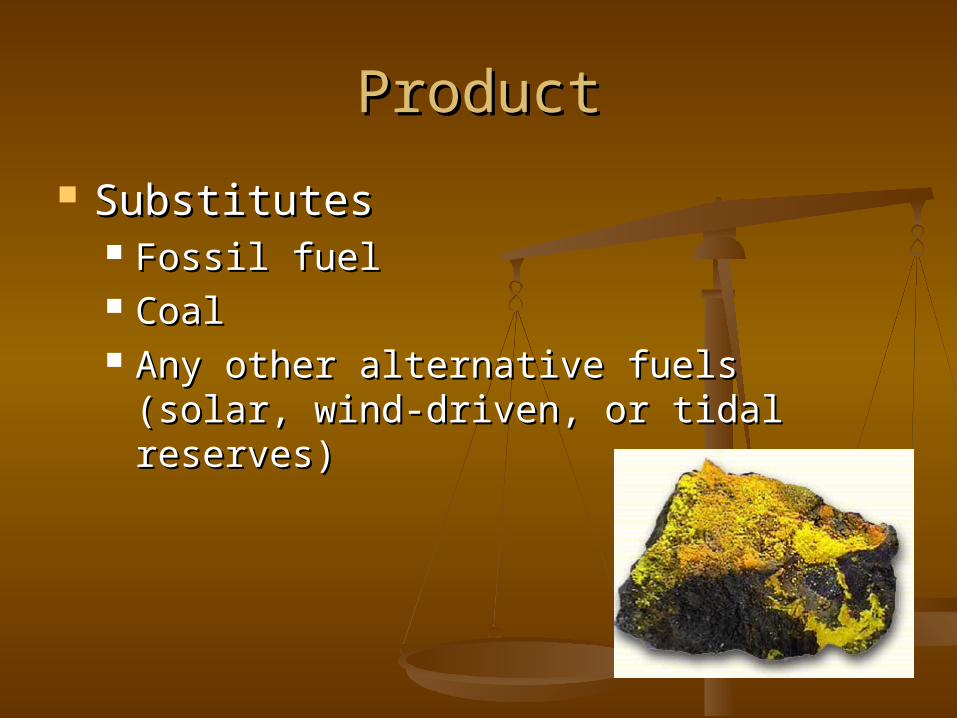
ProductProduct
SubstitutesSubstitutes Fossil fuel Fossil fuel CoalCoal Any other alternative fuels (solar, wind-Any other alternative fuels (solar, wind-
driven, or tidal reserves)driven, or tidal reserves)
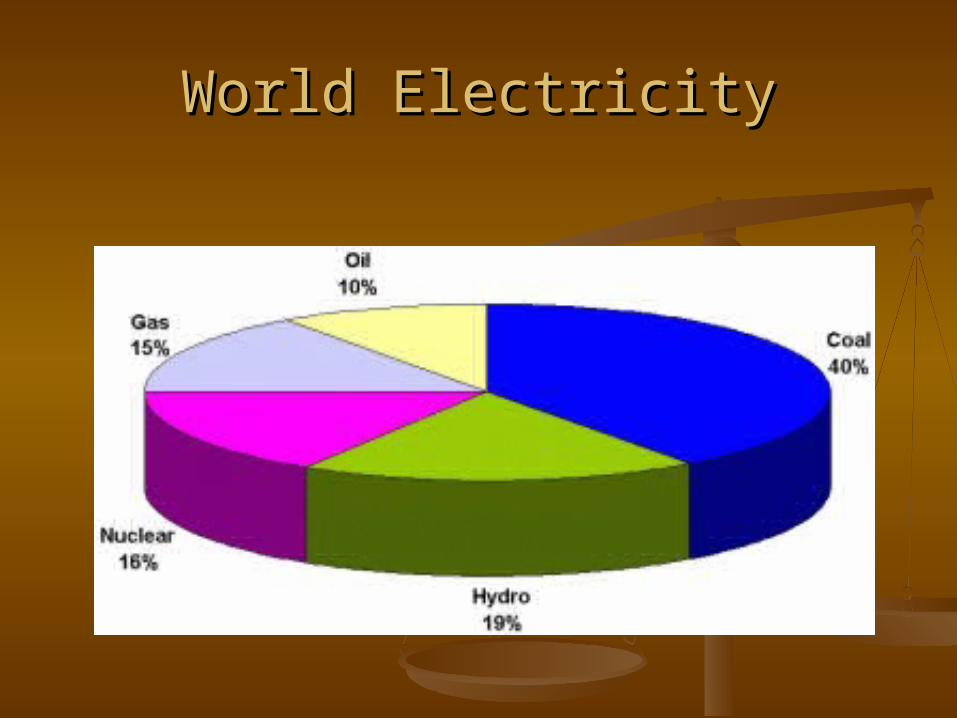
World ElectricityWorld Electricity
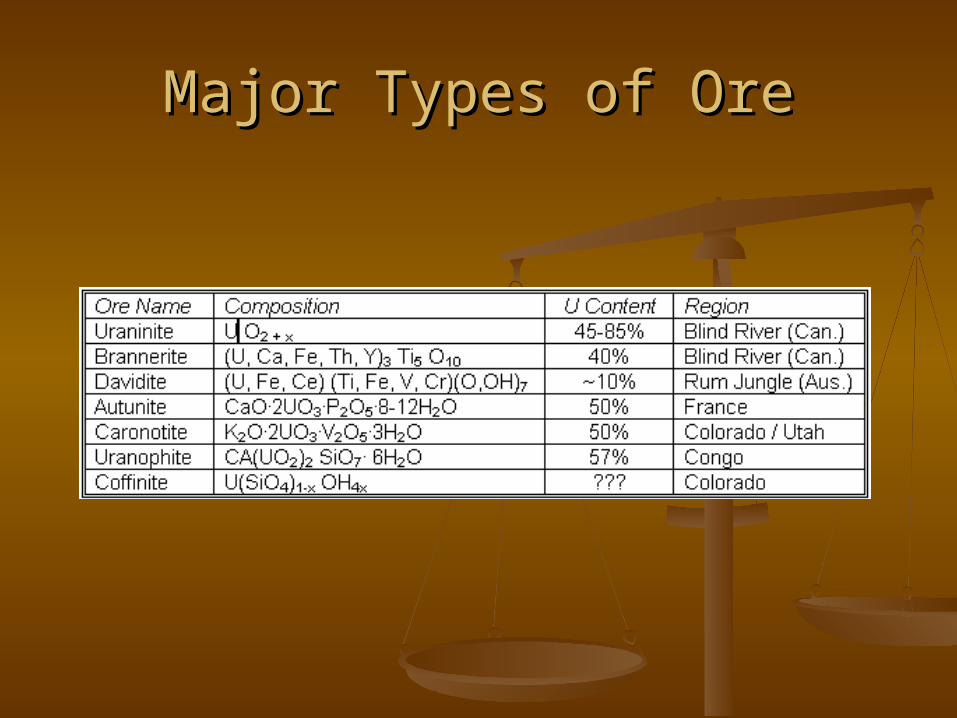
Major Types of OreMajor Types of Ore
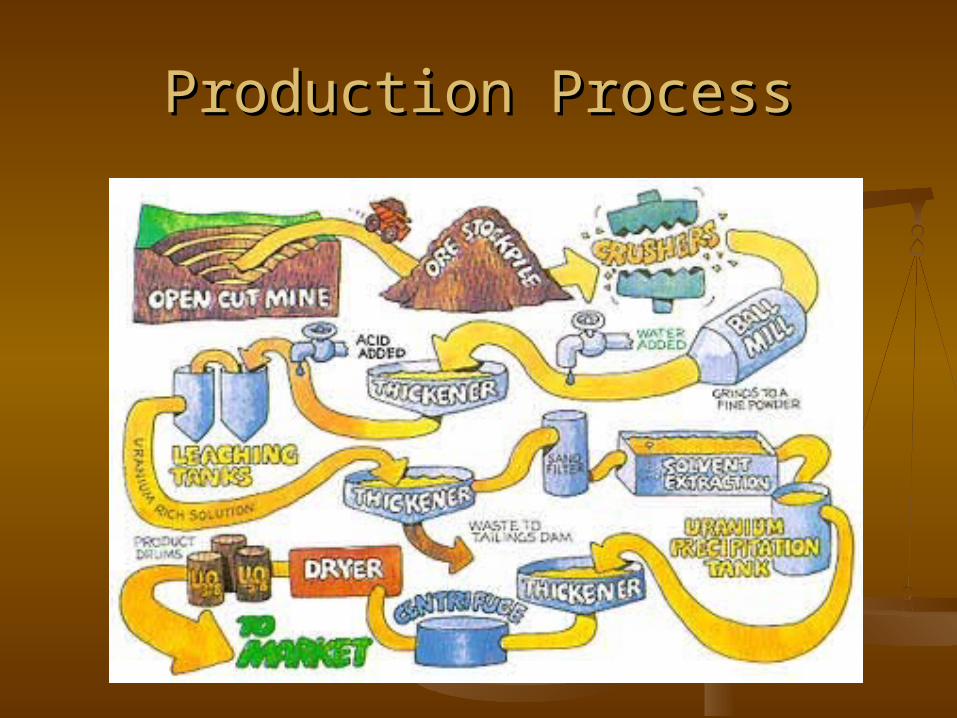
Production ProcessProduction Process
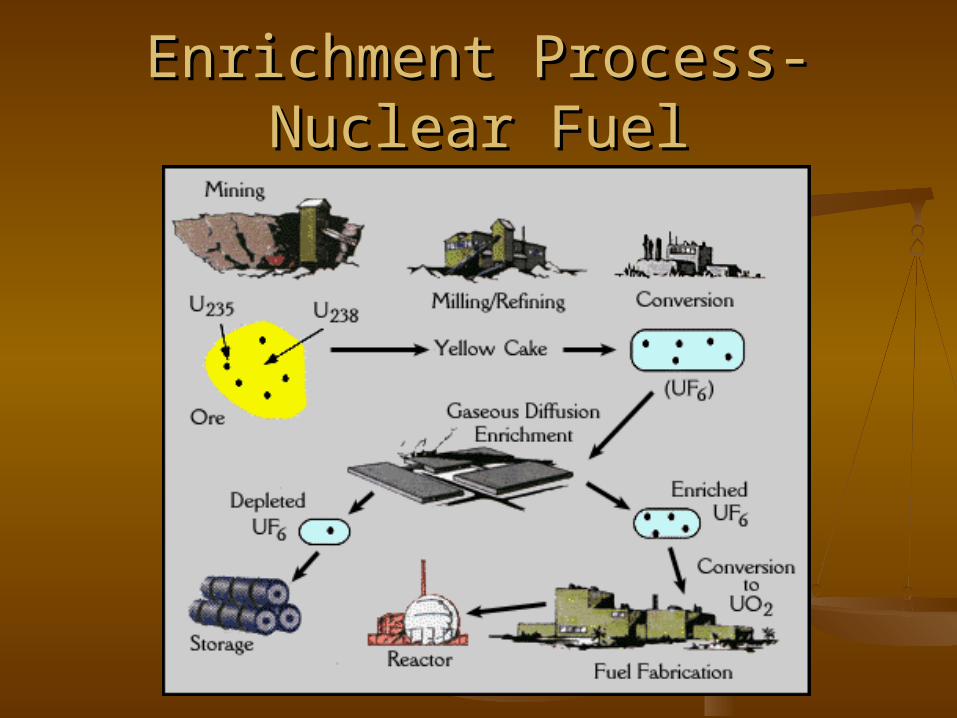
Enrichment Process-Nuclear Enrichment Process-Nuclear FuelFuel

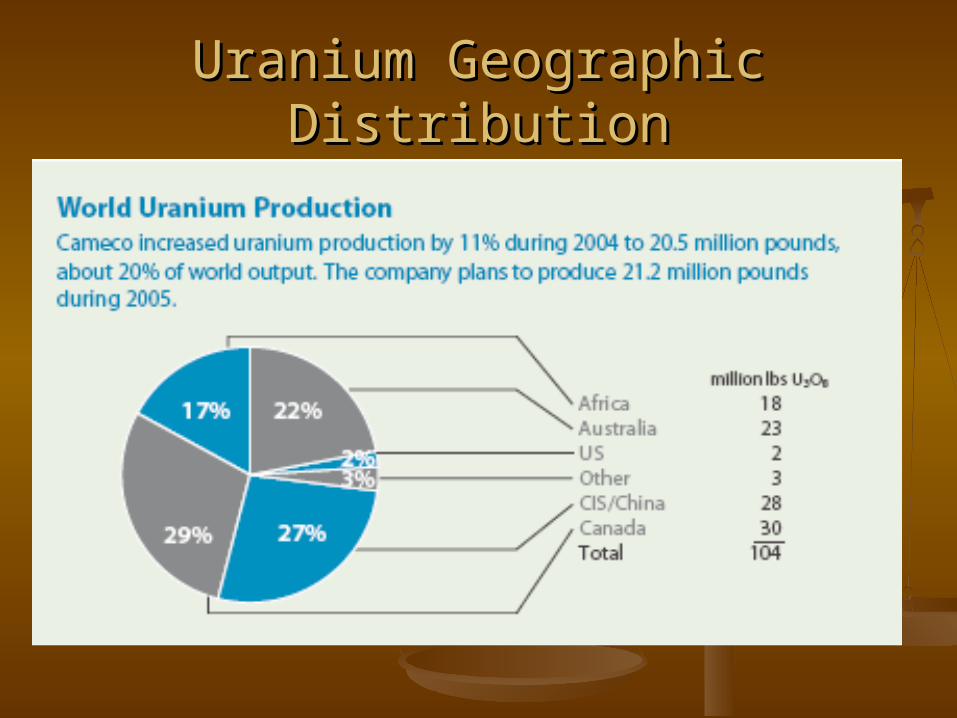
Uranium Geographic DistributionUranium Geographic Distribution
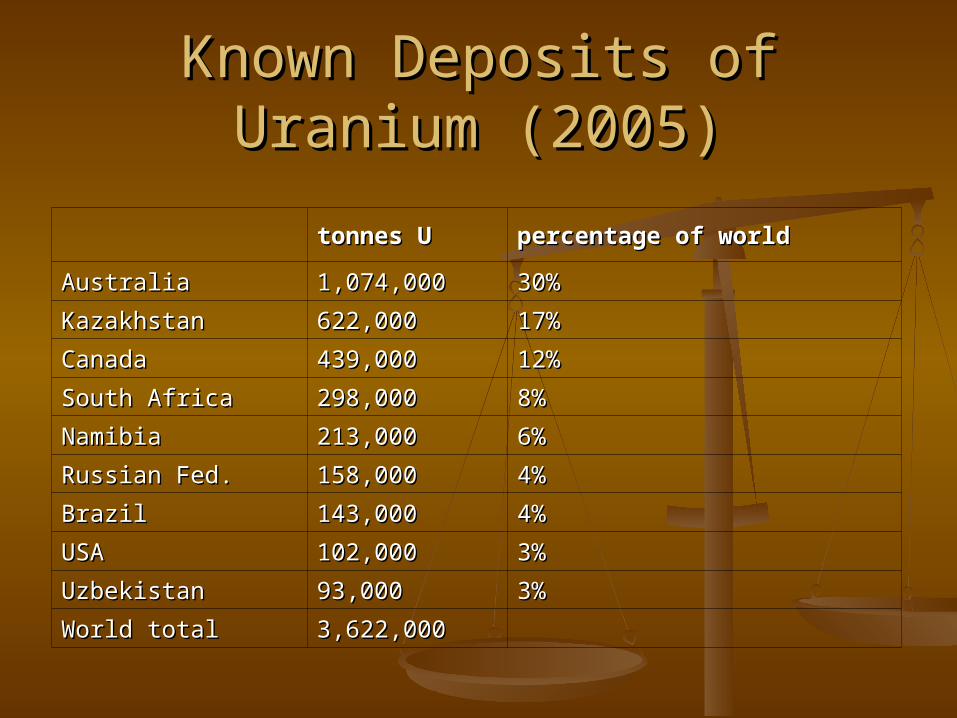
Known Deposits of Uranium Known Deposits of Uranium (2005)(2005)
tonnes Utonnes U percentage of worldpercentage of world
AustraliaAustralia 1,074,0001,074,000 30%30%
Kazakhstan Kazakhstan 622,000622,000 17%17%
Canada Canada 439,000439,000 12%12%
South Africa South Africa 298,000298,000 8%8%
Namibia Namibia 213,000213,000 6%6%
Russian Fed.Russian Fed. 158,000158,000 4%4%
Brazil Brazil 143,000143,000 4%4%
USA USA 102,000102,000 3%3%
UzbekistanUzbekistan 93,00093,000 3%3%
World total World total 3,622,0003,622,000
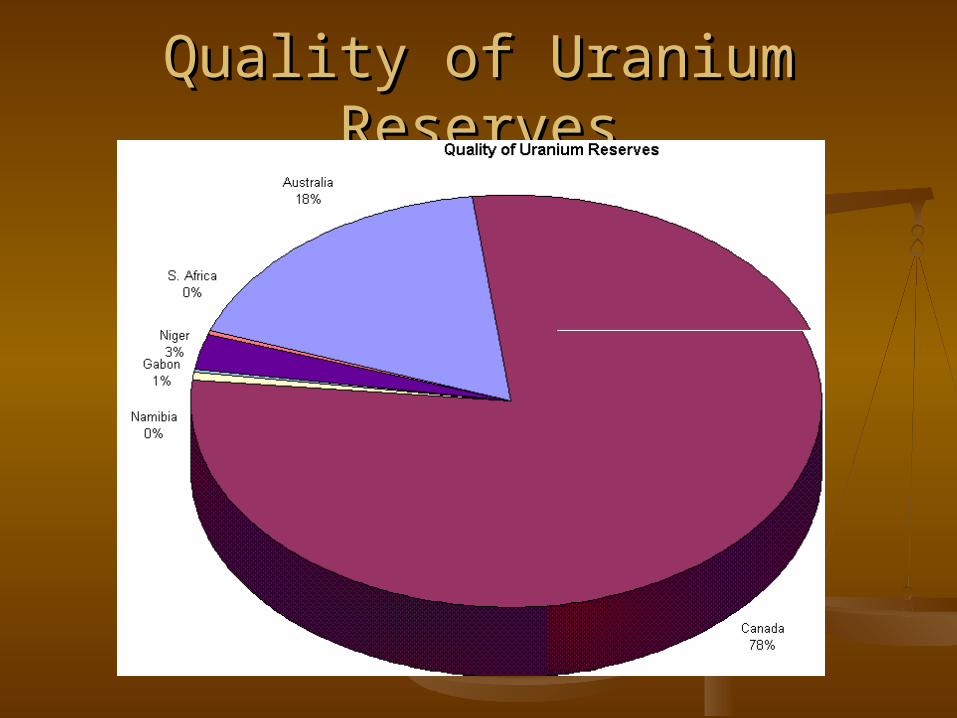
Quality of Uranium ReservesQuality of Uranium Reserves
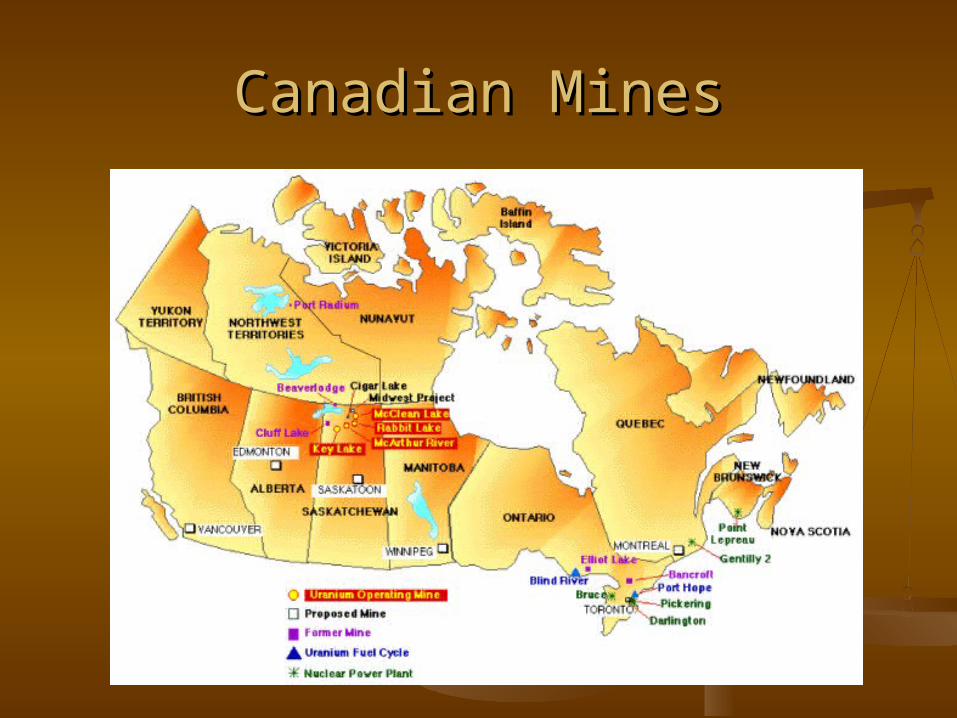
Canadian MinesCanadian Mines
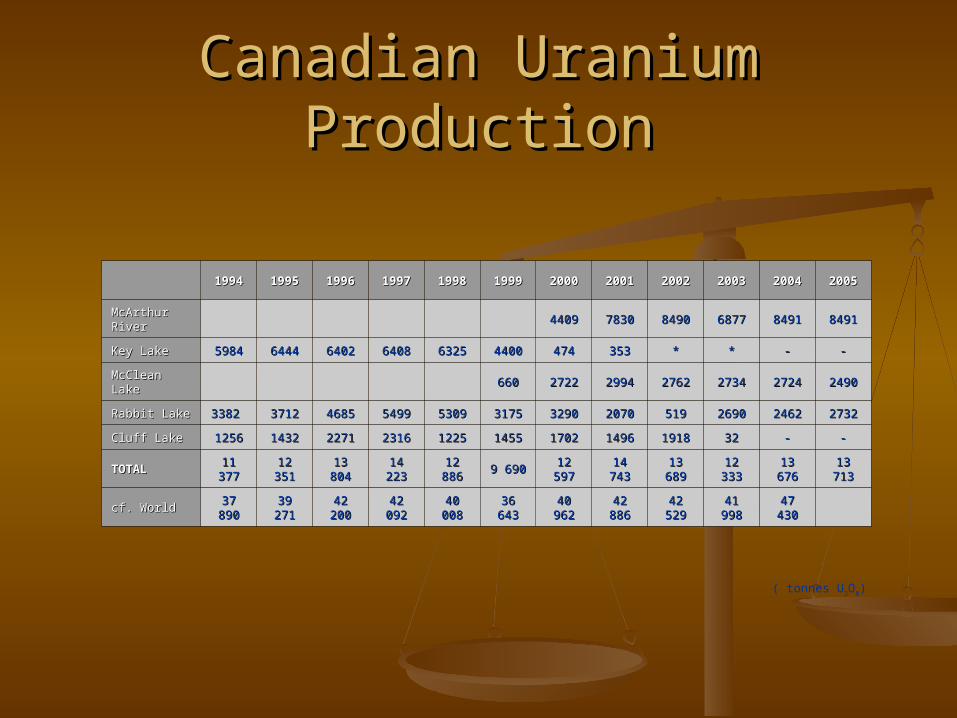
Canadian Uranium ProductionCanadian Uranium Production
( tonnes U3O8)
19941994 19951995 19961996 19971997 19981998 19991999 20002000 20012001 20022002 20032003 20042004 20052005
McArthur McArthur RiverRiver 44094409 78307830 84908490 68776877 84918491 84918491
Key Lake Key Lake 59845984 64446444 64026402 64086408 63256325 44004400 474474 353353 ** ** -- --
McClean McClean LakeLake 660660 27222722 29942994 27622762 27342734 27242724 24902490
Rabbit Lake Rabbit Lake 3382 3382 37123712 46854685 54995499 53095309 31753175 32903290 20702070 519519 26902690 24622462 27322732
Cluff Lake Cluff Lake 12561256 14321432 22712271 23162316 12251225 14551455 17021702 14961496 19181918 3232 -- --
TOTAL TOTAL 11 11 377377
12 12 351351
13 13 804804
14 14 223223
12 12 886886 9 6909 690 12 12
59759714 14
74374313 13
68968912 12
33333313 13
67667613 13
713713
cf. World cf. World 37 37 890890
39 39 271271
42 42 200200
42 42 092092
40 40 008008
36 36 643643
40 40 962962
42 42 886886
42 42 529529
41 41 998998
47 47 430430
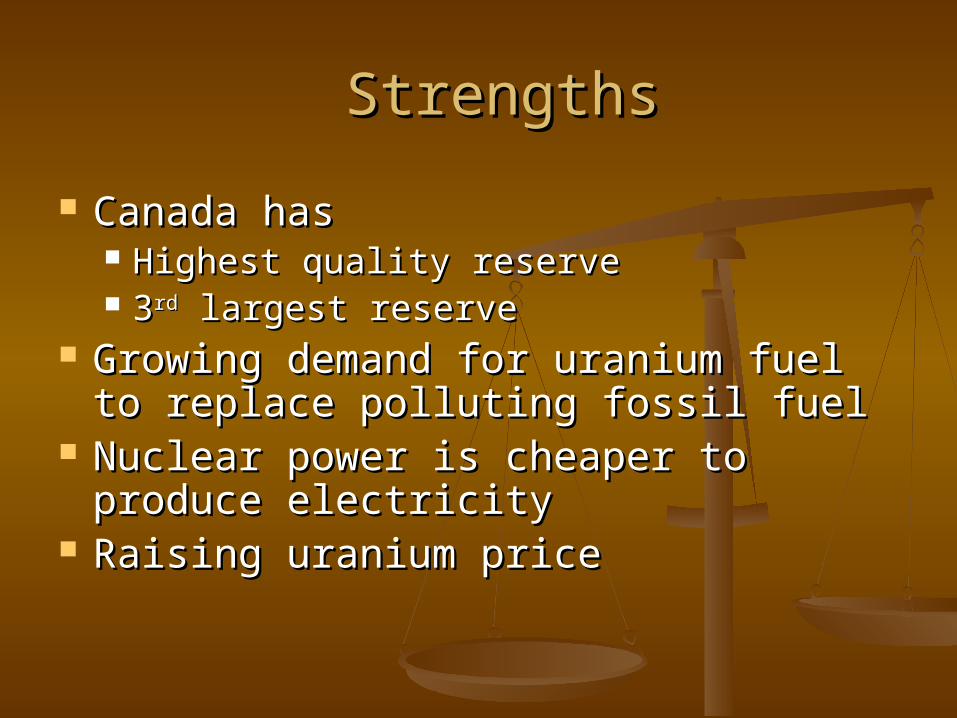
StrengthsStrengths
Canada has Canada has Highest quality reserveHighest quality reserve 33rdrd largest reserve largest reserve
Growing demand for uranium fuel to Growing demand for uranium fuel to replace polluting fossil fuelreplace polluting fossil fuel
Nuclear power is cheaper to produce Nuclear power is cheaper to produce electricityelectricity
Raising uranium priceRaising uranium price
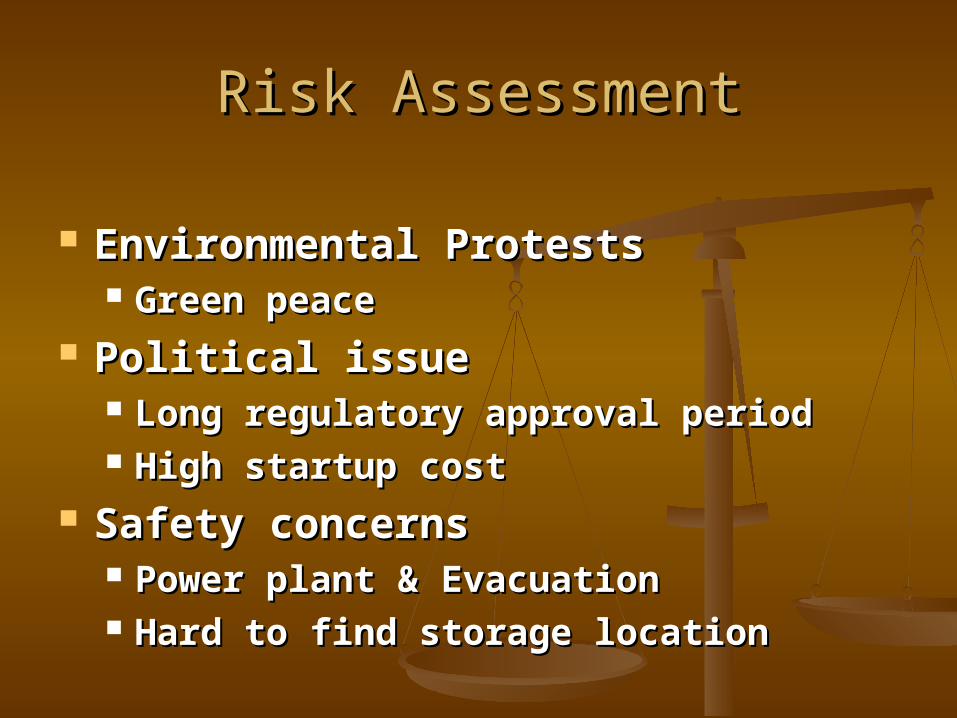
Risk AssessmentRisk Assessment
Environmental ProtestsEnvironmental Protests Green peaceGreen peace
Political issuePolitical issue Long regulatory approval periodLong regulatory approval period High startup costHigh startup cost
Safety concernsSafety concerns Power plant & Evacuation Power plant & Evacuation Hard to find storage locationHard to find storage location
Important TrendsImportant Trends
Raising pricesRaising prices High demand due to need for High demand due to need for
electricityelectricity Production from world uranium mines Production from world uranium mines
now supplies only 55% of the now supplies only 55% of the requirements of power utilities requirements of power utilities
Mine production is increasingly Mine production is increasingly supplemented by ex-military materialsupplemented by ex-military material
Recommended StrategyRecommended Strategy
Selection Criteria for Long Term Selection Criteria for Long Term InvestmentInvestment
Larger companies with strong financial resourcesLarger companies with strong financial resources Companies that have good access to resources Companies that have good access to resources
and (potential) marketsand (potential) markets Companies that already demonstrate superior Companies that already demonstrate superior
cost structure and lower production costscost structure and lower production costs Companies with large reserves of high grade oreCompanies with large reserves of high grade ore
Gold Mining IndustryGold Mining Industry
Overall IntroductionOverall Introduction Product UseProduct Use Production ProcessProduction Process Structure of IndustryStructure of Industry Financial StructureFinancial Structure Risk AssessmentRisk Assessment Recommended StrategyRecommended Strategy
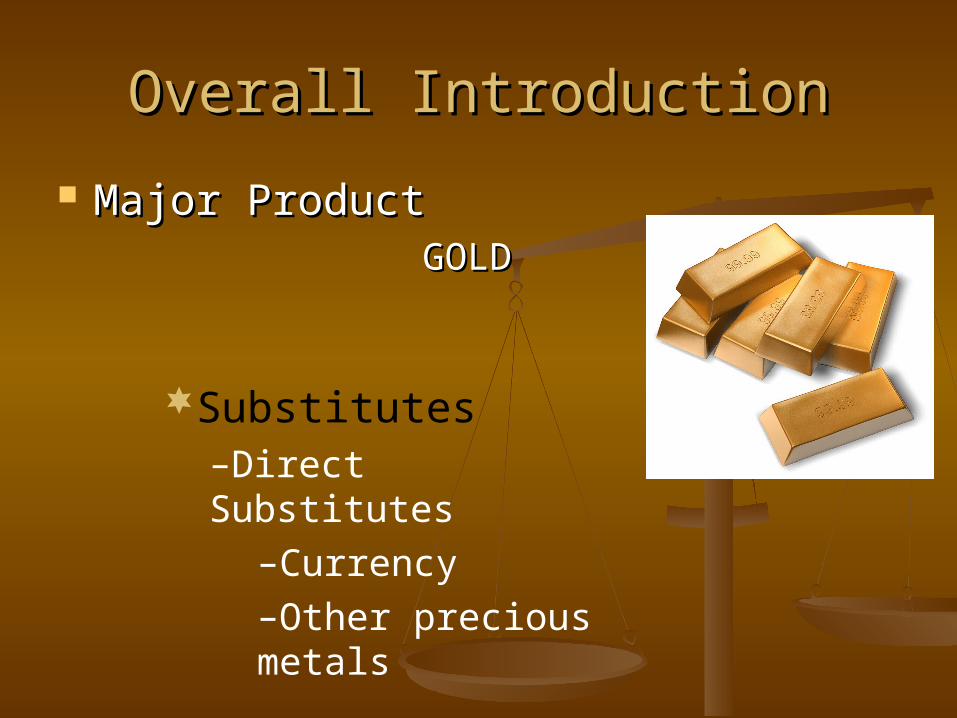
Overall IntroductionOverall Introduction
Major ProductMajor ProductGOLDGOLD
Substitutes–Direct Substitutes
–Currency–Other precious metals
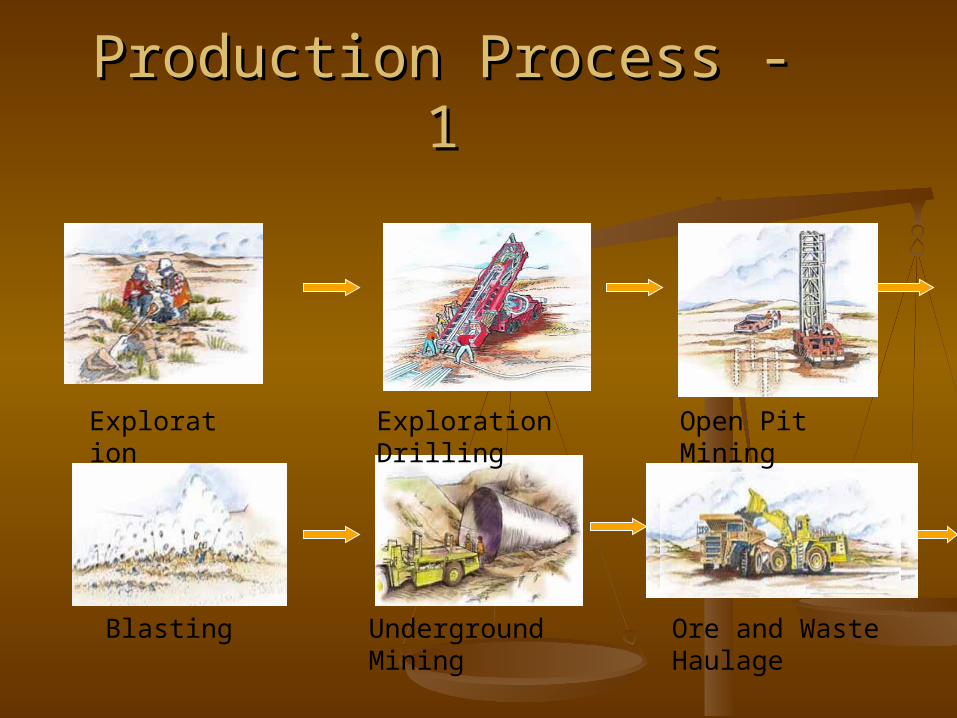
Production Process - 1Production Process - 1
Exploration Exploration Drilling Open Pit Mining
Blasting Underground Mining Ore and Waste Haulage
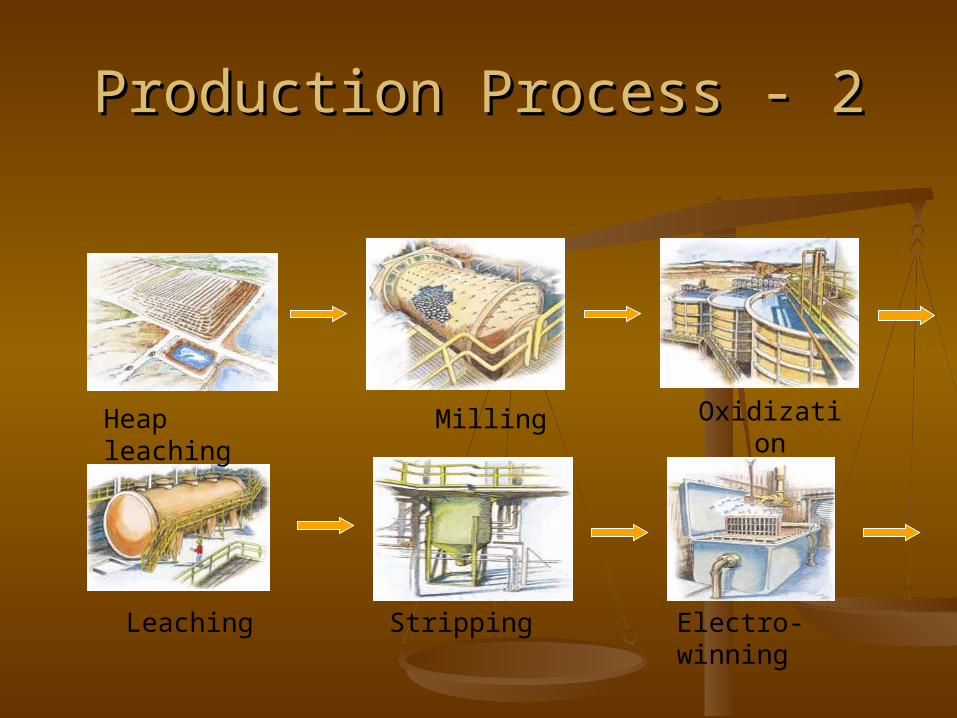
Production Process - 2Production Process - 2
Heap leaching Milling Oxidization
Leaching Stripping Electro-winning
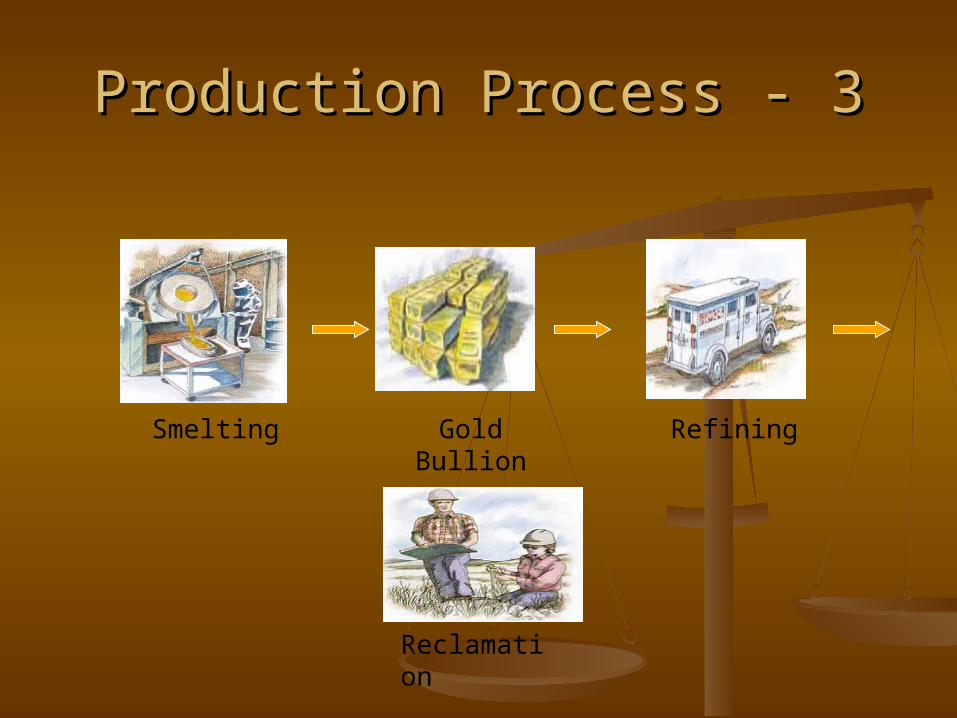
Production Process - 3Production Process - 3
Smelting Gold Bullion
Reclamation
Refining
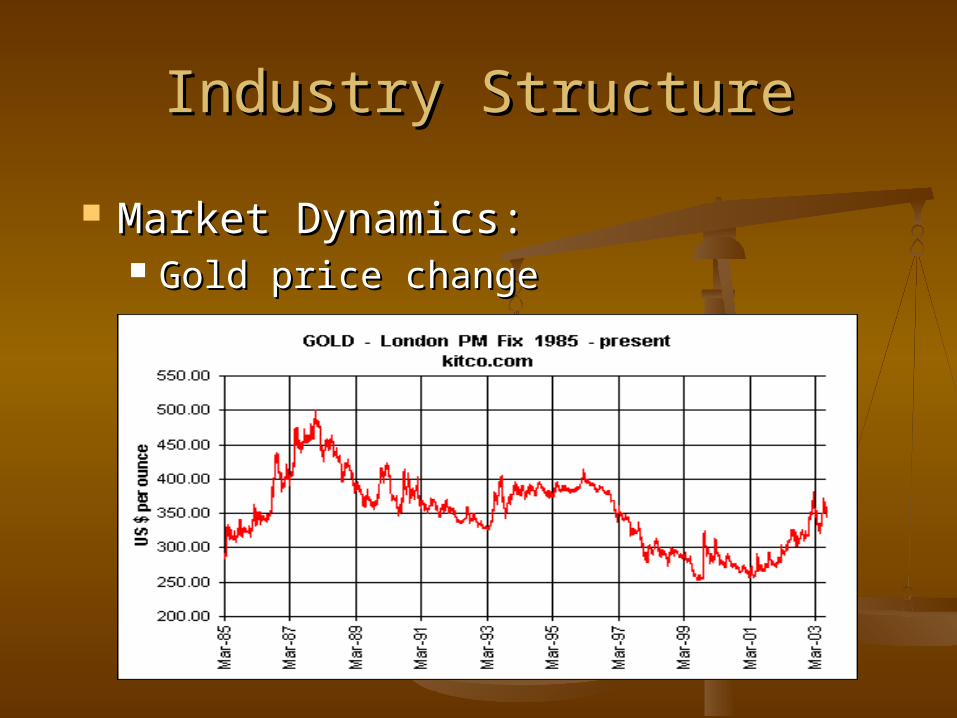
Industry StructureIndustry Structure
Market Dynamics:Market Dynamics: Gold price change Gold price change
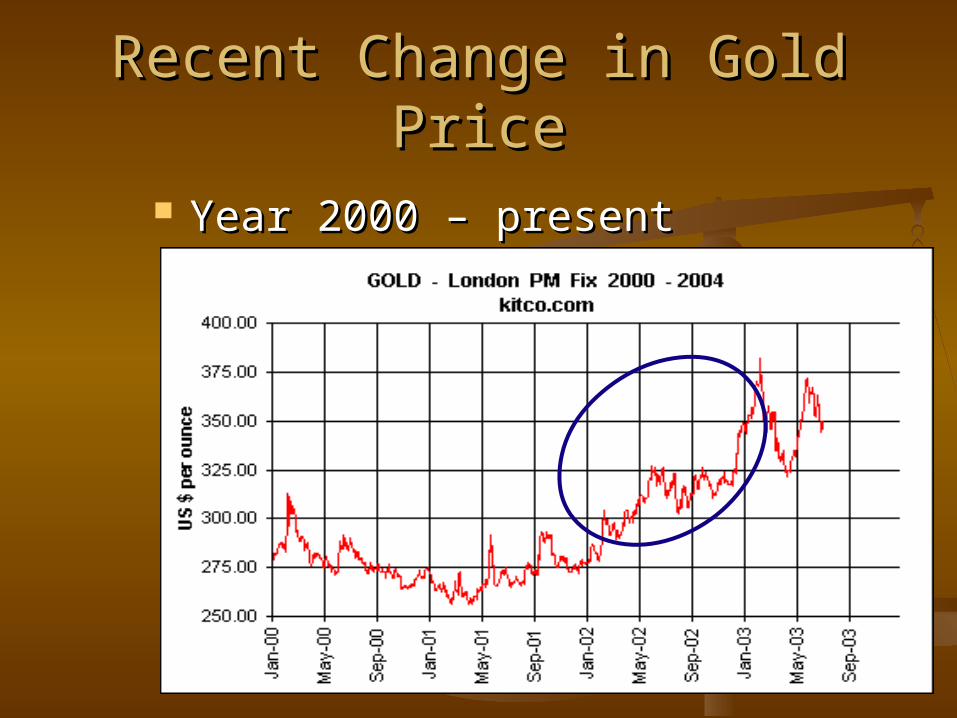
Recent Change in Gold PriceRecent Change in Gold Price
Year 2000 – presentYear 2000 – present
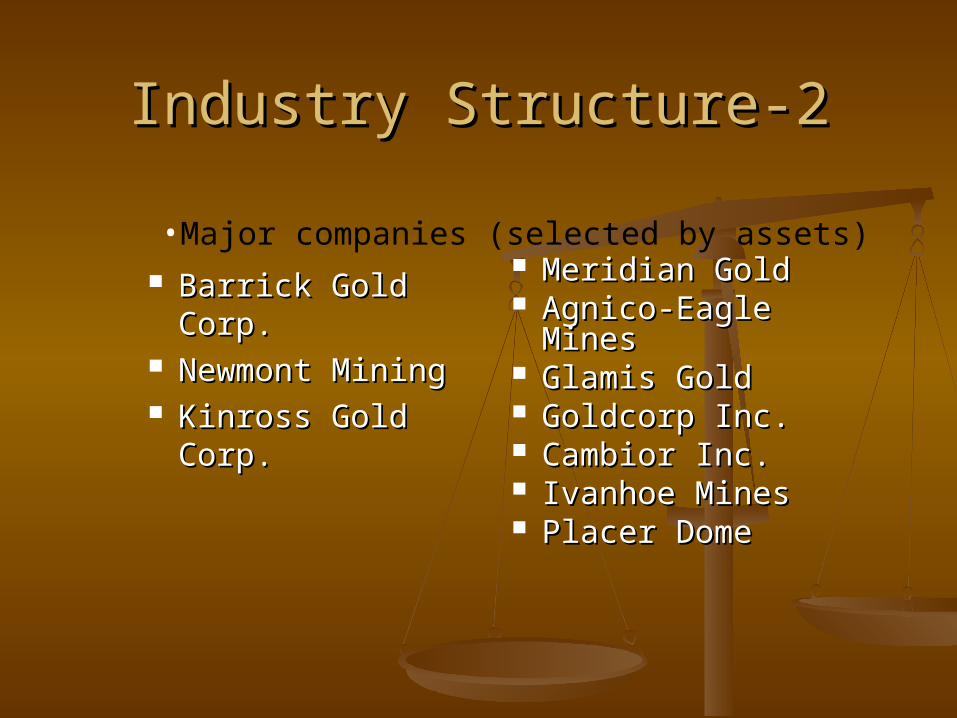
Industry Structure-2Industry Structure-2
Barrick Gold Corp. Barrick Gold Corp. Newmont Mining Newmont Mining Kinross Gold Corp.Kinross Gold Corp.
Meridian GoldMeridian Gold Agnico-Eagle Mines Agnico-Eagle Mines Glamis Gold Glamis Gold Goldcorp Inc. Goldcorp Inc. Cambior Inc. Cambior Inc. Ivanhoe MinesIvanhoe Mines Placer Dome Placer Dome
•Major companies (selected by assets)
Financial StructureFinancial Structure
Cost StructureCost Structure Exploration, research and developmentExploration, research and development General operation costsGeneral operation costs Depreciation, depletion and amortization Depreciation, depletion and amortization Interest expensesInterest expenses Write-down of assets Write-down of assets
Risk AssessmentRisk Assessment
Nature of Mineral Exploration and Nature of Mineral Exploration and MiningMining
Environmental RisksEnvironmental Risks Reserve EstimatesReserve Estimates Worldwide OperationsWorldwide Operations Licenses and PermitsLicenses and Permits Supply and DemandSupply and Demand

Recommended StrategyRecommended Strategy
Selection Criteria for Long Term InvestmentSelection Criteria for Long Term Investment
Larger companies with strong financial Larger companies with strong financial resourcesresources
Companies that have good access to resources Companies that have good access to resources and (potential) marketsand (potential) markets
Companies that already demonstrate superior Companies that already demonstrate superior cost structure and lower production costscost structure and lower production costs
Companies with large reserves of high grade Companies with large reserves of high grade oreore
Phelps Dodge
Phelps Dodge Corp. is one of the world’s largest copper producers
World leader in the production of molybdenum-based chemicals
Leading producers of continuous-cast copper rod
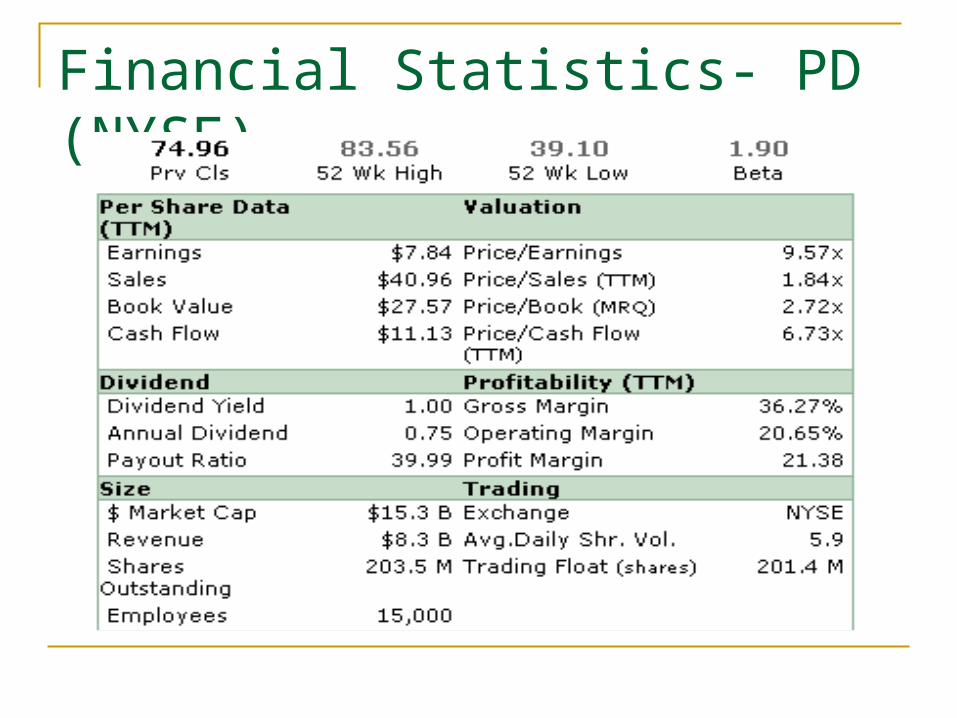
Financial Statistics- PD (NYSE)
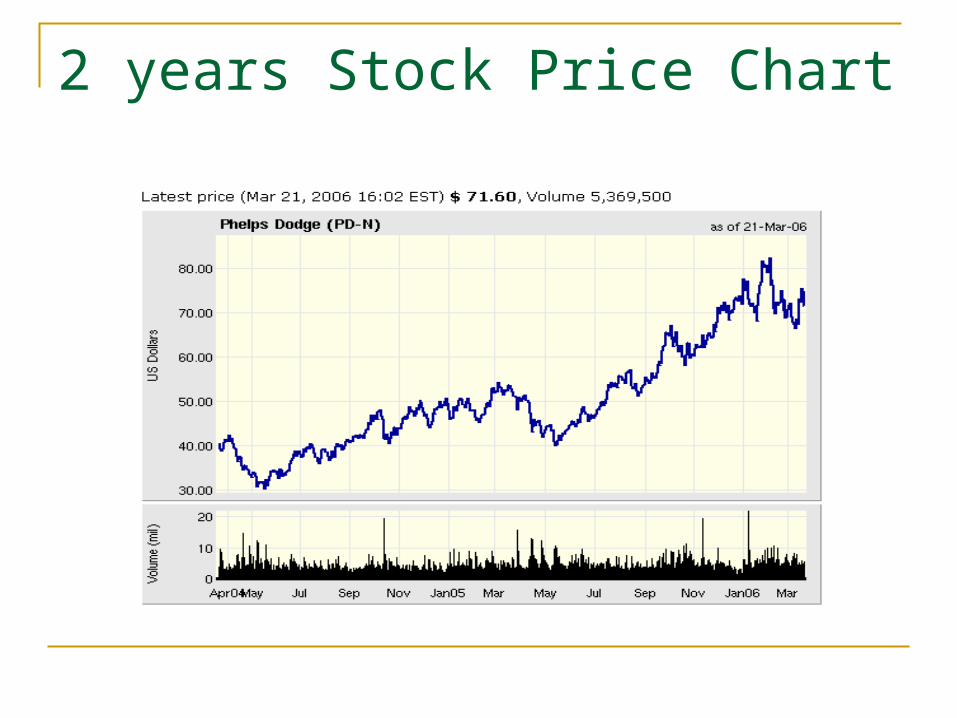
2 years Stock Price Chart
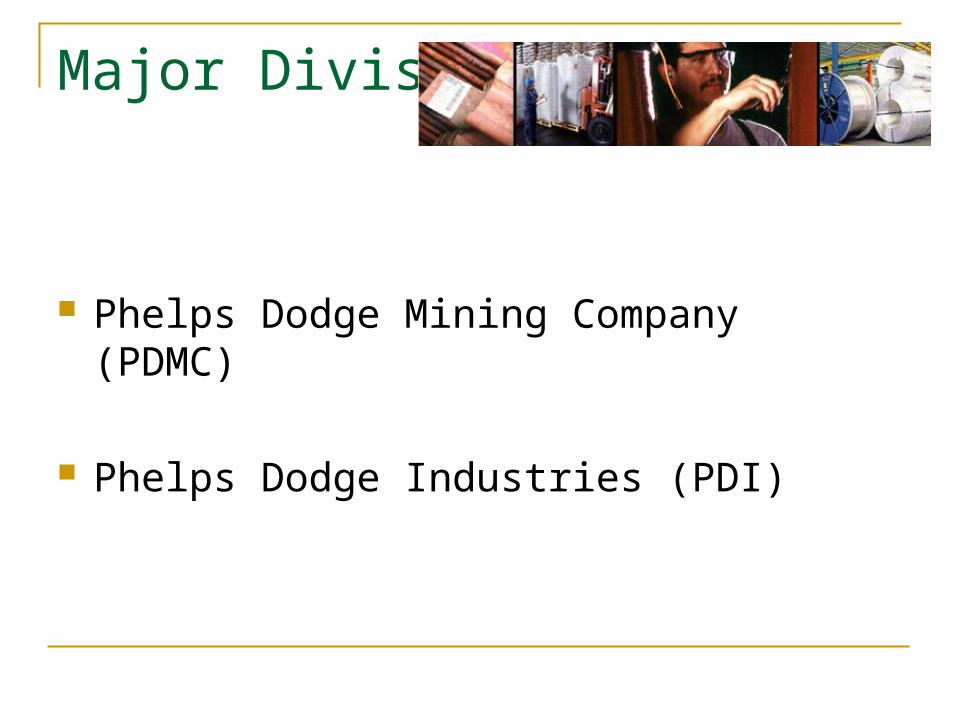
Major Divisions
Phelps Dodge Mining Company (PDMC)
Phelps Dodge Industries (PDI)
PDMC’s Major Operations
Worldwide and vertically integrated copper operations
from mining through rod production, marketing and sales
Molybdenum operations from mining through conversion to chemical and
metallurgical products, marketing and sales Other mining operations and investment Worldwide mineral exploration, technology and
project development programs
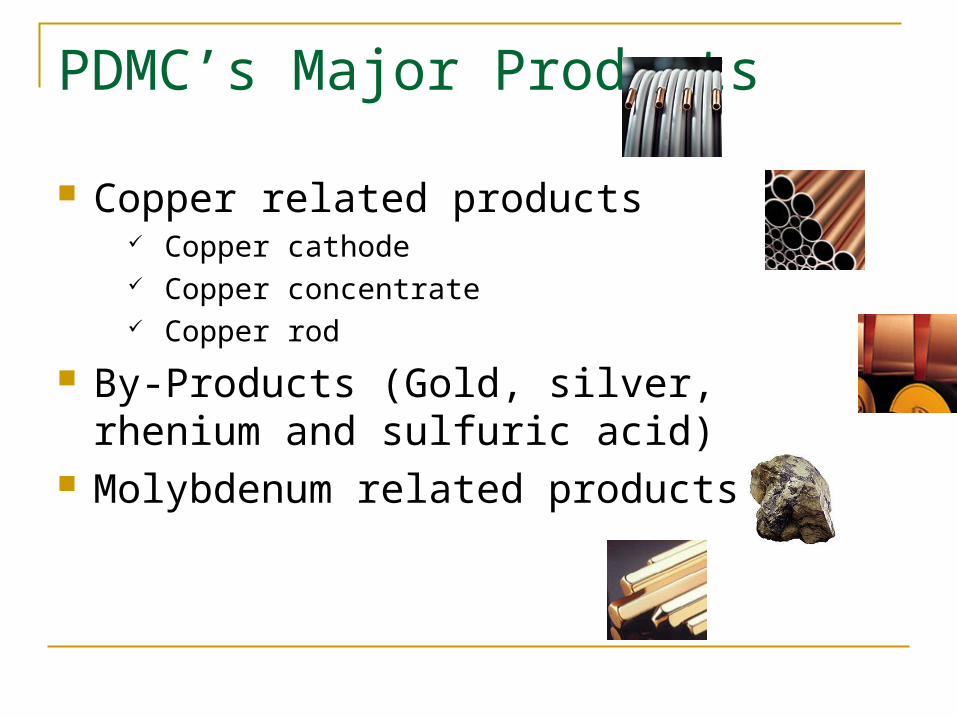
PDMC’s Major Products
Copper related products Copper cathode Copper concentrate Copper rod
By-Products (Gold, silver, rhenium and sulfuric acid)
Molybdenum related products
Copper
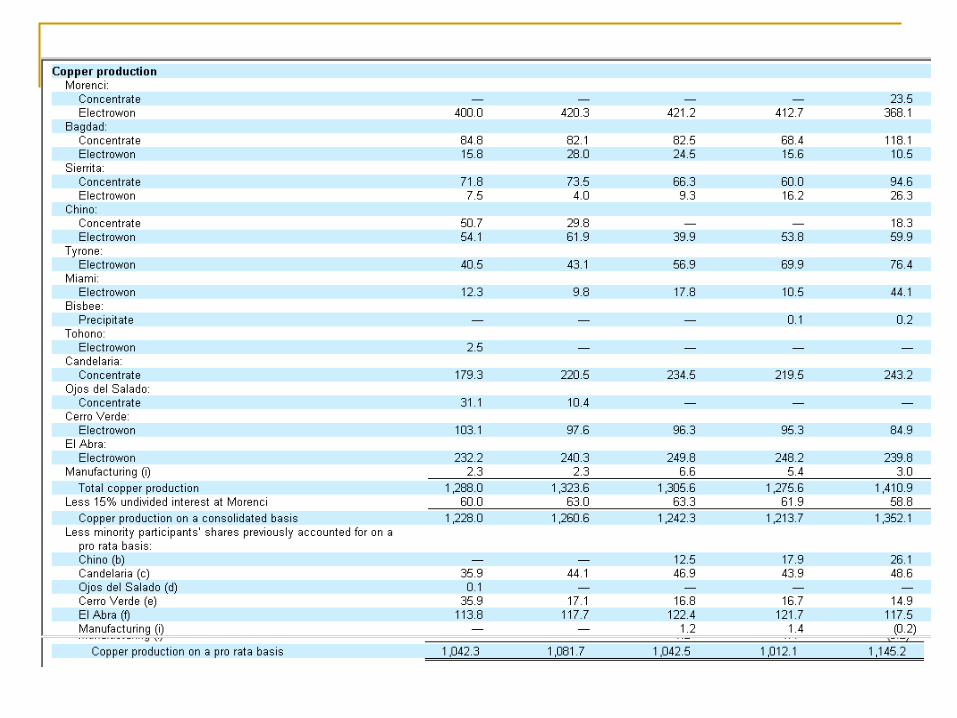
In 2005, PDMC produced 1,228,000 tons of copper on a consolidated basis (1,042,300 tons on a pro rata basis)
An additional 60,000 tons of copper for 15% undivided interest in the Morenci mine
Production of copper on pro rata basis constituted 53%of the copper mined in US
Molybdenum Concentrate
In 2005, PDMC produced 62.3 million pounds of molybdenum
High-purity, chemical-grade molybdenum concentrate is produced at Henderson mine in Colorado
Most of concentrate is produced for metallurgical markets (steel industries) to strengthen the steel and lubricant industry
PDI’s Wire and Cable
PDI produces magnet wire, copper and aluminum energy cables, specially conductors and other products for sale to original equipment manufacturers for US in electrical motors, generators, transformers, medical applications and public utilities
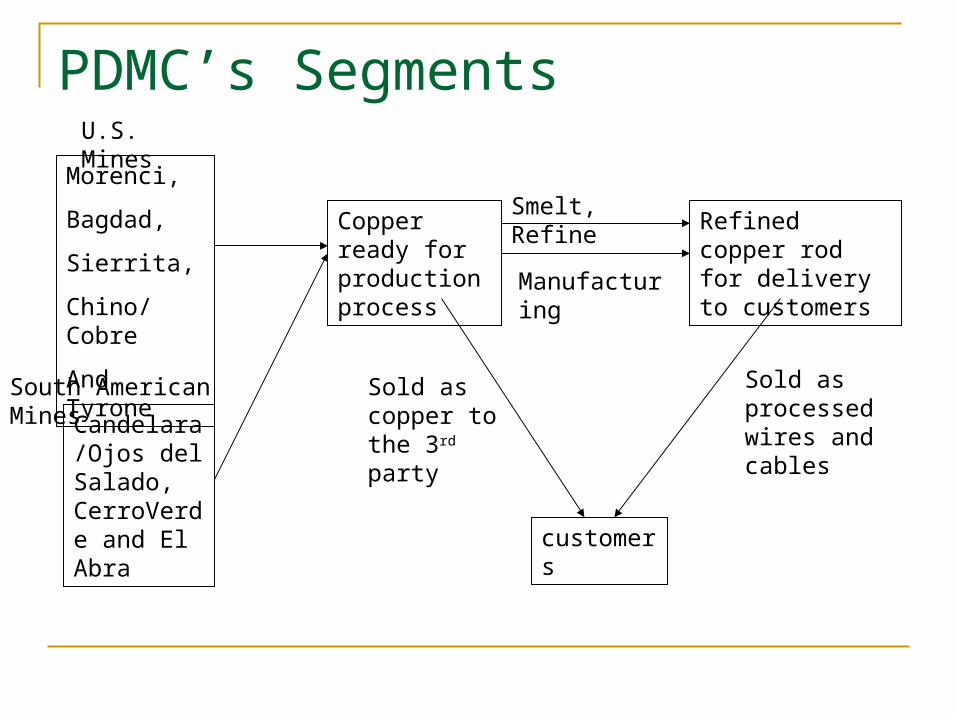
PDMC’s Segments
South American Mines
Morenci,
Bagdad,
Sierrita,
Chino/Cobre
And Tyrone
Candelara/Ojos del Salado, CerroVerde and El Abra
Copper ready for production process
Refined copper rod for delivery to customers
Smelt, Refine
Manufacturing
U.S. Mines
customers
Sold as copper to the 3rd party
Sold as processed wires and cables
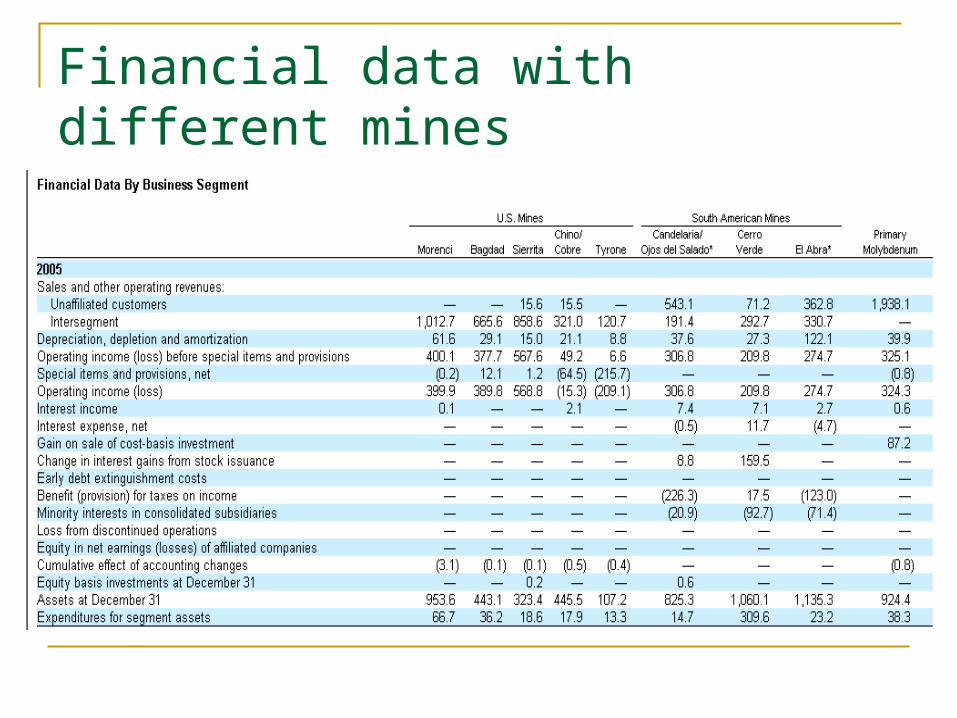
Financial data with different mines
PD’s mines segments
US Mines
South American Mines
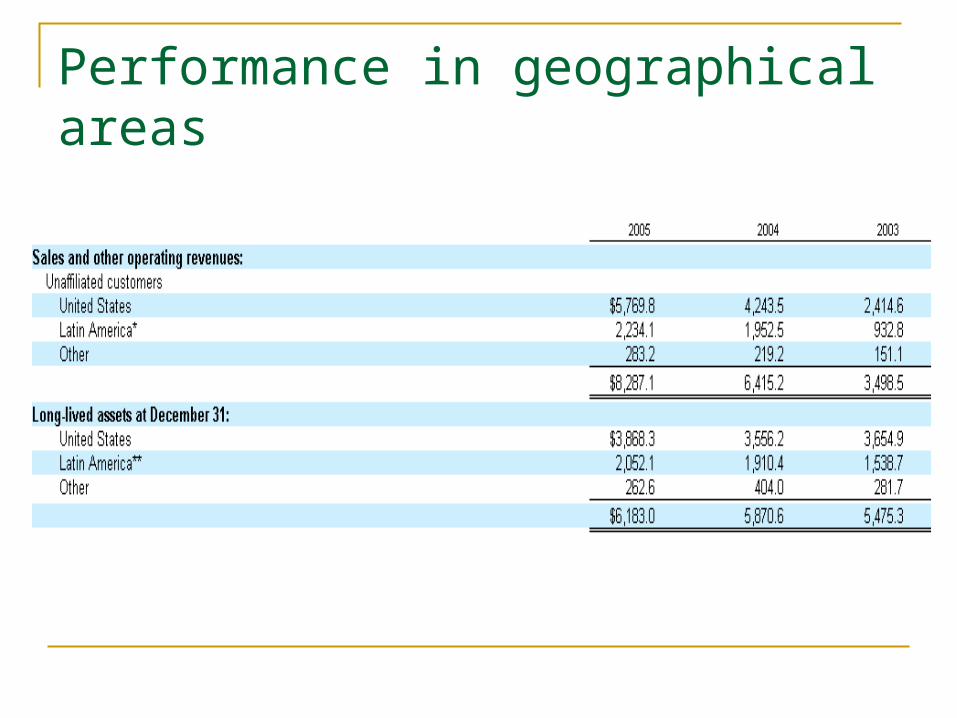
Performance in geographical areas
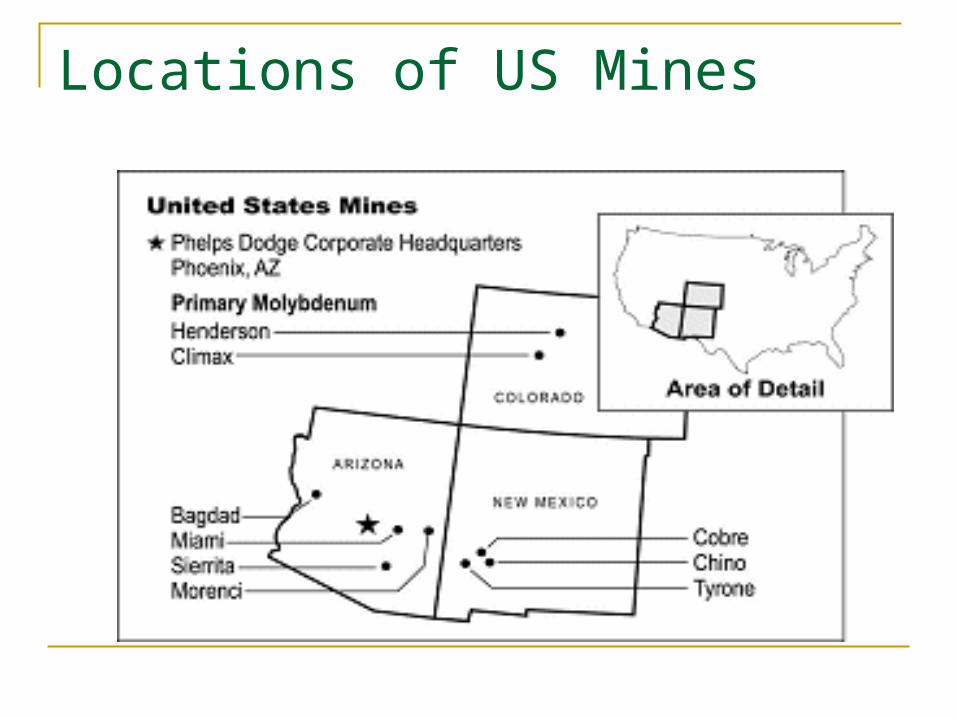
Locations of US Mines
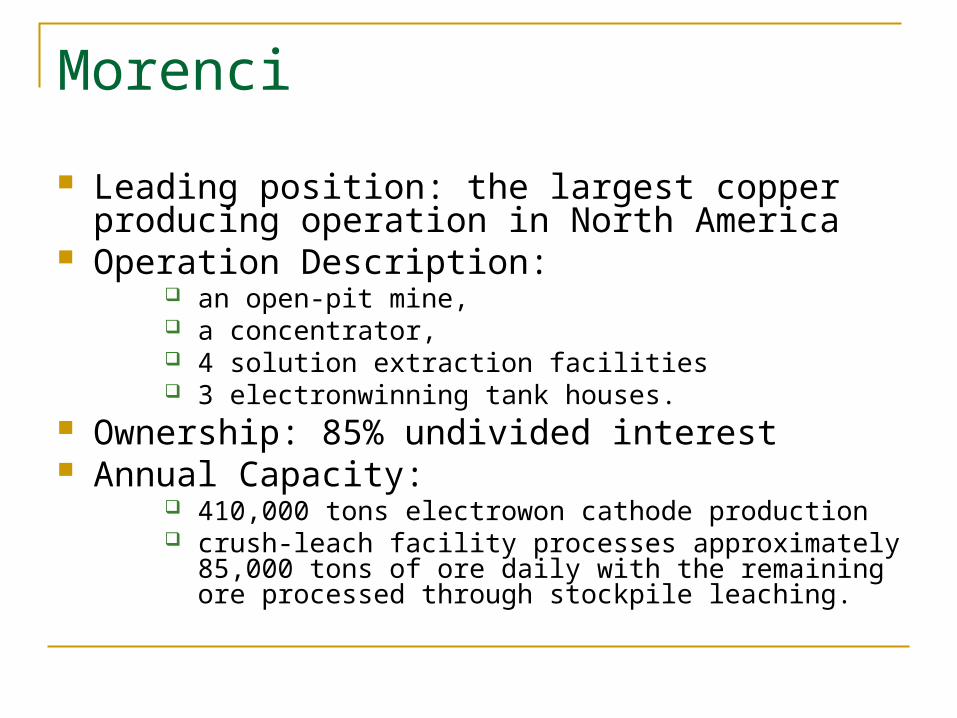
Morenci
Leading position: the largest copper producing operation in North America
Operation Description: an open-pit mine, a concentrator, 4 solution extraction facilities 3 electronwinning tank houses.
Ownership: 85% undivided interest Annual Capacity:
410,000 tons electrowon cathode production crush-leach facility processes approximately 85,000 tons of
ore daily with the remaining ore processed through stockpile leaching.
Morenci’s Key Future Growth Factors On June 1, 2005, the Company’s board of directors
approved expenditures of $210 million to construct a concentrate-leach, direct-electrowinning facility at Morenci, and to restart its concentrator.
The concentrate-leach, direct-electrowinning facility is expected to be in operation by mid-2007, and copper production is projected to be approximately 150 million pounds per year .
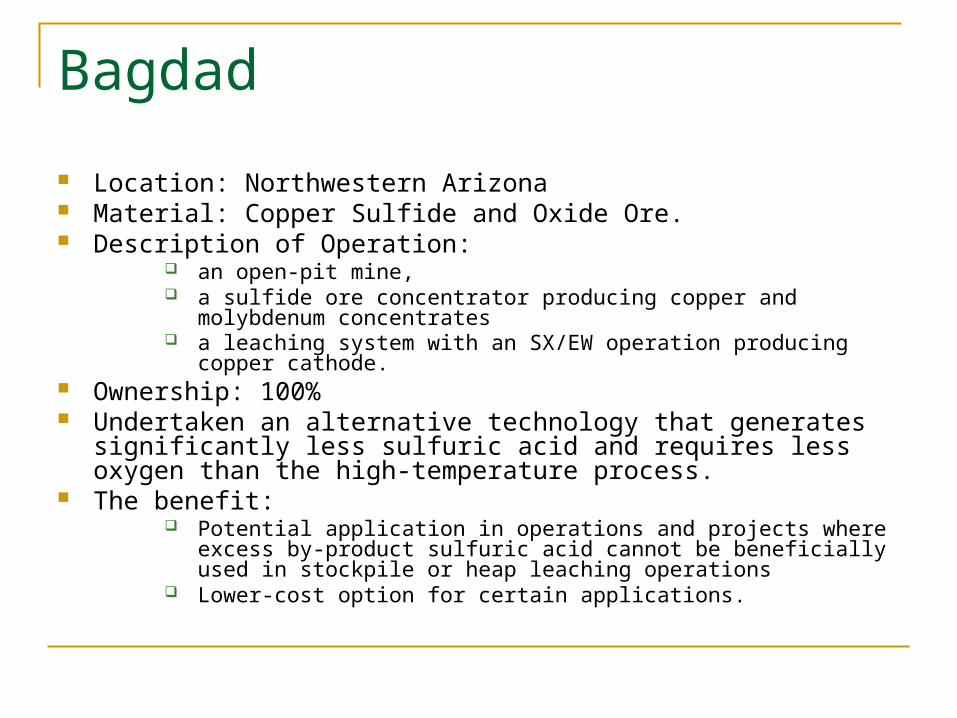
Bagdad
Location: Northwestern Arizona Material: Copper Sulfide and Oxide Ore. Description of Operation:
an open-pit mine, a sulfide ore concentrator producing copper and molybdenum
concentrates a leaching system with an SX/EW operation producing copper cathode.
Ownership: 100% Undertaken an alternative technology that generates significantly less
sulfuric acid and requires less oxygen than the high-temperature process.
The benefit: Potential application in operations and projects where excess by-product
sulfuric acid cannot be beneficially used in stockpile or heap leaching operations
Lower-cost option for certain applications.
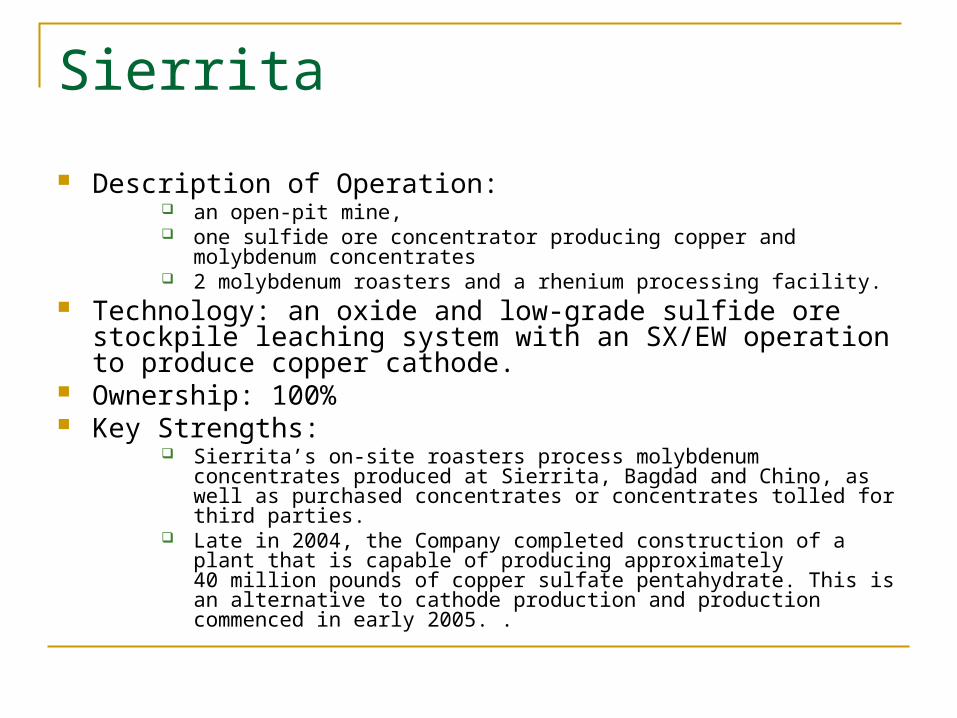
Sierrita
Description of Operation: an open-pit mine, one sulfide ore concentrator producing copper and molybdenum
concentrates 2 molybdenum roasters and a rhenium processing facility.
Technology: an oxide and low-grade sulfide ore stockpile leaching system with an SX/EW operation to produce copper cathode.
Ownership: 100% Key Strengths:
Sierrita’s on-site roasters process molybdenum concentrates produced at Sierrita, Bagdad and Chino, as well as purchased concentrates or concentrates tolled for third parties.
Late in 2004, the Company completed construction of a plant that is capable of producing approximately 40 million pounds of copper sulfate pentahydrate. This is an alternative to cathode production and production commenced in early 2005. .
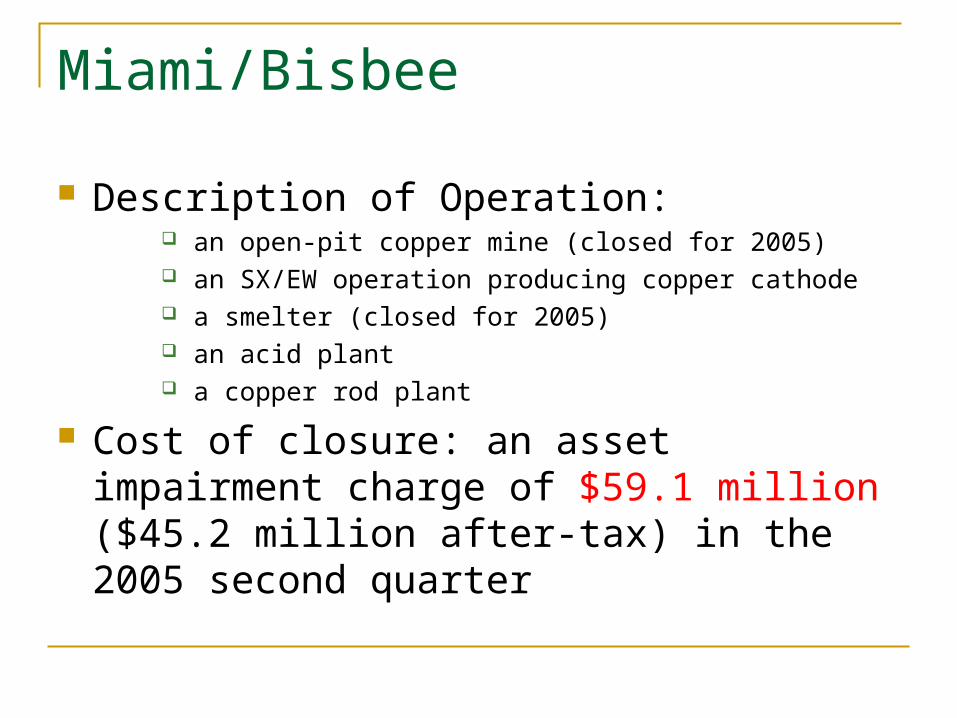
Miami/Bisbee
Description of Operation: an open-pit copper mine (closed for 2005) an SX/EW operation producing copper cathode a smelter (closed for 2005) an acid plant a copper rod plant
Cost of closure: an asset impairment charge of $59.1 million ($45.2 million after-tax) in the 2005 second quarter
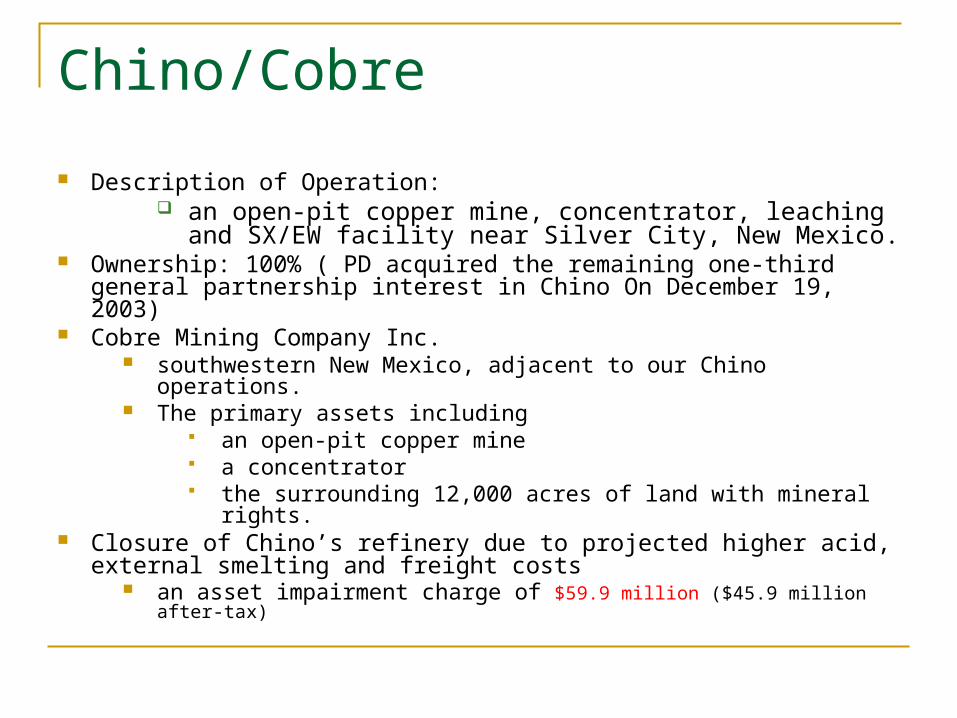
Chino/Cobre
Description of Operation: an open-pit copper mine, concentrator, leaching and
SX/EW facility near Silver City, New Mexico. Ownership: 100% ( PD acquired the remaining one-third general
partnership interest in Chino On December 19, 2003) Cobre Mining Company Inc.
southwestern New Mexico, adjacent to our Chino operations. The primary assets including
an open-pit copper mine a concentrator the surrounding 12,000 acres of land with mineral rights.
Closure of Chino’s refinery due to projected higher acid, external smelting and freight costs
an asset impairment charge of $59.9 million ($45.9 million after-tax)
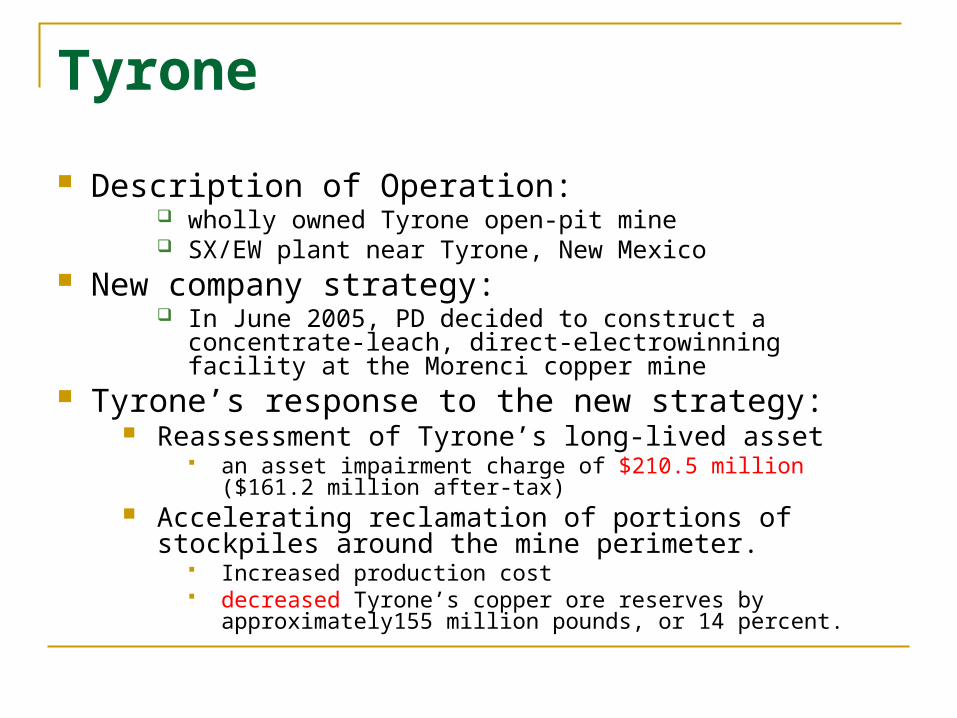
Tyrone
Description of Operation: wholly owned Tyrone open-pit mine SX/EW plant near Tyrone, New Mexico
New company strategy: In June 2005, PD decided to construct a concentrate-leach,
direct-electrowinning facility at the Morenci copper mine Tyrone’s response to the new strategy:
Reassessment of Tyrone’s long-lived asset an asset impairment charge of $210.5 million ($161.2 million
after-tax) Accelerating reclamation of portions of stockpiles around
the mine perimeter. Increased production cost decreased Tyrone’s copper ore reserves by
approximately155 million pounds, or 14 percent.
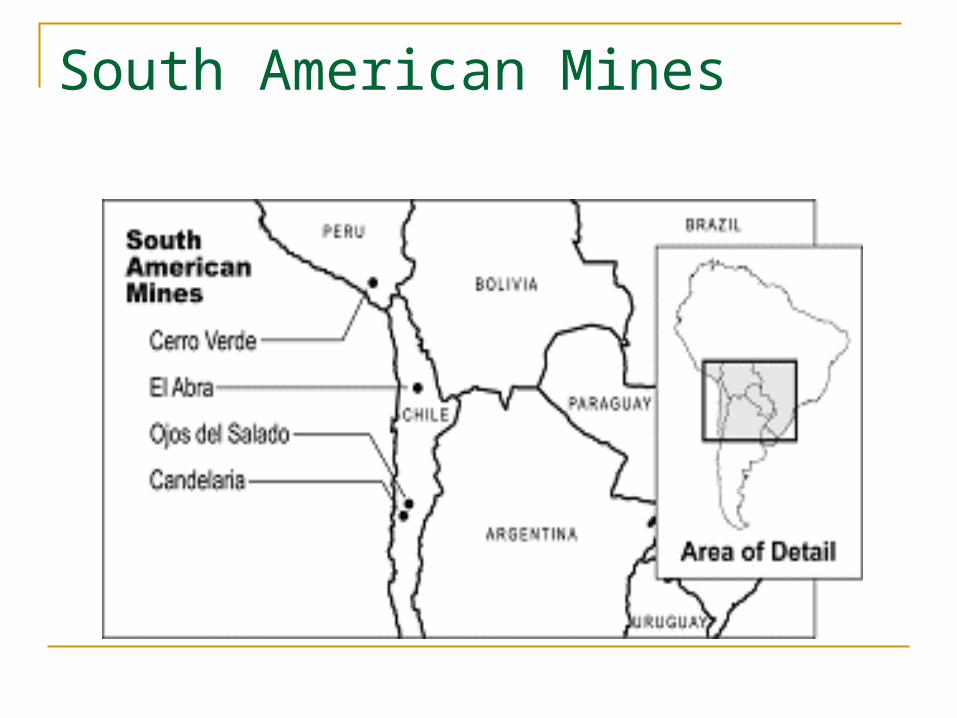
South American Mines

Candelaria/Ojos del Salado
Description of Operation: an open-pit and underground copper mines a concentrator, port and associated facilities
Ownership: 80 % partnership interest of a Chilean contractual mining
company in Candelaria Acquisition on Ojos del Salado by SMMA
On December 22, 2005, SMMA Candelaria, Inc. acquired a 20 percent equity interest in Ojos del Salado from PD Received cash of $24.8 million (net of $0.2 million of expenses) Phelps Dodge’s interest in Ojos del Salado was reduced to
80 percent from 100 percent.

El Abra
Description of Operation: Mine-for-leach, open-pit mining operation that uses three
stages of crushing prior to leaching an on/off heap leach pad an SX/EW operation to produce copper cathode
Ownership: 51 percent partnership interest in Sociedad Contractual
Minera El Abra (El Abra), a Chilean contractual mining company. The remaining 49 percent is owned by the state-owned copper enterprise Corporación Nacional del Cobre de Chile (CODELCO)
El Abra holds mining concessions over more than 33,000 acres of land near Calama in the copper-rich Second Region of northern Chile.
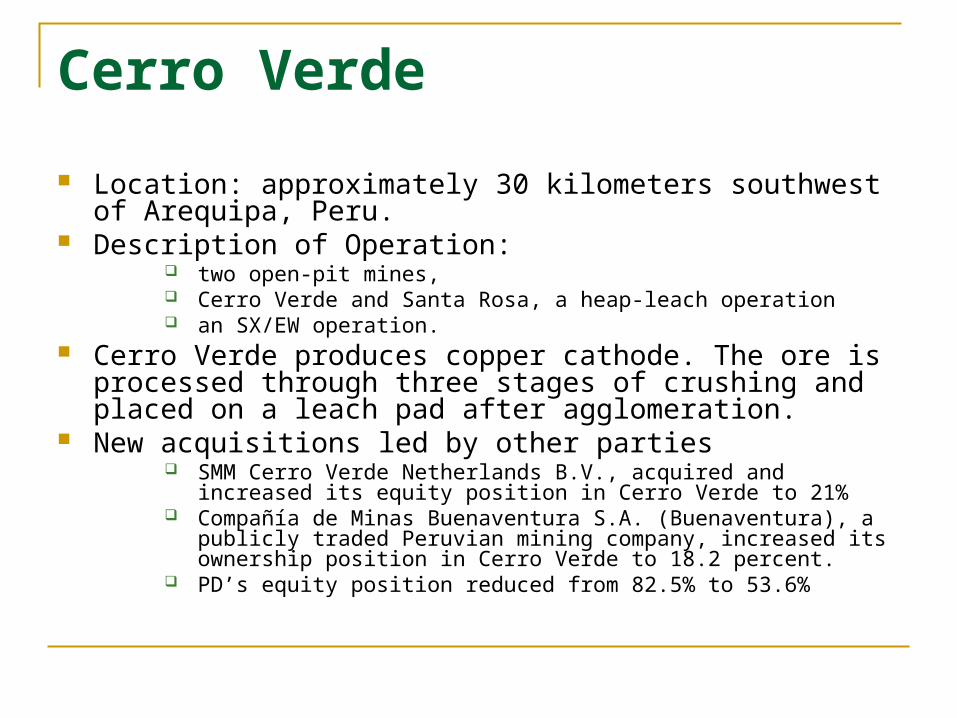
Cerro Verde
Location: approximately 30 kilometers southwest of Arequipa, Peru.
Description of Operation: two open-pit mines, Cerro Verde and Santa Rosa, a heap-leach operation an SX/EW operation.
Cerro Verde produces copper cathode. The ore is processed through three stages of crushing and placed on a leach pad after agglomeration.
New acquisitions led by other parties SMM Cerro Verde Netherlands B.V., acquired and increased its equity
position in Cerro Verde to 21% Compañía de Minas Buenaventura S.A. (Buenaventura), a publicly traded
Peruvian mining company, increased its ownership position in Cerro Verde to 18.2 percent.
PD’s equity position reduced from 82.5% to 53.6%
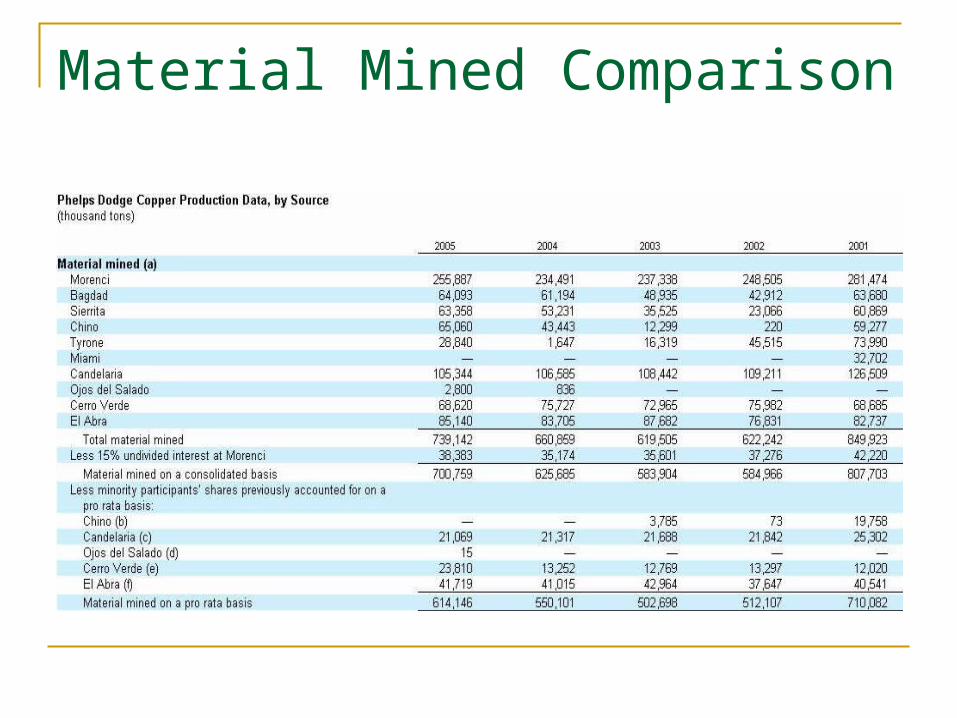
Material Mined Comparison
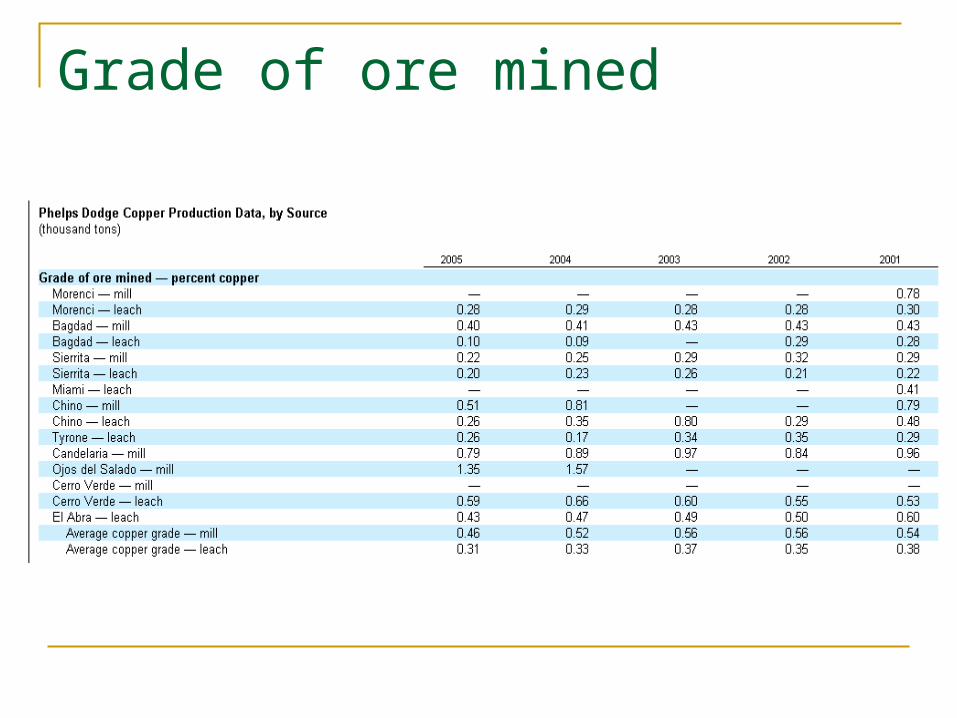
Grade of ore mined
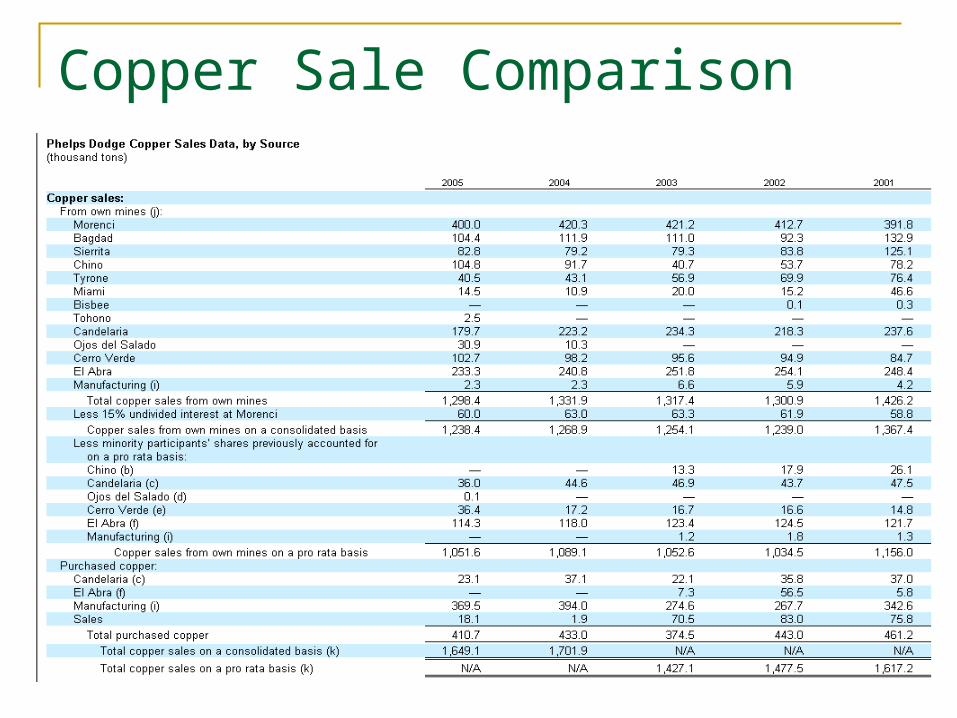
Copper Sale Comparison
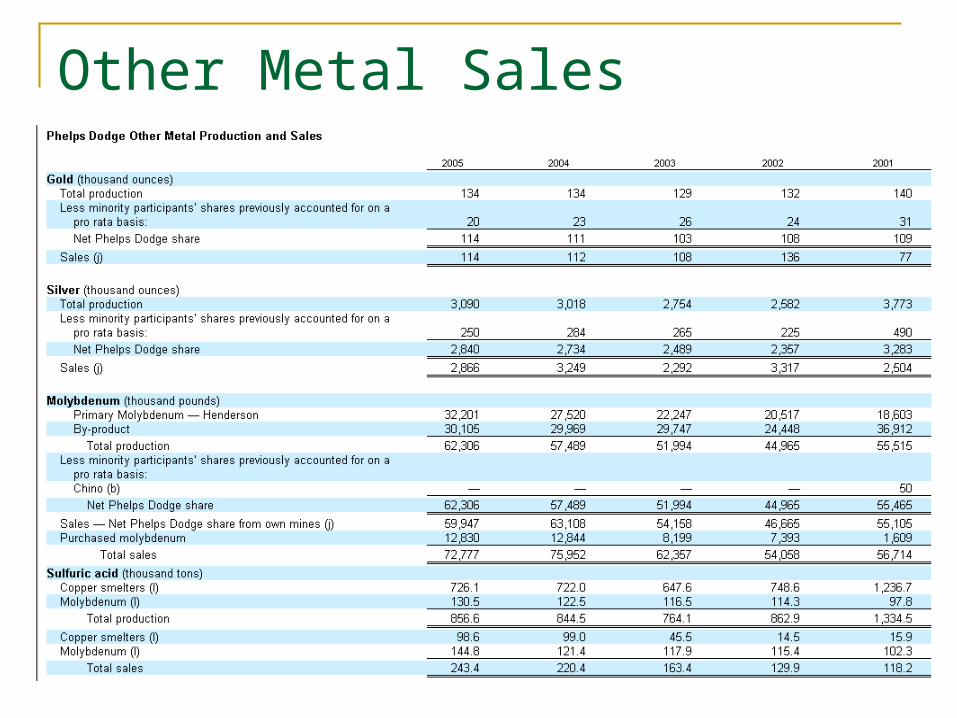
Other Metal Sales
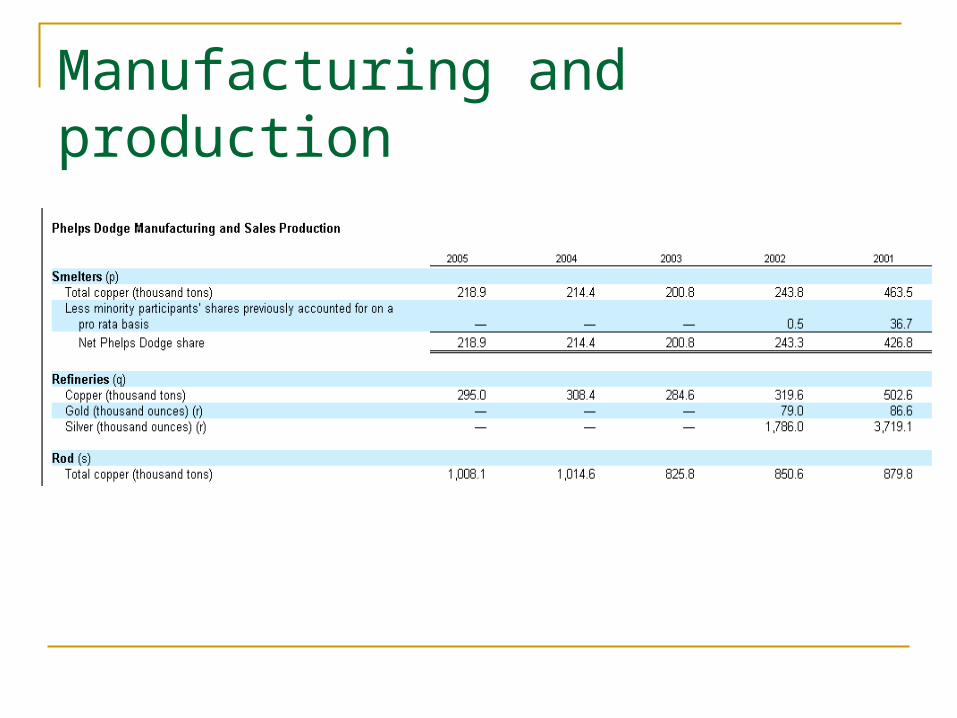
Manufacturing and production
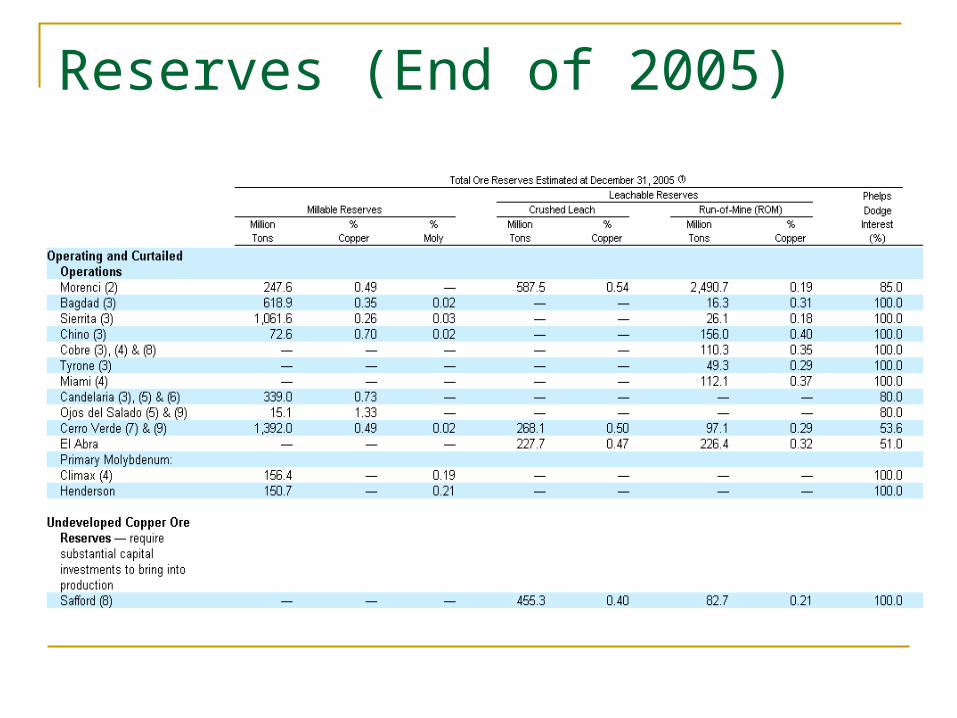
Reserves (End of 2005)
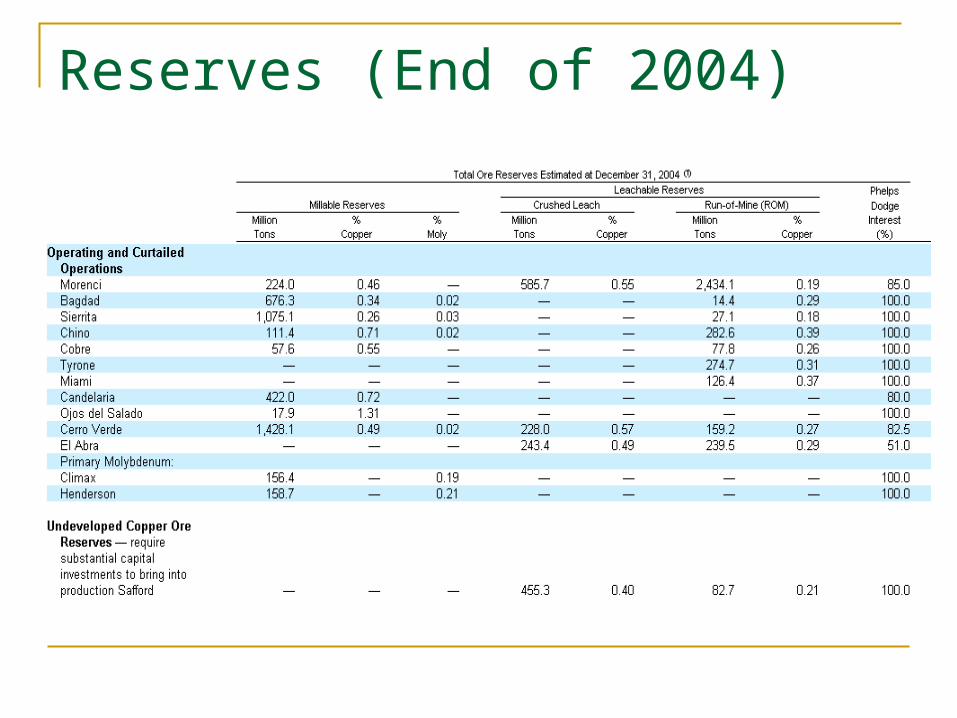
Reserves (End of 2004)
Consolidated Financial Statements
Income Statement Balance sheet statement Cash flow statement
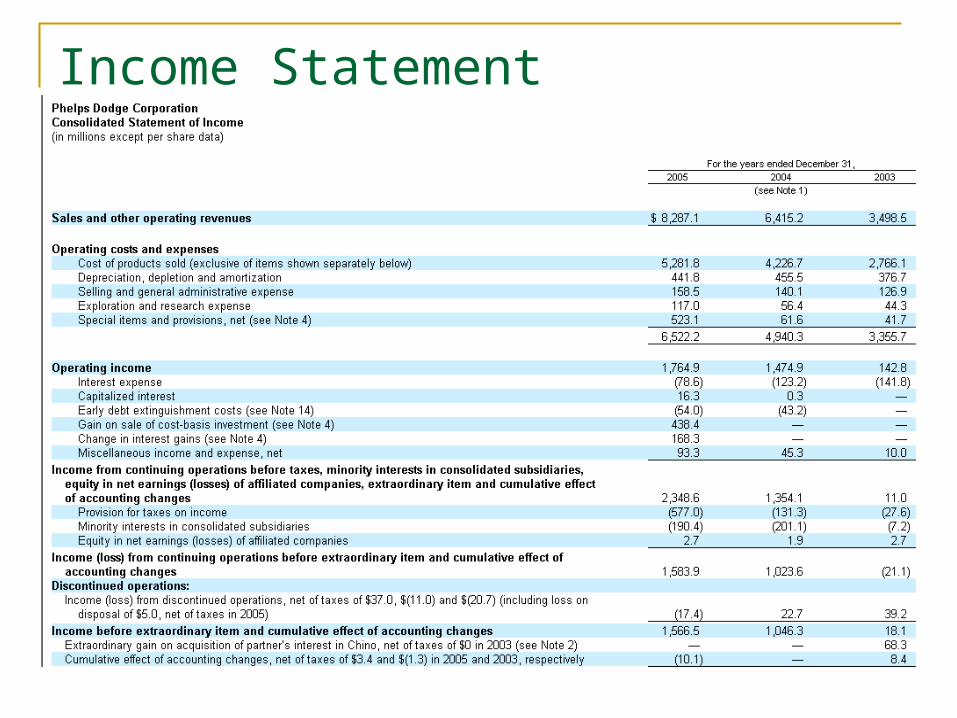
Income Statement
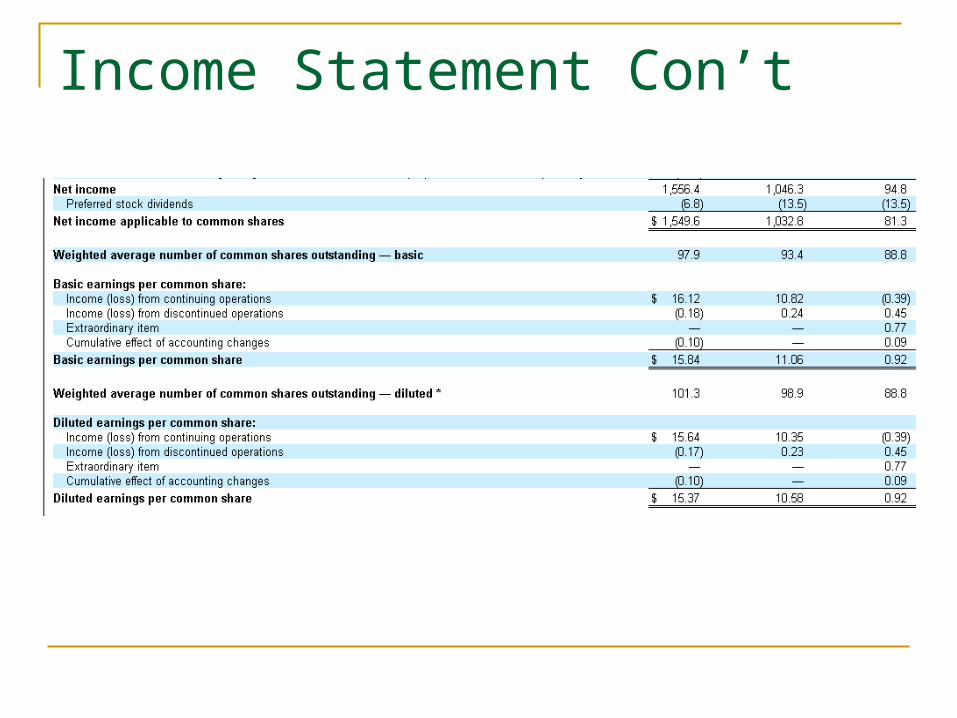
Income Statement Con’t
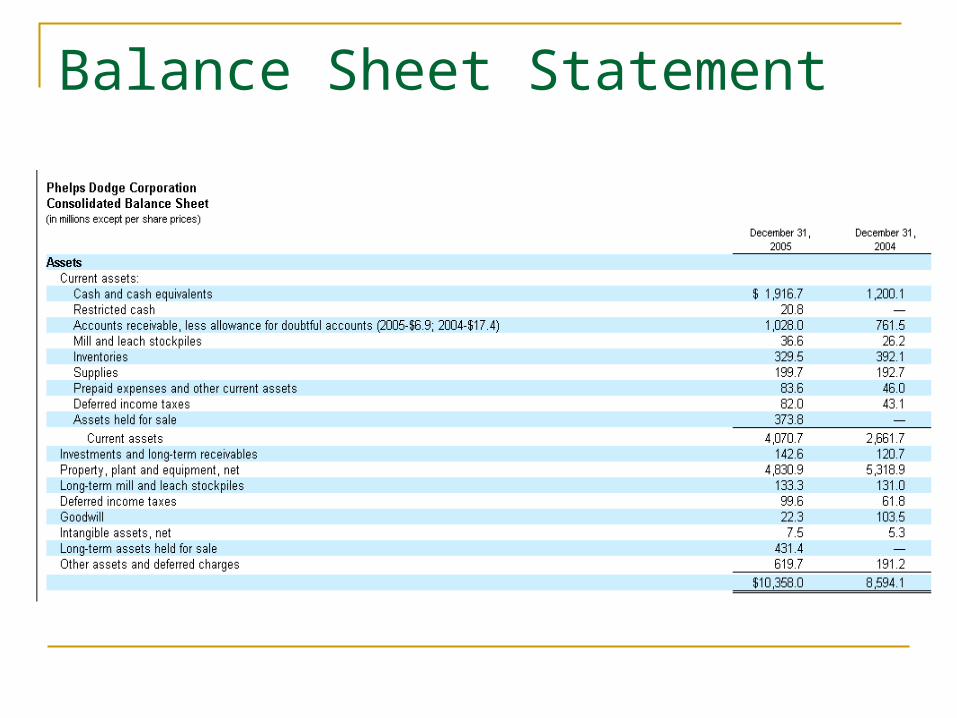
Balance Sheet Statement
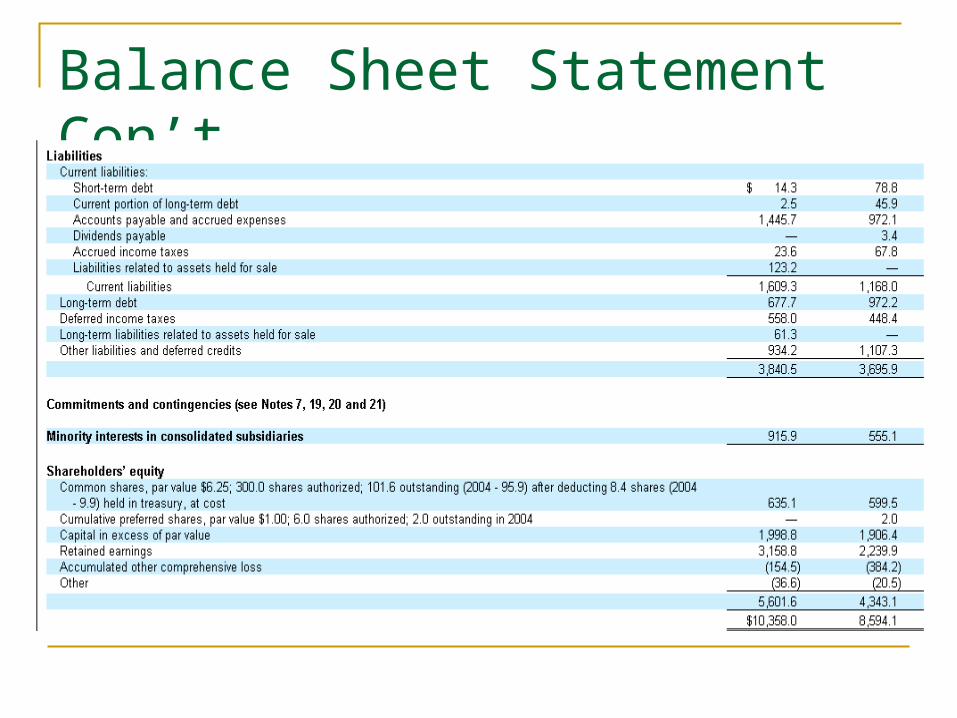
Balance Sheet Statement Con’t
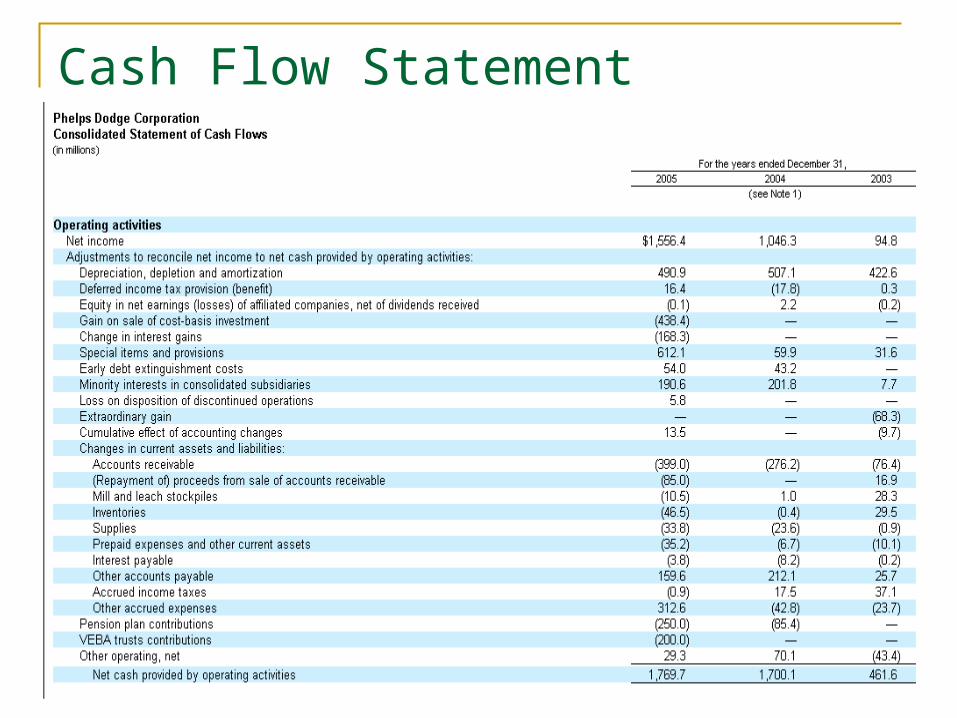
Cash Flow Statement
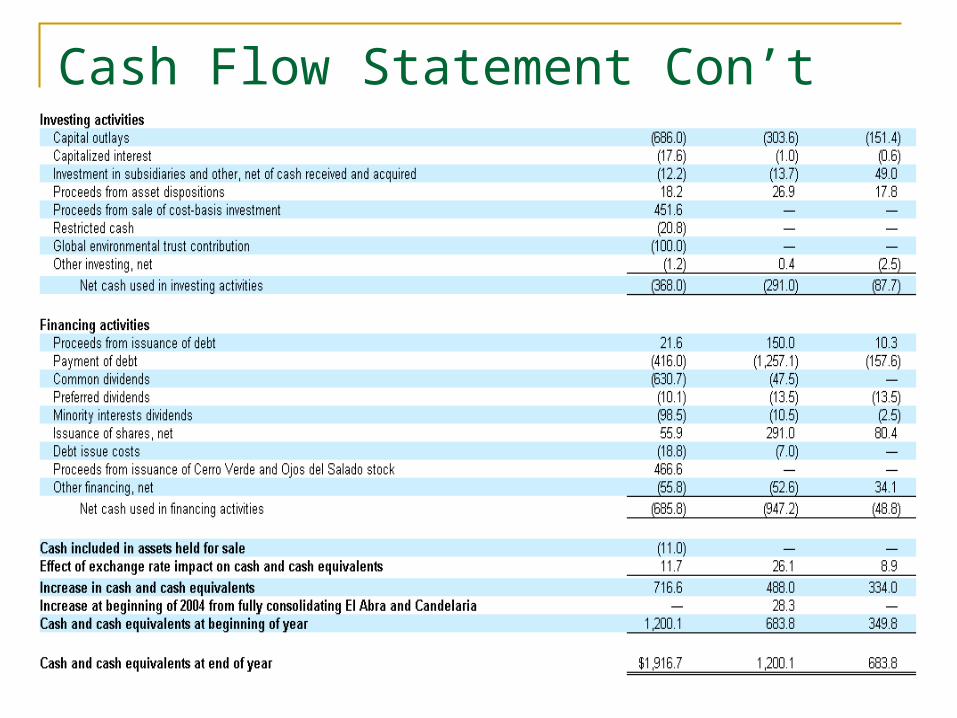
Cash Flow Statement Con’t
Evaluation Dimensions
Sale and Competition 2006’s Copper Price Cost Factor Level of recoverable reserves Financial Strength $ Profitability Net cash position
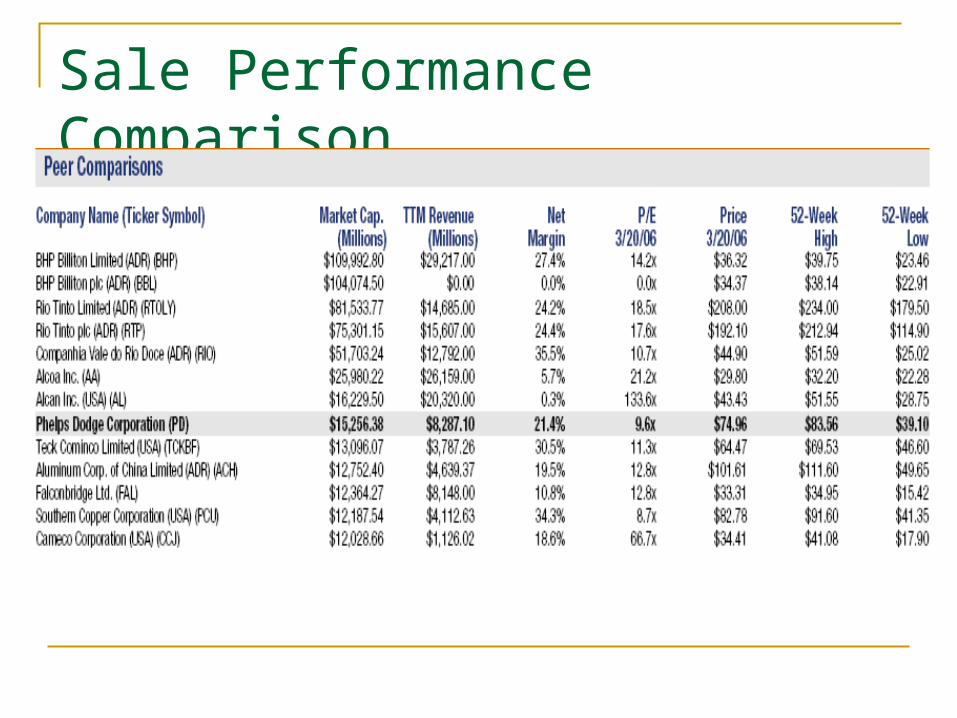
Sale Performance Comparison
Copper price
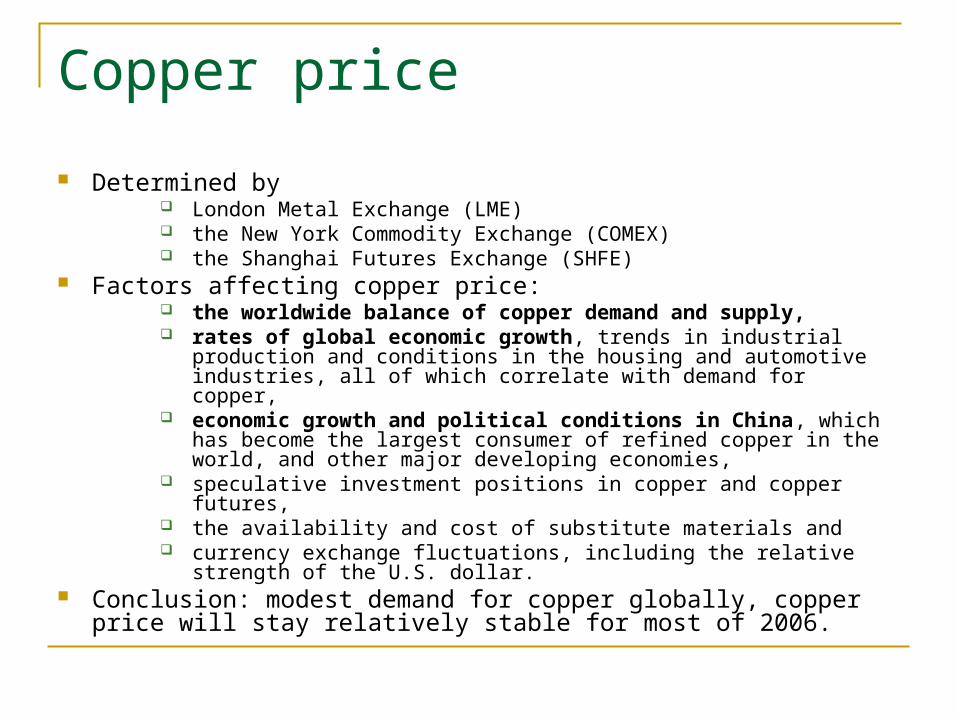
Determined by London Metal Exchange (LME) the New York Commodity Exchange (COMEX) the Shanghai Futures Exchange (SHFE)
Factors affecting copper price: the worldwide balance of copper demand and supply, rates of global economic growth, trends in industrial production and
conditions in the housing and automotive industries, all of which correlate with demand for copper,
economic growth and political conditions in China, which has become the largest consumer of refined copper in the world, and other major developing economies,
speculative investment positions in copper and copper futures, the availability and cost of substitute materials and currency exchange fluctuations, including the relative strength of the U.S.
dollar. Conclusion: modest demand for copper globally, copper price will stay
relatively stable for most of 2006.
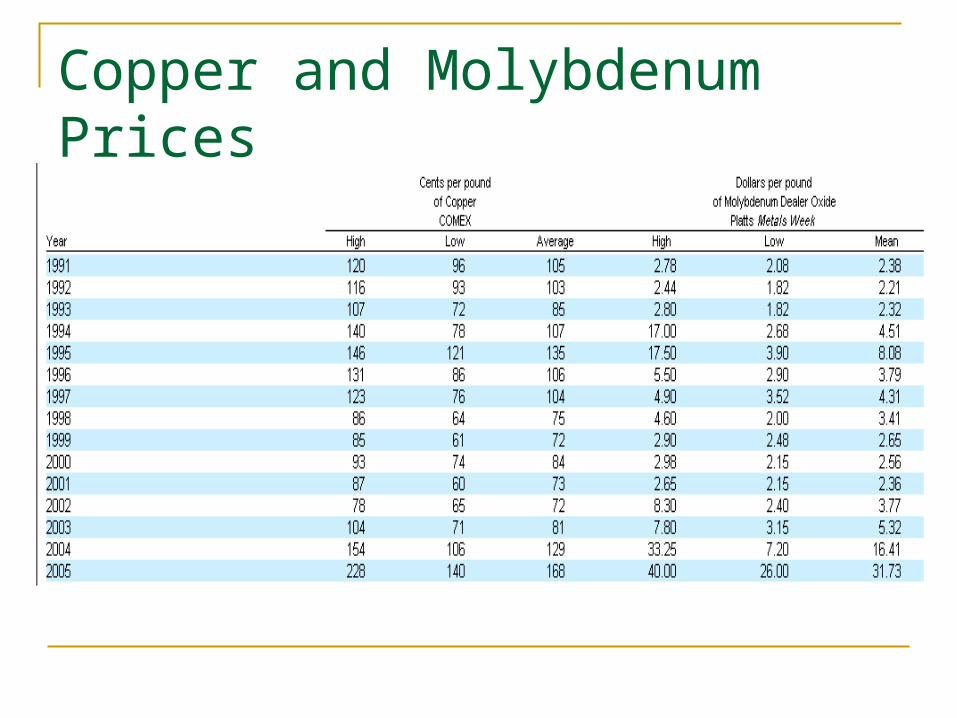
Copper and Molybdenum Prices
Production Cost
High energy cost: diesel fuel, natural gas, electricity, and purchased petroleum.
High copper production cost Mine closure also incurred large loss
Recoverable reserves
Levels of Ore Reserves and Mill and Leach Stockpiles Are Subject to Uncertainty and PD’s Ability to Replenish Ore Reserves Is Important for Long-Term Viability
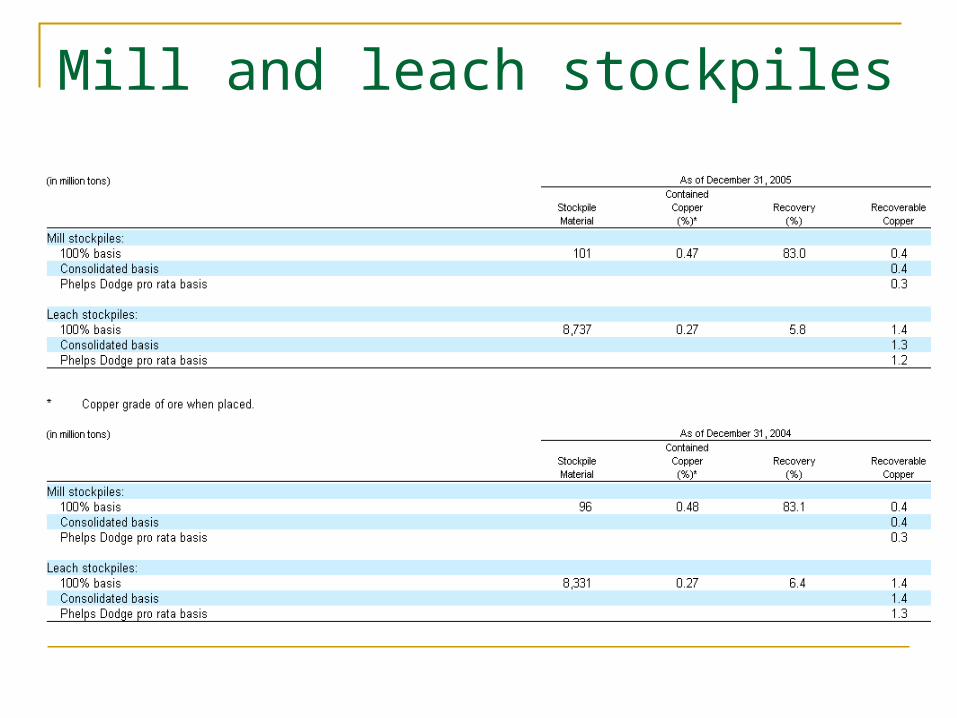
Mill and leach stockpiles
Mill Stockpiles & Leach stockpiles Mill stockpiles contain low-grade ore that has been
extracted from the mine and is available for processing to recover the contained copper by milling, concentrating, smelting and refining, or alternatively, by concentrate leaching.
Leach stockpiles contain low-grade ore that has been extracted from the mine and is available for processing to recover the contained copper through a leaching process. Leach stockpiles are exposed to acidic solutions that dissolve contained copper and deliver the copper in solution to the extraction processing facilities.
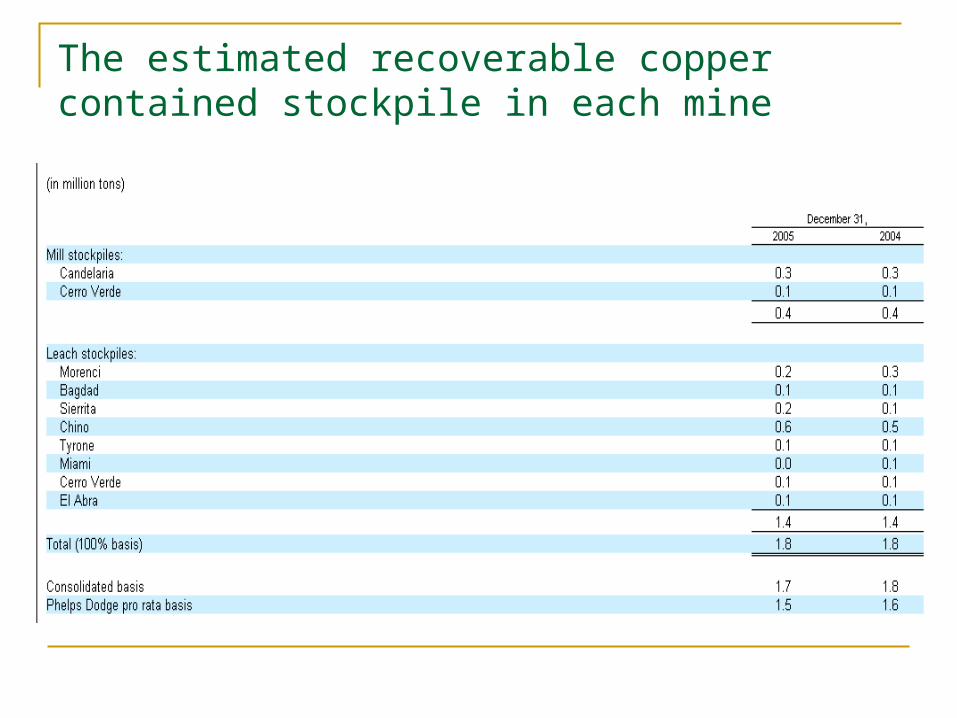
The estimated recoverable copper contained stockpile in each mine
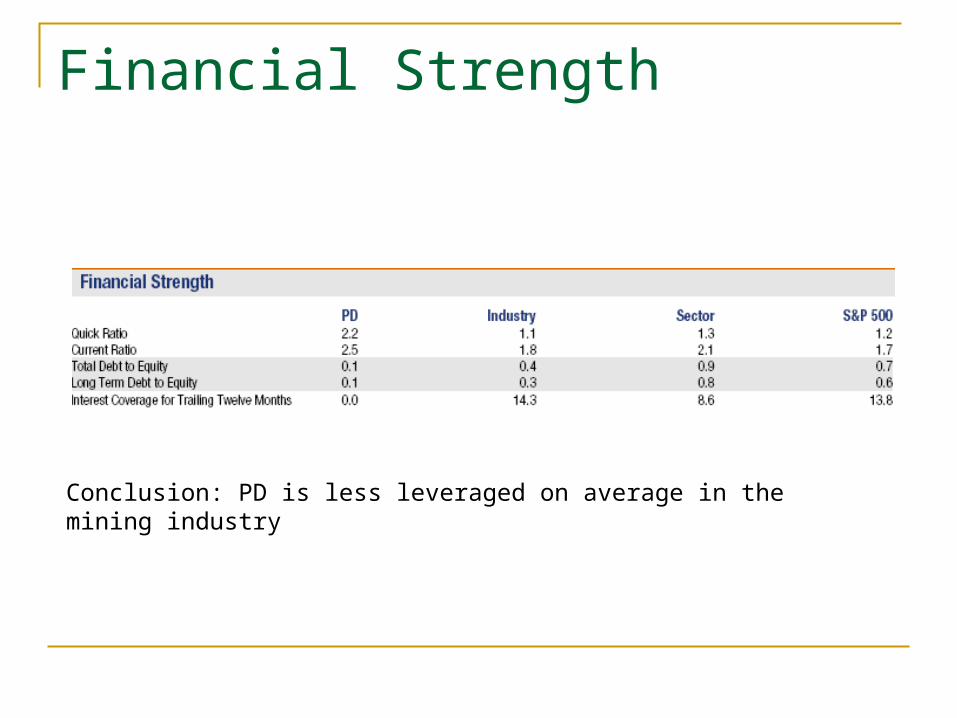
Financial Strength
Conclusion: PD is less leveraged on average in the mining industry
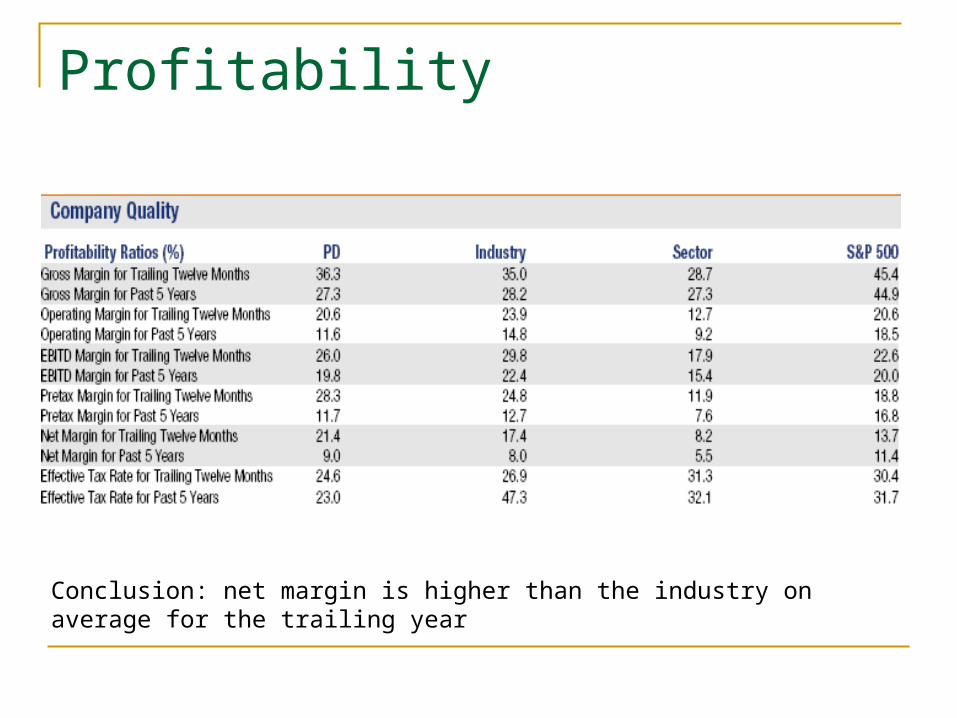
Profitability
Conclusion: net margin is higher than the industry on average for the trailing year
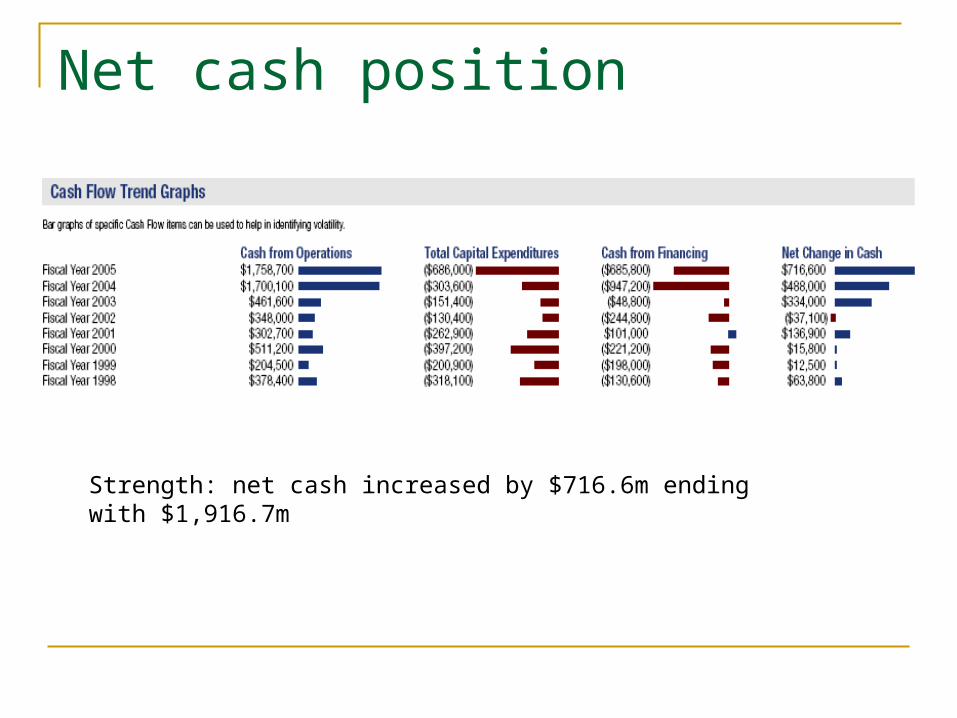
Net cash position
Strength: net cash increased by $716.6m ending with $1,916.7m
Recommendation
Short term: Hold
Long term: Sell
Section AgendaSection Agenda
Corporate ProfileCorporate Profile Stock PerformanceStock Performance Management Management Recent HistoryRecent History Competitive StrategyCompetitive Strategy Uranium OverviewUranium Overview Industry Competitors/ PositioningIndustry Competitors/ Positioning
Section AgendaSection Agenda
Core Business Properties: Uranium Core Business Properties: Uranium productionproduction
Diversified operationsDiversified operations Reserves and ResourcesReserves and Resources Segmented performance/ CAPEXSegmented performance/ CAPEX Financial statementsFinancial statements Evaluation MetricsEvaluation Metrics Recommendations/ConclusionsRecommendations/Conclusions

Corporate ProfileCorporate Profile Created Created 19881988 by the merger of two Crown by the merger of two Crown
corporations—Saskatchewan Mining Development corporations—Saskatchewan Mining Development Corporation and Eldorado Nuclear Limited. Corporation and Eldorado Nuclear Limited.
Worlds largest low cost uranium production Worlds largest low cost uranium production companycompany
Core businesses: Core businesses: Uranium production 20% of world supplyUranium production 20% of world supply Conversion services Conversion services Nuclear electricity generation, Nuclear electricity generation, Gold miningGold mining
Market Capitalization: $7.316 Billion (CAD)Market Capitalization: $7.316 Billion (CAD) Listings: Listings:
• Common Stock TSX (CCO), NYSE(CCJ)Common Stock TSX (CCO), NYSE(CCJ)• Convertible Debentures (Toronto) CCO.DBConvertible Debentures (Toronto) CCO.DB
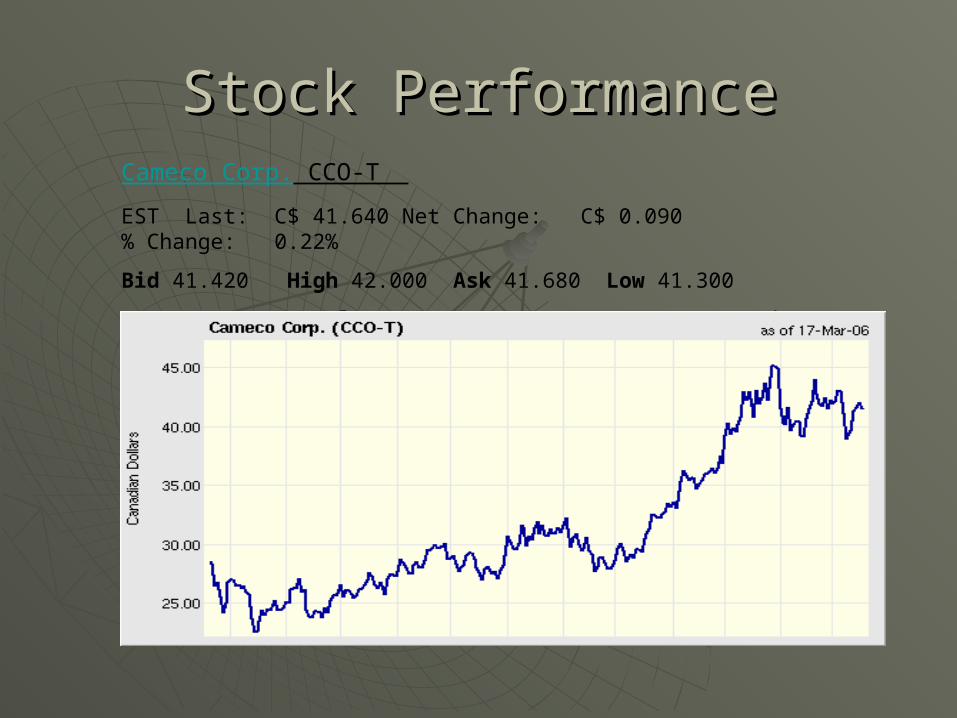
Stock PerformanceStock PerformanceCameco Corp. CCO-T
EST Last: C$ 41.640 Net Change: C$ 0.090 % Change: 0.22%
Bid 41.420 High 42.000 Ask 41.680 Low 41.300
EPS 1.26 Volume 1,272,811 P/E 33.00 52-Week High 46.820
Indicated Annual Div. 0.16 52-Week Low 22.325 Yield 0.39
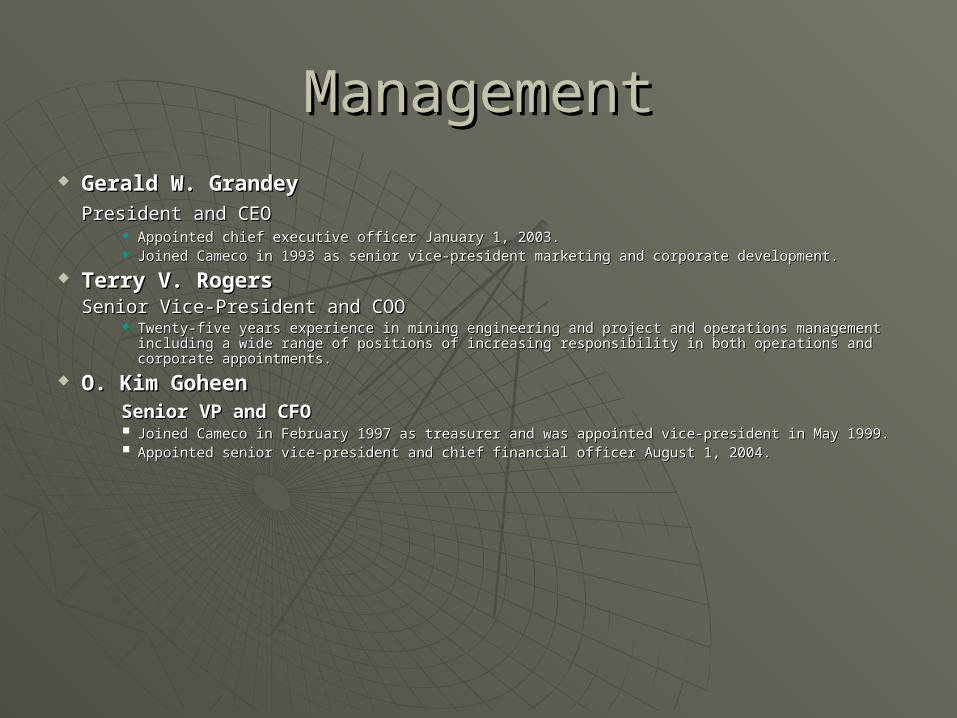
ManagementManagement Gerald W. GrandeyGerald W. Grandey
President and CEOPresident and CEO Appointed chief executive officer January 1, 2003. Appointed chief executive officer January 1, 2003. Joined Cameco in 1993 as senior vice-president marketing and corporate development.Joined Cameco in 1993 as senior vice-president marketing and corporate development.
Terry V. RogersTerry V. RogersSenior Vice-President and COOSenior Vice-President and COO
Twenty-five years experience in mining engineering and project and operations management Twenty-five years experience in mining engineering and project and operations management including a wide range of positions of increasing responsibility in both operations and corporate including a wide range of positions of increasing responsibility in both operations and corporate appointments. appointments.
O. Kim Goheen O. Kim Goheen Senior VP and CFOSenior VP and CFO
Joined Cameco in February 1997 as treasurer and was appointed vice-president in May 1999.Joined Cameco in February 1997 as treasurer and was appointed vice-president in May 1999. Appointed senior vice-president and chief financial officer August 1, 2004.Appointed senior vice-president and chief financial officer August 1, 2004.
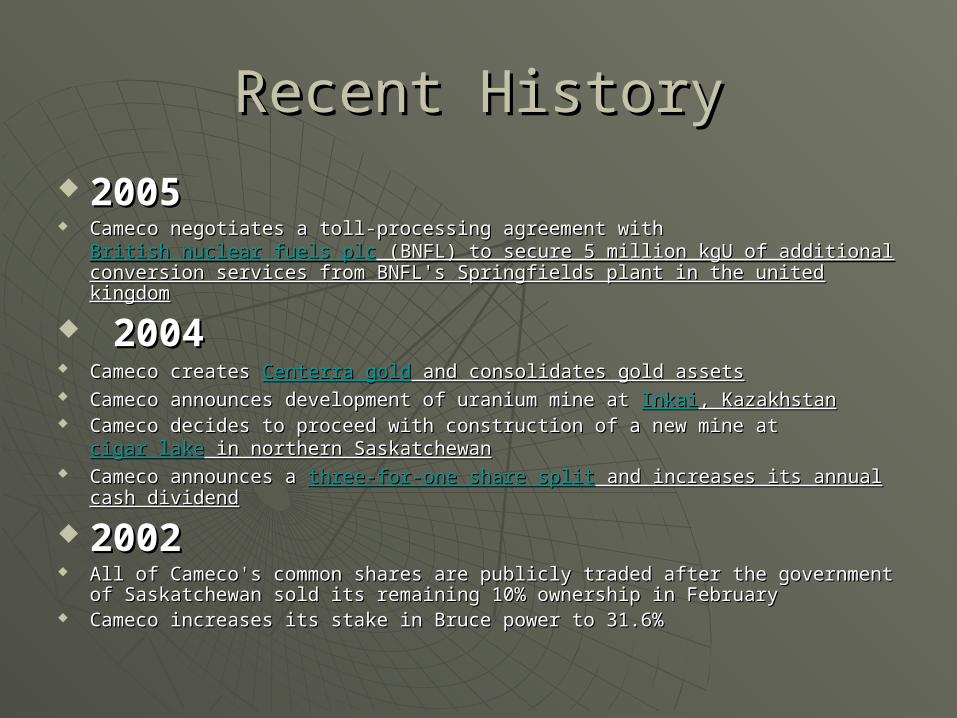
Recent HistoryRecent History
20052005 Cameco negotiates a toll-processing agreement with Cameco negotiates a toll-processing agreement with
British nuclear fuels plcBritish nuclear fuels plc (BNFL) to secure 5 million kgU of additional (BNFL) to secure 5 million kgU of additional conversion services from BNFL's Springfields plant in the united kingdomconversion services from BNFL's Springfields plant in the united kingdom
20042004 Cameco creates Cameco creates Centerra goldCenterra gold and consolidates gold assets and consolidates gold assets Cameco announces development of uranium mine at Cameco announces development of uranium mine at InkaiInkai, Kazakhstan, Kazakhstan Cameco decides to proceed with construction of a new mine at Cameco decides to proceed with construction of a new mine at cigar lakecigar lake in in
northern Saskatchewannorthern Saskatchewan Cameco announces a Cameco announces a three-for-one share splitthree-for-one share split and increases its annual and increases its annual
cash dividendcash dividend
20022002 All of Cameco's common shares are publicly traded after the government All of Cameco's common shares are publicly traded after the government
of Saskatchewan sold its remaining 10% ownership in Februaryof Saskatchewan sold its remaining 10% ownership in February Cameco increases its stake in Bruce power to 31.6%Cameco increases its stake in Bruce power to 31.6%
Competitive StrategyCompetitive Strategy
““..Simply stated it is our objective to be ..Simply stated it is our objective to be involved in involved in every stage of the every stage of the nuclear fuel cyclenuclear fuel cycle…from exploring …from exploring for, and extracting the raw uranium for, and extracting the raw uranium ore…to conversion to a purer product…ore…to conversion to a purer product…to further upgrading enrichment…to to further upgrading enrichment…to manufacturing fuel rods…and, finally, manufacturing fuel rods…and, finally, to the generation of nuclear electricity.” to the generation of nuclear electricity.” Jerry Grandey President & CEO Jerry Grandey President & CEO
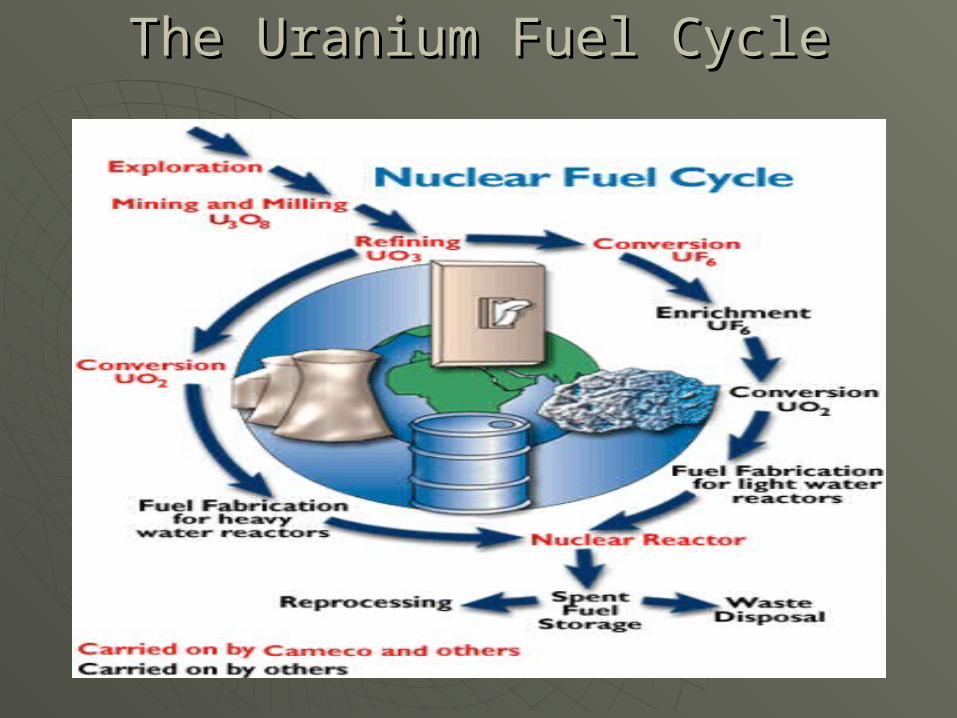
The Uranium Fuel CycleThe Uranium Fuel Cycle
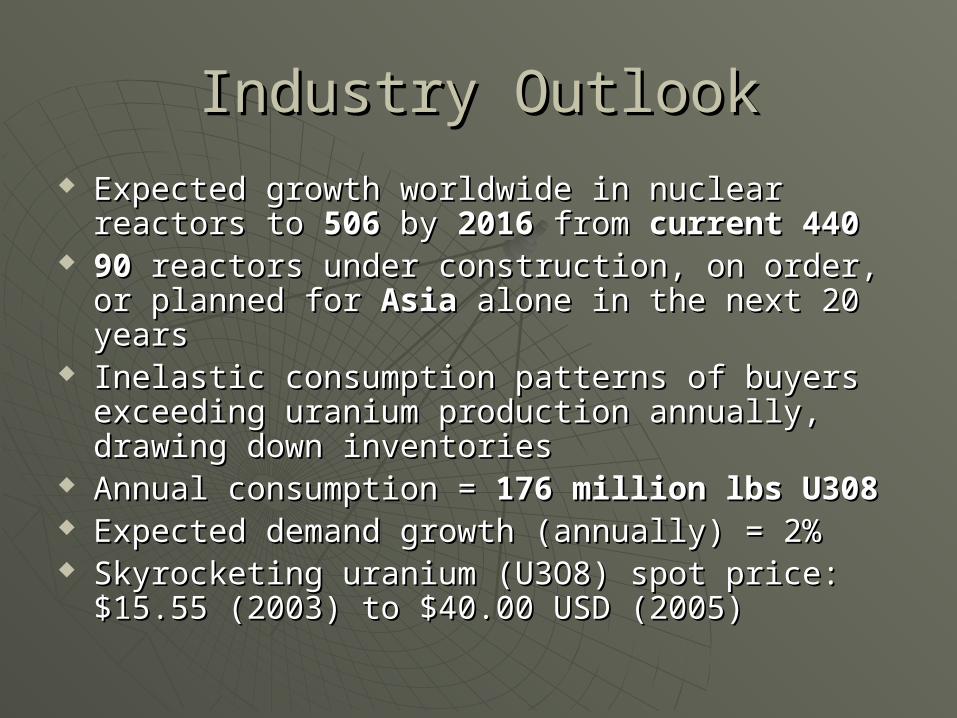
Industry OutlookIndustry Outlook Expected growth worldwide in nuclear reactors to Expected growth worldwide in nuclear reactors to
506 506 by by 2016 2016 from from current 440current 440 9090 reactors under construction, on order, or reactors under construction, on order, or
planned for planned for AsiaAsia alone in the next 20 years alone in the next 20 years Inelastic consumption patterns of buyers Inelastic consumption patterns of buyers
exceeding uranium production annually, drawing exceeding uranium production annually, drawing down inventoriesdown inventories
Annual consumption = Annual consumption = 176 million lbs U308176 million lbs U308 Expected demand growth (annually) = 2%Expected demand growth (annually) = 2% Skyrocketing uranium (U3O8) spot price: $15.55 Skyrocketing uranium (U3O8) spot price: $15.55
(2003) to $40.00 USD (2005)(2003) to $40.00 USD (2005)
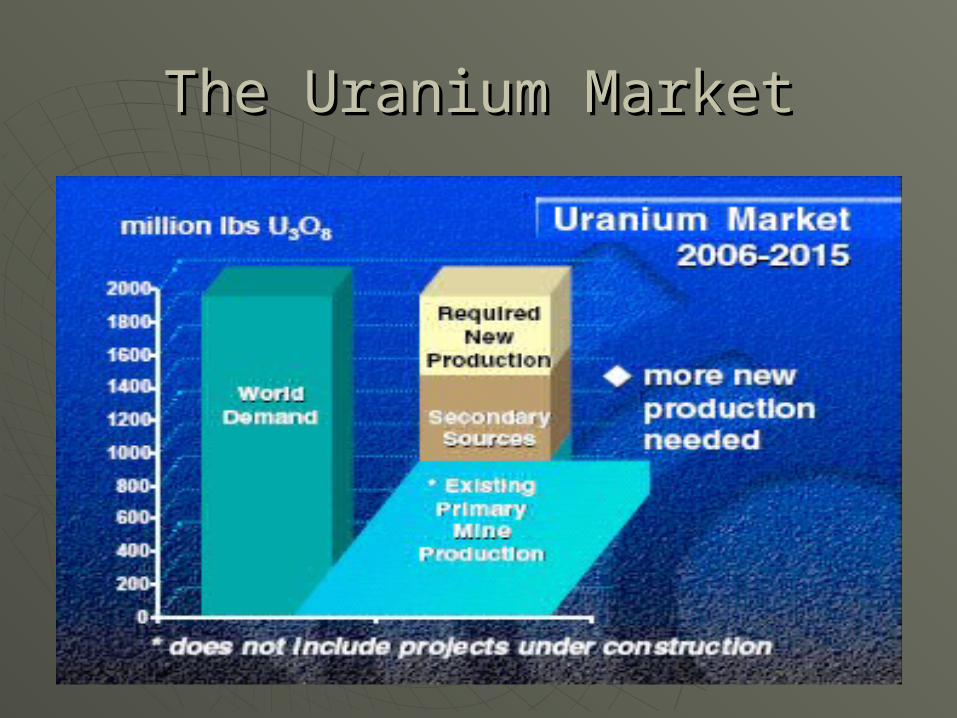
The Uranium MarketThe Uranium Market
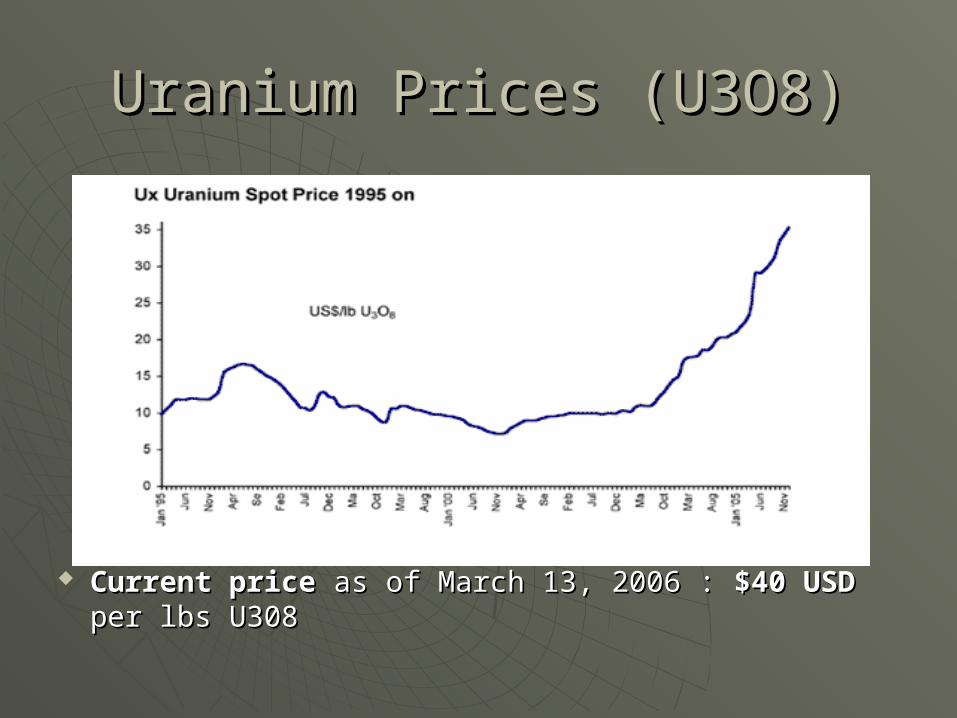
Uranium Prices (U3O8)Uranium Prices (U3O8)
Current priceCurrent price as of March 13, 2006 : as of March 13, 2006 : $40 USD$40 USD per per lbs U308lbs U308
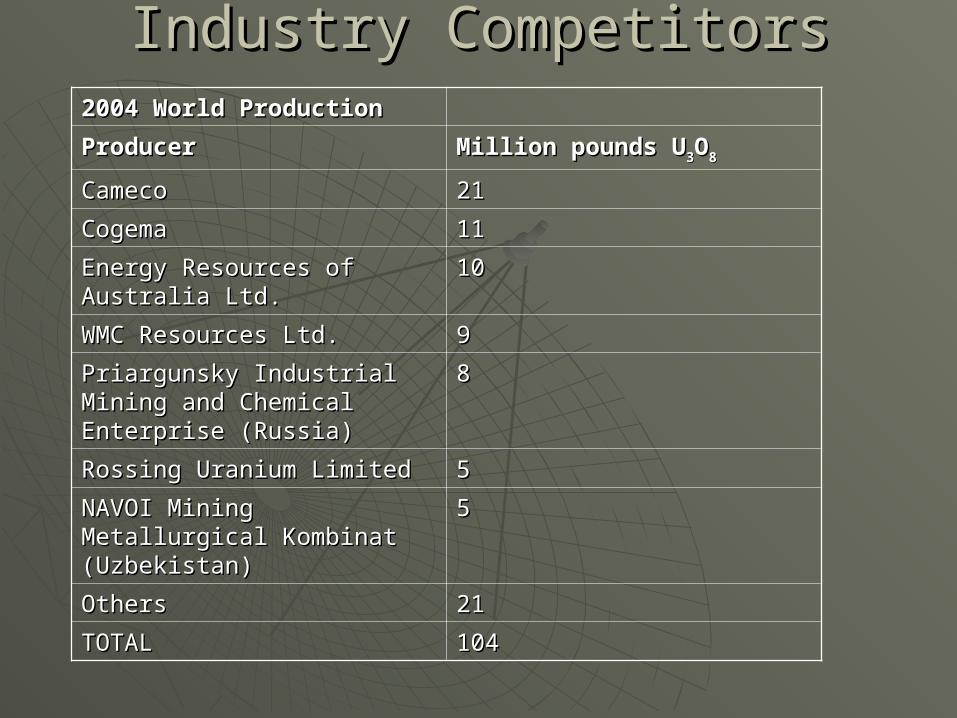
Industry CompetitorsIndustry Competitors2004 World Production 2004 World Production
Producer Producer Million pounds UMillion pounds U33OO88
CamecoCameco 2121
CogemaCogema 1111
Energy Resources of Energy Resources of Australia Ltd.Australia Ltd.
1010
WMC Resources Ltd.WMC Resources Ltd. 99
Priargunsky Industrial Mining Priargunsky Industrial Mining and Chemical Enterprise and Chemical Enterprise (Russia)(Russia)
88
Rossing Uranium LimitedRossing Uranium Limited 55
NAVOI Mining Metallurgical NAVOI Mining Metallurgical Kombinat (Uzbekistan)Kombinat (Uzbekistan)
55
OthersOthers 2121
TOTALTOTAL 104104
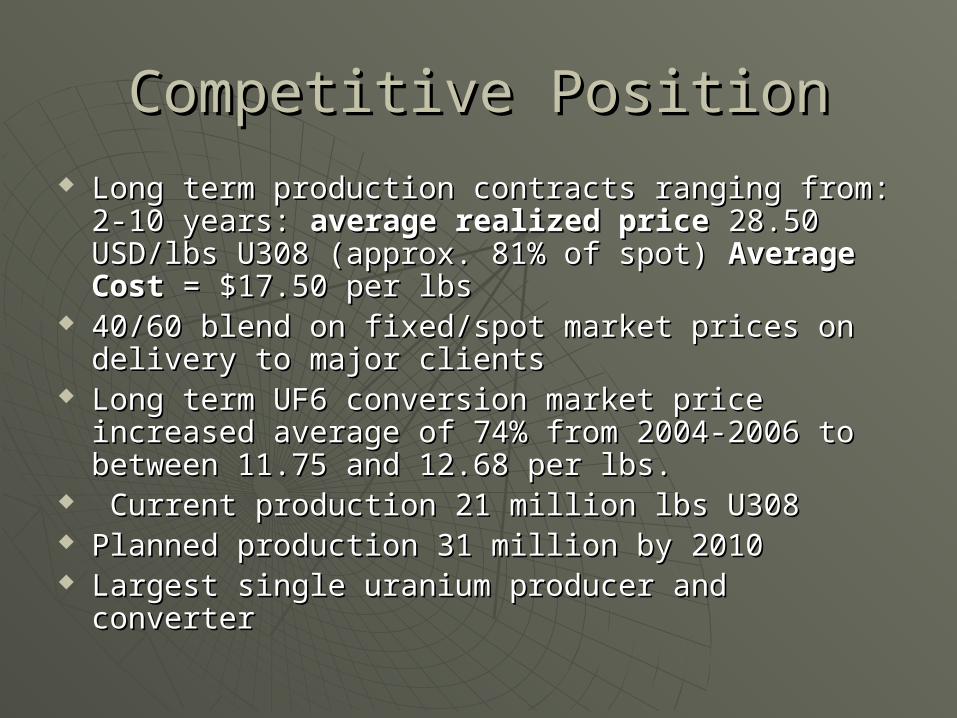
Competitive PositionCompetitive Position Long term production contracts ranging from: 2-Long term production contracts ranging from: 2-
10 years: 10 years: average realized priceaverage realized price 28.50 USD/lbs 28.50 USD/lbs U308 (approx. 81% of spot) U308 (approx. 81% of spot) Average CostAverage Cost = = $17.50 per lbs$17.50 per lbs
40/60 blend on fixed/spot market prices on 40/60 blend on fixed/spot market prices on delivery to major clientsdelivery to major clients
Long term UF6 conversion market price increased Long term UF6 conversion market price increased average of 74% from 2004-2006 to between average of 74% from 2004-2006 to between 11.75 and 12.68 per lbs.11.75 and 12.68 per lbs.
Current production 21 million lbs U308Current production 21 million lbs U308 Planned production 31 million by 2010Planned production 31 million by 2010 Largest single uranium producer and converterLargest single uranium producer and converter
Core Business: Uranium ProductionCore Business: Uranium Production
Uranium PropertiesUranium Properties• MacArthur RiverMacArthur River• Cigar LakeCigar Lake• Key LakeKey Lake• Rabbit LakeRabbit Lake• Crowe ButteCrowe Butte• Smith Ranch HighlandSmith Ranch Highland• InkaiInkai
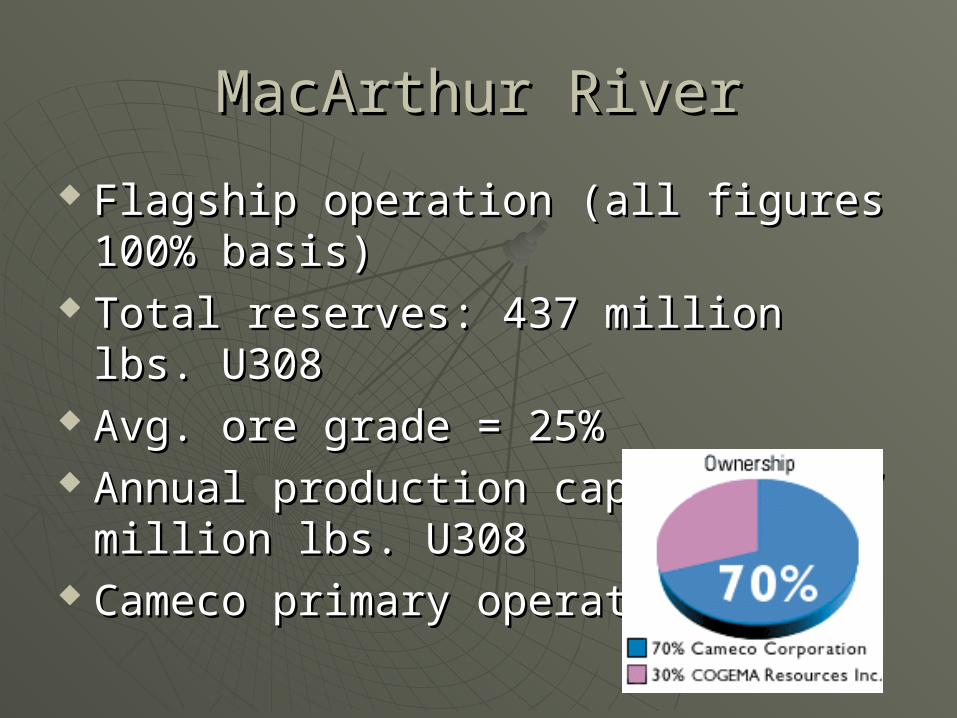
MacArthur RiverMacArthur River
Flagship operation (all figures 100% Flagship operation (all figures 100% basis)basis)
Total reserves: 437 million lbs. U308Total reserves: 437 million lbs. U308 Avg. ore grade = 25%Avg. ore grade = 25% Annual production capacity 18.7 Annual production capacity 18.7
million lbs. U308million lbs. U308 Cameco primary operator Cameco primary operator
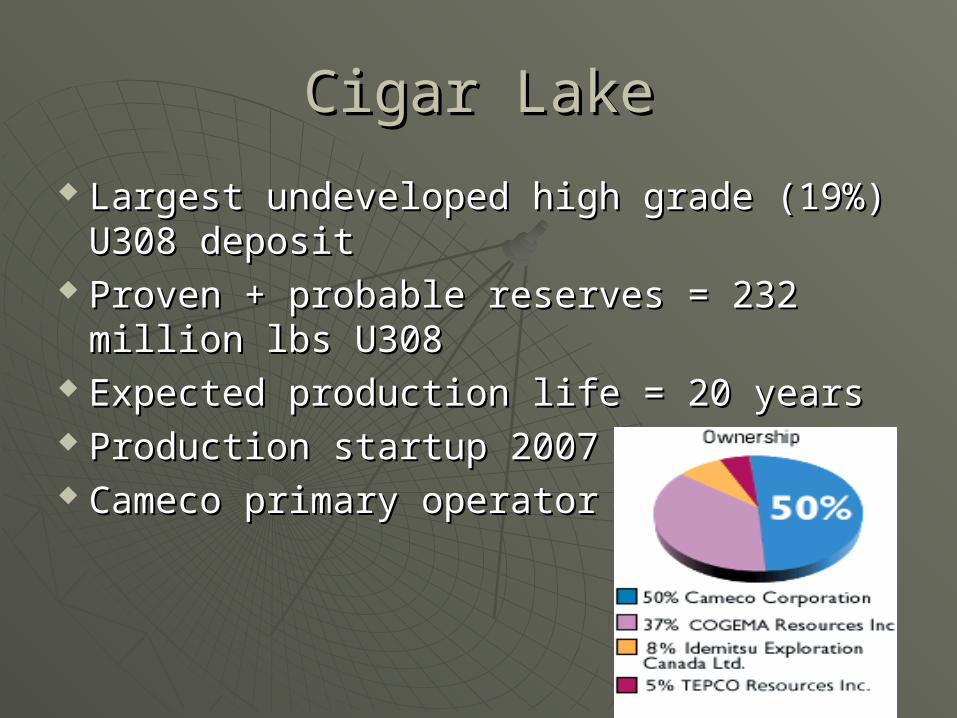
Cigar LakeCigar Lake
Largest undeveloped high grade (19%) Largest undeveloped high grade (19%) U308 depositU308 deposit
Proven + probable reserves = 232 million Proven + probable reserves = 232 million lbs U308lbs U308
Expected production life = 20 yearsExpected production life = 20 years Production startup 2007Production startup 2007 Cameco primary operatorCameco primary operator
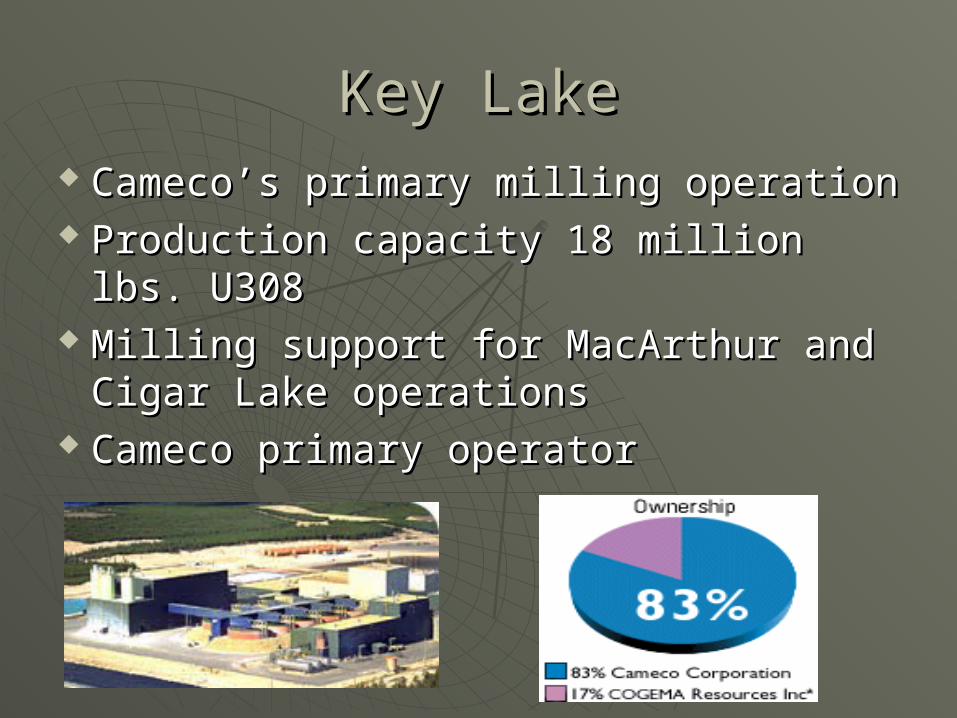
Key LakeKey Lake Cameco’s primary milling operationCameco’s primary milling operation Production capacity 18 million lbs. Production capacity 18 million lbs.
U308U308 Milling support for MacArthur and Milling support for MacArthur and
Cigar Lake operationsCigar Lake operations Cameco primary operatorCameco primary operator
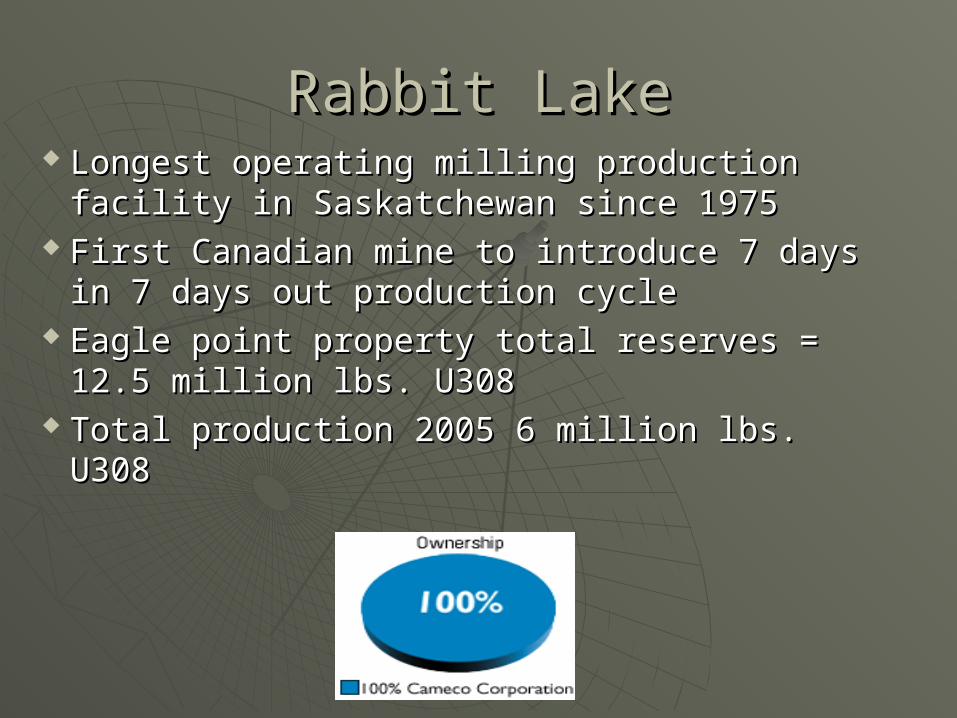
Rabbit LakeRabbit Lake Longest operating milling production Longest operating milling production
facility in Saskatchewan since 1975facility in Saskatchewan since 1975 First Canadian mine to introduce 7 days in First Canadian mine to introduce 7 days in
7 days out production cycle7 days out production cycle Eagle point property total reserves = 12.5 Eagle point property total reserves = 12.5
million lbs. U308million lbs. U308 Total production 2005 6 million lbs. U308Total production 2005 6 million lbs. U308
Crowe Butte/ Smith Highland Crowe Butte/ Smith Highland RanchRanch
United States uranium operations: United States uranium operations: total annual production = 3.1 million total annual production = 3.1 million lbs. U308lbs. U308
Total reserves proven + probable = Total reserves proven + probable = 24.9 million lbs. U30824.9 million lbs. U308
Both properties use (ISL) In situ leach Both properties use (ISL) In situ leach for extractionfor extraction
Cameco 100% operatorCameco 100% operator
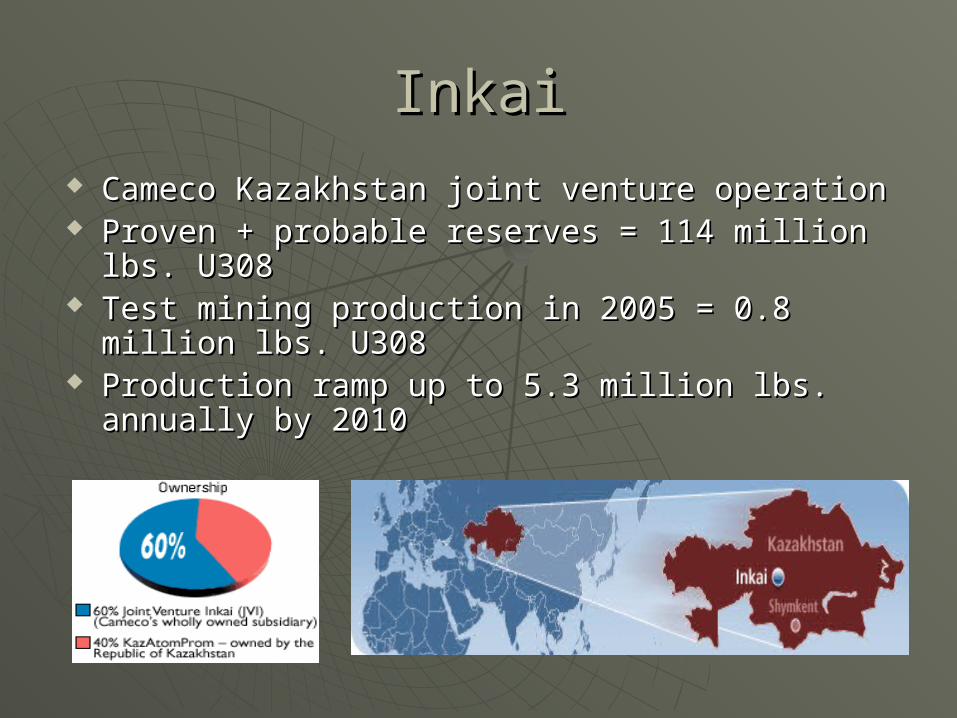
InkaiInkai Cameco Kazakhstan joint venture operationCameco Kazakhstan joint venture operation Proven + probable reserves = 114 million lbs. Proven + probable reserves = 114 million lbs.
U308U308 Test mining production in 2005 = 0.8 million lbs. Test mining production in 2005 = 0.8 million lbs.
U308U308 Production ramp up to 5.3 million lbs. annually by Production ramp up to 5.3 million lbs. annually by
20102010
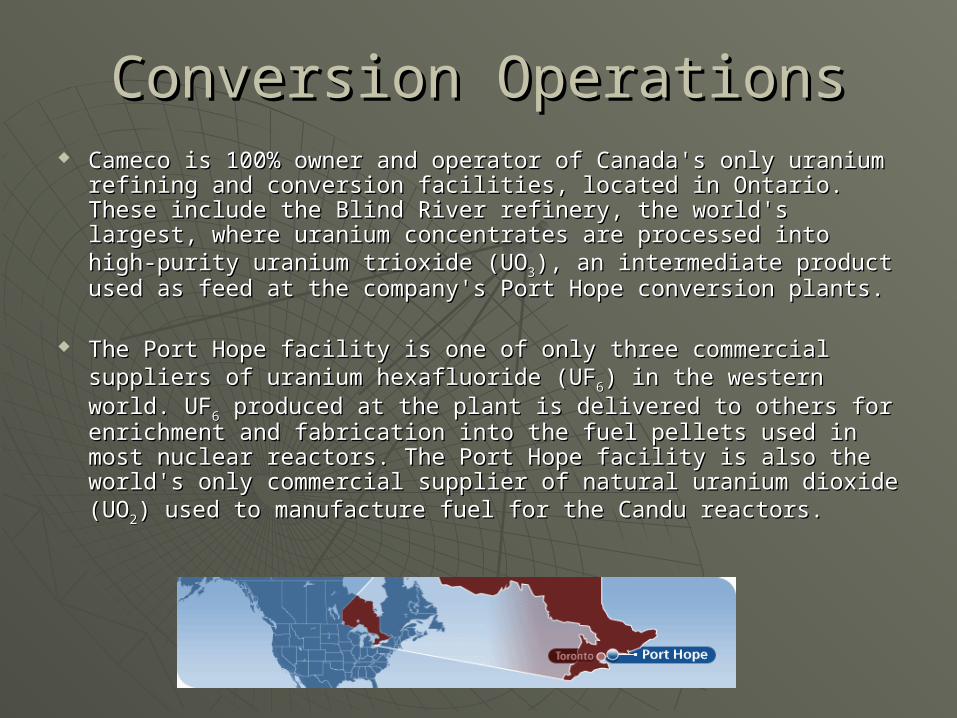
Conversion OperationsConversion Operations Cameco is 100% owner and operator of Canada's only Cameco is 100% owner and operator of Canada's only
uranium refining and conversion facilities, located in Ontario. uranium refining and conversion facilities, located in Ontario. These include the Blind River refinery, the world's largest, These include the Blind River refinery, the world's largest, where uranium concentrates are processed into high-purity where uranium concentrates are processed into high-purity uranium trioxide (UOuranium trioxide (UO33), an intermediate product used as feed ), an intermediate product used as feed at the company's Port Hope conversion plants. at the company's Port Hope conversion plants.
The Port Hope facility is one of only three commercial The Port Hope facility is one of only three commercial suppliers of uranium hexafluoride (UFsuppliers of uranium hexafluoride (UF66) in the western world. ) in the western world. UFUF66 produced at the plant is delivered to others for produced at the plant is delivered to others for enrichment and fabrication into the fuel pellets used in most enrichment and fabrication into the fuel pellets used in most nuclear reactors. The Port Hope facility is also the world's nuclear reactors. The Port Hope facility is also the world's only commercial supplier of natural uranium dioxide (UOonly commercial supplier of natural uranium dioxide (UO22) ) used to manufacture fuel for the Candu reactors.used to manufacture fuel for the Candu reactors.
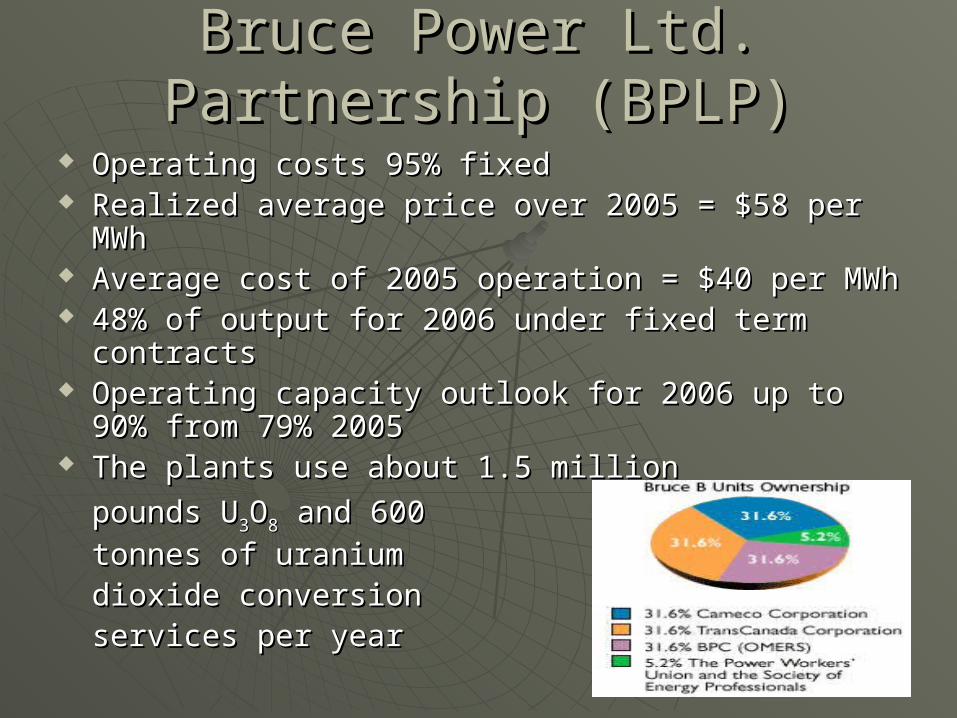
Bruce Power Ltd. Partnership Bruce Power Ltd. Partnership (BPLP)(BPLP)
Operating costs 95% fixedOperating costs 95% fixed Realized average price over 2005 = $58 per MWhRealized average price over 2005 = $58 per MWh Average cost of 2005 operation = $40 per MWhAverage cost of 2005 operation = $40 per MWh 48% of output for 2006 under fixed term 48% of output for 2006 under fixed term
contractscontracts Operating capacity outlook for 2006 up to 90% Operating capacity outlook for 2006 up to 90%
from 79% 2005from 79% 2005 The plants use about 1.5 million The plants use about 1.5 million
pounds Upounds U33OO88 and 600 and 600 tonnes of uranium tonnes of uranium dioxide conversion dioxide conversion services per yearservices per year
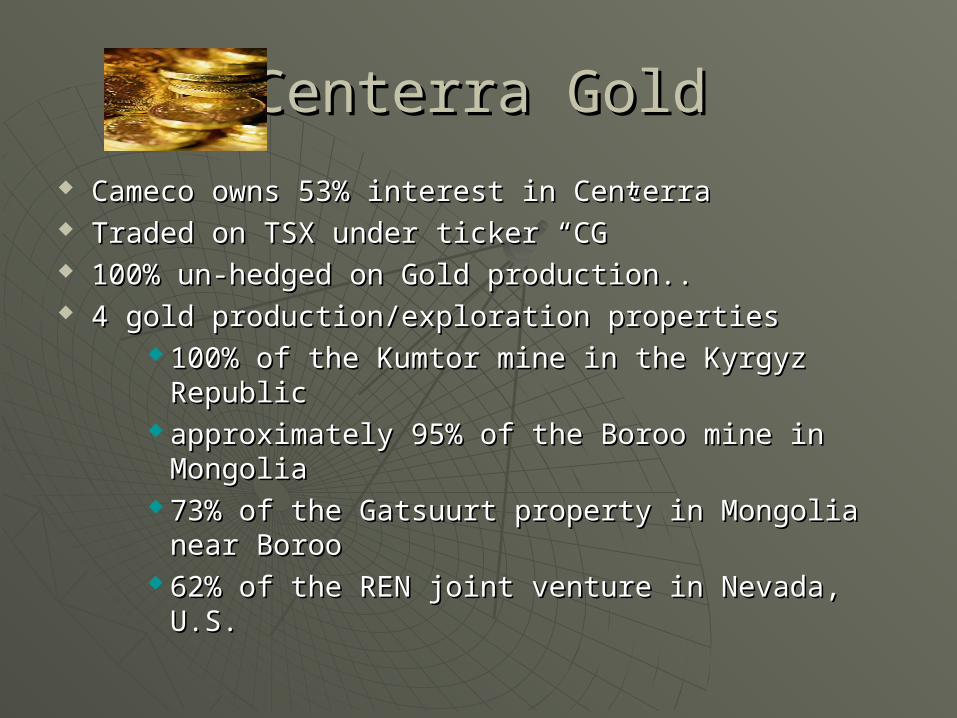
Centerra GoldCenterra Gold
Cameco owns 53% interest in CenterraCameco owns 53% interest in Centerra Traded on TSX under ticker “CG”Traded on TSX under ticker “CG” 100% un-hedged on Gold production..100% un-hedged on Gold production.. 4 gold production/exploration properties4 gold production/exploration properties
100% of the Kumtor mine in the Kyrgyz 100% of the Kumtor mine in the Kyrgyz Republic Republic
approximately 95% of the Boroo mine in approximately 95% of the Boroo mine in Mongolia Mongolia
73% of the Gatsuurt property in Mongolia near 73% of the Gatsuurt property in Mongolia near Boroo Boroo
62% of the REN joint venture in Nevada, U.S. 62% of the REN joint venture in Nevada, U.S.
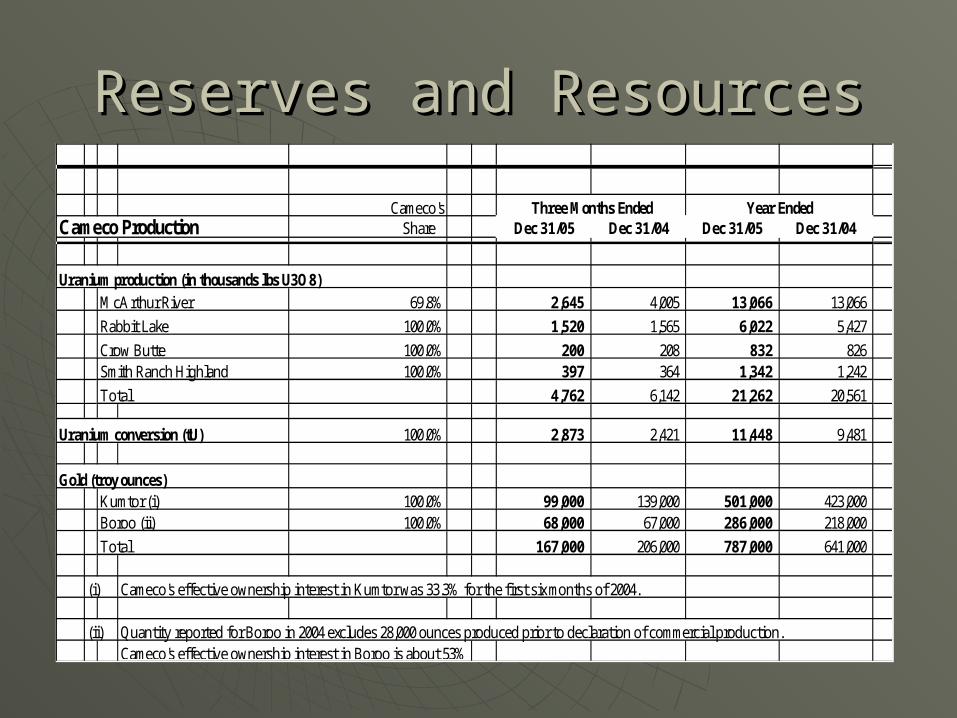
Reserves and ResourcesReserves and Resources
Cameco'sCameco Production Share Dec 31/05 Dec 31/04 Dec 31/05 Dec 31/04
Uranium production (in thousands lbs U3O8)
McArthur River 69.8% 2,645 4,005 13,066 13,066
Rabbit Lake 100.0% 1,520 1,565 6,022 5,427
Crow Butte 100.0% 200 208 832 826Smith Ranch Highland 100.0% 397 364 1,342 1,242
Total 4,762 6,142 21,262 20,561
Uranium conversion (tU) 100.0% 2,873 2,421 11,448 9,481
Gold (troy ounces)Kumtor (i) 100.0% 99,000 139,000 501,000 423,000Boroo (ii) 100.0% 68,000 67,000 286,000 218,000
Total 167,000 206,000 787,000 641,000
(i) Cameco's effective ownership interest in Kumtor was 33.3% for the first six months of 2004.
(ii) Quantity reported for Boroo in 2004 excludes 28,000 ounces produced prior to declaration of commercial production.Cameco's effective ownership interest in Boroo is about 53%.
Year EndedThree Months Ended
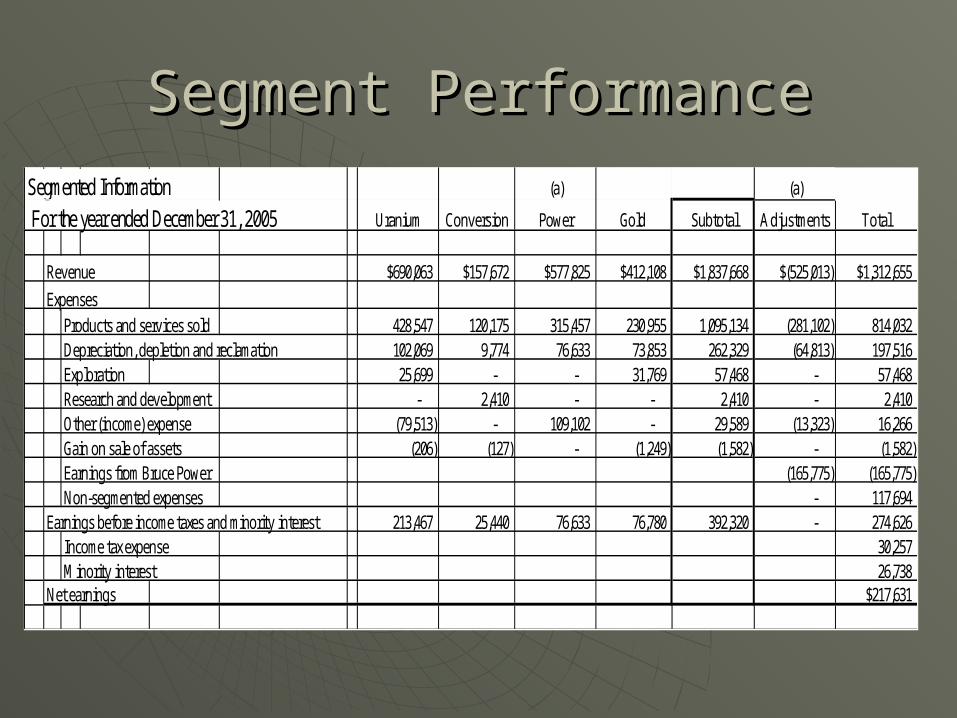
Segment PerformanceSegment PerformanceSegmented Information (a) (a)
For the year ended December 31, 2005 Uranium Conversion Power Gold Subtotal Adjustments Total
Revenue $690,063 $157,672 $577,825 $412,108 $1,837,668 $(525,013) $1,312,655
Expenses
Products and services sold 428,547 120,175 315,457 230,955 1,095,134 (281,102) 814,032 Depreciation, depletion and reclamation 102,069 9,774 76,633 73,853 262,329 (64,813) 197,516 Exploration 25,699 - - 31,769 57,468 - 57,468 Research and development - 2,410 - - 2,410 - 2,410 Other (income) expense (79,513) - 109,102 - 29,589 (13,323) 16,266 Gain on sale of assets (206) (127) - (1,249) (1,582) - (1,582) Earnings from Bruce Power (165,775) (165,775) Non-segmented expenses - 117,694
Earnings before income taxes and minority interest 213,467 25,440 76,633 76,780 392,320 - 274,626 Income tax expense 30,257 Minority interest 26,738
Net earnings $217,631
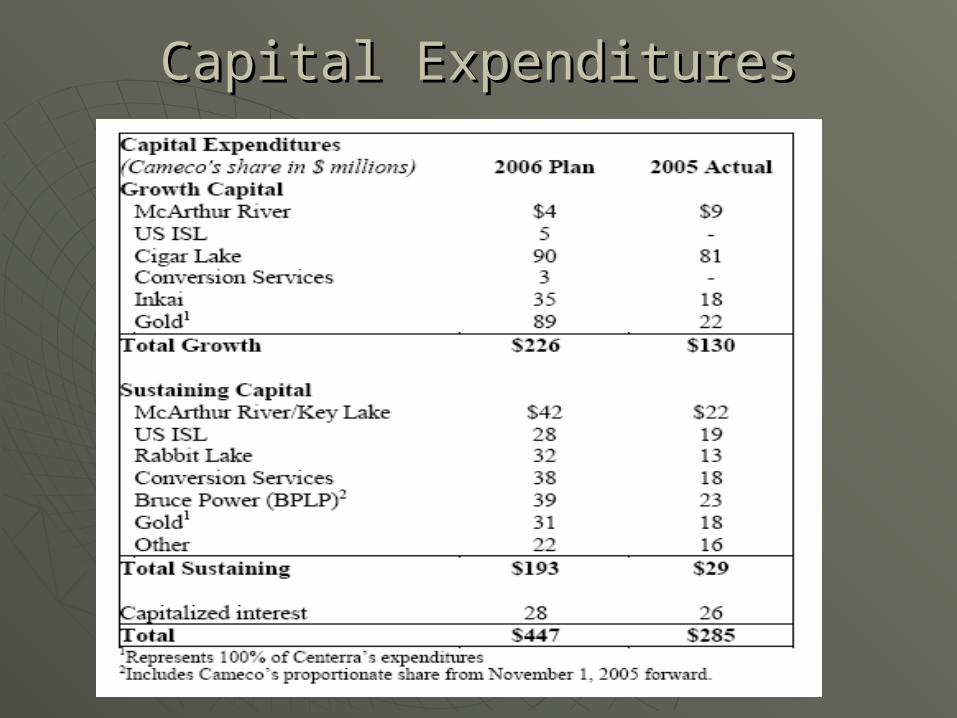
Capital ExpendituresCapital Expenditures
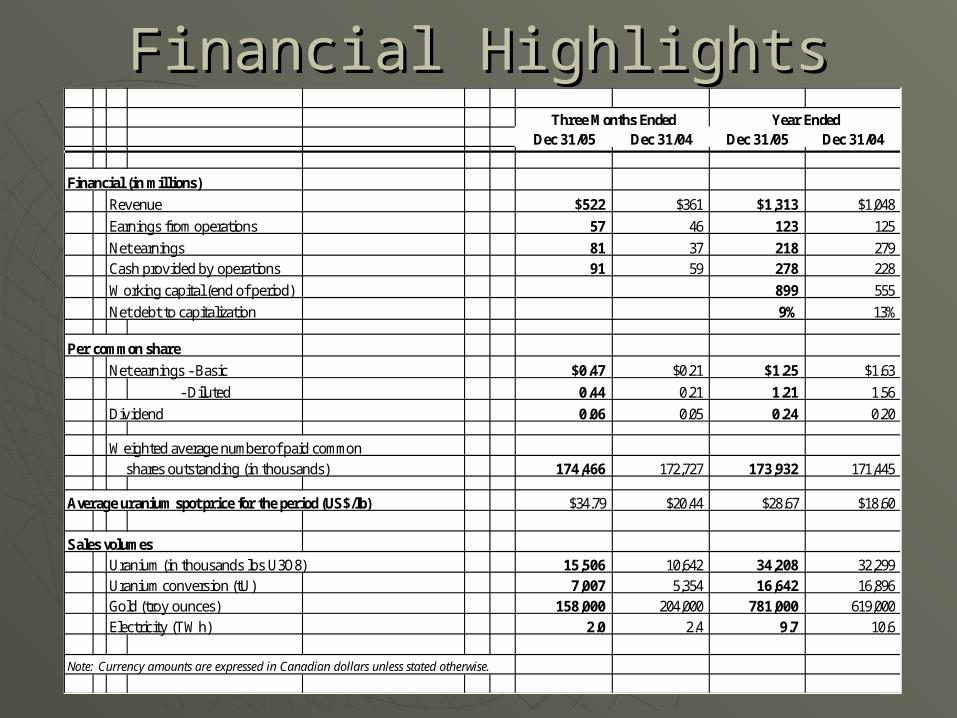
Financial HighlightsFinancial HighlightsDec 31/05 Dec 31/04 Dec 31/05 Dec 31/04
Financial (in millions)
Revenue $522 $361 $1,313 $1,048
Earnings from operations 57 46 123 125
Net earnings 81 37 218 279 Cash provided by operations 91 59 278 228
Working capital (end of period) 899 555
Net debt to capitalization 9% 13%
Per common share
Net earnings - Basic $0.47 $0.21 $1.25 $1.63
- Diluted 0.44 0.21 1.21 1.56
Dividend 0.06 0.05 0.24 0.20
Weighted average number of paid common shares outstanding (in thousands) 174,466 172,727 173,932 171,445
Average uranium spot price for the period (US$/lb) $34.79 $20.44 $28.67 $18.60
Sales volumesUranium (in thousands lbs U3O8) 15,506 10,642 34,208 32,299Uranium conversion (tU) 7,007 5,354 16,642 16,896Gold (troy ounces) 158,000 204,000 781,000 619,000Electricity (TWh) 2.0 2.4 9.7 10.6
Note: Currency amounts are expressed in Canadian dollars unless stated otherwise.
Year EndedThree Months Ended
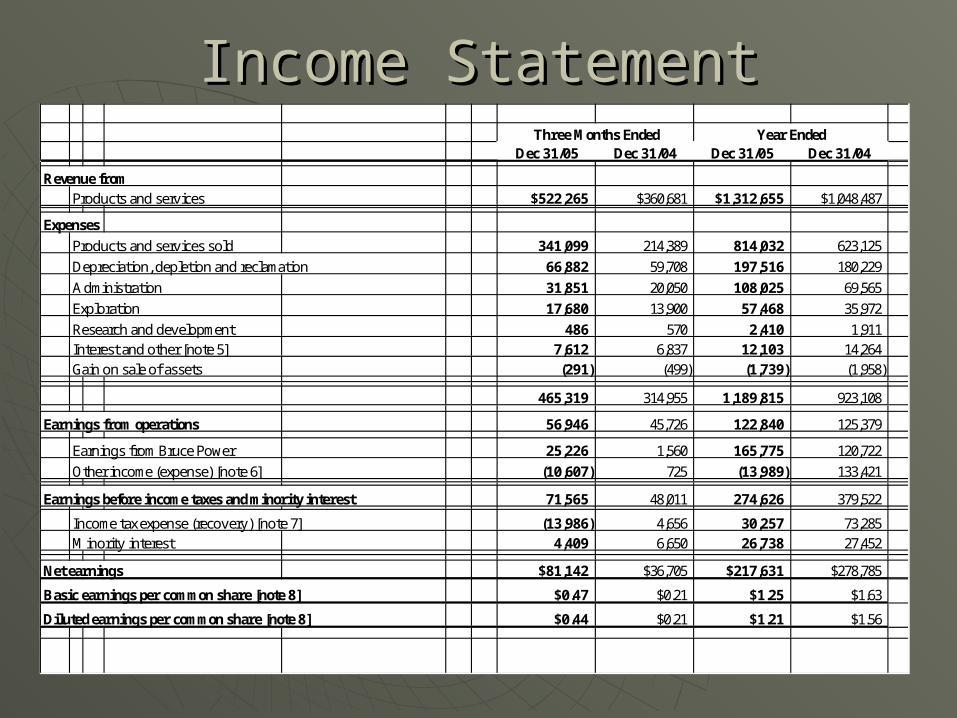
Income StatementIncome Statement
Dec 31/05 Dec 31/04 Dec 31/05 Dec 31/04
Revenue fromProducts and services $522,265 $360,681 $1,312,655 $1,048,487
Expenses
Products and services sold 341,099 214,389 814,032 623,125
Depreciation, depletion and reclamation 66,882 59,708 197,516 180,229
Administration 31,851 20,050 108,025 69,565
Exploration 17,680 13,900 57,468 35,972
Research and development 486 570 2,410 1,911Interest and other [note 5] 7,612 6,837 12,103 14,264Gain on sale of assets (291) (499) (1,739) (1,958)
465,319 314,955 1,189,815 923,108
Earnings from operations 56,946 45,726 122,840 125,379
Earnings from Bruce Power 25,226 1,560 165,775 120,722
Other income (expense) [note 6] (10,607) 725 (13,989) 133,421
Earnings before income taxes and minority interest 71,565 48,011 274,626 379,522
Income tax expense (recovery) [note 7] (13,986) 4,656 30,257 73,285Minority interest 4,409 6,650 26,738 27,452
Net earnings $81,142 $36,705 $217,631 $278,785
Basic earnings per common share [note 8] $0.47 $0.21 $1.25 $1.63
Diluted earnings per common share [note 8] $0.44 $0.21 $1.21 $1.56
Three Months Ended Year Ended
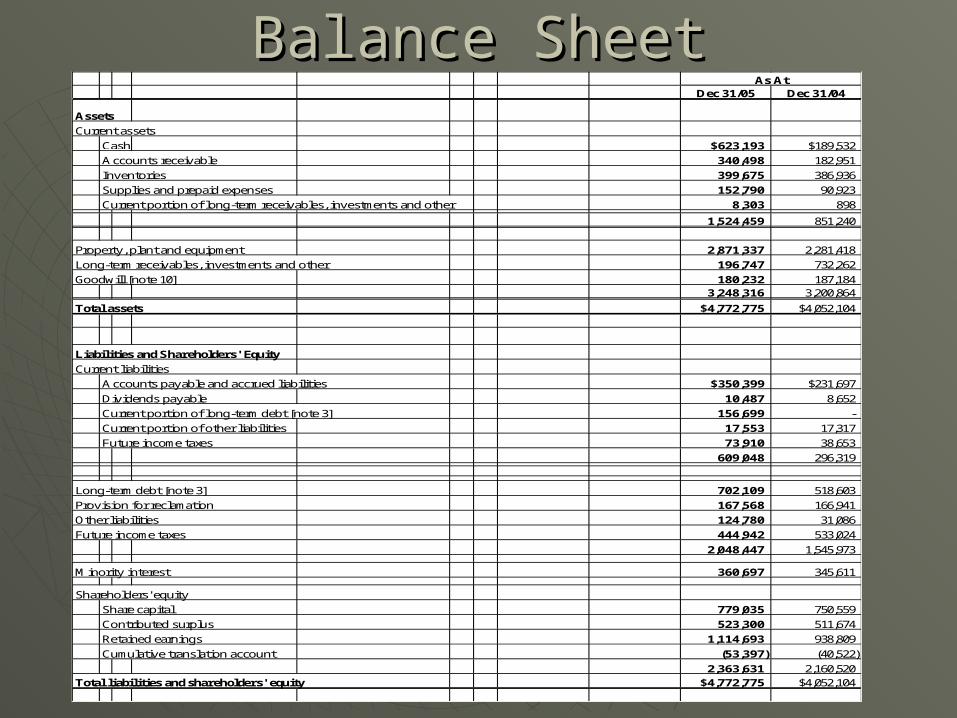
Balance SheetBalance SheetDec 31/05 Dec 31/04
Assets
Current assets
Cash $623,193 $189,532
Accounts receivable 340,498 182,951
Inventories 399,675 386,936
Supplies and prepaid expenses 152,790 90,923
Current portion of long-term receivables, investments and other 8,303 898
1,524,459 851,240
Property, plant and equipment 2,871,337 2,281,418
Long-term receivables, investments and other 196,747 732,262
Goodwill [note 10] 180,232 187,1843,248,316 3,200,864
Total assets $4,772,775 $4,052,104
Liabilities and Shareholders' Equity
Current liabilities
Accounts payable and accrued liabilities $350,399 $231,697
Dividends payable 10,487 8,652
Current portion of long-term debt [note 3] 156,699 -
Current portion of other liabilities 17,553 17,317
Future income taxes 73,910 38,653
609,048 296,319
Long-term debt [note 3] 702,109 518,603
Provision for reclamation 167,568 166,941
Other liabilities 124,780 31,086
Future income taxes 444,942 533,024
2,048,447 1,545,973
Minority interest 360,697 345,611
Shareholders' equity
Share capital 779,035 750,559
Contributed surplus 523,300 511,674
Retained earnings 1,114,693 938,809
Cumulative translation account (53,397) (40,522)
2,363,631 2,160,520
Total liabilities and shareholders' equity $4,772,775 $4,052,104
As At
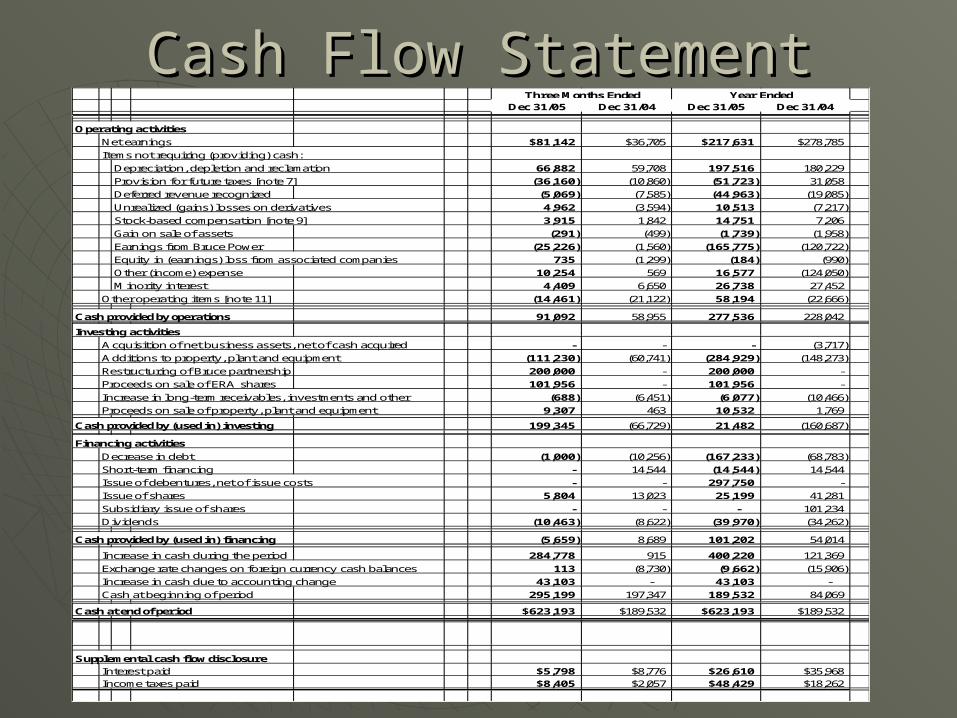
Cash Flow StatementCash Flow Statement Dec 31/05 Dec 31/04 Dec 31/05 Dec 31/04
Operating activities
Net earnings $81,142 $36,705 $217,631 $278,785
Items not requiring (providing) cash:
Depreciation, depletion and reclamation 66,882 59,708 197,516 180,229
Provision for future taxes [note 7] (36,160) (10,860) (51,723) 31,058
Deferred revenue recognized (5,069) (7,585) (44,963) (19,085)
Unrealized (gains) losses on derivatives 4,962 (3,594) 10,513 (7,217)
Stock-based compensation [note 9] 3,915 1,842 14,751 7,206
Gain on sale of assets (291) (499) (1,739) (1,958)
Earnings from Bruce Power (25,226) (1,560) (165,775) (120,722)
Equity in (earnings) loss from associated companies 735 (1,299) (184) (990)
Other (income) expense 10,254 569 16,577 (124,050)
Minority interest 4,409 6,650 26,738 27,452
Other operating items [note 11] (14,461) (21,122) 58,194 (22,666)
Cash provided by operations 91,092 58,955 277,536 228,042
Investing activities
Acquisition of net business assets, net of cash acquired - - - (3,717)
Additions to property, plant and equipment (111,230) (60,741) (284,929) (148,273)
Restructuring of Bruce partnership 200,000 - 200,000 -
Proceeds on sale of ERA shares 101,956 - 101,956 -
Increase in long-term receivables, investments and other (688) (6,451) (6,077) (10,466)
Proceeds on sale of property, plant and equipment 9,307 463 10,532 1,769
Cash provided by (used in) investing 199,345 (66,729) 21,482 (160,687)
Financing activities
Decrease in debt (1,000) (10,256) (167,233) (68,783)
Short-term financing - 14,544 (14,544) 14,544
Issue of debentures, net of issue costs - - 297,750 -
Issue of shares 5,804 13,023 25,199 41,281
Subsidiary issue of shares - - - 101,234
Dividends (10,463) (8,622) (39,970) (34,262)
Cash provided by (used in) financing (5,659) 8,689 101,202 54,014
Increase in cash during the period 284,778 915 400,220 121,369
Exchange rate changes on foreign currency cash balances 113 (8,730) (9,662) (15,906)
Increase in cash due to accounting change 43,103 - 43,103 -
Cash at beginning of period 295,199 197,347 189,532 84,069
Cash at end of period $623,193 $189,532 $623,193 $189,532
Supplemental cash flow disclosure
Interest paid $5,798 $8,776 $26,610 $35,968
Income taxes paid $8,405 $2,057 $48,429 $18,262
Three Months Ended Year Ended
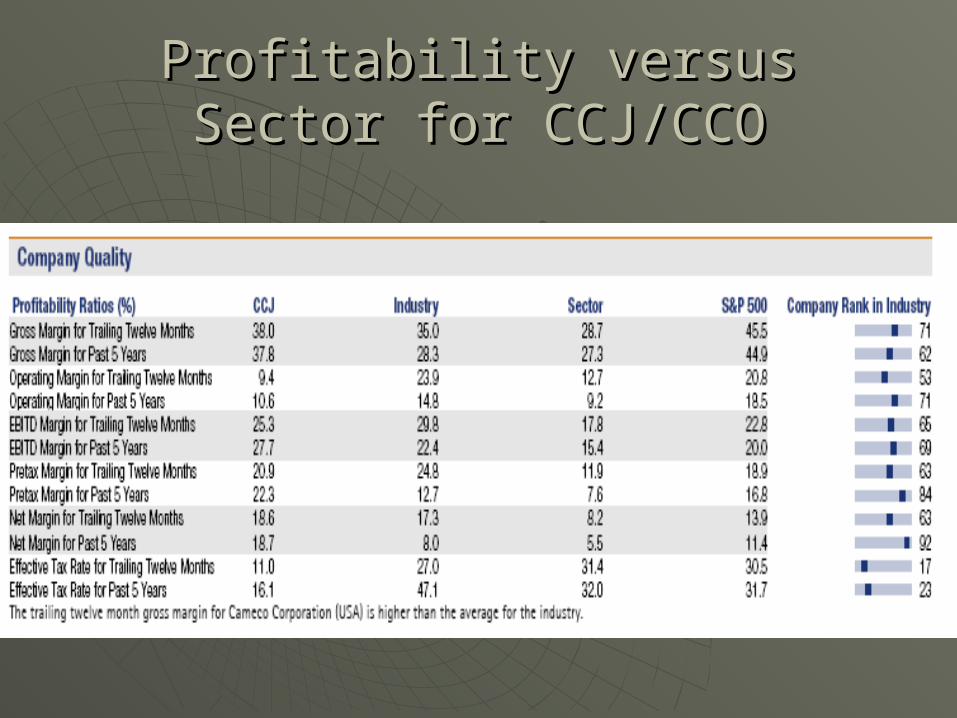
Profitability versus Sector for Profitability versus Sector for CCJ/CCOCCJ/CCO
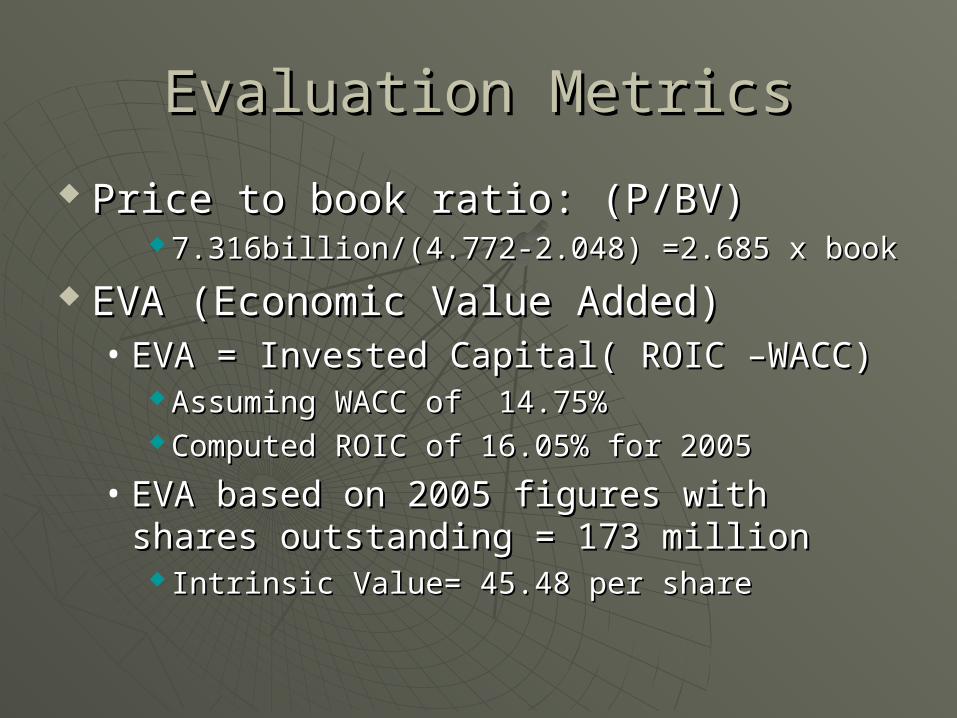
Evaluation MetricsEvaluation Metrics
Price to book ratio: (P/BV)Price to book ratio: (P/BV) 7.316billion/(4.772-2.048) =2.685 x book7.316billion/(4.772-2.048) =2.685 x book
EVA (Economic Value Added)EVA (Economic Value Added)• EVA = Invested Capital( ROIC –WACC)EVA = Invested Capital( ROIC –WACC)
Assuming WACC of 14.75%Assuming WACC of 14.75% Computed ROIC of 16.05% for 2005Computed ROIC of 16.05% for 2005
• EVA based on 2005 figures with shares EVA based on 2005 figures with shares outstanding = 173 millionoutstanding = 173 million
Intrinsic Value= 45.48 per shareIntrinsic Value= 45.48 per share
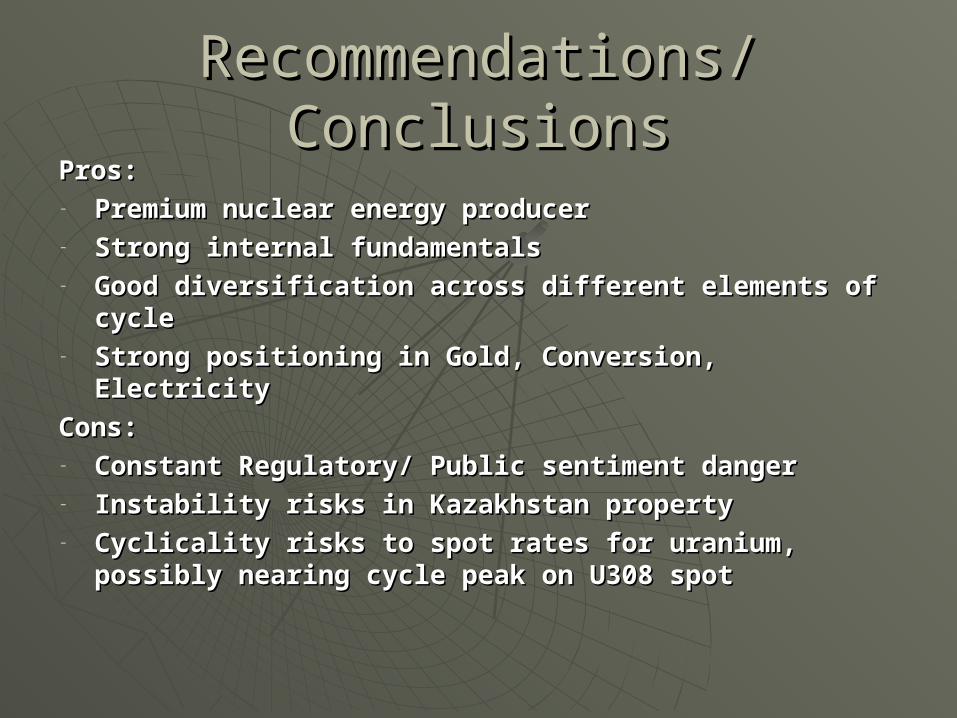
Recommendations/ConclusionsRecommendations/ConclusionsPros:Pros:- Premium nuclear energy producerPremium nuclear energy producer- Strong internal fundamentalsStrong internal fundamentals- Good diversification across different elements of Good diversification across different elements of
cycle cycle - Strong positioning in Gold, Conversion, ElectricityStrong positioning in Gold, Conversion, Electricity
Cons:Cons:- Constant Regulatory/ Public sentiment dangerConstant Regulatory/ Public sentiment danger- Instability risks in Kazakhstan propertyInstability risks in Kazakhstan property- Cyclicality risks to spot rates for uranium, possibly Cyclicality risks to spot rates for uranium, possibly
nearing cycle peak on U308 spotnearing cycle peak on U308 spot
Recommendations/ConclusionsRecommendations/Conclusions
SpeculativSpeculative Buye Buy
2006 2006 Target Price: $45.00Target Price: $45.00
Newmont Mining Corporation
Creating Value with Every Ounce…
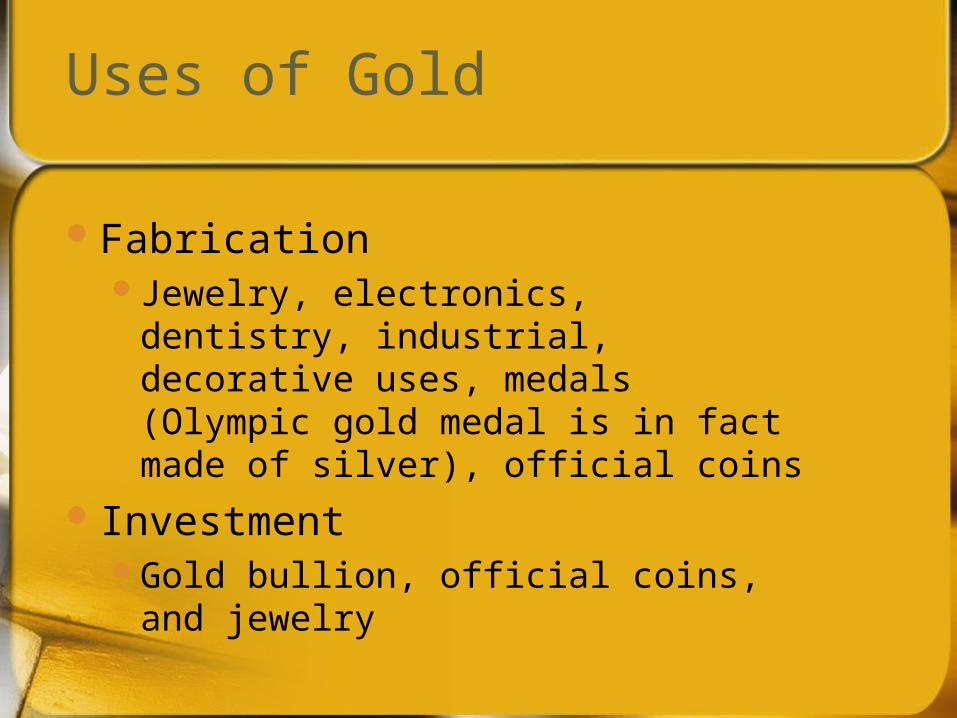
Uses of Gold
FabricationJewelry, electronics, dentistry,
industrial, decorative uses, medals (Olympic gold medal is in fact made of silver), official coins
InvestmentGold bullion, official coins, and
jewelry
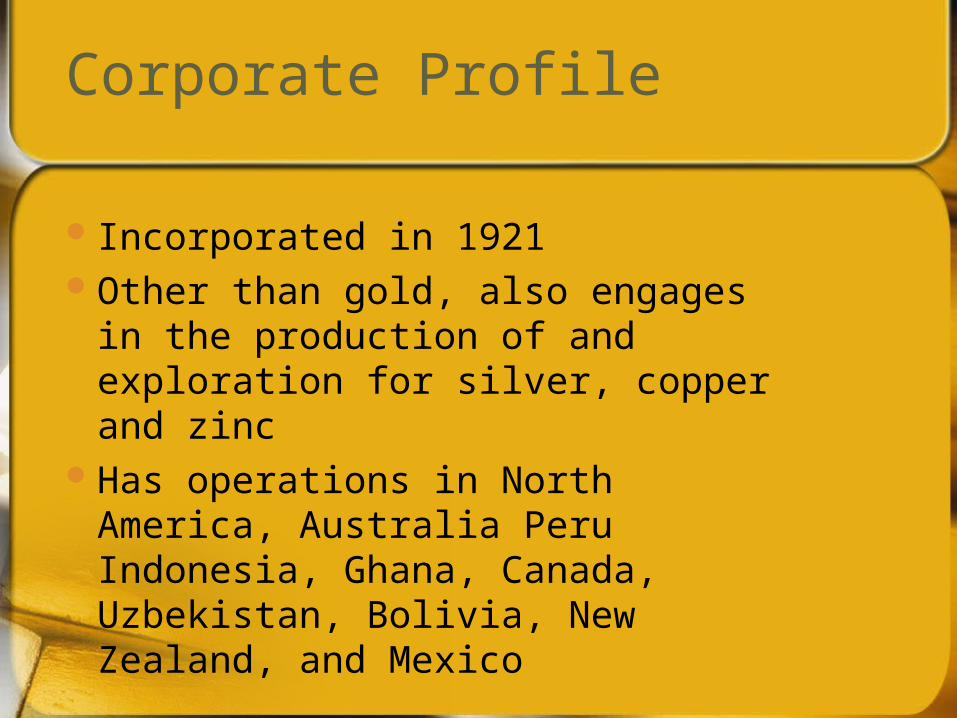
Corporate Profile
Incorporated in 1921Other than gold, also engages in
the production of and exploration for silver, copper and zinc
Has operations in North America, Australia Peru Indonesia, Ghana, Canada, Uzbekistan, Bolivia, New Zealand, and Mexico
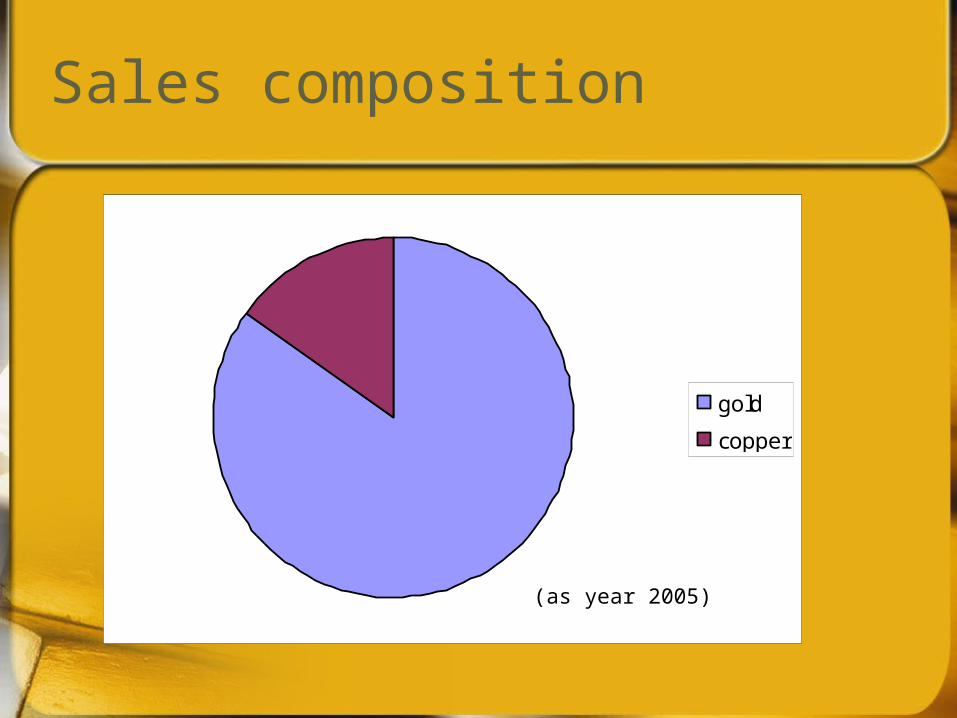
Sales composition
gold
copper
(as year 2005)
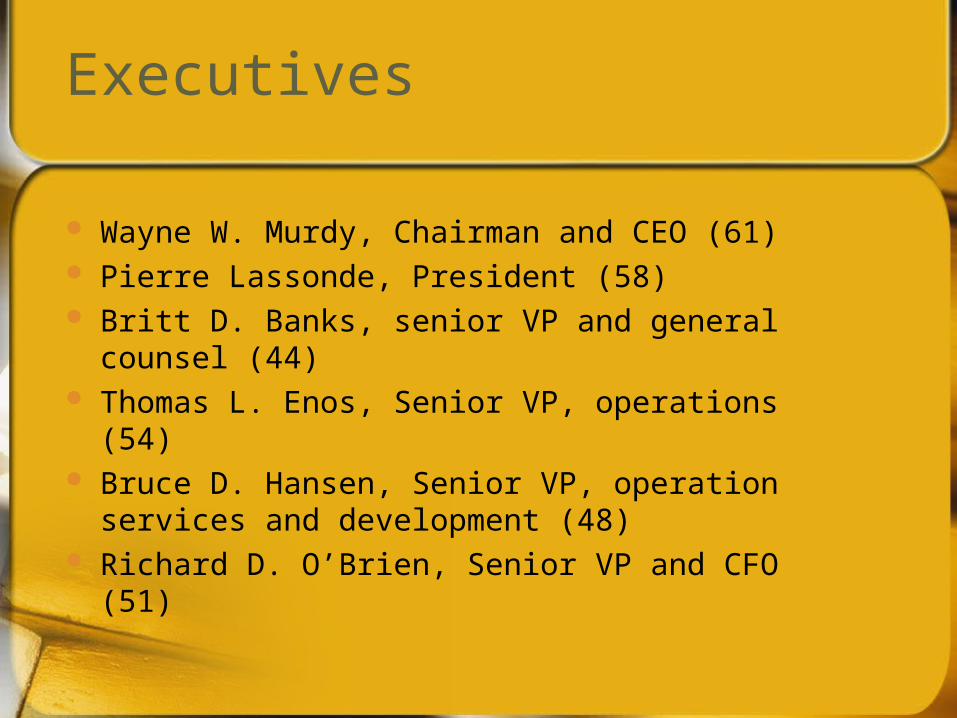
Executives
Wayne W. Murdy, Chairman and CEO (61) Pierre Lassonde, President (58) Britt D. Banks, senior VP and general
counsel (44) Thomas L. Enos, Senior VP, operations (54) Bruce D. Hansen, Senior VP, operation
services and development (48) Richard D. O’Brien, Senior VP and CFO (51)
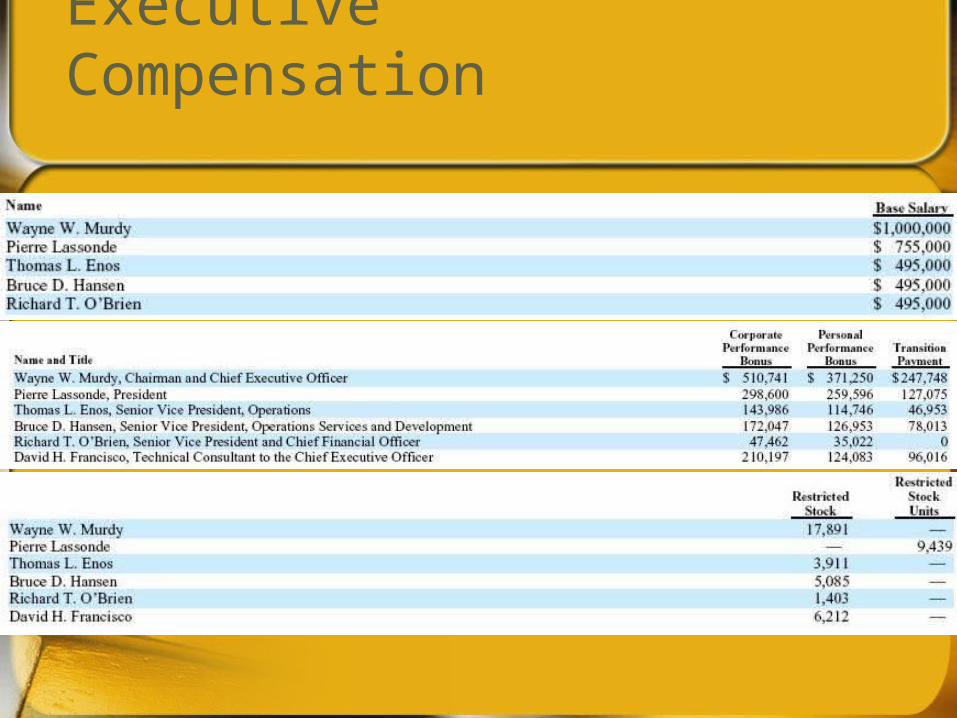
Executive Compensation
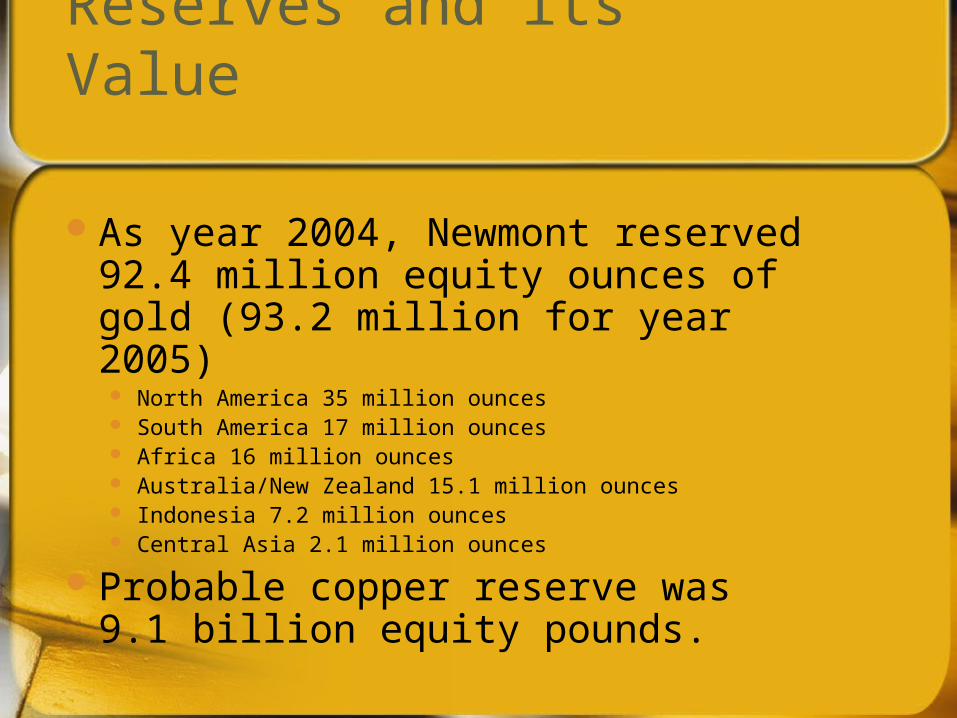
Reserves and its Value
As year 2004, Newmont reserved 92.4 million equity ounces of gold (93.2 million for year 2005) North America 35 million ounces South America 17 million ounces Africa 16 million ounces Australia/New Zealand 15.1 million ounces Indonesia 7.2 million ounces Central Asia 2.1 million ounces
Probable copper reserve was 9.1 billion equity pounds.
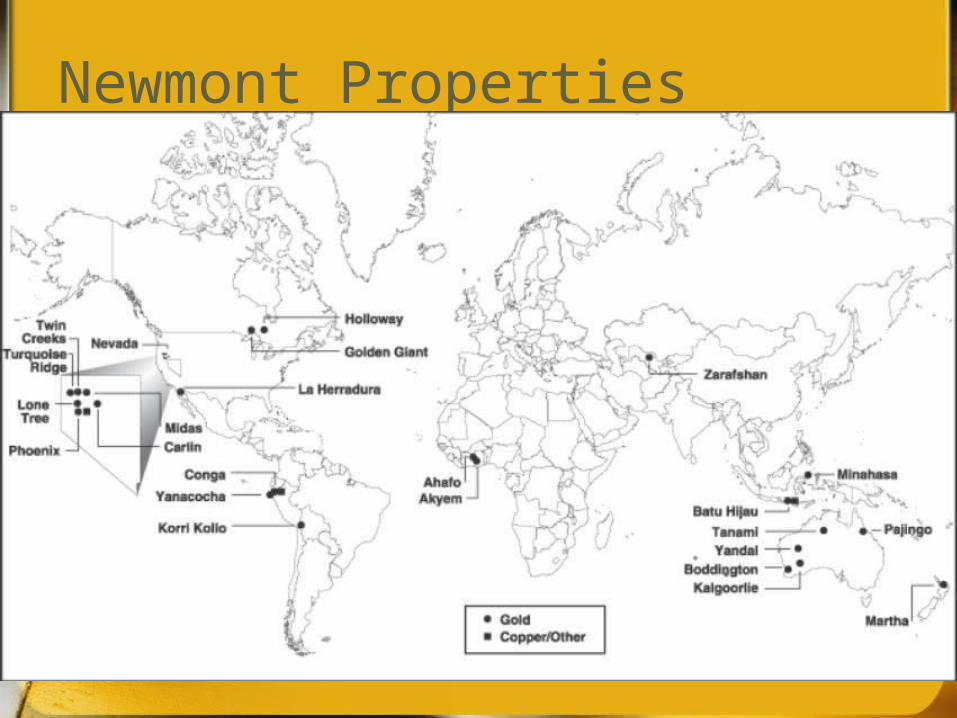
Newmont Properties
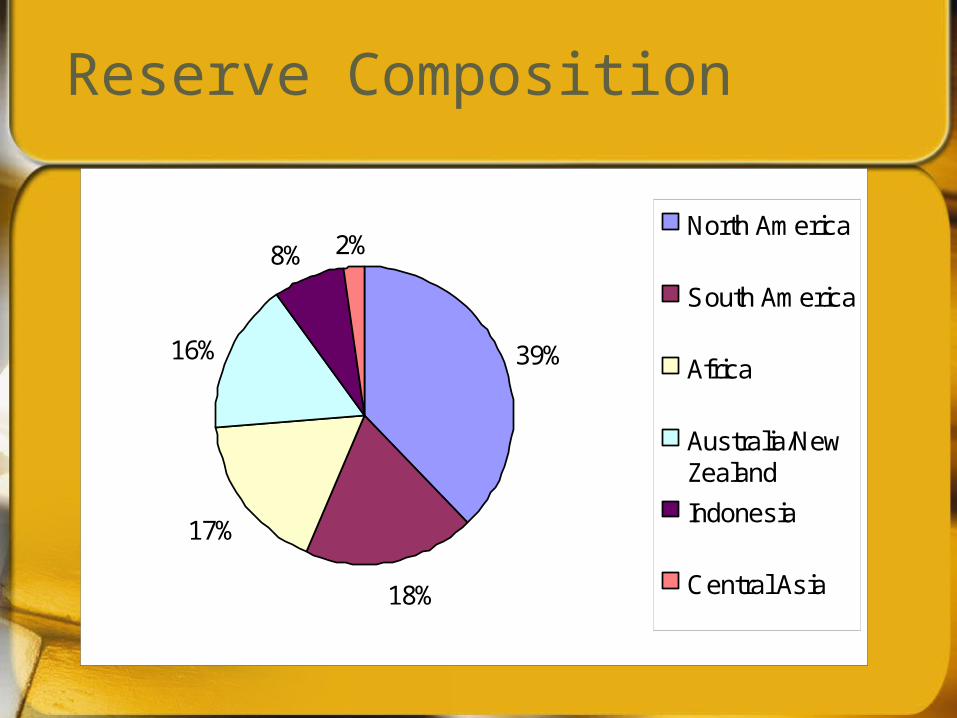
Reserve Composition
39%
18%
17%
16%
8% 2%North America
South America
Africa
Australia/NewZealand
Indonesia
Central Asia
Nevada Operation
Newmont owns or controls approximately 3,056 square miles (7,915 square kilometers) of land in Nevada
Three Regions: Eastern NevadaTwin Creeks, Lone Tree and
Phoenix Midas
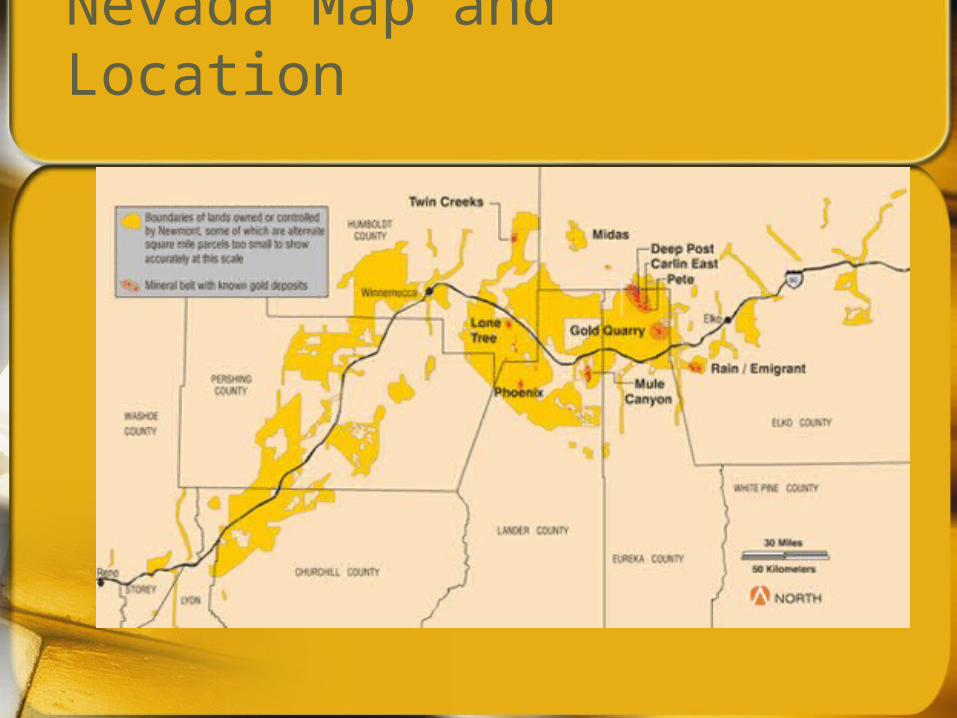
Nevada Map and Location
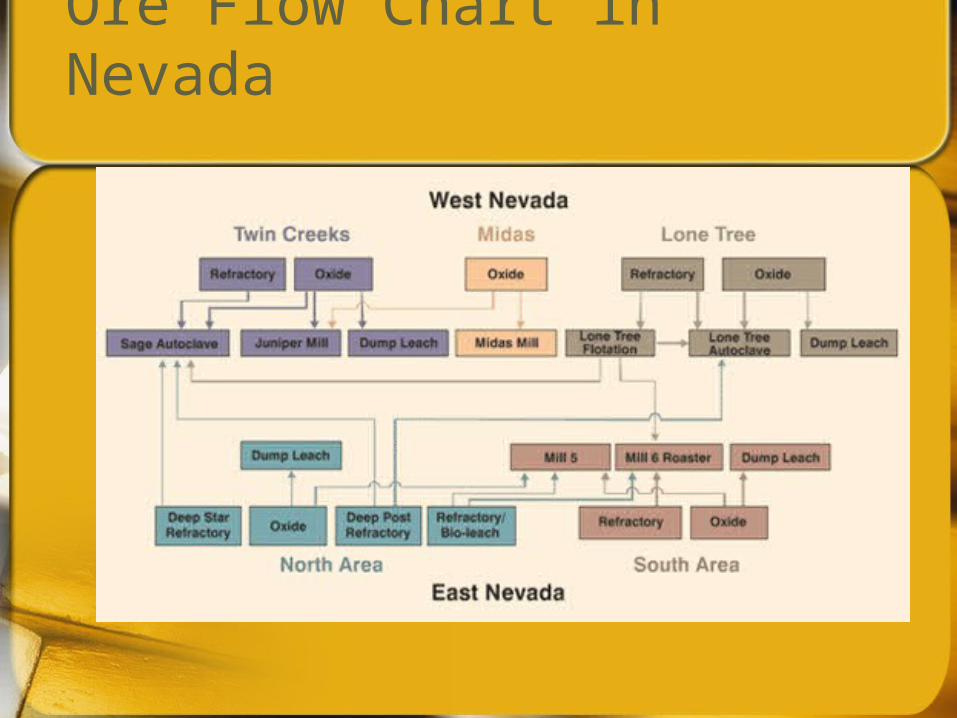
Ore Flow Chart in Nevada
Minera Yanacocha, Peru
51.35% Newmont, 43.65% Peruvian mining firm, Compania de Minas Buenaventura S.A.A , 5% International Finance Corporate
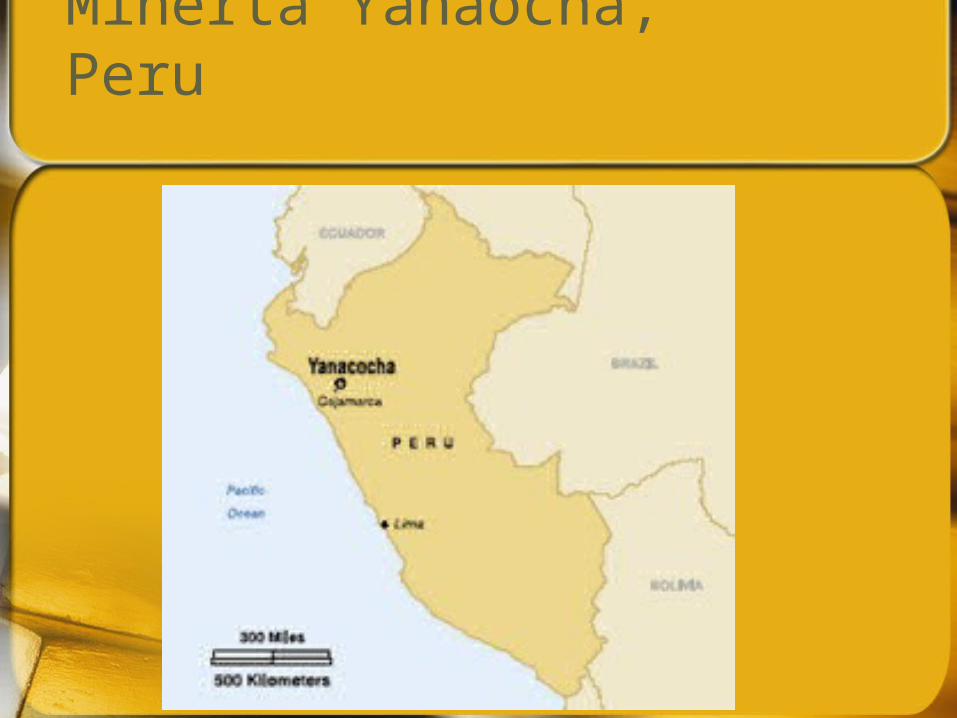
Minerta Yanaocha, Peru
Australia/New Zealand
Re-entry in year 2001After acquiring Normandy
Mining, Newmont is now the largest gold producer in Australia
Five mining operations in Western Australia, Queensland, the Northern Territory and New Zealand
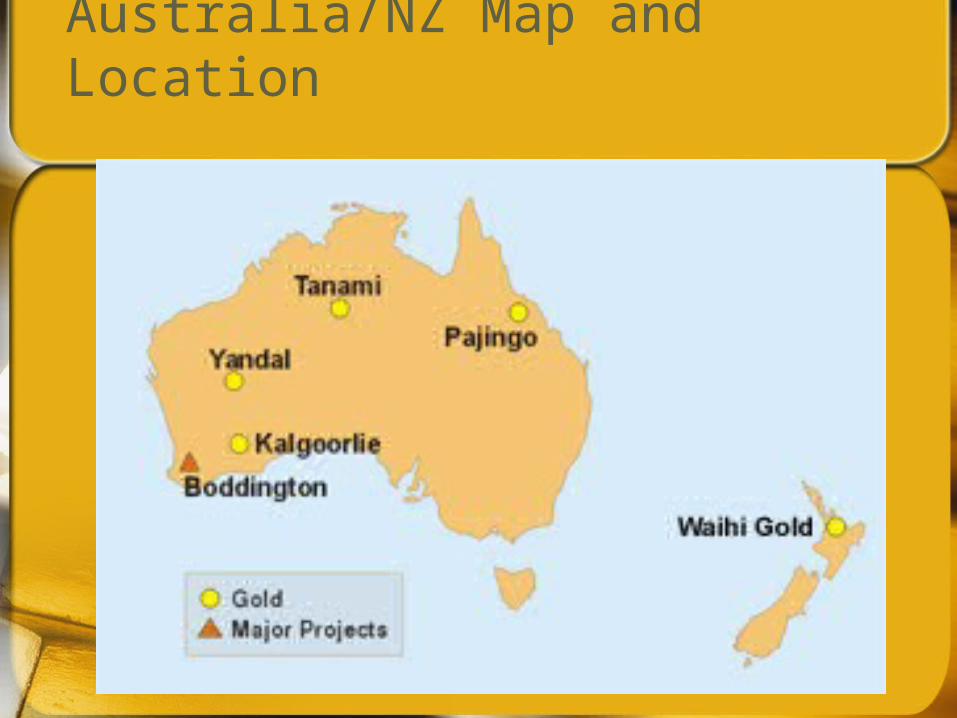
Australia/NZ Map and Location
Indonesia Operation
Minahasa, started operation in 1996
Batu Hijau, a large copper-gold deposit on the island of Sumbawa, started in 1999
Recent attack on workers’ residential camp may raise security issues
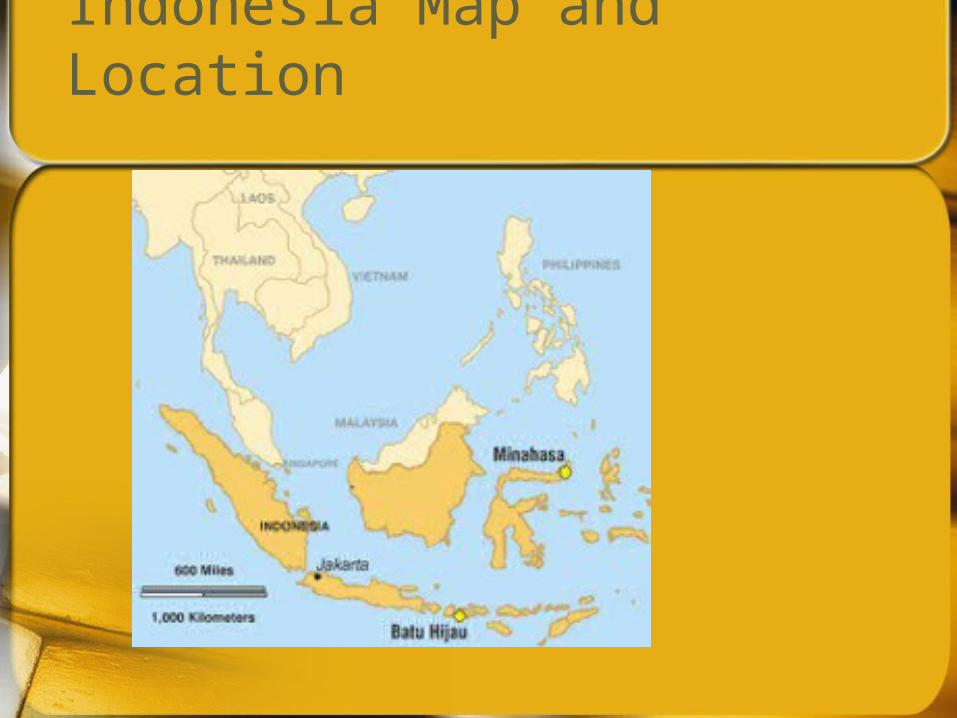
Indonesia Map and Location
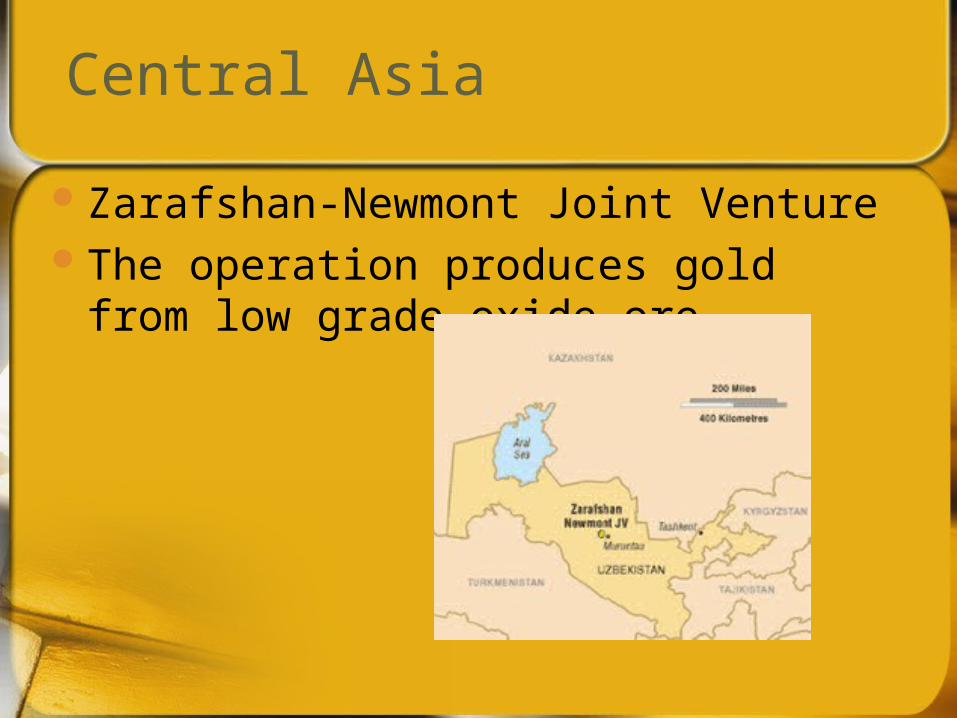
Central Asia
Zarafshan-Newmont Joint Venture The operation produces gold from
low grade oxide ore.
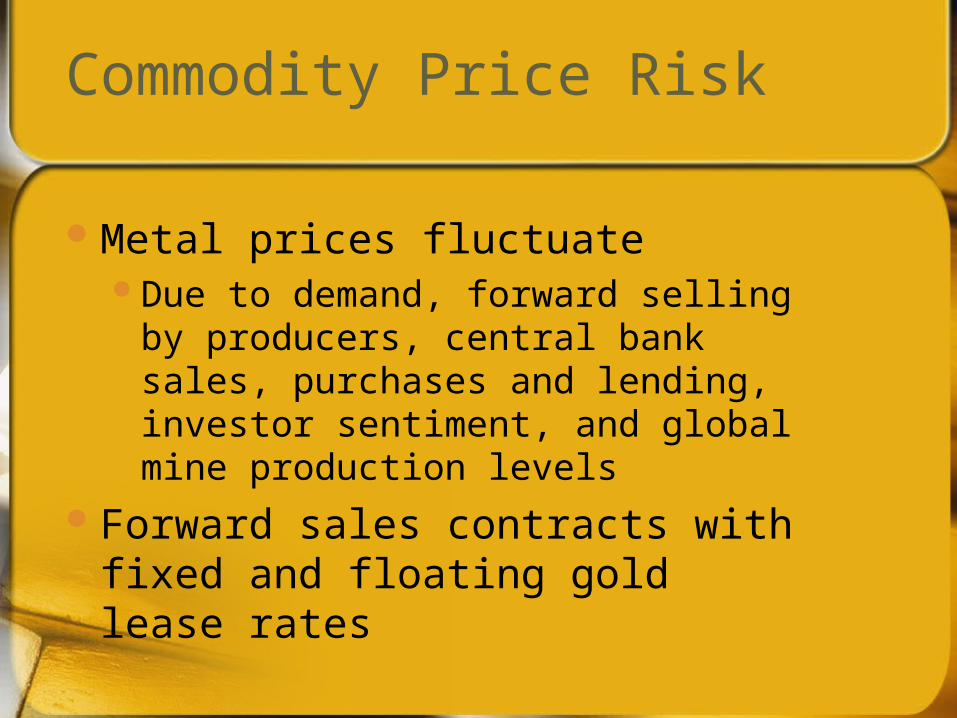
Commodity Price Risk
Metal prices fluctuateDue to demand, forward selling by
producers, central bank sales, purchases and lending, investor sentiment, and global mine production levels
Forward sales contracts with fixed and floating gold lease rates
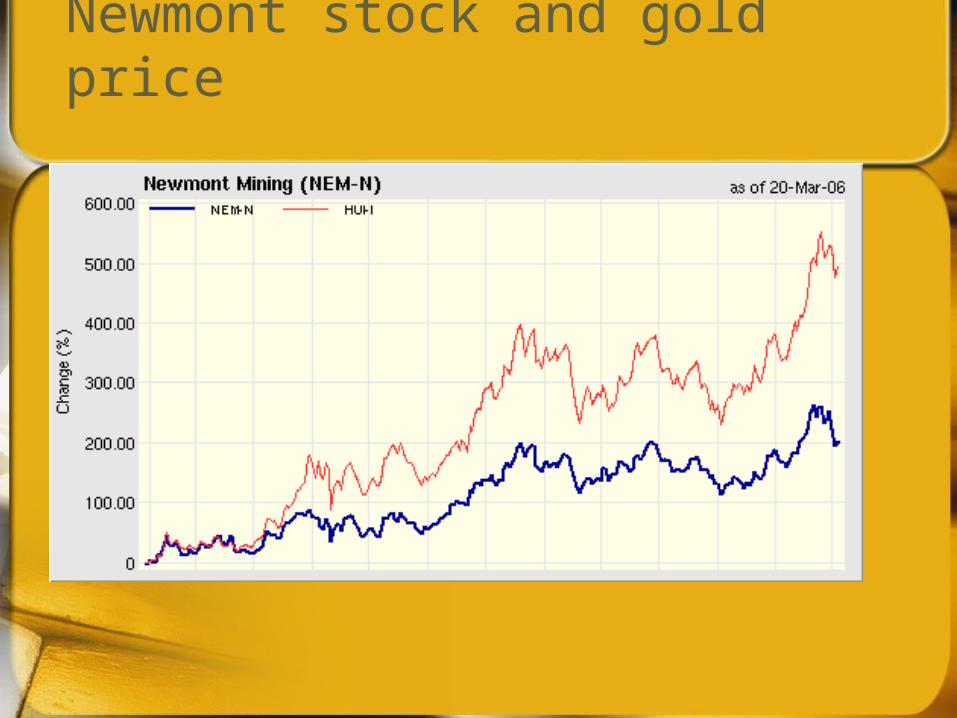
Newmont stock and gold price
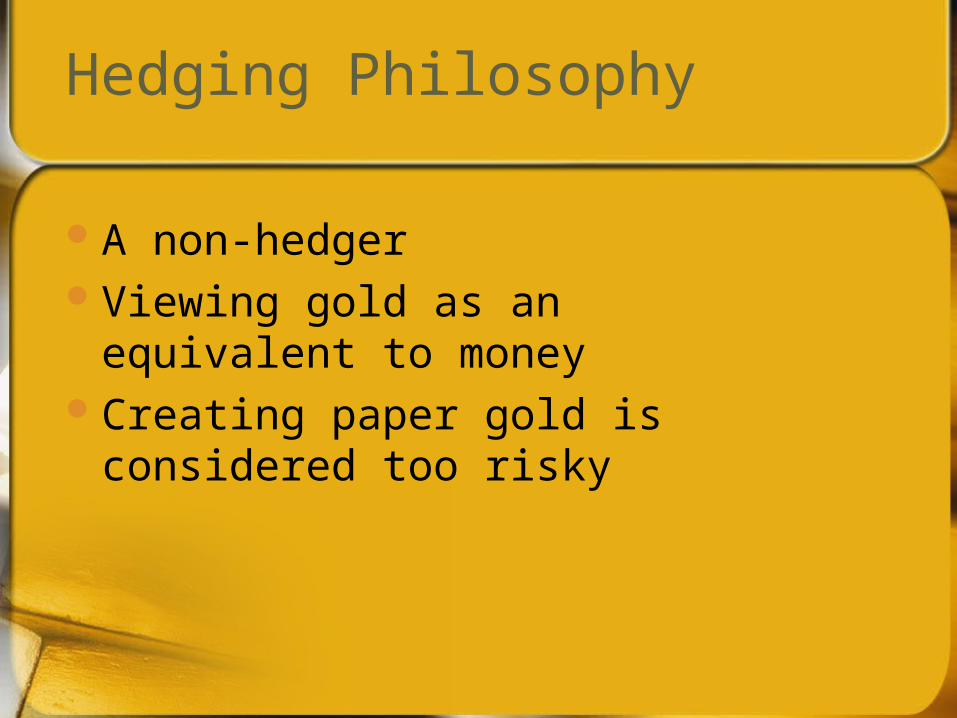
Hedging Philosophy
A non-hedgerViewing gold as an equivalent to
moneyCreating paper gold is
considered too risky
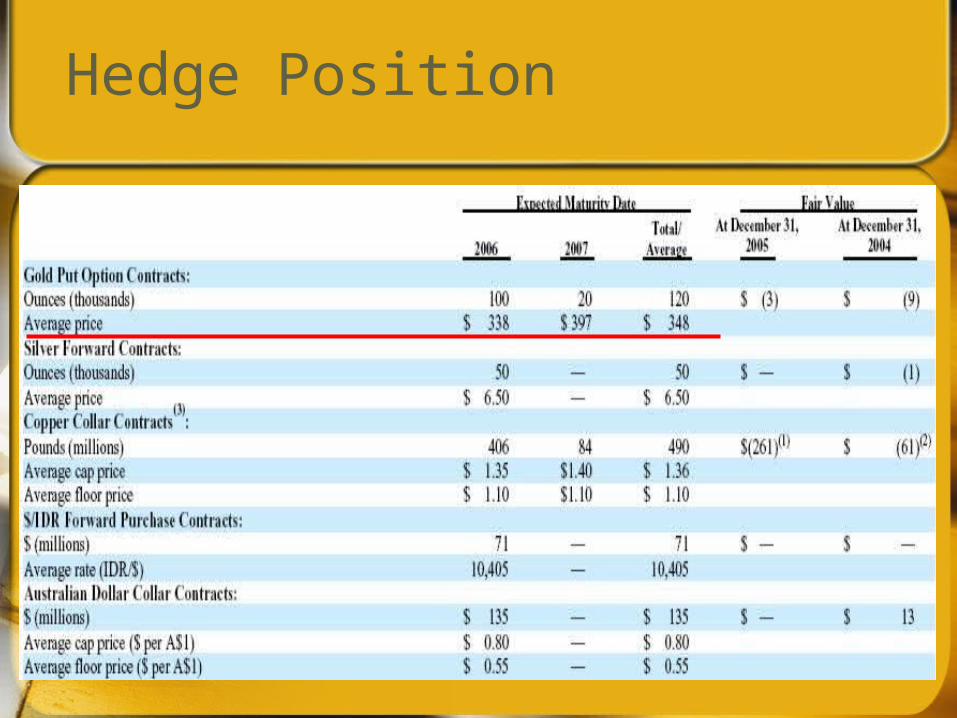
Hedge Position
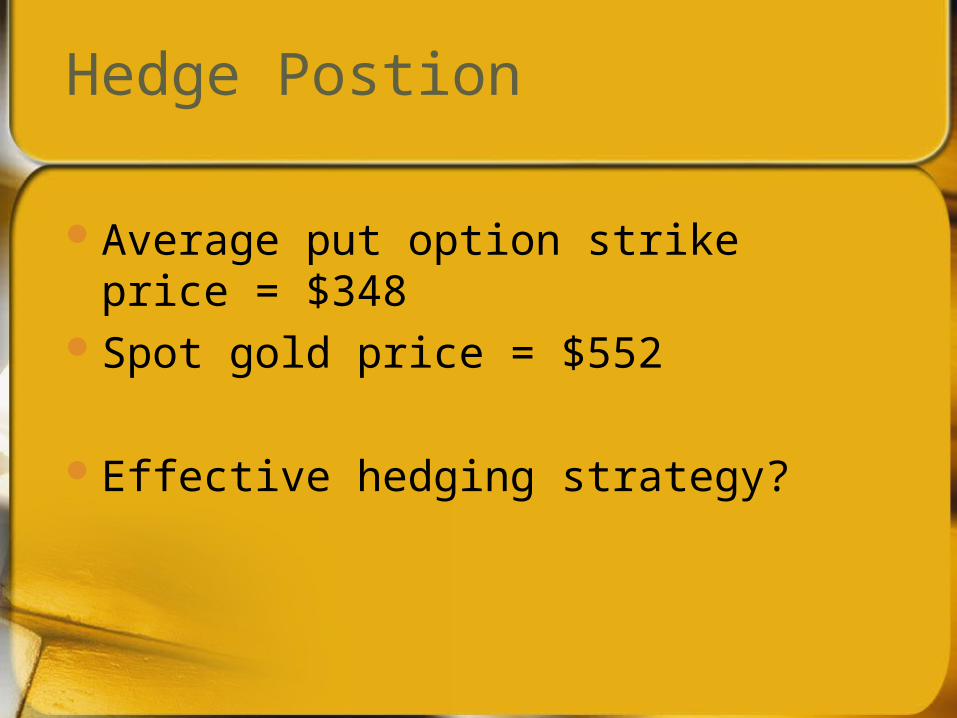
Hedge Postion
Average put option strike price = $348
Spot gold price = $552
Effective hedging strategy?
Financial Statements
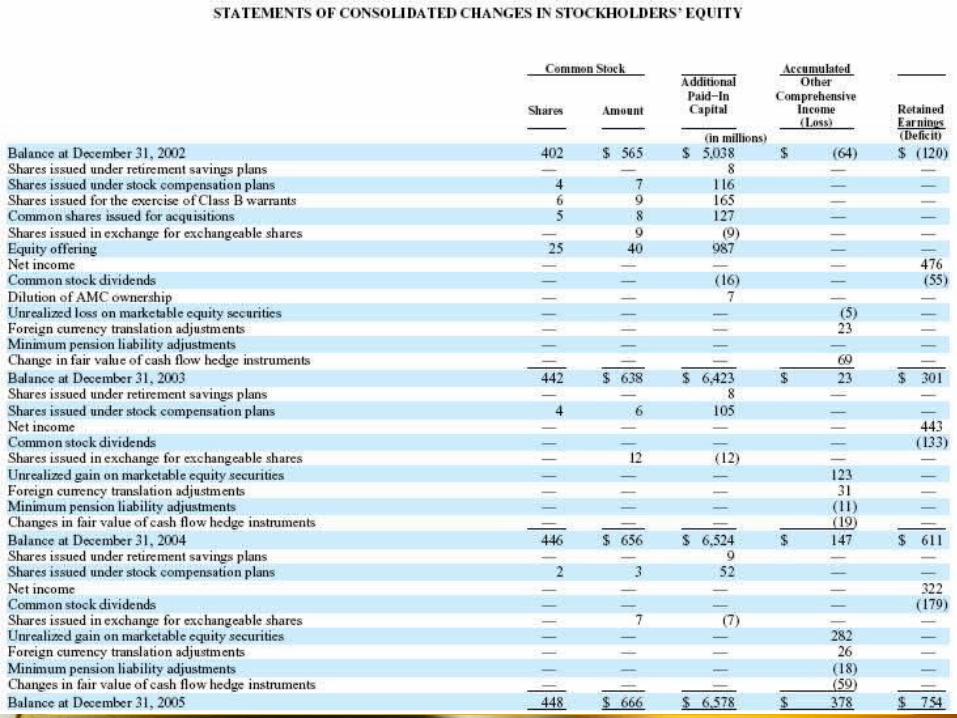
Income StatementBlance SheetStatement of Change in
Shareholder EquityStatement of Cash Flow
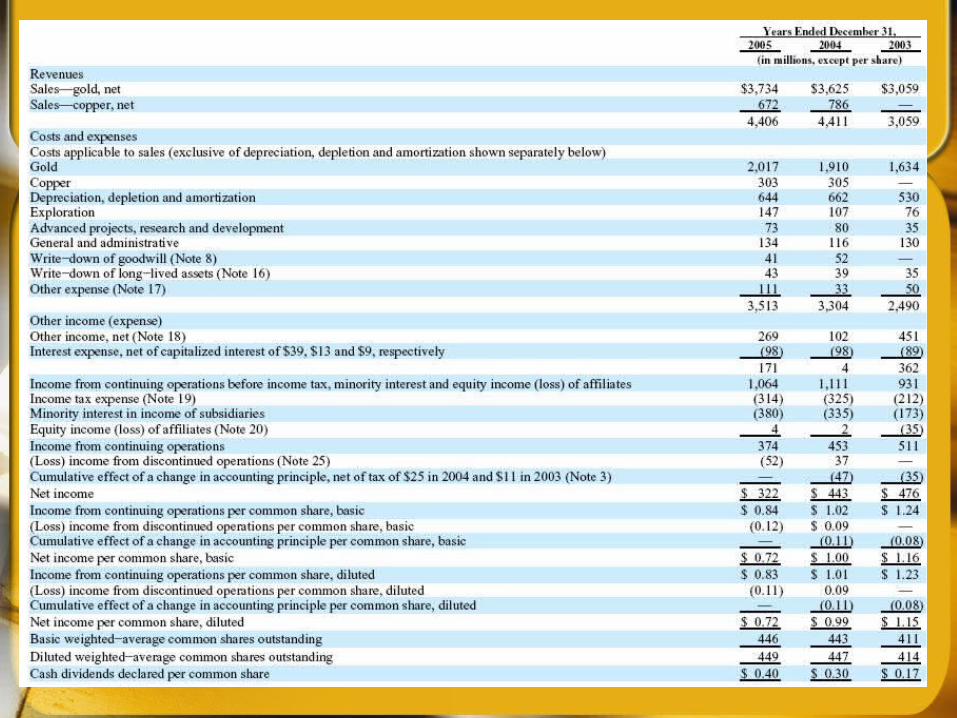
Income Statement
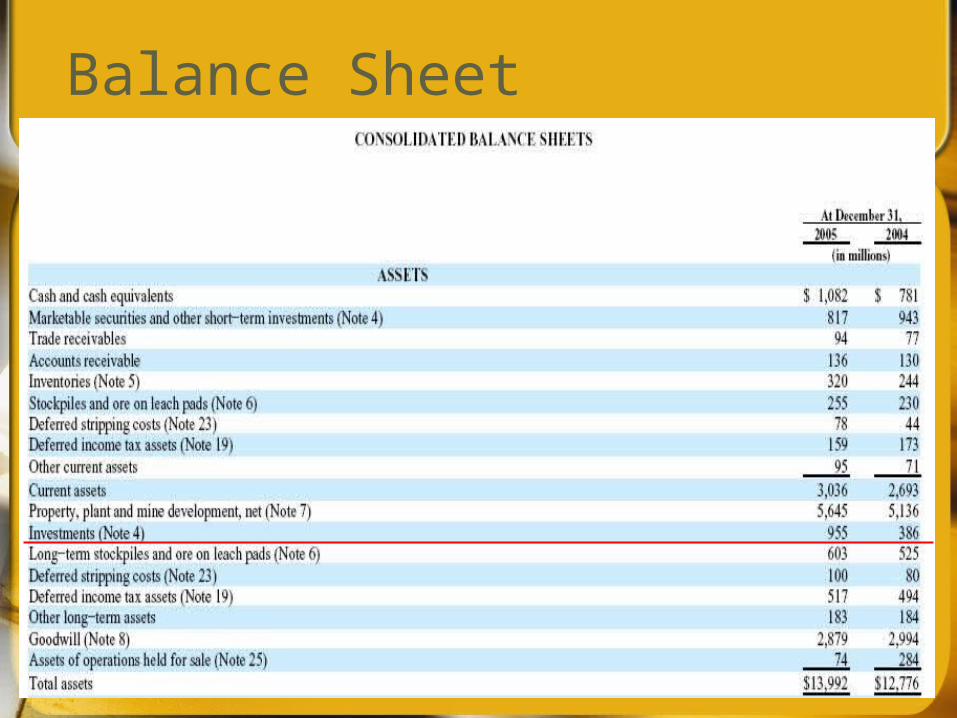
Balance Sheet
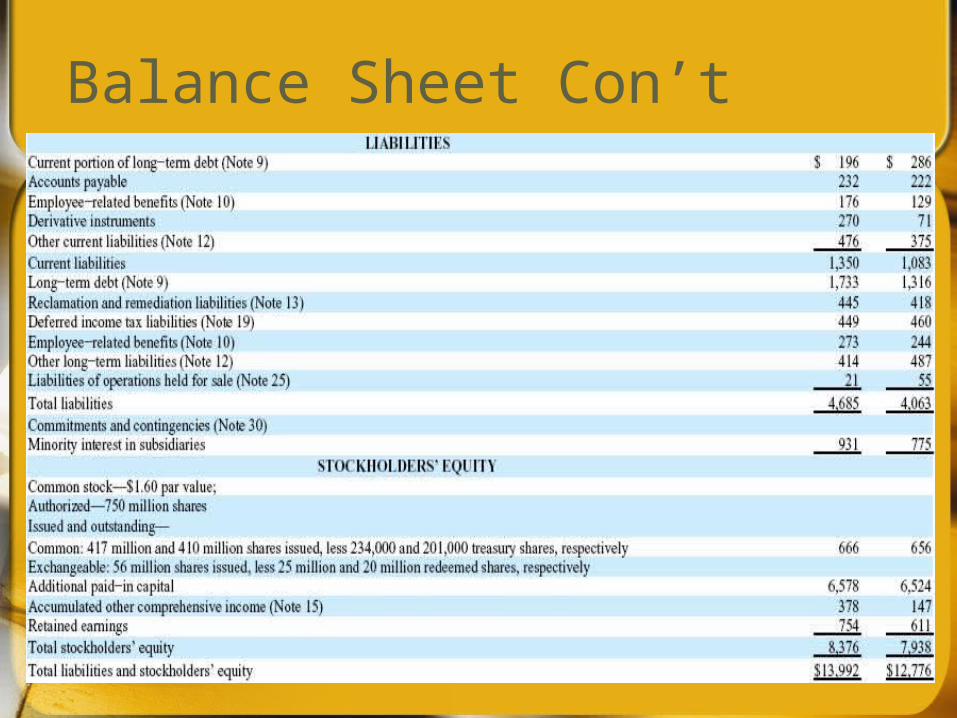
Balance Sheet Con’t
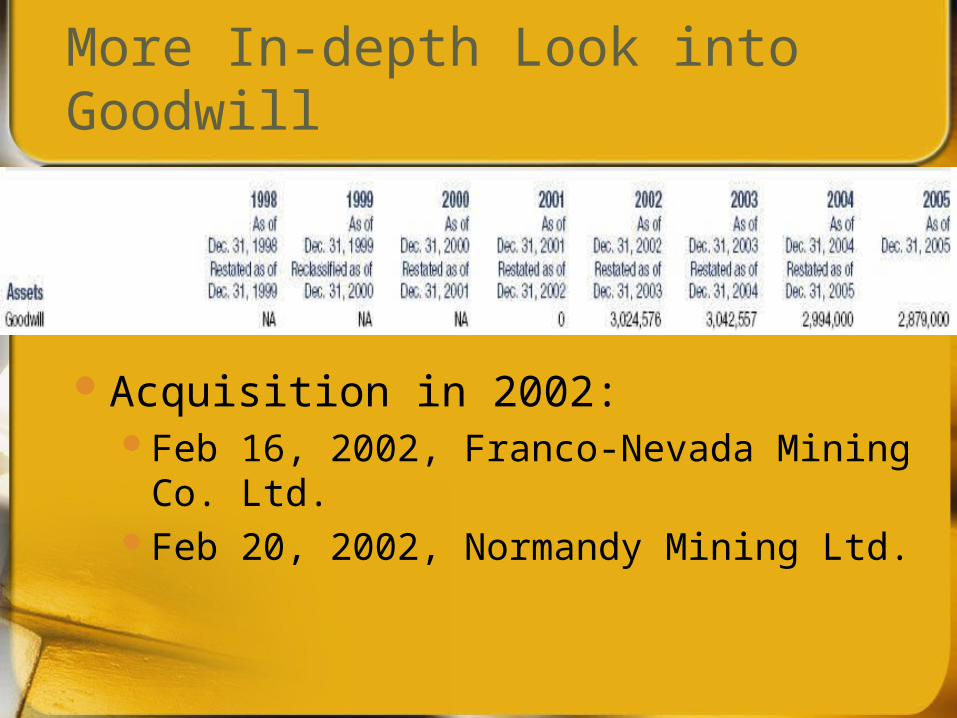
More In-depth Look into Goodwill
Acquisition in 2002:Feb 16, 2002, Franco-Nevada Mining Co.
Ltd.Feb 20, 2002, Normandy Mining Ltd.
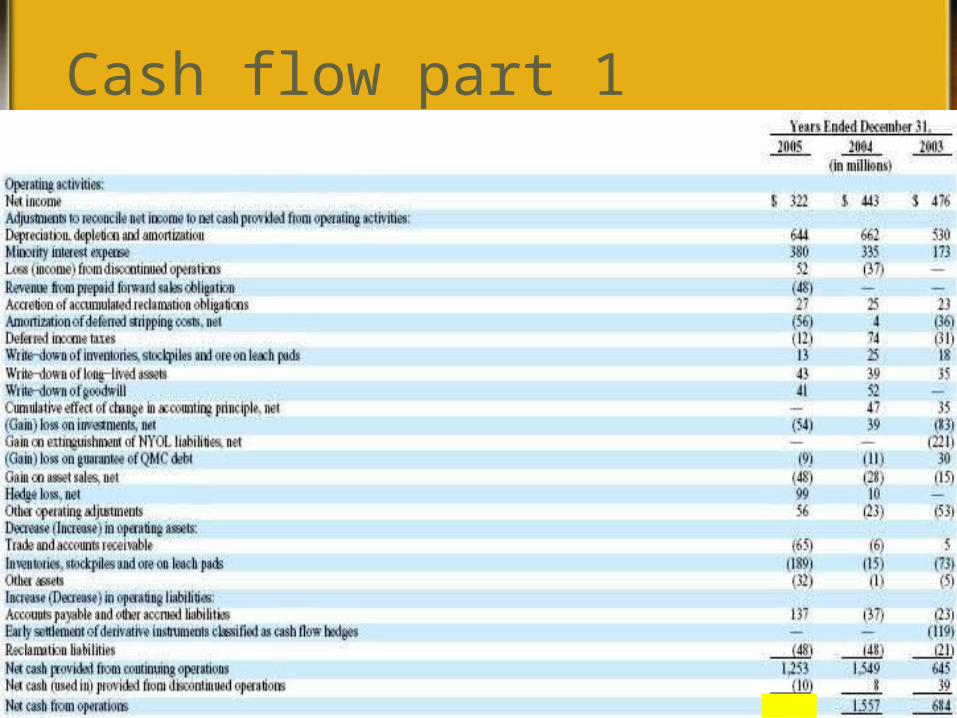
Cash flow part 1
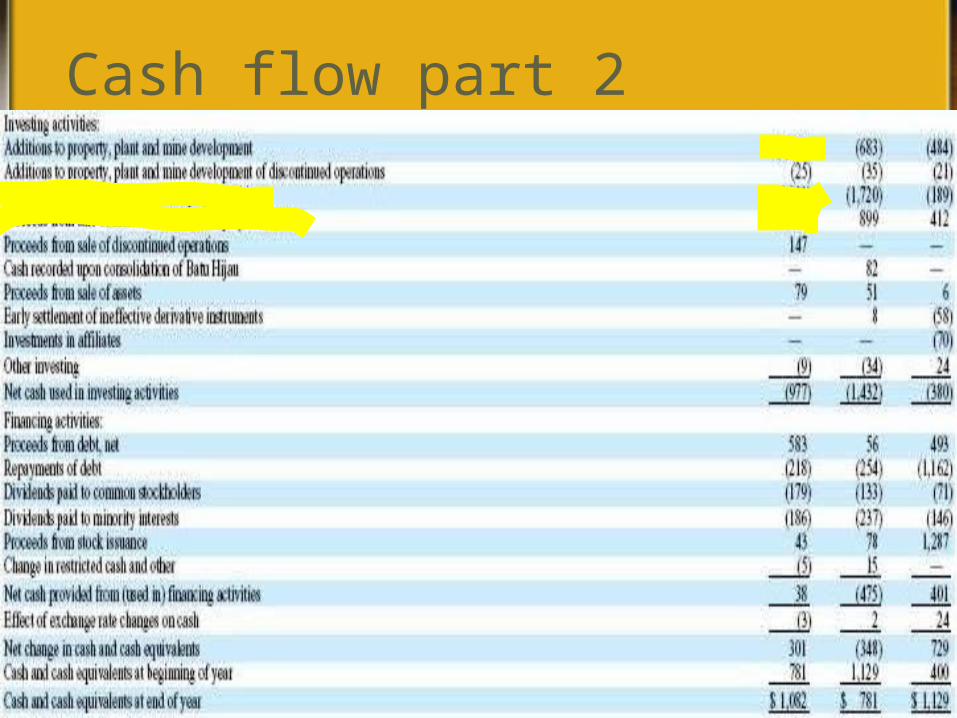
Cash flow part 2
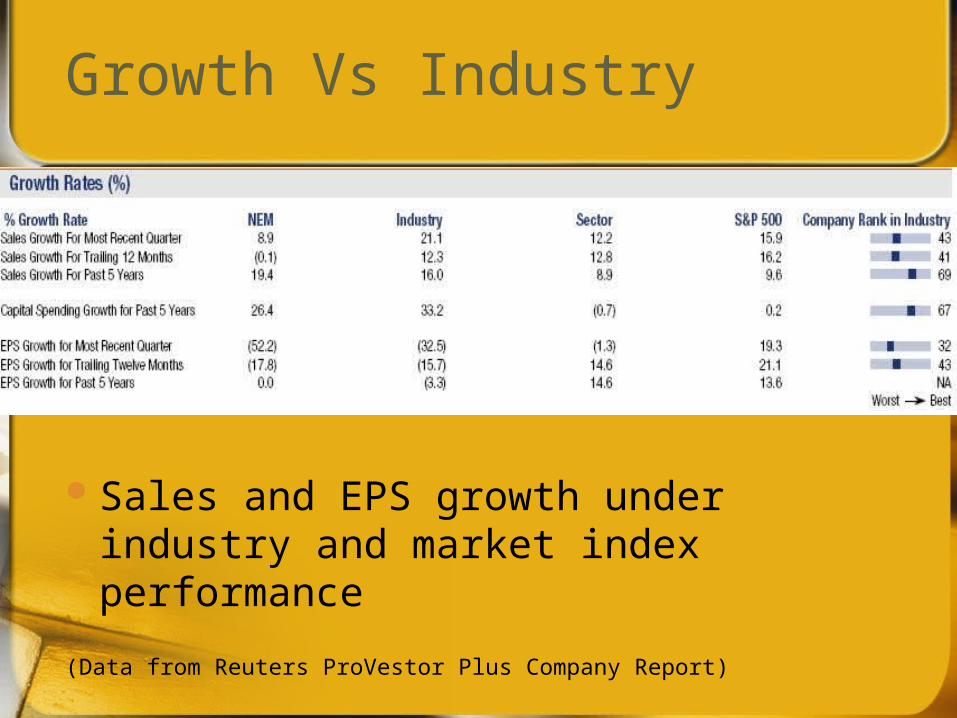
Growth Vs Industry
Sales and EPS growth under industry and market index performance
(Data from Reuters ProVestor Plus Company Report)

Recommendation
EXIT