MINERALS COUNCIL OF AUSTRALIA - pc.gov.au · Benefits of mining operations to regions in NSW and...
105
2017/001082 MINERALS COUNCIL OF AUSTRALIA SUBMISSION TO THE PRODUCTIVITY COMMISSION’S INITIAL REPORT ON TRANSITIONING REGIONAL ECONOMIES AUGUST 2017
Transcript of MINERALS COUNCIL OF AUSTRALIA - pc.gov.au · Benefits of mining operations to regions in NSW and...

2017/001082
MINERALS COUNCIL OF AUSTRALIA
SUBMISSION TO THE PRODUCTIVITY COMMISSION’S
INITIAL REPORT ON TRANSITIONING REGIONAL
ECONOMIES
AUGUST 2017

Minerals Council of Australia
2017/001082
TABLE OF CONTENTS
EXECUTIVE SUMMARY ........................................................................................................................ 3
Recommendations .............................................................................................................................. 4
1. CONTRIBUTION OF MINING TO NATIONAL AND REGIONAL ECONOMIES ............................ 9
Economic contribution of mining and competitive challenges ............................................................ 9
Benefits of mining operations to regions in NSW and Queensland .................................................. 13
Policies to promote national and regional growth ............................................................................. 15
2. CONTRIBUTION OF MINING AND METS TO REGIONS IN VICTORIA ..................................... 19
A significant economic contribution ................................................................................................... 19
Regional benefits of mining and METS ............................................................................................. 19
An untapped opportunity for new regional jobs and investment ....................................................... 20
Encouraging a new wave of minerals investment in Victoria ............................................................ 21
Priority areas for policy action and regulatory reform ....................................................................... 22
Energy security and regional development: the opportunity for the Latrobe Valley ......................... 23
3. CONTRIBUTION OF MINING TO NORTHERN TERRITORY ..................................................... 26
Significant contribution of mining and METS to the Northern Territory economy ............................. 26
Significant contribution of mining to the Northern Territory’s regional, remote and Aboriginal
communities ...................................................................................................................................... 27
Importance of Northern Territory mining to developing Northern Australia ...................................... 30
Policy priorities for the Northern Territory ......................................................................................... 30
Maximising productivity and improving environmental regulation..................................................... 31
Maximising benefits through resource management reforms and modernising security bonds ....... 31
Investing in strategic infrastructure and attracting investors ............................................................. 32
Stimulate greater industry investment in exploration ........................................................................ 33
Promoting and realising broad community benefits from mining ...................................................... 33
4. REGIONAL BENEFITS OF LABOUR MOBILITY ......................................................................... 35
Highly skilled, highly paid jobs in regional and remote Australia ...................................................... 35
Importance of labour mobility ............................................................................................................ 35

Minerals Council of Australia | 3
2017/001082
EXECUTIVE SUMMARY
The Minerals Council of Australia welcomes the Productivity Commission’s initial report on
transitioning regional economies. The report confirms that Australian regions continue to benefit
substantially from the resources sector and refutes the notion that the Australian economy is
transitioning away from mining. It also notes that the large resource base of many resource regions,
combined with the expansion of capacity generated during the mining investment boom, are likely to
provide economic and employment opportunities for decades to come.
The Productivity Commission makes a number of critical findings that should inform policymakers at
all levels of government:
Most resource regions have high adaptive capacity and are continuing to grow in terms of
employment, population and value of production
Regions whose base is large-scale mining have generally had the highest employment
growth
Total employment in mining is more than double what it was before the mining boom
Average wages are generally higher (and have grown faster) in mining-intensive regions than
in other parts of the country
Labour mobility allows the mining industry to support many workers who do not live in mining
regions, thereby spreading the income and employment benefits of mining well beyond where
resource extraction occurs
Fewer than five mining areas are classified in the least adaptive category, and all of them are
located in remote and sparsely populated areas
The economic and employment benefits of mining are not limited to particular phases of the
commodity cycle, but are sustainable in the longer term.
The Productivity Commission’s findings are consistent with a report by Deloitte Access Economics
(commissioned by the MCA) on the combined economic contribution of mining and mining equipment,
technology and services (METS). The report found that the total economic contribution of Australia’s
mining and METS sector was $236.8 billion in 2015-16 – equivalent to around 15 per cent of the
Australia’s gross domestic product (GDP).
Mining and METS activities support 484,100 full-time-equivalent jobs directly and a further 655,700
indirectly – amounting to approximately 10 per cent of total employment. (NB that Deloitte’s estimates
include exploration, minerals extraction and metal refining, but exclude oil & gas.)
While the benefits of mining and METS activities are distributed across Australia, there are a number
of regional areas where the sector makes a particularly significant economic contribution:
The Pilbara region (WA), with a total economic contribution of $37.8 billion (88 per cent of
total regional economic activity) and 93,800 jobs (direct and indirect)
The Bowen-Surat region (Queensland), with a total economic contribution of $18.6 billion (63
per cent of total regional economic activity) and 99,700 jobs (direct and indirect)
The Hunter region (NSW), with a total economic contribution of $15.2 billion (34 per cent of
total regional economic activity) and 93,600 jobs (direct and indirect).
In addition, Deloitte Access Economics has estimated the total economic contribution of mining and
METS to Victoria, South Australia and the Northern Territory in 2015-16:
Victoria – $13.6 billion in value added (4 per cent of total state activity) and 121,700 jobs
South Australia – $8.9 billion in value added (8 per cent of total state activity) and 69,800 jobs
Northern Territory – $3.2 billion (10 per cent of total Territory activity) and 23,500 jobs.

Minerals Council of Australia | 4
2017/001082
Further, individual minerals companies make significant contributions to the economies and
communities of particular regions. A number of examples are provided in this submission.
The Productivity Commission’s initial report also makes sensible policy recommendations for
encouraging regional growth and development. The MCA agrees with the Productivity Commission
that industry diversification should not be pursued as an end in itself, and that all regional
communities would benefit from removing regulatory obstacles to market opportunities and
entrepreneurship. The Productivity Commission is right to emphasise that deregulation is a ‘no
regrets’ policy and that implementation of its previous recommendations for microeconomic reform
has been ‘patchy and slow’.1
In particular, the maintenance of duplicative and unnecessary environmental approvals imposes a
significant opportunity cost on regions that would otherwise benefit from the income and employment
that major projects deliver. A survey of MCA members has identified required areas of policy focus to
improve the industry’s productivity performance. Project approvals processes was nominated as the
area of greatest concern, followed (with equal frequency) by workplace relations and taxes and
royalties.
The Australian minerals industry regards the following reforms as priorities for national and regional
growth and development:
Recommendations
National
1. Streamlining and safeguarding project approvals
Duplication of federal and state environmental approval processes causes unnecessary
complexity and delays in resource projects. Parliament should approve a One-Stop Shop
for approval processes and remove the redundant ‘water trigger’ for coal projects.
Measures should be put in place to prevent vexatious legal challenges to approved projects
by anti-development activists, without reducing environmental protection.2
Some environmental organisations are misusing tax-deductible donations to disrupt and delay
productivity-enhancing investment. The MCA supports early implementation of the
recommendations of the government’s Tax Deductible Gift Recipient Reform Opportunities
discussion paper, to ensure that tax concessions are being used for their intended policy
purpose.3
2. Modernising workplace relations
The recentralisation and overregulation of workplace relations is impeding productivity and
innovation in the Australian resources industry.
The MCA recommends:
- Removing the availability of protected industrial action over business decisions and
confining the content of enterprise agreements to direct employment matters. The
MCA agrees with the Productivity Commission that the Fair Work Act should be
amended to:
Remove issues pertaining to the relationship between an employer and employee
organisations from the list of permitted matters in enterprise agreements
1 Productivity Commission, Transitioning Regional Economics: Initial Report, 20 April 2017, p. 25.
2 Minerals Council of Australia, Submission to Senate Select Committee on red tape inquiry into environmental approvals,
MCA, 18 August 2017. 3 Minerals Council of Australia, Submission on Tax Deductible Gift Recipient Reform Opportunities discussion paper, 4 August
2017.

Minerals Council of Australia | 5
2017/001082
Specify that an enterprise agreement may only contain terms about permitted
matters.4
- Refocusing adverse action provisions that are interfering with reasonable
management decisions, including by reinstating the sole or dominant reason test to
prove claims of contravention, and allowing cost orders to follow the result of the case.5
Rebalancing union right-of-entry provisions by anchoring right of entry provisions in the
need to allow employees access to their representatives (rather than a right of unions to
advance their interests). The MCA supports the Productivity Commission’s proposal that:
The Fair Work Commission should be better able to deal with disputes about
frequency of entry and be required to take into account the cumulative impact on the
employer, the likely benefit to employees of further entries and the union’s reasons
for the frequency of visits.6
Facilitating greenfields agreements by allowing the Fair Work Commission to approve a
greenfields agreement if the terms are at least at the level of similar work performed at
another enterprise covered by an enterprise agreement. Employers should be able to
enter into ‘life of project’ greenfields agreements (consistent with the Productivity
Commission’s recommendation) or at least agreements with a duration of up to and
including five years, according to operational needs.7
Granting greater capacity for employees who are earning over a particular threshold
(such as the existing high income threshold for unfair dismissals) to opt out of enterprise
agreements and enter into individual agreements.8
3. Competitive taxation
Mining is among Australia’s highest taxed industries and faces a heavy tax burden compared
to competitors in other nations. The MCA’s 2016 minerals industry tax survey found that the
minerals industry faced an effective tax rate (company tax plus royalties) of 54.3 per cent in
2014-15. A phased reduction in the company tax rate to at least the OECD average of 25 per
cent is essential to drive future investment in Australian mining.
Stable tax arrangements for off-road fuel use and research and development are vital to
maintaining industry competitiveness and innovation, as well as economic activity in remote
and regional Australia.
4. Affordable and reliable energy
Policies that promote affordable and reliable energy are critical to the productivity and
competitiveness of Australian businesses. Mining is a significant energy user, accounting for
9 per cent of national energy consumption and 11 per cent of electricity use.
A looming gap in baseload energy is emerging. Between now and 2030 around 8,000 MW, or
27 per cent of baseload plant is likely to retire. Yet nothing is being planned to replace this.
To place downward pressure on electricity prices while also ensuring reliable supplies,
Australia urgently needs to address.this looming gap.
Energy policy should be technology-neutral, with all low emissions options treated equally.
High efficiency, low emissions (HELE) coal technologies should be under consideration and
the ban on nuclear power in Australia should be lifted.9
4 Productivity Commission, Workplace Relations Framework: Inquiry Report, Volume 2, Canberra, 21 December 2015, p. 683.
5 Cf. the Productivity Commission, op. cit., p. 622ff.
6 Productivity Commission, Workplace Relations Framework: Inquiry Report, Volume 2, Canberra, 21 December 2015, p. 683,
p. 910. 7 ibid., p. 691.
8 See Minerals Council of Australia, Australia’s workplace relations framework: The case for reform, MCA, 8 August 2017.

Minerals Council of Australia | 6
2017/001082
Australia’s CO2 emissions reduction target for 2030 (26 to 28 per cent on 2005 levels) is
credible and appropriate, but it imposes an greater economic burden greater than the targets
of other developed nations. To limit the cost of meeting this target, access to international
abatement should be permitted.
5. Free trade and open markets
A liberal foreign investment regime, with consistent application of rules and thresholds, is vital
to investor confidence and the future growth of the minerals industry. The government should
reassure investors that Australia is still open for business by minimising the burden of new
reporting requirements for foreign owners of agricultural land and water entitlements.
The MCA supports continued liberalisation of Australia’s international trade relationships
through high-quality multilateral, regional and bilateral trade agreements. Australia should
continue its current program of negotiations for bilateral free trade agreements, giving
particular priority to the negotiations with India, Indonesia and Peru. It should also work with
regional trading partners to conclude the Regional Comprehensive Economic Partnership and
to realise the gains in market access secured in Trans-Pacific Partnership, notwithstanding
the decision by the US Administration to withdraw from this agreement.
The government should refocus on deregulation, not just ‘better’ or ‘best practice’ regulation.
Australia’s coastal shipping should be deregulated to allow more efficient transport of freight.
Victoria
1. Affordable and reliable power
Supporting (together with the federal government) the construction of a new high-efficiency, low-
emissions (HELE) lignite power station in the La Trobe Valley
A lignite HELE plant would provide new baseload power at a much lower cost than gas or wind or
solar with battery storage
2. Encouraging minerals investment
Designating the minerals industry as a priority sector for Victoria with designated investment
attraction and project facilitation support
This would include appointment of sector specialists, located in Ballarat, Bendigo and
Gippsland, within Regional Development Victoria to facilitate major minerals development
projects. The specialists would support coordinated engagement with relevant approvals
agencies and enable enhanced regional consideration of project opportunities and impacts.
Five existing minerals development and mine life extension projects could benefit from this
support.
3. Streamlining environmental regulations
Reforming Victoria’s development approvals processes to improve inter-agency coordination,
efficiency and effectiveness and reduce unnecessary delays
Urgent reform is required to modernise the Environment Effects Statement (EES) process, a
requirement for development projects expected to have a regional or state-wide impact under
the Environment Effects Act 1978. Reform should improve process transparency and
efficiency and transition to outcomes-based rather than activities-based conditions.
Harmonisation of state and federal environmental approvals would improve efficiency without
compromising standards. Restarting the assessment bilateral agreement between the
Commonwealth and Victorian Governments to eliminate overlap between the
9 See Solstice Development Services, Prospects for a HELE USC Coal-fired Power Station, June 2017, released on 3 July
2017. This report demonstrates that HELE coal plants – which would have operating lives of several decades – are viable and
affordable options for replacing Australia’s existing ageing coal fired power stations.

Minerals Council of Australia | 7
2017/001082
Commonwealth’s Environment Protection and Biodiversity Conversation Act 1990 and the
Victorian Environment Effects Act 1978 and Flora and Fauna Guarantee Act 1988 is the first
step.
4. Improving efficiency of offset regime
Broadening the range of native vegetation offset tools to improve flexibility and enable proponents
to strategically contribute to local biodiversity targets
Introducing financial-based offsets in Victoria would enhance the workability of the regulations
and encourage targeted support for community-identified biodiversity conservation projects in
host communities. Financial-based offsets are already available in some Melbourne urban
growth areas. There is no reason why they should not be available to regional industries.
5. Strategic land-use planning
Supporting councils to undertake strategic land use planning, building on the COAG Multi-Land
Use Planning Framework
Five regional areas identify minerals development as a potential source for future growth.
Regional Development Victoria could assist local councils to identify areaswith high minerals
prospectivity, understand potential concurrent and sequential land uses and strategically plan
for new investment.10
6. Developing Victoria’s resources
Removing restrictions on development of Victoria’s resources, including lignite but also
conventional and unconventional gas
There is no sound scientific basis for the Victorian government’s ban on development of the
state’s unconventional gas resources or moratorium on conventional gas exploration and
development. This policy simply drives up energy costs, which in turn reduces both the
competitiveness of Victorian businesses and the standard of living of households.
Northern Territory
1. Maximising productivity
Establish a One-Stop Shop approach for Northern Territory and Commonwealth
environmental assessment and approval processes
Ensure that monitoring and reporting requirements are risk-based.
2. Maximising benefits through resource management and security bond reforms
Ensure that regulation of access to water is transparent and consistent with principles of
sustainable use and acknowledge the needs of the mineral sector (including ability to use
lower-quality water for particular activities)
Modernise the current security bond system to accept a broader range of forms (e.g. insured
bonds), to reduce bond sizes in line with progressive rehabilitation and demonstrated strong
environmental performance of operators
Broaden strategic land use approaches that consider landholder and industry interests to
maximise benefits from multiple land uses.
10
The five regional growth areas are Hume, Gippsland, Central Highlands, Loddon Mallee North and Wimmera Southern Mallee.

Minerals Council of Australia | 8
2017/001082
3. Investing in strategic infrastructure
Through establishment of a multi-disciplinary working group comprising government and
industry representatives, develop a priority list of investments, maximising return on
investment across industries
NT Government and industry to work together to pursue Commonwealth funding through the
Northern Australia Infrastructure Facility (for concessional loans) and other initiatives
NT Government and industry to pursue jointly-funded infrastructure projects, through private-
public partnerships across industries with similar needs.
4. Stimulate greater industry investment in exploration
Secure funding for priority surveys in the NT through the Commonwealth’s ‘Exploring for the
Future’ initiative
Adequately fund the NT Geological Survey, so it can continue to generate priority geoscientific
datasets to attract greater exploration investment in the Territory
Work with mineral companies to identify priority areas and types of surveys to attract further
investment.
5. Promoting and realising broad community benefits from mining
Renew the Territory’s focus on attracting investment and promoting development through a
targeted marketing campaign and updated vision statement
Provide dedicated project facilitators to assist investors in navigating and meeting regulatory
requirements
Collaborate and support industry to redress misinformation about the value of the minerals

Minerals Council of Australia | 9
2017/001082
1. CONTRIBUTION OF MINING TO NATIONAL AND REGIONAL ECONOMIES
The Productivity Commission’s initial report on transitioning regional economies confirms the
ongoing and significant contribution of the resources sector. It refutes the notion that the
Australian economy is transitioning away from mining, by showing that mining regions are
characterised by high adaptive capacity, high employment growth, high (and faster growing)
wages, and resilience across commodity cycles.
The Productivity Commission’s findings are consistent with a report by Deloitte Access
Economics (commissioned by the MCA, Appendix A), which found that the combined
economic contribution of mining and mining equipment, technology and services (METS) is
around 15 per cent of GDP and approximately 10 per cent of total employment
The Productivity Commission highlights the importance of regulatory reform to encouraging
growth and employment in regions and warns against industry diversification as an end in
itself. The MCA agrees that continued microeconomic reform – including a One-Stop Shop
for environmental approvals and a more ambitious deregulation agenda – would help all
regional communities to make the most of their natural endowments and market
opportunities.
Economic contribution of mining and competitive challenges
The Australian mining industry remains a pillar of the Australian economy. Australia’s resources
sector remains the nation’s largest source of export revenue – accounting for 73 per cent of
Australia’s merchandise trade in 2016-17. Iron ore and coal are Australia’s top two exports by value.11
A report by Deloitte Access Economics (commissioned by the MCA, Appendix A) found that the
combined economic contribution of mining (excluding oil and gas but including metal refining) and
mining equipment, technology and services (METS) is around 15 per cent of GDP. Mining and METS
activities support a total of 1.1 million jobs across Australia, representing approximately 10 per cent of
total employment (Box 1).
Because mining in Australia is capital-intensive, the industry’s capital productivity has a large bearing
on its multifactor productivity; that is, the growth of output above the growth of labour and capital
combined.
Between 2006-07 and 2015-16, the resources sector (including oil and gas) undertook unparalleled
investment in new mines, equipment and infrastructure, with a corresponding net capital stock of $841
billion in June 2016.12
Measured productivity in mining declined during this period, owing to the lag
between investment and production, rapid workforce expansion with constrained labour markets, and
increased mining of lower grade ores that are more costly to extract. However, as the mining boom
moved from the investment phase to the production phase, multifactor productivity growth turned
positive, recording 7.0 per cent growth in 2014-15 and 2.4 per cent in 2015-16.13
Resources regions and their workforces have benefitted from substantial investments made over the
past decade. As the Productivity Commission observes:
Ultimately … many mining regions are experiencing transition due to a re-adjustment to the production phase
following the resources investment boom. Their large resource base and the expansion of capacity
generated during the boom are likely to provide economic and employment opportunities for decades to
come.14
11
Australian Bureau of Statistics, International Trade in Goods and Services, Australia, Jun 2017, released on 3 August 2017, Tables 3 and 12b. 12
Australian Bureau of Statistics, Australian System of National Accounts, 2015-16, ABS cat no. 5204, released on 28 October 2016. 13
See Productivity Commission, PC Productivity Update 2016, Canberra, released on 26 April 2016, p. 7 14
Productivity Commission, Transitioning Regional Economics: Initial Report, 20 April 2017, p. 18.

Minerals Council of Australia | 10
2017/001082
Box 1: Mining and METS sector accounts for 15 per cent of GDP
A report by Deloitte Access Economics (commissioned by the MCA) reveals that the total economic contribution of Australia’s METS sector was $236.8 billion in 2015-16 – equivalent to around 15 per cent of the Australia’s gross domestic product (GDP).
Mining and METS activities support 484,100 full-time-equivalent jobs directly and a further 655,700
indirectly – amounting to approximately 10 per cent of total employment
While the benefits of mining and METS activities are distributed across Australia, there are a number
of regional areas where the sector makes a particularly significant economic contribution:
The Pilbara region (WA), with a total economic contribution of $37.8 billion (88 per cent of
total regional economic activity) and 93,800 jobs (direct and indirect)
The Bowen-Surat region (QLD), with a total economic contribution of $18.6 billion (63 per
cent of total regional economic activity) and 99,700 jobs (direct and indirect)
The Hunter region (NSW), with a total economic contribution of $15.2 billion (34 per cent of
total regional economic activity) and 93,600 jobs (direct and indirect).
The report by Deloitte Access Economics also features ten case studies of mining and METS
companies, which demonstrate that innovation and technological improvements are central to the
efficiency and global competitiveness of the sector.
Deloitte further points out that Australia’s comparative advantage in mining and METS not only hinges
on innovation; it also depends on policies that strengthen competition, support the accumulation of
skills and capital, and enable firms to respond flexibly to changing market conditions.15
The expanded capital stock has underpinned average weekly earnings of resource sector workers
increasing 66 per cent over the past decade to $2,635 – 77 per cent higher than the average for other
industries (Chart 1).16
The Productivity Commission notes that average wages are generally higher (and have grown faster)
in mining-intensive regions than in other parts of the country:
Between 2005-06 and 2010-11, annual average income growth in mining regions ranged from 5.5 to 6.7 per
cent, considerably higher than the Australian average of 4.9 per cent.17
The resources sector employs approximately 230,000 people in high-value, high-wage, high-skilled
jobs – nearly three times higher than in 2000 (Chart 2).
The Productivity Commission notes that mining generates employment well beyond where resource
extraction occurs, owing to fly-in, fly-out (FIFO) and drive-in, drive out (DIDO) working arrangements,
as well as the location of many mining jobs in cities (section 4).18
The Productivity Commission also affirms that resources regions have continued to grow in terms of
employment, population and value of production.19 It finds that:
Most regions that have mining as their main source of employment have relatively high adaptive capacity ...
There are very few (less than five) mining areas among the regions identified as being in the ‘least adaptive’
category … They are all located in very remote regions, which means they cover large geographic areas
with sparse populations.20
15
Deloitte Access Economics, Mining and METS: engines of economic growth and prosperity for Australians, 29 March 2017. 16
Australian Bureau of Statistics, Average Weekly Earnings, Australia, Nov 2016, ABS cat. no. 6302.0, released on 23 February 2017. 17
Productivity Commission, Transitioning Regional Economics: Initial Report, 20 April 2017, p. 64. 18
ibid., pp. 66, 68. 19
ibid., p. 64. 20
ibid., p. 109.

Minerals Council of Australia | 11
2017/001082
Chart 1: Australian resources sector – net capital stock and average weekly earnings, 2000-01
to 2015-16
Source: ABS21
Chart 2: Australia’s resources sector – exports and employment, 1990-91 to 2016-17
Source: ABS and Department of Industry, Innovation and Science.22
The 2016-17 export figure is the department’s June 2017
estimate. The 2016-17 employment figure is the average year to date (ABS cat. no. 6291.0.55.003).
21
Australian Bureau of Statistics, Australian System of National Accounts, ABS cat. No 5204.0, 2015-16, (net capital stock) Australian Bureau of Statistics, Labour Force, Australia, Detailed, Quarterly, May 2017, ABS cat. no. 6291.0.55.003, released on 22 June 2017, (average weekly earnings) 22
Department of Industry, Innovation and Science, Resources and Energy Quarterly – June 2017, released on 7 July 2017. Australian Bureau of Statistics, 6921.0.55.003 - Labour Force, Australia, Detailed, Quarterly, May 2017, 22 June 2017, viewed 7 August 2017 (employment statistics).
0
600
1,200
1,800
2,400
3,000
0
200
400
600
800
1,000A
verage
We
ekly Earn
ings, A
$
Ne
t C
apit
al S
tock
A$
b
Net Capital Stock Average Weekly Earnings
0
50
100
150
200
250
300
0
50
100
150
200
250
300
'00
0 e
mp
loye
d
A$
bil
lio
n
Resources employment (RHS) Resources exports by value (LHS)

Minerals Council of Australia | 12
2017/001082
Importantly, the Productivity Commission argues that the economic and employment benefits of
mining are not limited to particular phases of the commodity cycle:
Although mining regions are exposed to commodity cycles, many have proven to be sustainable in the
longer term where there are secure resources that can be mined economically … [R]egions (such as the
Pilbara) that have a comparative advantage in markets for minerals and commodities have benefited from
significant investments in new projects and expansions during the investment boom. This will likely provide
an economic and employment base in these regions for decades to come, largely irrespective of commodity
market cycles.23
Further, the Australian minerals industry paid $177 billion in company tax and royalties alone over the
decade to 2015-16.24
The Productivity Commission has confirmed that the industry receives
‘negligible’ industry assistance.25
23
Productivity Commission, Transitioning Regional Economics: Initial Report, 20 April 2017, p. 111. 24
Deloitte Access Economics, Estimates of royalties and company tax accrued in 2015-16, report prepared for the Minerals Council of Australia, MCA, 5 January 2017. 25
Productivity Commission, Trade and Assistance Review 2015-16, released on 29 July 2017, p. 30.

Minerals Council of Australia | 13
2017/001082
Benefits of mining operations to regions in NSW and Queensland
Box 2: Centennial Coal – contributing $400 million to lower Hunter and Lithgow regions
Centennial Coal supplies around 40 per cent of New South Wales’ coal-fired electricity generating
capacity. It also exports coal. Centennial Coal has more than 1,400 employees and five operating
coal mines in New South Wales. It has a large presence in the lower Hunter and Lithgow regions. In
2015, Centennial Coal supported 133 full-time-equivalent staff over and above direct employment,
comprising around 1.5 per cent of its labour force.
Support for local business
Centennial Coal has a strong focus on supporting local businesses. By using local suppliers for 46
per cent of its goods and services, Centennial Coal contributes approximately $400 million to the
lower Hunter and Lithgow local economies. Local procurement supports a range of local businesses
including construction, accounting, surveyors, environmental specialists, caterers, recruitment
services, equipment hire, sign writing and printers, earthmoving/transport and logistics providers.
Local sponsorships
Centennial Coal has a local sponsorship program to support grass-roots community based
organisations. It also supports its workforce in participating in community engagement.
Apprentices and trainees
Centennial Coal provides training opportunities including:
53 apprentices (mechanical/electrical)
Four trainees
Two graduates (mining/electrical engineer)
Seven undergraduates.
Minimising the socioeconomic impact of mine closures
In the Kandos/Rylstone area, Centennial Coal’s community sponsorship approach has shifted
towards a strategic capacity building approach that encourages alternative employment opportunities.
For example, Centennial Coal has helped to build capacity for tourism in the region. An example of
this is in supporting the Kandos Museum with trips to the Charbon Box Cut, which is a popular place
for geology students to visit.
Website: http://www.centennialcoal.com.au/

Minerals Council of Australia | 14
2017/001082
Box 3: Newcrest, Cadia Valley Operations
Situated near Orange and Blayney among farmland, Newcrest’s Cadia Valley Operations (Cadia) is
Australia’s largest gold mine.
Community engagement
Cadia holds an annual open day. Its May 2016 open day, held in conjunction with the Orange
Farmers Market, attracted more than 4,000 members of the local community and incorporated more
than 70 market stalls, an art exhibition, live music and an interactive mining display centre that
featured gold panning, a light vehicle simulator, virtual underground tour and two 3-D Heritage
models. Buses from the Orange Showground took 2,000 people on tours of the mine. $4,680 was
raised, which was donated to the Rotary Club of Orange Daybreak.26
Volunteering
Newcrest recognises and encourages volunteering efforts of its Cadia workforce through the Cadia
Good Onya! Program. When a Newcrest employee or his/her spouse volunteers 25 hours or more of
personal time during a year, Newcrest will donate $250 to that organisation to recognise their
contribution. In 2014, Newcrest awarded 88 Good Onya! grants of $250 each.
Orange Hospital
In April 2017, Cadia donated $70,000 to Orange hospital to enable it to purchase the hospital’s first
Terumo Spectra Optia apheresis machine that helps treat patients by removing plasma and
antibodies from the blood, which cause significant and potentially fatal illnesses. Prior to acquiring the
machine, patients had to travel to Sydney regularly for treatment, sometimes more than once a
week.27
Support to schools
Cadia has provided environmental grants for local schools to encourage environmental excellence
under the EnviroSmart awards. Newcrest donated $500 to support 12 projects in 2015.
Tertiary education
Cadia offers $9,000 per year tertiary education and indigenous scholarships to local secondary school
students. In 2016, it awarded two tertiary scholarships to local students commencing studies in
nursing and medicine, and an Indigenous scholarship to a local student studying psychology.28
In
2013, Cadia donated ‘Cadia Cottage’ to TAFE Western. The mock domestic house is being used as
part of the electrical trade coursework through TAFE.29
Festivals
Cadia was the major sponsor of the Texture of One 2017 Blayney Art Festival Weekend.30
Cadia
provided seed funding for the Newcrest Orange Challenge which is an annual cycling event held in
Orange attracting hundreds of riders to the district.
Website: http://www.cadiavalley.com.au
26
Newcrest Mining, Cadia Valley Operation: Mine Open Day, viewed on 6 August 2017. 27
‘New machine brings treatment closer to home at Orange dialysis unit’, Central Western Daily, 6 April 2017 28
Newcrest Mining, Cadia Valley Operations: Tertiary Scholarships, viewed on 6 August 2017. 29
TAFE NSW, TAFE Western to unveil ‘Cadia Cottage’, April 2013. 30
Textures of One, Sponsors, viewed on 6 August 2017.

Minerals Council of Australia | 15
2017/001082
Box 4: Rio Tinto’s support for regional communities in Queensland
Rio Tinto
Rio Tinto is a global mining and metals group with more than 140 years of history. It places a high
emphasis on developing strong, trusting and lasting relationships with host communities. Rio Tinto’s
Communities and Social Performance (CSP) standard guides how it maintains community
relationships and partnerships. In 2016, Rio Tinto supported over 470 community initiatives
nationwide.
Examples of projects that support regional communities in the Queensland are:
Queensland
Rio Tinto operates the Hail Creek Mine Community Development Fund to support communities in
the Nebo, Mackay, Mirani and Sarina shires and the Gladstone Community Development Fund to
support the wider region.
Through Future Reef 2.0, Rio Tinto, CSIRO and the Great Barrier Reef Foundation have
partnered to help preserve the Great Barrier Reef. A Rio Tinto vessel that travels between Weipa
and Gladstone monitors ocean chemistry along the 2,300km of the Great Barrier Reef Marine
Park. This research gathers data essential to combatting the threat of acidification to the Reef.
Rio Tinto has partnered with the North Queensland Cowboys NRL Team to provide mentoring
support to Indigenous staff across the Amrun project and to support initiatives on site and in
Western Cape York Communities. The Try for 5! Program has been established at the Aurukun
State School to encourage greater student attendance.
In its fifth year, the Future Indigenous Leaders Program is a partnership between Rio Tinto and
the Queensland Reds which provides leadership coaching and mentoring for Indigenous girls and
boys from the communities of Cherbourg, Woorabinda and Yarrabah. The program is designed
to support the students to make a smooth transition from primary school to high school.
The Rio Tinto Hail Creek Mine CQ University Scholarship Programme offers annual scholarships
to first-year students studying at the university’s Mackay campus. Five scholarships worth $4,000
will be offered in 2017.31
Rio Tinto Hail Creek Mine and employees support the Mackay River2Reef Charity Ride. In
October 2016, the mine helped to raise more than $80,000 for two Mackay-based charities.32
The Wiri Yuwiburra Community Benefits Trust was established in 1998, and is supported annually
by Hail Creek Coal.33
Website: http://www.riotinto.com/ourcommitment/community-relationships-21467.aspx
Policies to promote national and regional growth
The Productivity Commission’s initial report correctly emphasises that regulatory reform would help all
regional economies to grow and develop:
All regional communities … would benefit from the removal of obstacles that prevent people and businesses
from taking advantage of opportunities, particularly those in which the region has a comparative advantage.
Barriers include unnecessarily complex and costly regulatory processes and regulations that restrict what
people (including business owners) can do. The Commission has previously made recommendations to
reform regulations affecting regional communities, including in relation to planning, zoning and development
processes, environmental regulations, and occupational licensing arrangements …34
31
Rio Tinto, $20,000 scholarship programme opens up exciting pathways for Central Queensland students, 9 March 2017, viewed on 21 July 2017 32
Rio Tinto, Hail Creek helps raise $80,000 for Mackay charities, 2 October 2016. 33
Rio Tinto, Wiri Yuwiburra Community Benefits Trust, viewed on 21 July 2017. 34
Productivity Commission, Transitioning Regional Economics: Initial Report, 20 April 2017, p. 24.

Minerals Council of Australia | 16
2017/001082
The Productivity Commission also affirms that deregulation is a ‘no regrets’ policy and that its
previous recommendations for microeconomic reform should be adopted immediately by all
governments:
Removing unnecessary regulatory barriers is a ‘no-regrets’ or ‘win-win’ policy option – these reforms are
justifiable in their own right and create incentives and open up new opportunities for communities to adapt to
change. They should be pursued by all governments. Although the advantages of such reform are clear,
adoption of previously recommended reforms has been patchy and slow. Given the challenges to regions
highlighted in this report, governments should expedite these reforms. Failure to do so will unnecessarily
increase the pressure faced by vulnerable communities and reduces their future prospects.35
The Productivity Commission also warns against pursuing industry diversification as a strategy for
regional development:
Diversification for its own sake is not always better — regions should focus on producing goods or services
that can earn them the highest income.36
In its submission to the Productivity Commission’s review on increasing Australia’s prosperity, the
MCA argued that the federal government should adopt the famous ‘to do’ list compiled by Gary Banks
in 2012. Professor Banks nominated a number of outstanding recommendations of the Productivity
Commission, including several that remain acutely relevant to the Australian minerals industry:
Reform complex and duplicative project approval processes
Test workplace regulations to ensure that: (a) they deliver public interest benefits which
exceed the economic costs; and (b) these benefits cannot be delivered in another, better way
Improve Australia’s tax system by relying on fewer and less distorting taxes
Rigorously review significant restrictions on competition, including coastal shipping protection
Terminate selective industry subsidies that cannot deliver demonstrable net social benefits,
including assistance for renewable energy
Embed cost-benefit analysis into regulatory practices, including consideration of alternatives
Abolish remaining tariffs and limit provisions for anti-dumping action.37
Some of these recommendations have been reiterated and expanded in subsequent work by the
Productivity Commission, such as the reports on Australia’s workplace relations framework and major
development approval processes.
A survey of MCA members has identified required areas of policy focus to improve the industry’s
productivity performance. Project approvals processes was nominated as the area of greatest
concern, followed (with equal frequency) by workplace relations and taxes and royalties.
The Australian minerals industry regards the following reforms as priorities for national and regional
growth and development:
1. Streamlining and safeguarding project approvals
Duplication of federal and state environmental approval processes causes unnecessary
complexity and delays in resource projects. Parliament should approve a One-Stop Shop
for approval processes and remove the redundant ‘water trigger’ for coal projects.
Measures should be put in place to prevent vexatious legal challenges to approved projects
by anti-development activists, without reducing environmental protection.38
35
ibid., p. 24f. 36
ibid., p. 51. 37
Gary Banks, Productivity Policies: the ‘to do’ list, address to Economic and Social Outlook Conference, Melbourne, 1 November 2012, pp. 8-18. 38
Minerals Council of Australia, Submission to Senate Select Committee on red tape inquiry into environmental approvals, MCA, 18 August 2017.

Minerals Council of Australia | 17
2017/001082
Some environmental organisations are misusing tax-deductible donations to disrupt and delay
productivity-enhancing investment. The MCA supports early implementation of the
recommendations of the government’s Tax Deductible Gift Recipient Reform Opportunities
discussion paper, to ensure that tax concessions are being used for their intended policy
purpose.39
2. Modernising workplace relations
The recentralisation and overregulation of workplace relations is impeding productivity and
innovation in the Australian resources industry.
The MCA recommends:
- Removing the availability of protected industrial action over business decisions and
confining the content of enterprise agreements to direct employment matters. The MCA
agrees with the Productivity Commission that the Fair Work Act should be amended to:
- Remove issues pertaining to the relationship between an employer and employee
organisations from the list of permitted matters in enterprise agreements
- Specify that an enterprise agreement may only contain terms about permitted matters.40
- Refocusing adverse action provisions that are interfering with reasonable management
decisions, including by reinstating the sole or dominant reason test to prove claims of
contravention, and allowing cost orders to follow the result of the case.41
Rebalancing union right-of-entry provisions by anchoring right of entry provisions in the
need to allow employees access to their representatives (rather than a right of unions to
advance their interests). The MCA supports the Productivity Commission’s proposal that:
The Fair Work Commission should be better able to deal with disputes about
frequency of entry and be required to take into account the cumulative impact on the
employer, the likely benefit to employees of further entries and the union’s reasons
for the frequency of visits.42
Facilitating greenfields agreements by allowing the Fair Work Commission to approve a
greenfields agreement if the terms are at least at the level of similar work performed at
another enterprise covered by an enterprise agreement. Employers should be able to
enter into ‘life of project’ greenfields agreements (consistent with the Productivity
Commission’s recommendation) or at least agreements with a duration of up to and
including five years, according to operational needs.43
Granting greater capacity for employees who are earning over a particular threshold
(such as the existing high income threshold for unfair dismissals) to opt out of enterprise
agreements and enter into individual agreements.44
39
Minerals Council of Australia, Submission on Tax Deductible Gift Recipient Reform Opportunities discussion paper, 4 August 2017. 40
Productivity Commission, Workplace Relations Framework: Inquiry Report, Volume 2, Canberra, 21 December 2015, p. 683. 41
Cf. the Productivity Commission, op. cit., p. 622ff. 42
Productivity Commission, Workplace Relations Framework: Inquiry Report, Volume 2, Canberra, 21 December 2015, p. 683, p. 910. 43
ibid., p. 691. 44
See Minerals Council of Australia, Australia’s workplace relations framework: The case for reform, MCA, 8 August 2017.

Minerals Council of Australia | 18
2017/001082
3. Competitive taxation
Mining is among Australia’s highest taxed industries and faces a heavy tax burden compared
to competitors in other nations. The MCA’s 2016 minerals industry tax survey found that the
minerals industry faced an effective tax rate (company tax plus royalties) of 54.3 per cent in
2014-15. A phased reduction in the company tax rate to at least the OECD average of 25 per
cent is essential to drive future investment in Australian mining.
Stable tax arrangements for off-road fuel use and research and development are vital to
maintaining industry competitiveness and innovation, as well as economic activity in remote
and regional Australia.
4. Affordable and reliable energy
Policies that promote affordable and reliable energy are critical to the productivity and
competitiveness of Australian businesses. Mining is a significant energy user, accounting for
9 per cent of national energy consumption and 11 per cent of electricity use.
A looming gap in baseload energy is emerging. Between now and 2030 around 8,000 MW, or
27 per cent of baseload plant is likely to retire. Yet nothing is being planned to replace this.
To place downward pressure on electricity prices while also ensuring reliable supplies,
Australia urgently needs to address.this looming gap.
Energy policy should be technology-neutral, with all low emissions options treated equally.
High efficiency, low emissions (HELE) coal technologies should be under consideration and
the ban on nuclear power in Australia should be lifted.45
Australia’s CO2 emissions reduction target for 2030 (26 to 28 per cent on 2005 levels) is
credible and appropriate, but it imposes an greater economic burden greater than the targets
of other developed nations. To limit the cost of meeting this target, access to international
abatement should be permitted.
5. Free trade and open markets
A liberal foreign investment regime, with consistent application of rules and thresholds, is vital
to investor confidence and the future growth of the minerals industry. The government should
reassure investors that Australia is still open for business by minimising the burden of new
reporting requirements for foreign owners of agricultural land and water entitlements.
The MCA supports continued liberalisation of Australia’s international trade relationships
through high-quality multilateral, regional and bilateral trade agreements. Australia should
continue its current program of negotiations for bilateral free trade agreements, giving
particular priority to the negotiations with India, Indonesia and Peru. It should also work with
regional trading partners to conclude the Regional Comprehensive Economic Partnership and
to realise the gains in market access secured in Trans-Pacific Partnership, notwithstanding
the decision by the US Administration to withdraw from this agreement.
The government should refocus on deregulation, not just ‘better’ or ‘best practice’ regulation.
Australia’s coastal shipping should be deregulated to allow more efficient transport of freight.
45
See Solstice Development Services, Prospects for a HELE USC Coal-fired Power Station, June 2017, released on 3 July
2017. This report demonstrates that HELE coal plants – which would have operating lives of several decades – are viable and
affordable options for replacing Australia’s existing ageing coal fired power stations.

Minerals Council of Australia | 19
2017/001082
2. CONTRIBUTION OF MINING AND METS TO REGIONS IN VICTORIA
Deloitte Access Economics has estimated that the total economic contribution to Victoria of
the mining and mining equipment, technology and services (METS) sector was $13.6 billion
in 2015-16. The corresponding total employment contribution was 121,700 full-time jobs.
Lignite-fired electricity generation is integral to the competitiveness of Victorian manufacturers
and the affordability and reliability of the National Australian Electricity Market.
With approximately 1,100 years of accessible resources, the opportunity cost of not
developing Victoria’s lignite industry is high. The federal and Victorian governments should
support the construction of a new high-efficiency, low-emissions lignite power station in the
Latrobe Valley. The state government should also improve environmental approval
processes and land use planning to make Victoria a more attractive destination for minerals
investment.
A significant economic contribution
Deloitte Access Economics estimates that in 2015-16, Victoria’s mining and METS sector contributed
$8.6 billion in direct value added to the state’s economy, supporting 88,000 full-time jobs. Deloitte
also estimated a $5.4 billion indirect contribution, supporting a further 33,700 full-time jobs (see
Appendix B).
Together, the overall direct and indirect contribution of the mining and METS sector to Victoria in
2015-16 was $13.6 billion, representing 4 per cent of economic activity in the state. In addition to
Melbourne-based mining services, a significant driver of this contribution is regionally based mining
and METS operations.
Mining activity generated an estimated $81 million in royalties for Victoria in 2016-17. Over the four
years to 2020-21, mining royalties are forecast to total $373 million.46
The vast majority of mining
royalties in Victoria are generated from lignite (brown coal) production for energy generation. The
mining of lignite (brown coal) in the Latrobe Valley generated $66.4 million in state royalties in 2016-
17 and is expected to yield approximately $300 million over the four years to 2020-21.47
While the contribution of lignite royalties to state revenue significant, the tripling of the royalty rate –
from 7.6 cents to 22.8 cents per gigajoule of energy from 1 January 2017 – has contributed to the
recent significant increase in electricity prices. In its 2016-17 Budget, the Victorian government
forecast this would deliver $252 million of additional revenue between 2016-17 and 2019-20. The
increase was justified on the spurious basis of aligning the royalty rate for lignite (which is only used
for domestic energy generation) with the royalty regimes for the black coal industries of Queensland
and New South Wales (which export around 90 per cent of their output).
Regional benefits of mining and METS
Victoria’s mining sector includes lignite operations in the Latrobe Valley, gold production in central
Victoria and a pipeline of world-class minerals sands projects in the Murray and Gippsland Basins.
Australia’s only antimony mine is also located near Bendigo (Box 5).
Existing operations contribute directly through local communities through employment and business
opportunities as well as support for community initiatives and projects. Deloitte Access Economics
confirms that the state is a ‘national hub for METS exports, with strong manufacturing and
engineering capabilities operating in both metropolitan Melbourne and in regional hubs such as
Geelong, Ballarat and Bendigo’ (Appendix B). The spread of manufacturing and engineering
46
State of Victoria, Victorian Budget 17/18: Statement of Finances (incorporating Quarterly Financial Report No. 3), Melbourne, 2 May 2017, p. 167. 47
ibid. The Earth Resources Regulation agency in Victoria informed the MCA secretariat on 5 July 2017 that the current estimate of the share of lignite royalties in total state royalties for 2016-17 is 82 per cent.

Minerals Council of Australia | 20
2017/001082
capability across regional Victoria is another important means by which the benefits of mining are
shared.
Box 5: Contribution of gold and antimony mining to Bendigo and Heathcote
Fosterville Mine
The Fosterville Gold Mine is an underground mine situated 20 kilometres from Bendigo. Owned by
Kirkland Lake Gold, it has a strong community engagement investment program including outreach
sessions to discuss future exploration projects at the mine and an annual open day, which in 2016
attracted more than 500 visitors
As part of this approach, Fosterville Gold Mine runs a community grants program that helps
community groups undertake a wide range of activities. The round is conducted twice a year. The
mine has assisted 168 community groups and allocated over $240,000 through the grants program.
In April 2017, Fosterville Gold Mine announced six successful community grants, with recipients
including the Bendigo Science and Technology Centre, Eaglehawk Hockey Club, Central Deborah
Gold Mine, Bendigo Squash Club, St Pauls Cathedral and the Strathfieldsaye Football Netball Club.
Costerfield gold and antimony mine
Mandalay Resources’ Costerfield gold-antimony mine is situated in central Victoria, around 10km
south of Heathcote in Victoria. Mandalay undertook community surveys in three locations in 2016.
Based on the responses, Costerfield scored highly with 51 per cent of respondents saying they highly
valued the mine’s presence in their communities and 35 per cent said they moderately valued it.
Kalianna School
On 4 March 2016, Mandalay Resources Costerfield Operations provided $6,700 to the Kalianna
School in Bendigo. The school has approximately 230 students and 65 dedicated staff, providing
education for children with physical, mental or developmental needs. Funds were used to purchase
new uniforms for the cheerleading team, which won the Victorian state schools championship. The
school will also use the money to purchase specialised play equipment.48
The Costerfield mine donated $5,000 to Headspace Bendigo to install a shower and buy toiletries for
young people in need. Headspace provides early intervention mental health services to 12 to 25 year
olds, and assistance in promoting young peoples’ well-being.49
An untapped opportunity for new regional jobs and investment
With its skilled labour force and growing global demand for minerals, Victoria has the potential to
transform its minerals endowment prospectivity into a new pipeline of new investment and jobs in
regional Victoria.
This endowment includes 42.8 per cent and 34.5 per cent of Australia’s economically demonstrated
resources of rutile and zircon (mineral sands) respectively.50
Geological Survey Victoria (GSV)
studies also indicate potential for discovery of new multi-million ounce gold deposits. New research
also indicates the potential for copper discoveries.51
A new minerals investment pipeline is much-needed in regional Victoria, which has been
disproportionately affected by structural changes underway across the state’s economy. In 2015-16
the regional Victorian economy recorded its ninth consecutive year of economic decline.52
SGS
48
Mandalay Resources, Communities value our presence,, viewed 5 July 2017. 49
Mandalay Resources, Costerfield Case Study, viewed 5 July 2017. 50
Commonwealth of Australia, Mineral Sands, Geoscience Australia, viewed on 16 March 2017. 51
State of Victoria, Key Resource Opportunities, Department of Economic Development, Jobs, Transport and Resources, viewed 16 May. 52
SGS Economics and Planning, Australian Cities Accounts – 2015-16, Melbourne, 2016, p. 40.

Minerals Council of Australia | 21
2017/001082
Economics and Planning attributes this contraction to a 20 per cent decline in manufacturing output in
regional Victoria since 2005-06.53
There is strong recognition of the potential for economic diversification through development of the
state’s minerals resources within regional Victoria. The Productivity Commission cited the Victorian
government-commissioned 2015 Regional Economic Development and Services Review, which
identified development of the state’s earth resources (particularly mineral sands) as an opportunity to
‘drive inclusive growth and create regional jobs.’54
Box 6: Kalbar Fingerboards Mineral Sands: Employment opportunities for Gippsland
Located near Glenaladale on the Wellington and East Gippsland Shire Board, the Kalbar
Fingerboards Minerals Sands is based on one of the largest and highest grade mineral sands
deposits in the world for processing into heavy mineral concentrate. When operational, the project
will benefit from growing global demand for heavy mineral sands and be Victoria’s sixth mineral sands
operation.
Over an initial mine life of 20 years, the mine could provide direct jobs for 110 people in addition to a
further 200 across the region. This is a significant opportunity for the Gippsland region, which has
recently been affected by the closure of a number of significant employers in the energy and timber
sectors.
Box 7: Donald Mineral Sands: New development for the Murray Basin
Donald Mineral Sands, located 66 kilometres northeast of Horsham in Victoria’s Murray Basin, is a
titanium and zircon mineral sand development project.
Over recent years, over $60 million has been invested to support development of Donald Mineral
Sands with work underway to optimise the mine plan and obtain other final approvals. The current
estimated cost suggests the project could be one of the most significant private investment projects in
regional Victoria. Once operational, the project could provide 200 direct jobs over a mine life of at
least 25 years.
Encouraging a new wave of minerals investment in Victoria
Despite the urgent need for economic diversification, it is widely acknowledged that Victoria missed the
2000s mining investment boom.55
Victoria captured just 1.3 per cent of Australia’s total exploration
expenditure in 2012-13 – the same period that national exploration investment peaked at more than $4
billion.56
A number of government reports have recommended substantial reforms to reposition Victoria’s
attractiveness as a destination for new minerals investment. This includes the Regional Economic
Development and Services Review, which concluded that:
The existing legislative arrangements for earth resources projects have evolved through the accumulation of
assessment and approvals processes over the last 30 years.
A transformational regulatory reform package is required to make Victoria competitive in a global market for
earth resources projects, particularly to overcome the lengthy, costly and uncertain process to obtain
environmental and planning approvals, while maintaining safeguards to protect public health, other land uses
and the environment.57
53
ibid. 54
State of Victoria, Regional Economic Development and Services Review, 2015, Melbourne, p. 50. 55
Parliament of Victoria Economic Development and Infrastructure Committee, Inquiry into greenfields mineral exploration and project development in Victoria, Parliamentary Paper No. 136, Session 2010–11, May 2012, Melbourne. 56
Australian Bureau of Statistics, Mineral and Petroleum Exploration, Australia, March 2017, ABS cat 8412.0, ABS, Canberra, 2017. 57
State of Victoria, Regional Economic Development and Services Review, Department of Economic Development, Jobs, Transport and Resources, Melbourne, 2015, p.50.

Minerals Council of Australia | 22
2017/001082
These conclusions align with findings from the Victorian Parliament’s Economic Development and
Infrastructure Committee’s 2012 Inquiry into greenfields exploration and project development in
Victoria. In addition to perceptions that Victoria was ‘closed’ to new minerals investment, the
committee noted misperceptions of conflict between the minerals and agricultural industries. Both
industries have co-existed in Victoria for more than 160 years and active and inactive mining licences
account for just 0.2 per cent of Victoria’s total land area.58
Unlocking Victoria’s potential minerals investment pipeline requires coordination and urgent action by
State and local governments.
Priority areas for policy action and regulatory reform
1. Supporting (together with the federal government) the construction of a new high-efficiency, low-
emissions (HELE) lignite power station in the La Trobe Valley
A lignite HELE plant would provide new baseload power at a much lower cost than gas or wind or
solar with battery storage (see next section)
2. Designating the minerals industry as a priority sector for Victoria with designated investment
attraction and project facilitation support
This would include appointment of sector specialists, located in Ballarat, Bendigo and
Gippsland, within Regional Development Victoria to facilitate major minerals development
projects. The specialists would support coordinated engagement with relevant approvals
agencies and enable enhanced regional consideration of project opportunities and impacts.
Five existing minerals development and mine life extension projects could benefit from this
support.
3. Reforming Victoria’s development approvals processes to improve inter-agency coordination,
efficiency and effectiveness and reduce unnecessary delays
Urgent reform is required to modernise the Environment Effects Statement (EES) process, a
requirement for development projects expected to have a regional or state-wide impact under
the Environment Effects Act 1978. Reform should improve process transparency and
efficiency and transition to outcomes-based rather than activities-based conditions.
Harmonisation of state and federal environmental approvals would improve efficiency without
compromising standards. Restarting the assessment bilateral agreement between the
Commonwealth and Victorian Governments to eliminate overlap between the
Commonwealth’s Environment Protection and Biodiversity Conversation Act 1990 and the
Victorian Environment Effects Act 1978 and Flora and Fauna Guarantee Act 1988 is the first
step.
4. Broadening the range of native vegetation offset tools to improve flexibility and enable
proponents to strategically contribute to local biodiversity targets
Introducing financial-based offsets in Victoria would enhance the workability of the regulations
and encourage targeted support for community-identified biodiversity conservation projects in
host communities. Financial-based offsets are already available in some Melbourne urban
growth areas. There is no reason why they should not be available to regional industries.
5. Supporting councils to undertake strategic land use planning, building on the COAG Multi-Land
Use Planning Framework
Five regional areas identify minerals development as a potential source for future growth.
Regional Development Victoria could assist local councils to identify areaswith high minerals
58
Defined as active and inactive mining leases, Earth Resources Regulation, email, 31 January 2017.

Minerals Council of Australia | 23
2017/001082
prospectivity, understand potential concurrent and sequential land uses and strategically plan
for new investment.59
6. Removing restrictions on development of Victoria’s resources, including lignite but also
conventional and unconventional gas
There is no sound scientific basis for the Victorian government’s ban on development of the
state’s unconventional gas resources or moratorium on conventional gas exploration and
development. This policy simply drives up energy costs, which in turn reduces both the
competitiveness of Victorian businesses and the standard of living of households.
Energy security and regional development: the opportunity for the Latrobe Valley
The report Securing energy, jobs and Australia’s export advantage: A low emissions coal future for
the Latrobe Valley, written by Ian Nethercote (former Chief Executive of Loy Yang A), Mary Aldred
(Chief Executive Officer of Committee for Gippsland) and Patrick Gibbons (Director – Climate
Change, Environment & Energy, MCA) discusses the social and economic impact of the closure of
the Hazelwood power station on the Latrobe Valley, one of Victoria’s most disadvantaged regions.
According to the National Institute of Economic and Industry Research, the closure of Hazelwood
power station will lead to a loss of 2,000 local jobs and a $340 million reduction in the Latrobe Valley’s
gross regional product.60
Removal of a source of secure, baseload power also has broader consequences for energy-intensive
industries in the Gippsland region. The report notes that:
[T]here is significant concern about the impact rising energy prices are having on the competitiveness of
energy intensive, trade exposed businesses in Gippsland and beyond.
Manufacturing businesses that export internationally have historically relied on their access to cheap energy
inputs to make them cost competitive with international firms able to engage cheaper input costs such as
labour that Australia can’t compete with.61
Burra Food is a South Gippsland based dairy processing business that exports to Asia. Its CEO
Grant Crothers writes a monthly blog on key issues in this business and dairy sector. In his March
2017 blog, Grant wrote:
Burra’s experience in the last six months has been brutal where we have seen a 90 per cent increase in
electricity costs and an 80 per cent increase in the cost of natural gas. This amounts to an additional
expenditure on energy of millions of dollars. And is an unexpected headwind.62
Australia accounts for 24 per cent of the world’s lignite resources and has the second largest share
after Russia (29 per cent). Nearly all of Australia’s recoverable lignite economic demonstrated
resources (EDR) are located in Victoria, with more than 93 per cent in the Latrobe Valley.
Geoscience Australia has revised up its estimate of recoverable lignite EDR resources to 76.5 billion
tonnes – an increase of 73 per cent from 2014.63
Geoscience Australia says that:
Australia is ranked second in the world in terms of recoverable brown coal and, at 2015 production levels,
Australia has approximately 1095 years of (accessible) recoverable brown coal EDR.64
59
The five regional growth areas are Hume, Gippsland, Central Highlands, Loddon Mallee North and Wimmera Southern Mallee. 60
Ian Nethercote et al., Securing energy, jobs and Australia’s export advantage: A low emissions coal future for the Latrobe Valley, MCA, 16 June 2017, p. 10. 61
ibid., p. 11. 62
Ibid., p. 11. 63
Geoscience Australia, Australia’s Identified Mineral Resources 2016, p. 4 64
Geoscience Australia, Coal: Summary, viewed on 5 July 2017.

Minerals Council of Australia | 24
2017/001082
Box 8: The contribution of lignite mining to the Latrobe Valley: ENGIE
ENGIE in Australia is a private power company that owns and operates approximately 2,000 gross
megawatts (MWs) of power generating plants in Victoria, South Australia and Western Australia. It
has a majority investment in Loy Yang B power station. ENGIE’s retail business, Simply Energy,
operates in Victoria, South Australia, New South Wales and Queensland.
ENGIE in Australia allocates funding against a best practice formula where it aims to spend a share of
our earnings before interest, tax, depreciation and amortisation on corporate social responsibility
(CSR) projects, with an emphasis on local projects. The company spends around $800,000 a year in
Australia on CSR, with the majority on projects in the Latrobe Valley and wider Gippsland region.
ENGIE in Australia publishes a digital and print newsletter called Community Connect at least three
times a year, which outlines details of current community related projects.
Its Community Partnerships Program works with almost 60 organisations across Victoria, South
Australia and Western Australia. It has a focus on projects in education, environment, youth
development, mental health awareness, suicide prevention initiatives, and support for economically
disadvantaged. With a strong presence in Victoria’s Latrobe Valley, ENGIE in Australia has spent
between $17 million to $20 million on projects in the region since 1996 including building or enhancing
the Morwell Community Playground, the Traralgon Railway Reservoir Conservation Reserve, the
Grace Berglund Scope Centre refurbishment in Warragul, and replacing Country Fire Authority
equipment after the 2009 black Saturday bushfires.
Further examples of projects that ENGIE in Australia supports include:
Landcare (via the Bass Coast Landcare Network)
Landcare runs a program called Environmental Detectives. The education program is delivered to
children from Prep/Grade 1 through to secondary levels, including schools with special needs
students. ENGIE in Australia has worked with Landcare for twenty years. The initial program was
focused on wildlife corridors and planting over 1.5 million trees in Victoria’s Gippsland region between
Phillip Island and the Latrobe Valley.
FareShare Food Rescue Charity
ENGIE in Australia is FareShare’s largest corporate sponsorship. The business has worked in
partnership with FareShare for a decade. It also has supported the delivery of 87,000 meals a year to
disadvantaged people in Victoria’s Gippsland region through local distribution agencies.
Operation Flinders
Operation Flinders runs week-long courses hiking through the far north Flinders Ranges of South
Australia for children who are at risk. The aim is to make a difference in the lives of participants to
make a lasting change in attitude and opportunity. The business has worked with Operation Flinders
for seven years. It supports five teams a year, consisting of ten children plus support staff and
logistics back-up from South Australia and Victoria.
Germany offers important lessons for Victorian and Australian policymakers. Lignite power
generation forms an integral part of the country’s energy supply and will do so for decades to come.
RWE, a major German power company, is at the leading-edge of coal technologies that currently
deliver cheap and reliable baseload power at emissions levels 25 per cent lower than the cleanest
power stations in the Latrobe Valley.65
The latest proposed power station, currently in the license approval phase, offers even better
performance: 35 to 40 per cent lower emissions compared to the best generators in the Latrobe
65
Ian Nethercote et al., Securing energy, jobs and Australia’s export advantage: A low emissions coal future for the Latrobe Valley, MCA, 16 June 2017, p. 5.

Minerals Council of Australia | 25
2017/001082
Valley like Loy Yang A and flexible operations critical for integrating higher levels of renewables and
storage.66
Electricity generated from Germany’s lignite-fired generators accounted for about 23 per cent of
supply in 2016. (Black coal accounts for 17 per cent of Germany’s total electricity generation.) This
includes generation from plants using leading-edge high efficiency, low emissions coal technology,
such as RWE’s MW Neurath Power Station (BOA 2-3). Neurath Power Station is an ultra-supercritical
coal power plant that has an operating efficiency of more than 43 per cent – approximately 25 per
cent more efficient than Loy Yang A. Put another way, the plant’s emissions are around 25 per cent
lower than those Loy Yang A.67
Analysis undertaken for the Securing energy, jobs and Australia’s export advantage report confirms
that a new-coal fired baseload power station in the Latrobe Valley would place downward pressure on
energy prices: ‘With a LCOE [levelised cost of electricity] of around A$55-$A65/MWh [megawatt hour]
this would represent a significant decrease on observed forward prices.68
This is because the
levelised cost of other baseload sources is significantly higher. In particular,
The LCOE of combined cycle gas turbine technology is $89 per megawatt hour
The LCOE of open cycle gas turbine technology is $269 per megawatt hour
The LCOE of wind with storage ranges from $135 to $215 per megawatt hour
The LCOE of solar with storage ranges from $155 to $215 per megawatt hour.69
Development of a new low emissions coal-fired power plant in the Latrobe Valley is strongly
supported by local groups, including the Committee for Moe and Advance Morewell.70
Further, a new HELE lignite power plant could be fitted with carbon capture and storage technology to
reduce emissions even further. HELE coal-fired power stations integrated with carbon capture and
storage can reduce CO2 emissions by approximately 90 per cent.71
CarbonNet has already done
work to develop a multi-user CO₂ transport network and storage site in the Gippsland Basin, which is
near the Latrobe Valley.72
66
Ian Nethercote et al., Securing energy, jobs and Australia’s export advantage: A low emissions coal future for the Latrobe Valley, MCA, 16 June 2017, p. 5. 67
ibid., p. 15f. 68
ibid., p. 17. 69
ibid.. p. 14. 70
ibid., p. 10. 71
International Energy Agency, Technology Roadmap High-Efficiency, Low-Emissions Coal-Fired Power Generation, Paris, originally published in 2012, updated March 2013, p. 19. 72
State of Victoria, The CarbonNet Project, Department of Economic Development, Jobs, Transport and Resources, viewed on 24 March 2017.

Minerals Council of Australia | 26
2017/001082
3. CONTRIBUTION OF MINING TO NORTHERN TERRITORY
Deloitte Access Economics estimated that the direct and indirect economic contributions of
the mining and the mining equipment, technology and services (METS) sector to the Northern
Territory economy were $3.2 billion in 2015-16, representing 10 per cent of economic activity.
In the same financial year, the sector employed a 23,459 people (directly and indirectly).
With key Territory mineral commodities including bauxite, gold, manganese, zinc-lead and
phosphate, the mining industry is the second largest sector in the Territory and will continue
to be a key driver of economic growth and development in northern Australia. Currently more
than a dozen new and proposed mining projects are in the pipeline.
To realise the significant opportunities and benefits possible from continued growth of the
mining and METS sector in the regions of the Northern Territory, federal and Territory
environmental policy and regulatory settings must become more efficient and risk-based
(including a One-stop Shop for environmental assessments and approvals) and fair access
and competitive pricing for strategic infrastructure (particularly rail) to be developed through
the federal government’s Northern Australia Infrastructure Facility (NAIF), investment through
Infrastructure Australia and other investment.
Significant contribution of mining and METS to the Northern Territory economy
The mining and METS sector represents an important source of economic activity in the Northern
Territory. Deloitte Access Economics estimates that in the Northern Territory, the mining and METS
sector (excluding oil & gas) contributed a total of $3.2 billion in value added to the Territory’s economy
in 2015-16. The sector also supported around 23,500 full-time-equivalent jobs – 13,500 directly
employed, 10,000 indirectly (Appendix B). $1.2 billion was paid in wages and salaries in the NT
resources sector in 2015-16.73
The value of key commodities produced in the Northern Territory in 2015-16 were:
Gold ($885 million)
Manganese ($829 million)
Zinc and lead concentrate ($475 million)
Bauxite ($448 million)
Uranium ($314 million)
Other minerals ($99 million)74
Over the past decade, mineral commodities have ranged between 15-35 per cent of total goods
exported from the Northern Territory.75
Mineral production from the 2017-18 financial year is
expected to strengthen as new mineral operations commence. The completion of expansion works at
the Newmont Tanami gold mine is expected to drive this increase. With the Bootu Creek manganese
mine re-opening in early 2017, manganese is also expected to contribute significantly to the economy
of the Northern Territory.2
In the past year, the Northern Territory government has awarded major project status to several new
mineral resources projects, including the Jervois copper-silver-gold project; the Mount Peake
vanadium-titanium project; the Verdant Minerals Ammaroo Phosphate project; and Arafura Resources
Nolans rare earths and phosphate project in the Alice Springs region.
73
Australian Bureau of Statistics, Australian National Accounts: State Accounts, 2015-16, Table 8, ABS cat. no. 5220.0, released on 18 November 2016 74
Department of Primary Industries and Resources, Mineral Production Statistics 2015-16, Northern Territory Government, 14 November 2016 75
Northern Territory Government, Northern Territory Budget 2017-18, May 2017,

Minerals Council of Australia | 27
2017/001082
Significant contribution of mining to the Northern Territory’s regional, remote and Aboriginal
communities
The mining and energy sectors have the potential to contribute significant benefits to regional and
Indigenous Territorians, through creation of high-skilled and well-paid jobs (recall Chart 1 above).
Mining employment is critically important to many regional and remote communities in Australia, with
61 per cent of industry employment in regional and remote areas, compared with 37 per cent for all
industries. Mining accounts for up to 50 per cent of employment in some regional centres.76
The minerals industry is also the largest private sector employer of Indigenous Australians with more
than six per cent of the industry’s workforce identifying as Indigenous, up from an average of less
than one per cent 20 years ago.77
At some mining sites, Indigenous workers account for up to 40 per
cent of those directly and indirectly employed. MCA member companies have developed a range of
strategies aimed at retention and career development for Indigenous employees.
Mining-related employment is much more significant to the Northern Territory labour market than to
Australia as a whole, with 4.8 per cent of the labour force directly employed in the Territory’s mining
sector compared with 1.9 per cent across Australia.
Most mining companies in the Northern Territory have programs to attract and train Aboriginal
workers, including Indigenous employment strategies, mentoring, flexible work arrangements, and
workplace literacy and numeracy training. Many also support students from local communities
through work experience and school-based apprenticeships (see Boxes 9, 10 and 11 below).
The industry is the largest private employer of Indigenous Australian employees, with an overall rate
of 16 per cent across all mineral industries in the Territory, with some companies and special skilled
jobs (e.g. haul truck drivers) exceeding 20 per cent.78
The recently released Northern Territory Economic Development Framework (June 2017) identifies
mineral production and exploration as the main drivers of economic activity and employment in central
Australia (Alice Springs region), the East Arnhem region and Katherine region in the short to medium
term.
76
Australian Workforce and Productivity Agency, Resource sector skills needs 2013, Australian Government 2013. 77
B. Hunter, M. Howlett and M. Gray, The Economic Impact of the Mining Boom on Indigenous and Non-Indigenous Australians, CAEPR, Working Paper 93, 2014. 78
Minerals Council of Australia Northern Territory Division, Agenda for Growth: Northern Territory Mining Industry (June 2016), MCA NT, 3 August 2016, viewed 8 August 2017

Minerals Council of Australia | 28
2017/001082
Box 9: Gulkula Mining - Australia’s first Indigenous-owned mining company
Gulkula Mining, an Aboriginal-owned mining company, has been granted approval by Australia’s
Northern Land Council to commence a small-scale bauxite operation in northeast Arnhem Land. This
is the first time that an Aboriginal Clan has operated a mine on land it traditionally owns.79
The mine
will benefit the remote Gove Peninsula region, including by providing training and jobs for Indigenous
Australians.
The bauxite mine is proposed to operate on Gove Peninsula and a Yolngu training centre will run at
nearby Gulkula, which is the site of the annual Garma Festival. The mine aims to produce 15,000
metric tons of bauxite in its first year.80
Rio Tinto has assisted the venture by providing $2.4 million towards the establishment of the Yolngu
training centre. The centre will provide training for Yolngu people to prepare for bauxite mining
operations.81
The training centre aims to produce 15 Indigenous graduates who would be able to
work in the mine when it commences operations.82
The first batch of 20 trainees will commence a 17-
week residential course of study at the facility in August 2017. In addition to job specific training,
participants will receive training on workplace health and safety and negotiation skills, with the aim of
ensuring the graduates will be able to actively participate in the mining industry rather than just being
spectators.83
Box 10: Rio Tinto Gove
Rio Tinto is a global mining and metals group with more than 140 years of history. It places a high
emphasis on developing strong, trusting and lasting relationships with host communities. Its
Communities and Social Performance (CSP) standard guides how it maintains its community
relationships. It has several projects that support regional Australia that include the following:
Rio Tinto’s Gove Operations is providing $2.4 million for a mine training centre to support the
first Aboriginal owned and operated mine in Australia.
It is also funds $1 million worth of community investment programs and initiatives annually.
Rio Tinto maintains the Nhulunbuy Township and airport and provides essential services to
Nhulunbuy and surrounding communities.
It has contributed $2 million seed funding to the Developing East Arnhem initiative and
provided up to 250 housing assets to attract and drive economic diversification across the
region.
Website: http://www.riotinto.com/ourcommitment/community-relationships-21467.aspx
79
Aluminium Insider, Indigenous-owned mining company to open mine in Northern Australia, 18 August 2016, viewed 8 August 2017 80
Helen Davidson, Indigenous-owned company approved to open mine in Arnhem Land, The Guardian, 17 August 2016, viewed 8 August 2017 81
Rio Tinto, Mining Training Centre to generate economic development for Yolngu people, 2 August 2014, viewed 8 August 2017 82
Aluminium Insider, Indigenous-owned mining company to open mine in Northern Australia, 18 August 2016, viewed 8 August 2017 83
Ashely Manicaros, Gumatj Corporation to be active in mining industry from August, NT News 26 April 2017, viewed 8 August 2017

Minerals Council of Australia | 29
2017/001082
Box 11: Newmont Tanami Operations
Newmont is a global mining company that has approximately 23,000 employees throughout the world.
It has owned and operated the Tanami mine in the remote Tanami Dessert of Northern Australia since
2002. The mine and plant are located on Aboriginal freehold land that is owned by the Warlpiri
people and managed by the Central Desert Aboriginal Trust.84
The site is the most remote in
Australia, with the closest communities of Yuendumu and Lajamanu approximately 257 km south and
327 km north east of the mine.85
Newmont’s Tanami operations have contributed nearly $374 million to the economy through
procurement, payroll taxes, government royalties, land use payments and community projects. It
employed 94 Aboriginal workers in 2016, 13.9 percent of its workforce.86
Community
Newmont has a dedicated community relations team on site at its Tanami operations to encourage
dialogue with all stakeholders. Newmont invests in community programs including support for staff
housing for the Warlpiri Youth Development Aboriginal Corporation; the Waninjawarnu Project which
provides resources on nutrition and healthcare to parents; the National Indigenous Music Awards;
development of Violent Behaviour and Aggressive Risk Assessment Protocols; Warlpiri Education
and Training Trust; and the Books in Willowra Homes project, that works to improve literacy among
young children in the community.87
In 2016 Newmont, the Central Land Council (CLC) and Yapa
developed a guide for working together to achieve stronger outcomes for Yapa. This plan (Granites-
Kurra Ten Year Plan) was reviewed and endorsed by traditional owners and CLC regional delegates
in June 2017. The plan highlights the outcomes that the CLC, Newmont and Yapa can achieve to
strengthen Yapa voice, employment and education in the Tanami region.88
Cultural events
In 2010, Newmont entered into a three-year partnership with the South Australian Museum for a
project to catalogue and digitize Australia’s largest collection of Aboriginal cultural artefacts. The
partnership also supports a physical exhibition at the South Australian Museum in Adelaide and a
mobile exhibition of the Tanami or Yuendumu Door. The Yuendumu Doors were created in 1983 by
senior Warlpiri men, who painted their sacred Dreaming designs onto the doors of the remote
Yuendumu school. It was a key moment in the history of Australian art, and symbolised the Warlpiri’s
decision to explain the Tjukurrpa (Dreaming) to the world. There are 30 original Doors. Newmont
continues to invest in aboriginal art with examples of sponsorships of the Land Rights - Anniversary
Arts Award Catalogue (2016) and the display and selling of aboriginal art at the mine.
Newmont also regularly support the Milpirri Festival, a cultural dance held every two years that
brings together male and female elders, parents, and young people to express their culture
through traditional and contemporary forms of dance. The Festival is credited with increasing
school attendance throughout the year and connecting generations by sharing cultural customs
and stories in a modern setting.89
84
Newmont, Tanami Australia, viewed on 21 July 2017 85
Newmont, Tanami – Community, viewed 21 July 2017 86
Minerals Council of Australia Northern Territory Division, Agenda for Growth: Northern Territory Mining Industry (June 2016), MCA NT, 3 August 2016, viewed 8 August 2017, p 14 87
Newmont Australia, Beyond the Mine: 2016 Australia Region Summary Report , viewed 8 August 2017 88
Planning for more Yapa mine jobs, Landrightsnews Central Australia, Volume 7, Number 2, August 2017, page 6 89
ibid.

Minerals Council of Australia | 30
2017/001082
Importance of Northern Territory mining to developing Northern Australia
The minerals industry is a significant contributor to economic growth and development in Northern
Australia, accounting for around 85 per cent of export value from Northern Australian ports.
Similar to Queensland and Western Australia, the majority of the Northern Territory’s resources are
exported to Asia, particularly China, Japan, Indonesia and South Korea. Future growth prospects are
strong, with Northern Australia having more than 70 per cent of Australian’s known resources of iron
ore, lead, zinc, silver, bauxite, molybdenum, tungsten, rare earth elements, phosphate and potash.
The Australian Government’s 2015 White Paper on Developing Northern Australia – Our North, Our
Future – identified land access, infrastructure, cost-effective regulation, and skills as focal points for
future development.
The industry is keen to work with governments, native title bodies and local Indigenous groups on
measures to support simpler and more secure land access arrangements.
Its 2017 Budget includes almost $7 billion for major infrastructure projects in Northern Australia. $5
billion will be available in concessional loans from the Northern Australia Infrastructure Facility (NAIF);
$600 million from the Northern Australia Roads Programme; $187 million specifically for NT road
projects; $100 million for the Beef Roads Programme; and other major infrastructure investments.
Among new and prospective infrastructure projects that will support future mining activity in the north
are sealing the Tanami Road, constructing a new railway between Tennant Creek and Mount Isa, and
installing a return railway loop at the East Arm Port for more efficient delivery of mineral concentrate.
The minerals industry strongly endorses the Australian Government’s acknowledgement in the White
Paper of the importance of driving down the costs of operating in the north, to make it a more
attractive place to invest and work.
There is significant untapped potential for further mineral resource development in the Territory which
could play a vital role in building sustainable regional communities in the North, underpinning
population growth, the boosting of incomes and improving standards of living, as much of this
resource potential exists in the less developed areas of the Northern Territory and Northern Australia
more broadly. Realising the substantial and diverse benefits from this untapped potential is, however,
dependent on appropriate policy settings.
Policy priorities for the Northern Territory
The current challenge for the sector is to build on the Territory’s legacy of strong mining growth and to
position the industry to take early and full advantage of the next wave of economic opportunities.
This will require further improvements in productivity and competitiveness to attract investors.
Investment from larger and more global industry leaders in the relevant commodities will most likely
be the key lever in underpinning the future development of these resources; however, capital for
mining and mineral processing projects is mobile, and these global players have many options across
the globe for investment. For this reason, mining projects in the Northern Territory must be seen as
globally competitive, and in some areas, our position has slipped over the years, e.g. in the blowing-
out of timeframes and requirements for environmental assessment and approvals for new
developments, and associated cost blow-outs.
Governments need to commit to ensuring that domestic regulation does not unnecessarily delay and
push up the costs of investors doing business in the Territory.
With an efficient regulatory system and energetic marketing, the resources industry is the Territory’s
best path to future growth.

Minerals Council of Australia | 31
2017/001082
The key policy priorities for the Northern Territory address the following issues:
Maximising productivity
Improving environmental regulation
Maximising benefits through resource management and security bond reforms
Investing in strategic infrastructure
Attracting investors
Stimulate greater industry investment in exploration
Promoting and realising broad community benefits from mining.
Maximising productivity and improving environmental regulation
Streamlining environmental assessment and approval processes to remove duplication, delays and
complexity can be done without compromising the effectiveness of environmental regulation.
Achieving this would increase business certainty and encourage investment. Competition for
markets, investment and talented people is intense in a world where mineral resources are widely
available.
Regulatory requirements have a profound impact on cost competitiveness and the industry’s capacity
to adapt to changing market conditions. In Australia, the average time to obtain new approvals is
more than five years. A one-year delay can reduce the net present value (NPV) of a major mining
project by up to 13 per cent. For large greenfields mining projects of $3 billion to $4 billion in value,
the loss can be up to $1 million per day.
MCA member companies found that environmental approvals processes and ‘green tape’ in general
is the area of greatest policy concern, followed by workplace relations, taxes and royalties.
Better alignment between Territory and federal approval processes would provide regulatory certainty
and reduce approval timeframes. The Productivity Commission concluded in 2013 that overlap and
duplication can be reduced without diminishing environmental outcomes.
The Northern Territory’s environmental regulatory processes should be accredited under the
Environment Protection and Biodiversity Conservation (EPBC) Act to create a single assessment and
approval process to ensure high environmental standards with risk-based monitoring and reporting
arrangements.
The Northern Territory Government should encourage the federal parliament to approve changes to
the EPBC Act to allow these reforms.
Post-approval regulation also needs to be more cost-effective, with monitoring and reporting
requirements reflecting risk and consistent with industry best practice.
Key policy priorities
Establish a One-Stop Shop approach for Northern Territory and Commonwealth
environmental assessment and approval processes
Ensure that monitoring and reporting requirements are risk-based.
Maximising benefits through resource management reforms and modernising security bonds
Resource management reforms and multiple land-use should be encouraged and supported to
maximise the benefits of mining and other land uses for all Territorians.
Water availability and security of supply are critical business risks for a range of industries including
the minerals sector. Mine operators frequently supply, operate and maintain their own water
infrastructure and provide a reliable water supply to other stakeholders including neighbouring remote
and indigenous communities, farmers and pastoralists. Water planning and access arrangements

Minerals Council of Australia | 32
2017/001082
should account for the specific needs and characteristics of all water users, including the minerals
industry.
The industry undertakes extensive biodiversity assessments and establishes conservation areas to
offset impacts that cannot be completely avoided or mitigated. The industry contributes to biodiversity
conservation programs in partnership with government and non-government organisations, including
the Bush Blitz program in the Northern Territory.
The MCA supports a flexible and responsive security bond system that incentivises good
environmental performance and progressive rehabilitation by reducing the size of the bond.
Operators can reinvest these savings in innovative technologies and ongoing rehabilitation. The
mining industry acknowledges that there are legacy sites that need to be rehabilitated and contributes
significantly to these through the Rehabilitation Security Levy.
Land access is critical to industry growth. A fair and strategic approach to developing compatible and
complementary uses benefits land-owners, mineral and pastoral lessees and other land managers.
Land access processes should be efficient, transparent and consider all land use values including
cultural connection, conservation, agriculture and mineral production.
Key policy priorities
Ensure that regulation of access to water is transparent and consistent with principles of
sustainable use and acknowledge the needs of the mineral sector (including ability to use
lower-quality water for particular activities)
Modernise the current security bond system to accept a broader range of forms (e.g. insured
bonds), to reduce bond sizes in line with progressive rehabilitation and demonstrated strong
environmental performance of operators
Broaden strategic land use approaches that consider landholder and industry interests to
maximise benefits from multiple land uses.
Investing in strategic infrastructure and attracting investors
Development and expansion of commerce-enabling infrastructure will increase the attractiveness of
the Northern Territory to investors across a range of industries and unlock further growth in regional
and remote locations.
Infrastructure in Northern Australia is a major barrier to minerals industry growth. The impact of
inadequate public infrastructure flows through to the broader economy and society. Inefficient
transport infrastructure increases the cost of doing business and limits exports. Inefficient public
infrastructure makes it difficult to attract and retain workers and their families in remote and regional
areas of the Northern Territory.
The government has a role to play in public, common-user and shared infrastructure. Long-term
investments in commerce-enabling infrastructure can promote other investment, including from the
private sector.
The MCA NT applauds recent commitments by both the Commonwealth and Northern Territory
governments to seal and upgrade a number of remote roads that service a range of industries.
Government investment in transport, water, energy and other critical infrastructure will significantly
enhance the attractiveness of the Northern Territory to investors in tourism, agriculture, pastoralism
as well as mining.
Key policy priorities
Through establishment of a multi-disciplinary working group comprising government and
industry representatives, develop a priority list of investments, maximising return on
investment across industries
Minerals Council of Australia | 33
2017/001082
NT Government and industry to work together to pursue Commonwealth funding through the
Northern Australia Infrastructure Facility (for concessional loans) and other initiatives
NT Government and industry to pursue jointly-funded infrastructure projects, through private-
public partnerships across industries with similar needs.
Stimulate greater industry investment in exploration
To stimulate greater industry investment in exploration, governments must invest in geotechnical
studies to narrow the search for prospective deposits, water and energy sources.
Geoscience Australia estimates around 80 per cent of Australia remains under-explored, in particular
the Northern Territory, Queensland, Western Australia and South Australia. In May 2016 the
Commonwealth Government committed an extra $100 million to stimulate exploration through
mapping mineral, energy and groundwater potential.
The Northern Territory Geological Survey’s Creating Opportunities for Resource Exploration (CORE)
program provides interpreted data on the prospectively of various regions of the Northern Territory.
Investment such as this recognises the critical importance of the minerals industry to future economic
growth and prosperity. By providing data that suggest highly prospective areas for mineral
exploration, governments can promote prospective projects and increase investor confidence by
narrowing their search (i.e. de-risking investment).
A 2015 ACIL Allen Consultants report indicated that for every dollar invested in pre-competitive
programs, the rate of return on investment is 20 to 1.90
Australia ranks second in the world at
converting exploration into mineral discoveries. Exploration has multiple benefits in generating
valuable data not only on target metal and non-metal resources, but also on ground and surface
water, and flora and fauna.
Key policy priorities
Secure funding for priority surveys in the NT through the Commonwealth’s ‘Exploring for the
Future’ initiative
Adequately fund the NT Geological Survey, so it can continue to generate priority
geoscientific datasets to attract greater exploration investment in the Territory
Work with mineral companies to identify priority areas and types of surveys to attract further
investment.
Promoting and realising broad community benefits from mining
Sound governance that promotes investment will ensure that the mining sector can continue to deliver
a broad range of benefits to Territorians.
The Northern Territory’s minerals sector is a major source of export income, economic growth and
employment, with significant untapped potential for further growth and expansion. Development of
the sector will play a vital role in building sustainable regional communities, population growth, income
growth and improved standards of living.
There are many examples demonstrating the sector’s community contribution in the Northern
Territory:
MMG provides training and mentoring support to the Borroloola-based Indigenous business,
Pandanus Development Group,that prepares Aboriginal workers for fieldwork with the company.
McArthur River Mine’s Community Benefits Trust has provided more than $10 million to 64
economic, social and cultural projects in the Gulf Region including
The Borroloola Song Peoples Sessions
90
Department of Mines and Petroleum. Exploration incentive scheme economic impact study, Government of Western Australia, 16 April 2015, viewed 8 August 2017

Minerals Council of Australia | 34
2017/001082
Li-Anthawirriyarra Sea Rangers
The new Wunala Creche
Local health and sporting programs.
Newmont’s Tanami Operations contributed nearly $375 million to the economy through
procurement, payroll taxes, government royalties, land use payments and community projects. It
employed 88 Aboriginal workers in 2015, 12 per cent of the workforce. It also provides financial
support to
A Community Development Officer (three -year appointment) to train women and youth in the
Tanami Region
The Milpirri Festival
Lajamanu School through the provision of workshop tools, equipment and readers.
Energy Resources Australia paid royalties of $17.9 million in 2015 of which approximately $13.9
million flowed to Northern Territory Aboriginal interests, including local Traditional Owners. ERA is a
significant contributor to the Jabiru and Alligator Rivers region economy:
Generating approximately 70 per cent of jobs in Jabiru
Operating the airport that serves the Jabiru township and the region’s tourism industry
Supporting a wide range of community activities including the Gurrung Community Sports
Carnival, the Mahbilil Festival in Jabiru and the Stone Country Festival at Gunbalanya.
Rio Tinto Gove Operations committed $2.4 million for a mine training centre to support the first
Aboriginal owned and operated mine in the NT.
Has local contracts in place with Rirratjingu and Gumatj Traditional Owners
Funds a range of community investment programs and initiatives up to the value of $1 million
per annum
Maintains the Nhulunbuy Township and airport and provides essential services to Nhulunbuy
and surrounding communities
Contributed $2 million seed funding to the Developing East Arnhem initiative and has
provided up to 250 housing assets to attract and drive economic diversification in the region.
Key policy priorities
Renew the Territory’s focus on attracting investment and promoting development through a
targeted marketing campaign and updated vision statement
Provide dedicated project facilitators to assist investors in navigating and meeting regulatory
requirements
Collaborate and support industry to redress misinformation about the value of the minerals

Minerals Council of Australia | 35
2017/001082
4. REGIONAL BENEFITS OF LABOUR MOBILITY
Labour mobility is essential to existing operations and new projects in the minerals industry.
Strategies such as fly-in, fly-out (FIFO) and drive-in, drive-out (DIDO) arrangements, together
with an effective skilled migration program, help sustain mining activity in regional areas. The
Productivity Commission observes that labour mobility spreads the income and employment
benefits of mining well beyond where resource extraction occurs.
The Productivity Commission notes that regulatory impediments (such as occupational
licensing requirements that differ across jurisdictions) reduce labour mobility, making it
difficult for people in regional communities to pursue employment or training opportunities.
The minerals industry employs approximately 1 per cent of its workforce through temporary
skilled migration and over 90 per cent of these are professionals, managers and technical
trades. The Minerals Council of Australia will continue to work with its members and the
Australian Government to monitor the impact of the new temporary skilled visa system and
ensure further changes are considered as economic circumstances change.
Highly skilled, highly paid jobs in regional and remote Australia
Mining in Australia is a sophisticated and technologically advanced enterprise that demands a highly
skilled and adaptable workforce. The Australian resources sector employs around 220,000 people in
high-value, high-wage, high-skilled jobs, mostly in remote and regional Australia. Average weekly
earnings (full-time adult) in the resources sector are $2,625 per week, 77 per cent higher than the
average for other industries.91
Australia’s resources workforce covers a range of scientific fields and professional occupations. The
resources sector is Australia’s largest total employer of:
Mining engineers (12,500)
Geologists and geophysicists (12,000)
Industrial and mechanical engineers (13,330)
Metallurgists and physicists (2,700).92
Nationally, mining is also the third-biggest employer of environmental scientists, employing more than
13,600 directly and indirectly.93
Importance of labour mobility
As part of its commitment to communities, the minerals industry prioritises local employment and
sourcing. In many cases, companies have established local training programs and provide relocation
support for employees to support this priority.
However, the remote location of Australian mining operations makes fly-in, fly-out (FIFO) and drive-in,
drive-out (DIDO) arrangements a necessary option for many operators and their employees,
especially for highly specialist professional, technical and trade roles.
While some have seen this as a negative, the Productivity Commission correctly identifies that mining
regions are resilient and have relatively high adaptive capacity, with labour mobility spreading the
benefits of the unprecedented investment and construction phase and now the production phase into
other regions.94
In its initial report, the Productivity Commission points to positive impacts of labour mobility:
91
Australian Bureau of Statistics, Labour Force, Australia, Detailed, Quarterly, May 2017, ABS cat. no. 6291.0.55.003, released on 22 June 2017; Average Weekly Earnings, Australia, November 2016, ABS cat. no. 6302.0, released on 23 February 2017. 92
Department of Employment, Job Outlook 2014; MCA calculations. NB these figures are estimates of the total number of workers directly and indirectly employed by the resources sector. 93
ibid. 94
Productivity Commission, Transitioning Regional Economies, Initial Report, April 2017

Minerals Council of Australia | 36
2017/001082
The mining boom has made Australians substantially better off in the long term with a mobile workforce
(including fly-in, fly-out) not only spreading the benefits of the boom across workers living in other regions,
but also reducing the cost of both the investment phase and the ongoing production phase.95
A significant number of people who were employed in construction and mining during the investment boom
were fly-in, fly-out workers which enabled a larger number of workers and businesses to share in the
demand for goods and services in the region – from increases in the price of coffee to housing.96
FIFO arrangements reduced the potential magnitude which unemployment rates could have had on the
people in any particular region.97
The Productivity Commission notes a key policy issue with regulatory impediments that act to reduce
labour mobility, making it difficult for people in regional communities to pursue employment or training
opportunities. These include occupational licensing requirements, particularly where there are
different arrangements across jurisdictions.98
Removing or reducing the impact such barriers is
crucial to enable people and businesses in regions to make better use of their existing resources.
Australia has a permanently larger mining sector employing more than double the size of its workforce
a decade ago and triple from 2000.99
Labour mobility has played an important part in this.
The Reserve Bank of Australia found that long-distance commuters ‘helped employers meet labour
demand requirements given the reluctance of workers to move permanently to remote areas.’100
This
finding was reiterated by the Productivity Commission and the National Centre for Vocational
Education Research.101
The Productivity Commission observed:
While not uniformly regarded as a positive development by stakeholders, it appears that FIFO has been
instrumental in attracting sufficient mining and construction workers to mining areas during the
resources boom, and spreading the benefits of the boom across the economy more broadly. FIFO has
also dulled the boom–bust cycle that mining towns might otherwise experience if all workers had to be
residential.
The increasing use of FIFO practices, particularly in the mining and construction industries, can be
attributed to a number of factors, including:
The high cost of living in regional and remote areas
A lack of accommodation and facilities in regional and remote areas
Worker preferences for living in metropolitan or coastal areas
The shift away from the traditional 8-hour working day to 12-hour shifts
The short term nature of construction projects
More widely available flights to regional areas
Intense competition for workers with particular skills, such as engineers and project managers
Newer mines increasingly located in more remote areas.102
In 2012, the MCA commissioned KPMG to undertake two studies: Analysis of the Changing Resident
Demographic Profile of Australia’s Mining Communities’ and the Analysis of the Long Distance
Commuter Workforce Across Australia.103
95
ibid, p. 2 96
ibid, pp. 3, 16 97
ibid, p. 80 98
ibid. 99
Minerals Council of Australia, Miners at Work, June 2016. 100
See Reserve Bank of Australia Bulletin, Labour Market Turnover and Mobility, December Quarter 2012, p. 9. 101
Productivity Commission, Geographic Labour Mobility, April 2014; National Centre for Vocational Education Research, An exploration of labour mobility in mining and construction: who moves and why, 23 June 2014. 102
Productivity Commission, Geographic Labour Mobility, April 2014. 103
See KPMG, Analysis of the Long Distance Commuter Workforce Across Australia, report commissioned by the Minerals Council of Australia, March 2013; KPMG, Analysis of the Changing Resident Demographic Profile of Australia’s Mining Communities, report commissioned by the Minerals Council of Australia, February 2013.

Minerals Council of Australia | 37
2017/001082
Both studies considered Australian Bureau of Statistics Census data from 2006 and 2011. In relation
to long distance commuting (FIFO and DIDO) the study found that according to 2011 Census data, 25
per cent of the mining workforce were long distance commuting, up from 22 per cent in 2006. Put
another way, in 2011, three quarters of the then mining workforce were resident in regional and
remote Australia.
In some cases, FIFO and DIDO are criticised for causing a loss of economic and social value to
regional areas. However, FIFO and DIDO also provide increased employment opportunities through
increased supply of goods and services from local businesses. It facilitates increased mining activity
in regional and remote Australia by creating lifestyle choices for its employees which is important in a
national skills shortage context.
The results from the KPMG studies show that, despite suggestions that FIFO and DIDO workers were
displacing residents, residential populations in eight of the nine mining regions examined increased
between the 2006 and 2011 Censuses; in six of the nine mining regions, residential populations grew
faster than the regional Australian average.
The KPMG studies further found that incomes and educational attainment are higher and
unemployment is lower in mining regions compared to regional Australia more generally. There is
also a greater proportion of families and working-aged people in mining regions compared to regional
Australia generally.
The evidence supports the Productivity Commission’s conclusions that mining has benefited regional
areas. Far from restricting opportunities, the mining industry has boosted incomes, attracted families
and reduced unemployment in mining regions.104
Recent research from James Cook University
confirms that availability of rental accommodation, quality service provision – measured by the
number of students per teacher and the number of people per medical practitioner – encourages
workers to move to a region and discourages long distance commuting.105
Against this backdrop, focus has been taken away from important issues, such as mental health, due
to misconceptions about workforce mobility. The Western Australian Parliamentary Inquiry into
mental health impacts of FIFO work arrangements was not able to substantiate a causal link between
FIFO and suicide.106
The Queensland Parliamentary Inquiry into fly-in, fly-out and other long distance
commuting practices in regional Queensland concluded that the benefits of resource activity such as
employment must be able to be accessed by all and that workers are able to make their own informed
decision about where they live for work.107
As a result of these findings from these inquiries, the minerals industry as part of its commitment to
the health and safety of its workforce, developed a range of resources to assist employers and
employees and their families in their considered and informed FIFO or DIDO employment choice such
as the MCA Blueprint for Mental Health and Wellbeing, www.thisfifolife.com, www.fifofacts.com.au,
https://www.ruok.org.au/every-day-resources.
104
ibid. 105
Nicholas, C, and Welters, R, How to slow FIFO, James Book University, 9 February 2017 106
Western Australia Parliament, Education and Health Standing Committee, Report 5, The impact of FIFO work practices on mental health, June 2015. 107
Queensland Parliament, Infrastructure, Planning and Natural Resources Committee, Report No. 9, Inquiry into fly-in, fly-out and other long distance commuting work practices in regional Queensland, October 2015

Minerals Council of Australia | 38
2017/001082
Box 12: Mining’s use of temporary skilled migrants
The minerals industry employs approximately 1 per cent of its workforce through temporary skilled
migration (1630 persons), accounting for only 2 per cent of all temporary skilled workers in Australia.
Over 90 per cent of these are professionals, managers and technical trades, which include
geotechnical engineers, mining engineers, mechanical engineers, mine surveyors, environmental
engineers and scientists, extractive metallurgists, diesel mechanics.108
The mining industry employs Australians first whenever possible. The cost of employing and
sponsoring temporary skilled migrants ($60,000 per person according to the Australian Mines and
Metals Association) means they will typically be used on a needs basis.109
An effective temporary skilled migration program is therefore a vital component of meeting the
ongoing specialist skills needs of the sector which are not available in Australia. Long educational
lead times for professional and technical roles and reducing enrolments in Australian universities in
crucial disciplines (like mining engineering and metallurgy) make the targeted use of temporary skilled
migrants important to the mining industry.110
The Australian government’s substantial changes to temporary skilled migration arrangements in April
2017 to tighten requirements for English language proficiency, require three year minimum work
experience and introduce a maximum age requirement (45 years) present considerable barriers to
accessing and developing global leadership and technical talent in mining organisations operating in
Australian and overseas. The additional introduction of new ‘more targeted’ occupation lists (for
short- and medium-term skill shortages) that purport to ‘better align with skill needs in the Australian
labour market’ was done without consultation and consideration of the business environment and
have resulted in immediate impediments to the mining industry accessing crucial professional,
management and technical skills.
The mining industry nonetheless welcomes the outcome of the inaugural review of occupations able
to access temporary skilled visas (effective 1 July 2017) to allow skilled migrants to fill genuine
vacancies for chief executive and senior executive positions, along with a range of other high skilled
occupations, through a four year temporary visa as opposed to two year.111
The changes are
essential for building a globally competitive mining industry for all Australians.
The Minerals Council of Australia will continue to work with its members and the Australian
Government to monitor the impact of the new temporary skilled visa system and ensure further
changes are considered as economic circumstances change.
108
Department of Immigration and Border Protection, Subclass 457 Quarterly Report 31 December 2016. 109
Australian Mines and Metals Association, AMMA urges cautious approach to 457 visa reforms, media release, 24 February 2013 110
Minerals Council of Australia, MTEC Key Performance Measures 2016. 111
Department of Immigration and Border Protection, List of eligible skilled occupations.

Mining and METS: engines of economic growth and prosperity for Australians
1
Mining and METS: engines of
economic growth and prosperity
for Australians Report prepared for the Minerals Council of Australia, 2017
jelkir
Typewritten Text
APPENDIX A

Contents
Glossary i
Executive summary ii
1 Mining and METS in Australia 5
2 The economic significance of mining and METS 10
2.1 Contribution to the Australian economy 10
2.1.1 Modelling framework 10 2.1.2 National economic contribution 13 2.1.3 Regional economic contribution 14
2.2 Innovation as a key growth driver 18
2.2.1 Newcrest 19 2.2.2 Peabody 20 2.2.3 BHP Billiton 22 2.2.4 Rio Tinto 23 2.2.5 Glencore 24 2.2.6 Hedweld Engineering 26 2.2.7 MICROMINE 27 2.2.8 Maptek 28 2.2.9 Orica 29 2.2.10 Donhad 30
3 Policy environment for a productive mining and METS sector 32
3.1 Previous structural reforms 32 3.2 Future areas of policy focus 35
3.2.1 Flexible workplaces 35 3.2.2 Competitive and fair taxation system 37 3.2.3 Affordable and reliable energy 39 3.2.4 Openness to foreign investment 41 3.2.5 Efficient approaches to regulation 41 3.2.6 Support for collaboration and entrepreneurship 42
References 43
Appendix A: Economic contribution modelling framework 47
Limitation of our work 52
General use restriction 52

Mining and METS: engines of economic growth and prosperity for Australians
i
Glossary
ABS Australian Bureau of Statistics
ANZSIC Australian and New Zealand Standard Industrial Classification
DAE Deloitte Access Economics
DIDO Drive-in drive-out
FIFO Fly-in fly-out
FIRB Foreign Investment Review Board
FTE Full-Time Equivalent
GDP Gross Domestic Product
IO Input-Output
IOIG Input-Output Industry Group
MCA Minerals Council of Australia
METS Mining Equipment, Technology and Services
NEM National Electricity Market
OECD Organisation for Economic Co-operation and Development
PC Productivity Commission
R&D Research and Development
RBA Reserve Bank of Australia
RCEP Regional Comprehensive Economic Partnership
SOL Skilled Occupations List

Mining and METS: engines of economic growth and prosperity for Australians
ii
Executive summary
The mining sector has long made – and continues to make – a significant contribution to Australia’s economic
growth and development. The Australian mining industry uses sophisticated production techniques and highly
skilled labour to make the most of Australia’s comparative advantage in mineral endowments. The supporting
activities of the mining equipment, technology and services (METS) sector add further to Australia’s national
income and employment.
The Australian economy continues to enjoy the fruits of the latest mining boom that began in 2003. A sharp
increase in commodity prices was followed by unprecedented investment in new mines, equipment and
infrastructure – at its peak in 2012, resources investment accounted for 60% of total investment in Australia
(including investment in both the mining and oil and gas sectors). This growth in mining capacity underpins
the current production phase of the mining boom, in which rising export volumes support a range of
manufacturing and service activities across Australia. Minerals and energy exports are the primary source of
Australia’s export earnings, accounting for 64% of merchandise exports by value in 2015-16 (DIIS, 2016).
This report estimates the total economic contribution of the mining and METS sector to Australia’s gross
domestic product (GDP) by using an input-output modelling framework in order to capture all mining and
METS activities. This economic analysis applies a similar approach to the methodology used in the RBA’s 2013
Research Discussion Paper Industry Dimensions of the Resource Boom: An Input-Output Analysis. Overall,
Deloitte Access Economics estimates that the direct economic contribution of mining and METS activities was
$133.2 billion in value added in 2015-16, with 484,114 full-time equivalent (FTE) jobs directly supported by
the sector.1 This figure represents the ‘economic footprint’ attributable directly to the mining and METS sector
in the Australian economy.
In addition to this direct economic contribution, the mining and METS sector depends on outputs from other
industries in the Australian economy, such as petroleum, electricity and manufacturing, as inputs to
production. This indirectly generates economic activity by facilitating production and paying wages and profits
in these other industries. This indirect economic contribution added a further $103.6 billion in 2015-16,
supporting another 655,654 FTE jobs.
While this economic activity is distributed across Australia, there are a number of regional areas where mining
and METS activities make a particularly significant economic contribution (Figure i), much higher than the
national average. In 2015-16, these included:
The Pilbara region (WA), with a total economic contribution from mining and METS of $37.8 billion, which
represented around 88% of total regional economic activity;
The Bowen-Surat region (QLD), with a total economic contribution from mining and METS of $18.6 billion,
which represented around 63% of total regional economic activity; and
The Hunter region (NSW), with a total economic contribution from mining and METS of $15.2 billion, which
represented around 34% of total regional economic activity.
1 The value added by an industry is the value of its output, less the value of intermediate inputs used to produce this output (as these represent outputs of other industries). It is important to note that GDP adds up value added by industry, not the
value of industry output or sales. Accordingly, the economic contribution of an industry must be distinguished from its total revenue and total exports, which do not discount inputs supplied by other industries or economies.
The total economic contribution of Australia’s mining and METS sector in 2015-16 was $236.8 billion,
representing around 15% of the Australian economy. This economic activity supported a total of
1,139,768 FTE jobs across Australia, which represents around 10% of total FTE employment.

Mining and METS: engines of economic growth and prosperity for Australians
iii
Figure i: Regional contribution – value added and full-time equivalent jobs, 2015-16*
* Some of the mining and METS jobs that have been created in these regions are fly-in fly-out (FIFO) or drive-in drive-out (DIDO) positions.
Source: Deloitte Access Economics (2017)
Australian mining and METS companies compete in fiercely contested international markets and cannot pass
on higher domestic costs to offshore customers. Consequently, innovation and technological improvements
play an important role in ensuring that mining and METS companies are able to operate productively and
remain globally competitive. Innovative applications of new technologies have been a significant driver of
growth in the Australian mining and METS sector over the most recent mining boom.
The benefits of innovation can range from broad strategic improvements through to enhancing individual
worker’s tasks. This report includes case studies of innovative applications of technology across 10 mining and
METS companies in Australia. The productivity benefits of innovation highlighted in these case studies include:
Reduced operating costs reflecting efficiency gains from using new technologies;
Extending the productive life of mines, such as by enabling the extraction of deposits that are
deeper or more remote;
Higher yields, such as increased metal recovery from ores;
Safety improvements flowing from simplified processes and earlier detection of hazards;
Higher workforce satisfaction and productivity in translating innovative ideas suggested by
employees into operational improvements;
Applying knowledge from research institutions to implement new or improved processes and
products; and
Brand development and generating new opportunities by enabling access to new markets overseas.

Mining and METS: engines of economic growth and prosperity for Australians
iv
Australia’s comparative advantage in mining and METS not only hinges on innovation in driving productivity
growth but also on policies that strengthen competition, support the accumulation of skills and capital, and
enable firms to respond flexibly to changing market conditions. By increasing competition in markets for
products, finance, energy, infrastructure and labour, previous governments facilitated the current mining
boom and allowed its benefits to spread and endure. More recently, however, the pace of reform has slowed;
and in some cases past reforms have been eroded by policies and regulations that impede national
competitiveness and productivity.
In looking to sustain the economic contribution of Australia’s mining and METS sector into the future,
policymakers need to ensure that the economic environment remains open and flexible. Policy considerations
likely to be relevant include:
Competitive and fair taxation system – ensuring that Australia’s corporate taxation rate and other
mining-related taxes are stable and competitive relative to other economies, and upholding good economic
principles in setting taxation policy, for example, in respect of taxing business inputs;
Flexible workplaces – ensuring that Australia has an industrial relations framework that is both equitable
and productive by addressing deficiencies in the Fair Work Act 2009 and considering more flexible
approaches to workplace relations, as well as ensuring that appropriate skilled migration settings are
maintained;
Openness to foreign investment – greater clarity and consistency in Foreign Investment Review Board
decisions, and ensuring that Australia continues to engage with the broader region through bilateral and
multilateral agreements;
Affordable and reliable energy – as the mining and METS sector is a significant energy user, it is
essential that firms in this sector have access to reliable and affordable power;
Efficient approaches to regulation – simplifying or streamlining government regulations such as
environmental approvals in order to improve certainty and consistency; and
Support for collaboration and entrepreneurship – continued support for bodies that enhance
collaboration between the mining and METS sector and research organisations.
The risks of inaction in these areas are significant. Supportive and flexible policy settings helped to establish
the most recent mining boom; yet there is now the potential for adverse policy settings to compromise a
major source of Australia’s national prosperity and future economic growth. It is critical that governments pay
heed to these key policy areas and initiate reforms where improvement is required, so that mining and METS
continue to innovate and grow, helping to secure Australia’s future prosperity.
Deloitte Access Economics

Mining and METS: engines of economic growth and prosperity for Australians
5
1 Mining and METS in Australia
Australia’s mining sector has historically played an important role in shaping the national economy and
society. The mining extraction and refining industries themselves – as well as the various industries that
supply mining equipment, technology and services (METS) – continue to make a significant contribution to the
Australian economy as a source of income and a driver of rising living standards.
Figure 1.1: Examples of mining and METS industries*
* A detailed description of industries included and excluded in the definitions of mining and METS for the purposes of this report is provided
below in Section 2.1.1.
Source: Deloitte Access Economics (2017)
The size and scale of mining and METS in Australia owe much to the unique geology of the Australian
landscape. The country is extremely rich in natural mineral resources. For example, Australia has the world’s
largest economically demonstrated reserves of iron ore and gold, second largest reserves of bauxite and
copper, and the fifth largest reserves of black coal (Geoscience Australia 2016). These significant natural
endowments form the basis of Australia’s comparative advantage in mining production, which is realised by
innovative and competitive firms and (ideally) supported by sound policies and efficient regulatory practices.
The Australian economy is a world leader in the production of a number of minerals, including iron ore,
bauxite, gold, lead, zinc and coal. As illustrated in Chart 1.2, iron ore production represents over half of the
resources extraction component of the sector in value-added terms.
Mining support
services
Chemical
manufacturing
Telecommuni-
cation services
Transportation
services
Equipment
manufacturing
Computer
systems design
Iron ore
METS industries
Mining extraction and refining industries
Coal Copper Gold Bauxite
The mining and METS sector comprises a diverse range of economic activity across all States and Territories in
Australia. Since at least the 1850s, mining has played a significant role in shaping the country and, more
recently, mining has been a major driver of economic growth.
This chapter provides an overview of mining and METS in Australia and summarises how the most recent mining
boom has developed and matured.

Mining and METS: engines of economic growth and prosperity for Australians
6
Chart 1.2: Composition of Australia’s mining industry value added, 2014-15
Source: ABS cat. 8415.0 Mining Operations, Australia (2016)
A number of key features of the mining and METS sector in Australia are discussed below.
Mining and METS businesses operate across Australia
Australia has a rich and diverse natural endowment of minerals, which are located across the country.
Correspondingly, mining and METS businesses also operate in various states and territories across Australia.
In particular, 77% of total mines in operation and 66% of METS businesses are located in New South Wales,
Queensland and Western Australia (Chart 1.3).
Chart 1.3: Share of mines in operation and METS businesses in selected states
Source: Geoscience Australia (2015), Austmine (2013)
While a large share of mining activity is conducted at or within close geographic proximity of mine sites in
regional areas, the mining and METS sector also has a strong presence in metropolitan centres across
Australia. The head offices of mining companies are typically located in capital cities (such as Melbourne), and
Coal, 20%
Iron ore, 57%
Copper, 3%
Gold, 9%
Mineral sand, 1%
Silver, lead, zinc, 3%
Other metal ore mining, 4%
Non-metallic mineral mining,
3%
0%
5%
10%
15%
20%
25%
30%
35%
40%
45%
50%
METSbusinesses
Mines inoperation
METSbusinesses
Mines inoperation
METSbusinesses
Mines inoperation
NSW QLD WA
Share
of
tota
l M
ET
S b
usin
esses /
m
ines in o
pera
tion

Mining and METS: engines of economic growth and prosperity for Australians
7
their operations include corporate functions such as management, finance, marketing and legal. In addition,
METS businesses tend to be located in metropolitan areas, which facilitates their ability to supply goods and
services to non-mining markets where their products and skills may be transferable, such as infrastructure,
defence and renewable energy.
Exporting to overseas markets is a significant part of mining and METS activity
A key feature of the Australian mining sector is its export-intensive nature. In 1969, the minerals and fuels
industry comprised only 17% of Australian exports and was dwarfed by agriculture (Anderson 2014). There
has been substantial growth since then - minerals and energy exports accounted for 64% of Australia’s
merchandise exports by value in 2015-16 (DIIS 2016). The increasing importance of the sector has been
driven by the rising demand for resources in Asia due to continued economic development and the advance of
urbanisation.
Exports are also a key component of the METS industry, with over half of all businesses operating in the METS
sector exporting products, services or technology to mines around the world (Department of Industry 2016). A
2015 survey of METS companies in Australia found that the top export market for the sector was Indonesia,
with other important overseas markets including New Zealand, the United States, Chile, Papua New Guinea
and the Philippines (Austmine 2015). The survey also found that the number of METS companies exporting to
overseas markets has increased over recent years, rising by 11 per cent since the previous survey conducted
in 2013. The Australian METS sector’s global success in export markets has been, in large part, enabled by the
experience and established expertise of METS companies developed over time by engagement with domestic
mining operations.
The capital intensity of mining operations is high but varies for METS companies
Most mining operations require significant upfront capital investment in machinery and equipment. By
contrast, the capital intensity of METS activity varies depending on the products and services offered.
For example, METS businesses that provide mining support services such as exploration, as well as
manufacturers of heavy mining equipment and instruments, require significant capital investment, while the
capital intensity associated with professional services such as consulting, legal and accounting services is
generally lower.
There has been a boom in mining and METS activity over recent years
Over the past decade, the Australian mining industry has experienced one of the largest and longest mining
booms in history. The boom can be divided into three stages:
Price increase phase, in which the prices for resources such as coal and iron ore increased rapidly during
the 2000s, resulting in a sharp rise in Australia’s terms of trade;
Investment phase, in which Australian mining companies made additional capital investments in mining
projects to expand their productive capacity; and
Production phase, when the additional capacity from the investment boom becomes operational,
resulting in an increased volume of minerals being extracted and exported.
Chart 1.4 illustrates the rapid increase in commodity prices observed throughout the 2000s. This sharp rise
was driven by growth in global demand for resources, particularly from China in the context of the significant
construction booms and rapid urbanisation experienced in major cities across that country. This in turn raised
Chinese demand for commodities, outstripping increases in supply and significantly boosting world commodity
prices.

Mining and METS: engines of economic growth and prosperity for Australians
8
Chart 1.4: Price movements in metals commodities*
* Data presented is the IMF’s metals price index which includes the prices of copper, aluminium, iron ore, tin, nickel, zinc, lead and uranium,
with a reference year of 2005 = 100.
Source: IMF (2017).
Given the long-term nature of investment decisions and the high capital intensity of mining projects, it can
take some time for companies to respond to increased demand and prices with an increase in production.
Increased productive capacity is created through net positive investment in real capital goods, which in the
most recent Australian mining boom occurred over the decade to the early 2010s, as can be seen in Chart 1.5.
At the peak of the investment boom in 2012, resources investment (including oil and gas) represented 58% of
total investment in the Australian economy.2
Chart 1.5: Investment by industry type
Source: ABS cat. 5625.0 Private New Capital Expenditure and Expected Expenditure, Australia (2016)
2 Note that this figure includes investment in both the minerals sector and the oil and gas sector, the latter of which is not included in the economic analysis presented throughout this report.
0
50
100
150
200
250
$0 bn
$20 bn
$40 bn
$60 bn
$80 bn
$100 bn
$120 bn
$140 bn
$160 bn
$180 bn
1990 1995 2000 2005 2010 2015
Mining Manufacturing Other industries Total

Mining and METS: engines of economic growth and prosperity for Australians
9
Having passed through the price and investment phases, the mining boom has now entered the production
phase, in which previous investments in new mining projects are now operational, thereby increasing the
capacity of the industry to extract and export a larger volume of resources (Chart 1.6).
However, this period has coincided with a decline in commodity prices over recent years (see figure 1.4
above), and so mining companies have sought cost reductions and productivity improvements in order to
maintain profitability (or positive cash flow). The Productivity Commission (2016) recently reported that the
mining sector has made efficient use of the large capital stock built up during the boom, with output growth of
7.6% over the 2014-15 financial year and growth in inputs of only 2.1%.
Chart 1.6: Annual volume of mine production indexes (metals and other minerals)
* Data series from the Department is only available from 2006-07; the index has been calculated with a reference year of 1997-98 = 100.
Source: Department of Industry, Innovation and Science Resources and Energy Quarterly (2016)
Overall, the most recent mining boom has had a long-term positive impact on the broader Australian
economy. A Reserve Bank of Australia research discussion paper (Downes, Hanslow and Tulip 2014) estimates
that the boom:
Resulted in a permanent increase in living standards, measured by real household disposable income per
capita, of around 13% in 2013. Approximately half of this increase (6%) is the result of increases in
relative prices (that is, a ‘purchasing power’ effect), while the other half (6%) is the result of increased
volume of output.
Lowered the unemployment rate by around 1.25 percentage points in 2013, from an unemployment rate
of around 6.6% without the mining boom to around 5.3% with the boom.
The RBA also highlighted that industries outside the mining sector have benefited indirectly from aspects of
the mining boom; for example, Australian manufacturing has benefited from the higher demand for equipment
needed to support the higher levels of mining activity.
0
50
100
150
200
250
300

Mining and METS: engines of economic growth and prosperity for Australians
10
2 The economic significance of mining and METS
2.1 Contribution to the Australian economy
2.1.1 Modelling framework
An economic contribution study estimates the impact of an industry (or firm) on the economy, both directly
though the operations of the industry itself, and indirectly as the impact of its activities filter through the
broader Australian economy. More specifically, our economic contribution analysis includes estimates of:
the direct contribution of the mining and METS sector – calculated using the income approach to Gross
Domestic Product (GDP) as the returns to labour in the form of wages and salaries, and the returns to
capital in the form of gross operating surplus from the sector’s activities; and
the indirect contribution or flow-on impacts of the sector – generated by the industry-specific inputs
required to support activity in the mining and METS sector, which considers demand for upstream inputs
and further interlinkages with other sectors of the Australian economy.
The economic contribution of the mining and METS sector is estimated using Input-Output (IO) modelling. Our
overall approach to economic contribution modelling is consistent with the framework used by the Australian
Bureau of Statistics (ABS) in compiling the Australian National Accounts. A general discussion of the use of
input-output tables in economic contribution modelling, including interpreting the results, is provided in
Appendix A.
Our modelling framework also follows on from the methodology applied in the RBA’s 2013 Research Discussion
Paper Industry Dimensions of the Resource Boom: And Input-Output Analysis (Rayner and Bishop, 2013).
In this research paper, input-output tables are used to identify industries in the “resource economy”, which
comprises resource extraction (including resource-specific manufacturing e.g. refining activities) and other
resource-related activity (e.g. constructing mines, related transportation, engineering services). This approach
meant that the economic contribution of the overall resource sector could be more accurately captured, with
the paper highlighting that the ABS’s definition of the “mining industry” corresponds only to the resource
The mining and METS sector has made a significant contribution to driving growth in Australian living standards,
particularly over the course of the most recent boom. Australia’s significant natural endowments form the basis of
the nation’s comparative advantage in mining production, which is realised by innovative and competitive firms
and (ideally) supported by sound policies and efficient regulatory practices (discussed in Chapter 3). Because
Australia is a small open economy, its comparative advantage in minerals and energy exports makes the mining
and METS sector an important driver of broader economic growth.
In this chapter, we examine the critical role played by the mining and METS sector in the Australian economy:
- First, we quantify the contribution of the sector using economic modelling, in order to capture the full
economic footprint resulting from production in the mining and METS sector in 2015-16 – both nationally and
in regions of significant mining and METS activity.
- Second, we highlight the importance of innovation in driving economic growth and competitive advantage,
and present case studies that illustrate the benefits of new technologies in the mining and METS sector.
We estimate that in 2015-16, the mining and METS sector’s total economic contribution to Australia was $236.8
billion, representing around 15% of the Australian economy. This economic activity supported a total of
1,139,768 FTE jobs across Australia, which represents around 10% of total FTE employment.

Mining and METS: engines of economic growth and prosperity for Australians
11
extraction component of the “resource economy”, less resource-specific manufacturing. We therefore take a
similar approach in our modelling framework to ensure that the economic analysis provides a suitable
representation of the contribution of mining and METS activity in Australia.
Defining the mining and METS sector
In order to model the economic contribution of mining and METS, industries relevant to the sector within the
ABS’s standard Input-Output Industry Group (IOIG) classifications need to be identified.
The Australian mining sector is therefore defined to comprise the IOIGs listed below in Table 2.1, noting that
in some cases only a portion of the relevant IOIG has been included in the definition.
Table 2.1: Industries comprising the “mining sector”
Code Input-Output Industry Group Inclusions
601 Coal Mining All
801 Iron Ore Mining All
802 Non Ferrous Metal Ore Mining All
901 Non Metallic Mineral Mining All
1001 Exploration and Mining Support Services Exploration only
2101 Iron and Steel Manufacturing Iron Smelting and Steel Manufacturing only
2102 Basic Non-Ferrous Metal Manufacturing Alumina Production; Aluminium Smelting;
Copper, Silver, Lead and Zing Smelting and
Refining; Other Basic Non-Ferrous Metal
Manufacturing only
Source: Deloitte Access Economics (2017)
Defining the Australian METS sector is a more complex task, as there is no widely agreed or accepted
definition of what activities are included in “METS”, and the breadth of industries that supply specialised inputs
to the mining sector is wide.3 This means that the scope of the METS sector is somewhat ambiguous,
particularly in the context of applying standard ABS industry definitions.
Consequently, a number of steps were taken to isolate the METS sector as part of the economic contribution
modelling process, starting with a principles-based approach to identifying industries that are heavily focused
on supplying the mining industry.
3 Indeed, previous studies on METS and mining-related economic activity have typically used different methods for defining the sector, including in Austmine’s 2013 report Australia’s New Driver for Growth: Mining Equipment, Technology and
Services; a 2014 Research Discussion Paper published by the RBA on The Effect of the Mining Boom on the Australian Economy; and a Lateral Economics (n.d.) report on the gross value added of the METS sector.
The mining sector has been defined to capture the activities of mining companies operating in
Australia. This includes minerals extraction industries (i.e. excludes oil and gas), exploration activities
and metal processing to a primary product (i.e. in refined metal form).
The mining equipment, technology and services (METS) sector comprises companies that are heavily
focused on supplying the mining industry. They provide goods and services that are innovative,
technologically advanced or distinctive in their use by the mining industry.

Mining and METS: engines of economic growth and prosperity for Australians
12
In order to provide a quantitative foundation for identifying relevant METS sector industries, we examined the
IOIGs that are key suppliers of inputs to the mining sector in the Pilbara, Bowen-Surat and Hunter regions –
that is, in areas across Australia where there is significant mining activity – as well as industries whose output
at a national level is heavily focused on supporting the mining sector.
Aligning the above principles with the industries that are key regional and national suppliers to the mining
sector enabled us to determine the IOIGs that could be specialised enough in their mining-related activities to
be classified as METS (e.g. machinery and equipment manufacturing, civil engineering construction, road and
rail transport). It also allowed us to identify and exclude from the METS definition those industries that
represent more ‘generic supplying’ industries, whose inputs to the mining sector are also broadly relevant to
other sectors (e.g. petroleum, finance, accommodation).
These industries have been excluded from the modelling definition in order to take a relatively conservative
approach to quantifying the economic contribution of the mining and METS sector. However, it is important to
note that these ‘generic supplying’ industries – which also include areas such as electricity generation, clothing
manufacturing, food and beverage services, and construction services – also make a significant contribution to
one or more of the key mining regions in Australia.
IOIGs that support economic activity in the mining sector are listed below in Table 2.2.
Table 2.2: Industries partially classified as the “METS sector”
Code Input-Output Industry Group
1001 Exploration and Mining Support Services – Mining Support Services component only
1803 Basic Chemical Manufacturing
1902 Natural Rubber Product Manufacturing
2303 Railway Rolling Stock Manufacturing
2401 Professional, Scientific, Computer and Electronic Equipment Manufacturing
2403 Electrical Equipment Manufacturing
2405 Specialised and other Machinery and Equipment Manufacturing
2801 Water Supply, Sewerage and Drainage Services
2901 Waste Collection, Treatment and Disposal Services
3101 Heavy and Civil Engineering Construction
4601 Road Transport
4701 Rail Transport
4801 Water, Pipeline and Other Transport
4901 Air and Space Transport
5201 Transport Support services and storage
In this context:
- Mining equipment includes manufactured items (plant, machinery, equipment) that contribute to
the capital stock of the mining industry; parts for machinery and equipment; industry-specific
supplies such as chemicals and explosives (i.e. excluding multi-purpose generic supplies such as
food, fuel and furniture); and construction and civil engineering.
- Mining technology includes engineering design; information and communications technology
(such as data analytics, real-time monitoring and sensors); and scientific research into
geoscience, mine engineering, mineral processing or other mining industries.
- Mining services include applied sciences such as laboratory work, environmental sciences,
geospatial data processing; equipment maintenance and repairs; specialised mining consulting;
and transportation.

Mining and METS: engines of economic growth and prosperity for Australians
13
Code Input-Output Industry Group
5701 Internet Service Providers, Internet Publishing and Broadcasting, Websearch Portals and
Data Processing
5801 Telecommunication Services
6001 Library and Other Information Services
6601 Rental and Hiring Services (except Real Estate)
6901 Professional, Scientific and Technical Services
7001 Computer Systems Design and Related Services
8110 Technical, Vocational and Tertiary Education Services (incl undergraduate and postgraduate)
9401 Automotive Repair and Maintenance
9402 Other Repair and Maintenance
Source: Deloitte Access Economics (2017)
However, not all economic activity within these industries can be considered to support the mining sector. We
therefore define the METS sector as comprising specified portions of each of these IOIGs. The split between
the METs component and the non-METS component in each industry was determined based on the proportion
of each industry’s total supply to the mining IOIGs listed in Table 2.1.
The mining industries and the identified METS components of the METS industries were then aggregated to
form a combined “mining and METS sector” within a new IO table. This new table is then used to estimate the
direct and indirect contributions of the overall mining and METS sector to the Australian economy.
2.1.2 National economic contribution
The direct economic contribution of the mining and METS sector is represented by the sector’s total value
added. In economic terms, value added measures the value of output (i.e. goods and services) generated by
the mining and METS sector’s factors of production (i.e. labour and capital) as measured by the income earned
by these factors of production – that is, the returns to labour (wages) and capital (profit).
Value added is therefore a smaller figure than the sector’s revenue, as it does not account for the cost of
purchasing inputs from other firms – these are measured as part of the sector’s indirect economic
contribution. In economic terms, this indirect contribution is a measure of the demand for goods and services
produced in other sectors as a result of demand generated by the mining and METS sector itself; that is, it
represents the sector’s flow-on impacts to other parts of the economy through its use of intermediate inputs.
The average dollar of revenue from the mining and METS sector contributes $0.48 and $0.37 in direct and
indirect value added, respectively, to the Australian economy.
Table 2.3: Economic contribution of mining and METS sector in Australia, 2015-16
Direct contribution Indirect contribution Total contribution
Value added ($m) 133,244 103,552 236,797
Value added / revenue ($) 0.482 0.37 0.857
Employment (FTE) 484,114 655,654 1,139,768
Source: Deloitte Access Economics (2017)
Deloitte Access Economics estimates that in 2015-16 the mining and METS sector directly contributed
$133.2 billion in value added to the Australian economy and supported 484,114 full-time equivalent
(FTE) jobs (see Table 2.3 below). The indirect economic contribution is estimated to be $103.6 billion,
supporting an additional 655,654 FTE jobs.
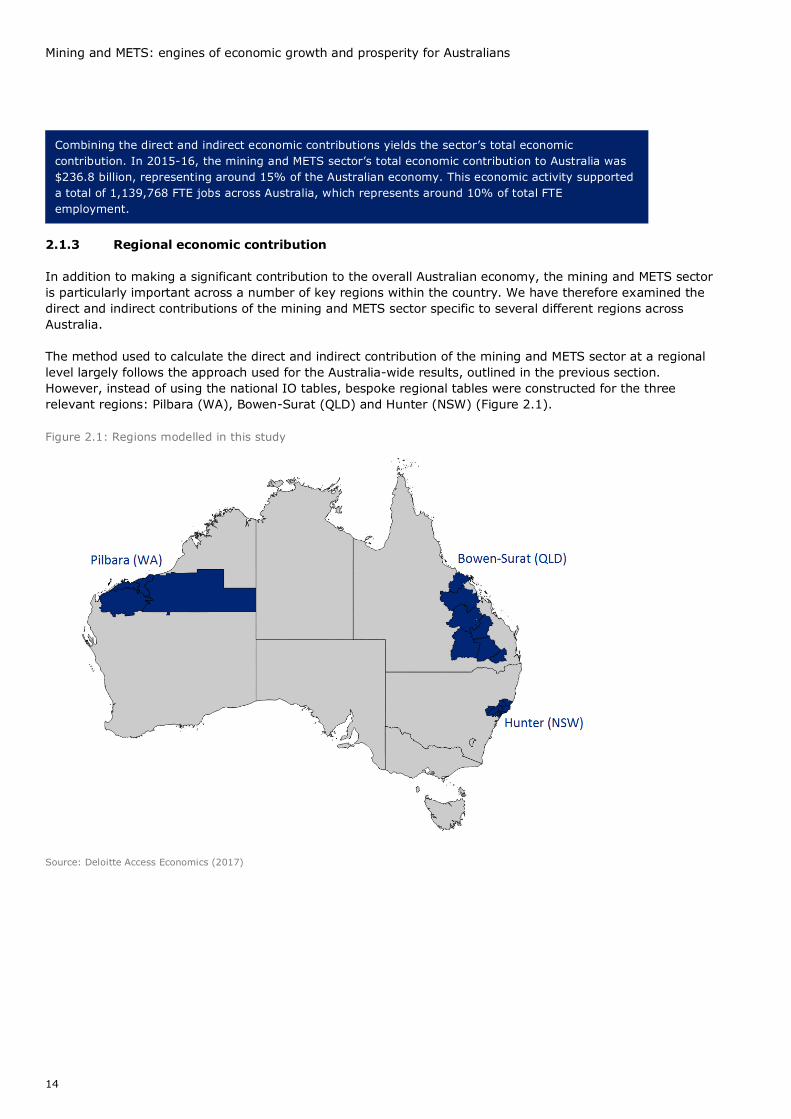
Mining and METS: engines of economic growth and prosperity for Australians
14
2.1.3 Regional economic contribution
In addition to making a significant contribution to the overall Australian economy, the mining and METS sector
is particularly important across a number of key regions within the country. We have therefore examined the
direct and indirect contributions of the mining and METS sector specific to several different regions across
Australia.
The method used to calculate the direct and indirect contribution of the mining and METS sector at a regional
level largely follows the approach used for the Australia-wide results, outlined in the previous section.
However, instead of using the national IO tables, bespoke regional tables were constructed for the three
relevant regions: Pilbara (WA), Bowen-Surat (QLD) and Hunter (NSW) (Figure 2.1).
Figure 2.1: Regions modelled in this study
Source: Deloitte Access Economics (2017)
Combining the direct and indirect economic contributions yields the sector’s total economic
contribution. In 2015-16, the mining and METS sector’s total economic contribution to Australia was
$236.8 billion, representing around 15% of the Australian economy. This economic activity supported
a total of 1,139,768 FTE jobs across Australia, which represents around 10% of total FTE
employment.

Mining and METS: engines of economic growth and prosperity for Australians
15
Pilbara (WA)
The Pilbara is a large, arid area in north-west Western Australia, known for its large iron ore and petroleum
reserves.4 96% of Western Australia’s iron ore exports come from the Pilbara. Including both iron ore and
petroleum, the region produces over two-thirds of the State’s commodity exports and roughly 20% of
Australia’s total merchandise exports by value (RDA Pilbara, 2014). The Pilbara has a low population density
and its economy is dominated by the mining and METS sector; economic activity outside of mining and METS
includes some basic services, pastoralism, tourism and fishing (RDA Pilbara, 2014).
Deloitte Access Economics estimates that, in the Pilbara region of Western Australia, the mining and METS
sector directly contributed $30.9 billion in value added to the regional economy in 2015-16, and supported
around 47,100 FTE jobs (see Table 2.4 below). Many of the mining and METS jobs that have been created in
the Pilbara region are fly-in fly-out (FIFO) positions, which allow resource companies to draw from a wider
pool of workers while also providing the opportunity to spread the economic benefits of resource industry
employment to the rest of the State (Commonwealth of Australia, 2013). The indirect economic contribution to
the Pilbara region is estimated to be $6.9 billion, supporting approximately 46,700 jobs in FTE terms. Overall,
the total direct and indirect contribution of $37.8 billion in value added represented 88% of economic activity
in the Pilbara region in 2015-16.
Table 2.4: Economic contribution of mining and METS sector in Pilbara region, 2015-16
Direct contribution Indirect contribution Total contribution
Value added ($m) 30,894 6,882 37,776
Employment (FTE) 47,142 46,697 93,839
Source: Deloitte Access Economics (2017)
Figure 2.2: Summary of Pilbara region
Source: Deloitte Access Economics (2017)
4 It should be noted the petroleum production is beyond the scope of this report.

Mining and METS: engines of economic growth and prosperity for Australians
16
Bowen-Surat (QLD)
The Bowen and Surat basins are located in central and south-west Queensland. Bowen basin contains
Australia’s largest coal reserves (especially high quality metallurgical coal), with almost all of Queensland’s
operating coal mines in 2014-15 being located in the Bowen basin (DNRM 2016). Due to this abundance of
coking coal, Queensland has become the world’s largest exporter of seaborne-traded metallurgical coal (TMR
2016). The region is serviced by a number of ports, which export a majority of the coal mined in the region. In
2014-15, the ports of Abbot Point, Hay Point and Gladstone, respectively, exported 29, 72 and 68 million
tonnes of metallurgical and thermal coal (TMR, 2016).
Deloitte Access Economics estimates that, in the Bowen-Surat region of Queensland, the mining and METS
sector directly contributed $11.3 billion in value added to the regional economy in 2015-16, and supported
around 49,200 FTE jobs (see Table 2.5 below). The indirect economic contribution to the Bowen-Surat region
is estimated to be $7.3 billion, supporting approximately 50,600 jobs in FTE terms. Overall, the total direct
and indirect contribution of $18.6 billion in value added represented 63% of economic activity in the Bowen-
Surat region in 2015-16.
Table 2.5: Economic contribution of mining and METS sector in Bowen-Surat region, 2015-16
Direct contribution Indirect contribution Total contribution
Value added ($m) 11,251 7,343 18,594
Employment (FTE) 49,186 50,566 99,752
Source: Deloitte Access Economics (2017)
Figure 2.3: Summary of Bowen-Surat region
Source: Deloitte Access Economics (2017)

Mining and METS: engines of economic growth and prosperity for Australians
17
Hunter (NSW)
The Hunter region is located in New South Wales, around 100 to 300 kilometres north of Sydney. The Hunter
has a long history of coal mining: the area was first settled by Europeans due to its extensive coal reserves
and its major city, Newcastle, was named after the British coal-shipping town. Coal from the Hunter was
among Australia’s first exports, as coal was shipped from the colony of New South Wales to Bengal in 1799
(Kininmonth 2002). The region continues to be NSW’s major source of mining and METS activity, with the
Hunter coalfields accounting for over half of NSW’s overall coal production (CIE 2014). Moreover, Newcastle is
the world’s largest coal export port.
Deloitte Access Economics estimates that, in the Hunter region of NSW, the mining and METS sector directly
contributed $8.5 billion in value added to the regional economy in 2015-16, and supported around 50,400 FTE
jobs (see Table 2.6 below). The indirect economic contribution to the Hunter region is estimated to be $6.7
billion, supporting approximately 43,100 jobs in FTE terms. Overall, the total direct and indirect contribution of
$15.2 billion in value added represented 34% of economic activity in the Hunter region in 2015-16.
Table 2.6: Economic contribution of mining and METS sector in Hunter region, 2015-16
Direct contribution Indirect contribution Total contribution
Value added ($m) 8,501 6,698 15,199
Employment (FTE) 50,416 43,138 93,554
Source: Deloitte Access Economics (2017)
Figure 2.4: Summary of Hunter region
Source: Deloitte Access Economics (2017)

Mining and METS: engines of economic growth and prosperity for Australians
18
2.2 Innovation as a key growth driver
Although Australia is blessed with large natural endowments of iron ore, coal, bauxite, base metals and many
other minerals, the same is also true of other countries such as South Africa, Canada, Indonesia and Brazil.
Innovation is a key differentiator for Australian-based mining and METS companies to ensure they, and
Australia, continue to be global leaders – not only as a mining nation, but also as an innovation nation.
Innovation is not new to the mining and METS sector. Miners rely on continual innovation and technological
improvement, and innovations in mining often lower the costs of basic inputs (such as energy or metals) to
other economic activities, thereby helping to build a foundation for further innovation in other supply chains.
The mining industry has changed radically in the past century, and has transitioned from a largely labour
intensive industry to a highly capital intensive industry. In recent years, there have been significant
developments in innovative transformations being implemented across the Australian mining and METS sector.
No part of the production process remains unimproved, and in this context, our case studies highlight 10
Australian innovators from across the sector. We find that across these companies, innovation has been
implemented through a diverse range of approaches, which include:
The creation of new technologies that improve efficiencies in the production process;
Adopting existing technologies for new applications to realise additional productivity gains;
Collaborating with academic institutions and scientific research bodies in order to develop and integrate
research ideas with industry applications;
Pre-competitive technological collaboration between companies in the same industry to realise benefits
across all stakeholders;
Collaboration between producers and suppliers in order to increase efficiency throughout the supply chain;
and
Improving company processes by using the knowledge and experience of workers to drive innovative
activities.
These case studies represent not only some of the largest miners listed on the ASX but also smaller service
companies that support the industry. They cover a range of impacts from the corporate and strategic level
through to specific applications of innovations in day-to-day tasks, and illustrate how innovation can be a key
driver of business growth and enable Australian mining and METS companies to be globally competitive. Some
of the benefits of innovation highlighted in these case studies include:
Reduced operating costs reflecting efficiency gains from using new technologies;
Extending the productive life of mines, such as by enabling the extraction of deposits that are deeper or
more remote;
Higher yields, such as increased metal recovery from ores;
Safety improvements flowing from simplified processes and earlier detection of hazards;
Higher workforce satisfaction and productivity in translating innovative ideas suggested by employees into
operational improvements;
Innovation is integral to the performance of the mining and METS sector. It is a global and highly
competitive sector, and as such companies that are slower to create or adapt to new products and
processes – including new technologies – risk fewer growth opportunities and lower returns.
Australia’s comparative advantage in minerals and energy exports is not simply a function of its
natural endowments, important as they are. Rather, this comparative advantage has to be achieved
by productive firms that are prepared to bear the risks of investing, employing and innovating to
derive market value from mineral resources.
Innovation enables the mining industry to extract and process ores more efficiently, and to extract
deposits that are deeper or more remote. Innovation also improves safety and environmental
outcomes. Australia’s mining industry is increasingly focused on integrating new technology and ideas
into its operations. Consequently, the METS sector is likely to become ever more important.

Mining and METS: engines of economic growth and prosperity for Australians
19
Applying knowledge from research institutions to implement new or improved processes and products; and
Brand development and generating new opportunities by enabling access to new markets overseas.
There is a common theme that flows through all of the case studies presented – innovation is about unlocking
individual ideas and improving what workers do every day. The case studies illustrate that no matter what the
size of the company or the worker’s position in the organisational chart, good ideas are recognised for their
merits and quickly adopted.
2.2.1 Newcrest
Newcrest Mining Limited was formed in 1990 following Newmont Australia Limited’s acquisition of Australmin
Holdings Limited and its subsequent merger with BHP Gold Mines Limited. Newcrest is one of the largest gold
producers in the world with 77.4 tonnes, or 2.4% of global gold produced in 2015.
The biggest Australian gold producer
Newcrest owns and operates a total of five gold mines internationally including Cadia in New South Wales and
Telfer in Western Australia with combined production of over 1.13 million ounces of gold in FY2016 (46% of
Newcrest’s global production) worth as much as US$1.32 billion (AU$1.81 billion) a year. Newcrest’s gold
production increased 1% from FY2015, an increase driven by the implementation of operational improvement
initiatives.
An innovator’s mindset driving faster adoption of innovation
Newcrest’s approach to innovation is about setting a transformative vision to drive breakthrough thinking, and
encouraging a culture of experimentation, collaboration and fast adoption. The company has a wide range of
industry collaborations in place with research institutions, suppliers in the METS sector and other mining
companies and is using these to drive faster development and application of innovative solutions and
technologies.
Newcrest is developing the capability to engineer harder rock masses to enable caving at depths of greater
than 1 kilometre. This innovation can turn a short life underground mine into a long-life series of block caves,
through more efficient use of block caving mining techniques and through improved management of safety at
the mine. This in turn increases the likelihood of further development of low-grade, previously uneconomic
orebodies as well as improving returns from existing operations.
Innovation drives Australia’s largest underground mine
One of the world’s most advanced and innovative gold mines can be found 25 kilometres south of Orange in
central-west New South Wales.
Newcrest began developing the Cadia East deposit in 2010 and has invested more than AU$2 billion to build
the first underground cave of this design in the country. As part of Newcrest’s Cadia Valley Operations, Cadia
East is at the forefront of mining innovation, using a cutting-edge caving technique and the latest technology
to deliver safe, low-cost production.
Innovation process engineering enabled a faster production ramp-up at Cadia East’s Panel Cave 1 than any
comparable underground mine in the world. This was achieved through high-capacity ore transportation
design, intensive preconditioning, an innovative undercutting strategy and a high-efficiency loading
configuration.
Newcrest worked closely with Codelco, a Chilean mining company with expertise in bulk underground mining
techniques, to assist in developing technologies and maximise efficiency at Cadia East.
Cadia East is Australia’s largest underground mine and when it reaches full capacity it will be one of the
largest tonnage hard rock underground mines in the world with a potential life of more than 30 years.

Mining and METS: engines of economic growth and prosperity for Australians
20
Cave process monitoring and control
Cave process monitoring is the state of the art capability to ‘see’ what’s going on within the complex cave
propagation and draw process.
Innovative technologies such as ‘cave tracker’ developed by Elexon Mining in collaboration with CRC Mining
(now Mining3), Newcrest and Rio Tinto deliver productivity improvements and make cave mining safer by
detecting the formation of air gaps before they pose a hazard.
Electric drive loaders
Innovations in hybrid electric drive technology are increasing underground loader productivity due to improved
work cycle performance, reduced operating costs, increased durability and reduced emissions from the
reduced engine size. Simplification of the all-electric driveline leads to fewer failures.
Newcrest has trialled Joy Global’s initial 18 tonne capacity prototype hybrid loader for over 12 months and is
now progressing trials for the larger 22 tonne loader.
Mechanical cut tunnelling
Rock strength presents a challenge to effective mining and new methods for excavation such as Joy’s
‘Dynacut’ system enable the creation of compact mining equipment capable of excavating rock with strengths
in excess of 250MPa. The benefit of this technology is the design of small and highly manoeuvrable continuous
excavation machines.
In effect, if correctly implemented, continuous mining processes (vs. typical batch processes) may yield a 20%
reduction in operational costs by increasing advance rates and reducing equipment requirements and energy
use.
2.2.2 Peabody
Peabody Energy serves metallurgical and thermal coal customers in 25 countries and holds majority interests
in 26 coal operations located in the U.S. and Australia. The company reported improved Australian costs per
tonne in the order of 24% in 2015, delivering savings of some $620 million globally.
The largest private coal producer in Australia
Peabody Energy operates three mines in New South Wales and six in Queensland. The Wilpinjong mine
operation in New South Wales employs a workforce of approximately 400 people (including subcontractors)
and sold 12.5 million tons of high quality thermal coal to Australian and Asian operators in 2015.
Driving down costs and incidents with innovation
Innovation at the Wilpinjong mine is conducive to achieving Peabody’s safety and productivity improvement
targets in several aspects of the miner’s operations. Partnerships with leading industry players and research
bodies like Caterpillar (CAT) and the University of Queensland (UQ) are key to allowing Peabody access to new
technologies to sustain its values for safety and cost-competitiveness through continuous improvement. As
stated by Blair Jackson, the General Manager of the Wilpinjong mine:
“A key advantage of gaining early access to new technology is that you can be part of product development to ensure they fit a practical application.”

Mining and METS: engines of economic growth and prosperity for Australians
21
Semi-autonomous bulldozers
In collaboration with the University of Queensland and Caterpillar (CAT) and with funding from the Australian
Coal Association Research Program (ACARP),5 Peabody Energy is trialling the integration of a semi-
autonomous bulldozer into its bulk dozer pushing operations at its Wilpinjong Mine.
The benefit of this technology is increased safety via the removal of operator exposure to whole body vibration
and mounting and dismounting incidents as well as a productivity increase by:
Increased daily hours of operation from the current 18.5 hours to 23.5 hours in remote operation;
More cubic meters pushed per hour;
Reduced energy use (fuel) per cubic meter pushed.
Drones
The Wilpinjong mine introduced drone use in mid-2014 with a hire unit to start with and, once benefits were
made evident, the miner moved to purchasing its own unit.
Drones reduce risks of incidents by allowing monitoring of tailings and carrying out inspections in dangerous
areas (for example, due to slope or height). They are used for aerial fly-overs and the temperature monitoring
of stockpiles. The other key component the drone allows is quick turn around on survey volumes. These pick-
ups are completed with the drone with no interaction with any mining equipment. This eliminates the need to
have surveyors on the ground doing survey work amongst the mining equipment.
Another benefit is the ability to overcome stigmas associated with coal mining. Mining operations are often
pictured as gaping open pits with long lasting visual impacts. Drones enable open cut mines like Wilpinjong to
use media to correctly represent their operations to remotely located stakeholders.
5 ACARP aims to improve the industry’s competitiveness, safety and environmental performance, and has provided $273 million in funding to 1,468 projects since its inception in 1992.

Mining and METS: engines of economic growth and prosperity for Australians
22
2.2.3 BHP Billiton
For more than 130 years, BHP Billiton has been contributing to Australian industry development and economic
growth. The company has grown into one of the world’s leading resources companies, with its Minerals
Australia business directly employing around 16,000 people across four States with a diversified asset portfolio
including iron ore, metallurgical coal, copper and nickel.
Ensuring the benefits of its operations flow back to the community is a priority for BHP Billiton, with A$10
billion in goods and services for its operations sourced from over 11,500 Australian suppliers during the 2016
financial year. Its focus on local industry participation coupled with the scale of its operations provides
significant opportunities for the nation’s mining, engineering and technology services (METS) sector.
Over recent years, BHP Billiton has made several changes to drive productivity across its business and
empower its frontline employees to pursue safer, more efficient and innovative ways to work. This included a
concerted effort to significantly improve the inclusiveness of its culture and diversity of its workforce. This
concerted focus has underpinned US$11 billion in annualised productivity gains across its global portfolio over
the last four years.
Also facilitating this result was the evolution of the BHP Billiton operating model, which in early 2016 saw
assets previously divided on commodity lines consolidated under a single regional management model
supported by globalised functions such as Supply and Technology that now free its operations to focus on
safety and productivity. Specifically, the Supply function is now coordinating and standardising its activities
providing a single accountable interface for our supplier relationships and commercial activities. The model will
improve the ability of our suppliers to connect with BHP Billiton’s operations, offering a wider set of
opportunities for the METs sector. A great example of this is the work done by the maintenance team at the
Blackwater coal mine with the Supply and Technology functions who, have been working closely with
Brisbane-based software provider Dingo to develop a mobile device application that is helping improve the
speed, efficiency and quality of in-field equipment inspections.
Once the Field Inspection App is installed on mobile plant such as draglines and coal wash plants, it records
data on oil levels, vibration, thermography, magnetic plug and filter inspections and integrates it automatically
with Dingo’s condition management software. This allows BHP Billiton’s maintenance teams to review and
analyse the information, and make adjustments to their work to deliver greater value. This collaboration has
benefitted both parties, with BHP Billiton reducing break-in maintenance costs by over A$5.5 million and the
successful commercialisation of Dingo’s App, which is now being utilised by a range of mining companies
globally.
Another success story is BHP Billiton’s collaboration with mining software developers Runge Pincock Minarco
(RPM). Together they developed Open Pit Metals Solution (OPMS) and the company’s Western Australia Iron
Ore business was the first to purchase the software. Since then, the company and RPM have worked closely to
further refine the product. OPMS has streamlined the two year mine planning process and made it less
resource intensive. The software has since been commercialised and is quite prevalent in open pit coal and oil
sands mining operations in Australia and abroad.
BHP Billiton’s simplified operating model where functions can aggregate activities across multiple operations is
also enabling the rapid replication of innovation across its operations. This will facilitate continued integration
of technology throughout the supply chain to bring about step changes in safety, productivity and
environmental impact. Partnerships with innovative companies, universities and strategic vendors will be
critical in this process.
BHP Billiton’s new organisational structure is also facilitating the replication of best practice, including
approaches to social investment such as its science, technology, engineering and maths (STEM) education
partnerships aimed at building skills to create diverse and innovative employment pathways and boost the
international competitiveness of the Australian economy. Our Local Buy Program which has been successfully
supporting sustainable businesses in regional Queensland since 2012, has already been expanded to the
Hunter Valley reviewed for expansion to BHP Billiton’s other regional communities.

Mining and METS: engines of economic growth and prosperity for Australians
23
Through this multi-faceted approach to fostering innovation within its business, through collaboration with
suppliers and the research sector, and by investing in developing capacity and capability in its host
communities, BHP Billiton hopes to continue its strong contribution to the economy, community and industry
for another 130 years and beyond.
2.2.4 Rio Tinto
The Rio Tinto Centre for Mine Automation (RTCMA) is the product of a unique partnership between Rio Tinto
and the University of Sydney. Established in 2007 within the University's Australian Centre for Field Robotics,
with a renewed agreement in 2014, the centre was created to develop and implement the company's vision
for the Mine of the Future.TM
Automation technology is playing an increasingly important role in mining. The RTCMA draws on the expertise
of university researchers who have worked on cutting edge research and development (R&D) automation
technologies across diverse industries such as defence, aerospace and agriculture.
The RTCMA oversees a range of programmes that incorporate sensing, machine learning, data fusion and
systems engineering, with technologies developed including automated drilling and algorithms for interpreting
drilling data. The work of the centre has resulted in a number of major research advancements in both basic
and applied areas.
As well as supporting the development and implementation of technology into mine operations, work at the
centre has yielded more than 150 papers for high-quality conferences and journals, as well as a substantial
patent portfolio for Rio Tinto and the University of Sydney.
Focus and achievements
From initial development of a prototype, an Automated Drill System (ADS) comprised of seven automated
drills has now been fully deployed at Rio Tinto's West Angelas mine. This technology increases the safety of
the operator while also improving drilling precision and, by extension, drilling productivity. With more than 3
million metres drilled by mid-2016, deployment will be extended to other Rio Tinto Iron Ore sites during 2017.
Even more ambitious has been the implementation of Rio Tinto's Mine Automation System (MAS) that
combines all data from Rio Tinto mines into a single set of models which can then be used to task and
coordinate manned and autonomous equipment. MAS is now deployed at more than 85 per cent of the
company's surface mines - including iron ore, copper, coal and bauxite operations - and accessed by more
1000 Rio Tinto employees through the RTVis 3D visualisation software.
Alongside this work, a number of novel in-ground data processing algorithms have been developed. These
algorithms allow Rio Tinto geologists to get unique perspectives on the construction and make-up of ore
bodies. Trials of new orebody modelling techniques are ongoing, and are in the process of being deployed.
Partnership in practice
Rio Tinto's Growth and Innovation (G&I) group acts as a conduit between Rio Tinto's mine operations and the
researchers and technical staff at the university. Both Rio Tinto and University of Sydney personnel make up
the Technical Steering Group that oversees and manages the work programme of the RTCMA. Effective
communication and agreement on milestones are essential at the start of a project and throughout R&D
stages.
Successful industry-academic partnerships need to balance differing objectives. Industry will necessarily look
for a timely return on investment while university research is an often time-consuming process guided by
academic peer review.
Simply owning a new technology is not sufficient for it to make a difference to operations. A plan for careful
integration with existing systems and processes is essential. The G&I team within Rio Tinto fulfils this
function, pulling through technologies when they are ready, taking responsibility for trials and working with

Mining and METS: engines of economic growth and prosperity for Australians
24
mine site employees to pilot, integrate, adapt and deploy technologies where they can add most value to Rio
Tinto's business.
With some ideas and projects taking years to mature from the identification of a problem by Rio Tinto,
maintaining a wide portfolio of projects allows for progressive validation and commercialisation of
technologies.
2.2.5 Glencore
Glencore is a global major producer of natural resources including coal, copper, nickel and zinc. The company
is one of Australia’s largest coal producers with 17 operational mines across New South Wales and
Queensland. Glencore’s coal business employs more than 7,000 Australians and in 2016 managed the
production of nearly 93 million tonnes of thermal and coking coal, predominantly for export.
The importance of low emissions coal technologies
Glencore acknowledges the need for the world to continue reducing carbon emissions and believes that
government policies globally should support low emission coal technologies – including high efficiency, low
emissions (HELE) generation and carbon capture and storage (CCS) technologies.
HELE coal technologies allow power generators to operate at higher temperatures and pressures, reducing by
up to 40 per cent.6 The emissions per unit of electricity generated HELE coal-fired power stations integrated
with CCS can reduce CO2 emissions by approximately 90 per cent.7
CCS is the capture, transport and storage of CO2 from coal or gas fired power stations as well as emissions
from the production of cement, iron, steel, fertilizers and chemicals. CO2 is captured from a large emission
sources, it is then compressed into liquid form and transported to a suitable storage site, where it is stored
permanently deep underground. This technology is proven and is operating at numerous sites around the
world.
The Intergovernmental Panel on Climate Change has projected that an already very expensive global solution
to climate change will be almost two and a half times more costly without CCS.8
CTSCo Integrated Surat Basin CCS Project
Over the past eight years, Glencore has participated in a number of low emission technology projects in
Australia and overseas. Glencore’s Integrated Surat Basin CCS Project is a demonstration project that aims
to test the Surat Basin in Queensland for the suitability of deep carbon storage. The geology of the Surat Basin
has up to 2.9 billion tonnes of CO2 storage potential and there are a number of coal-fired power stations
nearby.
The Integrated Surat Basin CCS Project is located within a single greenhouse gas tenement on Glencore-
owned land 15 km from Wandoan, granted by the Queensland Government in 2012. The project is being
delivered by the Carbon Transport and Storage Company (CTSCo) – a wholly-owned, subsidiary of Glencore.
The project began in 2009 with a pre-feasibility study that ran to 2012. The project is currently in feasibility
stage undertaking geological studies and environmental baseline monitoring with a view of gaining permits to
inject CO2. A post-combustion-capture (PCC) plant, attached to a coal power station, is expected to be built by
2021 and CO2 injection anticipated for 2021 to 2024. It has received strong industry support from the
6 ACALET assessment based on publicly available information on world power plant efficiency levels. According to a
discussion paper released by the former Gillard Government, new coal technologies can increase the efficiency of Australian plants to over 45 per cent and lower their CO2 emissions by up to 50 per cent. See the Department of Resources, Energy
and Tourism, A Cleaner Future For Power Stations, Interdepartmental Task Group Discussion Paper, 1 November 2010, p. 5. 7 International Energy Agency, Technology Roadmap High-Efficiency, Low-Emissions Coal-Fired Power Generation, Paris,
originally published in 2012, updated March 2013, p. 19. 8 IPCC (2014). ‘Summary for Policymakers’, in: Climate Change 2014, Mitigation of Climate Change. Contribution of Working
Group III to the Fifth Assessment Report of the Intergovernmental Panel on Climate Change, edited by O. Edenhofer et al., Cambridge University Press, Cambridge, United Kingdom and New York, NY, USA. p. 58.

Mining and METS: engines of economic growth and prosperity for Australians
25
Australian Coal Association Low Emissions Technologies Ltd (ACALET) and also from the Federal and
Queensland Governments.
The project uses existing and proven technology, which reduces both risks and costs. It aims to demonstrate
that CO2 can be safely stored in an ‘industrially scalable’ manner more than 1km underground, at a cost of
millions – rather than billions – of dollars. It aims to benefit all emitters of CO2 – including coal- and gas-fired
power stations as well as industrial producers of cement, iron, steel, fertilizers and chemicals.
Environmental baseline program
CTSCo is undertaking a comprehensive and multi-year environmental baseline program at the Glenhaven
Project site to understand the presence and concentrations of naturally occurring gases and chemicals within
the project area.
Scientists have installed monitoring sites across the proposed project area, which involves drilling a number of
bores at different depths to collect information using special monitoring equipment. This equipment sends
readings in real time to a central database via mobile phone technology.
The collection of this comprehensive environmental and geological data will enable CTSCo to accurately
monitor the impacts of the sequestration process.
Seismic survey program
A seismic survey is similar to an ultrasound where sound waves are bounced off underground rock formations
and the waves that reflect back to the surface captured by recording sensors for later analysis. Analysing the
time the waves take to return provides valuable information about rock types, structures and possible gases
or fluids in rock formations.
Onshore seismic operations usually use specialised trucks that carry a heavy plate that is pressed against the
ground and then vibrated to generate a seismic signal. Seismic processing requires powerful computers,
sophisticated software and specialised skills. Once the seismic data has been processed, it must be interpreted
by highly trained scientists.
Seismic survey recording vehicle
Community and stakeholder engagement
CTSCo is committed to working closely with local communities and fully investigating the economic,
environmental, social and cultural implications of the proposed project.
The first stage of the local engagement program involved a community baseline survey. This helped CTSCo
better understand the community and its priorities and potential concerns. The survey’s 60% response rate
highlighted the community’s desire for information about the project and ongoing dialogue with the company.

Mining and METS: engines of economic growth and prosperity for Australians
26
A number of community leaders (identified through the survey) have helped inform and design an appropriate
engagement approach.
Communicating the science and process behind CCS transport and storage is an important part of
understanding the project in detail. A science-based engagement program is currently being co-designed with
Wandoan State School to help build understanding at a grass-roots level. In addition to this engagement
activity will continue at a local community level with one-on-one meetings, group meetings, community
presentations and general public library information sessions.
2.2.6 Hedweld Engineering
Hedweld markets and distributes a range of technologically advanced, innovative products specifically
designed to improve safety and efficiency within the mining and earthmoving industries.
The design is done in close collaboration with original equipment manufacturers (OEMs) such as CAT and
Komatsu, and manufacturing is carried out at the company’s Mount Thorley facility in New South Wales.
Hedweld also provides after sales support services including commissioning, training and installation and on-
site and off-site servicing and spare parts.
Australian grown business with a global reach
Hedweld has grown into an international business, exporting its products to 32 countries. Hedweld employs
approximately 85 people across its global workforce, with the bulk of the company’s employees located in
Mount Thorley.
Driving down costs and increasing safety with innovation
Hedweld Engineering has developed two main categories of products: Trilift and Safe-Away. The former is a
range of workshop equipment for the removal, installation and handling of components on mining and heavy
earthmoving vehicles. The latter provides a range of ladder and stair access options specifically designed for
the mining and earthmoving industries.
Those two ranges are designed in close collaboration with equipment OEMs to custom design new and
innovative products to make vehicle access and maintenance safer and more time efficient. Several prototypes
may be built before a final one is agreed upon.
Trilift range and dump truck transmission hoist
The Trilift range enables the safe and efficient handling of wheel motors, hoist cylinders, transmissions and
other components which can weigh several tonnes.
The Trilift Cat 797 Transmission Hoist was designed for the safe and efficient removal and installation of the
transmission block on the largest dump trucks used in Australia. The hoist overcomes one of the main hurdles

Mining and METS: engines of economic growth and prosperity for Australians
27
faced by maintenance staff globally which is the difficulty of accessing the transmission as a consequence of
the truck’s staged manufacturing process.
Without the hoist, the dump body which weighs upward of 60 Tonnes must be removed requiring two cranes,
a large number of people (operators and spotters), and exposing workers to crushing hazards and falls. This
process also requires up to three days from the removal of the body to its replacement after changing the
transmission. However this product reduces the time to four hours. Other methods using a single crane are
also employed although they also expose the workers to crushing hazards and falls.
Capable of supporting up to 8 tonnes using the truck’s chassis as the base and hydraulics for its operation, the
hoist provides the following benefits:
Safer working environment for all maintenance staff;
Reduced number of personnel required to perform maintenance tasks;
Reduces truck downtime from 40 hours to 8 hours and labour time from 60 hours to 16 hours;
Reduced maintenance costs. Hedweld Engineering estimates the Trilift method lowers costs by close to
$170,000 each use.
2.2.7 MICROMINE
MICROMINE is privately-owned mining software company, providing innovative solutions that span the
breadth of the mining cycle from geological data management, to resource estimation, mine design, planning
and production control.
Graeme Tuder founded the company in 1986 after identifying a market opportunity to apply offshore oilfield
technology ideas to mineral exploration techniques. He was a surveyor and had spent his early career in
seabed mapping, geophysical and hydrographic studies, and bathymetric surveys for the offshore oil industry
in the Middle East, North Sea, West Africa, New Zealand and south East Asia.
Primarily, Graeme wanted to build a global company involved in geoscience. His experience overseas, his
knowledge of international markets and his exposure to widely divergent cultures meant he had no difficulty
operating in foreign markets. MICROMINE first made its way into Indonesia, then China, Mongolia, Russia,
Central Asia and Ukraine. Graeme believes it was because other companies had neither the corporate culture
of MICROMINE, nor its experience, that the business established itself as a leader in some of these markets.
The business has always been an avid employer of talent not based on parochial attitudes.
MICROMINE’s products include Geobank, a data management, validation and reporting tool, Micromine, a
sophisticated resource modelling, 3D mine design and planning solution, and Pitram, a fleet management and
mine control solution that records, manages and processes mine production data in real time. The company
also provides services that enable the more complete integration of those products into clients’ systems.
MICROMINE’s growth can be attributed to Graeme’s ability to identify and develop new markets and the
company’s focus on people - both staff and clients.
The marketplace is very competitive for each of the company’s products and MICROMINE draws on the
experience and creativity of its staff and operational flexibility gained through its 30 years’ exposure to
international markets to stay ahead of its competition.

Mining and METS: engines of economic growth and prosperity for Australians
28
In Micromine 2016, an as-built mine defined by a laser point cloud, surrounded by drillholes and
proposed future mine workings
2.2.8 Maptek
Maptek is an innovative software and technology company which designs and develops applications targeting
key industry outcomes of productivity, safety and profitability for miners.
Maptek employs 300 staff worldwide and has offices in the Americas (U.S., Canada, Brazil, Mexico and Chile),
Australia, South Africa and the UK. The company’s first office was opened in Sydney in 1981 – Maptek
celebrated its 35th birthday last year. Maptek product technology focuses on collecting, modelling and
analysing technical data to solve mining industry challenges.
The range of products includes mine design and modelling software (Vulcan and I-Site Studio) as well as I-Site
3D laser survey) and digital imaging hardware. Vulcan 3D modelling helped with the 2010 San José mine
rescue in Chile to identify the location of the 33 men trapped underground. The software was used with the I-
Site laser scanning hardware to map and guide drilling of an access shaft to free the miners.

Mining and METS: engines of economic growth and prosperity for Australians
29
Since this extraordinary event in 2010 Maptek has made its 3D scanning hardware mobile. I-Site Drive
enables the continuous acquisition of data using a laser scanner. The vehicle mounted device links the laser
scanner which generates a stockpile profile with an inertial navigation system (INS), enabling the continuous
acquisition of data and coordinates. The mobile survey system reduces the time spent surveying a typical
stockpile from 4 hours down to 45 minutes.
I-Site Studio generates detailed 3D models for geological mapping of mining faces. For underground
operations, high resolution models of drifts (passageways that allow access to the ore) can be used to
implement ground support measures. Laser scans taken before and after shotcreting (spraying of concrete on
the walls of the drift) measures shotcrete thickness. This geotechnical control approach brings the following
safety benefits:
Reduced time in the drift;
No need to core (drilling the shotcrete to measure thickness can reduce wall integrity); and
More accurate data for fast validation of design.
Maptek monitoring hardware and software systems have other uses which include monitoring the design of
walls during excavation, thereby maximising ore recovery with steeper walls and effectively managing the
increased safety risk that derives from that gain.
2.2.9 Orica
Using analytics to drive productivity across the mining value chain
Blasting is a natural strategic enabler
From its early beginnings in 1874 supplying explosives for the Victorian gold fields, Orica has played a leading
role in the development of new blasting technologies that have made significant contributions to productivity,
safety and environmental outcomes for the mining industry.
With blasting’s position so early in the value chain, and its potential to significantly impact the total operating
cost and productivity of a mine, it is a natural strategic enabler within the total mining value chain. Advanced
blasting techniques and products can generate returns from more productive drilling, digging, hauling and
processing. In every sector, including underground, surface, quarrying and construction, blasting holds a key
to unlock productivity benefits.
Using explosive energy in the pit can dramatically increase the efficiency and throughput of downstream
processing. Orica pioneered ultra-high intensity blasting which reduces ore into smaller particles before the
load, haul, crushing and milling stages. This reduces overall energy consumption with a consequent reduction
in emissions and energy costs. Orica customers adopting this technology and its variants are achieving mill
throughput rates that were simply not previously possible with conventional blasting. This is significant when
you consider that as the highest grade ore bodies across the globe are exhausted, average ore grades fall and
processing costs rise.
Integrating data across the value chain will drive systemic improvement
One of the real opportunities in speeding up the rate of innovation and the adoption of new technologies lies in
the implementation of data management systems. The collection and aggregation of data throughout the
value chain enables a fuller understanding of the impact of products and techniques on other activities in the
whole mining process. This process can yield performance improvement in blast design and modelling, blast
execution, and measurement and analysis. By combining customer data across the value chain, Orica can help
drive systemic change for optimal and sustainable mine productivity.
Orica has been at the forefront of innovative blast design and modelling software and advanced blast
prediction models for well over 20 years. With the development of the BlastIQ system, its goal now is to
connect a suite of technologies throughout the blasting process with data-enabled and autonomous equipment
to deliver real time continuous improvement, automated through the use of “smart” algorithms and models.
They include:

Mining and METS: engines of economic growth and prosperity for Australians
30
Blast design and modelling;
At site activities to measure and adjust for aspects like drilling accuracy, hole depth, hole temperature, the
presence of water and as loaded product information;
Measurement, interpretation and reporting systems, such as blast-related environmental effects analysis
and fragmentation monitoring on shovels and conveyors;
Sophisticated systems to analyse the collected data and report useful information on outcomes and trends.
A selection of Orica customer pilot sites are integrating blast design, visibility of conformance to design, and
measurement of results on a Cloud-based platform. The visual integration is providing powerful insights into
better understanding geological domains for blasting and allowing design adjustments and suitable explosives
selection to better manage achievement of targeted results.
The use of BlastIQ at customer sites has driven:
Better geological domaining to obtain more consistent fragmentation in blasting
Improved drilling quality, leading to less wastage and reduced costs
Improved compliance with environmental limits
Alteration of blast patterns and explosives selection to achieve improved outcomes
Increased interaction between the mine and the plant, improving understanding of the effect of
fragmentation in various domains on the plant and jointly administering improvements
The greatest opportunity comes through strong relationships between Orica and customers, in which data
exchange and analysis is a principle. It’s through the collection and aggregation of data throughout the value
chain that the impact of product and technique selection on other functional mining activities like the drilling,
excavation and processing can be truly understood. By combining data from across the whole mining value
chain, Orica can help drive systemic change for optimal and sustainable mine productivity.
Orica is excited by the possibilities BlastIQ will unlock to leverage blasting for improved productivity and is
encouraged by customers’ feedback to date.
2.2.10 Donhad
Donhad Pty Ltd is an Australian-based manufacturer of technically advanced grinding media and forged
products servicing the global mining industry. Founded in Bassendean Western Australia in 1965, it forms part
of the US-listed Valmont Incorporated - Mining & Energy Division. Donhad manufactures semi-autonomous
grinding (SAG) and roll forged ball grinding media, engineering forgings and a range of specialised forged
fasteners for use in the mining, mineral processing and engineering industries. Donhad primarily serves the
Australia, New Zealand and Asia-Pacific markets, and over the past 50 years has exported products to
customers in Africa, Europe, North and South America and the Middle East. It operates three grinding media
manufacturing operations strategically located in Perth, Newcastle and Townsville.
Donhad’s principal products are grinding media balls and rods used in the comminution processing mills
(SAG/Ball/Rod) and forged products (bolts, pins, fasteners and accessories). The business also provides
technical services and support to its mining customers to optimise process parameters and product
performance, in order to reduce operating costs and improve productivity. It maintains an in-house research,
development and testing capability which is NATA and SGS Quality accredited, supported by industry-
experienced metallurgists and engineers. Employing a LEAN operating system approach, Donhad has been on
the continuous improvement journey for a number of years, with increasing levels of automation and robotics
in its manufacturing plants and investment in process improvement, quality and product development.
Improving grinding media performance and reducing costs
Grinding media comes in a range of forms (balls, rods, cylpebs), sizes (27mm to 140mm balls) and
composition (alloy, carbon, ceramic). The principal use for grinding media is to crush or grind mineral ores
into various sizes, liberate minerals from gangue and increase surface area for chemical extraction using
further downstream processing. This is termed “comminution” within the mining and metallurgical industry.
The mineral ores which are typically processed include iron ore, gold, platinum, nickel, copper, zinc, alumina,

Mining and METS: engines of economic growth and prosperity for Australians
31
silver, lead, uranium, tin and lithium. The comminution process accounts for a significant cost in the mineral
processing cycle through the consumption of grinding media and power, and is an important determinant of
processing volume – and therefore productivity – on mine sites.
Donhad has developed a range of branded “Hi Carb” grinding media for which it has a number of patents, and
represents the latest technical development from its continuous improvement initiatives. The HiCarb™ product
demonstrates the latest improvement in terms of lower wear rate in service and potential to reduce milling
costs through improved throughput on a “cost/tonne” basis.
The HiCarb™ ball has two main advantages. For one, it is designed to be manufactured to consistent high
quality levels with improved throughput (tonnes per hour) in manufacture, making the business more
competitive. This benefits the customers, who can access the next generation of grinding media more cost
effectively.
Second, the performance of the media is improved in the customer’s grinding process, particularly in ball mills
(in contrast with semi-autonomous grinding [SAG] mills). The specific properties of HiCarb™ grinding media is
derived from a combination of its composition with a higher carbon level (>1%C), alloying additions, and the
heat treatment process during manufacture. This imparts improved wear resistance compared to traditional
carbon grades of grinding media under like conditions. The performance of grinding media is typically
measured in its consumption on a kilograms per tonne processed (kg/T) basis. The lower the value, the better
the performance of the media, assuming other variables (ore characteristics, operating parameters, mill
speed/condition, power) are stable.
Donhad HiCarb™ grinding media has been found to improve wear rates in excess of 3.5% in laboratory and in-
market trials. Customers that have switched to the HiCarb™ product have communicated improvements in
wear rates ranging from 3.5% to 10%+, compared to grinding media previously in use. Improved grinding
media wear rates combined with increased volume of ore processed per hour can deliver tangible cost
reductions to customers measured on a $/T processed or all in sustaining cost (AISC $/oz) metrics.
Donhad is building on the HiCarb™ success with further product and process development initiatives with a
range of collaboration partners including customers and industry stakeholders. Of particular focus is
technology to provide big data modelling of key mill process metrics. This capability would enable operators to
optimise the comminution process and achieve a step change in power usage, processing rates and grinding
efficiency.

Mining and METS: engines of economic growth and prosperity for Australians
32
3 Policy environment for a productive mining and METS
sector
3.1 Previous structural reforms
A range of structural reforms implemented over the previous three decades has contributed to the scale and
length of the most recent mining boom. In particular, openness to foreign investment has been a
significant enabler of Australia’s mining-led growth.
A key principle of economic policy is that an economy should focus production in areas where it has a
comparative advantage – that is, in areas where it can produce goods and services relatively more efficiently.
As a resource-rich country, Australia is likely to have a comparative advantage in mining. However, as a
relatively capital-intensive industry, significant investment by mining companies is required to ensure this
potential comparative advantage is realised. Foreign investment can be an important source of funding for the
industry’s capital needs.
During previous mining booms in Australia, foreign investment was not encouraged – for example, in 1976,
there was a requirement that new mining projects be funded by at least 50% Australian equity. This policy
was repealed in 1986 (Hanratty 1996). In the same year that the equity requirement was introduced, the
Foreign Investment Review Board (FIRB) was established – which is responsible for determining whether large
foreign investments are contrary to the national interest.
The most recent mining boom in Australia continues to have a significant impact on the Australian economy,
resulting in substantially higher living standards. The sustained nature of the boom since the early 2000s was
facilitated by earlier structural reforms that made Australia a more open and flexible economy. These include the
floating of the exchange rate for the $A, as well as reforms in finance, product, labour and energy markets.
Previous achievements have established favourable conditions to support a prolonged investment and production
cycle.
In looking to the future of the mining and METS sector in Australia, policymakers must ensure that the economic
environment continues to remain open to cross-border flows of trade, investment, technology, knowledge and
skills.
This chapter provides some background on how previous microeconomic reforms helped to create a supportive
environment for growth in mining and METS, and discusses areas where further reform can be prioritised. These
areas include:
- Increased flexibility in workplace arrangements, including the industrial relations framework and skilled
migration policy;
- Taxation policy settings that are competitive and fair, and also stable so as to avoid negative impacts on
sovereign risk;
- Ensuring access to affordable and reliable energy;
- Maintaining an open policy to foreign investment and trade;
- More simplified or streamlined regulation where efficiency gains can be made without compromising the goals
of the regulation; and
- Continued support for bodies that enhance collaboration between the mining and METS sector and research
organisations.

Mining and METS: engines of economic growth and prosperity for Australians
33
Nowadays, FIRB approval is required for all mining projects funded by foreign investors (with exceptions for
investment from particular countries under various threshold levels9). While this approval can be blocked if the
FIRB assesses that the project is contrary to the national interest, there are no minimum restrictions placed on
the proportion of a project required to be domestically funded once approval has been granted.
This increasing openness to foreign funds as a source of financing for large and capital-intensive mining
projects has been a key factor in facilitating the significant investment that took place as part of Australia’s
most recent mining boom. An example of this is the Roy Hill iron ore mining project in WA’s Pilbara region,
which is 30% owned by an overseas consortium comprised of Marubeni Corporation (15% equity interest),
POSCO (12.5%) and China Steel Corporation (2.5%).
More broadly, Australia’s openness to foreign investment has provided the opportunity to start mining projects
that may not otherwise have attracted sufficient capital investment. Borrowing funds from foreign investors
has enabled an increase in the size of the nation’s capital stock and, following the productive application of
this capital, an increase in national income – beyond what the growth in capital and income would otherwise
have been. While some of these income benefits accrue as returns to overseas investors, research by the
Committee for Economic Development of Australia (CEDA) has found that “the extra production made possible
in Australia from using foreign funds has indeed on average significantly exceeded interest and other
investment income paid abroad” (CEDA 2009).
In addition, openness to trade is also an important element of Australia’s microeconomic policy environment
that has encouraged and sustained the most recent mining boom. During earlier mining booms Australia
maintained a more protectionist trade environment, with high tariffs on imports of manufactured goods. This
arguably leads to a misallocation of resources by Australian mining companies that utilise these goods as
inputs to their production process. That is, import tariffs raise the production costs of exporters who, due to
global competition, cannot raise their prices. Consequently, protectionist trade environments that place tariffs
on imports can, inadvertently, result in Australian mining output falling.
More recently, the Government has continued to make progress in lowering trade barriers with Australia’s key
regional trading partners. Australia’s openness to trade and investment facilitated the development of a highly
productive mining sector. The Productivity Commission has stated that the improvement in Australia’s position
on international rankings of per capita GDP over the past 2-3 decades “has been linked to sustained economic
reforms during the 1980s and 1990s, including the opening up of trade and capital markets to competition”
(PC 2016a). These reforms have enabled significant economic growth in an area of Australia’s comparative
advantage, generating additional mining activity and contributing to the creation of jobs around the country.
Recent years have seen this trend continue as new free trade agreements were signed with China, Japan and
Korea in 2014 and 2015. These agreements included reductions in tariffs placed on resources, particularly the
China-Australia Free Trade Agreement, which involved the immediate elimination of tariffs on copper,
aluminium oxide and nickel, and the phased elimination of tariffs on coal and titanium.
Continuing to develop an open environment for foreign investment and trade, such as through the ongoing
negotiations with India in relation to establishing a comprehensive economic cooperation agreement, will be
an important factor in supporting ongoing growth in Australia’s mining and METS sector. Multilateral trade
agreements such as current negotiations for the Regional Comprehensive Economic Partnership (RCEP) – an
ASEAN-centred proposal for a regional free trade area – can also deliver significant global opportunities for
mining and METS businesses in Australia.
Further to this, reforms across a number of other microeconomic policy areas also contributed to the open and
flexible conditions that facilitated the mining sector’s sustained growth over the most recent boom. In some
cases these policies have been of direct benefit to mining and METS activities. In others, they have assisted in
managing the booming sector and maintaining a stable macroeconomic environment, which has meant that
9 Exceptions exist for Chile, New Zealand and United States for projects under $1,095 million and for projects under $15
million for China, Japan and Korea. Any acquisition of mining tenement by a foreign government requires approval. There is also approval required for acquisition of interest of at least 10% in securities in a mining, production or exploration entity.

Mining and METS: engines of economic growth and prosperity for Australians
34
broader policy adjustments that may have dampened the boom have not been required over the most recent
period.
Relevant policies have included:
Financial markets – Previous export booms in Australia had taken place under a fixed exchange rate
regime. As such, the structural macroeconomic adjustments to the rise in exports occurred through
increased domestic inflation, which had disruptive impacts throughout the broader economy. The most
recent mining boom has been the first since the floating of the Australian dollar in 1983, which has allowed
for smoother structural adjustments as the appreciation of the exchange rate has assisted in keeping
inflation relatively low. According to the Productivity Commission, the floating exchange rate has given the
Australian economy an “external ‘shock absorber’, [and as such] the Reserve Bank has been able to keep
inflation within its target band on average since the boom began, and we have not seen the rapid
economy-wide wage increases experienced in previous booms” (Banks 2011).
Labour markets – At the time of previous commodity booms, Australia had a centralised wage-setting
system that had the effect of transmitting demand pressures from the mining sector to aggregate wage
outcomes across the economy. This meant that nominal wage growth reached double digits during
previous booms (for example, accelerating to 30% during the early 1970s mining boom), destabilising
conditions across the broader economy.
The transition from centralised wage-setting to productivity-focused enterprise bargaining began in the
early 1990s with reforms continuing under successive governments. The decentralisation of wage-setting
arrangements enabled wages to adjust differentially across various markets and industries, resulting in a
more economically efficient alignment of wages and productivity across the economy than had been seen
previously. In essence, previous reforms ensured that wage increases in the mining industry did not cause
economy-wide disruption. The appreciation of the exchange rate has also assisted in this respect, by
keeping downward pressure on the prices of traded goods.
Energy markets – Prior to the 1990s, Australia’s energy sector was characterised by vertically integrated,
publicly owned enterprises. Energy markets as we know them today did not exist and prices did not
reflect efficient costs. Investment decisions were seldom made with efficiency in mind. Throughout the
1990s and into the 2000s a series of energy market reforms were undertaken. A milestone reform was
the formation of the National Electricity Market (NEM), which revolutionised Australia’s electricity sector by
(among other things):
– Introducing a uniform single wholesale electricity market across eastern and southern Australia which
could move energy from where it was most efficiently produced to where customers required it;
– Disaggregating the vertically integrated electricity sector into competitive sectors of generation and
retail, and monopoly sectors of transmission and distribution network service providers;
– Harmonising laws and regulations across participating jurisdictions, including rules for the wholesale
electricity market and access to the networks; and
– Transitioning towards full retail competition and the deregulation of retail pricing (AEMC 2013).
However, it should be noted that these past successes in microeconomic policy do not ensure that the initial
benefits associated with reform will continue into the future. There is a need for ongoing attention to the
policy environment in order to enable the mining and METS sector to continue to innovate, grow and
contribute to the Australian economy. Potential areas of future policy focus are discussed in the following
section.

Mining and METS: engines of economic growth and prosperity for Australians
35
3.2 Future areas of policy focus
3.2.1 Flexible workplaces
The mining and METS sector makes a significant contribution to employment in Australia, as highlighted in the
economic contribution analysis above. There was a significant growth in labour demand over the investment
phase of the most recent mining boom, and it has been noted that as the boom has transitioned into the
production and operational phase, “employment in the resource sector remains higher than pre-boom levels
as production of resource commodities has increased” (Kent 2016). Labour availability and workplace
flexibility are therefore key to ensuring that the mining and METS sector can continue to grow and innovate in
the future.
Industrial relations
An industrial relations framework that is both equitable and productive is a critical determinant of workplace
flexibility. The Productivity Commission’s 2015 report on Australia’s workplace relations system noted that it
has “several major deficiencies [that] need addressing” (PC 2015, p.2). The Productivity Commission made
recommendations that are particularly relevant to the Australian mining industry.
For example, the Productivity Commission found that enterprise bargaining arrangements for greenfields
agreements “pose risks for large capital-intensive projects with urgent timelines” (PC 2015, p.3), with the
unique circumstances characterising these agreements warranting a different regulatory approach. The review
raised concerns about the ability of unions to hold out in these negotiations, creating significant uncertainties
about project start dates, which can reduce companies’ capabilities in securing finance, project planning and
managing risk. It was noted that this ‘hold-up problem’ could potentially provide unions with excessive
bargaining power (PC 2015, p.36). Several recommendations were proposed, including allowing the employer
to request ‘last offer’ arbitration by the Fair Work Commission after three months, and allowing the nominal
expiry date of an enterprise agreement to match the life of the project.
The Productivity Commission’s review also commented on the Fair Work Act’s current provisions governing
industrial action. It stated that, while strike activity is not a major problem in Australia at present, there are
shortcomings in current arrangements that can result in strategic use of industrial action. The review made a
number of recommendations about how the Act could be amended to address these deficiencies, such as
proposing that the Fair Work Commission be able to suspend or terminate protected industrial action “where it
is causing, or threatening to cause, significant economic harm to either the employer or the employees
covered by the agreement” (PC 2015, p.889).
In the 2014 report Positioning for prosperity? Catching the next wave, Deloitte Access Economics
identified the mining and METS sector as a key driver of Australia’s economic growth over the next 20
years , highlighting the need to “extend the [mining] boom for as long as possible and make sure we
do not burden it with disadvantage through unwise regulation and taxation”. As this section discusses
in detail, open and flexible policy settings will be required to ensure that mining and METS continues
to be a growth industry in the future. These include:
- Increased flexibility in workplace arrangements, including the industrial relations framework and
skilled migration policy;
- Taxation policy settings that are competitive and fair, and also stable so as to avoid negative
impacts on sovereign risk;
- Ensuring access to affordable and reliable energy;
- Maintaining an open policy to foreign investment and trade;
- More simplified or streamlined regulation where efficiency gains can be made without
compromising the goals of the regulation; and
- Continued support for bodies that enhance collaboration between the mining and METS sector and
research organisations.

Mining and METS: engines of economic growth and prosperity for Australians
36
The Productivity Commission also recommended reforms in areas such as:
Disputes about the frequency of entry by union officials so that the cumulative impact on the employer
and the likely benefit to employees are considered
The scope of permitted content by removing issues pertaining to the relationship between an employer
and employee organisations from the list of permitted matters in enterprise agreements and specifying
that an enterprise agreement may only contain terms about permitted matters
Adverse action including aligning discovery processes with those of the Federal Court and more clearly
defining the meaning and application of workplace rights.
Beyond the scope of the Productivity Commission’s review and recommendations, there are fundamental
changes affecting the labour requirements of the mining and METS sector. As illustrated through the
innovation case studies presented above, mining and METS production is becoming increasingly
technologically advanced, which will potentially reduce companies’ labour requirements for low-skilled workers
(e.g. truck drivers on mine sites) and increase demand for highly skilled workers who can develop and operate
these technologies. Furthermore, workplaces of the future are likely to look different from workplaces of
today, as changes in the nature of work, workplace diversity and locations where work is performed continue
to take place.
In this context, the relevance of historical approaches to labour and industrial relations may need to be
reconsidered, to ensure Australia’s industrial relations system is able to support continued productivity growth
by adapting to an increasingly dynamic and knowledge-based workplace.
For example, over recent times there has been growth in non-traditional working arrangements in the mining
and METS sector and across the broader economy, such as casual employment, fixed-term contracts and self-
employed contractors. However, the current industrial relations framework essentially provides a binary
classification of an ‘employee’ as compared to a ‘contractor’, with arrangements under the latter classification
characterised by considerably fewer worker protections and entitlements. The increasing incidence of
unconventional forms of employment highlights the need for the workplace relations system to evolve to suit a
wider range of agreement options.
Skilled migration
The availability of skilled workers from overseas through Australia’s migration program has been important for
meeting mining companies’ demand for skilled labour over the course of the most recent mining boom, and
this will continue as the boom moves through the production phase. The list of eligible occupations for skilled
immigration visas and the associated quotas should therefore continue to be updated in line with the
industry’s requirements, to ensure that companies in the sector have adequate flexibility across their
workforce.
For example, the Mining Engineer occupation was removed from the Department of Immigration and Border
Protection’s Skilled Occupations List (SOL) in July 2016. Occupations on the SOL can be used to apply for
permanent and temporary skilled migration programs such as the 186 (Employer Nominated Scheme), 187
(Regional Sponsored Migrations Scheme), and 485 (Temporary Graduate) visas. While this change may hinder
the ability of mining and METS companies to access skilled migrants under this specific occupation, the
inclusion of related occupations in the SOL such as Engineering Manager, Geotechnical Engineer, or
Engineering Technologist may still provide companies with an adequate level of flexibility in sourcing skilled
migrants to address domestic workforce gaps. It will be important that this flexibility be retained as the SOL
continues to change in future years.
The Productivity Commission has suggested that temporary skilled visas such as the 457 visa may be
preferable for adjusting to increased demand for skilled labour, rather than a general increase in skilled
immigration (Banks 2011). 457 visas allow employers experiencing domestic skills shortages to hire skilled
migrant workers for up to four years. The 457 programme uses a broader list than the Skilled Occupation List
and is based on the Consolidated Sponsored Occupation List (CSOL). These visas allow for more flexibility in
responding to shorter-term fluctuations in demand for labour in the mining and METS sector and also provide
a pathway to permanent migration for employees.

Mining and METS: engines of economic growth and prosperity for Australians
37
3.2.2 Competitive and fair taxation system
A competitive and fair taxation system is critical to support investment in globally competitive industries such
as mining. Mining projects involve high-risk exploration outlays, large upfront capital commitments, long-life
assets, sophisticated technologies and long lead times to profitability. Competition from other resource-rich
economies to capture future opportunities in resource development is intense. In this environment, it is
important the taxation system be not only competitive but also predictable, as stability supports long-term
capital investments by minimising Australia’s sovereign risk profile.
Federal and State taxation
Australia’s corporate tax rate of 30% is at the upper end of the band of comparable countries, and is above
the OECD average of 22.6% (OECD 2016, see Chart 3.1). More specifically, with regard to global competition
for attracting investment in mining-related projects, Australia’s 30% corporate tax rate is higher than other
OECD countries with significant mining activity, such as Canada (26.7%) and Chile (24%).
Chart 3.1: Corporate taxation rates for selected OECD countries
Source: OECD tax database (2016)
This higher taxation rate in turn lowers returns on foreign investment in mining, which can influence the
decision making of foreign investors determining where to invest capital.
Considering mining in particular, the interaction of state and territory royalties with federal company tax
means Australia is a relatively high-tax jurisdiction for mining. The Minerals Industry Tax Survey 2016
undertaken by Deloitte Access Economics (2016c) found that the minerals industry faced an effective tax rate
(company tax plus royalties) of 54.3 per cent in 2014-15. This is the highest tax ratio recorded since the
survey began and the first time it has exceeded 50 per cent.
0%
5%
10%
15%
20%
25%
30%
35%
40%
45%
Australia Canada Chile United States OECD Average
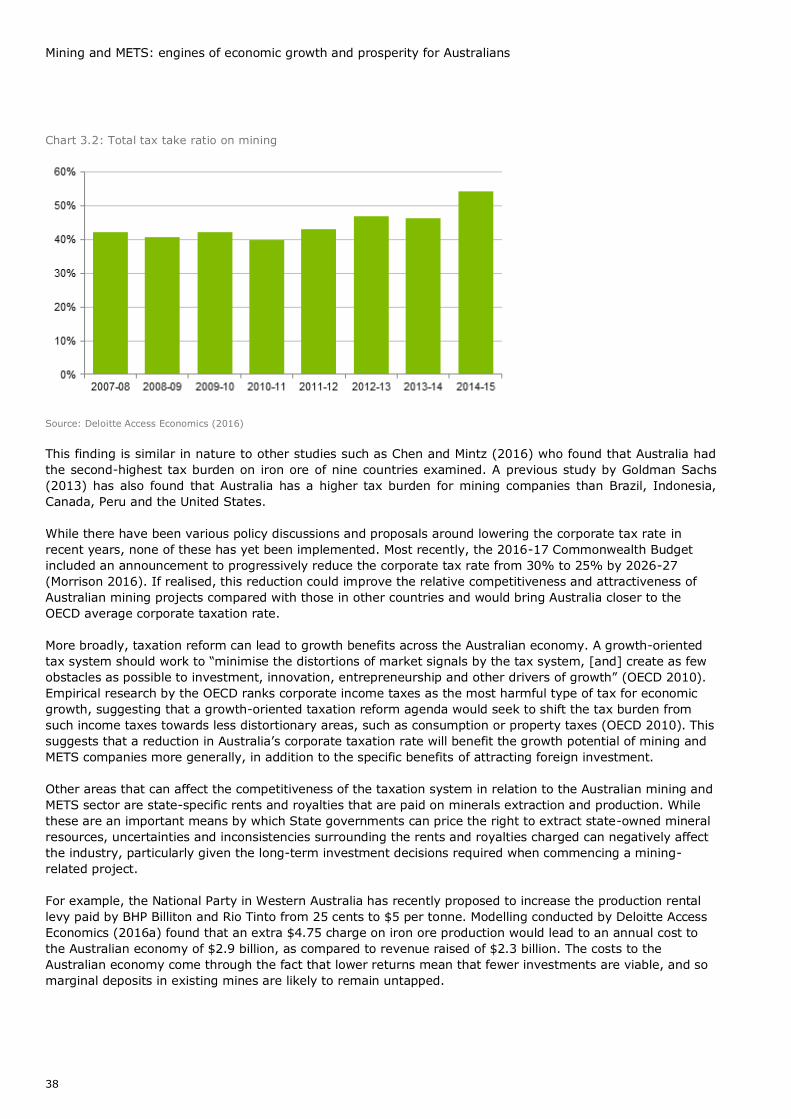
Mining and METS: engines of economic growth and prosperity for Australians
38
Chart 3.2: Total tax take ratio on mining
Source: Deloitte Access Economics (2016)
This finding is similar in nature to other studies such as Chen and Mintz (2016) who found that Australia had
the second-highest tax burden on iron ore of nine countries examined. A previous study by Goldman Sachs
(2013) has also found that Australia has a higher tax burden for mining companies than Brazil, Indonesia,
Canada, Peru and the United States.
While there have been various policy discussions and proposals around lowering the corporate tax rate in
recent years, none of these has yet been implemented. Most recently, the 2016-17 Commonwealth Budget
included an announcement to progressively reduce the corporate tax rate from 30% to 25% by 2026-27
(Morrison 2016). If realised, this reduction could improve the relative competitiveness and attractiveness of
Australian mining projects compared with those in other countries and would bring Australia closer to the
OECD average corporate taxation rate.
More broadly, taxation reform can lead to growth benefits across the Australian economy. A growth-oriented
tax system should work to “minimise the distortions of market signals by the tax system, [and] create as few
obstacles as possible to investment, innovation, entrepreneurship and other drivers of growth” (OECD 2010).
Empirical research by the OECD ranks corporate income taxes as the most harmful type of tax for economic
growth, suggesting that a growth-oriented taxation reform agenda would seek to shift the tax burden from
such income taxes towards less distortionary areas, such as consumption or property taxes (OECD 2010). This
suggests that a reduction in Australia’s corporate taxation rate will benefit the growth potential of mining and
METS companies more generally, in addition to the specific benefits of attracting foreign investment.
Other areas that can affect the competitiveness of the taxation system in relation to the Australian mining and
METS sector are state-specific rents and royalties that are paid on minerals extraction and production. While
these are an important means by which State governments can price the right to extract state-owned mineral
resources, uncertainties and inconsistencies surrounding the rents and royalties charged can negatively affect
the industry, particularly given the long-term investment decisions required when commencing a mining-
related project.
For example, the National Party in Western Australia has recently proposed to increase the production rental
levy paid by BHP Billiton and Rio Tinto from 25 cents to $5 per tonne. Modelling conducted by Deloitte Access
Economics (2016a) found that an extra $4.75 charge on iron ore production would lead to an annual cost to
the Australian economy of $2.9 billion, as compared to revenue raised of $2.3 billion. The costs to the
Australian economy come through the fact that lower returns mean that fewer investments are viable, and so
marginal deposits in existing mines are likely to remain untapped.

Mining and METS: engines of economic growth and prosperity for Australians
39
Fuel Tax Credits Scheme
In considering the fairness of the taxation system, a key principle of public finance theory is that taxes on
intermediate goods – that is, goods used as business inputs as part of the production process – can cause
significant economic distortions. Reducing taxes on intermediate goods decreases this distortion and can
therefore increase overall economic growth (Treasury 1998).
This principle is particularly relevant to the mining and METS sector in the context of fuel-related taxes, with
diesel fuel representing a critical input for the heavy mining equipment and off-road vehicles used by the
mining industry. The Fuel Tax Credits Scheme recognises this policy principle by providing all businesses with
a credit for the fuel tax (excise or customs duty) that is included in the price of fuel used as a business input.
It also recognises that fuel excise is designed to fund expenditure on public roads, and many of the businesses
receiving Fuel Tax Credits operate in industries that do not use public roads – such as mining, agriculture and
forestry.
While some have argued that Fuel Tax Credits represent an industry subsidy to these fuel-intensive sectors,
Treasury has previously noted that “fuel tax credits are not a subsidy for fuel use, but a mechanism to reduce
or remove the incidence of excise or duty levied on the fuel used by businesses off-road or in heavy on-road
vehicles” (Webb 2012). In addition, the Productivity Commission’s annual trade and assistance review does
not include rebates paid under the Scheme as a form of government assistance to industry, stating that “it is
not considered assistance as the excise tax on fuel is purported to be a mechanism to pay for roads, which are
not used by those receiving the fuel rebate” (PC 2016b).
R&D Tax Incentive
Innovation is critical in ensuring that Australia’s mining and METS sector remains globally competitive. As
illustrated in the case studies above, the increasing integration of new technology and ideas into mining and
METS operations results in significant economic benefits, such as reduced operating costs, higher yields and
better safety outcomes.
It has long been understood that businesses' research and development (R&D) activities – which then drive
innovation throughout the economy – have positive spillovers. Official data show that the mining sector
spends nearly $3 billion on R&D annually, or nearly $1 in $6 of all business R&D spending in Australia (ABS
2015).
While individual businesses do benefit from their own R&D activities, the additional benefits realised by
consumers, suppliers and competitors justify government support for these activities. In Australia, the largest
form of Commonwealth Government support for private sector innovation is the R&D tax incentive, which
provides businesses with a tax offset for eligible R&D activities.
Estimates of the size of spillover benefits suggest that the Government should continue to provide incentives
for R&D activities that may not otherwise have been viable. For example, the CIE has found that each dollar of
tax foregone through the R&D tax incentive is associated with between 0.9 and 1.5 additional dollars of R&D
for small and medium-sized enterprises, and between 0.3 and 1.0 additional dollars of R&D for large
companies (CIE 2016; cited in Ferris, Finkel and Fraser 2016). In this context, the broad-based nature of the
R&D tax incentive ensures that it provides support for additional innovative activity across all industries and
for a range of R&D investments. This has allowed mining and METS companies to engage in the productivity-
enhancing innovation that, as our case studies highlight, generates significant wider economic and social
benefits across Australia.
3.2.3 Affordable and reliable energy
Affordable and reliable energy is vital to the productivity and competitiveness of the Australian economy and
the Australian mining industry. Ready access to reliable and affordable energy is crucial to heavy industrial
users such as mining operations, refineries and smelters. Mining accounts for 9 per cent of national energy
consumption and 11 per cent of electricity use. Affordable and reliable energy also underpins the high
standard of living of households and supporting the competitiveness of Australian industry more broadly.

Mining and METS: engines of economic growth and prosperity for Australians
40
The two decades long task of creating the NEM and building the regulatory frameworks which encourage
competition in electricity markets can be seen as one of the major microeconomic reforms achieved in
Australia. However, there is the potential for further reform of the electricity industry to ensure affordability.
Current market conditions, particularly the recent blackouts in South Australia, are highlighting the need to
ensure that energy supply is also reliable.
Energy users have, in recent years, seen increasing electricity prices. These increases can, in some cases, be
attributed to a lack of efficiency gains in the electricity transmission and distribution (PC 2013d). Lack of
efficiency gains have been attributed to a combination of ownership structures and regulatory approaches. In
some NEM states, government ownership is prevalent in generation, transmission and distribution and there
are strong economic regulatory controls in markets where competition could be more heavily relied upon
(retail in particular). Regulatory approaches could also be refined to ensure that energy users do not bear
increases in costs from a lack of efficiency gains.
In addition to poor efficiency performance, electricity prices are directly increased by the range of Green and
energy conservation schemes that are in place around Australia. Green schemes aim to encourage the use of
low emission generation sources, while energy conservation schemes aim to encourage the pursuit of energy
efficiency measures by energy users. Together these schemes add an additional cost component to the final
cost of electricity faced by energy users, as liable entities under these schemes are typically generators or
retailers who are likely to pass associated costs onto customers. In aggregate, the subsidies paid to producers
of renewable electricity amounted to almost $3 billion in 2015-16 (BAEconomics 2017). When subsidies and
feed-in tariffs are all included, the extra cost to consumers is 6 to 9 per cent of their total power bill (Principal
Economics 2015). For large businesses, the cost of all government schemes can be as much as 20 per cent of
their total power bill (Principal Economics 2015).
The NEM is also facing challenges in delivering reliable energy. The recent blackouts in South Australia are
the prime example of the challenges that the NEM is facing in terms of delivering reliable energy to
consumers. However, the experience of South Australia is just an extreme version of factors that are being
seen across the NEM. The Independent Review carried out following the 2016 blackout in SA has identified
that increasing complexity in the NEM is causing concerns about the reliability of the system. The review
identifies that increased complexity is being caused by factors such as an increasing share of intermittent
renewable energy sources (e.g. wind power), distributed generation (home solar panels), increasing costs for
peak generators (gas) and more complex consumer behaviour.
The value that electricity customers place on a reliable electricity supply can be quantified using the value of
customer reliability (VCR), measured by the AEMO (2014). The VCR estimates consumers’ willingness to pay
for reliable electricity supply in dollars per kilowatt hour. This includes residential, commercial, agricultural
and industrial users, and customers directly connected to the transmission network. To calculate the values,
the AEMO conducted surveys asking consumers how much they would pay to avoid various outage situations.
Based on a standard weighting of electricity user types in Victoria, the VCR is estimated at $32.98 per kilowatt
hour, in 2015–16 price terms. The impacts valued in this VCR estimate include:
Loss of work from paid staff
Lost production
Extra time taken to complete tasks
Loss of revenue from fewer sales
Spoilage of perishable products
Loss of livestock
Business downtime
Loss of heating or air-conditioning
To put this value into context, Deloitte Access Economics (2016b) has previously estimated the costs of a
significant blackout in Victoria in 2007. During the blackout, about 7,100,000 kilowatt hours of electricity was
lost to 620,342 households and 66,890 businesses, as well as disruptions to major public infrastructure and
public hospitals (Nous Group, 2007). Using the VCR, the cost of this blackout was estimated to be around
$293 million (Deloitte Access Economics 2016b). This is similar in scale to the initial estimate by Business SA
of $367 million for the cost of the 2016 South Australian blackout.

Mining and METS: engines of economic growth and prosperity for Australians
41
The importance of electricity as an input used throughout the economy, combined with the sharp increase in
the costs paid by consumers and industry over the past few years and increasing unreliability means that
ongoing reform of the NEM can contribute real and significant economic gains that will benefit households,
business and the mining industry. These reforms would need to focus on increasing competition where
appropriate, generating the right incentives for cost minimisation and providing efficient levels of reliability.
3.2.4 Openness to foreign investment
As a significant enabler of the most recent mining boom and broader mining-led economic growth in Australia,
maintaining an open approach to foreign investment is important for facilitating future industry growth. The
extent to which the Australian economy was able to benefit from the recent mining boom was in part
dependent on the country’s openness to foreign capital, and our ability to capitalise on mining-led growth in
the future would likely be compromised if Australia were to move towards a less welcoming investment
regime. In addition to providing an additional source of capital funds, foreign direct investment also benefits
the Australian mining and METS sector as an important mechanism through which new technologies,
equipment and knowledge can be transferred between jurisdictions (Treasury 2016).
Uncertainties in the foreign investment approvals process can be a factor that deters investors from overseas
from selecting Australia as an investment destination. For example, recent decisions taken by the FIRB and
the Commonwealth Government resulted in the blocking of several significant foreign investment proposals in
the energy industry. Separate bids for a majority stake in NSW’s Ausgrid from the state-owned China State
Grid Corporation and Hong Kong’s Cheung Kong Infrastructure were blocked late in the bidding process due to
national security concerns (Williams and Foley 2016).
Uncertainty in foreign investment approvals could have broader implications in raising questions about
Australia’s openness to foreign investment more generally, potentially dissuading inbound investment to other
sectors such as mining and METS projects. While it is important to have protections and regulations in place in
the interests of national security and similar concerns, the significant degree of uncertainty for foreign
investors in relation to the interpretation of these criteria – such as in the Ausgrid case – could deter future
investment. Consistent application of these rules is therefore essential in supporting the confidence of foreign
investors.
In this context, greater clarity and consistency in FIRB decisions around the factors influencing investment
approvals could provide more certainty for overseas companies and funds looking to invest in the sector. This
is particularly relevant in encouraging foreign investment to the mining and METS sector, given that much of
the future foreign investment in mining is likely to come from China – a country that has experienced
uncertainties in FIRB decision-making processes in recent years.
In addition, it will be important for Australia to continue to engage with the region and ensure that trade and
investment negotiations remain open. To the extent that Australia’s recent free trade agreements with China
and Japan facilitate greater trade and investment flows, this will provide a positive indication to foreign
investors that Australian policy generally favours openness and regional engagement.
In the coming years, a successful trade negotiation with India will boost opportunities for the minerals
industry to supply India’s growing demand for resources, including coal and uranium. In 2015, exports of
resources accounted for 57 per cent ($7.6 billion) of Australia’s total exports to India ($13.4 billion), including
coal ($5 billion), gold ($930 million) and copper ores and concentrates ($682 million) (DFAT 2016).
3.2.5 Efficient approaches to regulation
Within the minerals industry, regulatory requirements cover all stages of industry activity from grant of
tenure, exploration, extraction, processing, transport and mine closure through to relinquishment of tenure.
With the presence of this thorough set of regulations, it is important to ensure that regulatory requirements
are simplified or streamlined when efficiency gains can be made without diminishing the goals of the
regulation (such as maintaining environmental standards).

Mining and METS: engines of economic growth and prosperity for Australians
42
For example, there are currently complex and duplicative processes for environmental assessments and
approvals. The Productivity Commission has concluded that overlap and duplication between federal and state
processes can be greatly reduced without lowering the quality of environmental outcomes (PC 2013c).
Inefficient regulatory processes that do not enhance outcomes contribute to lengthy approval timeframes and
delays and pose an unnecessary risk to the industry’s global competitiveness.
A 2013 Productivity Commission inquiry Mineral and Energy Resource Exploration highlighted environmental
approvals as one area where regulatory processes may place unnecessary burdens on the mining and METS
sector, noting that “addressing state, territory and Commonwealth environmental approvals processes that
are duplicative and are not commensurate with the risk and significant of the environmental impacts of
exploration” should be an area for improvement (PC 2013b). The report included several recommendations for
reform in order to reduce duplication of environmental approvals within and between jurisdictions, including
strengthening arrangements between the Commonwealth and states and territories, such as by establishing
bilateral agreements for the accreditation of environmental approvals where state and territory processes
meet appropriate standards.
Uncertainties and inconsistencies in the various approvals processes are costly for mining and METS
companies and the Australian economy more broadly. The benefits of the streamlined project approvals are
significant; for example, analysis by the then Department of the Environment concluded streamlining federal
and state environmental approval processes would save Australian businesses $426 million annually
(Department of the Environment 2014). In addition to these costs, uncertainties and inconsistencies in
approval processes affect the willingness of the sector to plan for and invest in future projects.
Furthermore, third party appeals against valid environmental approvals can increase delays and compliance
costs for major mining projects that have already been assessed to adequately meet environmental standards.
For example, some organisations have been known to employ a “strategy of ‘lodging legal challenges’ to delay
[mining] projects and therefore cause companies to give up, down scale or lose investment” (PC 2013b).
While appeal and review mechanisms are important to ensure that approvals are made in a transparent and
accountable manner, the Productivity Commission’s 2013 research report Major Project Development
Assessment Processes noted that vexatious litigation or commercially motivated appeals can create
unwarranted delays for major projects.
3.2.6 Support for collaboration and entrepreneurship
As noted throughout this report, the mining industry is becoming increasingly knowledge-intensive and open
to the adoption of evolving and step-change technologies. A total of 6,539 Australian mining inventions were
filed for patent between 1994 and 2011. Australian mining technology is exported globally, with patent filings
overseas showing major markets include the United States, Canada, China, Japan, Europe, Russia, Brazil and
Mexico (Francis 2015).
The Australian mining and METS sector contributes hundreds of millions of dollars annually through a range of
innovative partnerships with research bodies. These include cooperative research centres (CRCMining and
CRC Ore), the Australian coal industry’s research program (ACARP), the COAL21 Fund for low emissions coal
technologies and AMIRA International – which leverages mining R&D. The dividend from this collaboration has
been substantial across mine safety, extractive technologies, automation, energy efficiency, low emissions
technologies and environmental practices and biodiversity protection.
In addition, analysis by the Department of Industry, Innovation and Science has shown that mining has
accounted for the largest industry share of micro start-up businesses and has been one of the largest
contributors to job creation by these businesses over the past decade (Hendrickson 2015).
Mining, METS and research organisations are working closely together to develop and accelerate the adoption
of innovation into global mining supply chains. METS Ignited is an industry-led, government-funded, Growth
Centre for the mining equipment, technology and services sector. The Industry Growth Centre initiative
focuses on areas of competitive strength and strategic priority, with the goal of enabling national action on key
issues such as regulation reform, skills, collaboration and commercialisation. METS Ignited works with
Australian suppliers to the mining industry, global miners, research organisations and capital providers to
improve the competitiveness and productivity of the Australian METS sector.

43
References
Anderson, D (2014). Fifty years of Australian Trade. Department of Foreign Affairs and Trade.
Austmine (2013). Australia’s New Driver for Growth: Mining Equipment, Technology and Services.
Australian Bureau of Statistics [ABS] (2015). Research and Experimental Development, Businesses, Australia,
2013-14, cat. no. 8104.0, released on 4 September 2015. Available at:
http://www.abs.gov.au/AUSSTATS/[email protected]/Lookup/8104.0Main+Features12013-14?OpenDocument
Australian Energy Market Commission [AEMC] (2013), National Electricity Market: A case study in successful
microeconomic reform, 13 December 2013, pp. v and 3.
Australian Energy Market Operator [AEMO] (2014). Value of Customer Reliability Application Guide, available
at: www.aemo.com.au/Electricity/Planning/Value-of-Customer-Reliability-review.
BAEconomics (2017), Primer on renewable energy subsidies in Australia, report to the Minerals Council of
Australia, January 2017, p. 2.
Banks, G (2011). “Australia’s mining boom: what’s the problem?” Address to the Melbourne Institute and The
Australian Economic and Social Outlook Conference, 30 June 2011.
Centre for International Economics [CIE] (2014). The contribution of mining to the New South Wales
economy, available at:
http://www.resourcesandenergy.nsw.gov.au/__data/assets/pdf_file/0007/539935/CIE-Report-Contribution-of-
mining-to-NSW.pdf.
Chen, D and Mintz, J (2016). Effective tax rates on Australian mining and an evaluation of proposed increases
in taxation of iron ore, policy paper commissioned by the Minerals Council of Australia, 5 September 2016.
Committee for Economic Development of Australia [CEDA] (2009). Foreign investment pays a national
dividend, available at: https://www.ceda.com.au/research-and-
policy/research/2009/11/economy/foreign_investment.
Commonwealth of Australia (2013). Cancer of the bush or salvation for our cities? Fly-in, fly-out and drive-in,
drive-out workforce practices in Regional Australia, available at:
http://www.aph.gov.au/Parliamentary_Business/Committees/House_of_representatives_Committees?url=ra/fi
fodido/report.htm.
Competition Policy Review (2015). Competition Policy Review: Final Report, available at:
http://competitionpolicyreview.gov.au/files/2015/03/Competition-policy-review-report_online.pdf.
Deloitte Access Economics (2016a). WA Iron Ore Royalty Analysis, November.
Deloitte Access Economics (2016b). Building resilient infrastructure, available at:
http://australianbusinessroundtable.com.au/assets/documents/Report%20-
%20Building%20Resilient%20Infrastructure/Report%20-%20Building%20resilient%20infrastructure.pdf
Deloitte Access Economics (2016c). Minerals industry tax survey 2016, December.
Department of Foreign Affairs and Trade [DFAT] (2016). Country and commodity pivot table 2006 to 2015,
last updated November 2016 using ABS cat. 5368.0 (September 2016 data).

44
Department of Industry, Innovation and Science [DIIS] (2016). Resources and Energy Quarterly: Historical
data – September 2016, released on 7 October 2016, Canberra.
Department of the Environment (2014). Regulatory cost savings under the one-stop shop for environmental
approvals, Australian Government, Canberra, September 2014, p. 1.
Downes, P, Hanslow, K and Tulip, P (2014). “The Effect of the Mining Boom on the Australian Economy,”
Research Discussion Paper, Reserve Bank of Australia.
Ferris, B, Finkel, A and Fraser, J (2016). Review of the R&D Tax Incentive.
Finkel, A (2016). Independent Review into the Future Security of the National Electricity Market, available at:
http://www.environment.gov.au/system/files/resources/97a4f50c-24ac-4fe5-b3e5-
5f93066543a4/files/independent-review-national-elec-market-prelim.pdf
Francis, E (2015). The Australian Mining Industry: More than Just Shovels and Being the Lucky Country, IP
Australia, available at:
https://www.ipaustralia.gov.au/sites/g/files/net856/f/the_australian_mining_industry_report.pdf.
Geoscience Australia (2016). “Mineral Resources”, available at: http://www.ga.gov.au/scientific-
topics/minerals/mineral-resources.
Goldman Sachs (2013). Resource Nationalism Poses Big Threat to Miners, equity research paper, January
2013.
Hanratty, P (1996). Inward Direct Foreign Investment in Australia. Policy Controls and Economic Outcomes.
Research Paper 32. Australian Parliamentary Library.
Hendrickson, L (2015). Where does employment growth come from? Presentation to the Industry Innovation
Workshop 2015, Department of Industry, Innovation and Science, 15 September 2015, p. 8. Available at:
https://industry.gov.au/Office-of-the-Chief-Economist/Events/Documents/1-Luke-Hendrickson.pdf.
Ingram, T (2016). “Fortescue Metals Groups loses bid to block Brockman from rail”. Australian Financial
Review, September, available at: http://www.afr.com/business/mining/iron-ore/fortescue-metals-group-loses-
bid-to-block-brockman-from-rail-20160902-gr7lnl.
Irwin, DA (1996). Three Simple Principles of Trade Policy, available at: https://www.aei.org/wp-
content/uploads/2014/04/-three-simple-principles-of-trade-policy_142937157317.pdf.
Kent, C (2016). After the Boom, RBA speech, available at: https://www.rba.gov.au/speeches/2016/sp-ag-
2016-09-13.html.
Kininmonth, B (2002). Heritage in New South Wales Coalfields, available at:
https://www.ausimm.com.au/Content/docs/heritage_bob_kininmonth.pdf.
Lateral Economics (n.d.). Gross value added of the METS sector: A Report for Austmine.
Morrison, S (2016). Budget Speech, May, available at: http://www.budget.gov.au/2016-
17/content/speech/html/speech.htm.
Northern Territory Department of Mines and Energy (2015). Annual Report 2014-15, available at:
https://minerals.nt.gov.au/__data/assets/pdf_file/0006/258936/DME-Annual-Report-14_15_Final.pdf.
Nous Group (2007). 16 January 2007 electricity supply interruptions in Victoria: What happened and why,
Opportunities and recommendations, prepared for the Department of Primary Industries – 2010, National
workshop on rural electricity network options to reduce bushfire risk
45
Organisation for Economic Co-Operation and Development [OECD] (2010). Tax Policy Reform and Economic
Growth: OECD Tax Policy Studies No. 20, available at: https://www.oecd.org/ctp/tax-policy/46605695.pdf.
OECD (2016). OECD Tax Database. http://www.oecd.org/tax/tax-policy/tax-
database.htm#C_CorporateCaptial. Accessed on: 1 December 2016.
Productivity Commission [PC] (2013a). National Access Regime: Productivity Commission Inquiry Report,
available at: http://www.pc.gov.au/inquiries/completed/access-regime/report/access-regime.pdf.
PC (2013b). Mineral and Energy Resource Exploration, available at:
http://www.pc.gov.au/inquiries/completed/resource-exploration/report/resource-exploration.pdf.
PC (2013c). Major Project Development Assessment Processes, available at:
http://www.pc.gov.au/inquiries/completed/major-projects/report/major-projects.pdf.
Productivity Commission (2013d), Electricity Network Regulatory Frameworks, available at:
http://www.pc.gov.au/__data/assets/pdf_file/0016/123037/electricity-volume1.pdf
PC (2015). Workplace Relations Framework: Productivity Commission Inquiry Report, available at:
http://www.pc.gov.au/inquiries/completed/workplace-relations/report/workplace-relations-overview.pdf.
PC (2016a). Productivity Update 2016, available at: http://www.pc.gov.au/research/ongoing/productivity-
update/pc-productivity-update-2016.
PC (2016b). Trade & Assistance Review 2014-15, available at: http://www.pc.gov.au/research/ongoing/trade-
assistance/2014-15/trade-assistance-review-2014-15.pdf.
Principal Economics (2015), Electricity Production Subsidies in Australia, policy paper commissioned by the
Minerals Council of Australia, MCA, August 2015.
Queensland Department of Natural Resources and Mines [DNRM] (2016). Queensland coal – mines and
advanced projects, available at: https://www.dnrm.qld.gov.au/__data/assets/pdf_file/0011/238079/coal-
mines-advanced-projects.pdf.
Queensland Department of Transport and Main Roads [TMR] (2016). Coal transport infrastructure
development, available at: http://www.tmr.qld.gov.au/business-industry/Transport-sectors/Coal-transport-
infrastructure-development.
Rayner, V and Bishop, J (2013). Industry Dimensions of the Resource Boom: An Input-Output Analysis,
available at: https://www.rba.gov.au/publications/rdp/2013/pdf/rdp2013-02.pdf.
Regional Development Australia [RDA] Pilbara (2012). Pilbara Report: Exploring opportunities in the nation’s
powerhouse, available at:
http://www.rdapilbara.org.au/resources/site1/General/Publication%20Reports/Pilbara%20Report_WEB_spread
s.pdf.
RDA Pilbara (2014). Pilbara: Resources and Beyond, available at:
http://www.rdapilbara.org.au/resources/site1/General/Publication%20Reports/RDA%20Pilbara%20Resources
%20and%20Beyond.pdf.
South Australia Department of State Development (2016a). The facts about uranium mining in South
Australia, available at: http://www.statedevelopment.sa.gov.au/resources/the-facts/the-facts-about-uranium-
mining-in-south-australia.
South Australia Department of State Development (2016b). Copper, available at:
http://www.minerals.statedevelopment.sa.gov.au/invest/mineral_commodities/copper.

46
Stevens, M (2016). “Light rail relief for Fortescue Metals Group’s access pain,” Australian Financial Review,
September, available at: http://www.afr.com/opinion/columnists/light-rail-relief-for-fortescue-metals-groups-
access-pain-20160907-grazzs.
Treasury (1998). Tax Reform: Not a New Tax, A New Tax System, available at:
https://archive.treasury.gov.au/documents/159/HTML/docshell.asp?URL=Overview.asp.
Treasury (2016). Foreign investment into Australia: Treasury Working Paper, available at:
http://treasury.gov.au/~/media/Treasury/Publications%20and%20Media/Publications/2016/Foreign%20invest
ment%20into%20Australia/Downloads/PDF/TWP_201601_Foreign_Investment.ashx.
Victorian Department of Economic Development, Jobs, Transport and Resources [DEDJTR] (2016a). Earth
Resources in Victoria, available at: http://earthresources.vic.gov.au/earth-resources.
Victorian DEDJTR (2016b). Lignite / Brown Coal, available at: http://earthresources.vic.gov.au/earth-
resources/victorias-earth-resources/coal.
Victorian DEDJTR (2016c). Earth Resources Regulation: 2014 – 2015 statistical report.
Webb, R (2012). Fuel tax credits: are they a subsidy to fuel use?, available at:
http://www.aph.gov.au/About_Parliament/Parliamentary_Departments/Parliamentary_Library/FlagPost/2012/
May/Fuel_tax_credits_are_they_a_subsidy_to_fuel_use.
Williams, P and Foley, B (2016). “Australia discovers cost of blocking China in Ausgrid sale,” Sydney Morning
Herald, 21 October, available at: http://www.smh.com.au/business/energy/australia-discovers-cost-of-
blocking-china-in-ausgrid-sale-20161020-gs7dbt.html.

47
Appendix A: Economic contribution modelling
framework
Economic contribution studies are intended to quantify measures such as value added, exports, imports and
employment associated with a given industry or firm, in a historical reference year. The economic contribution
is a measure of the value of production by a firm or industry.
All direct, indirect and total contributions are reported as gross operating surplus (GOS), labour income, value
add and employment (with these terms defined in Table A.1).
Table A.1: Definitions of economic contribution estimates
Estimate Definition
Gross operating
surplus (GOS)
GOS represents the value of income generated by the entity’s direct capital
inputs, generally measured as the earnings before interest, tax, depreciation, and
amortisation (EBITDA).
Labour income Labour income is a subcomponent of value add. It represents the value of output
generated by the entity’s direct labour inputs, as measured by the income to
labour.
Value add Value add measures the value of output (i.e. goods and services) generated by
the entity’s factors of production (i.e. labour and capital) as measured in the
income to those factors of production. The sum of value add across all entities in
the economy equals gross domestic product. Given the relationship to GDP, the
value add measure can be thought of as the increased contribution to welfare.
Employment (FTE) Employment is a fundamentally different measure of activity to those above. It
measures the number of workers (measured in full-time equivalent terms) that
are employed by the entity, rather than the value of the workers’ output.
Direct economic
contribution
The direct economic contribution is a representation of the flow from labour and
capital committed in the economic activity.
Indirect economic
contribution
The indirect contribution is a measure of the demand for goods and services
produced in other sectors as a result of demand generated by economic activity.
Total economic
contribution
The total economic contribution to the economy is the sum of the direct and
indirect economic contributions.
Source: Deloitte Access Economics (2017)
Definitional notes
When calculating the GOS for a typical for-profit firm or industry, income streams from government (such as
transfers or production subsidies) are excluded as they are a transfer of public funds, not reflective of income
generated by the activities of the firm or industry.

48
Similarly, value added is typically calculated as GOS plus labour income net of subsidies; under the ABS
Australian System of National Accounts (ASNA)10:
A subsidy on a product is a subsidy payable per unit of a good or service. An enterprise may regard a subsidy as little different from sales proceeds. However, in the national accounts, subsidies are regarded as transfer payments from general government, enabling enterprises to sell their output for less than would otherwise be the case.
In this context, it should be noted that according to the Productivity Commission: ‘The estimated effective rate
of assistance from tariff and budgetary assistance for mining is negligible’ (PC 2016b, 26). The PC defines the
effective rate of assistance as the ratio of total assistance to unassisted output, with an effective rate of
assistance for the mining sector estimated to be 0.1 per cent.
Value added
The measures of economic activity provided by this contribution study are consistent with those provided by
the Australian Bureau of Statistics. For example, value added is the contribution the sector makes to total
factor income and gross domestic product (GDP).
There are a number of ways to measure GDP, including:
expenditure approach – measures expenditure: of households, on investment, government and net
exports; and
income approach – measures the income in an economy by measuring the payments of wages and
profits to workers and owners.
Below is a discussion measuring the value added by an industry using the income approach.
Measuring the economic contribution – income approach
There are several commonly used measures of economic activity, each of which describes a different aspect of
an industry’s economic contribution:
Value added measures the value of output (i.e. goods and services) generated by the entity’s factors of
production (i.e. labour and capital) as measured in the income to those factors of production. The sum of
value added across all entities in the economy equals gross domestic product. Given the relationship to
GDP, the value added measure can be thought of as the increased contribution to welfare.
Value added is the sum of:
– Gross operating surplus (GOS) represents the value of income generated by the entity’s capital inputs,
generally measured as the earnings before interest, tax, depreciation and amortisation (EBITDA).
– Tax on production less subsidy provided for production. Note: given the manner in which returns to
capital before tax are calculated, company tax is not included or this would double-count that tax. In
addition it excludes goods and services tax, which is a tax on consumption (i.e. levied on households).
– Labour income is a subcomponent of value added. It represents the value of output generated by the
entity’s direct labour inputs, as measured by the income to labour.
Figure A.1 shows the accounting framework used to evaluate economic activity, along with the components
that make up output. Output is the sum of value added and the value of intermediate inputs used by the firm
or industry.
The value of intermediate inputs can also be calculated directly by summing up expenses related to non-
primary factor inputs.
10 Australian Bureau of Statistics (2013). Australian System of National Accounts – Concepts, Sources and Methods

49
Figure A.1: Economic activity accounting framework
Source: Deloitte Access Economics (2017)
Contribution studies generally outline employment generated by a sector. Employment is a fundamentally
different measure of activity to those above. It measures the number of workers that are employed by the
entity, rather than the value of the workers’ output.
Direct and indirect contributions
The direct economic contribution is a representation of the flow from labour and capital in the company.
The indirect contribution is a measure of the demand for goods and services produced in other sectors as a
result of demand generated by the direct economic activity of the mining and METS industry. Estimation of the
indirect economic contribution is undertaken in an input-output (IO) framework using Australian Bureau of
Statistics IO tables which report the inputs and outputs of specific sectors of the economy (ABS 2013).
The total economic contribution to the economy is the sum of the direct and indirect economic contributions.
Other measures, such as total revenue or total exports are useful measures of economic activity, but these
measures alone cannot account for the contribution made to GDP. Such measures overstate the contribution
to value added because they include activity by external firms supplying inputs. In addition, they do not
discount the inputs supplied from outside Australia.
Limitations of economic contribution studies
While describing the geographic origin of production inputs may be a guide to a firm or industry’s linkages
with the local economy, it should be recognised that these are the type of normal industry linkages that
characterise all economic activities.
Unless there is unused capacity in the economy (such as unemployed labour) there may not be a strong
relationship between a firm’s economic contribution as measured by value added (or other static aggregates)
and the welfare or living standard of the community. The use of labour and capital by demand created from
the industry comes at an opportunity cost as it may reduce the amount of resources available to spend on
other economic activities. This is not to say that the economic contribution, including employment, is not
important. As stated by the Productivity Commission in the context of Australia’s gambling industries:11
11 Productivity Commission (1999), Australia’s Gambling Industries, Report No. 10, AusInfo, Canberra, (page 4.19).

50
Value added trade and job creation arguments need to be considered in the context of the economy as a whole … income from trade uses real resources, which could have been employed to generate benefits elsewhere. These arguments do not mean that jobs, trade and activity are unimportant in an economy. To the contrary they are critical to people’s well-being. However, any particular industry’s contribution to these benefits is much smaller than might at first be thought, because substitute industries could produce similar, though not equal gains.
In a fundamental sense, economic contribution studies are simply historical accounting exercises. No ‘what-if’,
or counterfactual inferences – such as ‘what would happen to living standards if the firm or industry
disappeared?’ – should be drawn from them.
The analysis – as discussed in the report – relies on a national IO table modelling framework and there are
some limitations to this modelling framework. The analysis assumes that goods and services provided to the
sector are produced by factors of production that are located completely within the state or region defined and
that income flows do not leak to other states.
The IO framework and the derivation of the multipliers also assume that the relevant economic activity takes
place within an unconstrained environment. That is, an increase in economic activity in one area of the
economy does not increase prices and subsequently crowd out economic activity in another area of the
economy. As a result, the modelled total and indirect contribution can be regarded as an upper-bound
estimate of the contribution made by the supply of intermediate inputs.
Similarly the IO framework does not account for further flow-on benefits as captured in a more dynamic
modelling environment like a Computerised General Equilibrium (CGE) model.
Input-output analysis
Input-output tables are required to account for the intermediate flows between sectors. These tables measure
the direct economic activity of every sector in the economy at the national level. Importantly, these tables
allow intermediate inputs to be further broken down by source. These detailed intermediate flows can be used
to derive the total change in economic activity associated with a given direct change in activity for a given
sector.
A widely used measure of the spill-over of activity from one sector to another is captured by the ratio of the
total to direct change in economic activity. The resulting estimate is typically referred to as ‘the multiplier’. A
multiplier greater than one implies some indirect activity, with higher multipliers indicating relatively larger
indirect and total activity flowing from a given level of direct activity.
The IO matrix used for Australia is derived from the ABS 2012-13 IO tables (2013), the latest available IO
data at the time of the analysis. The industry classification used for IO tables is based on the Australian and
New Zealand Standard Industrial Classification (ANZSIC), with 114 sectors in the modelling framework.
In order to produce economic contribution estimates for 2015-16, the figures in the 2012-13 IO tables were
updated using the latest National Accounts figures from the ABS. It was assumed that the mining proportion
of the overall mining and METS sector grew at the same rate from 2012-13 to 2015-16 as the three key
ANZSIC mining industries: Coal Mining, Iron Ore Mining and Other Mining. It was assumed that the METS
proportion of the overall mining and METS sector grew at the same rate as the ANZSIC Exploration and Mining
Support Service industry.
jelkir
Typewritten Text

52
Limitation of our work
General use restriction
This report is prepared solely for the use of the Minerals Council of Australia. This report is not intended to and
should not be used or relied upon by anyone else and we accept no duty of care to any other person or entity.
The report has been prepared for the purpose of analysing the economic importance of the mining and METS
sector in Australia. You should not refer to or use our name or the advice for any other purpose

53
Contact us
Deloitte Access Economics
ACN: 149 633 116
550 Bourke Street
Melbourne VIC 3000
Tel: +61 3 9671 7000
Deloitte Access Economics is Australia’s pre-eminent economics advisory practice and a member of Deloitte's global economics
group. For more information, please visit our website
www.deloitte.com/au/deloitte-access-economics
Deloitte refers to one or more of Deloitte Touche Tohmatsu Limited, a UK private company limited by guarantee, and its network
of member firms, each of which is a legally separate and independent entity. Please see www.deloitte.com/au/about for a
detailed description of the legal structure of Deloitte Touche Tohmatsu Limited and its member firms.
The entity named herein is a legally separate and independent entity. In providing this document, the author only acts in the
named capacity and does not act in any other capacity. Nothing in this document, nor any related attachments or
communications or services, have any capacity to bind any other entity under the ‘Deloitte’ network of member firms (including
those operating in Australia).
About Deloitte
Deloitte provides audit, tax, consulting, and financial advisory services to public and private clients spanning multiple industries.
With a globally connected network of member firms in more than 150 countries, Deloitte brings world-class capabilities and high-
quality service to clients, delivering the insights they need to address their most complex business challenges. Deloitte's
approximately 200,000 professionals are committed to becoming the standard of excellence.
About Deloitte Australia
In Australia, the member firm is the Australian partnership of Deloitte Touche Tohmatsu. As one of Australia’s leading
professional services firms. Deloitte Touche Tohmatsu and its affiliates provide audit, tax, consulting, and financial advisory
services through approximately 6000 people across the country. Focused on the creation of value and growth, and known as an
employer of choice for innovative human resources programs, we are dedicated to helping our clients and our people excel. For
more information, please visit our web site at www.deloitte.com.au.
Liability limited by a scheme approved under Professional Standards Legislation.
Member of Deloitte Touche Tohmatsu Limited
© 2017 Deloitte Touche Tohmatsu

APPENDIX B
Victoria Fact Sheet
South Australia Fact Sheet
Northern Territory Fact Sheet

Mining and METS: engines of economic growth and prosperity for Australians
Mining and METS: engines of
economic growth and prosperity
for Australians Victoria in focus: fact sheet Prepared for the Minerals Council of Australia, 2017

Mining and METS: engines of economic growth and prosperity for Australians
Victoria in focus: fact sheet
Overview The mining sector has long made – and continues to make – a significant contribution to Australia’s economic
growth and development. The Australian mining industry uses sophisticated production techniques and highly
skilled labour to make the most of Australia’s comparative advantage in mineral endowments. The supporting
activities of the mining equipment, technology and services (METS) sector add further to Australia’s national
income and employment.
The Australian economy continues to enjoy the fruits of the latest mining boom that began in 2003. A sharp
increase in commodity prices was followed by unprecedented investment in new mines, equipment and
infrastructure – at its peak in 2012, resources investment accounted for 60% of total investment in Australia
(including investment in both the mining and oil and gas sectors).
This growth in mining capacity underpins the current production phase of the mining boom, in which rising
export volumes support a range of manufacturing and service activities across Australia. Minerals and energy
exports are the primary source of Australia’s export earnings, accounting for 64% of merchandise exports by
value in 2015-16 (DIIS, 2016).
In its national report Mining and METS: engines of economic growth and prosperity for Australians, Deloitte
Access Economics estimated the total economic contribution of the mining and METS sector to Australia’s
gross domestic product (GDP) by using an input-output modelling framework in order to capture all mining
and METS activities. This economic analysis applies a similar approach to the methodology used in the RBA’s
2013 Research Discussion Paper Industry Dimensions of the Resource Boom: An Input-Output Analysis.
Overall, Deloitte Access Economics estimates that the direct economic contribution of mining and METS
activities was $133.2 billion in value added in 2015-16, with 484,114 full-time equivalent (FTE) jobs directly
supported by the sector.1 This figure represents the ‘economic footprint’ attributable directly to the mining and
METS sector in the Australian economy.
In addition to this direct economic contribution, the mining and METS sector depends on outputs from other
industries in the Australian economy, such as petroleum, electricity and manufacturing, as inputs to
production. This indirectly generates economic activity by facilitating production and paying wages and profits
in these other industries. This indirect economic contribution added a further $103.6 billion in 2015-16,
supporting another 655,654 FTE jobs.
1 The value added by an industry is the value of its output, less the value of intermediate inputs used to produce this output (as these represent outputs of other industries). It is important to note that GDP adds up value added by industry, not the
value of industry output or sales. Accordingly, the economic contribution of an industry must be distinguished from its total revenue and total exports, which do not discount inputs supplied by other industries or economies.
The total economic contribution of Australia’s mining and METS sector in 2015-16 was $236.8 billion,
representing around 15% of the Australian economy. This economic activity supported a total of
1,139,768 FTE jobs across Australia, which represents around 10% of total FTE employment.

Mining and METS: engines of economic growth and prosperity for Australians
Victoria in focus: fact sheet
Economic contribution in Victoria Mining has historically had a significant impact on the Victorian economy: the State’s initial development in
the 19th century was fuelled by its famous gold rush. Today, Victoria’s mining and METS sector produces a
variety of commodities, including brown coal (lignite), gold, mineral sands and base metals (DEDJTR, 2016a).
Victoria is also a national hub for METS exports, with strong manufacturing and engineering capabilities
operating in both metropolitan Melbourne and in regional hubs such as Geelong, Ballarat and Bendigo.
Victoria has 430 billion tonnes of lignite (brown coal) reserves – mostly found in the Gippsland Basin – which
plays a significant role in the production of affordable and reliable electricity for Victoria and the National
Electricity Market (DEDJTR 2016b). In 2014-15, the State mined 61 million tonnes of brown coal, representing
a 5.1% increase in production compared to the previous financial year (DEDJTR 2016c).
Deloitte Access Economics estimates that in Victoria, the mining and METS sector directly contributed $8.2
billion in value added to the state economy in 2015-16, and supported around 88,000 FTE jobs (see table
below). The indirect economic contribution to Victoria is estimated to be $5.4 billion, supporting approximately
33,700 jobs in FTE terms.
Overall, the total direct and indirect contribution of $13.6 billion in value added represented 4% of economic
activity in Victoria in 2015-16.
Economic contribution of mining and METS sector in Victoria, 2015-16
Direct contribution Indirect contribution Total contribution
Value added ($m) 8,160 5,402 13,562
Employment (FTE) 88,027 33,675 121,702
Source: Deloitte Access Economics (2017)
References Deloitte Access Economics (2017). Mining and METS: engines of economic growth and prosperity for
Australians, available at: https://www2.deloitte.com/au/en/pages/economics/articles/mining-mets-economic-
growth-prosperity-engines.html.
Department of Industry, Innovation and Science [DIIS] (2016). Resources and Energy Quarterly: Historical
data – September 2016, released on 7 October 2016, Canberra.
Victorian Department of Economic Development, Jobs, Transport and Resources [DEDJTR] (2016a). Earth
Resources in Victoria, available at: http://earthresources.vic.gov.au/earth-resources.
Victorian DEDJTR (2016b). Lignite / Brown Coal, available at: http://earthresources.vic.gov.au/earth-
resources/victorias-earth-resources/coal.
Victorian DEDJTR (2016c). Earth Resources Regulation: 2014 – 2015 statistical report.

Mining and METS: engines of economic growth and prosperity for Australians
Victoria in focus: fact sheet
Limitation of our work
General use restriction
This report is prepared solely for the use of the Minerals Council of Australia. This report is not intended to and
should not be used or relied upon by anyone else and we accept no duty of care to any other person or entity.
The report has been prepared for the purpose of analysing the economic importance of the mining and METS
sector in Australia and Victoria. You should not refer to or use our name or the advice for any other purpose
Contact us
Deloitte Access Economics
ACN: 149 633 116
550 Bourke Street
Melbourne VIC 3000
Tel: +61 3 9671 7000
Deloitte Access Economics is Australia’s pre-eminent economics advisory practice and a member of Deloitte's global economics
group. For more information, please visit our website
www.deloitte.com/au/deloitte-access-economics
Deloitte refers to one or more of Deloitte Touche Tohmatsu Limited, a UK private company limited by guarantee, and its network
of member firms, each of which is a legally separate and independent entity. Please see www.deloitte.com/au/about for a
detailed description of the legal structure of Deloitte Touche Tohmatsu Limited and its member firms.
The entity named herein is a legally separate and independent entity. In providing this document, the author only acts in the
named capacity and does not act in any other capacity. Nothing in this document, nor any related attachments or
communications or services, have any capacity to bind any other entity under the ‘Deloitte’ network of member firms (including
those operating in Australia).
About Deloitte
Deloitte provides audit, tax, consulting, and financial advisory services to public and private clients spanning multiple industries.
With a globally connected network of member firms in more than 150 countries, Deloitte brings world-class capabilities and high-
quality service to clients, delivering the insights they need to address their most complex business challenges. Deloitte's
approximately 200,000 professionals are committed to becoming the standard of excellence.
About Deloitte Australia
In Australia, the member firm is the Australian partnership of Deloitte Touche Tohmatsu. As one of Australia’s leading
professional services firms. Deloitte Touche Tohmatsu and its affiliates provide audit, tax, consulting, and financial advisory
services through approximately 6000 people across the country. Focused on the creation of value and growth, and known as an
employer of choice for innovative human resources programs, we are dedicated to helping our clients and our people excel. For
more information, please visit our web site at www.deloitte.com.au.
Liability limited by a scheme approved under Professional Standards Legislation.
Member of Deloitte Touche Tohmatsu Limited
© 2017 Deloitte Touche Tohmatsu

Mining and METS: engines of economic growth and prosperity for Australians
Mining and METS: engines of
economic growth and prosperity
for Australians South Australia in focus: fact sheet Prepared for the Minerals Council of Australia, 2017

Mining and METS: engines of economic growth and prosperity for Australians
South Australia in focus: fact sheet
Overview The mining sector has long made – and continues to make – a significant contribution to Australia’s economic
growth and development. The Australian mining industry uses sophisticated production techniques and highly
skilled labour to make the most of Australia’s comparative advantage in mineral endowments. The supporting
activities of the mining equipment, technology and services (METS) sector add further to Australia’s national
income and employment.
The Australian economy continues to enjoy the fruits of the latest mining boom that began in 2003. A sharp
increase in commodity prices was followed by unprecedented investment in new mines, equipment and
infrastructure – at its peak in 2012, resources investment accounted for 60% of total investment in Australia
(including investment in both the mining and oil and gas sectors).
This growth in mining capacity underpins the current production phase of the mining boom, in which rising
export volumes support a range of manufacturing and service activities across Australia. Minerals and energy
exports are the primary source of Australia’s export earnings, accounting for 64% of merchandise exports by
value in 2015-16 (DIIS, 2016).
In its national report Mining and METS: engines of economic growth and prosperity for Australians, Deloitte
Access Economics estimated the total economic contribution of the mining and METS sector to Australia’s
gross domestic product (GDP) by using an input-output modelling framework in order to capture all mining
and METS activities. This economic analysis applies a similar approach to the methodology used in the RBA’s
2013 Research Discussion Paper Industry Dimensions of the Resource Boom: An Input-Output Analysis.
Overall, Deloitte Access Economics estimates that the direct economic contribution of mining and METS
activities was $133.2 billion in value added in 2015-16, with 484,114 full-time equivalent (FTE) jobs directly
supported by the sector.1 This figure represents the ‘economic footprint’ attributable directly to the mining and
METS sector in the Australian economy.
In addition to this direct economic contribution, the mining and METS sector depends on outputs from other
industries in the Australian economy, such as petroleum, electricity and manufacturing, as inputs to
production. This indirectly generates economic activity by facilitating production and paying wages and profits
in these other industries. This indirect economic contribution added a further $103.6 billion in 2015-16,
supporting another 655,654 FTE jobs.
1 The value added by an industry is the value of its output, less the value of intermediate inputs used to produce this output (as these represent outputs of other industries). It is important to note that GDP adds up value added by industry, not the
value of industry output or sales. Accordingly, the economic contribution of an industry must be distinguished from its total revenue and total exports, which do not discount inputs supplied by other industries or economies.
The total economic contribution of Australia’s mining and METS sector in 2015-16 was $236.8 billion,
representing around 15% of the Australian economy. This economic activity supported a total of
1,139,768 FTE jobs across Australia, which represents around 10% of total FTE employment.

Mining and METS: engines of economic growth and prosperity for Australians
South Australia in focus: fact sheet
Economic contribution in South Australia South Australia’s mining and METS sector activity is based largely on copper, uranium and zircon. The State
has roughly 25% of the world’s uranium deposits and 80% of Australia’s deposits (Department of State
Development, 2016a), and all of the uranium oxide concentrate produced in the State is exported.
South Australia also has significant copper deposits, which have been mined since the mid-1800s, with 68% of
Australia’s economical copper found in South Australia (Department of State Development, 2016b).
Supporting METS activities in South Australia include applied research, information technologies and advanced
manufacturing.
Deloitte Access Economics estimates that in South Australia, the mining and METS sector directly contributed
$5.3 billion in value added to the state economy in 2015-16, and supported around 46,100 FTE jobs (see table
below). The indirect economic contribution to South Australia is estimated to be $3.6 billion, supporting
approximately 23,700 jobs in FTE terms.
Overall, the total direct and indirect contribution of $8.9 billion in value added represented 8% of economic
activity in South Australia in 2015-16.
Economic contribution of mining and METS sector in South Australia, 2015-16
Direct contribution Indirect contribution Total contribution
Value added ($m) 5,337 3,608 8,945
Employment (FTE) 46,100 23,710 69,810
Source: Deloitte Access Economics (2017)
References Deloitte Access Economics (2017). Mining and METS: engines of economic growth and prosperity for
Australians, available at: https://www2.deloitte.com/au/en/pages/economics/articles/mining-mets-economic-
growth-prosperity-engines.html.
Department of Industry, Innovation and Science [DIIS] (2016). Resources and Energy Quarterly: Historical
data – September 2016, released on 7 October 2016, Canberra.
South Australia Department of State Development (2016a). The facts about uranium mining in South
Australia, available at: http://www.statedevelopment.sa.gov.au/resources/the-facts/the-facts-about-uranium-
mining-in-south-australia.
South Australia Department of State Development (2016b). Copper, available at:
http://www.minerals.statedevelopment.sa.gov.au/invest/mineral_commodities/copper.

Mining and METS: engines of economic growth and prosperity for Australians
South Australia in focus: fact sheet
Limitation of our work
General use restriction
This report is prepared solely for the use of the Minerals Council of Australia. This report is not intended to and
should not be used or relied upon by anyone else and we accept no duty of care to any other person or entity.
The report has been prepared for the purpose of analysing the economic importance of the mining and METS
sector in Australia and South Australia. You should not refer to or use our name or the advice for any other
purpose
Contact us
Deloitte Access Economics
ACN: 149 633 116
550 Bourke Street
Melbourne VIC 3000
Tel: +61 3 9671 7000
Deloitte Access Economics is Australia’s pre-eminent economics advisory practice and a member of Deloitte's global economics
group. For more information, please visit our website
www.deloitte.com/au/deloitte-access-economics
Deloitte refers to one or more of Deloitte Touche Tohmatsu Limited, a UK private company limited by guarantee, and its network
of member firms, each of which is a legally separate and independent entity. Please see www.deloitte.com/au/about for a
detailed description of the legal structure of Deloitte Touche Tohmatsu Limited and its member firms.
The entity named herein is a legally separate and independent entity. In providing this document, the author only acts in the
named capacity and does not act in any other capacity. Nothing in this document, nor any related attachments or
communications or services, have any capacity to bind any other entity under the ‘Deloitte’ network of member firms (including
those operating in Australia).
About Deloitte
Deloitte provides audit, tax, consulting, and financial advisory services to public and private clients spanning multiple industries.
With a globally connected network of member firms in more than 150 countries, Deloitte brings world-class capabilities and high-
quality service to clients, delivering the insights they need to address their most complex business challenges. Deloitte's
approximately 200,000 professionals are committed to becoming the standard of excellence.
About Deloitte Australia
In Australia, the member firm is the Australian partnership of Deloitte Touche Tohmatsu. As one of Australia’s leading
professional services firms. Deloitte Touche Tohmatsu and its affiliates provide audit, tax, consulting, and financial advisory
services through approximately 6000 people across the country. Focused on the creation of value and growth, and known as an
employer of choice for innovative human resources programs, we are dedicated to helping our clients and our people excel. For
more information, please visit our web site at www.deloitte.com.au.
Liability limited by a scheme approved under Professional Standards Legislation.
Member of Deloitte Touche Tohmatsu Limited
© 2017 Deloitte Touche Tohmatsu

Mining and METS: engines of economic growth and prosperity for Australians
Mining and METS: engines of
economic growth and prosperity
for Australians Northern Territory in focus: fact sheet Prepared for the Minerals Council of Australia, 2017

Mining and METS: engines of economic growth and prosperity for Australians
Northern Territory in focus: fact sheet
Overview The mining sector has long made – and continues to make – a significant contribution to Australia’s economic
growth and development. The Australian mining industry uses sophisticated production techniques and highly
skilled labour to make the most of Australia’s comparative advantage in mineral endowments. The supporting
activities of the mining equipment, technology and services (METS) sector add further to Australia’s national
income and employment.
The Australian economy continues to enjoy the fruits of the latest mining boom that began in 2003. A sharp
increase in commodity prices was followed by unprecedented investment in new mines, equipment and
infrastructure – at its peak in 2012, resources investment accounted for 60% of total investment in Australia
(including investment in both the mining and oil and gas sectors).
This growth in mining capacity underpins the current production phase of the mining boom, in which rising
export volumes support a range of manufacturing and service activities across Australia. Minerals and energy
exports are the primary source of Australia’s export earnings, accounting for 64% of merchandise exports by
value in 2015-16 (DIIS, 2016).
In its national report Mining and METS: engines of economic growth and prosperity for Australians, Deloitte
Access Economics estimated the total economic contribution of the mining and METS sector to Australia’s
gross domestic product (GDP) by using an input-output modelling framework in order to capture all mining
and METS activities. This economic analysis applies a similar approach to the methodology used in the RBA’s
2013 Research Discussion Paper Industry Dimensions of the Resource Boom: An Input-Output Analysis.
Overall, Deloitte Access Economics estimates that the direct economic contribution of mining and METS
activities was $133.2 billion in value added in 2015-16, with 484,114 full-time equivalent (FTE) jobs directly
supported by the sector.1 This figure represents the ‘economic footprint’ attributable directly to the mining and
METS sector in the Australian economy.
In addition to this direct economic contribution, the mining and METS sector depends on outputs from other
industries in the Australian economy, such as petroleum, electricity and manufacturing, as inputs to
production. This indirectly generates economic activity by facilitating production and paying wages and profits
in these other industries. This indirect economic contribution added a further $103.6 billion in 2015-16,
supporting another 655,654 FTE jobs.
1 The value added by an industry is the value of its output, less the value of intermediate inputs used to produce this output (as these represent outputs of other industries). It is important to note that GDP adds up value added by industry, not the
value of industry output or sales. Accordingly, the economic contribution of an industry must be distinguished from its total revenue and total exports, which do not discount inputs supplied by other industries or economies.
The total economic contribution of Australia’s mining and METS sector in 2015-16 was $236.8 billion,
representing around 15% of the Australian economy. This economic activity supported a total of
1,139,768 FTE jobs across Australia, which represents around 10% of total FTE employment.

Mining and METS: engines of economic growth and prosperity for Australians
Northern Territory in focus: fact sheet
Economic contribution in the Northern
Territory The mining and METS sector represents an important source of economic activity in the Northern Territory.
Key minerals for the Territory include bauxite, gold, manganese, zinc-lead and phosphate. The mining industry
alone is the second largest industry in the Territory, having grown rapidly since the late 1990s (Department of
Mines and Energy, 2015).
The expansion of the resources sector in the Northern Territory through increased mining and METS activity is
and will continue to be a key driver of economic growth and development in northern Australia more broadly.
Deloitte Access Economics estimates that in the Northern Territory, the mining and METS sector directly
contributed $1.7 billion in value added to the territory’s economy in 2015-16, and supported around 13,500
FTE jobs (see table below). The indirect economic contribution to the Northern Territory is estimated to be
$1.5 billion, supporting approximately 10,000 jobs in FTE terms.
Overall, the total direct and indirect contribution of $3.2 billion in value added represented 10% of economic
activity in the Northern Territory in 2015-16.
Economic contribution of mining and METS sector in the Northern Territory, 2015-16
Direct contribution Indirect contribution Total contribution
Value added ($m) 1,747 1,450 3,198
Employment (FTE) 13,478 9,980 23,459
Source: Deloitte Access Economics (2017)
References Deloitte Access Economics (2017). Mining and METS: engines of economic growth and prosperity for
Australians, available at: https://www2.deloitte.com/au/en/pages/economics/articles/mining-mets-economic-
growth-prosperity-engines.html.
Department of Industry, Innovation and Science [DIIS] (2016). Resources and Energy Quarterly: Historical
data – September 2016, released on 7 October 2016, Canberra.
Northern Territory Department of Mines and Energy (2015). Annual Report 2014-15, available at:
https://minerals.nt.gov.au/__data/assets/pdf_file/0006/258936/DME-Annual-Report-14_15_Final.pdf.

Mining and METS: engines of economic growth and prosperity for Australians
Northern Territory in focus: fact sheet
Limitation of our work
General use restriction
This report is prepared solely for the use of the Minerals Council of Australia. This report is not intended to and
should not be used or relied upon by anyone else and we accept no duty of care to any other person or entity.
The report has been prepared for the purpose of analysing the economic importance of the mining and METS
sector in Australia and the Northern Territory. You should not refer to or use our name or the advice for any
other purpose
Contact us
Deloitte Access Economics
ACN: 149 633 116
550 Bourke Street
Melbourne VIC 3000
Tel: +61 3 9671 7000
Deloitte Access Economics is Australia’s pre-eminent economics advisory practice and a member of Deloitte's global economics
group. For more information, please visit our website
www.deloitte.com/au/deloitte-access-economics
Deloitte refers to one or more of Deloitte Touche Tohmatsu Limited, a UK private company limited by guarantee, and its network
of member firms, each of which is a legally separate and independent entity. Please see www.deloitte.com/au/about for a
detailed description of the legal structure of Deloitte Touche Tohmatsu Limited and its member firms.
The entity named herein is a legally separate and independent entity. In providing this document, the author only acts in the
named capacity and does not act in any other capacity. Nothing in this document, nor any related attachments or
communications or services, have any capacity to bind any other entity under the ‘Deloitte’ network of member firms (including
those operating in Australia).
About Deloitte
Deloitte provides audit, tax, consulting, and financial advisory services to public and private clients spanning multiple industries.
With a globally connected network of member firms in more than 150 countries, Deloitte brings world-class capabilities and high-
quality service to clients, delivering the insights they need to address their most complex business challenges. Deloitte's
approximately 200,000 professionals are committed to becoming the standard of excellence.
About Deloitte Australia
In Australia, the member firm is the Australian partnership of Deloitte Touche Tohmatsu. As one of Australia’s leading
professional services firms. Deloitte Touche Tohmatsu and its affiliates provide audit, tax, consulting, and financial advisory
services through approximately 6000 people across the country. Focused on the creation of value and growth, and known as an
employer of choice for innovative human resources programs, we are dedicated to helping our clients and our people excel. For
more information, please visit our web site at www.deloitte.com.au.
Liability limited by a scheme approved under Professional Standards Legislation.
Member of Deloitte Touche Tohmatsu Limited
© 2017 Deloitte Touche Tohmatsu