MINERAL- AND ENERGY-RESOURCE POTENTIAL FOR PERSHING...
1
OPEN-FILE REPORT 06-6 NEVADA BUREAU OF MINES AND GEOLOGY References and additional information Map 3. Cox, D.P., Ludington, S., Berger, B.R., Moring, B.C., Sherlock, M.G., Singer, D.A., and Tingley, J.V., 1996b, Tracts Permissive for Epithermal Deposits, Plate 12-2; in An Analysis of Nevada's Metal-Bearing Mineral Resources: Nevada Bureau of Mines and Geology Open-File Report 96-2, ftp://comstock.nbmg.unr.edu/pub/dox/ ofr962/index.htm. This GIS data layer is available with NBMG Report 51 (www.nbmg.unr.edu/dox/r51.zip, Figure 11). Map 4. Cox, D.P., Ludington, S., Berger, B.R., Moring, B.C., Sherlock, M.G., Singer, D.A., and Tingley, J.V., 1996, Tracts Permissive for Pluton-Related Deposits, Plate 12-1; in An Analysis of Nevada's Metal-Bearing Mineral Resources: Nevada Bureau of Mines and Geology Open-File Report 96-2, ftp://comstock.nbmg.unr.edu/pub/dox/ ofr962/index.htm. This GIS data layer is available with NBMG Report 51 (www.nbmg.unr.edu/dox/r51.zip, Figure 12). Map 5. Cox, D.P., Ludington, S., Berger, B.R., Moring, B.C., Sherlock, M.G., Singer, D.A., and Tingley, J.V., 1996c, Tracts Permissive for Deposit Types not Directly Related to Plutonic Activity, Plate 12-3; in An Analysis of Nevada's Metal-Bearing Mineral Resources: Nevada Bureau of Mines and Geology Open-File Report 96-2, ftp://comstock.nbmg.unr.edu/pub/dox/ofr962/index.htm. This GIS data layer is available in NBMG Report 51 (www.nbmg.unr.edu/dox/r51.zip, Figure 13). Map 6. This GIS data layer is available in NBMG Report 51 (Figure 14). Map 7. Price, J.G., Hess, R.H., Fitch, S., Faulds, J.E., Garside, L.J., Shevenell, L., and Warren, S., 2005, Preliminary assessment of the potential for carbon dioxide disposal by sequestration in geological settings in Nevada: Nevada Bureau of Mines and Geology Report 51, 35 p. (www.nbmg.unr.edu/dox/r51.zip, Figure 19) Map 8. Coolbaugh, M., Zehner, R., Kreemer, C., Blackwell, D., Oppliger, G., Sawatzky, D., Blewitt, G., Pancha, A., Richards, M., Helm-Clark, C., Shevenell, L., Raines, G., Johnson, G., Minor, T., and Boyd, T., 2005, Geothermal potential map of the Great Basin, western United States: Nevada Bureau of Mines and Geology Map 151 (www.nbmg.unr.edu/dox/m151/m151plate.pdf). While high-temperature geothermal activity is possible in all parts of the State of Nevada, not all are favorable for resource development. Map 8 shows areas that are considered at least marginally favorable for geothermal resource development in Pershing County. GIS data can be found at www.unr.edu/geothermal. Map 9. Garside, L.J., Hess, R.H., Fleming, K.L., Weimer, B.S., 1988, Oil and gas developments in Nevada: Nevada Bureau of Mines and Geology Bulletin 104, 136 p. (www.nbmg.unr.edu/dox/b104.zip, Figure 3) Map 10. U.S. Department of Energy, National Renewable Energy Laboratory, http://www.eere.energy.gov/windandhydro/windpoweringamerica/maps_template .asp?stateab=nv. This map shows areas assessed as good (Class 4) to superb (Class 7) for wind-power generation at an elevation of 50 meters above the ground. Map 11. Kepner, W., Ramsey, D., Lowry, J., and others, 2005, Southwest Regional GAP Analysis Project Final Report, Remote Sensing/GIS Laboratory, College of Natural Resources, Utah State University, 2005, www.epa.gov/esd/land- sci/nv_geospatial/pages/nvgeo_gis1_gap_2001.htm. This map, derived from a landcover map prepared for the U.S. Environmental Protection Agency as part of the Southwest ReGAP project, shows areas of pinyon-juniper woodlands in Nevada. Map 12. U.S. Department of Energy, National Renewable Energy Laboratory, http://www.nrel.gov/gis/solar.html#collector. The average annual solar energy incidence throughout Pershing County exceeds 5.13 kilowatt-hours per square meter per day, the mean value for the conterminous United States. Map 13. U.S. Bureau of Land Management, 2005, www.nv.blm.gov/gis/geospatial_data.htm. This map shows privately owned lands (plotted from nv_landowner1105.zip) and those lands administered by the Bureau of Land Management that have been identified as suitable to be considered for disposal (plotted from nv_disposal _20050505.zip, which includes some that may no longer be available). This map is intended to be used for reference only, not for determination of land ownership. Table 1. Areas favorable for mineral and energy resources within proposed land withdrawals. Geothermal Oil Wind Biomass Solar Area (See Map 1) Map 3 Map 4 Map 5 Map 6 Map 7 Map 8 Map 9 Map 10 Map 11 Map 12 A Mt Limbo Yes Yes Yes Yes Yes Yes Very Low Yes Yes Yes B Bluewing Mountains Yes Yes Yes Yes Yes Yes Very Low Yes Yes Yes C North Sahwave Mountains Yes Yes Yes Yes Yes Yes Very Low Yes Yes Yes D Fencemaker Yes Yes Yes Yes Yes Yes Low Yes Yes Yes E Tobin Crest Yes Yes Yes Yes Yes Yes Low Yes Yes Yes Mineral NEVADA BUREAU OF MINES AND GEOLOGY MACKAY SCHOOL OF EARTH SCIENCES AND ENGINEERING UNIVERSITY OF NEVADA, RENO The information displayed on this poster should be considered preliminary; it has not been thoroughly edited or checked for accuracy. Edited by: Dick Meeuwig Layout by: Jennifer Mauldin Printed by: Nevada Bureau of Mines and Geology on July 7, 2006 Nevada Bureau of Mines and Geology University of Nevada, Mail Stop 178 Reno, Nevada 89557-0088 (775)784-6691, ext. 2 www.nbmg.unr.edu; [email protected] Washoe Storey Carson City Douglas Mineral Esmeralda Nye Lincoln Clark Lyon Pershing Humboldt Elko White Pine Eureka Lander Churchill Map 13. Existing private land (yellow) and BLM land suitable for disposal (blue). Map 12. Pershing County exceeds the average annual solar energy incidence of the conterminous United States. Map 10. U.S. Department of Energy assessment of areas favorable for wind-energy development (red). Map 9. Areas with very low (white) and low (gray) potential for petroleum. (No areas on this map have medium or high potential.) Map 8. NBMG assessment of areas of greatest potential for geothermal development (red). Map 7. NBMG assessment of areas likely to experience mineral- resource development (red). Map 6. Areas where the geologic setting could host metal-bearing mineral resources, derived by combining Maps 3, 4, and 5 (red). Map 5. Areas where the geologic setting could host deposit types not related to plutonic activity (red). Map 4. Areas where the geologic setting could host pluton-related deposits (red). Map 3. Areas where the geologic setting could host epithermal deposits (red). Map 2. Proposals for wilderness (black outlines), Black Rock National Conservation Area (beige), and BLM Wilderness Study Areas (brown). E C B D A Map 1. Location map showing proposals for wilderness (black outlines) and Black Rock National Conservation Area (beige) in Pershing County. This poster illustrates where proposed land withdrawals in Pershing County coincide with areas of mineral- and energy-resource potential as determined in assessments made by the U.S. Geological Survey (USGS), the Nevada Bureau of Mines and Geology (NBMG), and others. Maps 3, 4, and 5 are from USGS assessments of favorable tracts for three broad types of metallic ore deposits, and Map 6 is a composite of these three maps. Map 7 is from an NBMG assessment of metallic and non-metallic mineral resources. Map 8 is an NBMG evaluation of geothermal resource potential. Map 9 is from an NBMG assessment of potential for discovery of petroleum resources. Maps 10, 11, and 12 illustrate potential for wind, biomass, and solar energy use. Map 13 illustrates private land parcels overlain by federal lands that the U.S. Bureau of Land Management (BLM) considers suitable for disposal. The table indicates which resources are likely to occur in each of the proposed areas of land withdrawal. This poster is available in PDF format at www.nbmg.unr.edu under online documents, Open-File Report 06-6. This information is provided by the Nevada Bureau of Mines and Geology (Jonathan G. Price, Larry J. Garside, Ronald H. Hess, Lisa Shevenell, John Muntean) and the Nevada Division of Minerals (Christy Morris, Alan Coyner) to assist in factoring mineral- and energy-resource potential into decisions regarding land withdrawals and future economic development. MINERAL- AND ENERGY-RESOURCE POTENTIAL FOR PERSHING COUNTY, NEVADA Geothermal Minerals Petroleum Biomass Fuel Wind Energy Minerals Solar Energy
Transcript of MINERAL- AND ENERGY-RESOURCE POTENTIAL FOR PERSHING...
OPEN-FILE REPORT 06-6NEVADA BUREAU OF MINES AND GEOLOGY
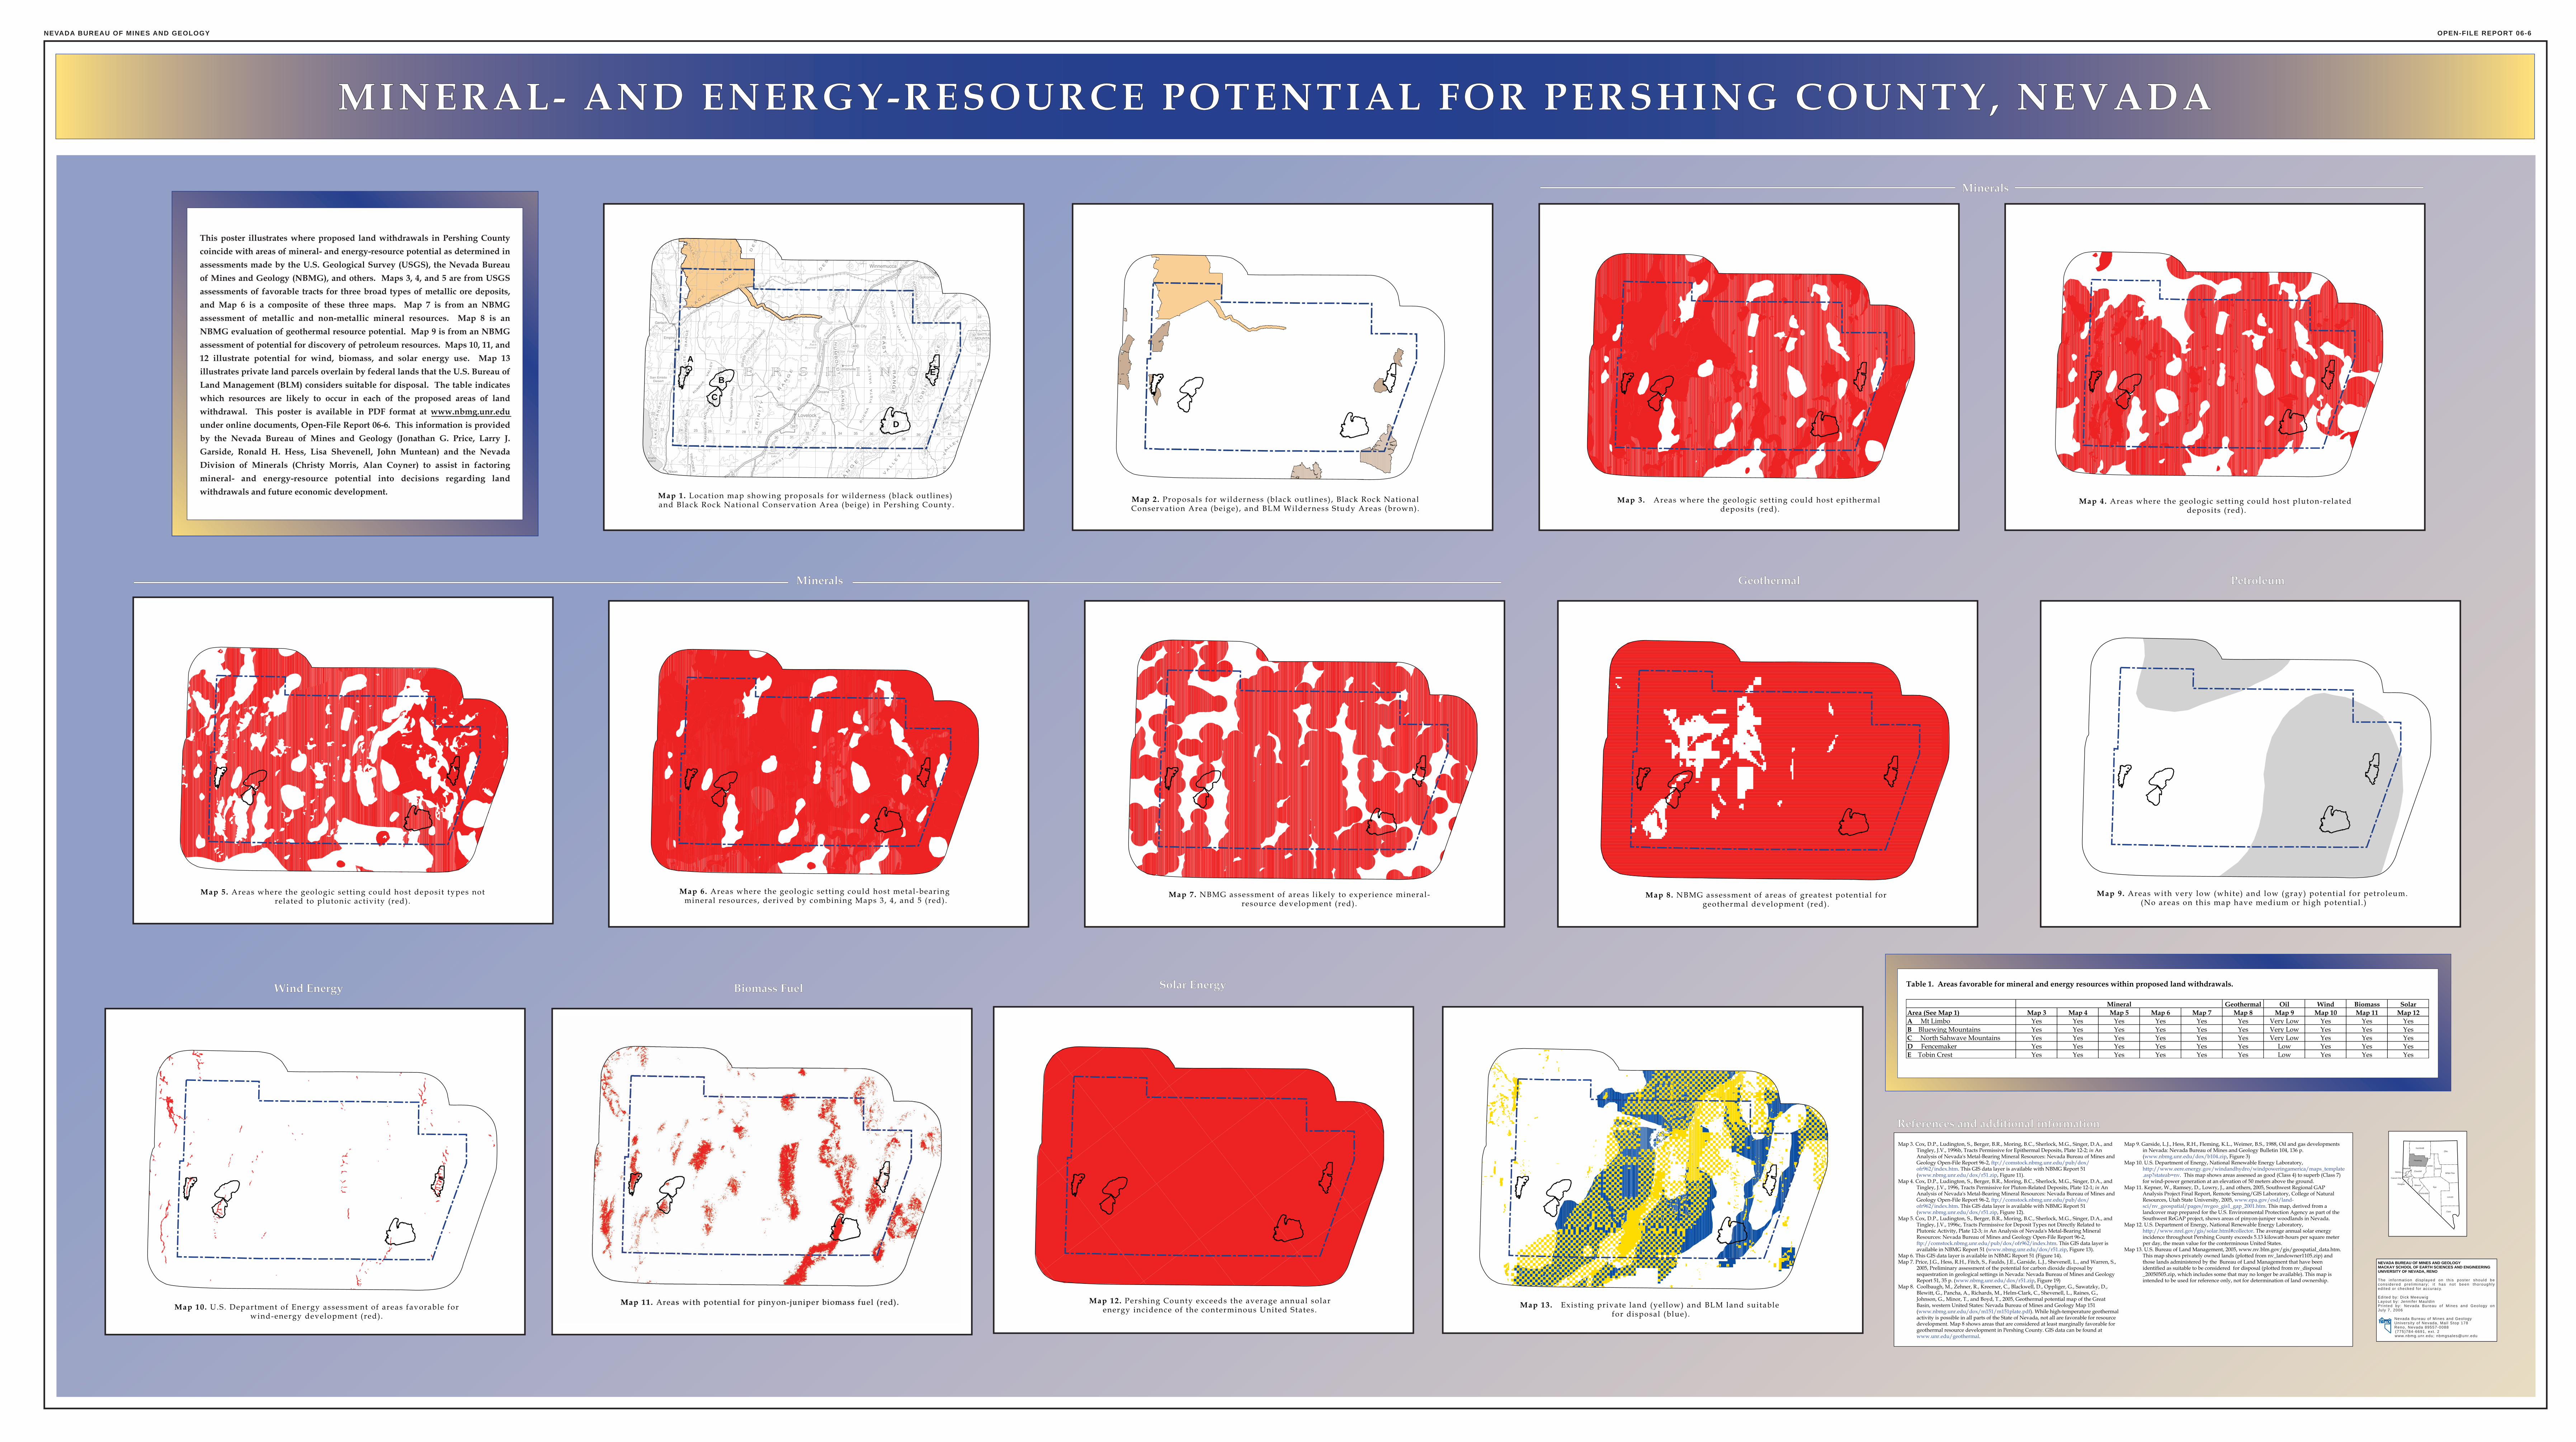
References and additional informationMap 3. Cox, D.P., Ludington, S., Berger, B.R., Moring, B.C., Sherlock, M.G., Singer, D.A., and
Tingley, J.V., 1996b, Tracts Permissive for Epithermal Deposits, Plate 12-2; in An Analysis of Nevada's Metal-Bearing Mineral Resources: Nevada Bureau of Mines and Geology Open-File Report 96-2, ftp://comstock.nbmg.unr.edu/pub/dox/
ofr962/index.htm. This GIS data layer is available with NBMG Report 51 (www.nbmg.unr.edu/dox/r51.zip, Figure 11).
Map 4. Cox, D.P., Ludington, S., Berger, B.R., Moring, B.C., Sherlock, M.G., Singer, D.A., and Tingley, J.V., 1996, Tracts Permissive for Pluton-Related Deposits, Plate 12-1; in An Analysis of Nevada's Metal-Bearing Mineral Resources: Nevada Bureau of Mines and Geology Open-File Report 96-2, ftp://comstock.nbmg.unr.edu/pub/dox/
ofr962/index.htm. This GIS data layer is available with NBMG Report 51 (www.nbmg.unr.edu/dox/r51.zip, Figure 12).
Map 5. Cox, D.P., Ludington, S., Berger, B.R., Moring, B.C., Sherlock, M.G., Singer, D.A., and Tingley, J.V., 1996c, Tracts Permissive for Deposit Types not Directly Related to Plutonic Activity, Plate 12-3; in An Analysis of Nevada's Metal-Bearing Mineral Resources: Nevada Bureau of Mines and Geology Open-File Report 96-2, ftp://comstock.nbmg.unr.edu/pub/dox/ofr962/index.htm. This GIS data layer is available in NBMG Report 51 (www.nbmg.unr.edu/dox/r51.zip, Figure 13).
Map 6. This GIS data layer is available in NBMG Report 51 (Figure 14).Map 7. Price, J.G., Hess, R.H., Fitch, S., Faulds, J.E., Garside, L.J., Shevenell, L., and Warren, S.,
2005, Preliminary assessment of the potential for carbon dioxide disposal by sequestration in geological settings in Nevada: Nevada Bureau of Mines and Geology Report 51, 35 p. (www.nbmg.unr.edu/dox/r51.zip, Figure 19)
Map 8. Coolbaugh, M., Zehner, R., Kreemer, C., Blackwell, D., Oppliger, G., Sawatzky, D., Blewitt, G., Pancha, A., Richards, M., Helm-Clark, C., Shevenell, L., Raines, G., Johnson, G., Minor, T., and Boyd, T., 2005, Geothermal potential map of the Great Basin, western United States: Nevada Bureau of Mines and Geology Map 151 (www.nbmg.unr.edu/dox/m151/m151plate.pdf). While high-temperature geothermal activity is possible in all parts of the State of Nevada, not all are favorable for resource development. Map 8 shows areas that are considered at least marginally favorable for geothermal resource development in Pershing County. GIS data can be found at www.unr.edu/geothermal.
Map 9. Garside, L.J., Hess, R.H., Fleming, K.L., Weimer, B.S., 1988, Oil and gas developments in Nevada: Nevada Bureau of Mines and Geology Bulletin 104, 136 p. (www.nbmg.unr.edu/dox/b104.zip, Figure 3)
Map 10. U.S. Department of Energy, National Renewable Energy Laboratory, http://www.eere.energy.gov/windandhydro/windpoweringamerica/maps_template.asp?stateab=nv. This map shows areas assessed as good (Class 4) to superb (Class 7) for wind-power generation at an elevation of 50 meters above the ground.
Map 11. Kepner, W., Ramsey, D., Lowry, J., and others, 2005, Southwest Regional GAP Analysis Project Final Report, Remote Sensing/GIS Laboratory, College of Natural Resources, Utah State University, 2005, www.epa.gov/esd/land-sci/nv_geospatial/pages/nvgeo_gis1_gap_2001.htm. This map, derived from a landcover map prepared for the U.S. Environmental Protection Agency as part of the Southwest ReGAP project, shows areas of pinyon-juniper woodlands in Nevada.
Map 12. U.S. Department of Energy, National Renewable Energy Laboratory, http://www.nrel.gov/gis/solar.html#collector. The average annual solar energy incidence throughout Pershing County exceeds 5.13 kilowatt-hours per square meter per day, the mean value for the conterminous United States.
Map 13. U.S. Bureau of Land Management, 2005, www.nv.blm.gov/gis/geospatial_data.htm. This map shows privately owned lands (plotted from nv_landowner1105.zip) and those lands administered by the Bureau of Land Management that have been identified as suitable to be considered for disposal (plotted from nv_disposal
_20050505.zip, which includes some that may no longer be available). This map is intended to be used for reference only, not for determination of land ownership.
Table 1. Areas favorable for mineral and energy resources within proposed land withdrawals.
Geothermal Oil Wind Biomass SolarArea (See Map 1) Map 3 Map 4 Map 5 Map 6 Map 7 Map 8 Map 9 Map 10 Map 11 Map 12A Mt Limbo Yes Yes Yes Yes Yes Yes Very Low Yes Yes YesB Bluewing Mountains Yes Yes Yes Yes Yes Yes Very Low Yes Yes YesC North Sahwave Mountains Yes Yes Yes Yes Yes Yes Very Low Yes Yes YesD Fencemaker Yes Yes Yes Yes Yes Yes Low Yes Yes YesE Tobin Crest Yes Yes Yes Yes Yes Yes Low Yes Yes Yes
Mineral
NEVADA BUREAU OF MINES AND GEOLOGYMACKAY SCHOOL OF EARTH SCIENCES AND ENGINEERINGUNIVERSITY OF NEVADA, RENO
The in format ion d isp layed on th is poster shou ld be cons idered pre l im inary ; i t has not been thorough ly edi ted or checked for accuracy.
Edi ted by: Dick MeeuwigLayout by: Jenni fer MauldinPr inted by: Nevada Bureau of Mines and Geology on July 7, 2006
Nevada Bureau of Mines and GeologyUniversi ty of Nevada, Mai l Stop 178Reno, Nevada 89557-0088 (775)784-6691, ext . 2 www.nbmg.unr.edu; [email protected]
Washoe
Storey
Carson City
Douglas Mineral
Esmeralda
Nye
Lincoln
Clark
Lyon
Pershing
HumboldtElko
White Pine
EurekaLander
Churchill
Map 13. Exist ing private land (yellow) and BLM land suitable for disposal (blue) .
Map 12. Pershing County exceeds the average annual solarenergy incidence of the conterminous United States.Map 10. U.S. Department of Energy assessment of areas favorable for
wind-energy development (red).
Map 9. Areas with very low (white) and low (gray) potential for petroleum. (No areas on this map have medium or high potential . )
Map 8. NBMG assessment of areas of greatest potential forgeothermal development (red).
Map 7. NBMG assessment of areas l ikely to experience mineral-resource development (red).
Map 6. Areas where the geologic sett ing could host metal-bearing mineral resources, derived by combining Maps 3, 4 , and 5 (red).
Map 5. Areas where the geologic sett ing could host deposit types notrelated to plutonic activity (red).
Map 4. Areas where the geologic sett ing could host pluton-related deposits (red).
Map 3. Areas where the geologic sett ing could host epithermal deposits (red).
Map 2. Proposed land withdrawals (black outl ines) , U.S. ForestService roadless areas (yellow), current wilderness
areas (green), BLM Wilderness Study Areas (brown),and Great Basin National Park (blue) .
Map 2. Proposals for wilderness (black outl ines) , Black Rock NationalConservation Area (beige) , and BLM Wilderness Study Areas (brown).
E
C
B
D
A
Map 1. Location map showing proposals for wilderness (black outl ines) and Black Rock National Conservation Area (beige) in Pershing County.
This poster illustrates where proposed land withdrawals in Pershing County coincide with areas of mineral- and energy-resource potential as determined in assessments made by the U.S. Geological Survey (USGS), the Nevada Bureau of Mines and Geology (NBMG), and others. Maps 3, 4, and 5 are from USGS assessments of favorable tracts for three broad types of metallic ore deposits, and Map 6 is a composite of these three maps. Map 7 is from an NBMG assessment of metallic and non-metallic mineral resources. Map 8 is an NBMG evaluation of geothermal resource potential. Map 9 is from an NBMG assessment of potential for discovery of petroleum resources. Maps 10, 11, and 12 illustrate potential for wind, biomass, and solar energy use. Map 13 illustrates private land parcels overlain by federal lands that the U.S. Bureau of Land Management (BLM) considers suitable for disposal. The table indicates which resources are likely to occur in each of the proposed areas of land withdrawal. This poster is available in PDF format at www.nbmg.unr.edu under online documents, Open-File Report 06-6. This information is provided by the Nevada Bureau of Mines and Geology (Jonathan G. Price, Larry J. Garside, Ronald H. Hess, Lisa Shevenell, John Muntean) and the Nevada Division of Minerals (Christy Morris, Alan Coyner) to assist in factoring mineral- and energy-resource potential into decisions regarding land withdrawals and future economic development.
MINERAL- AND ENERGY-RESOURCE POTENTIAL FOR PERSHING COUNTY, NEVADA
GeothermalMinerals Petroleum
Biomass FuelWind Energy
Minerals
Solar Energy