The Starfish System: Providing Intrusion Detection and Intrusion

Chapter 3
MINDS - Minnesota IntrusionDetection System
Levent Ertoz�, Eric Eilertson
�, Aleksandar Lazarevic
�,
Pang-Ning Tan�, Vipin Kumar
� �, Jaideep Srivastava
� �, Paul
Dokas��
Department of Computer Science, University of Minnesota�Army High Performance Computing and Research Center (AHPCRC), Minnesota
Abstract:This paper introduces the Minnesota Intrusion Detection System (MINDS), which usesa suite of data mining techniques to automatically detect attacks against computer net-works and systems. While the long-term objective of MINDS is to address all aspectsof intrusion detection, this paper focuses on two specific contributions: (i) an unsuper-vised anomaly detection technique that assigns a score to each network connection thatreflects how anomalous the connection is, and (ii) an association pattern analysis basedmodule that summarizes those network connections that are ranked highly anomalousby the anomaly detection module. Experimental results on live network traffic at theUniversity of Minnesota show that our anomaly detection techniques are very promis-ing and are successful in automatically detecting several novel intrusions that couldnot be identified using popular signature-based tools such as SNORT. Furthermore,given the very high volume of connections observed per unit time, association patternbased summarization of novel attacks is quite useful in enabling a security analyst tounderstand and characterize emerging threats.
1

2 CHAPTER THREE
Keywords: network intrusion detection, novel attacks, anomaly / outlier detection, as-sociation pattern analysis
3.1 Introduction
Traditional methods for intrusion detection are based on extensive knowledge of attacksignatures that are provided by human experts. The signature database has to be man-ually revised for each new type of intrusion that is discovered. A significant limitationof signature-based methods is that they cannot detect novel attacks. In addition, once anew attack is discovered and its signature developed, often there is a substantial latencyin its deployment. These limitations have led to an increasing interest in intrusion de-tection techniques based upon data mining [3, 4, 20, 23, 25], which generally fall intoone of two categories: misuse detection and anomaly detection.
In misuse detection, each instance in a data set is labeled as ‘normal’ or ‘intrusive’and a learning algorithm is trained over the labeled data. Research in misuse detec-tion has focused mainly on detecting network intrusions using various classificationalgorithms [3, 7, 11, 20, 22, 23], rare class predictive models [13–16, 18], associationrules [3, 20, 25] and cost sensitive modeling [10, 14]. Unlike signature-based intrusiondetection systems, models of misuse are created automatically, and can be more sophis-ticated and precise than manually created signatures. In spite of the fact that misusedetection models have high degree of accuracy in detecting known attacks and theirvariations, their obvious drawback is the inability to detect attacks whose instanceshave not yet been observed. In addition, labeling data instances as normal or intrusivemay require enormous time for many human experts.
Anomaly detection algorithms build models of normal behavior and automaticallydetect any deviation from it [8,12]. The major benefit of anomaly detection algorithmsis their ability to potentially detect unforeseen attacks. In addition, they may be ableto detect new or unusual, but non-intrusive, network behavior that is of interest to anetwork manager. A major limitation of anomaly detection systems is a possible highfalse alarm rate. There are two major categories of anomaly detection techniques,namely supervised and unsupervised. In supervised anomaly detection, given a setof normal data to train on, and given a new set of test data, the goal is to determinewhether the test data is ‘normal’ or anomalous. Recently, there have been severalefforts in designing supervised network-based anomaly detection algorithms, such asADAM [3], PHAD [24], NIDES [2], and other techniques that use neural networks[27], information theoretic measures [21], network activity models [6], etc. Unlikesupervised anomaly detection where the models are built only according to the normalbehavior on the network, unsupervised anomaly detection attempts to detect anomalousbehavior without using any knowledge about the training data. Unsupervised anomalydetection approaches are based on statistical approaches [29, 31, 32], clustering [9],outlier detection schemes [1, 5, 17, 26], state machines [28], etc.
This paper introduces the Minnesota Intrusion Detection System (MINDS), whichuses a suite of data mining techniques to automatically detect attacks against com-puter networks and systems. While the long-term objective of MINDS is to address all

AUTHOR 3
aspects of intrusion detection, in this paper we present details of two specific contri-butions: (i) an unsupervised anomaly detection technique that assigns a score to eachnetwork connection that reflects how anomalous the connection is, and (ii) an associa-tion pattern analysis based module that summarizes those network connections that areranked highly anomalous by the anomaly detection module.
We also provide an evaluation of our anomaly detection and association summa-rization schemes in the context of real life network data at the University of Minnesota.In the absence of labels of network connections (normal vs. intrusive), we are unableto provide any estimate of detection rate, but nearly all connections that are rankedhighly by our anomaly detection algorithms are found to be interesting by the networksecurity analyst on our team. In particular, during the past few months our techniqueshave been successful in automatically detecting several novel intrusions. In fact, manyof these attacks have been reported on the CERT/CC (Computer Emergency ResponseTeam/Coordination Center) list of recent advisories and incident notes. Finally, exper-iments on real network data demonstrate that association pattern analysis is successfulin creating useful summaries of many novel attacks detected by our anomaly detectionalgorithms.
3.2 The MINDS project
The Minnesota Intrusion Detection System (MINDS) is a data mining based system fordetecting network intrusions. Figure 3.1 illustrates the process of analyzing real net-work traffic data using the system. Input to MINDS is Netflow version 5 data collectedusing flow-tools [30]. Flow-tools only capture packet header information (i.e., it doesnot capture message content), and build one way sessions (flows). We are working withNetflow data instead of tcpdump data because we currently do not have the capacity tocollect and store the tcpdump. Netflow data for 10 minute windows, which typicallyresults in 1–2 million flows, are stored in flat files. The analyst uses MINDS to analyzethese 10-minute data files in a batch mode. The reason the system is running in a batchmode is not due to the time it takes to analyze these files, but because it is convenientfor the analyst to do so. Running the system on a 10-minute file takes less than 3minutes on a typical desktop computer. Before data is fed into the anomaly detectionmodule, a data filtering step is performed by the analyst to remove network traffic thatthe analyst is not interested in analyzing. For example, data filtered may include traf-fic from trusted sources or unusual/anomalous network behavior that is known to beintrusion free.
The first step in MINDS is extracting features that are used in the data mininganalysis. Basic features include source and destination IP addresses, source and desti-nation ports, protocol, flags, number of bytes and number of packets. Derived featuresinclude time-window and connection-windows based features. Time-window basedfeatures are constructed to capture connections with similar characteristics in the last�
seconds. These features are especially useful in separating sources of high volumeconnections per unit time from the rest of the traffic such as fast scanning activities. Asimilar approach was used for constructing features in KDD Cup’99 data [20]. Table3.1 summarizes the time-windows based features.

4 CHAPTER THREE
DataCaptureDevice
Storage
Network
FilteringFeature
ExtractionKnown Attack
Detection
AnomalyDetection
AnomalyScores
AssociationPatternAnalysis
Summary ofanomalies
Detected knownattacks
Analyst
Labels
The MINDS System
Figure 3.1: MINDS System
Table 3.1: Time-window based featuresFeature name Feature descriptioncount-dest Number of flows to unique destination IP addresses inside the
network in the last�
seconds from the same sourcecount-src Number of flows from unique source IP addresses inside the net-
work in the last�
seconds to the same destinationcount-serv-src Number of flows from the source IP to the same destination port
in the last�
secondscount-serv-dest Number of flows to the destination IP address using same source
port in the last�
seconds
“Slow” scanning activities, i.e., those that scan the hosts (or ports) and use a muchlarger time interval than a few seconds, e.g. one touch per minute or even one touch perhour, cannot be separated from the rest of the traffic using time-window based features.To do so, we also derive connection-window based features that capture similar char-acteristics of connections as time-window based features, but are computed using thelast � connections originating from (arriving at) distinct sources (destinations). Theconnection-window based features are shown in Table 3.2.
After the feature construction step, the known attack detection module is used todetect network connections that correspond to attacks for which signatures are avail-able, and then to remove them from further analysis. For results reported in this paper,this step is not performed.
Next, the data is fed into the MINDS anomaly detection module that uses an outlierdetection algorithm to assign an anomaly score to each network connection. A humananalyst then has to look at only the most anomalous connections to determine if theyare actual attacks or other interesting behavior.
MINDS association pattern analysis module summarizes network connections thatare ranked highly anomalous by the anomaly detection module. The analyst provides afeedback after analyzing the summaries created and decides whether these summariesare helpful in creating new rules that may be used in the known attack detection module.

AUTHOR 5
Table 3.2: Connection-window based featuresFeature name Feature description
count-dest-conn Number of flows to unique destination IP addresses in-side the network in the last � flows from the same source
count-src-conn Number of flows from unique source IP addresses insidethe network in the last � flows to the same destination
count-serv-src-conn Number of flows from the source IP to the same destina-tion port in the last � flows
count-serv-dest-conn Number of flows to the destination IP address using samesource port in the last � flows
3.3 MINDS Anomaly Detection Module
In this section, we only present the density based outlier detection scheme used in ouranomaly detection module. For more detailed overview of our research in anomalydetection, the reader is referred to [19].
MINDS anomaly detection module assigns a degree of being an outlier to eachdata point, which is called the local outlier factor (LOF) [5]. The outlier factor of adata point is local in the sense that it measures the degree of being an outlier withrespect to its neighborhood. For each data example, the density of the neighborhoodis first computed. The ���� of a specific data example represents the average of theratios of the density of the example and the density of its neighbors. To illustrate theadvantages of the LOF approach, consider a simple two-dimensional data set given inFigure 3.2. It is apparent that the density of cluster � � is significantly higher than thedensity of cluster � � . Due to the low density of cluster ��� , for most examples � insidecluster � � , the distance between the example � and its nearest neighbor is greater thanthe distance between the example � and its nearest neighbor, which is from cluster� � , and therefore example � will not be considered as outlier.
Hence, the simple nearest neighbor approach based on computing the distances failin these scenarios. However, the example � may be detected as an outlier using thedistances to the nearest neighbors. On the other hand, LOF is able to capture bothoutliers due to the fact that it considers the density around examples.
LOF requires the neighborhood around all data points be constructed. This in-volves calculating pairwise distances between all data points, which is an ����� ��� pro-cess, which makes it computationally infeasible for millions of data points. To addressthis problem, we sample a training set from the data and compare all data points tothis small set, which reduces the complexity to ����� ��� � where � is the size of thedata and � is the size of the sample. Apart from achieving computational efficiency bysampling, anomalous network behavior will not be able to match enough examples inthe sample to be called normal. This is because rare behavior will not be representedin the sample.

6 CHAPTER THREE
Figure 3.2: 2-D Outlier Example
3.4 Evaluation of MINDS Anomaly Detection Resultson Real Network Data
This section reports results of applying MINDS anomaly detection module on livenetwork traffic at the University of Minnesota. When describing results on real networkdata, we are not able to report the detection rate and false alarm rate due to difficulty inobtaining the complete labeling of network connections.
The University of Minnesota network security analyst has been using MINDS toanalyze the network traffic since August 2002. During this period, MINDS has beensuccessful in detecting many novel network attacks and emerging network behaviorthat could not be detected using signature based systems such as SNORT. In general,MINDS is able to routinely detect various suspicious behavior (e.g. policy violations),worms, as well as various scanning activities. In the following, we first show howthe analyst analyzes the output of the MINDS anomaly detection module on a specificdata set. We then follow with few examples of each of the different types of attacksidentified by MINDS.
Figure 3.3 shows top ranked connections produced by the MINDS anomaly de-tection module for a 10-minute window on January 27, 2 days after the Slammer/ Sapphire worm started. The output contains the original netflow data along withthe anomaly score and relative contributions of each of the 16 attributes used by theanomaly detection algorithm. Note that most of the top ranked connections shownbelong to the Slammer / Sapphire worm. This is despite the fact that for this periodnetwork connections due to the worm were only about 2% of the total traffic. Thisshows the effectiveness of the MINDS anomaly detection scheme in identifying con-nections due to worms. The connections due to the worm are highlighted in light gray.It can be observed that the highest contributions to the anomaly score for these connec-tions were due to features 9 and 11. This was due to the fact that the infected machinesoutside our network were still trying to communicate with many machines inside ournetwork. In Figure 3.3, it can also be observed that during this time interval, there isanother scanning activity (ping scan, highlighted in dark gray) that was detected mostlydue to features 9 and 11. The two non-shaded flows are replies from “half-life gameservers”, which were flagged anomalous since those machines were talking to only port27016/udp. For web connections, it is common to talk only on port 80, and it is wellrepresented in the normal sample. However, since half-life connections did not match

AUTHOR 7
Figure 3.3: Most anomalous connections found by the MINDS anomaly detection mod-ule in a 10-minute window, 2 days after the “slammer worm” started (January ������� ,2003)
any normal samples with high counts on feature 15, they became anomalous.Worm detection
� On October "! ��� 2002, our anomaly detection module detected two activitiesof the slapper worm that were not identified by SNORT since they were varia-tions of an existing worm code. Once a machine is infected with the worm, itcommunicates with other machines that are also infected and attempts to infectother machines. The most common version of the worm uses port 2002 for com-munication, but some variations use other ports. Our anomaly detector flaggedthese connections as anomalous for two reasons. First, the source or destina-tion ports used in the connection may not have been rare individually but thesource-destination port pairs were very rare (the anomaly detector does not keeptrack of the frequency of pairs of attributes; however, while building the neigh-borhoods of such connections, most of their neighbors will not have the samesource-destination port pairs, which will contribute to the distance). Second, thecommunication pattern of the worm looks like a slow scan causing the value ofthe variable that corresponds to the number of connections from the source IP tothe same destination port in the last � connections to become large. SNORT hasa rule for detecting worm that uses port 2002 (and a few other ports), but not forall possible variations. A single general SNORT rule can be written to detect thevariations of the worm at the expense of a higher false positive rate.
Scanning and DoS activities

8 CHAPTER THREE
� On August # ��� 2002, CERT/CC issued an alert for “widespread scanning andpossible denial of service activity targeted at the Microsoft-DS service on port445/TCP” as a novel Denial of Service (DoS) attack. In addition, CERT/CCalso expressed “interest in receiving reports of this activity from sites with de-tailed logs and evidence of an attack.” Network connections due to this typeof scanning were found to be the top ranked outliers on August "$ ��� , 2002, byour anomaly detection module in its regular analysis of University of Minnesotatraffic. The port scan module of SNORT could not detect this attack, since theport scanning was slow. A rule to catch this type of attack was added later inSeptember 2002.
� On August "$ ��� , 2002, our anomaly detection module detected “scanning for anOracle server” by ranking connections associated with this attack as the secondhighest ranked block of connections (top ranked block of connections belongedto the DoS activity targeted at the Microsoft-DS service on port 445/TCP). Thistype of attack is difficult to detect using other techniques, since the Oracle scanwas embedded within a much larger Web scan, and the alerts generated by Webscan could potentially overwhelm the analysts. On June "$ ��� , CERT/CC hadissued an alert for the attack.
Policy Violations
� On August % ��� and "! ��� 2002, our anomaly detection techniques detected a ma-chine running a Microsoft PPTP VPN server, and another one running a FTPserver on non-standard ports, which are policy violations. Both policy violationswere the top ranked outliers. Our anomaly detector module flagged these serversas anomalous since they are not allowed, and therefore very rare.
� On February &'��� , 2003, unsolicited ICMP echo reply messages to a computerpreviously infected with Stacheldract worm (a DDoS agent) were detected by ouranomaly detection techniques. Although the infected machine has been removedfrom the network, other infected machines outside our network were still tryingto talk to the previously infected machine from our network.
3.4.1 SNORT versus MINDS anomaly detection module
In this section, we present a comparison of MINDS and SNORT in terms of types ofattacks they are able to detect. Particularly, we compare their effectiveness on threecategories of anomalous network behavior:
� Content-based attacks
� Scanning activities
� Policy violations

AUTHOR 9
3.4.1.1 Content-based attacks
These attacks are out of scope for our anomaly detection module since the current ver-sion of MINDS does not make use of content based features. Therefore SNORT issuperior in identifying those attacks. However, SNORT is able to detect only thosecontent-based attacks that have known signatures/rules. Despite the fact that SNORTis more capable in detecting the content based attacks, it is important to note that oncea computer has been attacked successfully, its behavior could become anomalous andtherefore detected by our anomaly detection module, as seen in previous examples.This type of anomalous behavior will be further discussed in “policy violations” sec-tion.
3.4.1.2 Scanning activities
When detecting various scanning activities SNORT and MINDS anomaly detectionmodule may have similar performance for certain types of scans, but they have verydifferent detection capabilities for other types. In general there are two types of scans:inbound scans when an attacker outside the network is scanning for vulnerabilitieswithin the monitored network, and an outbound scan, when someone within the moni-tored network is scanning outside. There are two categories of inbound scanning activ-ities, where SNORT and our anomaly detection module might have different detectionperformance:
� Fast (regular) scans
� Slow scans
When detecting regular inbound scans from an outside source, SNORT portscanmodule keeps track of the number of destination IP addresses accessed by each sourceIP address in a given time window (default value is 3 seconds). Let’s denote thisvariable count-dest, already defined in Table 3.1. Whenever the value of count-destis above a specified threshold (SNORT default value is 4), SNORT raises an alarm,thus indicating a scan by the source IP address. Our anomaly detection module is alsoable to assign high anomaly score to such network connections, since for most normalconnections the value of count-dest is low. In addition, connections from many typesof scanning activities tend to have other features that are unusual (such as very smallpayload), which make additional contributions to the anomaly score.
An inbound scan can be detected by SNORT provided the scan is fast enough forchosen time window (default value is 3 seconds) and count threshold (default value is4). If a scanning activity is not fast enough (outside specified parameters), it will not bedetected by SNORT. However, SNORT can still detect such activities by increasing thetime window and/or decreasing the number of events counted within the time window,but this will tend to increase false alarm rate. On the other hand, our anomaly detectionmodule is more suitable for detecting slow scans since it considers both time-windowbased and connection-window based features (as opposed to SNORT that uses onlytime-window based features).
SNORT is unable to detect outbound scans simply because it does not examinethem. Contrary, our anomaly detection module is able to detect both inbound and
10 CHAPTER THREE
outbound scans. Reversing the inputs to the portscan module will allow SNORT todetect outbound scans as well. However, this will increase the memory requirements,and SNORT will still have the same problem with slow outbound scans as it has withslow inbound scans.
3.4.1.3 Policy violations
MINDS anomaly detection module is much more capable than SNORT in detectingpolicy violations (e.g. rogue and unauthorized services), since it looks for unusualnetwork behavior. SNORT may detect these policy violations only if it has a rule foreach of these specific activities. Since the number and variety of these activities canbe very large and unknown, it is not practical to incorporate them into SNORT forthe following reasons. First, processing of all these rules will require more processingtime thus causing the degradation in SNORT performance. It is important to note thatit is desirable for SNORT to keep the amount of analyzed network traffic small byincorporating as specific rules as possible. On the other hand, very specific rules limitthe generalization capabilities of a typical rule based system, i.e., minor changes in thecharacteristics of an attack might cause the attack to be undetected.
Second, SNORT’s static knowledge has to be manually updated by human ana-lysts each time a new suspicious behavior is detected. In contrast, MINDS anomalydetection module is adaptive in nature, and it is particularly successful in detectinganomalous behavior originating from a compromised machine (e.g. attacker breaksinto a machine, installs unauthorized software and uses it to launch attacks on othermachines). Such behavior is often undetected by SNORT’s signatures.
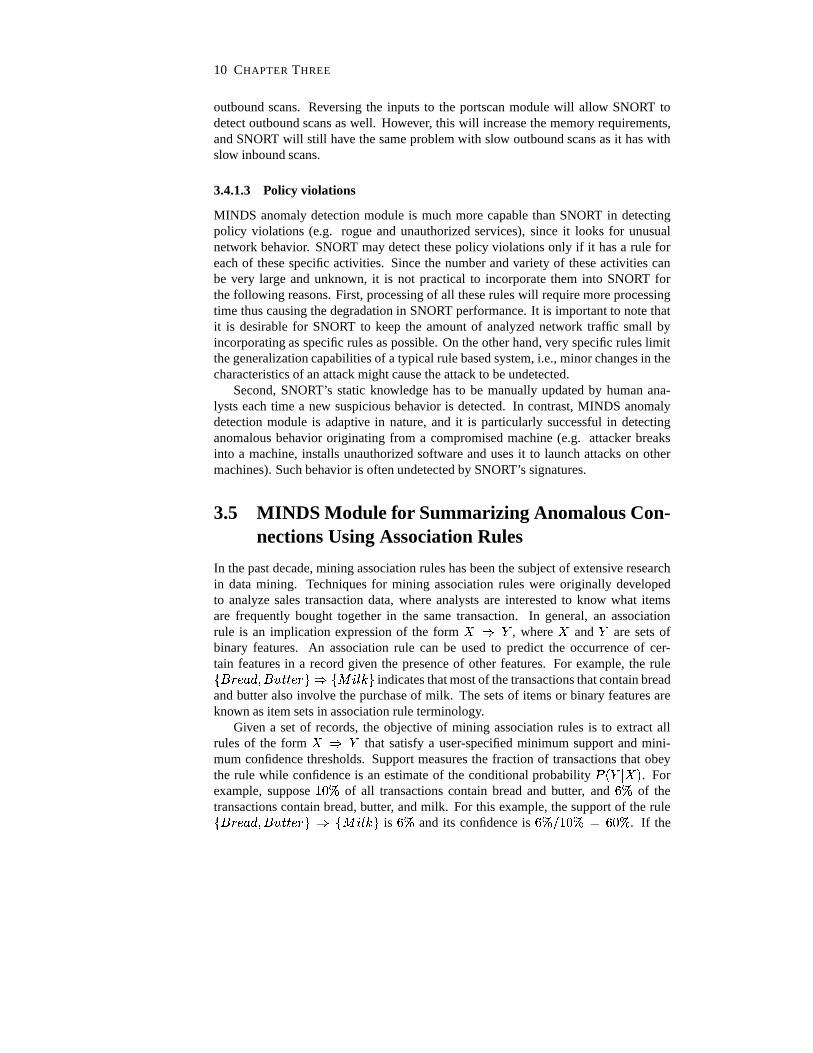
3.5 MINDS Module for Summarizing Anomalous Con-nections Using Association Rules
In the past decade, mining association rules has been the subject of extensive researchin data mining. Techniques for mining association rules were originally developedto analyze sales transaction data, where analysts are interested to know what itemsare frequently bought together in the same transaction. In general, an associationrule is an implication expression of the form (*),+ , where ( and + are sets ofbinary features. An association rule can be used to predict the occurrence of cer-tain features in a record given the presence of other features. For example, the rule-/.10�2�354768.:9<;=;>2/0@? ) -�ACB=DFEG?
indicates that most of the transactions that contain breadand butter also involve the purchase of milk. The sets of items or binary features areknown as item sets in association rule terminology.
Given a set of records, the objective of mining association rules is to extract allrules of the form (H),+ that satisfy a user-specified minimum support and mini-mum confidence thresholds. Support measures the fraction of transactions that obeythe rule while confidence is an estimate of the conditional probability IJ��+LK ( � . Forexample, suppose /!@M of all transactions contain bread and butter, and &@M of thetransactions contain bread, butter, and milk. For this example, the support of the rule-/.10�2�354768.:9<;=;>2/0@? ) -NACB=DFE<?
is &5M and its confidence is &@M�O5 /!@MQPR&�!@M . If the

AUTHOR 11
minimum support threshold is chosen to be �M and the minimum confidence thresholdis ST!5M , then this rule would be extracted by the association rule mining algorithm. Inthis example, the set
-�.:0N2�[email protected];=;>2/0N6UACBVDWE<?is also referred to as a frequent item set.
Association patterns, often expressed in the form of frequent item sets or associa-tion rules, have been found to be valuable for analyzing network traffic data [3,20,25].These patterns can be used for the following purposes:
� To construct a summary of anomalous connections detected by the IDS. Oftentimes, the number of anomalous connections flagged by an IDS can be verylarge, thus requiring analysts to spend a large amount of time interpreting andanalyzing each connection that has a high anomaly score. By applying associ-ation pattern discovery techniques, analysts can obtain a high-level summary ofanomalous connections. For example, scanning activity for a particular servicecan be summarized by a frequent set:
srcIP= ( , dstPort= +If most of the connections in the frequent set are ranked high by the anomaly de-tection algorithm, then the frequent set may be a candidate signature for additionto a signature-based system.
� To construct a profile of the normal network traffic behavior in anomaly detectionsystems [3,25]. As previously noted, an anomaly detection system requires someinformation about how the normal network traffic behaves in order to ascertainthe anomalous connections. Association patterns can provide the necessary in-formation by identifying sets of features that are commonly found in the normalnetwork traffic data. For example, a Web browsing activity, (almost always onport 80 and uses the TCP protocol with a small number of packets) could gener-ate the following frequent set:
protocol=TCP, dstPort= %'! , NumPackets=3. . . 6In addition, association patterns generated at different time frames can be used tostudy the significant changes in the network traffic at various periods of time [20]
� Recurrent patterns in normal or anomalous connections can serve as secondaryfeatures to be augmented to the original data in order to build better predictivemodels of the network traffic data.
Mining association patterns in network traffic data is a challenging task due to thefollowing reasons:
� Imbalanced class distribution. Standard association pattern discovery techniquesrely on a user-specified minimum support threshold to eliminate patterns thatoccur infrequently in the data. For network intrusion data, the proportion ofnetwork traffic that corresponds to an attack is considerably smaller than theproportion of normal traffic. As a result, one has to apply a very low minimumsupport threshold to detect patterns involving the attack class. This will degradethe performance of association pattern discovery algorithms considerably andproduces an overwhelmingly large number of patterns for the normal class.
Connections that have high anomaly scores are mostly likely to be attacks andthose with low anomaly scores are most likely to be normal traffic. For associa-

12 CHAPTER THREE
tion pattern analysis, we choose connections that appear in the top few percent-age of anomaly scores to be the attack class and the bottom few percentage ofanomaly scores to be the normal class. Connections with intermediate anomalyscores will be ignored. We then mine the frequent patterns for each class sepa-rately using different minimum support thresholds, depending on the number ofconnections that belong to each class. If the class is small, then a low minimumsupport threshold is chosen. Finally, a vertical association rule mining algo-rithm [20, 33] is applied to efficiently discover frequent patterns of each class.
� Binarization and grouping of attribute values. The network intrusion data con-tains several continuous attributes such as number of packets, number of bytes,and duration of each connection. These attributes must be transformed into bi-nary features first before applying standard association pattern algorithms. Thetransformation can be performed using a variety of supervised and unsuperviseddiscretization techniques. Using the output scores of the anomaly detector as itsground truth, MINDS employs a supervised binning strategy to discretize the at-tributes. Initially, all distinct values of a continuous attribute is put into one bin.Worst bin in terms of purity is selected for partitioning until the desired numberof bins is reached. Gini index is used to determine the best split. Binning for acontinuous attribute is illustrated in Table 3.3.
Table 3.3: Discretization of a continuous attributeClass X�� X � XTY XNZ XT[ XT\ XT] XT^ XT_
Anomalous 0 0 20 10 20 0 0 0 0Normal 150 100 0 0 0 100 100 150 100
bin1 bin2 bin3
In addition, the source and destination IP addresses can be grouped together byapplying varying sizes of net-masks. For example, the group 160.94.*.* repre-sents the class B address for all IP addresses whose first two octets are 160 and94. However, by doing so, an IP address will now belong to multiple groups,which may give rise to multiple patterns describing similar types of connections.For example, if the pattern (SourceIP = `�I� , Protocol=TCP) is frequent, thenthe pattern (SourceIP = `@I� /a , Protocol=TCP) where `@I� /bcPd`@I� "e � 3gf�E givena net-mask size, must also be frequent.
� Pruning the redundant patterns. Although association patterns can detect setsof features that occur frequently in the network traffic data, the number of pat-terns extracted can be quite large, depending on the choice of minimum supportthreshold. Some of the patterns are redundant because they correspond to thesubsets of other patterns. For example, given two frequent sets:
Protocol=TCP, DstPort=8888,TCPflags=SYNDstPort=8888,TCPflags=SYN
the first one is more descriptive than the second. If the support of these two itemsets is very close, then the second rule is redundant. MINDS applies a flexiblepruning scheme to eliminate redundant patterns by comparing the support and

AUTHOR 13
confidence of patterns that share similar features. If the support and confidenceof such patterns are almost identical, the more descriptive pattern is retained.
� Finding discriminating patterns. Eventually, the goal of mining association pat-terns is to discover patterns that occur regularly in the normal class or anomalyclass, but not both. To do this, we need a measure that can rank the patternsaccording to their discriminating power. MINDS allows the users to rank thediscovered patterns according to various measures, as illustrated in Figure 3.4.Consider a set of features ( that occur hT times in the anomalous class and hi�
Figure 3.4: Measures for ordering patterns
times in the normal class. Also, let �j and �k� be the number of anomalous andnormal connections in the data set. Assuming that we are only interested in find-ing profiles of the anomalous class, the ratio hT �O��j to hi��ON�k� would indicate howwell the pattern could discern anomalous connections from normal connections.If the proportion of samples in each class is the same, i.e., �j lPm�k� , then theratio measure is a monotone function of precision. Ratio or precision alone isinsufficient because they often characterize only a small number of anomalousconnections. In the extreme case, a rare pattern that is observed only once in theanomalous class and does not appear in the normal class will have a maximumvalue of ratio and precision, and yet, may not be significant. To account for thesignificance of a pattern, the recall measure can be used as an alternative. Un-fortunately, a pattern that has high recall may not necessarily be discriminating.The F1-measure, which is the harmonic mean of precision and recall, provides agood trade-off between the two measures.
� Grouping the discovered patterns. It is worth noting that some of the extractedpatterns can describe a similar set of anomalous connections. For example, aprobe or scan may give rise to multiple patterns that are very similar to each other(e.g., these patterns may involve the same source IP address and port number, butdifferent destination IP addresses). Thus, it is useful to group together the relatedpatterns before presenting them to the analysts.
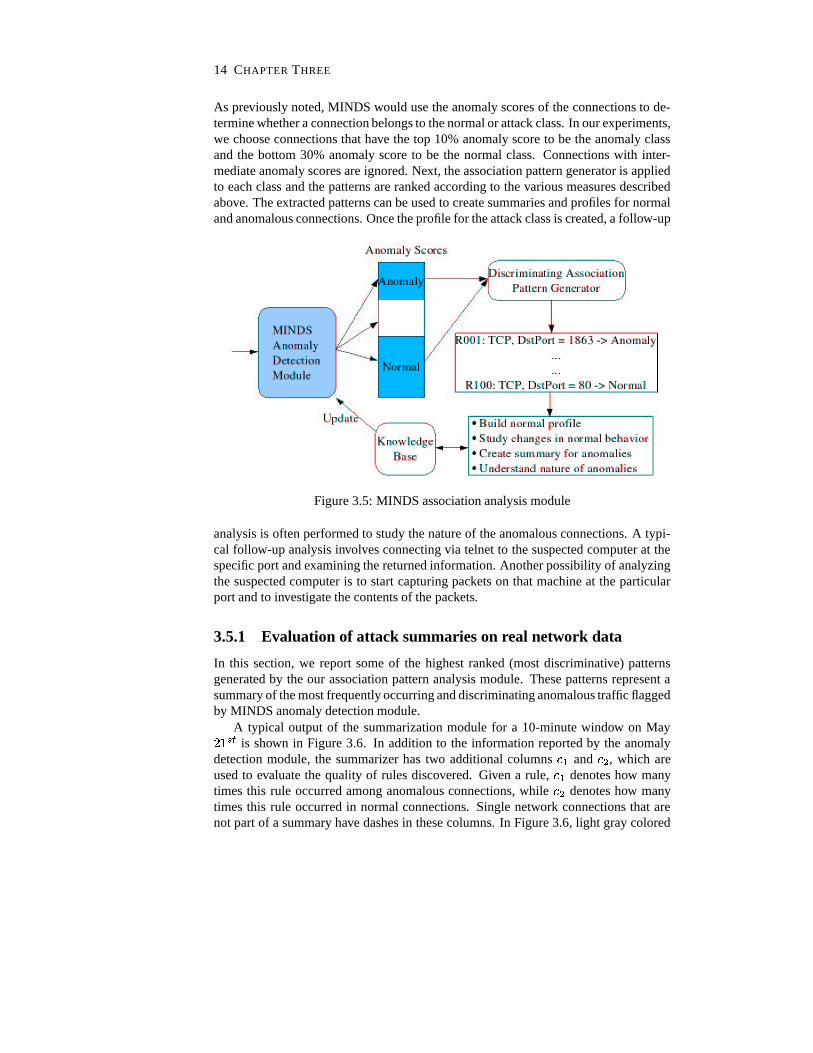
The overall architecture of our association analysis module is shown in Figure 3.5.
14 CHAPTER THREE
As previously noted, MINDS would use the anomaly scores of the connections to de-termine whether a connection belongs to the normal or attack class. In our experiments,we choose connections that have the top 10% anomaly score to be the anomaly classand the bottom 30% anomaly score to be the normal class. Connections with inter-mediate anomaly scores are ignored. Next, the association pattern generator is appliedto each class and the patterns are ranked according to the various measures describedabove. The extracted patterns can be used to create summaries and profiles for normaland anomalous connections. Once the profile for the attack class is created, a follow-up
Figure 3.5: MINDS association analysis module
analysis is often performed to study the nature of the anomalous connections. A typi-cal follow-up analysis involves connecting via telnet to the suspected computer at thespecific port and examining the returned information. Another possibility of analyzingthe suspected computer is to start capturing packets on that machine at the particularport and to investigate the contents of the packets.
3.5.1 Evaluation of attack summaries on real network data
In this section, we report some of the highest ranked (most discriminative) patternsgenerated by the our association pattern analysis module. These patterns represent asummary of the most frequently occurring and discriminating anomalous traffic flaggedby MINDS anomaly detection module.
A typical output of the summarization module for a 10-minute window on May�g �n � is shown in Figure 3.6. In addition to the information reported by the anomalydetection module, the summarizer has two additional columns hT� and h � , which areused to evaluate the quality of rules discovered. Given a rule, hN� denotes how manytimes this rule occurred among anomalous connections, while h � denotes how manytimes this rule occurred in normal connections. Single network connections that arenot part of a summary have dashes in these columns. In Figure 3.6, light gray colored

AUTHOR 15
connections, including the top ranked connection with a score of 31.17, correspond toa University of Minnesota computer connecting to a remote FTP server, which happensto be running on port 5002. Further investigation of the local machine showed that itis also running multiple peer-to-peer file sharing applications. These connections werenot summarized because a large number of similar connections had low scores. Thesecond line is a summary of 150 TCP reset packets received from 64.156.X.74. Furtheranalysis indicated that this computer has been the victim of a DoS attack, and we wereobserving backscatter, i.e. replies to spoofed packets. The next summary of 5 connec-tions on port 4729 appears to be a false alarm. The dark gray lines are summaries of 72connections involved in an FTP scan from a computer in Columbia (200.75.X.2). Thesummary of 12 connections involving destination port 113 represents IDENT lookups,where a remote computer is trying to get the username of a user. The next summary of8 connections with destination port 119, corresponds to a USENET server transferringa large amount of data.
Figure 3.6: Output of MINDS summarization module
In the following, we present several additional association patterns found by theMINDS summarization module on different days.
� Example 1srcIP=IP1, dstPort=80, Protocol=TCP, Flag=SYN, NumPackets=3,NumBytes=120. . . 180 (c1=256, c2=1)srcIP=IP1, dstIP=IP2, dstPort=80, Protocol=TCP, Flag=SYN, NumPackets=3,NumBytes=120. . . 180 (c1=177, c2=0)
The first rule indicates that the source of the anomalous connections originatesfrom IP1, the destination port is 80, the protocol used is TCP with tcpflags set toSYN, the number of packets is 3, and the total number of bytes is between 120and 180. Furthermore, this pattern is observed 256 times (c1 = 256) among theanomalous connections and only once (c2=1) in the normal connections. There-fore, it has a high ratio and precision, which is why it is ranked among the topfew patterns found by the system.
At first glance, the first rule indicates a Web scan since it appears mostly in theanomaly class with a fixed source IP address but not with a fixed destination IPaddress. However, the second rule suggests that an attack was later launched toone of the specific machines since the pattern originates from the same source

16 CHAPTER THREE
IP address but has a specific destination IP address and covers only anomalousconnections. Further analysis confirms that a scan has been performed from thesource IP address IP1, followed by an attack on a specific machine that was pre-viously identified by the attacker to be vulnerable.
� Example 2dstIP= IP3, dstPort=8888, Protocol=TCP (c1=369, c2=0)dstIP= IP3, dstPort=8888, Protocol=TCP, Flag=SYN (c1=291, c2=0)
This pattern indicates a high number of anomalous TCP connections on port8888 to a specific machine. Follow-up analysis of the connections covered bythe pattern indicates possible existence of a machine that is running a variation ofthe KaZaA file-sharing protocol. KaZaA file sharing software is typically usedfor sharing audio, video, and software files, which are very often illegal copies.
� Example 3srcIP=IP4, dstPort=27374, Protocol=TCP, Flag=SYN, NumPackets=4,NumBytes=189200 (c1=582, c2=2)srcIP= IP4, dstPort=12345, NumPackets=4, NumBytes=189200 (c1=580, c2=3)srcIP= IP5, dstPort=27374, Protocol=TCP, Flag=SYN, NumPackets=3, Num-Bytes=144 (c1=694, c2=3)
The patterns above indicate a number of scans on port 27374 (which is a sig-nature for the SubSeven worm) and on port 12345 (which is a signature for theNetBus worm). Further analysis has shown that there are no fewer than five ma-chines scanning for one or both of these ports within an arbitrary time window.
3.6 Future Directions
The overall objective of the MINDS project is to develop on-line and scalable datamining algorithms and tools for detecting attacks and threats against computer sys-tems. Although our techniques developed to date are very promising and successful indetecting many computer attacks that could not be detected by state of the art intrusiondetection systems, they need to be improved due to various challenges. First, data gen-erated from network traffic monitoring tends to have very high volume, dimensionalityand heterogeneity, and there is a need for high performance data mining algorithmsthat will scale to very large network traffic data sets. Second, network data is tem-poral (streaming) in nature, and development of algorithms for mining data streamsis necessary for building real-time intrusion detection system. Third, low frequencyof computer attacks requires modification of standard data mining algorithms for theirdetection. Fourth, cyber attacks may be launched from several different locations andtargeted to many different destinations, thus creating a need to analyze network datafrom several network locations in order to detect these distributed attacks. Therefore,

AUTHOR 17
development of a cooperative and distributed intrusion detection system for correlat-ing suspicious events among multiple participating network sites to detect coordinatedattacks will be one of the key components of this project. Finally, converting networktraffic data into useful features is a complex task. We plan to aggregate informationfrom different sources (e.g., tcpdump data, syslog data, alarms from various IDSs) inorder to obtain more comprehensive set of features that will be used in data miningalgorithms. In addition to these challenges that define possible directions in our futureresearch, MINDS also will have a visualization tool for providing a graphical user in-terface that will help security analysts to better comprehend the anomalous events andpatterns extracted.
A number of applications outside of intrusion detection have similar characteristics,e.g. detecting credit card and insurance frauds, early signs of potential disasters inindustrial process control, early detection of unusual medical conditions - e.g. cardiacarrhythmia, etc. We plan to explore the use of our techniques to such problems.
3.7 Acknowledgments
The authors are grateful to Yongdae Kim and Zhi-li Zhang for their comments andfeedback on the general architecture of MINDS. This work was supported by ArmyHigh Performance Computing Research Center contract number DAAD19-01-2-0014.The content of the work does not necessarily reflect the position or policy of the gov-ernment and no official endorsement should be inferred. Access to computing facilitieswas provided by the AHPCRC and the Minnesota Supercomputing Institute.

18 CHAPTER THREE

Bibliography
[1] Charu C. Aggarwal and Philip S. Yu. Outlier detection for high dimensional data.In SIGMOD Conference, 2001.
[2] D. Anderson, T. F. Lunt, H. Javitz, A. Tamaru, and A. Valdes. Detecting unusualprogram behavior using the statistical component of the next-generation intrusiondetection expert system NIDES. Technical Report SRI-CSL-95-06, ComputerScience Laboratory, SRI International, 1995.
[3] Daniel Barbara, Ningning Wu, and Sushil Jajodia. Detecting novel network intru-sions using bayes estimators. In Proceedings of First SIAM Conference on DataMining, Chicago, IL, 2001.
[4] Eric Bloedorn, Alan D. Christiansen, William Hill, Clement Skorupka, Lisa M.Talbot, and Jonathan Tivel. Data mining for network intrusion detection: How toget started. Technical report, The MITRE Corporation, 2001.
[5] Markus Breunig, Hans-Peter Kriegel, Raymond T. Ng, and Jorg Sander. Lof:Identifying densitybased local outliers. In Proceedings of the ACM SIGMODConference, Dallas, TX, 2000.
[6] J. B. D. Cabrera, B. Ravichandran, and R. K. Mehra. Statistical traffic modelingfor network intrusion detection. In Proceedings of the 8th International Sympo-sium on Modeling, Analysis and Simulation of Computer and TelecommunicationSystems, San Francisco, CA, 2000.
[7] Sara Matzner Chris Sinclair, Lyn Pierce. An application of machine learningto network intrusion detection. In Proceedings of the 15th Annual ComputerSecurity Applications Conference, pages 371–377, Phoenix, AZ, 1999.
[8] Dorothy E. Denning. An intrusion-detection model. IEEE Transactions on Soft-ware Engineering, SE-13:222–232, 1987.
[9] Eleazar Eskin, Andrew Arnold, Michael Prerau, Leonid Portnoy, and Sal Stolfo.A geometric framework for unsupervised anomaly detection: Detecting intru-sions in unlabeled data. Data Mining for Security Applications, 2002.
19

20 CHAPTER THREE
[10] Wei Fan, Salvatore J. Stolfo, Junxin Zhang, and Philip K. Chan. AdaCost: mis-classification cost-sensitive boosting. In Proc. 16th International Conf. on Ma-chine Learning, pages 97–105, Bled, Slovenia, 1999. Morgan Kaufmann, SanFrancisco, CA.
[11] Anup K. Ghosh and Aaron Schwartzbard. A study in using neural networks foranomaly and misuse detection. In Proceedings of the Eighth USENIX SecuritySymposium, pages 141–151, Washington, DC, 1999.
[12] Harold S. Javitz and Alfonso Valdes. The nides statistical component: Descrip-tion and justification. Technical report, Computer Science Laboratory, SRI Inter-national, 1993.
[13] M. Joshi and V. Kumar. Credos: Classification using ripple down structure (acase for rare classes). In Proceedings of 19th International Conference on DataEngineering, Bangalore, India, 2003.
[14] Mahesh V. Joshi, Ramesh Agarwal, and Vipin Kumar. Mining needles in ahaystack: Classifying rare classes via two-phase rule induction. In Proceedingsof ACM SIGMOD Conference on Management of Data, Santa Barbara, CA, 2001.
[15] Mahesh V. Joshi, Ramesh Agarwal, and Vipin Kumar. Predicting rare classes:Can boosting make any weak learner strong? In KDD, Edmonton, Canada, 2002.
[16] Mahesh V. Joshi, Vipin Kumar, and Ramesh C. Agarwal. Evaluating boostingalgorithms to classify rare classes: Comparison and improvements. In ICDM,pages 257–264, San Jose, CA, 2001.
[17] Edwin M. Knorr and Raymond T. Ng. Algorithms for mining distance-basedoutliers in large datasets. In Proc. 24th Int. Conf. Very Large Data Bases, VLDB,pages 392–403, New York City, NY, 1998. Morgan Kaufmann.
[18] Aleksander Lazarevic, Nitesh V. Chawla, Lawrence O. Hall, and Kevin W.Bowyer. Smoteboost: Improving the prediction of minority class in boosting.Technical Report 2002-136, AHPCRC, 2002.
[19] Aleksander Lazarevic, Levent Ertoz, Aysel Ozgur, Vipin Kumar, and Jaideep Sri-vastava. A comparative study of anomaly detection schemes in network intrusiondetection. In Proceedings of Third SIAM International Conference on Data Min-ing, San Francisco, 2003.
[20] Wenke Lee and Salvatore Stolfo. Data mining approaches for intrusion detection.In Proceedings of the 7th USENIX Security Symposium, San Antonio, TX, 1998.
[21] Wenke Lee and Dong Xiang. Information-theoretic measures for anomaly detec-tion. In IEEE Symposium on Security and Privacy, 2001.
[22] Richard P. Lippmann and Robert K. Cunningham. Improving intrusion detectionperformance using keyword selection and neural networks. Computer Networks(Amsterdam, Netherlands: 1999), 34:597–603, 2000.

AUTHOR 21
[23] Jianxiong Luo. Integrating fuzzy logic with data mining methods for intrusiondetection. Master’s thesis, Department of Computer Science, Mississippi StateUniversity, 1999.
[24] Matthew V. Mahoney and Philip K. Chan. PHAD: Packet header anomaly de-tection for identifying hostile network traffic. Technical report, Florida Tech.,2001.
[25] Stefanos Manganaris, Marvin Christensen, Dan Zerkle, and Keith Hermiz. A datamining analysis of rtid alarms. In Proceedings of the 2nd International Workshopon Recent Advances in Intrusion Detection RAID, West Lafayette, IN, 1999.
[26] Sridhar Ramaswamy, Rajeev Rastogi, and Kyuseok Shim. Efficient algorithmsfor mining outliers from large data sets. In Proceedings of the ACM SIGMODConference, pages 427–438, Dallas, TX, 2000.
[27] Jake Ryan, Meng-Jang Lin, and Risto Miikkulainen. Intrusion detection with neu-ral networks. In Proceedings of AAAI-97 Workshop on AI Approaches to FraudDetection and Risk Management, pages 72–77. AAAI Press, 1997.
[28] R. Sekar, A. Gupta, J. Frullo, T. Shanbhag, A. Tiwari, H. Yang, and S. Zhou.Specification based anomaly detection: A new approach for detecting network in-trusions. In ACM Conference on Computer and Communications Security, 2002.
[29] Stuart Staniford, James A. Hoagland, and Joseph M. McAlerney. Practical auto-mated detection of stealthy portscans. Journal of Computer Security, 10:105–136,2002.
[30] www.splintered.net/sw/flow tools. Flow-tools.
[31] K. Yamanishi, J. Takeuchi, G. Williams, , and P. Milne. On-line unsupervisedoultlier detection using finite mixtures with discounting learning algorithms. InKDD, pages 320–324, Boston, MA, 2000.
[32] Nong Ye and Qiang Chen. An anomaly detection technique based on a chi-squarestatistic for detecting intrusions into information systems. Quality and ReliabilityEngineering International, 17:105–112, 2001.
[33] Mohammed J. Zaki and Karam Gouda. Fast vertical mining using diffsets. Tech-nical Report 01-1, 2001 11, Rensselaer Polytechnic Institute, 2001.