
Mindray Medical International Limited Corporate...
25
Mindray Medical International Limited Corporate Presentation May 2013
Transcript of Mindray Medical International Limited Corporate...

Mindray Medical International LimitedMindray Medical International Limited
Corporate Presentation
May 2013
Disclaimer
This material contains "forward‐looking statements" within the meaning of the safe harbor provisions of the U. S. Private Securities Litigation Reform Act of 1995. Statements
contained herein and in our fourth quarter and full year 2012 earnings press release that are not historical facts, including, without limitation, statements about Mindray’s
anticipated net revenues, non‐GAAP net income and capital expenditure for 2013, the tax benefits related to the key software enterprise status that we may receive in 2013 for the
calendar year 2011 and 2012, our assumption of a corporate income tax rate of 15% applicable to the Shenzhen subsidiary, our being optimistic about the future growth prospects
of our in‐vitro diagnostic segment, that China will remain the primary engine for our growth this year due to our strong competitive position in the domestic market and favourable
spending environment on healthcare, that the prospects for emerging markets, albeit favourable overall, are somewhat overshadowed by potential political instability and currency
risks in some regions, our anticipation that the developed markets will remain challenging this year because of lingering uncertainties over their economies or hospital spending, that
our strategy of offering great products at reasonable prices will continue to serve us well in all markets, that we will work on strengthening our research and development and
pursuing suitable M&A opportunities in order to drive long‐term growth for Mindray, our expanding product offerings for 2013 and beyond, that favorable macro environment and
our strategy to strengthen our sales, distribution and services made us optimistic about our China performance going forward, that we remain confident about our expansion plans our strategy to strengthen our sales, distribution and services made us optimistic about our China performance going forward, that we remain confident about our expansion plans
to capture opportunities in key emerging countries, our expectation that emerging markets would further lead our international sales growth, that we remain cautious about the
macro hospital spending environments in the developed markets, our belief that our long‐term competitive position remains strong based on our attractive price‐to‐performance
products, comprehensive sales and service platforms, and increasing brand recognition, and statements about our growth plans for 2013, are forward‐looking statements. Forward‐
looking statements represent only the company's beliefs and predictions regarding future events, many of which, by their nature, are inherently uncertain and outside of the
company's control. Our actual results and financial condition and other circumstances may differ materially from the anticipated results and financial condition indicated in these
forward‐looking statements due to a variety of risk, uncertainties and factors, including, without limitation, the growth and expected growth of the medical device market in China
and internationally; relevant government policies and regulations relating to the medical device industry; market acceptance of our products; our expectations regarding demand for
our products; our ability to expand our production, our sales and distribution network and other aspects of our operations; our ability to stay abreast of market trends and
technological advances; our ability to effectively protect our intellectual property rights and not infringe on the intellectual property rights of others; our ability to settle disputes
with our customers and suppliers; competition in the medical device industry in China and internationally; and general economic and business conditions in the countries in which
we operate. For a discussion of other important factors that could adversely affect our business, financial condition, results of operations and prospects, see "Risk Factors" beginning
on page 5 of our annual report on Form 20‐F which was filed with the Securities and Exchange Commission on April 30, 2012.
Our results of operations for the fourth quarter of 2012 and the full year ended December 31, 2012 are not necessarily indicative of our operating results for any future periods. The
company has not completed its audit of 2012 financial statements and the selected unaudited financial results for the fourth quarter and full year ended December 31, 2012
1
company has not completed its audit of 2012 financial statements and the selected unaudited financial results for the fourth quarter and full year ended December 31, 2012
announced today are subject to adjustment. The anticipated results for the fourth quarter and full year ended December 31, 2012 remain subject to the finalization of the
company’s year‐end closing, reporting and audit processes, particularly as related to accrued expenses, income taxes, share‐based compensation expenses, and expenses and/or
amortization of intangible assets. The financial information contained in this release should be read in conjunction with the consolidated financial statements and notes thereto
included in our public filings with the Securities and Exchange Commission.
Any projections in this release and presentation are based on limited information currently available to us, which is subject to change. Although such projections and the factors
influencing them will likely change, we will not necessarily update the information. Such information speaks only as of the date of this release and presentation. Mindray disclaims
any intention or obligation to update or revise any forward‐looking statements, whether as a result of new information, future events or otherwise, except as required by law.

Who We Are
Mindray is a leading developer, manufacturer and marketer of medical
devices worldwide, creating value and driving growth through:
�Meeting the needs of hospitals and health systems in various
geographies around the world
�Constant innovation driven by a
vertically integrated business model and
a world class R&D operation
2
�Leveraging its leadership position in the
fast growing China market while
expanding its global presence

Our VisionWe will make better healthcare solutionsWe will make better healthcare solutions
more accessible to humanity.
Our MissionImprove healthcare by optimizing and
3
Improve healthcare by optimizing and
sharing medical technologies with the world.

Who We Are
� Established in 1991
� Headquarters in Shenzhen, China
� Over US$1 billion in annual sales
� Over 7,500 employees globally
� 10 R&D centers, subsidiaries in
over 20 countries
� Listed on the NYSE exchange
4
� Listed on the NYSE exchange
� Export to more than 190 countries

Worldwide Sales and Service Networks
5

A Global Player in Medical Technologies
2003 Total Revenues 2012 Total Revenues
Developed
Markets
8%
Emerging
Markets
17%
US$ 59mm US$ 704mm
China
45%
Developed
Emerging
Markets 34%
US$ 1,060mm
6
China
75%
Developed
Markets
21%
Note: Emerging Markets represent all countries except for China and the developed markets.
Developed Markets represent the North American and Western European countries.

Expanding Product OfferingsPatient Monitoring & Life Support Products In-Vitro Diagnostic Products
Patient Monitoring: 3B
Anesthesia Machine: 1.1B
Defibrillator & Surgical equipment:9.9B
Ventilator: 3B
Infusion Pump & Syringe Pump: 1B
2011
2011
2009
2006
1992
Launch Time
Immunoassay: 7.6B
Hematology Analysis: 1.9B
Biochemistry Analysis: 7.6B
Urine Analysis: 1.0B
2013
2012
2011
2011
2001
Launch Time
Microbiology Analysis: 2.3B
Coagulation analysis: 1.7B
Medical Imaging Systems
� Total addressable market size worldwide : ~ 18.0B� Total addressable market size worldwide: ~22.1B
1992
Addressable Market Size (us$)Hematology Analysis: 1.9B
Addressable Market Size (us$)
1998
Digital Radiography: 2.3B
Magnetic Resonance Imaging: 2.5B2010
2008
Launch Time
Other Products
2012
2012
Launch Time
Orthopedics : 30B
Endoscopes : 5.1B
7
� Total addressable market size worldwide: ~ 10.3B
Digital Radiography: 2.3B
Ultrasound: 5.5B
2008
2000
Addressable Market Size (us$)
PACS: 3.5B
� Total addressable market size worldwide: ~38.6B
2012
2011
Addressable Market Size (us$)
Orthopedics : 30B
Source: Internal estimate
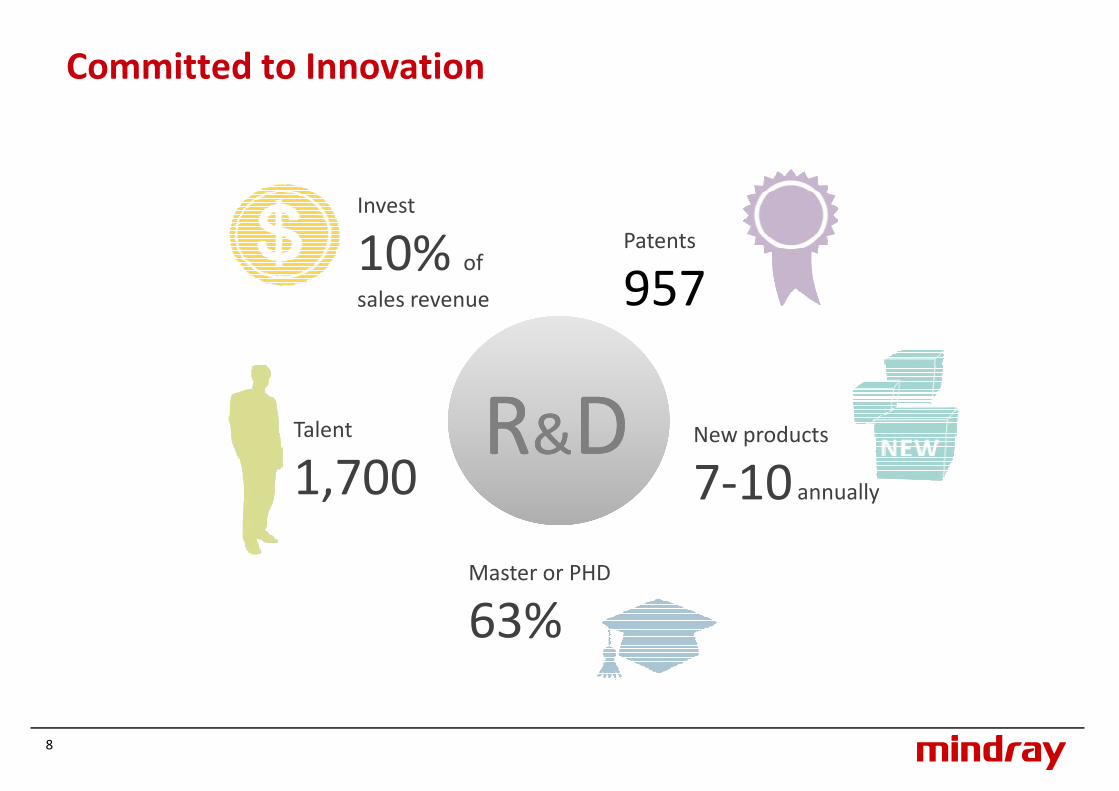
Committed to Innovation
Invest
10% of Patents
957
RR&&DD
10% of
sales revenue
Talent
1,700New products
7‐10 annually
957
8
Master or PHD
63%

Beijing, China
10 Worldwide R&D Centers
Mahwah, NJ, USA
Shenzhen, China
Nanjing, China
Beijing, China
Stockholm, Sweden
Seattle, USA
Chengdu, China
Xi’an, China
Shanghai, China
Miami, USA
9
Shenzhen, China
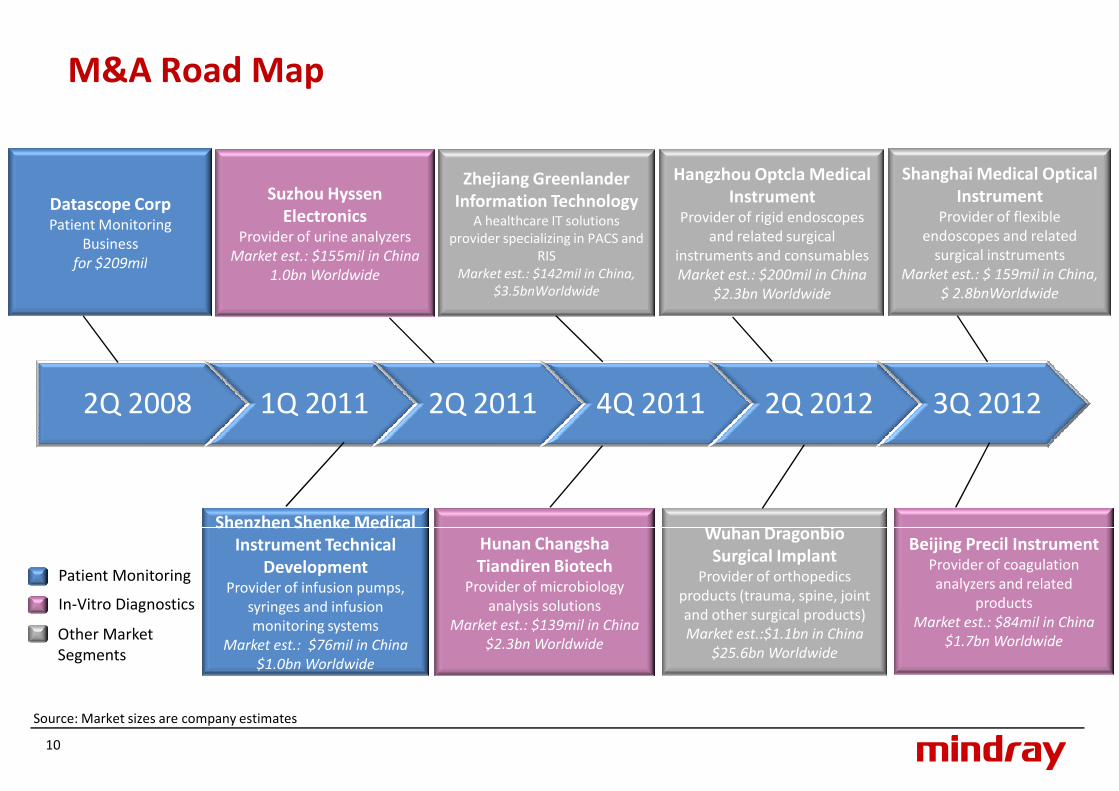
M&A Road Map
Zhejiang Greenlander
Information TechnologyA healthcare IT solutions
provider specializing in PACS and
RIS
Hangzhou Optcla Medical
InstrumentProvider of rigid endoscopes
and related surgical
instruments and consumables
Shanghai Medical Optical
InstrumentProvider of flexible
endoscopes and related
surgical instruments
Suzhou Hyssen
ElectronicsProvider of urine analyzers
Market est.: $155mil in China
Datascope CorpPatient Monitoring
Business
for $209milMarket est.: $142mil in China,
$3.5bnWorldwide
instruments and consumables
Market est.: $200mil in China
$2.3bn Worldwide
Wuhan Dragonbio Shenzhen Shenke Medical
2Q 2008 1Q 2011 2Q 2011 4Q 2011 2Q 2012 3Q 2012
Market est.: $ 159mil in China,
$ 2.8bnWorldwide
Market est.: $155mil in China
1.0bn Worldwidefor $209mil
10
Hunan Changsha
Tiandiren Biotech Provider of microbiology
analysis solutions
Market est.: $139mil in China
$2.3bn Worldwide
Wuhan Dragonbio
Surgical Implant Provider of orthopedics
products (trauma, spine, joint
and other surgical products)
Market est.:$1.1bn in China
$25.6bn Worldwide
Patient Monitoring
In‐Vitro Diagnostics
Other Market
Segments
Source: Market sizes are company estimates
Shenzhen Shenke Medical
Instrument Technical
DevelopmentProvider of infusion pumps,
syringes and infusion
monitoring systems
Market est.: $76mil in China
$1.0bn Worldwide
Beijing Precil InstrumentProvider of coagulation
analyzers and related
products
Market est.: $84mil in China
$1.7bn Worldwide

• A world‐class organization rooted in the world’s fastest growing market
• China’s leading domestic brand in three product areas, backed by international research centers in U.S. and Europe
• One of the most comprehensive sales and service infrastructure in China, reaching all major cities from local sales offices with distributors
• A robust growth track record in emerging markets
Investment Highlights
• A robust growth track record in emerging markets
• A high quality, value brand that is appealing to value‐seeking customers
• Sales and marketing investment rate among the highest within the industry
• Long‐term focus on growth, profitability and cash generation
US$ mm• Notes:
1. Non-GAAP figures exclude share-based compensation expenses, acquired intangible assets amortization expenses, in-progress research and development 704
881
1,060
863
800
1000
1200Revenue Non‐GAAP Net income Cash and cash equivalents and short‐term/restricted investments
11
research and development expenses, realignment costs - post acquisition, dispute charges, dispute related legal fees, as well as income from early termination of contract, all net of related tax impact .
2. Restricted cash and restricted investments related to purchase consideration in connection with our acquisition being held on escrow accounts are excluded.
59 84132
190
294
548
634704
13 23 35 5389
133 147 171 186 212
16 2256
216 245 253306
434
603
0
200
400
600
800
2003 2004 2005 2006 2007 2008 2009 2010 2011 2012
First Quarter 2013 Earnings Results
12
1Q13 Highlights
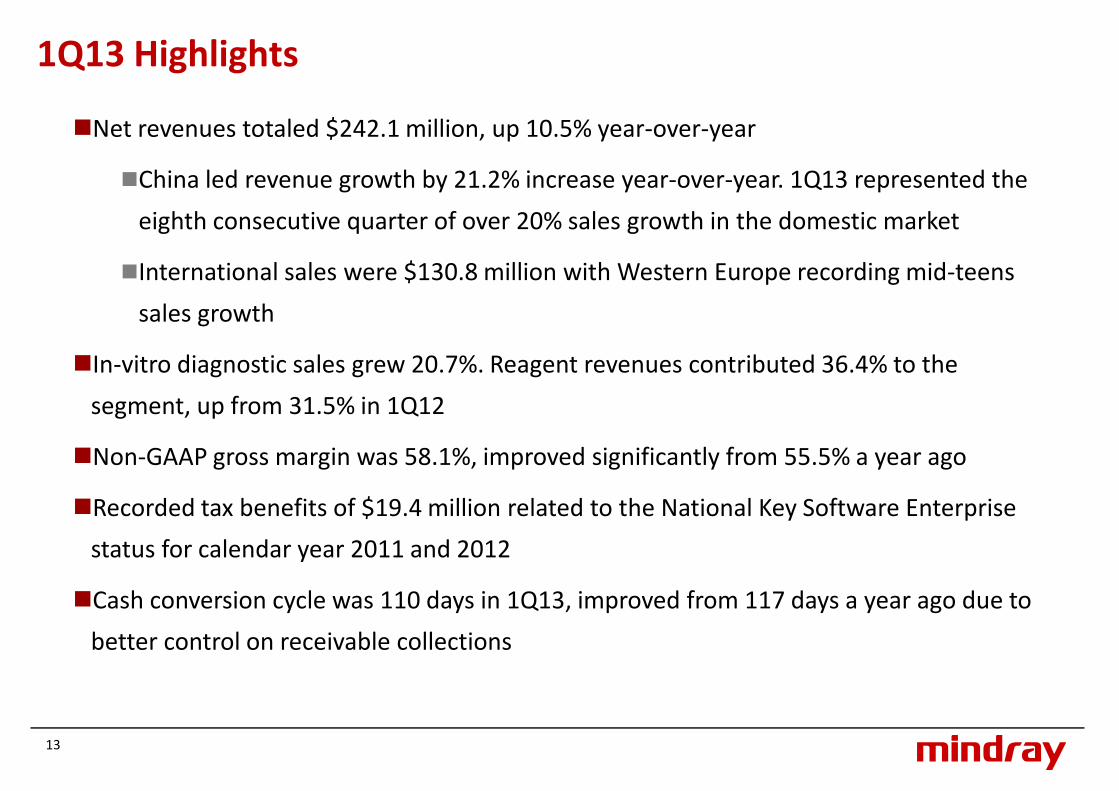
�Net revenues totaled $242.1 million, up 10.5% year‐over‐year
�China led revenue growth by 21.2% increase year‐over‐year. 1Q13 represented the
eighth consecutive quarter of over 20% sales growth in the domestic market
�International sales were $130.8 million with Western Europe recording mid‐teens �International sales were $130.8 million with Western Europe recording mid‐teens
sales growth
�In‐vitro diagnostic sales grew 20.7%. Reagent revenues contributed 36.4% to the
segment, up from 31.5% in 1Q12
�Non‐GAAP gross margin was 58.1%, improved significantly from 55.5% a year ago
�Recorded tax benefits of $19.4 million related to the National Key Software Enterprise
13
status for calendar year 2011 and 2012
�Cash conversion cycle was 110 days in 1Q13, improved from 117 days a year ago due to
better control on receivable collections

1Q13 Domestic Market Highlights
�1Q13 China sales continued its strong growth, up 21.2%, representing 46.0% of the
company’s total revenues
�Continued to capture market opportunities in county level hospitals where we �Continued to capture market opportunities in county level hospitals where we
have strong presence
�Our improved sales program and expanded direct‐servicing platform enabled us to
realize more opportunities and provide better customer service
�Strong IVD sales ‐ robust reagents growth and increasing high‐end segment
penetration
�Favourable macro environment and our strategy to strengthen our sales,
14
�Favourable macro environment and our strategy to strengthen our sales,
distribution and services made us optimistic about our China performance going
forward
1Q13 Emerging Markets Highlights
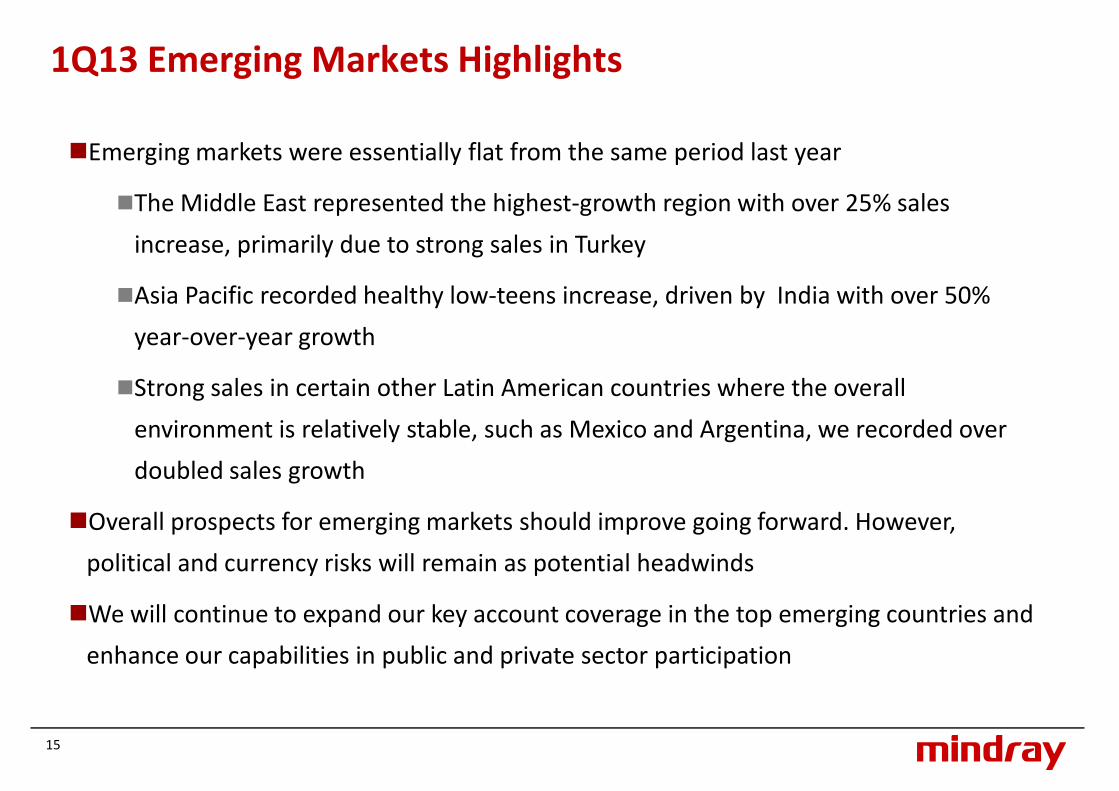
�Emerging markets were essentially flat from the same period last year
�The Middle East represented the highest‐growth region with over 25% sales
increase, primarily due to strong sales in Turkey
�Asia Pacific recorded healthy low‐teens increase, driven by India with over 50%
year‐over‐year growth
�Strong sales in certain other Latin American countries where the overall
environment is relatively stable, such as Mexico and Argentina, we recorded over
doubled sales growth
�Overall prospects for emerging markets should improve going forward. However,
15
�Overall prospects for emerging markets should improve going forward. However,
political and currency risks will remain as potential headwinds
�We will continue to expand our key account coverage in the top emerging countries and
enhance our capabilities in public and private sector participation

1Q13 Developed Markets Highlights
� Developed markets grew around 6%
� Western Europe posted around 16% growth, mainly contributed by strong
sales growth in France, the UK and the Netherlandssales growth in France, the UK and the Netherlands
� North America was flat this quarter largely due to weak hospital demand
� We expect the current weak underlying market demand to weigh on industry
participants in Western Europe. The macro hospital spending environment in North
America remains uncertain as well.
� We are confident about our long‐term competitive position based on our competitive
value proposition, comprehensive sales and services platforms, as well as increasing
16
value proposition, comprehensive sales and services platforms, as well as increasing
brand recognition

Financials – 1Q13 Results Highlights
USD (in millions)except EPS, A/R, A/P, Inventory days
1Q13 1Q12 4Q12 YoY%
Net Revenues 242.1 219.0 316.1 10.5%
Operating Income
Non‐GAAP OI
39.0
46.3
36.7
40.5
59.7
65.8
6.2%
14.3%Non‐GAAP OI
EBITDA
46.3
49.8
40.5
46.7
65.8
71.9
14.3%
6.8%
Net Income
Non‐GAAP NI
Non‐GAAP NI (ex tax benefits)
57.4
64.6
45.2
36.6
40.4
40.4
55.8
61.7
61.7
57.0%
59.9%
11.9%
Diluted EPS
Non‐GAAP Diluted EPS
0.48
0.53
0.31
0.34
0.47
0.51
54.8%
57.7%
17
Non‐GAAP Diluted EPS
Accounts Receivable Days 66 79 53
Inventory Days 103 92 83
Accounts Payable Days 59 54 47Note:1. Non‐GAAP figures exclude share‐based compensation expense and acquired intangible assets amortization expense, all net of related tax impact,2. Non‐GAAP NI (ex tax benefits) excludes the $19.4 million tax benefits related to the key software enterprise status for the calendar year 2011 and
2012, which was recognized in the first quarter of 2013
1Q13 Business Segment Highlights
PMLS
41%
MIS
22%
Others
9%
US$ 242mm
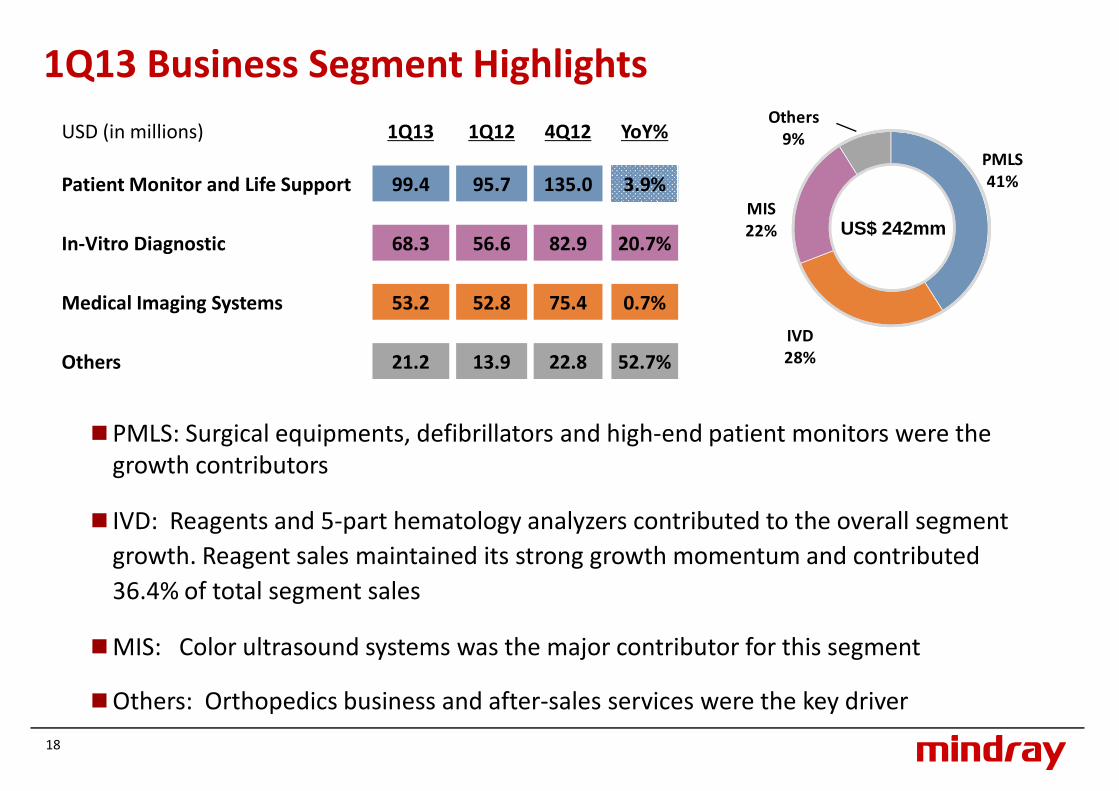
USD (in millions) 1Q13 1Q12 4Q12 YoY%
Patient Monitor and Life Support 99.4 95.7 135.0 3.9%
In-Vitro Diagnostic 68.3 56.6 82.9 20.7%
IVD
28%
Medical Imaging Systems 53.2 52.8 75.4 0.7%
Others 21.2 13.9 22.8 52.7%
�PMLS: Surgical equipments, defibrillators and high‐end patient monitors were the
growth contributors
� IVD: Reagents and 5‐part hematology analyzers contributed to the overall segment
18
� IVD: Reagents and 5‐part hematology analyzers contributed to the overall segment
growth. Reagent sales maintained its strong growth momentum and contributed
36.4% of total segment sales
�MIS: Color ultrasound systems was the major contributor for this segment
�Others: Orthopedics business and after‐sales services were the key driver

Growth Plans for 2013
�To capture growth opportunities in domestic market, Mindray plans to:
�Continue to optimize sales, marketing and service platforms
�Strengthen our position in areas where private and public healthcare spending take place
�To enhance our presence in emerging markets, Mindray intends to:�To enhance our presence in emerging markets, Mindray intends to:
�Continue to expand our key account coverage in the top emerging countries
�Enhance our capabilities in private and public sector participation
�To increase our market share in developed markets, Mindray intends to:
�Enhance brand awareness and focus on introducing new products
�Further build up direct sales channels and service capabilities
�Focus on R&D investment in technology and product development, as well as improving efficiency
19
�Focus on R&D investment in technology and product development, as well as improving efficiency
�Launch seven to ten new products to broaden product offerings across different market segments
�Speed up the integration of acquired companies and actively seek further M&A opportunities
2013 Guidance
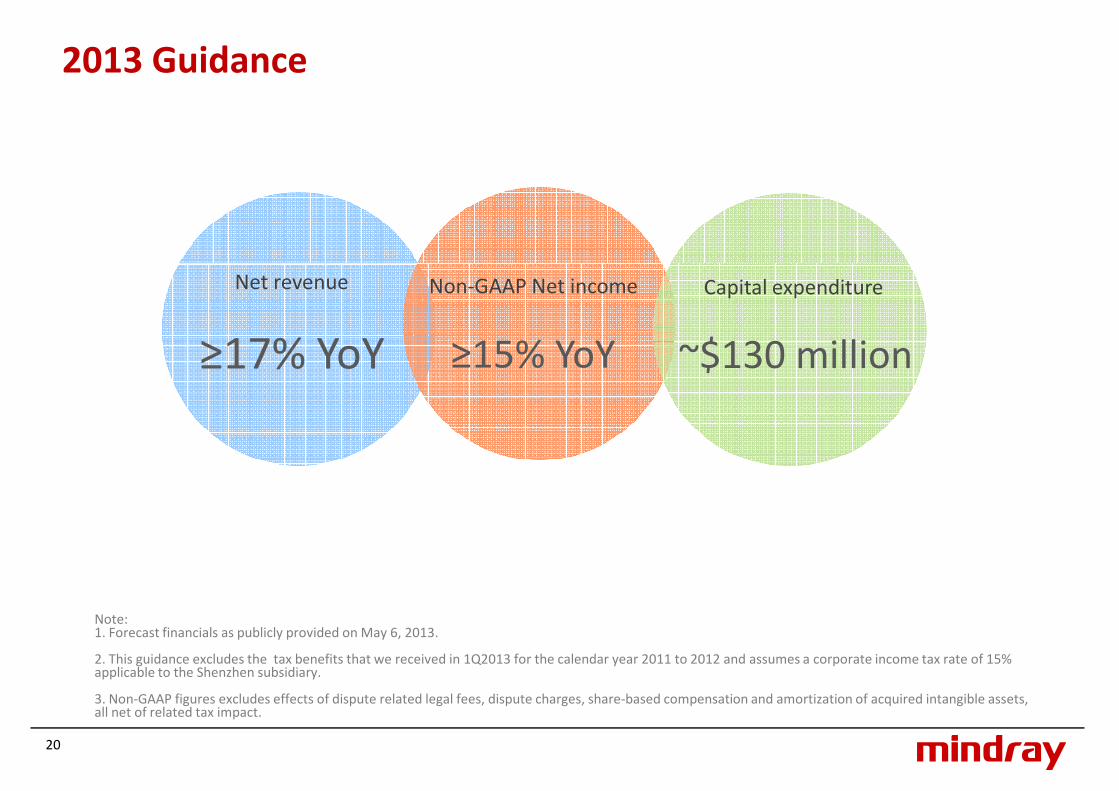
≥17% YoY
Net revenue Non‐GAAP Net income
≥15% YoY
Capital expenditure
~$130 million
20
Note: 1. Forecast financials as publicly provided on May 6, 2013.
2. This guidance excludes the tax benefits that we received in 1Q2013 for the calendar year 2011 to 2012 and assumes a corporate income tax rate of 15% applicable to the Shenzhen subsidiary.
3. Non‐GAAP figures excludes effects of dispute related legal fees, dispute charges, share‐based compensation and amortization of acquired intangible assets, all net of related tax impact.

Appendix
21
7208003000 RMB bn RMB bn
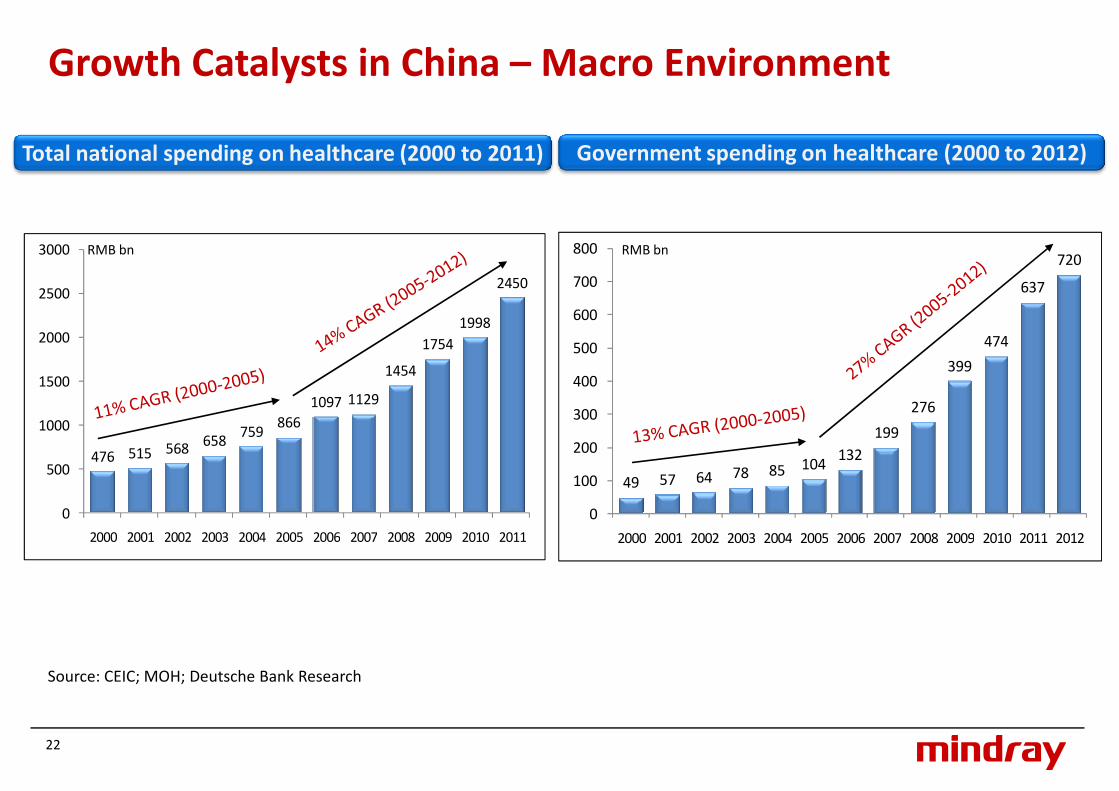
Total national spending on healthcare (2000 to 2011) Government spending on healthcare (2000 to 2012)
Growth Catalysts in China – Macro Environment
49 57 64 78 85 104132
199
276
399
474
637
720
0
100
200
300
400
500
600
700
476 515 568658
759866
1097 1129
1454
1754
1998
2450
0
500
1000
1500
2000
2500
22
2000 2001 2002 2003 2004 2005 2006 2007 2008 2009 2010 2011 20122000 2001 2002 2003 2004 2005 2006 2007 2008 2009 2010 2011
Source: CEIC; MOH; Deutsche Bank Research

Market Presence in China
Patient Monitoring Devices & Anesthesia Machine Biochemistry Analyzers
Mindray
27.2%Mindray
19.3%
Hematology Analyzers Ultrasound Systems
Others
72.8%Others
80.7%
Mindray
20.6%
Mindray
10.1%
23
Source: Frost & Sullivan research, market data as of 2012
Others
79.4%Others
89.9%

24
Healthcare within Reach