Minco Silver Corporate Presentation
32
TSX MSV DB:A0ESX5 QX: MISVF TSX:MSV Summer 2012
-
Upload
company-spotlight -
Category
Investor Relations
-
view
305 -
download
2
Transcript of Minco Silver Corporate Presentation

TSX MSV
DB:A0ESX5
QX: MISVF
TSX:MSV Summer 2012

TSX MSV
DB:A0ESX5
QX: MISVF
Except for the statements of historical fact, the information contained herein is of a forward-looking nature. Such forward-looking information involves known and unknown risks, uncertainties and other factors which may cause the actual results, performance or achievement of the Company to be materially different from any future results, performance or achievements expressed or implied by statements containing forward-looking information.
Although the Company has attempted to identify important factors that could cause actual results to differ materially, there may be other factors that cause results not to be as anticipated, estimated or intended. There can be no assurance that statements containing forward looking information will prove to be accurate as actual results and future events could differ materially from those anticipated in such statements. Accordingly, readers should not place undue reliance on statements containing forward looking information. Readers should review the risk factors set out in the Company’s prospectus and the documents incorporated by reference.
Cautionary Note to U.S. Investors Concerning Estimates of Inferred Resources
This presentation uses the term “Inferred Resources”. U.S. investors are advised that while this term is recognized and required by Canadian regulations, the Securities and Exchange Commission does not recognize it. “Inferred Resources” have a great amount of uncertainty as to their existence, and great uncertainty as to their economic and legal feasibility. It cannot be assumed that all or any part of an Inferred Resource will ever be upgraded to a higher category. Under Canadian rules, estimates of “Inferred Resources” may not form the basis of feasibility or other economic studies. U.S. investors are also cautioned not to assume
that all or any part of an “Inferred Mineral Resource” exists, or is economically or legally mineable.
2
Forward Looking Statement

TSX MSV
DB:A0ESX5
QX: MISVF
DEMAND CONTINUE TO INCREASE
• The chart at the left projects demand and uses by 2015
as follows:
• 62% industrial uses
• 18% silverware, coins & photographic uses
• 20% jewelry
*Uses source GFMS
3
Silver Demand
Global demand by 2015 is expected to continue to rise yet current supply appears low
COMEX INVENTORY
SUGGESTS SCARCITY
The first chart suggests
a supply of approx. 10 - 12 weeks
as at March 2012

TSX MSV
DB:A0ESX5
QX: MISVF
4
Silver vs. Gold
$5.00
$10.00
$15.00
$20.00
$25.00
$30.00
$35.00
$40.00
$45.00
$50.00
Pric
e (
US$
)
Spot Silver (US$/oz) Spot Gold (Index to Silver)
Source: FactSet

TSX MSV
DB:A0ESX5
QX: MISVF
Where does that
silver really go?
5
Current Consumption
Silver Consumption per Unit Silver Consumption
per Unit of Demand Product Demand
Total Silver
Consumption
Cell phones 250mg/handset 1.6bn 13 Moz
PC’s & laptops 1g/unit 690m 22 Moz
Automobiles 10-30g/vehicle 72m3 36 Moz
PDPs 10g/screen 19m 6 Moz
Thick film PV 0.15-0.25g/cell 14GW 47 Moz
Button batteries 1g/unit 156m 5 Moz
TOTAL 129 Moz

TSX MSV
DB:A0ESX5
QX: MISVF
6
2015 - HOW MUCH SILVER ?
WORLD INDUSTRIAL FABRICATION
SILVER DEMAND FOR NEW INDUSTRIAL USES
TSX MSV
DB:A0ESX5
QX: MISVF
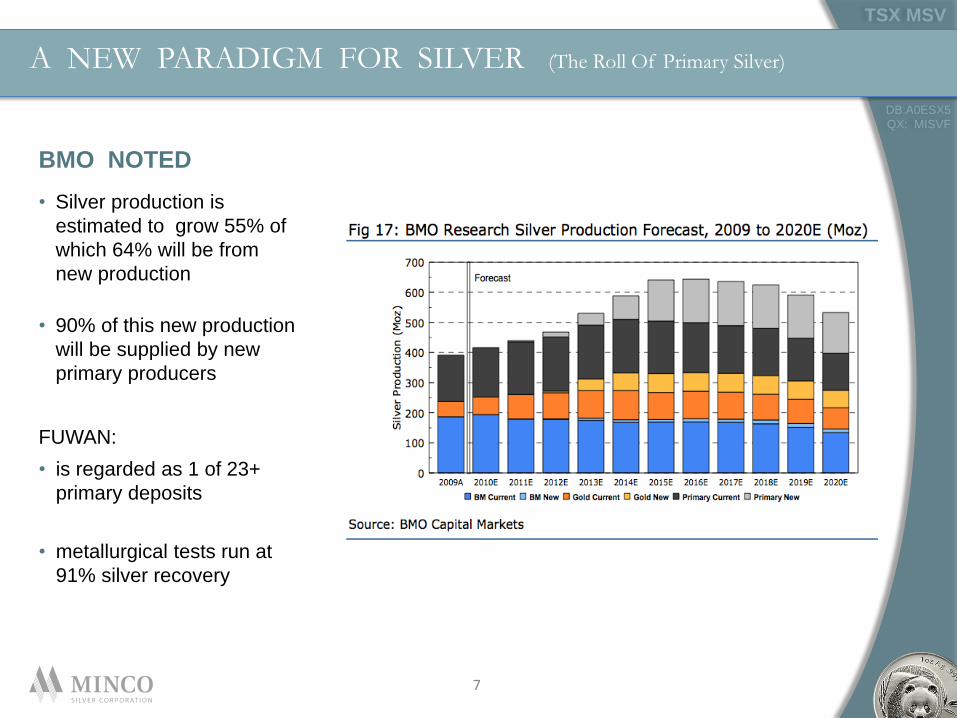
BMO NOTED
• Silver production is
estimated to grow 55% of
which 64% will be from
new production
• 90% of this new production
will be supplied by new
primary producers
FUWAN:
• is regarded as 1 of 23+
primary deposits
• metallurgical tests run at
91% silver recovery
7
A NEW PARADIGM FOR SILVER (The Roll Of Primary Silver)

TSX MSV
DB:A0ESX5
QX: MISVF
8
Minco Silver (The Company)
EXPERIENCED MANAGEMENT
FULLY FINANCED
LOW SHARE STRUCTURE
ROBUST PROJECT
HIGH GROWTH POTENTIAL
STRONG METAL PRICES
Minco Silver is a Canadian
based mining company
focused on the acquisition
and development of high
quality silver properties.

TSX MSV
DB:A0ESX5
QX: MISVF
SHARES & CAPITALIZATION As at June 30, 2012 ANALYTICAL COVERAGE As at June 30 2012
Shares outstanding 58,927,752 Raymond James Brad Humphrey
Warrants 418,000 BMO Andrew Kaip
Options 6,154,870 Haywood Securities Chris Thompson
Fully Diluted 65,500,622 Union Securities Philip Ker
52 week Hi/Lo C$1.26 - C$4.08
CAPITALIZATION As at June 30, 2012
Market Capitalization C$89M
Working Capital C$69,152.M
Cash C$68,172.M
Debt Nil
SHAREHOLDERS
Minco Gold 22.10%
International Institutions (approx) 23.75%
CDN. Institutions (approx) 10.90%
9
MSV: Corporate Snapshot

TSX MSV
DB:A0ESX5
QX: MISVF
10
MSV vs. Market
--
$1.00
$2.00
$3.00
$4.00
$5.00
$6.00
$7.00
$8.00
Sh
are
Pric
e (
C$)
MSV S&P/TSX Composite (Index to MSV)
Source: FactSet

TSX MSV
DB:A0ESX5
QX: MISVF
PROJECT
• Positive Bankable Feasibility on the Fuwan Project
• Completed Water Monitoring Study January 2012
• Majority of permits in place
FINANCING
• Fully financed
• Closed C$45.22 million bought deal (March 3, 2011)
- 7,600,000 common shares at C$5.95/share
- Led by BMO Capital Markets in syndication with
Haywood Securities, Raymond James, & Union Securities
• Retained low share structure
GENERAL
• Analytical coverage by BMO, Raymond James, Haywood, & Union
- Consistent price target increases
- Analysts ranked #1, #2, & #3, by Thomson Reuters (2010)
11
Highlights

TSX MSV
DB:A0ESX5
QX: MISVF
Foshan Minco is the operating
company for the Fuwan Silver
Project & holds 100% of the
exploration permits.
Ownership of Foshan Minco
• 90% Minco Silver
• 10% carried interest by
Guangdong Geological
Exploration & Development
Corporation, a government
entity
12
Fuwan Silver Project
Located in Guangdong Province, 45 km southwest of Guangzhou, China’s 4th largest city.
Large land package: Over 200 km2 with only a small portion explored to date
Fuwan Silver
★

TSX MSV
DB:A0ESX5
QX: MISVF
13
Exploration Permits
• 3 permits covering 205 km2
• Only company working this area
• 3 additional showings in
immediate area
• One showing or 3% of property
worked to date
• Excellent potential to upgrade current
indicated and inferred resources
• 10km strike length could host additional
3-400 mill oz (approx)

TSX MSV
DB:A0ESX5
QX: MISVF
• Silver zones are shallow (250-450m deep), high grade, flat-lying, and strata bound
• Hosted within Carboniferous limestone unconformity overlain by Triassic sandstone
• Eight silver zones controlled by a NE trending syncline
• Total strike length is 2,800 metres, deposit remains open along strike to the
southwest and down dip to the southeast
14
Fuwan Silver Deposit
Longitudinal section

TSX MSV
DB:A0ESX5
QX: MISVF
15
Reserve / Resource Statement* (NI 43-101)
Classification tonnes Ag Ag Au Pb Zn
(g/t) (oz) (g/t) (%) (%)
Probable Reserve (diluted - In Situ) 9,118,000 189 55,300,000 0.15 0.20 0.57
~~~ all of the economics contained in the IFS are derived from the Probable Reserves only ~~~
Indicated Resources**
Fuwan Permits *** 4,830,000 188 28,968,000 0.17 0.20 0.56
Changkeng Permits - **** 2,027,000 142 9,235,000 0.40 0.20 0.61
Total Indicated Resources 6,857,000 173 38,203,000 0.24 0.20 0.57
Inferred Resources**
Fuwan Permits 10,241,000 171 56,147,000 0.26 0.26 0.72
Changkeng Permits **** 1,049,000 212 7,136,000 0.29 0.37 0.86
Total Inferred Resources 11,290,000 174 63,283,000 0.26 0.27 0.73
•***NI 43-101 compliant, P&E Engineering ( May 2008) 40 g/t cut off
•*** Probable reserves were subtracted from the Indicated resources at the Fuwan Permit
• **** Resources reported on the Changkeng permit represents 51% of the actual resource s and reflects Minco’s
actual ownership.

TSX MSV
DB:A0ESX5
QX: MISVF
16
Reserves & Resources Layout
Red = Probable reserves Silver = Indicated & Inferred

TSX MSV
DB:A0ESX5
QX: MISVF
17
Fuwan Feasibility Study Highlights
•Completed by Wardrop, NERIN & ERM to International Standards
•Only Reserves of 55 million oz are used in the Study Study
• 55 million oz AG classified as probable reserve
•103 million oz AG classified as indicated & inferred resources Reserve/Resources
•Decline access
•Underground mechanized mining
•Combination of cut & fill, drift & fill, room & pillar Mining
•3,000 tpd, conventional floatation, 5.5 million oz p.a.
•End products: two concentrates: silver/lead; zinc/silver
• Metallurgical silver recovery of 91% Processing
•Capex: $73.1 M
•Opex: $34.42/tonne of ore processed
•NPV: $111.5 M
•Pre-tax IRR: 33.20%
•Payback: 2.3 years
Economics - Silver Price used: $13.57/ounce - Discount rate: 6%

TSX MSV
DB:A0ESX5
QX: MISVF
18
Bankable Feasibility Study (IFS)
KEY INDICATORS Results (in US dollars)
Probable Reserve of Silver (9.118 Mt averaging 189 g/t of Silver) 55 million ozs
Mine Life 9.2 years
Metallurgical Silver Recovery 91%
Average Annual Silver Recovery 5.5 million ozs
Operating Costs (per tonne ore processed)
(Mining = $18.01; Processing = $9.90; Tailings = $1.13; G&A = $4.78; Surface = $0.60) $34.42
Cash Cost per Payable ounce of Silver $5.65 (per oz)
Pre-Production Capital Costs (CAPEX) $73.1 million
Total Revenue $648.2 million
Total Operating Cost $313.8 million
Total Royalty Payment $ 24.3 million
Total Operating Cash Flow $310.0 million
NPV @ 8% Discount Rate $ 95.3 million
NPV @ 6% Discount Rate $111.5 million
Pre-Tax IRR 33.20%
Payback Period of Pre-Production Capital Costs 2.3 years
Construction Period 20 – 24 months
~~Silver Price used in above study $13.57 per oz (Base Case)~~ (3 year rolling average as at April 29, 2009)
Study done on only 1/3 of material available on site
COMPLETED SEPT. 2009

TSX MSV
DB:A0ESX5
QX: MISVF
19
Project Infrastructure
• Accessible by paved highway & nearby waterway
• Power, water, fuel & supplies easily are obtainable
EXCELLENT INFRASTRUCTURE
• Property accommodates tailings, waste disposal, & processing plant sites
• General labour readily accessible
• Supporting industries in close proximity
Paved highway near Fuwan
Power Plant
Fuwan Township Pop. 30,000
Eastern view from Fuwan Deposit

TSX MSV
DB:A0ESX5
QX: MISVF
20
Development Capex (as at Jul 31 2012)
Capex
(% Mkt Cap) 968% 265% 1537% 822% 15% 295% 155% 25% 86% 83% n/a n/a
$647
$574 $552
$411
$327 $297 $270
$133$73
$21
Levo
n R
eso
urc
es
Be
ar
Cre
ek
Min
es
Ma
na
ge
me
nt
So
uth
Am
eric
an
Silv
er
Tah
oe
Re
sou
rce
s
Wild
ca
t Silv
er
Ork
o S
ilve
r
MA
G S
ilve
r
Min
co
Silv
er
Arg
en
tex
Mira
sol
Pa
ram
ou
nt
Go
ld
& S
ilve
r
n/a n/a
Source: Factset, Public Disclosure

TSX MSV
DB:A0ESX5
QX: MISVF
IRR
• MSV provides a superior IRR
• Fig 45 indicates MSV’s ranking
NPV Sensitivity
• MSV ranks solidly with
it’s peers
• Industrial demand to grow
22% by 2015
21
IRR & NPV Sensitivity

TSX MSV
DB:A0ESX5
QX: MISVF
22
EV/Resources (US$/oz Ag Eq) (Exc. base metals)
$4.50
$3.50
$1.88
$0.85 $0.68
$0.32 $0.31 $0.22 $0.10 $0.08 $0.03 $0.01 --
$0.50
$1.00
$1.50
$2.00
$2.50
$3.00
$3.50
$4.00
$4.50
$5.00
Tah
oe
Re
sou
rce
s
MA
G
Mira
sol
Re
sou
rce
s
Ork
o S
ilve
r
Pa
ram
ou
nt
Wild
ca
t Silv
er
Arg
en
tex
Be
ar
Cre
ek
Min
co
Silv
er
Min
es
Ma
na
ge
me
nt
So
uth
Am
eric
an
Silv
er
Lev
on
Re
sou
rce
s
US$
/oz
Ag
Eq
Source: Public Disclosure, Equity Research
Note: Ag Eq resources calculated using long-term prices of US$21.70/oz Ag, US$1,250/oz Au, US$2.75/lb Cu, US$0.91/lb Pb and US$0.95/lb Zn
1. Excludes base metals

TSX MSV
DB:A0ESX5
QX: MISVF
23
Fuwan Surface Layout

TSX MSV
DB:A0ESX5
QX: MISVF
24
Stage of Development Expected Start-up Date
2014 2014
2016
20142015 2015
2017
Min
co
Silv
er
Tah
oe
Re
sou
rce
s
Be
ar
Cre
ek
Ork
o S
ilve
r
So
uth
Am
eric
an
Silv
er
MA
G S
ilve
r
Levo
n
Re
sou
rce
s
Min
es
Ma
na
ge
me
nt
Arg
en
tex
Wild
ca
t Silv
er
Mira
sol
Pa
ram
ou
nt
Go
ld &
Silv
er
n/a n/a n/an/a n/a
Construction Feas. Pre-Feas. Scoping
Source: Public Disclosure

TSX MSV
DB:A0ESX5
QX: MISVF
APPROVED
• Chinese exploration report approved by MOLAR (Ministry of Land and Resources)
• Chinese Feasibility Study
• Project Approved by the Gaoming County government
• Soil and Water Conservation Plan
• Mining Area Permit approved by MOLAR
• Land use permit
• Geological Hazard Assessment
• Technical Panel Review of the Regulatory Environmental Impact Assessment (EIA)
APPROVAL PENDING
• Administrative Approval of Regulatory EIA
• Mine Development Plan
• Preliminary Safety Assessment
IN PROGRESS
• Project Application
25
Permitting Status

TSX MSV
DB:A0ESX5
QX: MISVF
MSV solidly ranked:
- As Project
- Financially
Backed
• 157 million oz AG
• CDN$68.0 Mil cash
• 58.9 Mil shares I&O
• Institutionally held
• As at 06/30/2012
26
BMO Rankings of Equities

TSX MSV
DB:A0ESX5
QX: MISVF
TO BECOME A MID TIER SILVER PRODUCER
• Putting the Fuwan deposit into production
• Follow through with regional exploration
• M&A’s of properties fitting our corporate and property
portfolio profile
THE ADVANTAGES (Mining in China)
• Low Capital and Operating Costs
• Cost effective mining and equipment costs
• Labor costs lower than in most mining jurisdictions
CLOSE TO END MARKET
• Numerous smelters in area wanting to purchase the product
• Third largest silver producing nation
• Large silver consumer
27
Our Strategy - Advantage
TSX MSV
DB:A0ESX5
QX: MISVF
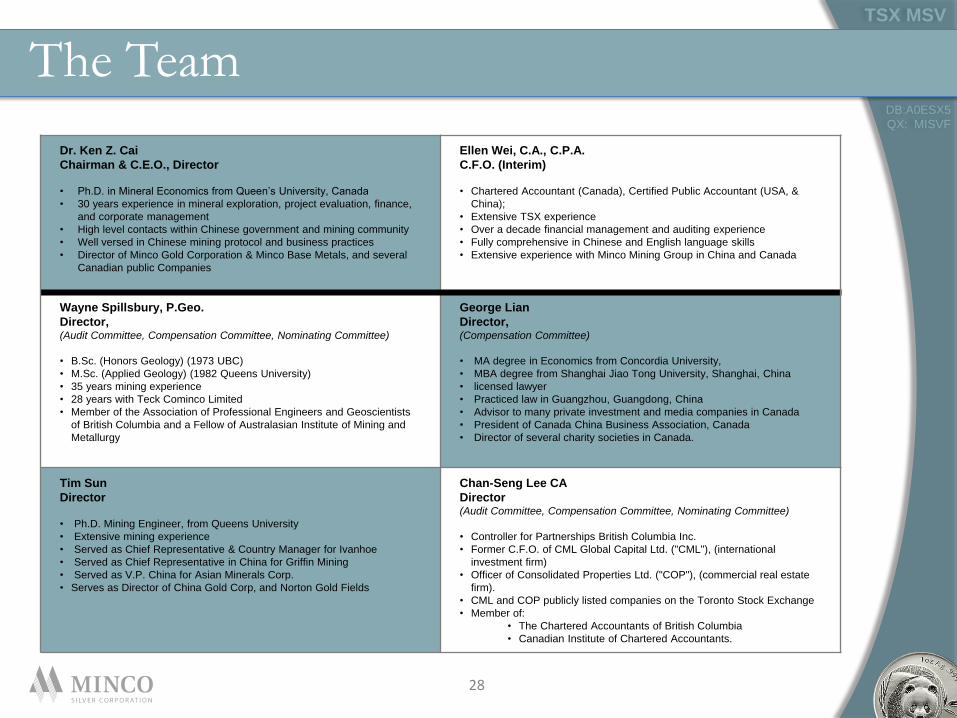
Dr. Ken Z. Cai
Chairman & C.E.O., Director
• Ph.D. in Mineral Economics from Queen’s University, Canada
• 30 years experience in mineral exploration, project evaluation, finance,
and corporate management
• High level contacts within Chinese government and mining community
• Well versed in Chinese mining protocol and business practices
• Director of Minco Gold Corporation & Minco Base Metals, and several
Canadian public Companies
Ellen Wei, C.A., C.P.A.
C.F.O. (Interim)
• Chartered Accountant (Canada), Certified Public Accountant (USA, &
China);
• Extensive TSX experience
• Over a decade financial management and auditing experience
• Fully comprehensive in Chinese and English language skills
• Extensive experience with Minco Mining Group in China and Canada
Wayne Spillsbury, P.Geo.
Director, (Audit Committee, Compensation Committee, Nominating Committee)
• B.Sc. (Honors Geology) (1973 UBC)
• M.Sc. (Applied Geology) (1982 Queens University)
• 35 years mining experience
• 28 years with Teck Cominco Limited
• Member of the Association of Professional Engineers and Geoscientists
of British Columbia and a Fellow of Australasian Institute of Mining and
Metallurgy
George Lian
Director, (Compensation Committee)
• MA degree in Economics from Concordia University,
• MBA degree from Shanghai Jiao Tong University, Shanghai, China
• licensed lawyer
• Practiced law in Guangzhou, Guangdong, China
• Advisor to many private investment and media companies in Canada
• President of Canada China Business Association, Canada
• Director of several charity societies in Canada.
Tim Sun
Director
• Ph.D. Mining Engineer, from Queens University
• Extensive mining experience
• Served as Chief Representative & Country Manager for Ivanhoe
• Served as Chief Representative in China for Griffin Mining
• Served as V.P. China for Asian Minerals Corp.
• Serves as Director of China Gold Corp, and Norton Gold Fields
Chan-Seng Lee CA
Director (Audit Committee, Compensation Committee, Nominating Committee)
• Controller for Partnerships British Columbia Inc.
• Former C.F.O. of CML Global Capital Ltd. ("CML"), (international
investment firm)
• Officer of Consolidated Properties Ltd. ("COP"), (commercial real estate
firm).
• CML and COP publicly listed companies on the Toronto Stock Exchange
• Member of:
• The Chartered Accountants of British Columbia
• Canadian Institute of Chartered Accountants.
28
The Team

TSX MSV
DB:A0ESX5
QX: MISVF
WHO WE SELL TO:
• Direct to Smelter
• At world market prices
WHERE WOULD WE RANK
• #1 in China
• # 7 for Primary production (Brooks Hunt stats)
“THE ROAD AHEAD”
Completion of:
• Administrative approval of EIA
• Receipt of Mining License
• Commence mine construction upon receipt of administrative EIA
29
Summary

TSX MSV
DB:A0ESX5
QX: MISVF
0.0%
2.0%
4.0%
6.0%
8.0%
10.0%
12.0%
14.0%
16.0%
0
2,000
4,000
6,000
8,000
10,000
1980 1984 1988 1992 1996 2000 2004 2008 2012E 2016E
Gold (Yuan/Oz) Chinese Real GDP Growth
Yuan/oz YoY%
30
China’s Economic Outlook
CHINA:
• Rapid economic growth over the past two decades
• Represents over 20% of major mining companies’ metal sales
• 30 - 50% of global raw materials demand
• Adjusting its economic model to imports
• Has over 1.3bn consumers with
Increasing personal income
Increased consumption
Has strong GDP growth
Developing luxury goods market
Gold (Yuan/oz) and China Real GDP growth (%)
Source: World Gold Council, IMF (World Economic Outlook Update, April 2012)
Source: World Gold Council

TSX MSV
DB:A0ESX5
QX: MISVF
31
Chinese Mining M&A • China has been aggressive in acquiring industrial / base metals as part of its strategic purchasing policy
• Also, active in oil and gas sectors as evidenced by CNOOC’s recently announced US$18bn acquisition of Nexen
• Below is a select list of recent Chinese M&A activity in precious metals
Note: Select acquisitions by Chinese companies of foreign mining assets since January 2008 greater than US$50mm. Does not include strategic investments Source: Bloomberg, Public Disclosure
Announcement
Date Acquirer Target Target Assets
Target Stage &
Commodity
Transaction
Value (US$mm)
09/29/2011 Minmetals Resources Anvil Metals D.R.C (Congo) Producer / Copper $1,256mm
07/05/2011 Jinchuan Group Metorex D.R.C (Congo) Producer / Copper $1,393mm
12/20/2010 Jinchuan Group Continental Minerals China Feasibility / Copper $356mm
03/01/2010 China Sci-Tech
Mining Chariot Resources Peru Developer / Copper $214mm
12/28/2009 CRCC-Tongling Corriente Resources Ecuador Developer / Copper $557mm
10/16/2009 Jilin Jien Canadian Royalties Canada Developer / Nickel $150mm
4/28/2008 Northwest / Jinduicheng
Yukon Zinc Canada Developer / Zinc $92mm
3/14/2008 Sinosteel Midwest Australia Producer / Iron Ore $1,231mm
01/06/2008 Jinchuan Tyler Resources Mexico Developer / Copper $195mm

TSX MSV
DB:A0ESX5
QX: MISVF
2772-1055 West Georgia St.
PO Box 11176 RCM
Vancouver, B.C.
Canada V6E 3R5
T.F. 1. 888. 288. 8288
TEL 604. 688. 8002
Fax 604. 688. 8030
www.mincosilver.ca
TSX:MSV QX:MISVF