Mimosa 16: « final results » 14 & 20 µm Mimosa 18: preliminary results

1
Mimosa Mine – Presentation to Implats’ investors
20 October 2005
2
Mimosa vision
To remain in the lowest cost quartile of
platinum producers to provide growth
and superior returns to our shareholders

2
3
Mimosa history
1994/95 - Zimasco starts current operations :- Phase I 200tpd- Phase II 700tpd
1996 - Claims consolidated into mining lease area of 6,500 ha
1998 - Feasibility studies for phase III2001 - Phase III project commences2003 - Full commissioning of 4050 tpd plant2005 - Phase IV Upgrade Project in progress
4
Organisational structure
Managing DirectorA Mhembere
General ManagerP Chimboza
Technical DirectorH Mashanyare
Mining ExecutiveK Ukama
HRMtombeni
Asset MgtSwart
PlantShamu
M / HandlingChauke
T / ServicesMuganyi
M / NorthBadza
M / SouthNyamambi
FinanceShoko
SHEManjoro
TOTAL EMPLOYEE COMPLEMENT 1581
Projects MgrA.I. Makuvaro
Corporate Office

3
3
Platinum in Zimbabwe
Mimosa
6
Mimosa mining lease

4
7
20-year mining plan
8
Mining operations
Mineral Resources/ReservesOre body characteristicsGeneral mine layoutMining methodRock mechanics andground controlGrade controlUnderground services

5
9
Schematic stope and mine layout
10
General section layoutGeneral section layout
Panel 1
Panel 2
Panel 3
Panel 4
Panel 5
Panel 6
Panel 7
4m15m
3m
100mCurrent Grizzleyposition
Continuous pillar
3m
6m
Pillar
V/Holing
10m
ASG
RoomRoom and Pillar Miningand Pillar Mining
Air, water,cable linesJet fan

6
11
Mimosa grade profileM
ETA
L DI
STR
IBUT
ION
ACR
OSS
THE
MS
Z
0
1
2
3
4
5
6
315 285 255 225 195 165 135 105 75 45 15 -30 -60 -90 -120 -150 -180 -210 -240 -270 -300 -330 -360
PGM
s pp
m
0
0.05
0.1
0.15
0.2
0.25
0.3
0.35
0.4
0.45
% B
ASE
MET
ALS
Pt
Pd
Ni
Cu
12
Mineral processing
• Design from Mintek test work and past operation
• 3 Stage crushing
• 2 MF circuit
• 4e recoveries – total 77,8%
• Produce final concentrate
• Concentrate transported by road to IRS
• Long term concentrate off take agreement

7
13
Simplified flow-sheet
Mining
ConveyingTo Surface
PrimaryCrushing
Secondary &Tertiary
Crushing
2 StageMilling
Flotation
Filtration
Road TransportConcentrate
Tailings
1,438,438 tpa
43,153 tpa
Mining
ConveyingTo Surface
0.00
0.10
0.20
0.30
0.40
0.50
0.60
Rat
e
DIFR 0.48 0.50 0.49 0.46 0.37 0.34 0.31 0.35 0.31 0.33 0.30 0.22
Oct-04 Nov-04 Dec-04 Jan-05 Feb-05 Mar-05 Apr-05 May-05 Jun-05 Jul-05 Aug-05 Sep-05
Disabling injury frequency rate

8
15
Quarterly average – ore hoisted
-
50,000
100,000
150,000
200,000
250,000
300,000
350,000
400,000
450,000
1996Ave
1997Ave
1998Ave
1999Ave
2000Ave
2001Ave
2002Ave
2003Ave
2004Ave
2005Ave
2006Qtr 1
2006PlanQtr 2
2006PlanQtr 3
2006PlanQtr 4
Tonn
es
Actual Plan
16
Quarterly mined Pt grade
0.000.200.400.600.801.001.201.401.601.802.002.202.40
1996 Ave
1997Ave
1998Ave
1999Ave
2000Ave
2001Ave
2002Ave
2003Ave
2004Ave
2005Ave
2006Qtr 1
2006PlanQtr 2
2006PlanQtr 3
2006PlanQtr 4
Pt g
/t
Actual Plan

9
17
Quarterly tonnes milled
0
40000
80000
120000
160000
200000
240000
280000
320000
360000
400000
440000
1996Ave
1997Ave
1998Ave
1999Ave
2000Ave
2001Ave
2002Ave
2003Ave
2004Ave
2005 Ave
2006Qtr 1
2006Plan Qtr
2
2006Plan Qtr
3
2006Plan Qtr
4
Ton
nes
Actual Plan
18
Quarterly PGM ozs
05,000
10,00015,00020,00025,00030,00035,00040,00045,000
Sep-03
Dec-03
Mar-04
Jun-04
Sep-04
Dec-04
Mar-05
Jun-05
Sep-05
Dec-05
Mar-06
Jun-06
OZ ActualPlan Budget

10
19
Revenue contribution by product
53%
11%
5%
3%
24%
4%
Platinum
Palladium
Rhodium
Gold
Nickel
Other
20
Quarterly CPTM
0.00
5.00
10.00
15.00
20.00
25.00
30.00
35.00
CPTM
CPTM 16.56 19.25 26.38 24.12 25.72 28.72 30.67 28.77 29.50 27.79 26.30
Dec-03 Mar-04 Jun-04 Sep-04 Dec-04 Mar-05 Jun-05 Sep-05 Dec-05 Mar-06 Jun-06
Actual Actual Actual Actual Actual Actual Actual Actual Budget Budget Budget

11
21
CPTM TrendCOST PER TONNE MILLED TREND
10.00
15.00
20.00
25.00
30.00
35.00
40.00
Oct-03
Nov-03
Dec-03
Jan-04
Feb-04
Mar-04
Apr-04
May-04
Jun-04
Jul-04
Aug-04
Sep-04
Oct-04
Nov-04
Dec-04
Jan-05
Feb-05
Mar-05
Apr-05
May-05
Jun-05
Jul-05
Aug-05
Sep-05
CPTM-GROSS CPTM-NET
22
Major expense elements
Labour Costs21%
Power2%
Chemicals and Reagents12%
Lhd Spares & Service Contract
15%Mechanical Tools and Pump Spares
7%
Explosives11%
Conveyor Belting & Accessories
3%
Jackhammer Drill Steels & Bits 8%
Outside transport2%
Supporting3%
Protective Clothing2%
Steel Balls5%
General Expenses6%
Other Stores3%

12
23
Inflation exchange rate parity
INFLATION-Exchange Rate Parity
-5010 01502 0 02 503 0 03 504 0 04 5050 05506 0 06 5070 07508 0 08 509 0 09 501,0 0 01,0 501,10 01,1501,2 0 01,2 501,3 0 01,3 50
C PI Exchange rat e Par it y
24
CPTM vs CPI exchange rate parity
CPTM vs CPI Exchange Rate Parity
-
50
100
150
200
250
300
350
400
Oct-03
Nov-03
Dec-03
Jan-0
4
Feb-04
Mar-04
Apr-04
May-04
Jun-04
Jul-0
4
Aug-04
Sep-04
Oct-04
Nov-04
Dec-04
Jan-0
5
Feb-05
Mar-05
Apr-05
May-05
Jun-05
Jul-0
5
Aug-05
Sep-05
UNIT
S
CPT-Gross Parity

13
25
CPTM vs CPI exchange rate parity (cont’d)
25.62CPT- PlanSep-05
2.49Exchange rate inflation paritySep-05
(2.36)Differential
28.21CPT-ActualSep-05
25.85 18.13 7.72 CPTM-TheoreticalSep-05
14.567.287.28CPTMOct-03
TotalLocal PortionForeign Portion
26
Analysis of first quarter CPTM by currency
ANALYSIS OF 1ST QTR CPTM BY CURRENCY
52%
16%
29%
3%
Zim DollarRandUSDEuro and Other

14
27
Breakdown of ZW$ costs
labour43%
Outside transport4%General expenses
8%Other Stores
5%
Power4%
Duty and Freight16%
LHD Repairs 4%
Sherphard Crook recon
5%
Steel Balls9%
Mill liners2%
28
Mining – major expense elements
22%
17%
5%13%
4%
30%
3%6%
Explosives
Labour
Support
Jack hammer andRockdrill Spares
Drill Steels and Bits
LHD Costs
Pipes and Fittings
Mechanical andScreening Spares
15
29
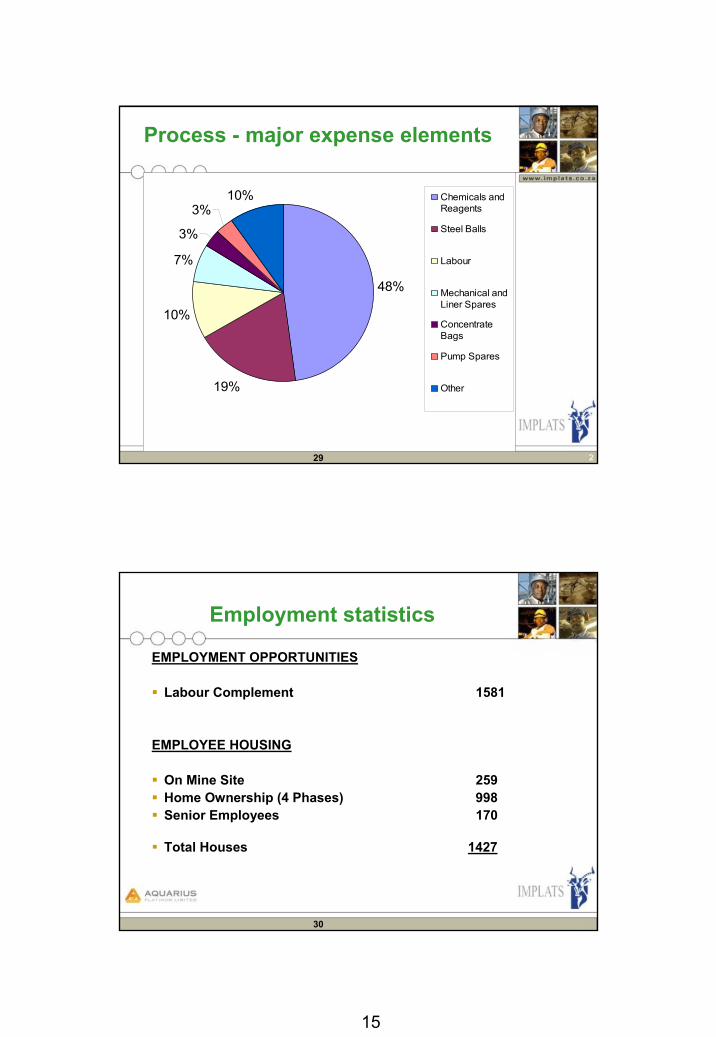
Process - major expense elements
48%
19%
10%
7%
3%
3%10% Chemicals and
Reagents
Steel Balls
Labour
Mechanical andLiner Spares
ConcentrateBags
Pump Spares
Other
30
Employment statistics
EMPLOYMENT OPPORTUNITIES
Labour Complement 1581
EMPLOYEE HOUSING
On Mine Site 259Home Ownership (4 Phases) 998Senior Employees 170
Total Houses 1427

16
31
Local community support
Donation of equipment to Mhondongori Clinic worth ZW$60m
Donations to schools in the district.
Sponsorship of the ZRP Cop of the Month Awards
Deliberate policy to employ local labour recruited through Chiefs and Councillors.
Putting up infrastructure within the local community.
Construction of infrastructure within the Zvishavane Town Council area.
32
Thank You