
MILTON ROAD ~ MITCHAM'S CORNER PARAMICS MODEL · three ‘roundal junctions’ at Chesterton Road,...
26
MILTON ROAD ~ MITCHAM'S CORNER PARAMICS MODEL INITIAL OPTION TESTING NOVEMBER 2016
Transcript of MILTON ROAD ~ MITCHAM'S CORNER PARAMICS MODEL · three ‘roundal junctions’ at Chesterton Road,...

MILTON ROAD ~ MITCHAM'S CORNER PARAMICS MODEL INITIAL OPTION TESTING
NOVEMBER 2016

Type of document (version) Project no: 700012012 Date: November 2016
– WSP | Parsons Brinckerhoff 62-64 Hills Road Cambridge CB2 1LA Tel: +44(0)1223 558050 www.wsp-pb.com
MILTON ROAD ~ MITCHAM'S CORNER PARAMICS MODEL INITIAL OPTION TESTING Cambridgeshire County Council

Q U A L I T Y M A N A G E M E N T ISSUE/REVISION FIRST ISSUE REVISION 1 REVISION 2 REVISION 3
Remarks DRAFT ISSUE FINAL ISSUE
Date 18TH July 2016 7TH November 2016 28th November 2016
Prepared by S Biggs S Biggs S Biggs
Signature
Checked by D Pacey N Poulton N Poulton
Signature
Authorised by D Pacey D Pacey N Poulton
Signature
Project number 70012012 70012012 70012012
Report number
File reference Mitcham’s Corner Gyratory Options_160718.docx
Mitcham’s Corner Gyratory Options_161107.docx
Mitcham’s Corner Gyratory Options_161128.d

ii
Milton Road ~ Mitcham's Corner Paramics Model WSP | Parsons Brinckerhoff Cambridgeshire County Council Project No 700012012 November 2016
P R O D U C T I O N T E A M
WSP | PARSONS BRINCKERHOFF
Project Director Darren Pacey
Project Manager Neil Poulton
Project Modeller Stephanie Biggs

iii
Milton Road ~ Mitcham's Corner Paramics Model WSP | Parsons Brinckerhoff Cambridgeshire County Council Project No 700012012 November 2016
TABLE OF CONTENTS 1 INTRODUCTION ...........................................................................1
2 MOVEMENT PROPOSAL MODELLING ......................................1
3 MODELLING RESULTS ...............................................................3
4 CONCLUSIONS ............................................................................6
T A B L E S TABLE 3-1: AVERAGE NETWORK PERFORMANCE .....................................................4 TABLE 3-1: PEAK HOUR LINK FLOWS (VEHICLES) .....................................................5
F I G U R E S FIGURE 6-1 PARAMICS NETWORK OF THE MOVEMENT PROPOSALS FOR
MITCHAM’S CORNER ...................................................................2
A P P E N D I C E S A P P E N D I X A MOVEMENT PROPOSALS FOR MITCHAM’S CORNER
(FIGURE 27, PAGE 33 IN DRAFT SPD) A P P E N D I X B JOURNEY TIME GRAPHS A P P E N D I X C QUEUE GRAPHS

1
Milton Road ~ Mitcham's Corner Paramics Model WSP | Parsons Brinckerhoff Cambridgeshire County Council Project No 700012012 November 2016
1 INTRODUCTION 1.1 BACKGROUND
1.1.1 WSP | Parsons Brinckerhoff have been appointed by Cambridgeshire County Council (CCC) to assess initial conceptual designs for the development of a public realm and reduced speed environment at Mitcham’s Corner located at the southern end of Milton Road where it meets Victoria Road and Chesterton Road.
1.1.2 The existing layout provides a 2-lane one-way circulatory carriageway forming a gyratory for the movements through the junction. Pedestrian crossings are provided on the approach roads into and out of the junction.
2 MOVEMENT PROPOSAL MODELLING 2.1 DESCRIPTION OF MODELLING WORK
2.1.1 The validated Base model that was prepared by Atkins for CCC in January 2015 has been used to assess the movement proposals for Mitcham’s Corner identified in the Draft Mitcham’s Corner Development Framework SPD, prepared by Cambridgeshire City Council in September 2016 (Figure 27 on page 33):
The movement proposals for Mitcham’s Corner from the SPD (Figure 27, page 33) are shown in Appendix A of this report. For the purposes of the modelling work this layout envisages three ‘roundal junctions’ at Chesterton Road, Victoria Avenue and Milton Road to replace the existing one-way operation. Informal uncontrolled crossing points are suggested across the single carriageway reduced speed area. The proposed speed is 20mph with a design speed of 15mph throughout the area.
2.1.2 The validated model flows from the 2014 traffic model have been used to test the scheme using the S-Paramics software.
2.2 SUITABILITY OF S-PARAMICS
2.2.1 It is considered that the S-Paramics software should be able to model the scheme option layouts including the speed reduction because this modelling software is based on road network geometry which has an impact on speeds and gap acceptance which are incorporated within the software. The exert below from the software developers (SIAS), shows that they are confident that a speed reduction can be modelled using their software.
“…will Paramics be able to accurately model the effects of a small change (5mph) in main road link speed on gap acceptance from the side roads? Answer from Paramics Support Centre The two bits of behaviour that will be affected are the speed setting and then the gap acceptance. First, the speed. The road speed limit is taken and used to set a target speed for each vehicle depending on its aggression. The more aggressive drivers will speed, the less aggressive will stay around the speed limit. The target mean and the variation depend on which lane a driver is in on highway links (based on observations from the M25), but it’s a simple calculation of 10% over the limit with 10% spread on urban links. Therefore a road with a 30mph speed limit will have a mean of 33mph and vehicles will be doing 30-36mph depending on aggression. On a road with a 25mph limit I'd expect 25-30mph. It's important to note

2
Milton Road ~ Mitcham's Corner Paramics Model WSP | Parsons Brinckerhoff Cambridgeshire County Council Project No 700012012 November 2016
that this is free flow speed only; vehicles may be travelling at other speeds dictated by car following or turn speeds. Next, the gap acceptance. A collision point is calculated where the vehicles will cross and then a time for the front and back of each to reach and clear that point. There is a knowledgebase article on how this works (#194). It’s all based on speed and time to collision, so there will be differences in gap acceptance if you change the speed limit on the road with major priority. So, the answer is yes, Paramics will model it - because it’s inherent in the way it models driver behaviour. Whether it will make it easier to exit the side roads is a good question though as this also depends on the level of congestion (i.e. are they actually driving at their maximum speed) and on the nature of the main road traffic flow. For example, a pedestrian crossing creating platoons with large gaps between them may have a bigger effect than a small speed limit reduction. The same would be true of a right turn with no filter lane preceding this junction or a bus stop with no layby. It's important to make sure that these kind of aspects are represented in the model (if appropriate) as well as the speed limit reduction, to get a true picture of the overall effect.”
2.2.2 The principles of the driver behaviour characteristics that result from design changes would also be applicable to other junction types including roundabouts; however, the speed on roundabout circulatory links is inherently lower through the design.
2.3 NETWORK
2.3.1 The model network for the movement proposals for Mitcham’s Corner is shown in Figure 2.1 and Figure 2.2. The structure of the network has been developed using the Draft Mitcham’s Corner Development Framework SPD.
Figure 2-1 Paramics Network of the movement proposals for Mitcham’s Corner
2.3.2 In the movement proposals for Mitcham’s Corner a single carriageway is modelled without flares at the junction entries. The speed limit has been set at 15mph on the main road approaches and 10mph on the circulatory links of the roundabouts. The ‘GA look-next’ flag has been applied to short links on the roundabouts to ensure that vehicles entering the junction ‘see’ vehicles already on the preceding link where these links are very short. This helps to ensure that junction capacity is not being over-estimated.

3
Milton Road ~ Mitcham's Corner Paramics Model WSP | Parsons Brinckerhoff Cambridgeshire County Council Project No 700012012 November 2016
2.3.3 In order to simulate the uncontrolled crossing points an end speed of 10mph has been applied to the relevant links which means that all vehicles travel more slowly through the informal crossing points.
2.3.4 There are three methods for setting up roundabouts within S-Paramics as follows:
Roundabout nodes – for very small roundabouts the path of vehicles through the junction and the location of the stop lines (reference points for vehicle paths that represent the beginning and end of each link) means that the conventional roundabout set-up in S-Paramics is not feasible for modelling mini-roundabouts. This method was therefore not considered feasible for this study.
One Priority node – an alternative method is to use a single node and to code all entries with a non-major priority, which achieves a degree of “give way from the right” to mimic roundabout behaviour. This method is most suited to non-congested locations and tends to under-estimate capacity. Due to the levels of traffic and potential for congestion in the study area this method was not appropriate.
Alternative method – this provides for separate nodes at each entry point to the junction and enables coding of the priorities for each such that the circulatory is the priority movement, whilst allowing the straight-on movements to have an appropriate speed.
2.3.5 The alternative method for roundabout coding has been adopted for the mini-roundabouts to best reflect how the junction layout would operate in combination with the reduced speed throughout the area.
2.4 MATRIX
2.4.1 The validated Base 2014 model matrix has been used for the purposes of these initial tests of the gyratory options.
3 MODELLING RESULTS 3.1 INTRODUCTION
3.1.1 The model of the movement proposals for Mitcham’s Corner has been run 10 times for each time period, with the model results being an average of the 10 runs. The 10 runs aim to reflect daily variation, with the average of these being used to represent ‘average’ conditions. Paramics version 2014.1 has been used to run both the Base and movement proposals. Comparisons between the models of:
Overall network delay – represents average journey times for all trips across the entire network included in the Paramics model;
Journey times – journey ‘paths’ have been set up in Paramics to collect journey time information about all vehicles that use a specific route. This includes northbound and southbound on Milton Road and also eastbound and westbound journeys through Mitcham’s corner;
Queues – queue ‘routes’ have been set up on the approaches to junctions throughout the corridor so that a comparison of delay on each approach can be made;
Link Flow / Turn Counts – link and turn flows have been compared at Mitcham’s Corner, Gilbert Road and Elizabeth Way to identify the difference in junction capacity between the options compared with the current situation;

4
Milton Road ~ Mitcham's Corner Paramics Model WSP | Parsons Brinckerhoff Cambridgeshire County Council Project No 700012012 November 2016
Link Speeds – mean link speeds (mph) have been collected within the models to check the model is correctly simulating the speeds that have been coded into the network
3.2 NETWORK PERFORMANCE
3.2.1 The network performance statistics taken from the Paramics models represent average journey times for all trips between all zone pairs within the network. This is presented for the AM and PM peak hours and includes all trips that start and end during that time period. The overall performance of each network is as follows:
Table 3-1: Average Network Performance
AM PEAK HOUR (08.00-09.00)
PM PEAK HOUR (17.00-18.00)
2014 Base 2014 SPD Option 2014 Base 2014 SPD
Option Total Vehicles 11,911 11,640 12,905 12,914 J/T per vehicle (secs) 234 324 257 262 Average Speed (mph) 24 17 22 21 Average Speed (kph) 39 28 35 34
3.2.2 The total vehicles represent the total number of vehicles that start and finish their journey during the peak hour. The total number of vehicles in the matrix is the same for each AM model and each PM model, the variation in the total vehicles arises from differences in congestion levels within the network which leads to a lower number of trips completing their journey during the hour in the AM peak and the same number of vehicles completing their journey in the PM peak. The above table shows that there is a notable impact within the Paramics model network, particularly during the AM peak hour.
3.2.3 The average speed across the network reduces during the AM peak hour as a result of the scheme, with average speeds reducing from 24mph to 17mph. In the PM peak hour, the additional delays are apparent but are less prevalent than in the AM peak hour.
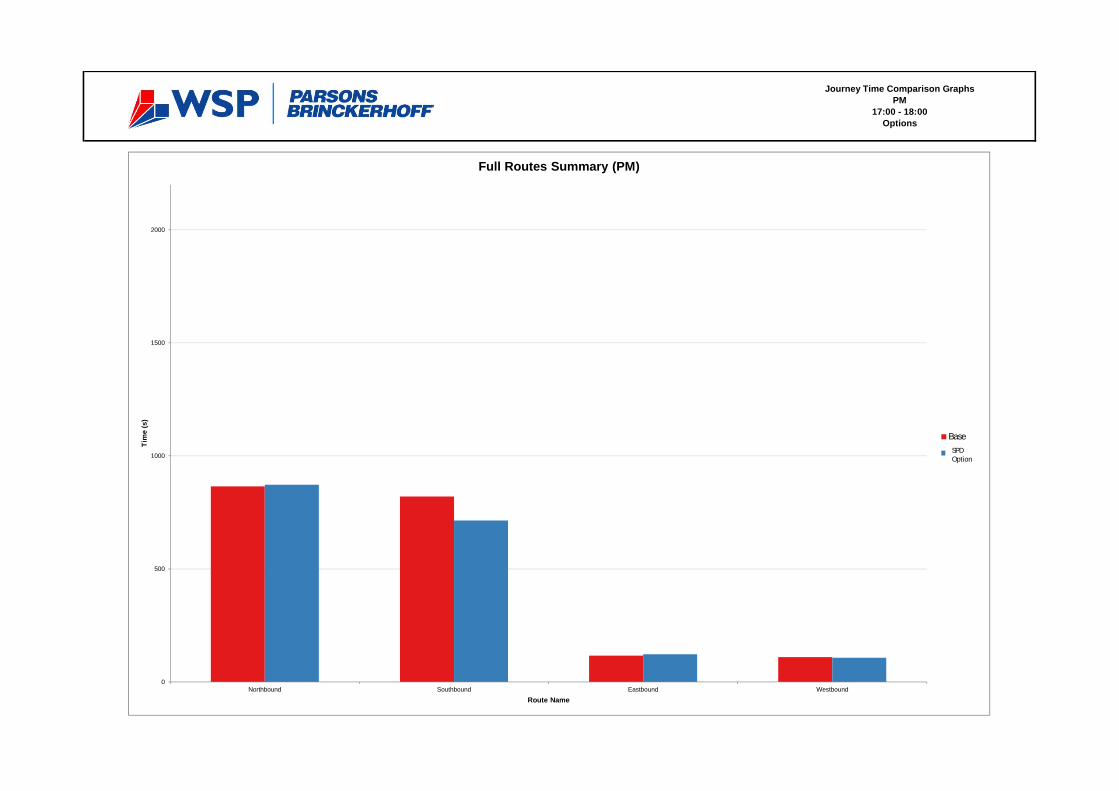
3.3 JOURNEY TIMES
3.3.1 The journey time routes that are set up within the models have been compared and provide a greater insight into the headline network performance results provided in Table 3.1. Graphs are provided in Appendix B which show the journey time outputs. This demonstrates that for the movement proposal for Mitcham’s Corner there are significant increases in the southbound AM peak journey time through Milton Road, with some reduction in the northbound journey time being experienced. In the PM the southbound journey times are shown to be reduced, however, there is some additional delay experienced from Victoria Avenue from the south in the PM compared with the Base model (see next section on queues) but this is not picked up through these journey time graphs because this route is not currently set up for assessment within the models as it did not form the basis of the initial Base model development. The following section on queues provides more context as to where the additional delays occur.
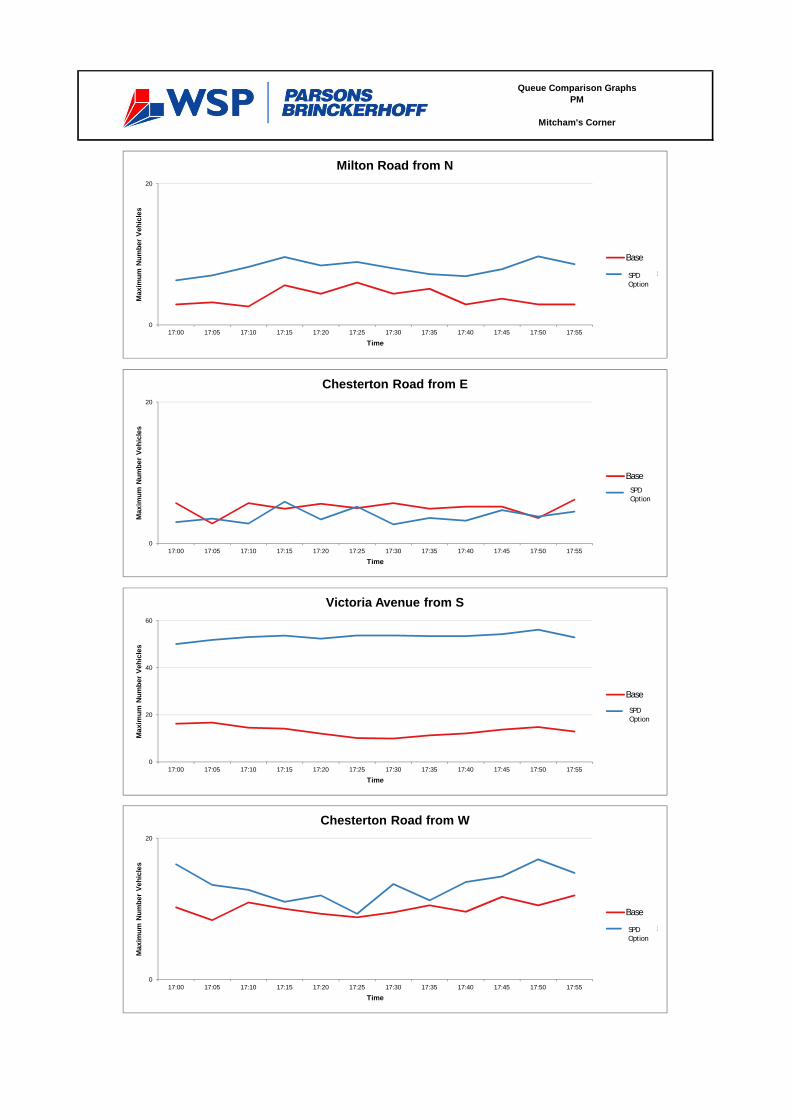
3.4 QUEUES
3.4.1 Queue graphs which compare the level of queueing at certain points within the immediate network close to Mitcham’s Corner have been set up in the Paramics model for analysis. The results of this are presented in the graphs in Appendix C. The movement proposals for Mitcham’s Corner has impacts on queuing during the AM peak hour southbound on Milton Road where the queue consistently extends back to Gilbert Road and beyond to also have further implications on Elizabeth Way.

5
Milton Road ~ Mitcham's Corner Paramics Model WSP | Parsons Brinckerhoff Cambridgeshire County Council Project No 700012012 November 2016
3.4.2 In the PM peak hour, the noticeable queue increase is from the south on the approach from Victoria Avenue where the queue is increased. There is also an increase in the queue from the north on Milton Road.
3.5 LINK FLOWS & TURN COUNTS
3.5.1 The level of the impact on the traffic flow through the gyratory has also been assessed with the results presented in Table 3.2 below.
Table 3-2: Peak Hour Link Flows (vehicles)
APPROACH ARM AM PEAK HOUR (08.00-09.00)
PM PEAK HOUR (17.00-18.00)
IN-inbound/OUT-outbound 2014 Base 2014 SPD Option 2014 Base 2014 SPD
Option MITCHAM’S CORNER Milton Road (N) IN 637 416 364 369 Milton Road (N) OUT 252 253 308 291 Chesterton Road (E) IN 367 368 471 471 Chesterton Road (E) Out 612 517 587 575 Victoria Avenue (S) IN 430 432 803 723 Victoria Avenue (S) OUT 608 503 519 519 Chesterton Road (W) IN 420 420 469 468 Chesterton Road (W) OUT 534 514 602 581 Victoria Road (NW) IN 456 455 443 443 Victoria Road (NW) OUT 301 302 520 493 GILBERT ROAD Milton Road (NE) IN 412 365 303 312 Milton Road (NE) OUT 299 229 363 349 Gilbert Road (W) IN 442 173 283 283 Gilbert Road (W) OUT 170 146 167 166 Milton Road (SW) IN 254 252 308 291 Milton Road (SW) OUT 638 416 364 372 ELIZABETH WAY Milton Road (NE) IN 762 757 709 734 Milton Road (NE) OUT 610 523 753 740 Elizabeth Way (SE) IN 524 416 627 626 Elizabeth Way (SE) OUT 567 492 637 650 Milton Road (SW) IN 298 228 361 347 Milton Road (SW) OUT 414 376 304 313
3.5.2 The greyed cells show those movements where the capacity has been reduced as a result of the scheme and leads to additional queueing and delay within the network. During the AM peak hour it is evident that the traffic flows are reduced into the junction from the north on Milton Road and that this has an impact on the traffic flows heading out of the junction at Victoria Avenue from the south and Chesterton Road east. In the PM peak the traffic flows are reduced coming into the junction from Victoria Avenue from the south and this has an impact on the outbound traffic flows from the junction at Victoria Road north west and Milton Road north.
3.5.3 At Gilbert Road and at Elizabeth Way during the AM peak hour there are knock-on impacts on traffic flows and queueing that is evidenced in Table 3.2 above. At Gilbert Road the traffic flow into the junction from Milton Road (NE) is reduced and from Gilbert Road there is a significant reduction in the traffic getting out of the approach due to the queue back from Mitcham’s Corner from 442 vehicles in the Base to 173 vehicles in the movement proposals model. The traffic flow out of the junction on Milton Road is also therefore reduced.
6
Milton Road ~ Mitcham's Corner Paramics Model WSP | Parsons Brinckerhoff Cambridgeshire County Council Project No 700012012 November 2016
3.5.4 The queue from Mitcham’s Corner extends to Elizabeth Way in the AM peak hour in the movement proposals model which leads to reductions in traffic flows at this junction.
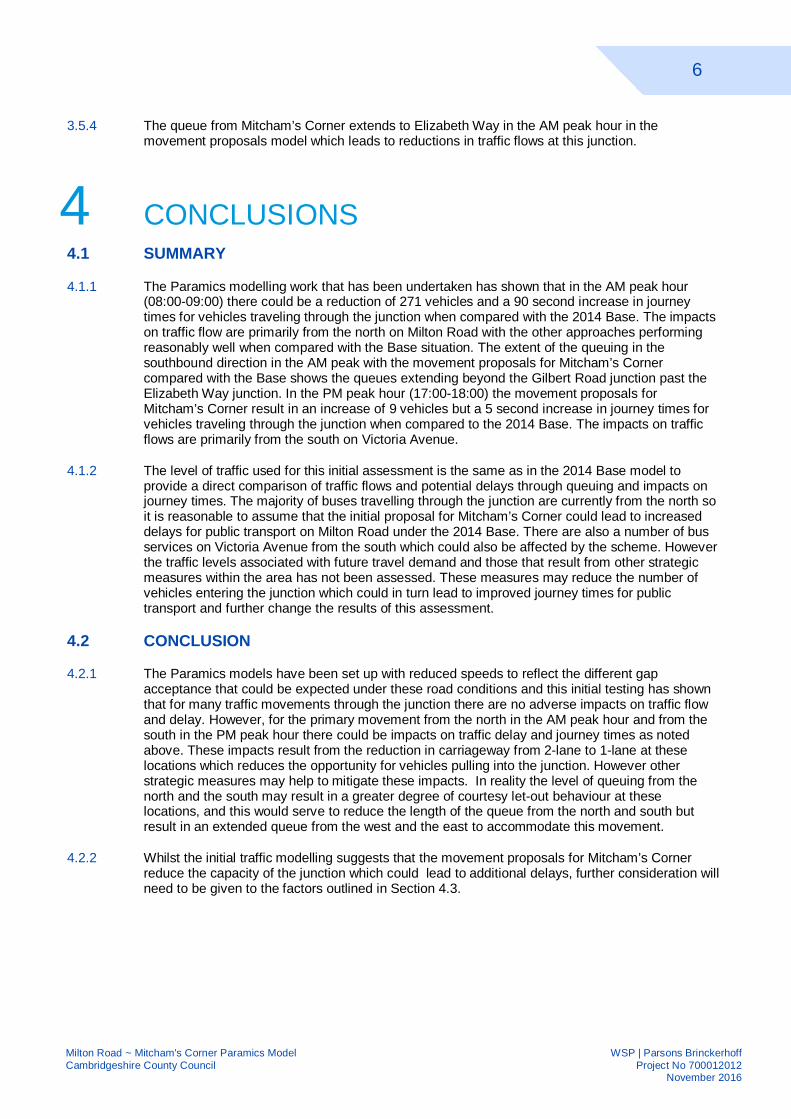
4 CONCLUSIONS 4.1 SUMMARY
4.1.1 The Paramics modelling work that has been undertaken has shown that in the AM peak hour (08:00-09:00) there could be a reduction of 271 vehicles and a 90 second increase in journey times for vehicles traveling through the junction when compared with the 2014 Base. The impacts on traffic flow are primarily from the north on Milton Road with the other approaches performing reasonably well when compared with the Base situation. The extent of the queuing in the southbound direction in the AM peak with the movement proposals for Mitcham’s Corner compared with the Base shows the queues extending beyond the Gilbert Road junction past the Elizabeth Way junction. In the PM peak hour (17:00-18:00) the movement proposals for Mitcham’s Corner result in an increase of 9 vehicles but a 5 second increase in journey times for vehicles traveling through the junction when compared to the 2014 Base. The impacts on traffic flows are primarily from the south on Victoria Avenue.
4.1.2 The level of traffic used for this initial assessment is the same as in the 2014 Base model to provide a direct comparison of traffic flows and potential delays through queuing and impacts on journey times. The majority of buses travelling through the junction are currently from the north so it is reasonable to assume that the initial proposal for Mitcham’s Corner could lead to increased delays for public transport on Milton Road under the 2014 Base. There are also a number of bus services on Victoria Avenue from the south which could also be affected by the scheme. However the traffic levels associated with future travel demand and those that result from other strategic measures within the area has not been assessed. These measures may reduce the number of vehicles entering the junction which could in turn lead to improved journey times for public transport and further change the results of this assessment.
4.2 CONCLUSION
4.2.1 The Paramics models have been set up with reduced speeds to reflect the different gap acceptance that could be expected under these road conditions and this initial testing has shown that for many traffic movements through the junction there are no adverse impacts on traffic flow and delay. However, for the primary movement from the north in the AM peak hour and from the south in the PM peak hour there could be impacts on traffic delay and journey times as noted above. These impacts result from the reduction in carriageway from 2-lane to 1-lane at these locations which reduces the opportunity for vehicles pulling into the junction. However other strategic measures may help to mitigate these impacts. In reality the level of queuing from the north and the south may result in a greater degree of courtesy let-out behaviour at these locations, and this would serve to reduce the length of the queue from the north and south but result in an extended queue from the west and the east to accommodate this movement.
4.2.2 Whilst the initial traffic modelling suggests that the movement proposals for Mitcham’s Corner reduce the capacity of the junction which could lead to additional delays, further consideration will need to be given to the factors outlined in Section 4.3.

7
Milton Road ~ Mitcham's Corner Paramics Model WSP | Parsons Brinckerhoff Cambridgeshire County Council Project No 700012012 November 2016
4.3 FURTHER CONSIDERATION
4.3.1 The traffic flows through the junction will be influenced by other changes to the surrounding road network that are being considered as part of the Greater Cambridge City Deal transport infrastructure programme and are likely to provide different results which will need to be factored into any further modelling work.
4.3.2 Further consideration of highway layout changes to Mitcham’s Corner should also factor in other assessment criteria additional to network performance.
4.3.3 The initial traffic modelling does not acknowledge the ‘place’ function of the streets within the area, which will need to be taken into account when considering any future changes to the highway network.
Appendix A
MOVEMENT PROPOSALS FOR MITCHAM’S CORNER (FIGURE 27, PAGE 33 IN DRAFT SPD)

33
MITCHAM’S CORNER DEVELOPMENT FRAMEWORK
0 20 40 60 80 10010Metres
CHESTERTON ROAD
MIL
TON
ROAD
GEO
RG
E ST
REE
T
CARLYLE ROAD
HER
BER
T ST
REE
T
VICTO
RIA AVEN
UE
PRET
OR
IA R
OAD
GILBERT ROAD
ALBERT STREET
TRAF
ALG
AR R
OAD
H
GR
EEN
'S R
OAD
VIC
TOR
IA P
ARK
PRIM
RO
SE S
TREE
T
SPRI
NGFI
ELD
ROAD
CO
RO
NA
RO
AD
GRAS
MER
E GA
RDEN
S
A
TRAFALGAR STREET
SPRINGFIELD TERRACE
Existing Streets
Figure 27: Movement proposals for Mitcham’s Corner
Reintroduce two way traffic movements
Opportunity Area Boundary (emerging Local Plan, Policy 21)
Local access only
Opportunity for new urban space through remodelling of the existing gyratory
Create new gateways into Mitcham’s Corner
Existing positive gateways
Proposed Amendment to the Opportunity Area Boundary
THE GYRATORY

Appendix B
JOURNEY TIME GRAPHS

Options
Journey Time Comparison GraphsAM
08:00 - 09:00
0
500
1000
1500
2000
Northbound Southbound Eastbound Westbound
Tim
e (s
)
Route Name
Full Routes Summary (AM)
Base
Option 3SPD Option
Options
Journey Time Comparison GraphsPM
17:00 - 18:00
0
500
1000
1500
2000
Northbound Southbound Eastbound Westbound
Tim
e (s
)
Route Name
Full Routes Summary (PM)
Base
Option 3SPD Option

Appendix C QUEUE GRAPHS

Gilbert Road
Queue Comparison GraphsAM
0
20
40
60
80
08:00 08:05 08:10 08:15 08:20 08:25 08:30 08:35 08:40 08:45 08:50 08:55
Max
imum
Num
ber
Vehi
cles
Time
Milton Road from N
Base
Option 3
0
20
40
60
80
100
120
140
08:00 08:05 08:10 08:15 08:20 08:25 08:30 08:35 08:40 08:45 08:50 08:55
Max
imum
Num
ber
Vehi
cles
Time
Gilbert Road from W
Base
Option 3
SPD Option
SPD Option

Elizabeth Way
Queue Comparison GraphsAM
0
20
40
08:00 08:05 08:10 08:15 08:20 08:25 08:30 08:35 08:40 08:45 08:50 08:55
Max
imum
Num
ber
Vehi
cles
Time
Elizabeth Way from E
Base
Option 3SPD Option

Mitcham's Corner
Queue Comparison GraphsAM
0
20
40
08:00 08:05 08:10 08:15 08:20 08:25 08:30 08:35 08:40 08:45 08:50 08:55
Max
imum
Num
ber
Vehi
cles
Time
Milton Road from N
Base
Option 3
0
20
08:00 08:05 08:10 08:15 08:20 08:25 08:30 08:35 08:40 08:45 08:50 08:55
Max
imum
Num
ber
Vehi
cles
Time
Chesterton Road from E
Base
Option 3
0
20
08:00 08:05 08:10 08:15 08:20 08:25 08:30 08:35 08:40 08:45 08:50 08:55
Max
imum
Num
ber
Vehi
cles
Time
Victoria Avenue from S
Base
Option 3
0
20
08:00 08:05 08:10 08:15 08:20 08:25 08:30 08:35 08:40 08:45 08:50 08:55
Max
imum
Num
ber
Vehi
cles
Time
Chesterton Road from W
Base
Option 3
SPD Option
SPD Option
SPD Option
SPD Option

Mitcham's Corner
Queue Comparison GraphsAM
0
20
08:00 08:05 08:10 08:15 08:20 08:25 08:30 08:35 08:40 08:45 08:50 08:55
Max
imum
Num
ber
Vehi
cles
Time
Victoria Avenue to Chesterton Road E-W
Base
Option 3
0
20
08:00 08:05 08:10 08:15 08:20 08:25 08:30 08:35 08:40 08:45 08:50 08:55
Max
imum
Num
ber
Vehi
cles
Time
Victoria Road from NW
Base
Option 3SPD Option
SPD Option

Gilbert Road
Queue Comparison GraphsPM
0
20
17:00 17:05 17:10 17:15 17:20 17:25 17:30 17:35 17:40 17:45 17:50 17:55
Max
imum
Num
ber
Vehi
cles
Time
Milton Road from N
Base
Option 3
0
20
17:00 17:05 17:10 17:15 17:20 17:25 17:30 17:35 17:40 17:45 17:50 17:55
Max
imum
Num
ber
Vehi
cles
Time
Gilbert Road from W
Base
Option 3
SPD Option
SPD Option

Elizabeth Way
Queue Comparison GraphsPM
0
20
17:00 17:05 17:10 17:15 17:20 17:25 17:30 17:35 17:40 17:45 17:50 17:55
Max
imum
Num
ber
Vehi
cles
Time
Elizabeth Way from E
Base
Option 3SPD Option
Mitcham's Corner
Queue Comparison GraphsPM
0
20
17:00 17:05 17:10 17:15 17:20 17:25 17:30 17:35 17:40 17:45 17:50 17:55
Max
imum
Num
ber
Vehi
cles
Time
Milton Road from N
Base
Option 3
0
20
17:00 17:05 17:10 17:15 17:20 17:25 17:30 17:35 17:40 17:45 17:50 17:55
Max
imum
Num
ber
Vehi
cles
Time
Chesterton Road from E
Base
Option 3
0
20
40
60
17:00 17:05 17:10 17:15 17:20 17:25 17:30 17:35 17:40 17:45 17:50 17:55
Max
imum
Num
ber
Vehi
cles
Time
Victoria Avenue from S
Base
Option 3
0
20
17:00 17:05 17:10 17:15 17:20 17:25 17:30 17:35 17:40 17:45 17:50 17:55
Max
imum
Num
ber
Vehi
cles
Time
Chesterton Road from W
Base
Option 3
SPD Option
SPD Option
SPD Option
SPD Option

Mitcham's Corner
Queue Comparison GraphsPM
0
20
17:00 17:05 17:10 17:15 17:20 17:25 17:30 17:35 17:40 17:45 17:50 17:55
Max
imum
Num
ber
Vehi
cles
Time
Victoria Avenue to Chesterton Road E-W
Base
Option 3
0
20
17:00 17:05 17:10 17:15 17:20 17:25 17:30 17:35 17:40 17:45 17:50 17:55
Max
imum
Num
ber
Vehi
cles
Time
Victoria Road NW
Base
Option 3SPD Option
SPD Option


