Millimeterwave (60 GHz) Imaging Wireless Sensor Network ... · Millimeterwave (60 GHz) Imaging...
5
Millimeterwave (60 GHz) Imaging Wireless Sensor Network: Recent Progress Munkyo Seo, Bharath Ananthasubramaniam, Upamanyu Madhow and Mark J. W. Rodwell Department of Electrical and Computer Engineering University of California, Santa Barbara, CA 93106-9560, Email: mkseogengineering.ucsb.edu Abstract-In this paper, we report recent progress on an experimental 60-GHz wireless sensor network based on an virtual imaging approach. The results of indoor radio experiments, in- cluding the bit-error-rate (BER) and sensor range measurements, are discussed. Basic link tests of low-power CMOS sensors are also presented. I. INTRODUCTION Sensor networks provide distributed information collection and transmission, and are useful for many industrial, environ- mental or military applications. Conventional wireless sensor networks (WSN) typically rely on multi-hop communication among neighboring sensors for information gathering (Fig. 1). For the purpose of sensor localization, various techniques exist, including measuring time-of-flight (of either radio or acoustic waves), using GPS, etc. It is known that the con- ventional approach based on multi-hop data transfer can be inefficient when the network size or the number of sensors are very large. It also tends to make sensor hardware rather complicated, especially if ranging devices are to be integrated. As an alternative to the conventional WSN, a simplistic approach to wireless sensor networks has been proposed [1]- [3]. In this architecture, sensors retain minimal functionality with no localization or network capability. This will enable ultimate cost and energy efficiency in favor of a very large scale network. The system complexity (or functionality) is instead moved to an information collector, whose spatially narrow radio beam selectively activates a subset of sensor nodes. Fig. 2 illustrates the proposed network architecture. First, the collector beam sequentially scans a sensor field. Second, illuminated sensors respond to the beacon by ap- propriately modulating and sending it back to the collector. Finally, the collector, upon completing a full scan, acquires an information map across the sensor field. The location of each sensor can also be accurately determined by using a wide bandwidth, spatially narrow beacon in analogy to radar. The return signal, however, also carries local data from possibly a number of sensors, unlike conventional radar. Furthermore, sensors intentionally shift the frequency of the received beam to differentiate their transmission signal with direct ground return or environmental reflections. The proposed sensor net can also be interpreted as a virtual imaging network: image map is drawn from reflected light by a large number of target pixels. 0 0~~ 0 0 D B 0 Internet and ______ I0%AO satellite 0 0 0 0 0 0 Task manager / node User sensor field sensor nodes Fig. 1. A Multi-hop based wireless sensor network. After [4]. fdelta sensor 0 00 0 ,cO \e ar\%e ^s1\W ° ~~~~~~~~~~~~~~~~~~~~~~~~~~~~~~~~~~~~~~~~~~~~~~~~~~~~~~~~~~~~~.......... rK ... , _ r G X ffi z z B 4qAJ\f\fVwvv Sensor local data o 0 000 0 0 0 0 0 0 O 0 00 0 0 0 0 0 Fig. 2. Imaging sensor network architecture In this paper, we present recent progress on the millimeter- wave imaging wireless sensor network, including results from the indoor radio experiments and initial CMOS sensor link test. In the next section, the implementation of the 60 GHz prototype system is briefly reviewed. The results from indoor radio experiments are discussed next. Initial test results of CMOS sensors follow. II. 60 GHz PROTOTYPE SYSTEM A. Collector and Sensor Hardware Fig. 3 shows the block diagram of the prototype collector. The collector is basically a 60-GHz transceiver with steer- able high-gain antennas (23 dB and 40 dB for the transmit and receive antenna, respectively). It continuously transmits a wideband range code, i.e. 20 MHz pseudo-random bit 978-1-4244-2110-7/08/$25.00 C2007 IEEE IA2 396
Transcript of Millimeterwave (60 GHz) Imaging Wireless Sensor Network ... · Millimeterwave (60 GHz) Imaging...

Millimeterwave (60 GHz) Imaging Wireless Sensor Network:Recent Progress
Munkyo Seo, Bharath Ananthasubramaniam, Upamanyu Madhow and Mark J. W. RodwellDepartment of Electrical and Computer Engineering
University of California,Santa Barbara, CA 93106-9560, Email: mkseogengineering.ucsb.edu
Abstract-In this paper, we report recent progress on anexperimental 60-GHz wireless sensor network based on an virtualimaging approach. The results of indoor radio experiments, in-cluding the bit-error-rate (BER) and sensor range measurements,are discussed. Basic link tests of low-power CMOS sensors arealso presented.
I. INTRODUCTION
Sensor networks provide distributed information collectionand transmission, and are useful for many industrial, environ-mental or military applications. Conventional wireless sensornetworks (WSN) typically rely on multi-hop communicationamong neighboring sensors for information gathering (Fig.1). For the purpose of sensor localization, various techniquesexist, including measuring time-of-flight (of either radio oracoustic waves), using GPS, etc. It is known that the con-ventional approach based on multi-hop data transfer can beinefficient when the network size or the number of sensorsare very large. It also tends to make sensor hardware rathercomplicated, especially if ranging devices are to be integrated.As an alternative to the conventional WSN, a simplistic
approach to wireless sensor networks has been proposed [1]-[3]. In this architecture, sensors retain minimal functionalitywith no localization or network capability. This will enableultimate cost and energy efficiency in favor of a very largescale network. The system complexity (or functionality) isinstead moved to an information collector, whose spatiallynarrow radio beam selectively activates a subset of sensornodes. Fig. 2 illustrates the proposed network architecture.First, the collector beam sequentially scans a sensor field.Second, illuminated sensors respond to the beacon by ap-propriately modulating and sending it back to the collector.Finally, the collector, upon completing a full scan, acquiresan information map across the sensor field. The location ofeach sensor can also be accurately determined by using a widebandwidth, spatially narrow beacon in analogy to radar. Thereturn signal, however, also carries local data from possiblya number of sensors, unlike conventional radar. Furthermore,sensors intentionally shift the frequency of the received beamto differentiate their transmission signal with direct groundreturn or environmental reflections. The proposed sensor netcan also be interpreted as a virtual imaging network: imagemap is drawn from reflected light by a large number of targetpixels.
0 0~~0 0
D B 0
Internet and ______I0%AOsatellite 0
0 00 0 0
Task manager /nodeUser sensor field sensor nodes
Fig. 1. A Multi-hop based wireless sensor network. After [4].
fdelta
sensor
0 00 0,cO \e ar\%es1\W°~~~~~~~~~~~~~~~~~~~~~~~~~~~~~~~~~~~~~~~~~~~~~~~~~~~~~~~~~~~~~..........
rK..., _ r
G X ffiz z B4qAJ\f\fVwvv
Sensor local data
o 0 0000 0
0
0
0
0 O0 00 0 0
0 0 0
Fig. 2. Imaging sensor network architecture
In this paper, we present recent progress on the millimeter-wave imaging wireless sensor network, including results fromthe indoor radio experiments and initial CMOS sensor linktest. In the next section, the implementation of the 60 GHzprototype system is briefly reviewed. The results from indoorradio experiments are discussed next. Initial test results ofCMOS sensors follow.
II. 60 GHz PROTOTYPE SYSTEM
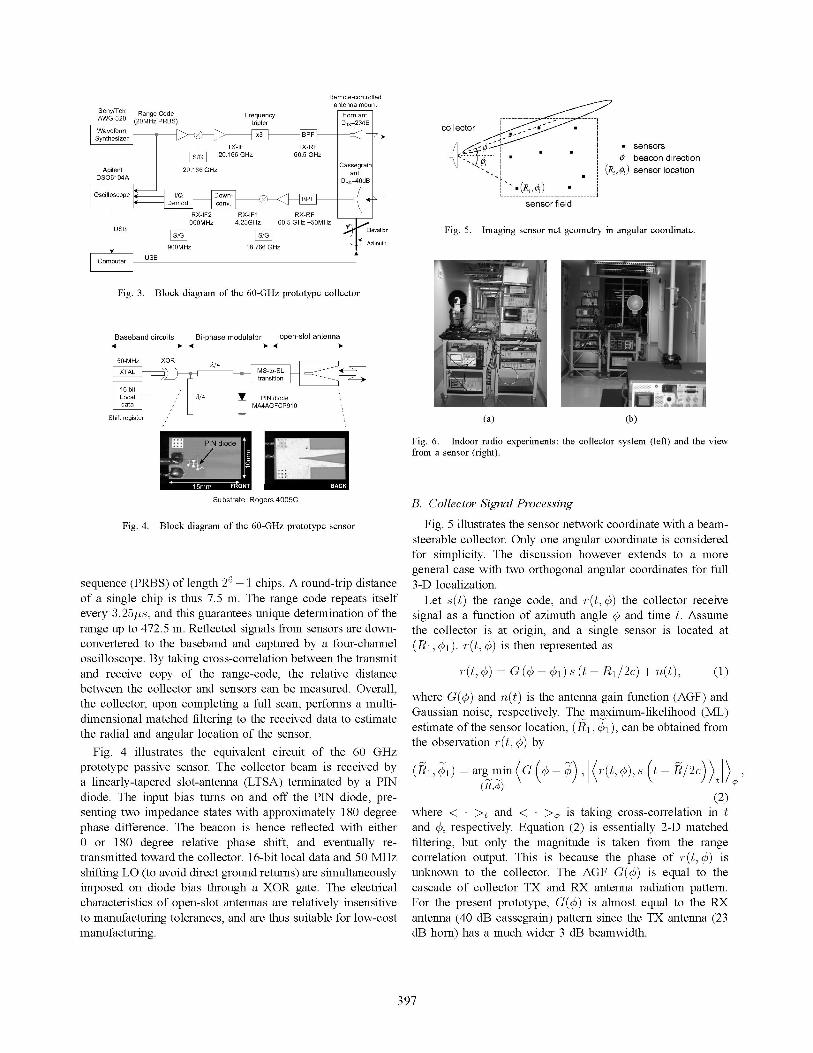
A. Collector and Sensor HardwareFig. 3 shows the block diagram of the prototype collector.
The collector is basically a 60-GHz transceiver with steer-able high-gain antennas (23 dB and 40 dB for the transmitand receive antenna, respectively). It continuously transmitsa wideband range code, i.e. 20 MHz pseudo-random bit
978-1-4244-2110-7/08/$25.00 C2007 IEEE
IA2
396
Frequencytripler
TX-IF TX-RF20.166 GHz 60.5 GHz
Remote-controlledantenna mount
Horn ant.DTX=23dB
CassegrainiAgilent 20.166 GHz an
DS06104A a4
Oscilloscope IQ Down BPDemd. cony.
RXIF2 RX-IF1 RX-RFE900MHz 4.25GHz 60.5 GHz +50MHz
USB Elevation
900MHz 18.766 GHz zimuth: 3 USBtComputer US
Fig. 3. Block diagram of the 60-GHz prototype collector
Baseband circuits Bi-phase modulator open-slot antenna
50-MHz
XTAL
16-bitLocaldata
Shift register
XOR214
L ~~~~~transition
A24 PINdiodeMA4AGFCP910
Substrate: Rogers 4005C
Fig. 4. Block diagram of the 60-GHz prototype sensor
sequence (PRBS) of length 26 -1 chips. A round-trip distanceof a single chip is thus 7.5 m. The range code repeats itselfevery 3.25,us, and this guarantees unique determination of therange up to 472.5 m. Reflected signals from sensors are down-convertered to the baseband and captured by a four-channeloscilloscope. By taking cross-correlation between the transmitand receive copy of the range-code, the relative distancebetween the collector and sensors can be measured. Overall,the collector, upon completing a full scan, performs a multi-dimensional matched filtering to the received data to estimatethe radial and angular location of the sensor.
Fig. 4 illustrates the equivalent circuit of the 60 GHzprototype passive sensor. The collector beam is received bya linearly-tapered slot-antenna (LTSA) terminated by a PINdiode. The input bias turns on and off the PIN diode, pre-
senting two impedance states with approximately 180 degreephase difference. The beacon is hence reflected with either0 or 180 degree relative phase shift, and eventually re-
transmitted toward the collector. 16-bit local data and 50 MHzshifting LO (to avoid direct ground returns) are simultaneouslyimposed on diode bias through a XOR gate. The electricalcharacteristics of open-slot antennas are relatively insensitiveto manufacturing tolerances, and are thus suitable for low-costmanufacturing.
collector
sensors*7 beacon direction
(R,i,5) sensor location
s(R, fiel
sensor field
Fig. 5. Imaging sensor net geometry in angular coordinate.
*-Lz--
(a) (b)
Fig. 6. Indoor radio experiments: the collector system (left) and the view
from a sensor (right).
B. Collector Signal Processing
Fig. 5 illustrates the sensor network coordinate with a beam-steerable collector. Only one angular coordinate is consideredfor simplicity. The discussion however extends to a more
general case with two orthogonal angular coordinates for full3-D localization.
Let s(t) the range code, and r(t, q5) the collector receivesignal as a function of azimuth angle and time t. Assumethe collector is at origin, and a single sensor is located at(RI, ¢51). r(t, q5) is then represented as
r(t, ) = G (5- 0I) s (t- R12c) + n(t), (1)
where G(q) and n(t) is the antenna gain function (AGF) andGaussian noise, respectively. The maximum-likelihood (ML)estimate of the sensor location, (RI, q5i), can be obtained fromthe observation r(t, q5) by
(RI, 01) =arg min(G (-¢) r(t, 0),,s (t-R/2c) )
(2)where < >t and < >¢ is taking cross-correlation in tand q5, respectively. Equation (2) is essentially 2-D matchedfiltering, but only the magnitude is taken from the range
correlation output. This is because the phase of r(t,¢o) isunknown to the collector. The AGF G(¢,) is equal to thecascade of collector TX and RX antenna radiation pattern.For the present prototype, G(¢,) is almost equal to the RXantenna (40 dB cassegrain) pattern since the TX antenna (23dB horn) has a much wider 3 dB beamwidth.
397
Sony/Tek Range CodeAWG-520 (20MHz PRBS)WaveformSynthesizer T
4 6 8 10 12 14
Measured EBINO (dB)
16 18 20 22
21
E 20
E 19
X 18
17
16
3 4 5 6 7 8 9Distance from the collector (m)
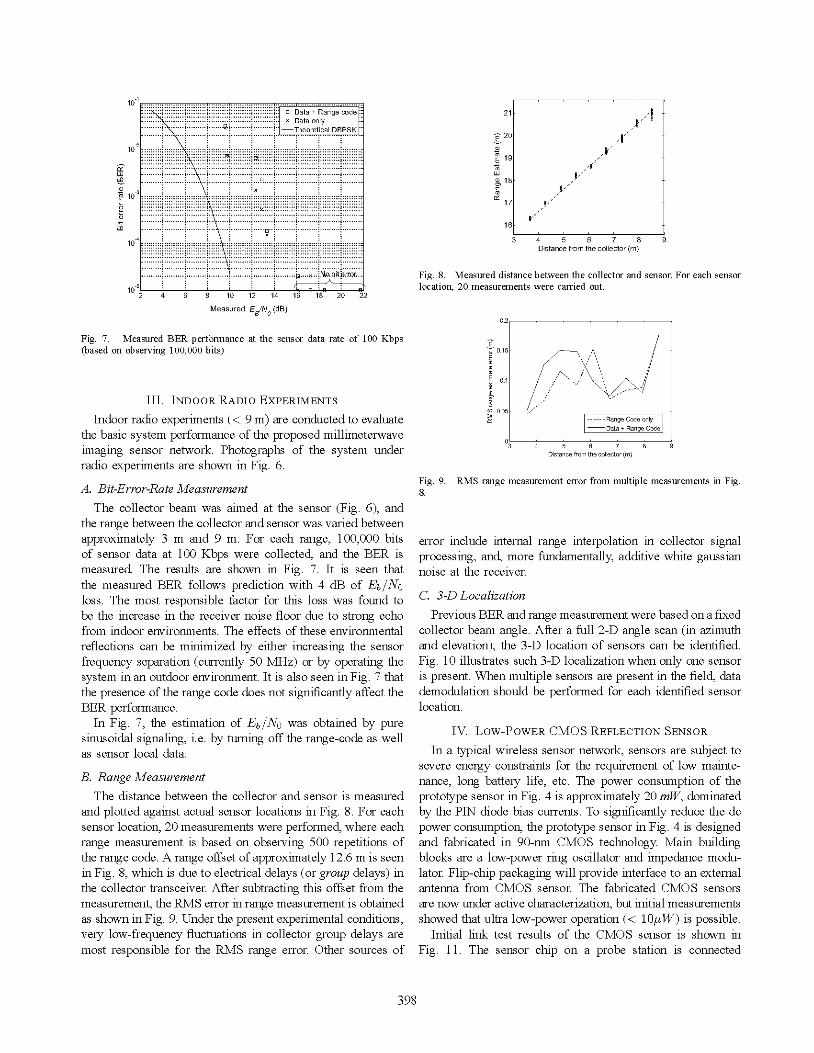
Fig. 8. Measured distance between the collector and sensor. For each sensorlocation, 20 measurements were carried out.
0.2
Fig. 7. Measured BER performance at the sensor data rate of 100 Kbps(based on observing 100,000 bits)
III. INDOOR RADIO EXPERIMENTS
Indoor radio experiments (< 9 m) are conducted to evaluatethe basic system performance of the proposed millimeterwaveimaging sensor network. Photographs of the system underradio experiments are shown in Fig. 6.
A. Bit-Error-Rate Measurement
The collector beam was aimed at the sensor (Fig. 6), andthe range between the collector and sensor was varied betweenapproximately 3 m and 9 m. For each range, 100,000 bitsof sensor data at 100 Kbps were collected, and the BER ismeasured. The results are shown in Fig. 7. It is seen thatthe measured BER follows prediction with 4 dB of EbINOloss. The most responsible factor for this loss was found tobe the increase in the receiver noise floor due to strong echofrom indoor environments. The effects of these environmentalreflections can be minimized by either increasing the sensor
frequency separation (currently 50 MHz) or by operating thesystem in an outdoor environment. It is also seen in Fig. 7 thatthe presence of the range code does not significantly affect theBER performance.
In Fig. 7, the estimation of EbINO was obtained by pure
sinusoidal signaling, i.e. by turning off the range-code as wellas sensor local data.
B. Range Measurement
The distance between the collector and sensor is measuredand plotted against actual sensor locations in Fig. 8. For eachsensor location, 20 measurements were performed, where eachrange measurement is based on observing 500 repetitions ofthe range code. A range offset of approximately 12.6 m is seen
in Fig. 8, which is due to electrical delays (or group delays) inthe collector transceiver. After subtracting this offset from themeasurement, the RMS error in range measurement is obtainedas shown in Fig. 9. Under the present experimental conditions,very low-frequency fluctuations in collector group delays are
most responsible for the RMS range error. Other sources of
E~
2 0.152
a)E
0.1
a)a)
C/ 0.05-
O _-3
Range Code onlyData + Range Code
4 5 6 7 8 9Distance from the collector (m)
Fig. 9. RMS range measurement error from multiple measurements in Fig.8.
error include internal range interpolation in collector signalprocessing, and, more fundamentally, additive white gaussiannoise at the receiver.
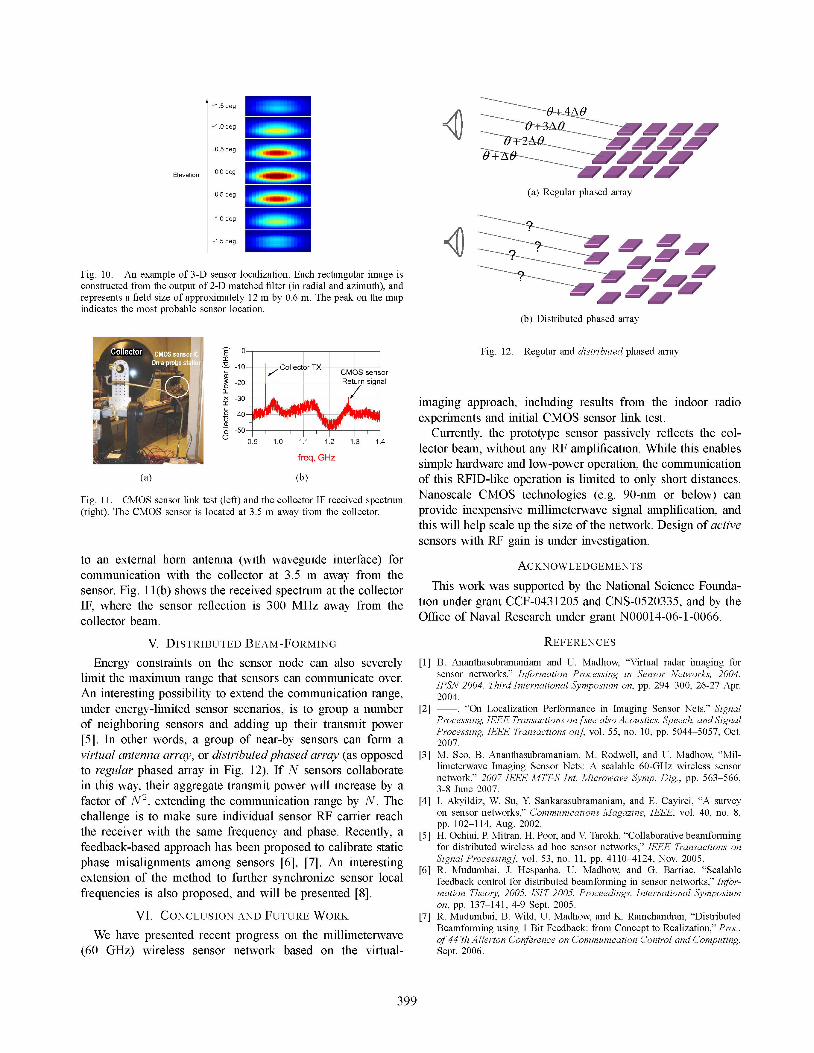
C. 3-D Localization
Previous BER and range measurement were based on a fixedcollector beam angle. After a full 2-D angle scan (in azimuthand elevation), the 3-D location of sensors can be identified.Fig. 10 illustrates such 3-D localization when only one sensor
is present. When multiple sensors are present in the field, datademodulation should be performed for each identified sensor
location.
IV. Low-POWER CMOS REFLECTION SENSOR
In a typical wireless sensor network, sensors are subject tosevere energy constraints for the requirement of low mainte-nance, long battery life, etc. The power consumption of theprototype sensor in Fig. 4 is approximately 20 mW, dominatedby the PIN diode bias currents. To significantly reduce the dcpower consumption, the prototype sensor in Fig. 4 is designedand fabricated in 90-nm CMOS technology. Main buildingblocks are a low-power ring oscillator and impedance modu-lator. Flip-chip packaging will provide interface to an externalantenna from CMOS sensor. The fabricated CMOS sensors
are now under active characterization, but initial measurementsshowed that ultra low-power operation (< 10utW) is possible.
Initial link test results of the CMOS sensor is shown inFig. 11. The sensor chip on a probe station is connected
398
10
LLJ
-a) .3110
a)
mt10-4
10 L-2
< g ~~~~~~~Theoretical DBPSK.Xi . .......................~~~~~............ ..~~~~~~~~~~~~~~~~~~~~~~......x..::..::~~~~~~~~~~~~~~~~~~~~~~..........~~~~~~~~~~~~~~~~~~~~~~....... ...\~~~~~~~~~~~~~~~~~~~~~.
.................... o.b..t..err. r
'j,
a+AO(a)6RegularAphased&arra
(a) Regular phased array
Fig. 10. An example of 3-D sensor localization. Each rectangular image is
constructed from the output of 2-D matched filter (in radial and azimuth), andrepresents a field size of approximately 12 m by 0.6 m. The peak on the mapindicates the most probable sensor location.
(b) Distributed phased array
Fig. 12. Regular and distributed phased array
10--io
B -20-0~nx -30-
2 -40-0 -0o -50-_
0.9
(a)
Collector TXCMOS sensorReturn signal
1.0 1.1 1.2 1.3 1.4
(b)
Fig. 11. CMOS sensor link test (left) and the collector IF received spectrum(right). The CMOS sensor is located at 3.5 m away from the collector.
to an external horn antenna (with waveguide interface) forcommunication with the collector at 3.5 m away from thesensor. Fig. 11 (b) shows the received spectrum at the collectorIF, where the sensor reflection is 300 MHz away from thecollector beam.
V. DISTRIBUTED BEAM-FORMING
Energy constraints on the sensor node can also severelylimit the maximum range that sensors can communicate over.
An interesting possibility to extend the communication range,
under energy-limited sensor scenarios, is to group a numberof neighboring sensors and adding up their transmit power
[5]. In other words, a group of near-by sensors can form a
virtual antenna array, or distributedphased array (as opposedto regular phased array in Fig. 12). If N sensors collaboratein this way, their aggregate transmit power will increase by a
factor of N2, extending the communication range by N. Thechallenge is to make sure individual sensor RF carrier reachthe receiver with the same frequency and phase. Recently, a
feedback-based approach has been proposed to calibrate staticphase misalignments among sensors [6], [7]. An interestingextension of the method to further synchronize sensor localfrequencies is also proposed, and will be presented [8].
VI. CONCLUSION AND FUTURE WORK
We have presented recent progress on the millimeterwave(60 GHz) wireless sensor network based on the virtual-
imaging approach, including results from the indoor radioexperiments and initial CMOS sensor link test.
Currently, the prototype sensor passively reflects the col-lector beam, without any RF amplification. While this enablessimple hardware and low-power operation, the communicationof this RFID-like operation is limited to only short distances.Nanoscale CMOS technologies (e.g. 90-nm or below) can
provide inexpensive millimeterwave signal amplification, andthis will help scale up the size of the network. Design of activesensors with RF gain is under investigation.
ACKNOWLEDGEMENTS
This work was supported by the National Science Founda-tion under grant CCF-0431205 and CNS-0520335, and by theOffice of Naval Research under grant N00014-06-1-0066.
REFERENCES
[1] B. Ananthasubramaniam and U. Madhow, "Virtual radar imaging forsensor networks," Information Processing in Sensor Networks, 2004.IPSN 2004. Third International Symposium on, pp. 294-300, 26-27 Apr.2004.
[2] "On Localization Performance in Imaging Sensor Nets," SignalProcessing, IEEE Transactions on [see also Acoustics, Speech, and SignalProcessing, IEEE Transactions on], vol. 55, no. 10, pp. 5044-5057, Oct.2007.
[3] M. Seo, B. Ananthasubramaniam, M. Rodwell, and U. Madhow, "Mil-limeterwave Imaging Sensor Nets: A scalable 60-GHz wireless sensor
network," 2007 IEEE MTT-S Int. Microwave Symp. Dig., pp. 563-566,3-8 June 2007.
[4] I. Akyildiz, W. Su, Y Sankarasubramaniam, and E. Cayirci, "A survey
on sensor networks," Communications Magazine, IEEE, vol. 40, no. 8,pp. 102-114, Aug. 2002.
[5] H. Ochiai, P. Mitran, H. Poor, and V. Tarokh, "Collaborative beamformingfor distributed wireless ad hoc sensor networks," IEEE Transactions on
Signal Processing], vol. 53, no. 11, pp. 4110-4124, Nov. 2005.[6] R. Mudumbai, J. Hespanha, U. Madhow, and G. Barriac, "Scalable
feedback control for distributed beamforming in sensor networks," Infor-mation Theory, 2005. ISIT 2005. Proceedings. International Symposiumon, pp. 137-141, 4-9 Sept. 2005.
[7] R. Mudumbai, B. Wild, U. Madhow, and K. Ramchandran, "DistributedBeamforming using 1 Bit Feedback: from Concept to Realization," Proc.of 44'th Allerton Conference on Communication Control and Computing,Sept. 2006.
399
+1.5 deg
+1.0 deg
+0.5 deg
0.0 deg
-0.5 deg
-1.0 deg
Elevation
-1.5 deg

[8] M. Seo, M. Rodwell, and U. Madhow, "A feedback-based distributedphased array technique and its application to 60-GHz wireless sensornetwork," submitted to 2008 IEEEIMTT-S International Microwave Sym-posium.
400