MILLIMAN REPORT Florida Agency for Health Care Administration
47
MILLIMAN REPORT Florida Agency for Health Care Administration Pharmacy Benefit Manager Pricing Practices in Statewide Medicaid Managed Care Program December 2020 AJ Ally, RPh, MBA Andrew Gaffner, FSA, MAAA Jim Hong, MBA, MS Michael T. Hunter, PharmD Michelle Wang, PharmD
Transcript of MILLIMAN REPORT Florida Agency for Health Care Administration

MILLIMAN REPORT
Florida Agency for Health Care Administration Pharmacy Benefit Manager Pricing Practices in Statewide Medicaid Managed Care Program December 2020
AJ Ally, RPh, MBA Andrew Gaffner, FSA, MAAA Jim Hong, MBA, MS Michael T. Hunter, PharmD Michelle Wang, PharmD

MILLIMAN REPORT
Florida Agency for Health Care Administration Pharmacy Benefit Management Pricing Practices in Statewide Medicaid Management Care Program December 1, 2020
Table of Contents I. EXECUTIVE SUMMARY ..................................................................................................................................... 1
II. BACKGROUND .................................................................................................................................................. 5
III. RESULTS ............................................................................................................................................................ 7
IV. DISCUSSION .................................................................................................................................................... 21
V. CONSIDERATIONS AND LIMITATIONS ......................................................................................................... 24
VI. METHODOLOGY AND ASSUMPTIONS .......................................................................................................... 27
VII. GLOSSARY AND DEFINITIONS ...................................................................................................................... 32
VIII. CAVEATS AND LIMITATIONS ......................................................................................................................... 34
APPENDIX - ADDITIONAL RESULTS
MILLIMAN REPORT
_______________________________________________________________________________________________________________________
Florida Agency for Health Care Administration Page 1 Pharmacy Benefit Management Pricing Practices in Statewide Medicaid Management Care Program December 1, 2020
METHODOLOGY Milliman analyzed 22.7 million claims for the state of Florida’s managed care plans for the most recent 12-month contract performance period for each plan. We observed the PBMs received over $2.1378 billion from 15 managed care plans for the direct reimbursement of prescription claims, of which $2.0482 billion was remitted to participating network pharmacies. We evaluated the aggregate program across all dispensing channels including retail, mail order, and specialty pharmacies but also displayed a subset of the results specific to the retail channel. We calculated total plan paid amounts separately for plans in spread and pass-through contract arrangements and matched the corresponding pharmacy remittance payments. We received and reviewed the plan-to-PBM contracts and reconciliation reports. We note there were nine managed care plans in spread arrangements and six managed care plans in pass-through arrangements based on the contractual agreement with their respective PBMs. One plan was in contractual pass-through arrangements with their PBM, but claims analysis confirmed the claims were paid using spread contracts. This plan was categorized as a spread plan in the analysis and results therefore the report states ten plans in spread and five plans in pass-through arrangements. This occurred because the plans’ contracted PBMs delegated the pharmacy network services to another PBM that was using spread contracting to pay pharmacies. Starting in 2020, seven plans are in spread and eight plans are in pass-through contractual arrangements. In addition, we accounted for other fees that are charged to the plans or charged to the pharmacies related to pharmacy networks payments including:
Administrative fees are fees that PBMs typically charge to managed care plan to administer the pharmacy benefit and are typically collected for pass-through pricing arrangements.
Transaction fees are fees ranging from $0.03 to $0.23 per claim charged by the PBM to the pharmacy for claim reimbursement. These fees typically apply to every submitted transaction including paid claim, reversed claim, adjusted claim, and denied claim.
Direct and indirect remuneration (DIR) fees are price concessions that are paid to the plan or PBM by the
pharmacy retrospectively. The managed care plans attested that no DIR was collected in the SMMC program. We also repriced all prescriptions using the Agency’s FFS reimbursement methodology to better understand how the SMMC program’s aggregate costs would change if the FFS reimbursement methodology was deployed for all managed care plans’ pharmacy claims. We performed the analysis for the aggregate program across all dispensing channels including retail, mail order, specialty, and ‘other’ dispensing channels (e.g., long-term care, Indian Health Service / Tribal / Urban Indian Health (I/T/U), and onsite hospital clinics). We also created a subset of results for only the community and retail pharmacy channel. This subset of results exclude mail order, specialty, and other dispensing channels.
I. EXECUTIVE SUMMARY The Florida Agency for Health Care Administration (Agency) retained Milliman to perform an independent analysis of pharmacy benefit manager (PBM) pricing practices in the Statewide Medicaid Managed Care (SMMC) program. The goal of this analysis was to provide the Agency a better understanding of the current landscape of plan-to-PBM and PBM-to-pharmacy pricing. The analysis focuses on practices and financial arrangements of PBMs and addresses spread pricing, dispensing fees, direct and indirect pharmacy assessment fees (including transaction fees), State fee-for-service (FFS) pricing comparison, and a review of the managed care plan to PBM contracts. The analysis includes separate results for managed care plans with spread pricing and pass-through pricing PBM contract arrangements that are defined as follows:
Spread pricing contracts are a fee structure where the PBM charges the managed care plan an amount different than the amount the PBM reimburses the pharmacy for the covered drugs dispensed. Spread pricing is also referred to as Traditional pricing.
Pass-through pricing contracts are a fee structure where the PBM reimburses the pharmacy the same amount the PBM collects from the managed care plan for the covered drugs dispensed. Under pass-through contracts, the PBM will typically charge a fee to the managed care plan for administering the plan in lieu of the spread. The administrative fee is not typically captured in the claims data. Pass-through pricing is also referred to as Transparent pricing.

MILLIMAN REPORT
_______________________________________________________________________________________________________________________
Florida Agency for Health Care Administration Page 2 Pharmacy Benefit Management Pricing Practices in Statewide Medicaid Management Care Program December 1, 2020
Notes:
We are unable to determine how the SMMC program costs would change if the claims were to move from spread to pass-through and vice versa. Despite accounting for different generic dispensing rates between plans with spread and pass-through arrangements, there are other factors that we are unable to account for when the claims move from spread to pass-through pricing and vice versa. These factors include various PBM contracted rates, mix of pharmacies utilized, differing types of drugs dispensed, and uncertainty in how PBMs would renegotiate their plan-to-PBM contracts if a significant portion of their business would move from one contract type to the other.
We assume a PBM will underwrite both pricing types to a similar level of margin when proposing the pharmacy pricing to a payer, so our general assumption is that these alternatives are financially equivalent to each other from a payer standpoint.
AGGREGATE PROGRAM RESULTS – ALL DISPENSING CHANNELS
Total payment difference between the plan-to-PBM and the PBM-to-pharmacy payments for the aggregate SMMC program was $89.6 million (4.1%). This amount is exclusive of admin fees ($17.9 million) plans in pass-through arrangements pay the PBM.
− Plans in spread arrangements pay PBMs $91.20 per claim and the PBMs reimburse pharmacies
$82.56 per claim generating approximately 9.5% spread. The spread is mostly identified in the retail generic prescriptions.
− Plans in pass-through arrangements pay PBMs $96.92 per claim and the PBMs reimburse pharmacies the same amount resulting in zero spread, but the plans also pay an administrative fee to the PBMs equal to $1.45 per claim that equals 1.5% of total plan paid.
Plans reported their respective PBM collected approximately $5.8 million in transaction fees per year
(averaging $0.13 per claim) from participating pharmacies. These are commonly found within PBM-to-pharmacy contracts.
− Plans attested there are no other network fees (e.g., DIR) charged to pharmacies for Medicaid
managed care utilization.
Repricing the entire managed care plan utilization to the State FFS fee schedule increases costs of the program by approximately $98.8 million (4.6%).

MILLIMAN REPORT
_______________________________________________________________________________________________________________________
Florida Agency for Health Care Administration Page 3 Pharmacy Benefit Management Pricing Practices in Statewide Medicaid Management Care Program December 1, 2020
Overall, these results appear to align with expectations for a managed Medicaid program. For plans that have spread arrangements, the results are similar to findings from analyses performed on other State programs, such as Ohio Maryland, and Kentucky.1 2 3 For plans with pass-through arrangements, the administration fees are consistent with other payers in pass-through arrangements.4 The aggregate payer-to-pharmacy payment difference for the program was 4.2%, which is in line with publicly reported PBM net profit margins.5 STATE CONSIDERATIONS
Milliman was asked by the Agency to evaluate the current landscape of plan-to-PBM and PBM-to-pharmacy pricing and provide commentary outlining options and considerations.
1 https://ohioauditor.gov/auditsearch/Reports/2018/Medicaid_Pharmacy_Services_2018_Franklin.pdf 2 https://mmcp.health.maryland.gov/SiteAssets/pages/Reports-and-Publications/hb589PBMauditappealsJCRfinal12-19%20(1).pdf 3 https://drive.google.com/file/d/1f0eZyVg5e-lmUOS4VQhQLQHfsVId_XEL/view 4 https://medicaid.ohio.gov/Portals/0/Resources/PharmacyTransparency/ODM-HDS-Qtr1-Analysis.pdf 5 CVS reported 3.5% net operating income as percentage of total revenue for CY 2018
https://materials.proxyvote.com/Approved/126650/20190321/AR_388086/pubData/mobile/index.htm#/25/
RETAIL PHARMACY CHANNEL RESULTS - GENERICS Generic claims comprise a majority of the payment difference between the plan payments to the PBM and
the PBM reimbursement to the pharmacy. The following results are a summary of non-specialty and specialty generic claims.
PHARMACY REIMBURSEMENT COST PER GENERIC NON-SPECIALTY CLAIM PHARMACY OWNERSHIP
PLANS WITH SPREAD PRICING
PLANS WITH PASS-THROUGH PRICING TOTAL: ALL PLANS
Chain $13 $16 $15
Independent $13 $23 $18
PBM Owned $12 $11 $11
Total $13 $16 $14
PHARMACY REIMBURSEMENT COST PER GENERIC SPECIALTY CLAIM
PHARMACY OWNERSHIP
PLANS WITH SPREAD PRICING
PLANS WITH PASS-THROUGH PRICING TOTAL: ALL PLANS
Chain $76 $115 $97
Independent $94 $202 $155
PBM Owned $171 $157 $163
Total $101 $144 $125
The mix of specialty drugs dispensed within the retail pharmacy channel may be affected by the underlying service model because chain pharmacies and PBM-owned pharmacies may direct specialty medications out of retail pharmacies and into mail order pharmacies.

MILLIMAN REPORT
_______________________________________________________________________________________________________________________
Florida Agency for Health Care Administration Page 4 Pharmacy Benefit Management Pricing Practices in Statewide Medicaid Management Care Program December 1, 2020
HOW TO ACHIEVE GREATER TRANSPARENCY METHOD TO ACHIEVE GREATER TRANSPARENCY CONSIDERATIONS
Redefine how ‘pass-through pricing’ in plan-to-PBM contracts are operationalized.
Results demonstrate pass-through rates are not the PBM-negotiated rates with pharmacies. Plan-to-PBM contract terms could be redefined to align with PBM-to-pharmacy contract terms and conditions.
We anticipate admin fees will increase because the observed admin fees for current ‘pass-through pricing’ contracts are only a portion of the total PBM margin for those plans.
Report on transaction fees charged by PBM to contracted network pharmacies.
This will allow pharmacies greater visibility into these fees and how they are charged.
Prevent the PBM from offsetting the payment of commercial and Medicaid claims for pharmacy reimbursement.
PBM contracts with pharmacies may allow offsetting of payments between commercial and Medicaid claims. This means commercial payment rates may influence Medicaid reimbursement to pharmacies.
Retail pharmacy reimbursement rates for specialty drugs to be at parity as PBM-owned pharmacy payment rates, including mail order and specialty pharmacies.
May require Agency defined and mandated specialty drug list that all stakeholders must implement.
METHODS AND CONSIDERATIONS TO ENHANCE STAKEHOLDER ALIGNMENT WITHIN THE PHARMACY PROGRAM
METHOD FOR ALIGNMENT CONSIDERATIONS
Single PBM to manage the entire SMMC program pharmacy benefit including pharmacy networks.
Single claims platform to manage entire pharmacy benefit and streamline data, reporting, and audits.
The State can provide the consolidated volume of the SMMC program to allow the PBM to negotiate pharmacy network rates and implement the transparency requirements uniformly to all plans.
This allows the plans and the chosen PBM to manage the pharmacy payments efficiently while allowing the program to remain carved in to the capitation rates.
The Agency may ask plans to voluntarily agree to a single PBM. If plans do not agree, the State would need to mandate participation.
Each managed care plan would continue to own the contract with the PBM.
Vertically integrated managed care plans may elect not to participate if their in-house PBM is not selected.
Must ensure that plans have full, real time access to prescription information for their members.
May require the Agency to issue a competitive solicitation.
Mandate a minimum reimbursement rate per prescription for independent and rural pharmacies to support access to care in rural settings.
Minimum reimbursement claims may be carved out of network pricing guarantees, which means they may be paid at a higher rate relative the rest of the program.
All stakeholders could align to a single brand / generic definition.
Identify opportunities where the PBM is paying the pharmacy a generic rate for a brand drug and charging the managed care plan the brand rate.
Value-based payments to pharmacies based on Medicaid outcomes metrics.
Opportunity to create limited networks that include only high performing pharmacy providers.
This list is not exhaustive and there may be other options not stated above. The options could be combined in part to create additional alternatives. The options were prepared based on a snapshot period of time assuming no material changes in the program; if there are any material changes to the underlying data or SMMC program including policy changes, the options and considerations may need to be revised.
MILLIMAN REPORT
_______________________________________________________________________________________________________________________
Florida Agency for Health Care Administration Page 5 Pharmacy Benefit Management Pricing Practices in Statewide Medicaid Management Care Program December 1, 2020
II. BACKGROUND The Florida Agency for Health Care Administration (Agency) is the single state agency responsible for administering the Medicaid program in Florida. The Agency contracts with 15 health plans to provide medical and prescription drug benefits to recipients enrolled in the Statewide Medicaid Managed Care (SMMC) program. The health plans can manage their pharmacy benefit internally or subcontract with a vendor for pharmacy benefit management (PBM) services. All 15 plans contract with various PBMs to manage the pharmacy benefit. The Agency retained Milliman to perform an independent analysis of PBM pricing practices in the SMMC program and provide a report to the Agency outlining the findings of the analysis. Over the past several years, there has been increased attention on PBM pricing models. Specifically, many have debated the pros and cons between traditional (spread) pricing and transparent (pass-through) pricing. Various stakeholders have discussed the lack of transparency that is associated with the spread pricing model and have worked to transition spread arrangements to pass-through models. Spread and pass-through pricing is defined as follows:
Spread pricing contracts are a fee structure where the PBM charges the managed care plan an amount different than the amount the PBM reimburses the pharmacy for the covered drugs dispensed. Spread pricing is also referred to as Traditional pricing.
Pass-through pricing contracts are a fee structure where the PBM reimburses the pharmacy the same amount the PBM collects from the managed care plan for the covered drugs dispensed. Under pass-through contracts, the PBM will typically charge a fee to the managed care plan for administering the plan in lieu of the spread. The administrative fee is not typically captured in claims data. Pass-through pricing is also referred to as Transparent pricing.
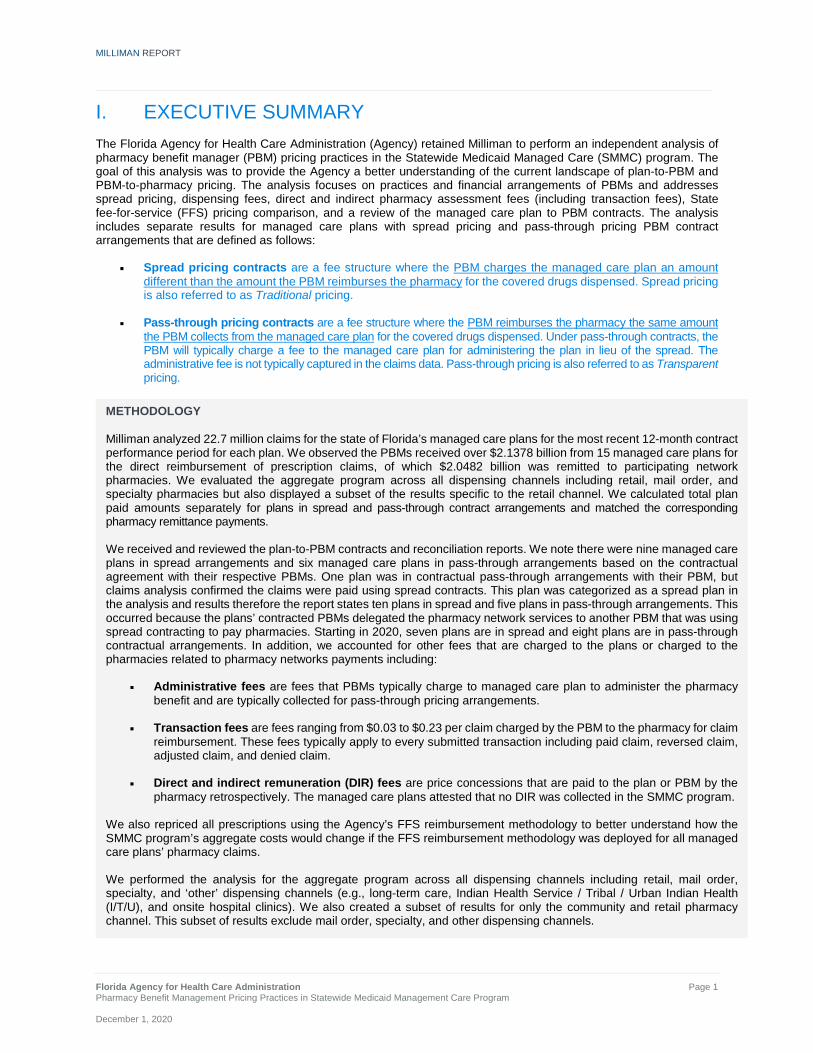
Across all lines of business, PBMs are central to the pharmacy supply chain. Their primary function is to aggregate prescription volume with the goal to negotiate better payment rates from all pharmacy suppliers on behalf of payers. Their core function includes administering and managing the pharmacy benefit according to the plan benefit design, which may include electronic claims adjudication, prior authorizations, formulary development, manufacturer rebate negotiations, pharmacy network management, clinical programs, and reporting. However, as PBMs also typically own pharmacies (e.g., specialty, mail order, retail), their model has evolved to manage multiple pricing models in order to respond to plan preferences for cost structure and / or transparency. The Agency currently manages the preferred drug list (PDL) and, therefore, in Florida Medicaid, the PBMs do not negotiate supplemental rebates or assist with the development of the formularies. Figure 1 shows the financial relationship of the PBM in the pharmacy supply chain as it specifically relates to the Agency and the managed care plans. Please note, other states may operate a different arrangement.
FIGURE 1: OVERVIEW OF THE PHARMACY SUPPLY CHAIN AND REIMBURSEMENT

MILLIMAN REPORT
_______________________________________________________________________________________________________________________
Florida Agency for Health Care Administration Page 6 Pharmacy Benefit Management Pricing Practices in Statewide Medicaid Management Care Program December 1, 2020
In Figure 1, we specifically focus on the product and financial flow of funds among the Agency, the managed care plan, the PBM, and the pharmacy. The Agency contracts with managed care plans and provides a capitated rate to each plan. Each managed care plan contracts with a PBM for pharmacy benefit management services, including pharmacy network discounts. Within the SMMC program, the PBMs negotiate specific rates with each pharmacy or pharmacy chain. The reimbursement may vary depending on the contracted arrangement between the pharmacy and PBM, as well as the managed care plan and the PBM. To the extent there is a difference in the payment from managed care plan to the PBM and the payment from the PBM to the pharmacy, this represents the payment difference, or the PBM “spread.” Pharmacies have voiced concerns6 about low reimbursement from PBMs that pay claims on behalf of Medicaid managed care plans, especially compared to the reimbursement from the States’ Medicaid fee-for-service (FFS) program. States and managed care plans may believe their transparency goals will be achieved when switching their PBM pharmacy network pricing arrangements to a pass-through model.7 8 Previous reports, audits, and publications on this topic have attempted to provide transparency on the flow of monies and economics among the different contract arrangements between the PBM, managed care plans, and pharmacies.9 10 11 12 However, due to the complex nature of the contracting nuances in PBM pricing, the results may not provide clear guidance to a managed care plan or the State on how to achieve program goals, such as transparency, adequate pharmacy reimbursement, and fiscal responsibility for the program. This analysis will help the Agency understand the flow of funds in the different PBM contract arrangements with the managed care plans, the economics of the spread retained by the PBM in spread pricing contracts, reimbursement to the pharmacies, and estimates of what the Agency would have paid under the State’s FFS reimbursement model. Additionally, the Centers for Medicare & Medicaid Services (CMS) has provided recent guidance regarding how administrative fees and spread pricing should be reflected in a plan’s medical loss ratio (MLR).13 CMS considers the administrative fees and additional costs charged by the PBM to be administrative costs for the Medicaid program, and, therefore these amounts must be considered separately when calculating a plan’s MLR. Understanding the flow of funds will assist the Agency and each managed care plan in properly categorizing these expenses for purposes of setting and reporting the MLR. In this report, we summarize the results of the following tasks:
Determine the type of pharmacy benefit pricing contracts in place between the managed care plans and their PBMs
Estimate the PBM spread for claims paid at the individual plan and aggregate State level
Identify and quantify the fees charged by the PBM to pharmacies at the State level, by pharmacy type, including direct and indirect pharmacy fees and other fees
Adjudicate all managed care prescriptions under the Agency’s FFS reimbursement methodology This report is not intended to provide opinions or recommendations on the following topics:
Which pricing methodology is best for a payer (spread vs. pass-through)
The impact of manufacturer rebates because the Agency manages the preferred drug list (PDL) and the PBM does not negotiate or receive supplemental rebates
If PBMs or pharmacy providers are fairly compensated
6 https://www.truthrx.org/puttpressreleases/survey-61-percent-of-florida-independent-pharmacies-plan-to-discontinue-medicaid-if-below-cost-reimbursements-continue 7 https://www.chicagotribune.com/business/ct-biz-independent-pharmacies-closing-20190319-story.html 8 https://www.wtsp.com/article/news/health/coronavirus/pharmacy-independent-local-neighbhorhood-mom-and-pop-struggle-to-stay-in-business-pbms-pharmacy-business-managers/67-fdbfb96f-8457-4af2-8d53-116da274c0a7 9 https://drive.google.com/file/d/1f0eZyVg5e-lmUOS4VQhQLQHfsVId_XEL/view 10 https://ohioauditor.gov/auditsearch/Reports/2018/Medicaid_Pharmacy_Services_2018_Franklin.pdf 11 http://www.ncpa.co/pdf/state-advoc/west-virginia-report.pdf 12 https://mmcp.health.maryland.gov/SiteAssets/pages/Reports-and-Publications/hb589PBMauditappealsJCRfinal12-19%20(1).pdf 13 https://www.cms.gov/newsroom/press-releases/cms-issues-new-guidance-addressing-spread-pricing-medicaid-ensures-pharmacy-benefit-managers-are-not

MILLIMAN REPORT
_______________________________________________________________________________________________________________________
Florida Agency for Health Care Administration Page 7 Pharmacy Benefit Management Pricing Practices in Statewide Medicaid Management Care Program December 1, 2020
III. RESULTS REVIEW OF PLAN-TO-PBM CONTRACTS: SPREAD AND PASS-THROUGH We received the plan-to-PBM contracts, plan paid claims file, financial reconciliation reports, information about network direct and indirect remuneration (DIR) payments, and network transaction fees from each managed care plan. Using the contracts and plan paid claims provided, we categorized the managed care plans as spread or pass-through contract types:
We observed a mix of contractual spread and pass-through arrangements within the Florida SMMC program for the analysis period. We categorized the plans based on how their claims were paid as follows:
− Ten plans consisting of 45.8% of claims or 43.9% of plan paid were in spread arrangements. − Five plans consisting of 54.2% of claims or 56.1% of plan paid were in pass-through arrangements.
We observed one plan (CCP) that had pass-through arrangements in their contract, but were confirmed to be operating under a spread arrangement through the claims analysis. For the claims analysis, we categorized this plan as spread.
− This situation occurred because the managed care plan contracted with their PBM subcontractor in a
pass-through arrangement, but the PBM delegated the pharmacy network function to another entity that paid its pharmacies in a spread arrangement.
We noted three plans’ claims were paid as spread during the analysis period. Contractually, these plans have
elected to move to pass-through pricing in a time period beyond the analysis period.
Four plans did not have 12-month contract periods due to being newly added to the program.
In Table 1, we provide a summary by plan of its payment-type (spread vs. pass-through) during the analysis period and contract-type for the current period:
TABLE 1: FLORIDA AGENCY FOR HEALTH CARE ADMINISTRATION LIST OF PLANS, PBMS, CONTRACT TYPE, AND CONTRACT PERIOD
PLAN PBM
PLAN MARKET SHARE
OF CLAIMS
PBM MARKET SHARE
OF CLAIMS ANALYSIS
PERIOD CONTRACT TYPE: ANALYSIS PERIOD
CONTRACT TYPE: CURRENT
Aetna CVS 1.8% 41.1% 201801 to 201812 Spread Spread
CCP MagellanRx 0.9% 6.4% 201807 to 201906 Spread Pass-Through
CMS Plan CVS 0.0% 41.1% 201801 to 201812 Pass-Through Pass-Through
FCC CVS 0.2% 41.1% 201812 to 201912 Spread Spread
Humana HPS 10.9% 10.9% 201801 to 201812 Pass-Through Pass-Through
Lighthouse CVS 0.7% 41.1% 201902 to 201912 Spread Spread
Magellan MagellanRx 5.5% 6.4% 201801 to 201812 Spread Spread
Miami Children's CVS 0.3% 41.1% 201812 to 201912 Spread Spread
Molina CVS 12.8% 41.1% 201801 to 201812 Spread Pass-Through
Prestige PerformRx 1.9% 1.9% 201801 to 201811 Pass-Through Pass-Through
Simply ESI 16.2% 16.2% 201801 to 201812 Pass-Through Pass-Through
Staywell CVS 25.2% 41.1% 201801 to 201812 Pass-Through Pass-Through
Sunshine Envolve 14.2% 14.2% 201801 to 201812 Spread Pass-Through
United OptumRx 9.2% 9.2% 201806 to 201905 Spread Spread
Vivida CVS 0.2% 41.1% 201901 to 201912 Spread Spread
Note: Although the CMS Plan is included in the list above, there were issues with the claims received for the contract period and thus could not be analyzed in this report. Therefore, the analysis only encompasses 14 plans.

MILLIMAN REPORT
_______________________________________________________________________________________________________________________
Florida Agency for Health Care Administration Page 8 Pharmacy Benefit Management Pricing Practices in Statewide Medicaid Management Care Program December 1, 2020
PBM-TO-PHARMACY CONTRACTS AND PAYMENTS Although we did not obtain the PBM-to-pharmacy contracts, we received the PBM-to-pharmacy remittance claims. Using the claims data provided along with our industry knowledge of PBM-to-pharmacy reimbursement, we provide the following information for background purposes and to assist in better explaining the results.
PBMs contract directly with pharmacies or with pharmacies through pharmacy services administration organizations (PSAOs). PSAOs are organizations that aggregate the volume of independent pharmacies to negotiate better reimbursement contracts with PBMs. The PBM typically negotiates one of two payment structure types with these pharmacies (direct or through a PSAO).
Overall guarantee effective rate (OGER) contracts are when the PBM negotiates an aggregate payment amount to the pharmacy over the contract period (typically 12 months in a calendar year).
For example, a discount rate of 87% off average wholesale price (AWP) for all generics. A typical 30-day generic prescription with $100 AWP, will equate to a $13 reimbursement to the pharmacy under an OGER contract.
Non-OGER contracts are when the PBM’s contract with the pharmacy does not include a contractually required payment amount, although there is a drug-specific pricing floor that the PBM is unable to price below. It is common for independent and community pharmacies (non-national chain pharmacies) to be in these types of contracts.
− This means every generic prescription could be paid to the pharmacy at what the PBM estimates is the
actual acquisition cost to the pharmacy.
For any given individual claim payment, the amount paid to the participating pharmacy may not equal the total amount due to the pharmacy.
− This means if the payment rate is guaranteed at $13 per claim, not every prescription is paid at $13.
− This is because the typical OGER contractual agreement between the PBM and the pharmacy reconciles
the guarantee payments in the aggregate across all commercial and Medicaid contracts.
An important concept that must be understood before reviewing the results below is the following: − Using the $13 generic drug example from above, the PBM has the ability to pay more than the
OGER to the pharmacy for claims where they have a pass-through pricing contract with a managed care plan and pay less than the OGER to the pharmacy for claims where they have a spread pricing contract with a different managed care plan as long as the guarantee is met in aggregate across all commercial and Medicaid contracts.

MILLIMAN REPORT
_______________________________________________________________________________________________________________________
Florida Agency for Health Care Administration Page 9 Pharmacy Benefit Management Pricing Practices in Statewide Medicaid Management Care Program December 1, 2020
AGGREGATE RESULTS: SPREAD, PASS-THROUGH, AND MEDICAID FFS PRICING SCHEDULE ACROSS All Managed Care Plans We provide Figure 2 to assist the reader in better understanding the payment flows for both pricing types (spread and pass-through) and how it relates to FFS pricing. PBM-to-pharmacy pricing is more complex than what is illustrated below, because the illustration assumes “one PBM” with an OGER contract with “one pharmacy chain” and that only Medicaid claims occur in this ecosystem. We use the actual results from our study to support the flow of funds illustration. In actuality, the numbers in Figure 2 are the result of many plans to PBM payments and many PBMs to many pharmacies payments. We have normalized the results to account for the generic dispensing rate (GDR) differences between the cohort of plans with spread and pass-through pricing. We normalized the results to account for the difference in the number of generic claims as a percentage of total claims dispensed between the two groups. We found this difference was enough to affect the non-normalized results. Normalizing the GDR is necessary to allow a comparison between pass-through and spread plans’ cost due to the substantially different payment rates between brand and generic drugs. There are many variables in addition to GDR that cause differences in average cost per script including differing mix of drugs dispensed, various PBM contracted rates, mix of pharmacies (OGER vs. non-OGER) among other variables. We did not control for all variables, but found that normalizing the GDR was necessary to be able to compare the spread and pass-through payment rates more directly and draw conclusions regarding their effect on PBM and pharmacy finances. The numbers below are actual values normalized to the aggregate claims GDR, but the conceptual illustration is highly simplified and does not take into account how these payment flows are contracted and actually paid. Key Observations for Figure 2
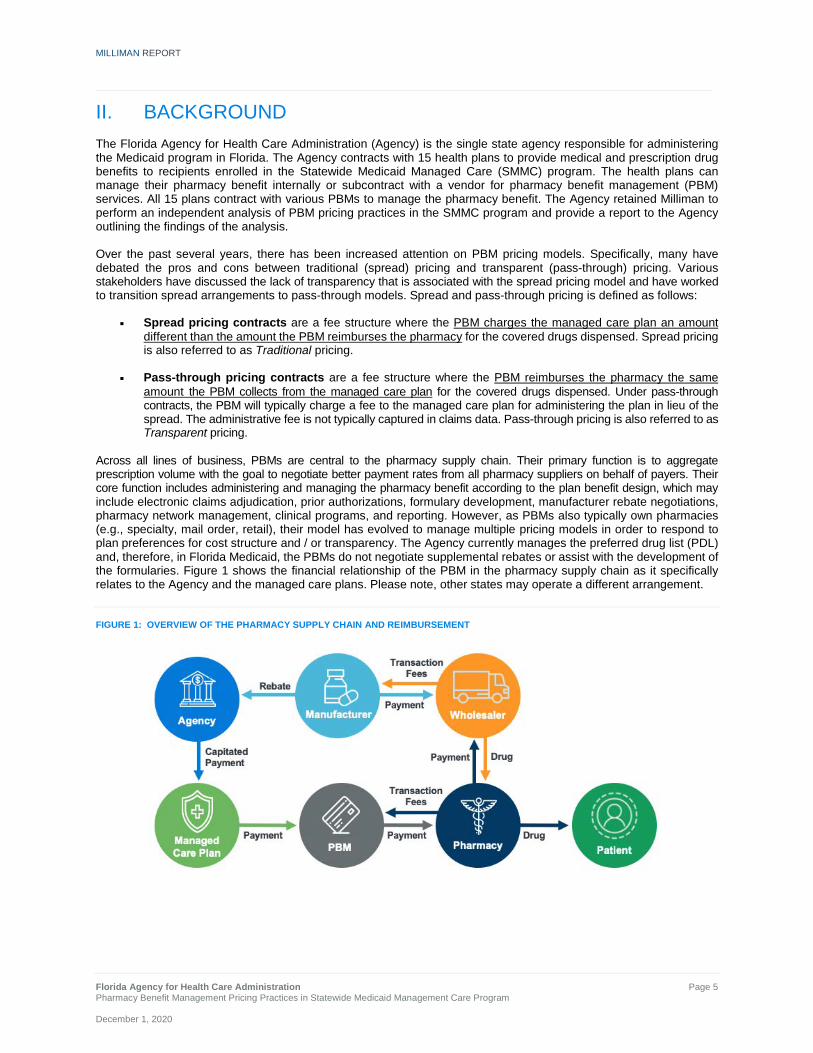
$90.35 is the average amount paid per claim to pharmacies for all prescriptions in the SMMC program for the analysis period. This is inclusive of ingredient cost plus dispensing fee. We use this value as a proxy for the average guaranteed payment negotiated between the PBM and the pharmacy. This includes a mix of payments to OGER and non-OGER pharmacies.
Plans in spread pricing arrangements pay PBMs $94.08 per claim and the PBMs pay pharmacies $85.42 per claim generating approximately 9.2% spread.
Plans in pass-through pricing arrangements pay PBMs $94.29 per claim and the PBMs pay pharmacies the same amount resulting in zero spread, but the plans also pay an administrative fee to the PBMs equal to $1.45 per claim.
Repricing the SMMC drug utilization under the Agency FFS reimbursement methodology increases total program costs and also increases total pharmacy reimbursement to $96.86 per claim (inclusive of ingredient cost and dispensing fee).
− The increased cost to the State is largely driven by the dispensing fee of $10.24 per claim. This is an
increase of $98.8M (4.6%) to total program costs.
− We also assumed the PBM will administer the State fee schedule and receive a $1.45 per claim admin fee for this function.

MILLIMAN REPORT
_______________________________________________________________________________________________________________________
Florida Agency for Health Care Administration Page 10 Pharmacy Benefit Management Pricing Practices in Statewide Medicaid Management Care Program December 1, 2020
FIGURE 2: FLOW OF FUNDS PER CLAIM PRICING, GDR NORMALIZED CLAIMS IN ALL DISPENSING CHANNELS
CALCULATED SPREAD USING
SPECIFIC PAYMENT AMOUNT CALCULATED SPREAD USING PBM-TO-
PHARMACY AVERAGE PAYMENT
Plans with Spread $94.08 - $85.42 = $8.66 (9.2%) $94.08 - $90.35 = $3.73 (4.0%)
Plans with Pass-through $94.29 - $94.29 = $0 (0%) $94.29 - $90.35 = $3.94 (4.2%) Note: It is not possible to discern which PBM pricing arrangement provides the lowest pharmacy costs to a managed care plan through a direct comparison of the spread and pass-through results above.
To understand the economics from the PBM perspective, we compared the amount received by the PBM from the managed care plan to the contractual guaranteed rate paid by the PBM to the pharmacy: − The spread percentage of the spread arrangement is 4.0% ($94.08 minus the guarantee of $90.35).
− The spread percentage of the pass-through arrangement is 4.2% ($94.29 minus the guarantee of $90.35).
− There is an effective payment difference between the plan and pharmacy in both spread and
pass-through arrangements. In addition, the difference between the $90.35 guarantee and the under-payments of $85.42 from the spread pricing arrangements help counter-balance the over-payments in the pass-through deals to calibrate to the PBMs’ overall guaranteed effective rate of $90.35.
• The PBMs have additional flexibility in reconciling reimbursements with the pharmacies that cannot
be captured in this analysis. The PBM’s contracted rates with the participating pharmacies may apply to both commercial and Medicaid contracts; therefore, there are claims outside of this analysis that can affect our proxy “average guaranteed payment.” This creates an additional variable that can be significant when attempting to anticipate how costs to the State will change under different pricing scenarios.
We are unable to determine how the SMMC program costs would change if the plans were to move from
spread to pass-through and vice versa. Despite normalizing claims to account for the differences in generic dispensing rates, there are numerous factors that we cannot account for that would allow a direct comparison of reimbursement differences driven purely by the contracting type. We assume a PBM will underwrite both pricing types to a similar level of margin when proposing the pharmacy pricing to a payer, so our general assumption is that these alternatives are financially equivalent to each other from a payer standpoint.
Pharmacies with guaranteed contracts with the PBMs (OGER – typically chain pharmacies) will receive the aggregate contractual amount due, which is the combination of the payment for claims from plans with pass-through and spread arrangements.
MILLIMAN REPORT
_______________________________________________________________________________________________________________________
Florida Agency for Health Care Administration Page 11 Pharmacy Benefit Management Pricing Practices in Statewide Medicaid Management Care Program December 1, 2020
Pharmacies without guaranteed contracts with the PBMs (non-OGER – typically independent pharmacies) will receive higher levels of payment for claims from plans with pass-through arrangements, and receive lower payments for claims from plans with spread arrangements, but these two separate payment streams do not balance to an overall guarantee.
− This means the non-OGER pharmacies can be financially affected if they dispense a disproportionate
number of claims from plans in spread arrangements.
Since we normalized the results in Figure 2 to better illustrate interactions between pass-through and spread pricing arrangements, we provide Figure 3 using the non-normalized results. These figures will reconcile to the results throughout the report.
FIGURE 3: FLOW OF FUNDS PER CLAIM PRICING, TOTAL CLAIMS IN ALL DISPENSING CHANNELS (RAW DATA)
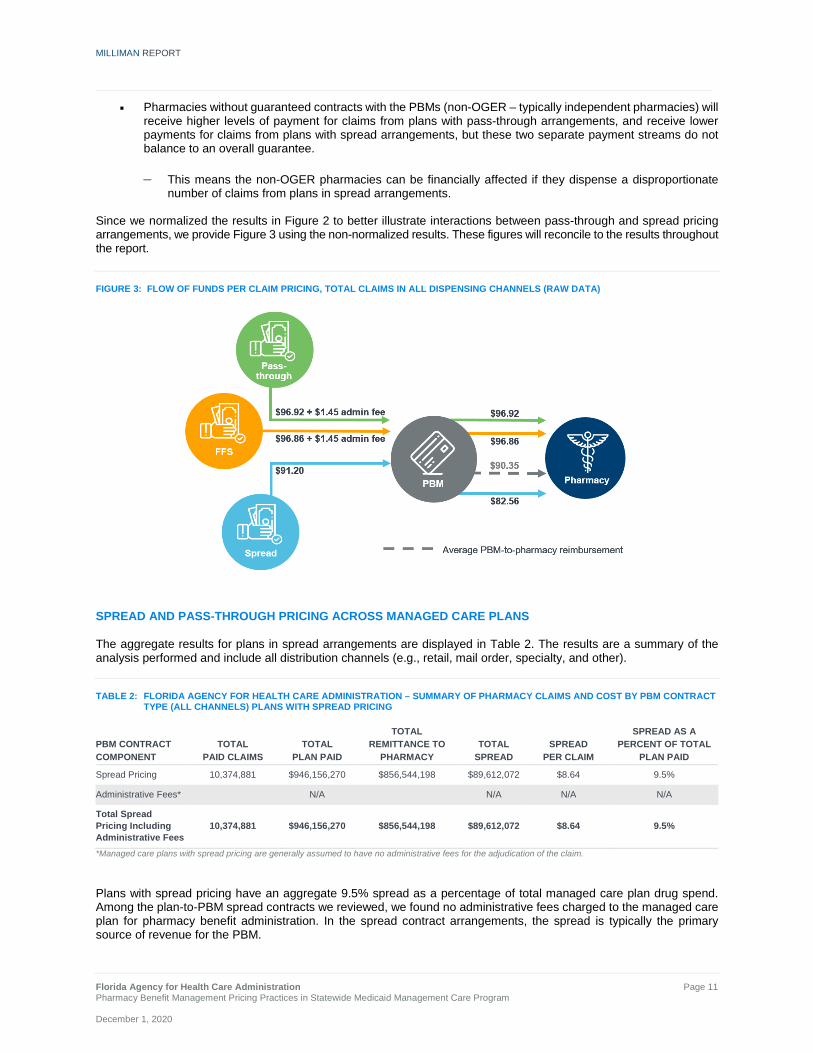
SPREAD AND PASS-THROUGH PRICING ACROSS MANAGED CARE PLANS The aggregate results for plans in spread arrangements are displayed in Table 2. The results are a summary of the analysis performed and include all distribution channels (e.g., retail, mail order, specialty, and other).
TABLE 2: FLORIDA AGENCY FOR HEALTH CARE ADMINISTRATION – SUMMARY OF PHARMACY CLAIMS AND COST BY PBM CONTRACT TYPE (ALL CHANNELS) PLANS WITH SPREAD PRICING
PBM CONTRACT COMPONENT
TOTAL PAID CLAIMS
TOTAL PLAN PAID
TOTAL REMITTANCE TO
PHARMACY TOTAL
SPREAD SPREAD
PER CLAIM
SPREAD AS A PERCENT OF TOTAL
PLAN PAID
Spread Pricing 10,374,881 $946,156,270 $856,544,198 $89,612,072 $8.64 9.5%
Administrative Fees* N/A N/A N/A N/A
Total Spread Pricing Including Administrative Fees
10,374,881 $946,156,270 $856,544,198 $89,612,072 $8.64 9.5%
*Managed care plans with spread pricing are generally assumed to have no administrative fees for the adjudication of the claim. Plans with spread pricing have an aggregate 9.5% spread as a percentage of total managed care plan drug spend. Among the plan-to-PBM spread contracts we reviewed, we found no administrative fees charged to the managed care plan for pharmacy benefit administration. In the spread contract arrangements, the spread is typically the primary source of revenue for the PBM.
MILLIMAN REPORT
_______________________________________________________________________________________________________________________
Florida Agency for Health Care Administration Page 12 Pharmacy Benefit Management Pricing Practices in Statewide Medicaid Management Care Program December 1, 2020
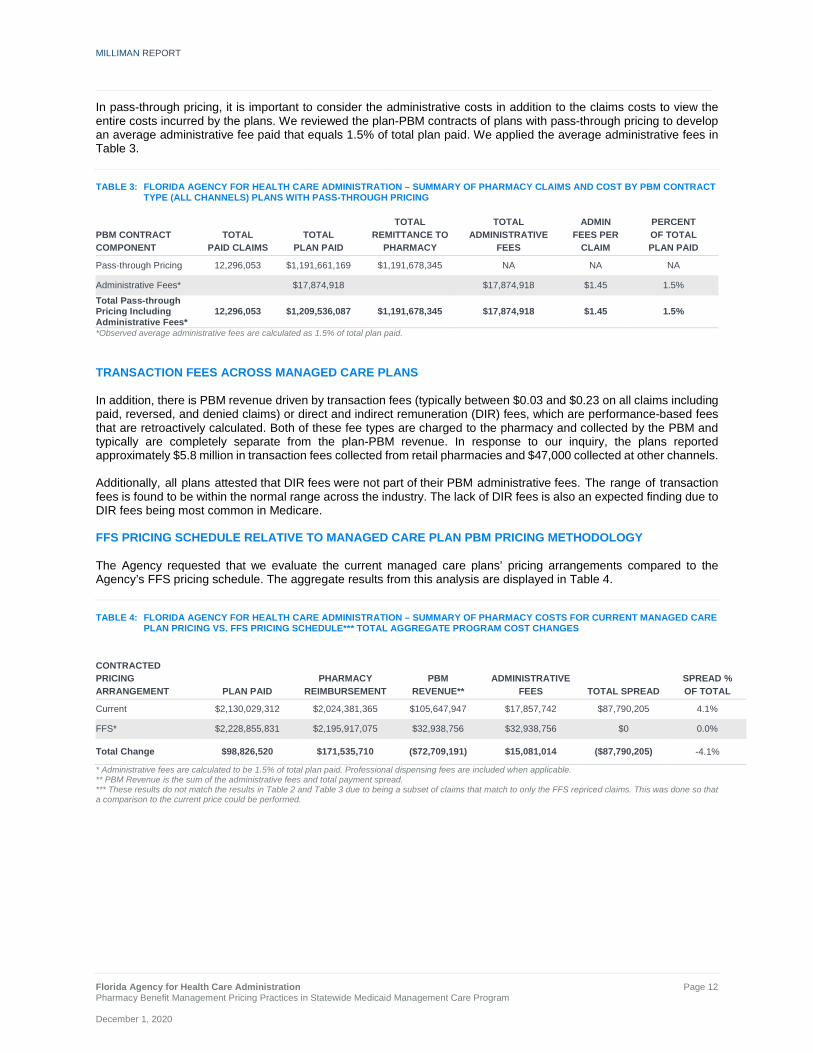
In pass-through pricing, it is important to consider the administrative costs in addition to the claims costs to view the entire costs incurred by the plans. We reviewed the plan-PBM contracts of plans with pass-through pricing to develop an average administrative fee paid that equals 1.5% of total plan paid. We applied the average administrative fees in Table 3.
TABLE 3: FLORIDA AGENCY FOR HEALTH CARE ADMINISTRATION – SUMMARY OF PHARMACY CLAIMS AND COST BY PBM CONTRACT TYPE (ALL CHANNELS) PLANS WITH PASS-THROUGH PRICING
PBM CONTRACT COMPONENT
TOTAL PAID CLAIMS
TOTAL PLAN PAID
TOTAL REMITTANCE TO
PHARMACY
TOTAL ADMINISTRATIVE
FEES
ADMIN FEES PER
CLAIM
PERCENT OF TOTAL PLAN PAID
Pass-through Pricing 12,296,053 $1,191,661,169 $1,191,678,345 NA NA NA
Administrative Fees* $17,874,918 $17,874,918 $1.45 1.5% Total Pass-through Pricing Including Administrative Fees*
12,296,053 $1,209,536,087 $1,191,678,345 $17,874,918 $1.45 1.5%
*Observed average administrative fees are calculated as 1.5% of total plan paid. TRANSACTION FEES ACROSS MANAGED CARE PLANS In addition, there is PBM revenue driven by transaction fees (typically between $0.03 and $0.23 on all claims including paid, reversed, and denied claims) or direct and indirect remuneration (DIR) fees, which are performance-based fees that are retroactively calculated. Both of these fee types are charged to the pharmacy and collected by the PBM and typically are completely separate from the plan-PBM revenue. In response to our inquiry, the plans reported approximately $5.8 million in transaction fees collected from retail pharmacies and $47,000 collected at other channels. Additionally, all plans attested that DIR fees were not part of their PBM administrative fees. The range of transaction fees is found to be within the normal range across the industry. The lack of DIR fees is also an expected finding due to DIR fees being most common in Medicare. FFS PRICING SCHEDULE RELATIVE TO MANAGED CARE PLAN PBM PRICING METHODOLOGY The Agency requested that we evaluate the current managed care plans’ pricing arrangements compared to the Agency’s FFS pricing schedule. The aggregate results from this analysis are displayed in Table 4.
TABLE 4: FLORIDA AGENCY FOR HEALTH CARE ADMINISTRATION – SUMMARY OF PHARMACY COSTS FOR CURRENT MANAGED CARE PLAN PRICING VS. FFS PRICING SCHEDULE*** TOTAL AGGREGATE PROGRAM COST CHANGES
CONTRACTED PRICING ARRANGEMENT PLAN PAID
PHARMACY REIMBURSEMENT
PBM REVENUE**
ADMINISTRATIVE FEES TOTAL SPREAD
SPREAD % OF TOTAL
Current $2,130,029,312 $2,024,381,365 $105,647,947 $17,857,742 $87,790,205 4.1%
FFS* $2,228,855,831 $2,195,917,075 $32,938,756 $32,938,756 $0 0.0%
Total Change $98,826,520 $171,535,710 ($72,709,191) $15,081,014 ($87,790,205) -4.1%
* Administrative fees are calculated to be 1.5% of total plan paid. Professional dispensing fees are included when applicable. ** PBM Revenue is the sum of the administrative fees and total payment spread. *** These results do not match the results in Table 2 and Table 3 due to being a subset of claims that match to only the FFS repriced claims. This was done so that a comparison to the current price could be performed.

MILLIMAN REPORT
_______________________________________________________________________________________________________________________
Florida Agency for Health Care Administration Page 13 Pharmacy Benefit Management Pricing Practices in Statewide Medicaid Management Care Program December 1, 2020
Table 4 shows that if the Agency were to move to the FFS reimbursement schedule, the major impacts to the stakeholders include:
An increase in cost to the State, through an increase to the plan paid amount of $98.8M (4.6%). This additional cost to plans would need to be reflected in their Medicaid capitation rates.
An increase in reimbursement to the pharmacies of $171.5M (8.5%).
− The FFS pricing schedule includes a professional dispensing fee (PDF) of $10.24 per claim, which is a key driver for the increase in costs. By comparison, the PDF under the managed care plans’ current PBM arrangement is nominal (typically $1 or less per claim), which aligns with results from other managed Medicaid analysis.14
A decrease in PBM revenue of $72.7M (-68.8%) as a result of a decrease of $87.8M in PBM spread partially
offset by an increase in administrative fees of $15.1M (84.5%).
− This estimated decrease in PBM revenue assumes no change in administrative fee or change in negotiated guaranteed discounts with current managed care plans.
Although under the FFS pricing model, the PBM spread is eliminated, it does not offset the increase in total plan paid amount for the program. We assumed that in moving to the FFS pricing schedule, the PBMs that administer the Agency’s fee schedule would charge an administrative fee of 1.5% of total drug costs, particularly when moving spread plans to FFS. This administrative fee is an assumption based on the current pass-through admin fee rates, and we recognize this rate could materially change if the State moved to FFS pricing. Refer to Tables 4.1, 4.2, and 4.3 in the Appendix for additional FFS vs. current plan cost results. Figure 4 illustrates the flow of funds to the pharmacies, the PBMs, and the plans on a per-claim basis:
FIGURE 4: AVERAGE PER-CLAIM MEDICAID FLOW OF FUNDS PLANS WITH SPREAD VS. PASS-THROUGH PRICING
Note: Professional dispensing fee per claim is slightly lower than $10.24 due to some claims being priced at Usual & Customary (U&C) and not subject to the dispensing fee.
14 https://chfs.ky.gov/agencies/ohda/Documents1/CHFSMedicaidPharmacyPricing.pdf

MILLIMAN REPORT
_______________________________________________________________________________________________________________________
Florida Agency for Health Care Administration Page 14 Pharmacy Benefit Management Pricing Practices in Statewide Medicaid Management Care Program December 1, 2020
We make the following observations:
The average per-claim reimbursement to the pharmacies is higher for claims paid in pass-through pricing arrangements compared to spread pricing arrangements.
The PBM revenue appears to be lower for claims paid in the pass-through arrangements.
Moving pharmacy payments to the FFS model increases pharmacy reimbursement for claims in spread arrangements (but not pass-through), but increases overall payments to pharmacies due to the additional $10.24 PDF.
It is not possible to determine the PBM pricing arrangement that provides the lowest pharmacy costs to a payer through a direct comparison of the spread and pass-through results. This type of comparison can only be done by repricing the claims to determine the difference in gross pharmacy spend.
AGGREGATE RESULTS - ADDITIONAL DETAIL: DRUG TYPE AND CHANNEL RESULTS Table 5 displays the spread by drug type. Table 5 also displays results across all dispensing pharmacy channels.
TABLE 5: FLORIDA AGENCY FOR HEALTH CARE ADMINISTRATION – SUMMARY OF PHARMACY CLAIMS AND COST BY DRUG TYPE (ALL CHANNELS) BRAND, GENERIC, SPECIALTY
PLANS WITH SPREAD PLANS WITH PASS-THROUGH TOTAL
DRUG TYPE SPREAD
PER CLAIM SPREAD
% SPREAD
PER CLAIM SPREAD
% SPREAD
PER CLAIM SPREAD
%
Brand, non-specialty $10.55 3.7% $0.06 0.0% $4.71 1.7%
Brand, specialty $23.55 0.6% $0.62 0.0% $9.12 0.3%
Generic, non-Specialty $7.94 37.5% ($0.03) -0.2% $3.64 19.9%
Generic, specialty $58.06 23.8% $3.06 1.3% $28.39 11.9%
Total $8.64 9.5% ($0.00) 0.0% $3.95 4.2%
The percentage spread is greatest among generic drugs, with generic non-specialty and generic specialty drugs averaging 37.5% and 23.8% spread, respectively. Findings in other reports show similar results.15 The 1.3% spread in the pass-through generic, specialty claims were observed primarily in one plan for a small number of drugs. This small amount of spread could have resulted from a misclassification of brand vs. specialty pricing (i.e., we can speculate the plan was charged a specialty discount and the pharmacy was paid a brand discount). For the detailed claims summary and the definition of specialty drugs, additional information is available in Tables 5.1 and 5.2 in the Appendix and the methodology section of the report. Table 6 displays the spread by pharmacy channel type.
TABLE 6: FLORIDA AGENCY FOR HEALTH CARE ADMINISTRATION – SUMMARY OF PHARMACY CLAIMS AND COST BY PHARMACY CHANNEL TYPE
PLANS WITH SPREAD PLANS WITH PASS-THROUGH TOTAL
PHARMACY CHANNEL TYPE
SPREAD PER CLAIM
SPREAD %
SPREAD PER CLAIM
SPREAD %
SPREAD PER CLAIM
SPREAD %
Community / Retail $8.77 12.3% ($0.01) 0.0% $3.96 5.4%
Mail Order $0.51 0.2% $0.00 0.0% $0.11 0.1%
Specialty $17.38 0.5% $0.66 0.0% $7.74 0.2%
Other $5.65 6.8% $0.02 0.0% $3.27 3.7%
Total $8.64 9.5% ($0.00) 0.0% $3.95 4.2%
15 https://mmcp.health.maryland.gov/SiteAssets/pages/Reports-and-Publications/hb589PBMauditappealsJCRfinal12-19%20(1).pdf

MILLIMAN REPORT
_______________________________________________________________________________________________________________________
Florida Agency for Health Care Administration Page 15 Pharmacy Benefit Management Pricing Practices in Statewide Medicaid Management Care Program December 1, 2020
The “Other” pharmacies category includes long term care (LTC), Indian Health Service / Tribal / Urban Indian Health (I/T/U), and onsite hospital clinics. The majority of prescriptions are filled by community / retail pharmacies and also comprise the highest PBM spread as a percent of total plan paid. For additional detail regarding aggregate results by pharmacy channel, refer to Tables 6.1 and 6.2 in the Appendix. DETAILED ANALYSIS OF RETAIL PHARMACY CHANNEL The results in this section are displayed for the retail channel only. This means that all claims filled at mail order, specialty pharmacies, and ‘other’ channels are excluded. This viewpoint focuses on the cost difference metrics for retail since this is the channel with the largest observed spread and largest volume of claims. Figures 5 and 6 illustrate the percentage of spend in both pricing contracts.
FIGURE 5: SUMMARY OF PLAN PAID FOR PLANS WITH SPREAD PRICING (RETAIL CHANNEL ONLY)
FIGURE 6: SUMMARY OF PLAN PAID FOR PLANS WITH PASS-THROUGH PRICING (RETAIL CHANNEL ONLY)
In both pricing arrangements, the chain pharmacies make up the largest portion equaling approximately half of the paid amount in the retail channel. The independent- and PBM-owned pharmacies each make up approximately a quarter of the paid each.
22%
55%
22%
1%
Independent
Chain
PBM Owned
Other
25%
50%
24%
1%
Independent
Chain
PBM Owned
Other

MILLIMAN REPORT
_______________________________________________________________________________________________________________________
Florida Agency for Health Care Administration Page 16 Pharmacy Benefit Management Pricing Practices in Statewide Medicaid Management Care Program December 1, 2020
Table 7 displays the retail channel only results separately by pharmacy ownership type including: Chain, Independent, PBM Owned, and Other.
TABLE 7: AGENCY FOR HEALTH CARE ADMINISTRATION – SUMMARY OF PHARMACY CLAIMS AND COST BY PHARMACY OWNERSHIP TYPE RETAIL CHANNEL ONLY
PLANS WITH SPREAD PLANS WITH PASS-THROUGH TOTAL PHARMACY OWNERSHIP TYPE
SPREAD PER CLAIM
SPREAD %
SPREAD PER CLAIM
SPREAD %
SPREAD PER CLAIM
SPREAD %
Chain $9.78 14.8% ($0.04) -0.1% $4.69 6.9%
Independent $10.15 11.5% $0.03 0.0% $4.58 4.7%
PBM Owned $4.71 6.8% $0.03 0.0% $1.82 2.8%
Other $11.05 8.4% ($0.01) 0.0% $6.24 4.6%
Total $8.77 12.3% ($0.01) 0.0% $3.96 5.4%
While Table 7 illustrates how the spread varies by pharmacy type, it is not appropriate to conclude which pharmacies are paid more or less relative to others. For example, higher spread may be the result of either lower payment rates to the pharmacies or higher payment rates received from the plan. Differences in drug mix could also contribute to differences in the results displayed. It is reasonable to expect that pharmacies with OGER PBM contracts have lower spread compared to pharmacies without an OGER contracted rate because they are owed a contractually negotiated payment rate from the PBM, whereas non-OGER pharmacies are not owed a specified level of reimbursement. PBM-owned retail pharmacies were observed to have a lower spread per claim on average. This may be a function of the economics of the retail contract and the additional source of profit for the PBM from the PBM-owned dispensing pharmacy. For additional detail, refer to Tables 7.1 and Table 7.2 in the Appendix. Table 8 displays the distribution of claims within the retail channel only by pharmacy location and pharmacy type. Unknown is unable to be identified, since there was no ZIP code provided. Super Rural is defined by CMS and includes all OMB-defined Non-Metropolitan Counties and selected ZIP code areas of Metropolitan Counties and is calculated to be the lowest quartile of the areas with the lowest densities.
TABLE 8: FLORIDA AGENCY FOR HEALTH CARE ADMINISTRATION – PHARMACY LOCATION CLAIMS DISTRIBUTION BY PHARMACY TYPE RETAIL CHANNEL ONLY - ALL PLANS
PHARMACY LOCATION INDEPENDENT CHAIN PBM OWNED OTHER TOTAL
Urban 16.5% 56.9% 26.1% 0.5% 100.0%
Rural 36.2% 40.8% 23.0% 0.0% 100.0%
Super Rural 54.5% 21.9% 23.6% 0.0% 100.0%
Unknown 22.0% 67.0% 10.1% 0.8% 100.0%
The distribution of pharmacies changes in relationship to the pharmacy location. In urban areas, claims are most concentrated among chain pharmacies and PBM-owned pharmacies. In super rural settings, claims are most concentrated among independent pharmacies. Please refer to the Methodology and Assumptions section for how the CMS defines the locations.

MILLIMAN REPORT
_______________________________________________________________________________________________________________________
Florida Agency for Health Care Administration Page 17 Pharmacy Benefit Management Pricing Practices in Statewide Medicaid Management Care Program December 1, 2020
TABLE 9: FLORIDA AGENCY FOR HEALTH CARE ADMINISTRATION – SUMMARY OF PBM SPREAD BY PHARMACY LOCATION RETAIL CHANNEL ONLY
PLANS WITH SPREAD PLANS WITH PASS-THROUGH TOTAL
PHARMACY LOCATION
SPREAD PER CLAIM
SPREAD %
SPREAD PER CLAIM
SPREAD %
SPREAD PER CLAIM
SPREAD %
Urban $8.75 12.2% -0.8% 0.0% $4.01 5.5%
Rural $8.76 14.2% -0.8% 0.0% $4.73 7.7%
Super Rural $9.74 15.1% 0.2% 0.0% $2.32 4.1%
Unknown $9.11 13.2% -0.1% 0.0% $2.63 2.9%
Total $8.47 12.3% -0.7% 0.0% $3.83 5.6%
Across plans with spread and pass-through pricing, the spread varies between each pharmacy location. For additional detail, refer to Table 8.1, Table 8.2, Table 9.1, and Table 9.2 in the Appendix. In Figure 7, we provide a map of the pharmacies in both plans with spread and pass-through pricing. The intensity of the color represents the total spread that may be retained by the PBM. The size of the circle represents the number of claims that have been filled at the pharmacy.
FIGURE 7: SPREAD PERCENTAGE AND CLAIMS VOLUME BY PHARMACY LOCATION
The map illustrates the geographical location of the pharmacies that may be impacted by each of the pricing arrangements enacted by the PBMs. The geographical nature of the SMMC program’s plans may affect pharmacy reimbursement. For example, a pharmacy located in the Naples area may receive reimbursement from plans that have pass-through pricing contracts, whereas a pharmacy located in Jacksonville could receive payments through predominantly spread pricing contracts. This means a single pharmacy could receive a disproportionate number of
Utilization
> 150,000
100,000
50,000
10,000
1,000 Spread
> 10.0%
7.5% 5.0% 2.5% < 0.0%

MILLIMAN REPORT
_______________________________________________________________________________________________________________________
Florida Agency for Health Care Administration Page 18 Pharmacy Benefit Management Pricing Practices in Statewide Medicaid Management Care Program December 1, 2020
Medicaid claims in higher per-claim reimbursement pass-through arrangements and benefit from not having corresponding lower per-claim reimbursement from spread claims. The inverse of this scenario is also possible. Another geographical consideration is independent pharmacies in a PSAO contract with a contracted guaranteed payment rate. Independent pharmacies in geographical areas with plans that have pass-through arrangements may receive higher reimbursement relative to independent pharmacies that are located in areas with plans that have spread arrangements. This is supported by the results that show payments to pharmacies from managed care plans with pass-through contracts are higher than payments to pharmacies from plans with spread contracts. Table 10 displays the spread by drug type. This viewpoint includes any specialty prescriptions and 90-day prescriptions filled in the retail pharmacy channel.
TABLE 10: FLORIDA AGENCY FOR HEALTH CARE ADMINISTRATION – SUMMARY OF PHARMACY CLAIMS AND COST BY DRUG TYPE (RETAIL CHANNEL ONLY) BRAND, GENERIC, SPECIALTY
PLANS WITH SPREAD PLANS WITH PASS-THROUGH TOTAL
DRUG TYPE SPREAD
PER CLAIM SPREAD
% SPREAD
PER CLAIM SPREAD
% SPREAD
PER CLAIM SPREAD
%
Brand, non-specialty $11.00 4.0% $0.06 0.0% $4.87 1.8%
Brand, specialty $45.15 1.6% $0.81 0.0% $15.59 0.6%
Generic, non-specialty $8.02 38.2% ($0.04) -0.2% $3.63 20.1%
Generic specialty $48.97 33.0% $2.47 1.7% $23.56 16.0%
Total $8.77 12.3% ($0.01) 0.0% $3.96 5.4%
Similar to the results across all channels shown in Table 5, Table 10 shows that retail generic prescriptions, both specialty and non-specialty, have the highest spread as a percentage of drug spend. Generic non-specialty also comprises the largest amount of prescriptions. For additional detail, refer to Tables 10.1 and 10.2 in the Appendix. Table 11 displays the results for retail brand and generic drugs (specialty and non-specialty combined) separated by 30-day supply and 90-day supply.
TABLE 11: AGENCY FOR HEALTH CARE ADMINISTRATION – SUMMARY OF PHARMACY CLAIMS AND COST BY DRUG TYPE AND DAY SUPPLY (RETAIL CHANNEL ONLY) 30 DAY AND 90 DAY PRESCRIPTIONS
PLANS WITH SPREAD PLANS WITH PASS-THROUGH TOTAL
DRUG TYPE DAY
SUPPLY SPREAD
PER CLAIM SPREAD
% SPREAD
PER CLAIM SPREAD
% SPREAD
PER CLAIM SPREAD
%
Brand 30 day $11.98 3.4% $0.09 0.0% $5.27 1.5%
Brand 90 day $34.28 1.8% $0.84 0.1% $9.53 0.8%
Generic 30 day $8.08 37.8% ($0.03) -0.2% $3.67 19.8%
Generic 90 day $15.59 47.6% $0.05 0.2% $6.89 25.9%
Total $8.77 12.3% ($0.01) 0.0% $3.96 5.4%
Consistent with Table 10 results, generic prescriptions have the highest spread as a percentage of drug spend regardless of the days supply filled by the pharmacy. We also note that the plans typically dispense 30-day supplies, and, therefore, there may be limited conclusions that can be drawn for 90-day supplies. For the distribution of 30-day and 90-day supplies, as well as additional detail, refer to Tables 11.1 and 11.2 in the Appendix. ANALYSIS OF NON-SPECIALTY GENERIC PAYMENTS IN RETAIL Generic medications dispensed in the retail channel are where most of the spread occurs. We provide Table 12 and Figure 8 to display additional detail for the top drugs (by total spread dollars) and percentile distribution of generic reimbursement. Table 12 displays the top 10 drugs ranked by total aggregate dollars of spread.

MILLIMAN REPORT
_______________________________________________________________________________________________________________________
Florida Agency for Health Care Administration Page 19 Pharmacy Benefit Management Pricing Practices in Statewide Medicaid Management Care Program December 1, 2020
TABLE 12: AGENCY FOR HEALTH CARE ADMINISTRATION – SUMMARY OF TOP 10 DRUGS BY TOTAL SPREAD RETAIL CHANNEL ONLY PLANS WITH SPREAD PLANS WITH PASS-THROUGH TOTAL
DRUG TYPE DRUG TYPE
TOTAL SPREAD
SPREAD PER CLAIM
SPREAD %
SPREAD PER CLAIM
SPREAD %
SPREAD PER CLAIM
SPREAD %
METHYLPHENIDATE HYDROCHLORIDE G $3,642,321 $51.15 31.6% ($0.25) -0.2% $23.76 14.6%
FLUTICASONE PROPIONATE G $1,746,083 $9.17 62.2% ($0.00) 0.0% $3.83 36.9%
ATOMOXETINE G $1,735,832 $118.05 57.7% ($0.15) -0.1% $55.59 34.6%
ALBUTEROL SULFATE G $1,527,822 $8.51 52.7% ($0.05) -0.4% $3.93 27.1%
AMPHETAMINE / DEXTROAMPHETAMINE G $1,342,134 $20.83 45.0% ($0.23) -0.8% $10.78 28.6%
CEFDINIR G $1,332,085 $19.04 50.8% ($0.10) -0.3% $8.83 26.6%
GUANFACINE ER G $1,315,749 $26.42 48.8% ($0.07) -0.4% $11.87 35.8%
BROMPHENIRAMINE / PSEUDOEPHEDRINE G $1,173,690 $9.45 55.3% $0.02 0.2% $4.11 27.0%
KETOCONAZOLE G $1,172,463 $21.87 58.4% ($0.10) -0.4% $9.51 29.4%
TAMIFLU B $1,138,847 $25.82 12.9% ($0.01) 0.0% $10.87 5.3%
Subtotal: Top 10 Drugs $16,127,026 $18.72 38.9% ($0.06) -0.2% $8.36 19.3%
TOTAL of all drugs $84,997,459 $8.77 12.3% ($0.01) 0.0% $3.96 5.4%
In Table 12, plans with spread contracts observe the greatest spread by PBMs on generic prescriptions. The top medication classes include mental health, asthma, and respiratory conditions. For additional detail, refer to Tables 12.1 through 12.6 in the Appendix. Figure 8 displays the percentile distribution of reimbursement rates for retail generic claims under spread contracts, pass-through contracts, and FFS pricing schedule. In order to determine the variance in the average cost per $100 of AWP, we examine the percentile distribution graphs in Figure 8.
FIGURE 8: PERCENTILE DISTRIBUTION OF PRICING METHODOLOGIES FOR GENERIC, NON-SPECIALTY DRUGS PER $100 OF AWP
10th
30th
50th 70th
80th
85th
90th
95th
10th30th
50th 70th
80th
85th
90th
95th
10th30th
50th 70th
80th
85th90th
95th
$0 $10 $20 $30 $40 $50 $60 $70 $80 $90 $100
Cla
ims
Dis
tribu
tion
Spread Plans Pass-through Plans FFS Plans

MILLIMAN REPORT
_______________________________________________________________________________________________________________________
Florida Agency for Health Care Administration Page 20 Pharmacy Benefit Management Pricing Practices in Statewide Medicaid Management Care Program December 1, 2020
Note the following observations regarding Figure 8:
Claims from spread plans between the 30th and 80th percentile (representing half the script volume) are reimbursed between $4 and $18.
Claims from plans with pass-through pricing between the 30th and 80th percentile (representing half the script volume) are reimbursed between $4 and $27.
Claims under the FFS methodology between the 30th and 80th percentile would be reimbursed between $13 and $56. The flatter line noticed under the FFS reimbursement is largely due to the $10.24 professional dispensing fee, which helps base the reimbursement closer to the actual acquisition cost of the drug.
The PBM is managing the claims reimbursement displayed along the blue and green lines to meet their pricing guarantees with both the pharmacies and the plans.
Claims under the plans with spread pricing are mostly concentrated at lower reimbursed amounts in comparison to plans with pass-through pricing and the FFS methodology.
A pharmacy’s mix of spread and pass-through claims can greatly influence its overall reimbursement.

MILLIMAN REPORT
_______________________________________________________________________________________________________________________
Florida Agency for Health Care Administration Page 21 Pharmacy Benefit Management Pricing Practices in Statewide Medicaid Management Care Program December 1, 2020
IV. DISCUSSION DETERMINING THE OPTIMAL PBM FINANCIAL ARRANGEMENT There are many variables and considerations in pharmacy pricing that make it difficult to predict the outcome when making a significant program change. A State cannot only require plans to enter into ‘pass-through’ pricing arrangements with PBMs and achieve true transparency. As described in the results above, the interaction between plan, PBM, and pharmacy is complex with many moving pieces. Due to the complexity of pharmacy pricing and the expertise required to understand how changing the reimbursement model of the Agency’s pharmacy program, the Agency requested Milliman provide insights and pharmacy pricing options for considerations given the current pricing landscape. Below, we provide options and factors the State should consider when evaluating a new program-wide pharmacy pricing model. The current Medicaid managed care pharmacy network pricing landscape:
Managed care plans in a mix of spread and pass-through pricing arrangements Pharmacies required to pay per-claim transaction fees to PBMs Geographically concentrated pockets of plans with spread and pass-through pricing Opaque pricing models currently in use
HOW TO ACHIEVE GREATER TRANSPARENCY Methods and considerations to achieve greater transparency:
Change the definition of “pass-through pricing” in plan-to-PBM contracts to align more closely with PBM-to-pharmacy network contracts.
− The current definition of pass-through within the plan-to-PBM contracts provides flexibility to PBMs in
several ways: allows the PBM to offset between both commercial and Medicaid claims to meet pharmacy contractual reimbursement; and allows PBMs to offset the payment of claims from plans with spread and pass-through contracts to meet the PBM-to-pharmacy financial guarantees.
− This will require the plan-to-PBM contract to align to definitions and pricing terms of the PBM-to-pharmacy contract. This means the amount the plan pays to the PBM will now equal the total amount contractually due to the pharmacy, in the aggregate.
Report on transaction fees charged by PBM to contract network pharmacies.
− Reporting the fees will allow the Agency and pharmacies greater visibility into these fees and how they are charged and potentially reduce the variability in fees across pharmacies.
Prevent the PBM from offsetting the payment of commercial and Medicaid claims for pharmacy
reimbursement.
− PBM contracts with pharmacies currently allow offsetting of payments between commercial and Medicaid claims. This means commercial payment rates may influence Medicaid reimbursement to pharmacies. This will prohibit the offsetting of claims between the commercial and Medicaid line of business and provide clear line of sight of the actual payments provided to pharmacies for claims within the SMMC program.
All of these methods will need to contemplate plans that contract with delegated PBM vendors. Any program
requirement change should extend contract requirements to delegated PBM vendors of SMMC plans.

MILLIMAN REPORT
_______________________________________________________________________________________________________________________
Florida Agency for Health Care Administration Page 22 Pharmacy Benefit Management Pricing Practices in Statewide Medicaid Management Care Program December 1, 2020
METHODS AND CONSIDERATIONS TO ENHANCE STAKEHOLDER ALIGNMENT WITHIN THE PHARMACY PROGRAM
Allow a single PBM to manage the entire SMMC pharmacy benefits program including pharmacy networks. − This will create a single claims platform to manage the entire pharmacy benefit and streamline data,
reporting and audits.
− The State can provide the consolidated volume of the entire SMMC program to a single PBM that will allow them to negotiate pharmacy network rates and implement the transparency requirements uniformly to all plans.
• The state may ask plans to voluntarily agree to a single PBM. If plans do not agree, the State would
need to mandate this initiative.
• Each managed care plan would continue to own the contract with the PBM.
• Vertically integrated managed care plans may refuse to participate if their in-house PBM is not selected.
• Vendor selection may require the Agency to issue a competitive solicitation.
Mandate a minimum reimbursement rate per prescription for independent rural pharmacies (e.g., $8 per script)
to support access to care in rural settings. − The reimbursement to independent pharmacies will increase and align payment to the true cost to fill a
prescription. These payments should be carved out of the overall network guaranteed rates because they will result in a higher payment rate to the pharmacy for these minimum reimbursement claims.
− The ultimate goal is to account for pharmacy location and characteristics that require higher costs to dispense. This is especially critical for pharmacies that do not have guaranteed reimbursement contracts with the PBMs. These custom payment rates will help reduce the pricing variability.
Evaluate how the State’s single PDL strategy is operationalized through plan-to-PBM payments and
PBM-to-pharmacy payments. − All stakeholders should align to a single brand / generic definition.
• For example, identify opportunities where the PBM is paying the pharmacy a generic rate for a brand
drug and charging the managed care plan the brand rate.
Align definitions of specialty drugs across contracts and require retail pharmacy reimbursement rates for specialty drugs to be at parity with PBM-owned pharmacy payment rates, including mail order and specialty pharmacies.16 − May require Agency defined and mandated specialty drug list that all stakeholders must implement.
− The current landscape may include specialty definition misalignment, which leads to different payment
rates between plans to PBMs and PBMs to pharmacies. Aligning all stakeholders to a single specialty list allows payment transparency and consistency. It is also important to address payment disparities for the same drug that may arise between dispensing channels (retail and mail order).
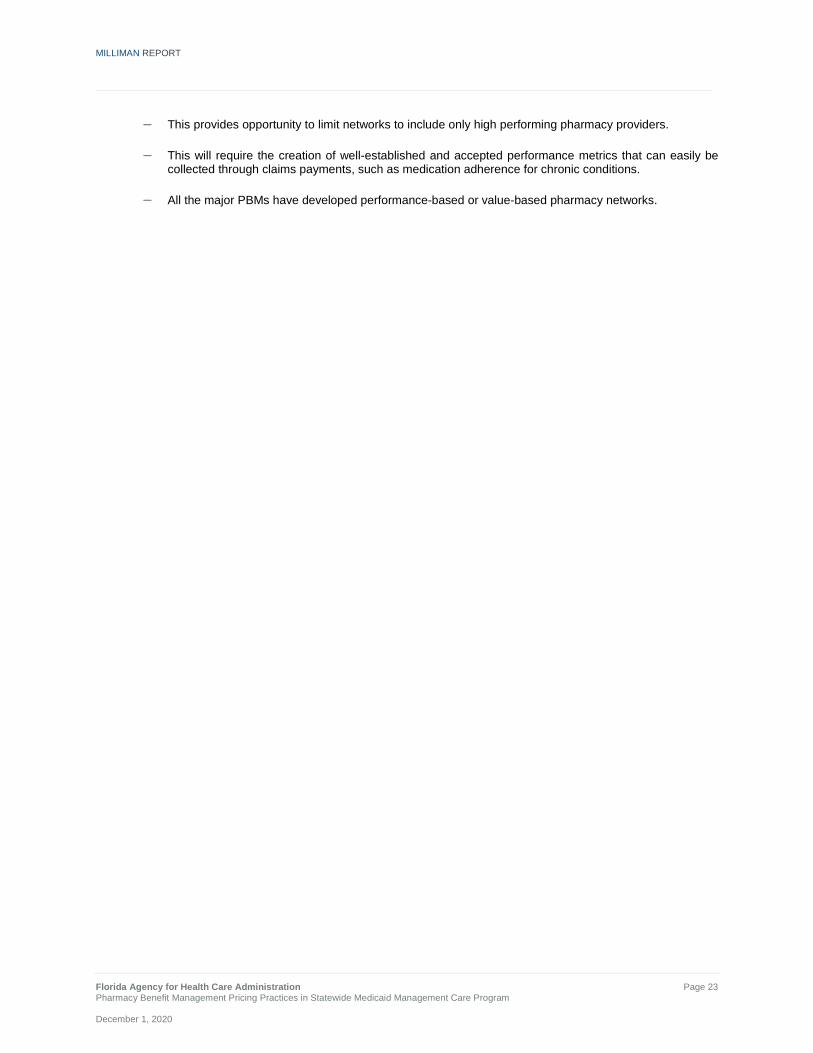
Align value-based payments to pharmacies based on Medicaid outcomes metrics.
− Value-based programs were first established through the Medicare Access and Children’s Health
Insurance Program Reauthorization Act of 2015 (MACRA).
16 http://webserver1.lsb.state.ok.us/cf_pdf/2019-20%20COMMITTEE%20REPORTS/House/CCR%20Combined/HB2632%20CCR.PDF [Accessed September 21, 2020]
MILLIMAN REPORT
_______________________________________________________________________________________________________________________
Florida Agency for Health Care Administration Page 23 Pharmacy Benefit Management Pricing Practices in Statewide Medicaid Management Care Program December 1, 2020
− This provides opportunity to limit networks to include only high performing pharmacy providers.
− This will require the creation of well-established and accepted performance metrics that can easily be
collected through claims payments, such as medication adherence for chronic conditions.
− All the major PBMs have developed performance-based or value-based pharmacy networks.

MILLIMAN REPORT
_______________________________________________________________________________________________________________________
Florida Agency for Health Care Administration Page 24 Pharmacy Benefit Management Pricing Practices in Statewide Medicaid Management Care Program December 1, 2020
V. CONSIDERATIONS AND LIMITATIONS Claims payments between a plan and PBM and between a PBM and pharmacy are complex and have many variables to analyze. Performing an analysis using only the historical claims dataset provides a limited viewpoint in understanding the value a PBM provides to a plan and ultimately to the pharmacy. It is important to take into account items that fall outside of the claims data to fully understand the total dollar value between the plan and PBM. These additional items include: the PBM-to-plan contract terms, reconciliation to the contract guarantees, network performance fees paid outside of the claims, and other PBM financial transactions that may exist outside of the claims dataset analyzed. When a State is considering program-level changes to the way its managed care plans contract with PBMs, it is typical for the State to consider the payer-to-PBM value, which eventually equates to total program value. But the State should also fully understand the financial ecosystem of the PBM vendors and the pharmacy providers within the pharmacy benefit program. In this viewpoint, there are even larger considerations at stake. These include items, such as: all stakeholder viewpoints – PBMs, managed care plans, and pharmacies, how the costs and stakeholder value will change under the proposed changes, and any unintended consequences that may occur as a result of the proposed changes. The discussion items below outline various considerations that were not included in our analysis and should be further contemplated when reviewing results for a multi-managed care plan PBM spread pricing analysis. FEE-FOR-SERVICE REIMBURSEMENT PRICE COMPARISON In the comparison of the managed care costs to FFS, we calculated a FFS cost at the claim level. In addition, we factored in an administrative fee assumption of 1.5% to account for any fees the PBM would charge for administration of the FFS reimbursement methodology. We estimated the value of the administrative fees based on the rates in the PBM contracts of plans with pass-through pricing and applied this value to all utilization under FFS. Actual administrative fees may vary by plan. The actual amount may vary if the Agency were to move to a FFS reimbursement schedule due to a variety of factors, such as different contracted pricing and mix of drugs. VARIATION OF PBM CONTRACT ARRANGEMENTS AMONG 15 MANAGED CARE PLANS When performing a claims data analysis, it is imperative to take into account the detailed contract terms between the plan and the PBM. For our analysis, we found that four plans were in pass-through pricing arrangements and ten plans were in spread pricing arrangements. An additional plan was excluded from the claims analysis due to invalid data. Each contract contained different definitions for brand, generic, specialty, varying categories of drugs included (or excluded) from the guarantees, and different terms defining how the payments would reconcile at the end of the performance period. There were also differences in the performance contract time period. It is important to note that some plans included within this analysis were in spread pricing arrangements, but were contracted to move to pass-through pricing arrangements in 2019 or 2020. The PBM typically negotiates a contract separately with plans and pharmacies. The PBM pays claims to pharmacies throughout the year, with the goal to meet its contractual obligation, while separately charging claims to the plan, sometimes a different rate, to meet its contractual guarantees with the plan. PLANS WITH PASS-THROUGH PRICING WITH INTERMEDIARY PBMS THAT HAVE SPREAD NETWORK We observed one managed care plan who had pass-through provisions within their contract with the PBM, but observed spread pricing arrangements when compared to the reimbursement to the pharmacies. This is due to the PBM contracting as an intermediary and leasing the network function from another PBM. This secondary PBM network is paid as a spread-pricing arrangement. This arrangement may lead the managed care plan to believe they are in a pass-through pricing arrangement, when in actuality the payments to the pharmacy are performed using a spread-pricing methodology.

MILLIMAN REPORT
_______________________________________________________________________________________________________________________
Florida Agency for Health Care Administration Page 25 Pharmacy Benefit Management Pricing Practices in Statewide Medicaid Management Care Program December 1, 2020
PBM CONTRACT CONSIDERATIONS Below are some additional details about specific items within PBM contracts:
Reconciliation: A process by which the plan and PBM or the PBM and pharmacy reconciles financial guarantees against actual performance achieved during the contract period. The PBM typically guarantees a specific discount off AWP on Drug Type and manages payments from the plan (and to the pharmacy) to achieve these guarantees over the contract performance period. Any over / under performance achieved through claims payment at the end of the contract period is reconciled retrospectively, which is a limitation to any analysis relying solely on claims data. These true-up payments are handled generally four to six months after the contract period has ended and results in payments to the plan or pharmacy, or back to the PBM. The reconciliation amounts may decrease the spread particularly if the plan underperforms compared to the network guarantee. We requested reconciliation amounts from the managed care plans. We reviewed the amounts and did not deem the reconciliation to impact the results of our analyses. Most managed care plans perform very closely to the guarantees.
Brand Effective Rates / Generic Effective Rates: All of the plan-PBM contracts reviewed have brand effective rate guarantees (BERs) and generic effective rate guarantees (GERs) among various other types of pricing guarantees. These financial commitments are calculated as aggregate AWP discounts and guaranteed by the PBM to be achieved during the contract performance period. We did not reconcile each plan’s claims data to the BERs and GERs, because the purpose of this analysis was to look at the aggregate pharmacy cost paid by all managed care plans compared to the reimbursement to all pharmacies from the PBMs.
Definitions (Brands, Generics, 30-day claims, 90-day claims): The definition of pricing components that have a financial guarantee (e.g., AWP discount off generic drugs) can vary widely among PBMs and even differ from contract to contract from the same PBM. The definitions may vary for pricing compared to operations (e.g., formulary brand / generic definitions). These definitions can vary for Brands, Generics, Specialty, 30-day claims, and 90-day claims. For our analysis, we created a consistent definition for each component and applied that definition to all plan-paid claims and pharmacy remittance claims to control for definition variation within the analysis.
Claim inclusion / exclusion criteria: Inclusion and exclusion criteria are an important consideration when trying to reconcile a plan’s aggregate claims back to the contract guarantees. We did not take into account plan-specific inclusion / exclusion criteria (e.g., 340B claims), but we did apply a general exclusion list to all claims to account for the most common exclusions observed across all plans. The list of exclusions is outlined in the methodology and assumptions section of the report.
Specialty Lists: Similar to brand and generic definitions as described above, specialty claims are also typically defined within a plan to PBM contract. This list is typically at the drug or National Drug Code (NDC) level defining the medications that are considered specialty drugs. The purpose of defining what drugs are specialty within the plan’s PBM contract is to outline separate (and different) financial guarantee separate from non-specialty drugs.
OTHER PBM REVENUE Our analysis reviews the revenue that is generated by spread pricing arrangements and administrative fees associated with the adjudication of claims. Our analysis does not include other PBM revenue, such as clinical program fees. Pharmacy Transaction Fees Most PBMs routinely include an assessment fee in their provider networks, called a “transmittal fee,” “line charge,” “access charge” or “network charge.” These fees are between the PBM and the pharmacy and typically range from $0.03 to $0.23 per claim and apply to every electronically submitted transaction, such as paid claim, reversed claim, adjusted claim, and denied claim. We requested these transaction fees for the Agency’s SMMC program, which totaled approximately $5.8M collected from the pharmacies and paid to the PBMs.

MILLIMAN REPORT
_______________________________________________________________________________________________________________________
Florida Agency for Health Care Administration Page 26 Pharmacy Benefit Management Pricing Practices in Statewide Medicaid Management Care Program December 1, 2020
Texas was the first state to ban transaction fees, starting September 1, 2015. The Texas Health and Human Services (HHSC) contract with MCOs in the Texas Medicaid program prohibits the direct or indirect assessment of transaction fees by either MCOs or their subcontractors (PBMs). Texas Insurance Code added pharmacies to the list of healthcare providers that cannot be assessed a transaction fee and specifically prohibit the assessment of fees for network management services, inclusion in a network, services related to the adjudication of a claim, services related to processing a claim, services related to transmitting a claim, or for developing a claims processing and adjudication network. The law does not apply to self-funded health plans as defined by ERISA, federal health plans — like Medicare or TRICARE — or workers’ compensation plans. Pharmacy DIR Fees Direct and Indirect remuneration are fees assessed by PBMs to any participating pharmacy and generally collected after the point of sale. The fee is often based on the performance of pharmacies where the pharmacies offer price concessions if they do not meet the PBM benchmark metrics of performance standards. Another common DIR fee is when a pharmacy would pay the PBM in order to participate in a preferred network. All PBMs for the Agency’s SMMC program attest they do not collect a DIR from participating pharmacies. However, DIR is very common in Medicare and has recently expanded to commercial plans. PBMs typically assess the pharmacies a DIR either as a flat fee per prescription or as a percentage of average wholesale drug cost. CMS originally designed DIR as a way to offer incentives, however, DIR is now seen as a catch-all, since it has been expanded well beyond CMS’ intended use of its definition.

MILLIMAN REPORT
_______________________________________________________________________________________________________________________
Florida Agency for Health Care Administration Page 27 Pharmacy Benefit Management Pricing Practices in Statewide Medicaid Management Care Program December 1, 2020
VI. METHODOLOGY AND ASSUMPTIONS DATA SOURCES Milliman received de-identified data from the Agency’s 15 managed care plans and plan or PBM contracts for the associated managed care plans for claims incurring between January 1, 2018 and December 31, 2019. We received plan-paid amount (plan paid to PBM) along with pharmacy remittance (PBM paid to pharmacy). We also received the PBM contract for each managed care plan, the PBM reconciliation reports (if available), and documentation of network remuneration fees (if applicable). ANALYSIS PERIOD AND TYPE OF CONTRACTED ARRANAGEMENT We performed a qualitative review of the contracts between the Agency and the managed care plans, including any associated PBM contracts. Table 1 reflects our review of the contracts. Our contract type appeared to be consistent with the information present in the claims data from the plan and the corresponding remittance to the pharmacy. The actual contract type may vary, since the contracts may have included other lines of businesses, Medicaid plans from other states, may have been redacted in the contract, or have changed in an amendment that was not provided. We assigned the claims from the plan to the designated pricing methodology and aligned the claims according to the particular contract period. We used the claims in aggregate to verify if the plan exhibited spread or pass-through pricing. ALIGNMENT OF CLAIMS DATA TO CONTRACT PERIOD PBMs typically provide pricing guarantees with plans by drug type category (generic, brand, specialty) over a specific time period, generally 12 months. We call this the contract performance period and believe to best understand how the underlying claims data paid by the plan to the PBM (and remittance to the pharmacy) perform, you must analyze the claims data that corresponds to this contract performance period. The general concept is, only reviewing a portion of the plan-paid contract period may show that the claims experience over or under perform payments, however, the PBM contracts are typically reconciled annually. Therefore, a complete 12-month plan-paid contractual period is recommended to capture these payment rates to achieve the overall effective discount guaranteed. CLAIMS ANALYSIS AND EXCLUSIONS We received over 79.7 million plan-paid pharmacy claims directly from the Agency based on a data request submitted to all managed care plans that submitted to their respective PBMs. This data included calendar year 2018 and calendar year 2019 plan-paid claims data and pharmacy reimbursement files (remittance) for the Agency’s managed care plans. We validated the data removing reversals and denials to obtain 40.3 million distinct paid claims. We matched paid claims to corresponding pharmacy remittance claims, which resulted in approximately 39.7 million claims. We excluded a list of commonly excluded claims (shown in Table 14) to arrive at a final claims dataset of 22.7 million claims. In the final analysis data, the PBMs received over $2.1 billion from 14 managed care plans for the payment of prescription drugs. Tables 13 and 14 list the detailed claim counts.
TABLE 13: FLORIDA AGENCY FOR HEALTH CARE ADMINISTRATION – SUMMARY OF PHARMACY CLAIMS AND COST DATA FOR STUDY CLAIMS SCRUBBING PLAN CLAIMS PLAN COSTS REMIT CLAIMS REMIT COSTS
Total Claims 79,696,985 $5,177,670,144 74,353,253 $4,864,209,216
Total Distinct Paid Claims 40,297,622 $3,649,940,757 N/A N/A
Paid Distinct Claims Matched to Remit Claim 39,744,234 $3,565,812,176 39,744,234 $3,449,735,230
Exclusions (17,073,300) ($1,427,994,737) (17,073,300) ($1,401,512,687)
Final Analysis Data 22,670,934 $2,137,817,439 22,670,934 $2,048,222,543
Remit claims and costs are N/A in the second row due to the fact we did not separately analyze the remit claims for reversals. We relied on plan-paid claims to determine the final status of the claim and allowed our process to match the remit claims and costs.
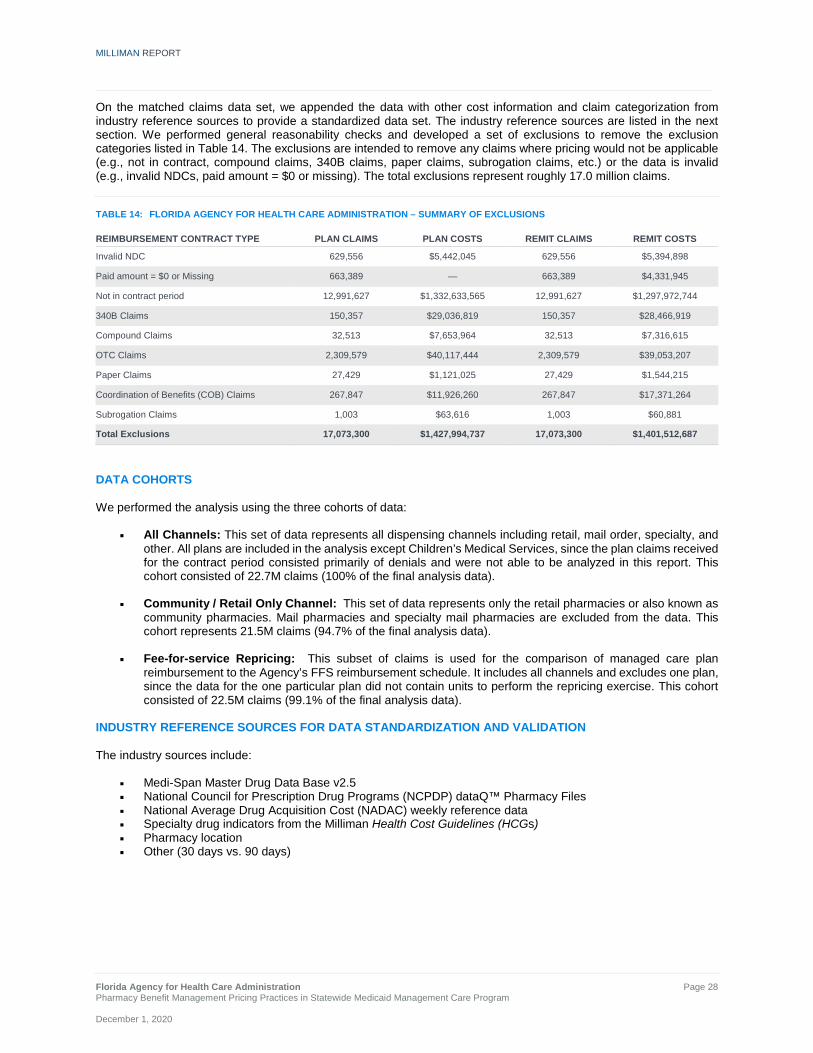
MILLIMAN REPORT
_______________________________________________________________________________________________________________________
Florida Agency for Health Care Administration Page 28 Pharmacy Benefit Management Pricing Practices in Statewide Medicaid Management Care Program December 1, 2020
On the matched claims data set, we appended the data with other cost information and claim categorization from industry reference sources to provide a standardized data set. The industry reference sources are listed in the next section. We performed general reasonability checks and developed a set of exclusions to remove the exclusion categories listed in Table 14. The exclusions are intended to remove any claims where pricing would not be applicable (e.g., not in contract, compound claims, 340B claims, paper claims, subrogation claims, etc.) or the data is invalid (e.g., invalid NDCs, paid amount = $0 or missing). The total exclusions represent roughly 17.0 million claims.
TABLE 14: FLORIDA AGENCY FOR HEALTH CARE ADMINISTRATION – SUMMARY OF EXCLUSIONS REIMBURSEMENT CONTRACT TYPE PLAN CLAIMS PLAN COSTS REMIT CLAIMS REMIT COSTS
Invalid NDC 629,556 $5,442,045 629,556 $5,394,898
Paid amount = $0 or Missing 663,389 — 663,389 $4,331,945
Not in contract period 12,991,627 $1,332,633,565 12,991,627 $1,297,972,744
340B Claims 150,357 $29,036,819 150,357 $28,466,919
Compound Claims 32,513 $7,653,964 32,513 $7,316,615
OTC Claims 2,309,579 $40,117,444 2,309,579 $39,053,207
Paper Claims 27,429 $1,121,025 27,429 $1,544,215
Coordination of Benefits (COB) Claims 267,847 $11,926,260 267,847 $17,371,264
Subrogation Claims 1,003 $63,616 1,003 $60,881
Total Exclusions 17,073,300 $1,427,994,737 17,073,300 $1,401,512,687
DATA COHORTS We performed the analysis using the three cohorts of data:
All Channels: This set of data represents all dispensing channels including retail, mail order, specialty, and other. All plans are included in the analysis except Children’s Medical Services, since the plan claims received for the contract period consisted primarily of denials and were not able to be analyzed in this report. This cohort consisted of 22.7M claims (100% of the final analysis data).
Community / Retail Only Channel: This set of data represents only the retail pharmacies or also known as community pharmacies. Mail pharmacies and specialty mail pharmacies are excluded from the data. This cohort represents 21.5M claims (94.7% of the final analysis data).
Fee-for-service Repricing: This subset of claims is used for the comparison of managed care plan reimbursement to the Agency’s FFS reimbursement schedule. It includes all channels and excludes one plan, since the data for the one particular plan did not contain units to perform the repricing exercise. This cohort consisted of 22.5M claims (99.1% of the final analysis data).
INDUSTRY REFERENCE SOURCES FOR DATA STANDARDIZATION AND VALIDATION The industry sources include:
Medi-Span Master Drug Data Base v2.5 National Council for Prescription Drug Programs (NCPDP) dataQ™ Pharmacy Files National Average Drug Acquisition Cost (NADAC) weekly reference data Specialty drug indicators from the Milliman Health Cost Guidelines (HCGs) Pharmacy location Other (30 days vs. 90 days)

MILLIMAN REPORT
_______________________________________________________________________________________________________________________
Florida Agency for Health Care Administration Page 29 Pharmacy Benefit Management Pricing Practices in Statewide Medicaid Management Care Program December 1, 2020
Information about how we used these sources is provided below. Medi-Span Master Drug Data Base v2.5 We used the NDC provided in the managed care plan claims data to supply the following information:
The 2017, 2018, and 2019 databases were used to determine the missing or invalid NDCs. If an NDC was not available from any of the databases, it was removed as an exclusion from the final study data.
We used the Multi-Source Codes to define the drug type as a brand or generic using the NDC provided on the claim. Any drug with a Multi-Source Code of Y (multi-source product) was defined as a generic. The remainder were defined as brands. When applying the drug type, we applied the Multi-Source Code that was effective at the end of each calendar year. We assumed that the Multi-Source Code remained the same throughout the calendar year.
We appended the AWP and WAC per unit effective on the date of the claim on the final study data. The AWP
and WAC were solely used to compare the managed care plan and FFS reimbursement. NCPDP dataQ™ We used the National Provider ID (NPI) provided in the managed care claims data to supply the following information:
The pharmacy channel type as community / retail, mail order, specialty using the provider type code. The remaining pharmacies were classified as other. Other includes long-term care pharmacies, institutional pharmacies, home infusion pharmacies, institutional pharmacies, compounding pharmacies, and other types of pharmacies.
The pharmacy ownership was defined using the dispenser class code. We used the dispenser class code for chain pharmacies and independent pharmacies. We reclassified franchise pharmacies as independent pharmacies, as these typically belonged to pharmacy services administrative organizations and are typically independently owned. We also defined pharmacies as PBM owned if the pharmacy was owned by the PBM (inclusive of all channel types) and the claim was dispensed by the same PBM. The remaining pharmacies were classified as other. Other includes government pharmacies and alternate dispensing sites.
Pharmacy ZIP code was used for the identification of urban, rural, and super rural pharmacy locations. The ZIP code was then used to map to the pharmacy location in the section titled “Pharmacy Location.”
TABLE 15: FLORIDA AGENCY FOR HEALTH CARE ADMINISTRATION – TOP 20 PHARMACIES BY TOTAL PAID CLAIMS TOTAL CLAIMS: PLANS WITH SPREAD AND PASS-THROUGH PRICING
RANK BY CLAIMS
PHARMACY NAME
PHARMACY CHAIN NAME
PHARMACY CHANNEL TYPE
TOTAL PAID CLAIMS
TOTAL PLAN PAID
TOTAL REMITTANCE TO PHARMACY
1 HOLIDAY CVS LLC CVS HEALTH Community / Retail 10,938,060 $632,828,181 $603,832,088
2 WAL-MART STORES EAST LP
WAL-MART STORES INC Community / Retail 2,440,177 $143,193,364 $133,459,732
3 WALGREEN CO WALGREENS Community / Retail 1,912,847 $143,341,157 $126,656,295
4 PUBLIX SUPER MARKETS INC
PUBLIX SUPER MARKETS INC Community / Retail 1,208,614 $89,789,025 $82,696,476
5 WINN DIXIE STORES INC
WINN DIXIE PHARMACY Community / Retail 530,081 $37,473,392 $35,160,917
6 GENOA HEALTHCARE LLC
MHA LONG TERM CARE NETWORK Other 189,318 $33,638,296 $32,450,708
7 OMNICARE PHARMACY
OF FLORIDA LLC CVS HEALTH Other 174,597 $10,819,573 $11,496,132
8 PHARMACY
CORPORATION OF AMERICA
PHARMERICA Other 101,431 $6,769,570 $6,626,377

MILLIMAN REPORT
_______________________________________________________________________________________________________________________
Florida Agency for Health Care Administration Page 30 Pharmacy Benefit Management Pricing Practices in Statewide Medicaid Management Care Program December 1, 2020
RANK BY CLAIMS
PHARMACY NAME
PHARMACY CHAIN NAME
PHARMACY CHANNEL TYPE
TOTAL PAID CLAIMS
TOTAL PLAN PAID
TOTAL REMITTANCE TO PHARMACY
9 SAMSON MERGER SUB LLC
WINN DIXIE PHARMACY Community / Retail 101,328 $6,020,748 $5,714,409
10 HUMANA PHARMACY INC PRESCRIBEIT RX Community / Retail 86,637 $3,956,258 $3,948,894
11 LTC PHARMA HLDG MHA LONG TERM CARE NETWORK Other 52,317 $2,704,464 $2,479,425
12 PHARMSCRIPT OF FLORIDA LLC
MHA LONG TERM CARE NETWORK Other 50,699 $2,913,129 $2,667,438
13 AIDS HEALTHCARE FOUNDATION
AIDS HEALTHCARE FOUNDATION Specialty Pharmacy 47,396 $31,321,591 $30,907,216
14 RURAL HEALTH
CARE INCORPORATED
RURAL HEALTH CARE INC Community / Retail 43,620 $2,031,575 $1,846,439
15 SAM'S EAST INC WAL-MART STORES INC Community / Retail 42,098 $3,239,934 $3,084,254
16 TAMPA FAMILY
HEALTH CENTERS INC
TAMPA FAMILY HEALTH CENTERS Other 42,036 $1,982,493 $1,895,637
17 PAXON
PRESCRIPTION CENTER INC
HEALTH MART ATLAS Community / Retail 39,059 $2,906,928 $2,552,129
18 SUNRISE
PHARMACY OF KISSIMMEE LLC
CARDINAL HEALTH Community / Retail 38,610 $4,869,169 $4,774,045
19 MCR HEALTH INC MCR HEALTH INC Community / Retail 35,765 $2,230,456 $2,152,725
20 RX EXPRESS
PHARMACY OF MILTON INC
ELEVATE PROVIDER NETWORK Community / Retail 33,234 $2,298,111 $2,215,736
All Other 4,563,010 $973,490,026 $951,605,472
Total 22,670,934 $2,137,817,439 $2,048,222,543
NADAC weekly reference data The NADAC is supplied on weekly basis available on https://data.medicaid.gov. The NDC was used to identify the NADAC per unit on the effective date and was used to calculate the NADAC cost on the date in which the MCO claim was incurred. OTHER DATA SOURCES Usual and Customary Cost (U&C) The Agency provided the U&C for the top 300 NDCs. The U&C is defined as the average charge to all other customers in any quarter for the same drug, quantity, and strength. The U&C was provided by calendar year by NDC on a per-claim basis. Since the U&C was not provided at the unit or pharmacy level, we used the average units reimbursed per prescription across all plans to develop an average U&C cost per unit and calculated an estimated U&C cost for the MCO claim based on the units submitted on the claim. Of the received U&Cs, our methodology assumes that the U&C is consistent across all pharmacies. We were able to identify a U&C on 47.17% of the claims. State Maximum Allowable Cost (SMAC) The Agency provided the SMAC. The SMAC is defined as the maximum allowable unit cost established by the Agency. The SMAC was provided on a weekly basis from 2018 to 2019. The SMAC included a generic drug name, strength, dosage form, and SMAC price per unit. Since the NDC was not provided for the SMAC list, we used the United Medical Language System (UMLS) nomenclature to match the drug name, strength, and dosage form to a RxNorm concept unique identifier (RXCUI). RXCUI is produced by The National Library of Medicine and serves as a unique identifier,

MILLIMAN REPORT
_______________________________________________________________________________________________________________________
Florida Agency for Health Care Administration Page 31 Pharmacy Benefit Management Pricing Practices in Statewide Medicaid Management Care Program December 1, 2020
which can represent multiple NDCs for similar drug products with the same brand name, active ingredient, strength, and dose form. We were able to identify a SMAC on 45.31% claims. Specialty drug indicators from the Milliman HCG There is no standard definition for a specialty medication. Therefore, we utilized the specialty definition from the Milliman HCGs. The specialty drug list is developed from a comprehensive review on each drug to determine the specialty classification. Multiple criteria, such as cost, biologic structure, route of administration, specific handling and storage requirements, indication for rare and orphan disease, special dosing or monitoring, requirement of a Risk Evaluation and Mitigation Strategy (REMS), limited drug distribution, and other information is used to determine the specialty classification. Drugs, such as those used to treat HIV and transplants are not classified as specialty in this study. Pharmacy Location We used the NCPDP files to provide the pharmacy ZIP code. If the pharmacy ZIP code was not available, the pharmacy location was labeled as null. We mapped the pharmacy ZIP code to the geographical categorization using the ZIP Code to Carrier Locality File available from cms.gov to label the pharmacy location as urban, rural, or super rural. Super Rural is defined by CMS and includes all OMB-defined Non-Metropolitan Counties and selected ZIP code areas of Metropolitan Counties and is calculated to be the 25th percentile of the areas with the lowest densities.17 Other The days supply (30 vs. 90) was defined using the claims data supplied by the managed care plan. We defined any prescriptions > 83 days as 90-day prescriptions. FEE-FOR-SERVICE COST DEVELOPMENT The Agency program reimbursement methodology as defined in 59G-4.251 for drugs under the FFS delivery system is not to exceed the lesser of:
1. The Actual Acquisition Cost (AAC) plus a PDF of $10.24. For the AAC, the NADAC will be used for the AAC,
when available. 2. The wholesale acquisition cost (WAC) plus a PDF of $10.24. 3. The SMAC plus a PDF of $10.24. 4. The provider’s U&C charge.
We calculated the cost for the above metrics and applied the lesser of as the FFS cost. Our analysis is limited to the claims we were able to identify a NADAC, SMAC, U&C, or WAC using the pricing formula outlined in the section State drug cost information from the Agency.
TABLE 16: FLORIDA AGENCY FOR HEALTH CARE ADMINISTRATION – AVAILABILITY FOR FFS METRICS (ALL CHANNELS) PLANS WITH SPREAD AND PASS-THROUGH EXCLUDING COMMUNITY CARE PLAN
CONTRACT TYPE TOTAL CLAIMS NADAC SMAC U&C WAC
Plans with Spread 10,170,314 95.2% 46.4% 40.2% 100.00%
Plans with Pass-through 12,296,041 94.9% 44.4% 47.5% 100.00%
Total 22,466,355 95.0% 45.3% 44.2% 100.00%
With dispensing fees and using lesser-of-logic as stated in the FFS reimbursement formula:
TABLE 17: FLORIDA AGENCY FOR HEALTH CARE ADMINISTRATION – METRICS APPLIED AS FFS (ALL CHANNELS) PLANS WITH SPREAD AND PASS-THROUGH EXCLUDING COMMUNITY CARE PLAN
CONTRACT TYPE TOTAL CLAIMS NADAC SMAC U&C WAC
Plans with Spread 10,170,314 79.0% 16.1% 2.1% 2.8%
Plans with Pass-through 12,296,041 78.6% 15.7% 2.8% 2.8%
Total 22,466,355 78.8% 15.9% 2.5% 2.8%
17 https://ruralhealth.und.edu/pdf/frontierreview.pdf [accessed August 19,2020]

MILLIMAN REPORT
_______________________________________________________________________________________________________________________
Florida Agency for Health Care Administration Page 32 Pharmacy Benefit Management Pricing Practices in Statewide Medicaid Management Care Program December 1, 2020
VII. GLOSSARY AND DEFINITIONS
TERM DEFINITION
Actual Acquisition Cost (AAC) The invoice cost that pharmacies use to acquire Medicaid outpatient prescription drugs.
Administrative (Admin) Fee An administrative fee that PBMs typically charge to the managed care plan to administer the pharmacy benefit in lieu of spread. The administrative fee is typically collected on pass-through pricing contracts.
Average Wholesale Price (AWP)
A list price that intended to represent the price that is paid by retailers to purchase the drug from the wholesaler. The AWP does not represent an average of wholesale prices from any group of transactions in the marketplace and a wholesaler may agree to sell its products to one or more of its customers at a lower price through the use of any number of methods, such as discounts or rebates.
Brand Drug Any drug that is not defined as a generic.
Chain Pharmacy Pharmacy ownership was defined using the class dispenser code from NCPCP dataQ. Pharmacies typically have other locations and belong to one NCPDP chain code.
Community / Retail Pharmacy Typically brick-and-mortar pharmacies where patients or caregivers are physically present to fill prescriptions.
Contracted Pricing Arrangement Defined as the reimbursement between the payer and the PBM. The options include spread pricing, pass-through pricing, or fee-for-service pricing.
Direct and Indirect Remuneration (DIR) Fee
Price concessions that are paid to the plan by the pharmacy after the point-of-sale. DIR is not specific to only pharmacy networks and can include discounts, chargebacks or rebates, cash discounts, free goods contingent on a purchase agreement, upfront payments, coupons, goods in kind, free or reduced-price services, grants, or other price concessions or similar benefits from manufacturers, pharmacies, or similar entities.18
Drug Mix The combination of drugs including retail / mail, generic / brand, and specialty / non-specialty. The drug mix can be further split out by drugs that have high average wholesale prices, low paid costs, and other numerous factors.
Fee-For-Service Pricing The contracted pricing arrangement in which the PBM reimburses the pharmacy the same amount the PBM is reimbursed from the managed care plan. The reimbursement amount is determined using a designated state formula.
Generic Drug Any drug with a Multi-Source Code of Y (multi-source product) was defined as a generic.
Independent Pharmacy Pharmacy ownership was defined using the class dispenser code from NCPDP dataQ. Includes pharmacies that were considered franchise pharmacies and are usually independently owned.
Mail Order Pharmacy Typically pharmacies that fill prescriptions through mail, a common carrier, or a delivery service.
Managed Care Plan The health plan that reimburses for the cost of utilizing healthcare services or products for Florida’s Statewide Medicaid Managed Care Program.
18 42 CFR § 423.308. Retrieved September 10, 2020, from: https://www.govinfo.gov/content/pkg/CFR-2011-title42-vol3/pdf/CFR-2011-title42-vol3-sec423-308.pdf
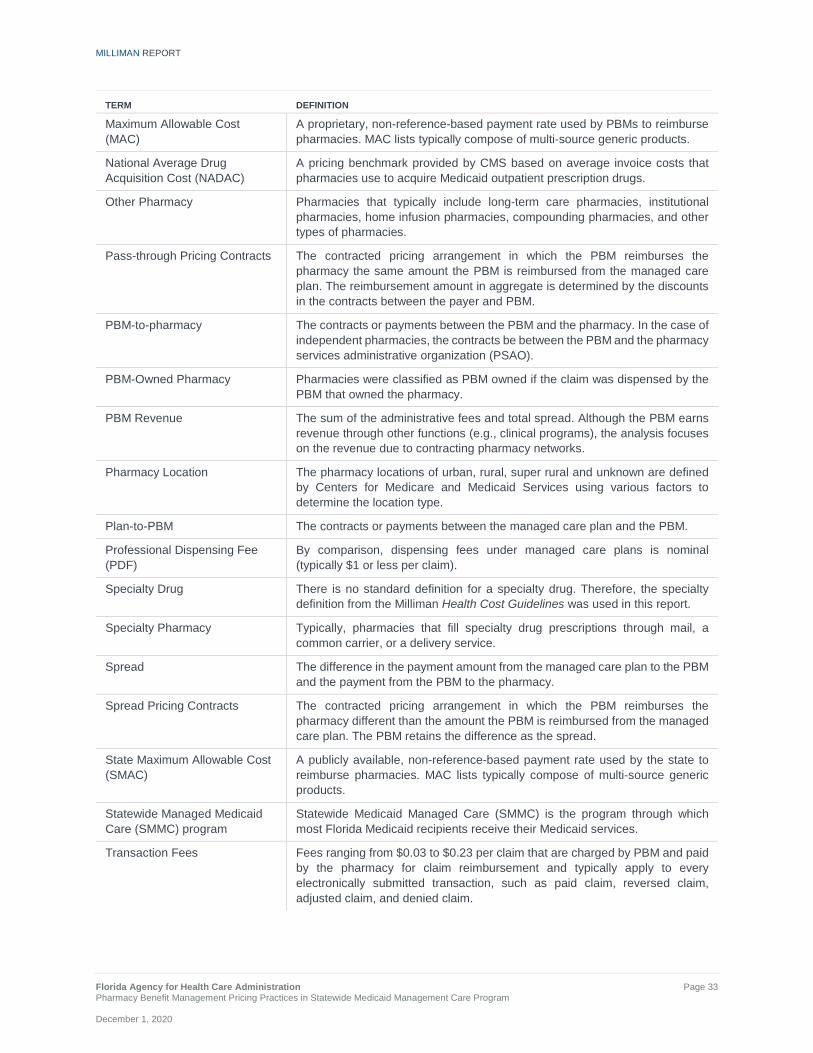
MILLIMAN REPORT
_______________________________________________________________________________________________________________________
Florida Agency for Health Care Administration Page 33 Pharmacy Benefit Management Pricing Practices in Statewide Medicaid Management Care Program December 1, 2020
TERM DEFINITION
Maximum Allowable Cost (MAC)
A proprietary, non-reference-based payment rate used by PBMs to reimburse pharmacies. MAC lists typically compose of multi-source generic products.
National Average Drug Acquisition Cost (NADAC)
A pricing benchmark provided by CMS based on average invoice costs that pharmacies use to acquire Medicaid outpatient prescription drugs.
Other Pharmacy Pharmacies that typically include long-term care pharmacies, institutional pharmacies, home infusion pharmacies, compounding pharmacies, and other types of pharmacies.
Pass-through Pricing Contracts The contracted pricing arrangement in which the PBM reimburses the pharmacy the same amount the PBM is reimbursed from the managed care plan. The reimbursement amount in aggregate is determined by the discounts in the contracts between the payer and PBM.
PBM-to-pharmacy The contracts or payments between the PBM and the pharmacy. In the case of independent pharmacies, the contracts be between the PBM and the pharmacy services administrative organization (PSAO).
PBM-Owned Pharmacy Pharmacies were classified as PBM owned if the claim was dispensed by the PBM that owned the pharmacy.
PBM Revenue The sum of the administrative fees and total spread. Although the PBM earns revenue through other functions (e.g., clinical programs), the analysis focuses on the revenue due to contracting pharmacy networks.
Pharmacy Location The pharmacy locations of urban, rural, super rural and unknown are defined by Centers for Medicare and Medicaid Services using various factors to determine the location type.
Plan-to-PBM The contracts or payments between the managed care plan and the PBM.
Professional Dispensing Fee (PDF)
By comparison, dispensing fees under managed care plans is nominal (typically $1 or less per claim).
Specialty Drug There is no standard definition for a specialty drug. Therefore, the specialty definition from the Milliman Health Cost Guidelines was used in this report.
Specialty Pharmacy Typically, pharmacies that fill specialty drug prescriptions through mail, a common carrier, or a delivery service.
Spread The difference in the payment amount from the managed care plan to the PBM and the payment from the PBM to the pharmacy.
Spread Pricing Contracts The contracted pricing arrangement in which the PBM reimburses the pharmacy different than the amount the PBM is reimbursed from the managed care plan. The PBM retains the difference as the spread.
State Maximum Allowable Cost (SMAC)
A publicly available, non-reference-based payment rate used by the state to reimburse pharmacies. MAC lists typically compose of multi-source generic products.
Statewide Managed Medicaid Care (SMMC) program
Statewide Medicaid Managed Care (SMMC) is the program through which most Florida Medicaid recipients receive their Medicaid services.
Transaction Fees Fees ranging from $0.03 to $0.23 per claim that are charged by PBM and paid by the pharmacy for claim reimbursement and typically apply to every electronically submitted transaction, such as paid claim, reversed claim, adjusted claim, and denied claim.

MILLIMAN REPORT
_______________________________________________________________________________________________________________________
Florida Agency for Health Care Administration Page 34 Pharmacy Benefit Management Pricing Practices in Statewide Medicaid Management Care Program December 1, 2020
VII. CAVEATS AND LIMITATIONS In preparing our results, we relied upon information available from various sources including: plan-paid claims and pharmacy remittance claims, PBM contracts, and reconciliation reports from all managed care plans, as provided by their respective PBMs. Public and internal resources including: Medi-Span Master Drug Data Base (MDDB) v2.5, National Council for Prescription Drug Programs (NCPDP) dataQ™ Pharmacy Files, National Average Drug Acquisition Cost (NADAC) weekly reference data, ZIP Code to Carrier Locality File, and Specialty indicator from Milliman’s HCGs. The Agency provided to Milliman State Maximum Allowable Cost (SMAC) files, and Usual and Customary (U&C) files. We did not audit or independently verify any of the information furnished, except that we did review the data for reasonableness and consistency. To the extent that any of the data or other information relied on was incorrect or inaccurate; the results of our analysis could be materially affected. Actual results will vary from estimates due to multiple variables. These variables include, but are not limited to: changes in drug mix, pharmacy network mix, and population changes. Any State mandate that changes contractual requirements between plans and PBMs, plan change of PBM vendors, or plan selection of different contract types (i.e., moving from spread to pass-through) may change program costs in a different manner than illustrated within this report. This report was provided to the Agency and is intended to explain the cost differences associated with various types of PBM pricing methodologies including: spread, pass-through, and the Agency’s FFS fee schedule. This work is not intended to be used for other purposes or to benefit any other party. Subject to applicable public records law(s), this report is intended for internal use only and may not be provided to third parties without our prior written consent. If consent is given, this report must be provided in its entirety. Regardless of consent, it is not our intent to benefit or create a legal liability to outside parties. The terms of Milliman’s contract with the Agency effective October 22, 2014, apply to this report and its use.

MILLIMAN REPORT
_______________________________________________________________________________________________________________________
Florida Agency for Health Care Administration A - 1 Pharmacy Benefit Management Pricing Practices in Statewide Medicaid Management Care Program December 1, 2020
APPENDIX - Additional Results
TABLE 4.1: FLORIDA AGENCY FOR HEALTH CARE ADMINISTRATION – CURRENT VS. FFS COSTS WITHOUT ADMINISTRATIVE FEES BY PHARMACY OWNERSHIP PER $100 OF AWP (RETAIL ONLY) PLANS WITH SPREAD AND PASS-THROUGH PRICING
PLANS WITH SPREAD PRICING PLANS WITH
PASS-THROUGH PRICING TOTAL
DRUG TYPE PHARMACY OWNERSHIP
CURRENT PLAN PAID
CURRENT PHARMACY
REIMBURSEMENT FFS
COST
CURRENT PLAN PAID
CURRENT PHARMACY
REIMBURSEMENT FFS
COST
CURRENT PLAN PAID
CURRENT PHARMACY
REIMBURSEMENT FFS
COST
Brand, non-specialty Independent $83 $81 $81 $80 $80 $81 $81 $80 $81
Brand, non-specialty Chain $84 $79 $82 $79 $79 $81 $81 $79 $81
Brand, non-specialty PBM Owned $75 $74 $81 $80 $80 $81 $79 $78 $81
Brand, non-specialty Other $80 $78 $82 $78 $78 $81 $79 $78 $81
Generic, non-specialty Independent $18 $10 $17 $18 $18 $19 $18 $15 $18
Generic, non-specialty Chain $20 $12 $20 $16 $16 $22 $18 $14 $21
Generic, non-specialty PBM Owned $17 $12 $22 $10 $10 $22 $13 $11 $22
Generic, non-specialty Other $17 $9 $17 $18 $18 $23 $17 $13 $20
Brand, specialty Independent $83 $82 $82 $79 $79 $81 $80 $80 $81
Brand, specialty Chain $83 $80 $82 $80 $80 $81 $81 $80 $81
Brand, specialty PBM Owned $83 $83 $82 $81 $81 $83 $82 $82 $82
Brand, specialty Other $83 $82 $83 $80 $80 $83 $82 $81 $83
Generic, specialty Independent $35 $17 $18 $35 $34 $14 $35 $28 $15
Generic, specialty Chain $29 $17 $16 $24 $24 $16 $26 $21 $16
Generic, specialty PBM Owned $32 $32 $21 $31 $30 $23 $31 $31 $22
Generic, specialty Other $46 $29 $39 $42 $42 $34 $43 $36 $36
Brand, non-specialty Total $82 $79 $81 $80 $80 $81 $81 $79 $81
Generic, non-specialty Total $19 $12 $20 $15 $15 $21 $17 $13 $21
Brand, specialty Total $83 $82 $82 $80 $80 $82 $81 $80 $82
Generic, specialty Total $31 $21 $18 $29 $28 $17 $30 $25 $18
Total Independent $45 $40 $44 $49 $49 $50 $48 $45 $47
Total Chain $44 $38 $43 $44 $44 $48 $44 $41 $46
Total PBM Owned $45 $42 $50 $41 $41 $47 $42 $41 $48
Total Other $51 $47 $52 $57 $57 $60 $54 $51 $56

MILLIMAN REPORT
_______________________________________________________________________________________________________________________
Florida Agency for Health Care Administration A - 2 Pharmacy Benefit Management Pricing Practices in Statewide Medicaid Management Care Program December 1, 2020
TABLE 4.2: FLORIDA AGENCY FOR HEALTH CARE ADMINISTRATION – PHARMACY COSTS DISCOUNTS WITHOUT ADMINISTRATIVE FEES BY PHARMACY OWNERSHIP PER $100 OF AWP (RETAIL ONLY) PLANS WITH SPREAD AND PASS-THROUGH PRICING
PLANS WITH SPREAD PRICING PLANS WITH
PASS-THROUGH PRICING TOTAL
DRUG TYPE PHARMACY OWNERSHIP
CURRENT PLAN PAID
CURRENT PHARMACY
REIMBURSEMENT FFS
COST
CURRENT PLAN PAID
CURRENT PHARMACY
REIMBURSEMENT FFS
COST
CURRENT PLAN PAID
CURRENT PHARMACY
REIMBURSEMENT FFS
COST
Brand, non-specialty Independent 17% 19% 19% 20% 20% 19% 19% 20% 19%
Brand, non-specialty Chain 16% 21% 18% 21% 21% 19% 19% 21% 19%
Brand, non-specialty PBM Owned 25% 26% 19% 20% 20% 19% 21% 22% 19%
Brand, non-specialty Other 20% 22% 18% 22% 22% 19% 21% 22% 19%
Generic, non-specialty Independent 82% 90% 83% 82% 82% 81% 82% 85% 82%
Generic, non-specialty Chain 80% 88% 80% 84% 84% 78% 82% 86% 79%
Generic, non-specialty PBM Owned 83% 88% 78% 90% 90% 78% 87% 89% 78%
Generic, non-specialty Other 83% 91% 83% 82% 82% 77% 83% 87% 80%
Brand, specialty Independent 17% 18% 18% 21% 21% 19% 20% 20% 19%
Brand, specialty Chain 17% 20% 18% 20% 20% 19% 19% 20% 19%
Brand, specialty PBM Owned 17% 17% 18% 19% 19% 17% 18% 18% 18%
Brand, specialty Other 17% 18% 17% 20% 20% 17% 18% 19% 17%
Generic, specialty Independent 65% 83% 82% 65% 66% 86% 65% 72% 85%
Generic, specialty Chain 71% 83% 84% 76% 76% 84% 74% 79% 84%
Generic, specialty PBM Owned 68% 68% 79% 69% 70% 77% 69% 69% 78%
Generic, specialty Other 54% 71% 61% 58% 58% 66% 57% 64% 64%
Brand, non-specialty Total 18% 21% 19% 20% 20% 19% 19% 21% 19%
Generic, non-specialty Total 81% 88% 80% 85% 85% 79% 83% 87% 79%
Brand, specialty Total 17% 18% 18% 20% 20% 18% 19% 20% 18%
Generic, specialty Total 69% 79% 82% 71% 72% 83% 70% 75% 82%
Total Independent 55% 60% 56% 51% 51% 50% 52% 55% 53%
Total Chain 56% 62% 57% 56% 56% 52% 56% 59% 54%
Total PBM Owned 55% 58% 50% 59% 59% 53% 58% 59% 52%
Total Other 49% 53% 48% 43% 43% 40% 46% 49% 44%

MILLIMAN REPORT
_______________________________________________________________________________________________________________________
Florida Agency for Health Care Administration A - 3 Pharmacy Benefit Management Pricing Practices in Statewide Medicaid Management Care Program December 1, 2020
TABLE 4.3: FLORIDA AGENCY FOR HEALTH CARE ADMINISTRATION – PHARMACY COSTS PER CLAIM WITHOUT ADMINISTRATIVE FEES (RETAIL ONLY) PLANS WITH SPREAD AND PASS-THROUGH PRICING
PLANS WITH SPREAD PRICING PLANS WITH
PASS-THROUGH PRICING TOTAL
DRUG TYPE PHARMACY OWNERSHIP
CURRENT PLAN PAID
CURRENT PHARMACY
REIMBURSEMENT FFS
COST
CURRENT PLAN PAID
CURRENT PHARMACY
REIMBURSEMENT FFS
COST
CURRENT PLAN PAID
CURRENT PHARMACY
REIMBURSEMENT FFS
COST
Brand, non-specialty Independent $332 $325 $325 $326 $326 $329 $329 $326 $327
Brand, non-specialty Chain $273 $259 $266 $269 $269 $274 $271 $264 $270
Brand, non-specialty PBM Owned $234 $228 $252 $256 $256 $258 $248 $246 $256
Brand, non-specialty Other $347 $340 $353 $267 $267 $277 $304 $301 $312
Generic, non-specialty Independent $24 $13 $23 $23 $23 $24 $23 $18 $23
Generic, non-specialty Chain $22 $13 $22 $16 $16 $22 $19 $15 $22
Generic, non-specialty PBM Owned $16 $12 $21 $11 $11 $23 $13 $11 $22
Generic, non-specialty Other $21 $11 $23 $21 $21 $26 $21 $15 $24
Brand, specialty Independent $2,069 $2,042 $2,036 $2,121 $2,120 $2,176 $2,105 $2,095 $2,132
Brand, specialty Chain $2,509 $2,407 $2,467 $2,369 $2,368 $2,413 $2,407 $2,379 $2,428
Brand, specialty PBM Owned $4,422 $4,427 $4,412 $3,532 $3,532 $3,619 $3,939 $3,941 $3,982
Brand, specialty Other $2,924 $2,879 $2,935 $3,107 $3,107 $3,221 $3,011 $2,988 $3,071
Generic, specialty Independent $187 $94 $94 $203 $202 $79 $196 $155 $86
Generic, specialty Chain $130 $76 $71 $116 $115 $76 $123 $97 $74
Generic, specialty PBM Owned $171 $171 $112 $164 $157 $119 $167 $163 $116
Generic, specialty Other $153 $97 $128 $179 $179 $148 $166 $139 $138
Brand, non-specialty Total $275 $264 $274 $275 $275 $279 $275 $270 $277
Generic, non-specialty Total $21 $13 $22 $16 $16 $22 $18 $14 $22
Brand, specialty Total $2,809 $2,763 $2,779 $2,439 $2,438 $2,494 $2,559 $2,543 $2,586
Generic, specialty Total $150 $101 $86 $146 $144 $89 $148 $125 $88
Total Independent Pharmacy $87 $77 $85 $104 $104 $105 $96 $92 $96
Total Chain Pharmacy $66 $56 $65 $70 $70 $76 $68 $63 $71
Total PBM Owned $70 $65 $76 $63 $63 $73 $66 $64 $75
Total Other $122 $110 $123 $139 $139 $147 $129 $123 $134
TABLE 5.1: FLORIDA AGENCY FOR HEALTH CARE ADMINISTRATION – SUMMARY OF ANNUAL PHARMACY CLAIMS AND COST BY REIMBURSEMENT CONTRACT TYPE (ALL CHANNELS) PLANS WITH SPREAD PRICING
DRUG TYPE TOTAL PAID
CLAIMS
TOTAL PLAN PAID
PLAN PAID PER
CLAIM
TOTAL REMITTANCE
TO PHARMACY
REMITTANCE TO
PHARMACY PAID PER CLAIM
TOTAL SPREAD
SPREAD PER PAID
CLAIM
SPREAD AS A PERCENT OF TOTAL PLAN
PAID
Brand non-specialty 1,502,514 $423,701,802 $282.00 $407,856,274 $271.45 $15,845,528 $10.55 3.7%
Brand, specialty 85,215 $327,750,952 $3,846.17 $325,744,072 $3,822.61 $2,006,880 $23.55 0.6%
Generic, non-specialty 8,747,297 $184,970,954 $21.15 $115,525,245 $13.21 $69,445,709 $7.94 37.5%
Generic specialty 39,855 $9,732,562 $244.20 $7,418,606 $186.14 $2,313,955 $58.06 23.8%
Total 10,374,881 $946,156,270 $91.20 $856,544,198 $82.56 $89,612,072 $8.64 9.5%

MILLIMAN REPORT
_______________________________________________________________________________________________________________________
Florida Agency for Health Care Administration A - 4 Pharmacy Benefit Management Pricing Practices in Statewide Medicaid Management Care Program December 1, 2020
TABLE 5.2: FLORIDA AGENCY FOR HEALTH CARE ADMINISTRATION – SUMMARY OF ANNUAL PHARMACY CLAIMS AND COST BY REIMBURSEMENT CONTRACT TYPE (ALL CHANNELS) PLANS WITH PASS-THROUGH PRICING
DRUG TYPE TOTAL PAID
CLAIMS
TOTAL PLAN PAID
PLAN PAID PER
CLAIM
TOTAL REMITTANCE
TO PHARMACY
REMITTANCE TO
PHARMACY PAID PER CLAIM
TOTAL SPREAD
SPREAD PER PAID
CLAIM
SPREAD AS A PERCENT OF TOTAL PLAN
PAID
Brand, non-specialty 1,881,971 $524,843,755 $278.88 $524,738,212 $278.82 $105,544 $0.06 0.0%
Brand, specialty 144,661 $493,685,752 $3,412.71 $493,596,408 $3,412.09 $89,345 $0.62 0.0%
Generic, non-specialty 10,222,724 $162,278,756 $15.87 $162,633,646 $15.91 ($354,889) ($0.03) -0.2%
Generic, specialty 46,697 $10,852,905 $232.41 $10,710,080 $229.35 $142,825 $3.06 1.3%
Total 12,296,053 $1,191,661,169 $96.91 $1,191,678,345 $96.92 ($17,176) ($0.00) 0.0%
TABLE 6.1: FLORIDA AGENCY FOR HEALTH CARE ADMINISTRATION – SUMMARY OF ANNUAL PHARMACY CLAIMS AND COST BY PHARMACY CHANNEL TYPE PLANS WITH SPREAD PRICING
PHARMACY CHANNEL TYPE
TOTAL PAID CLAIMS
TOTAL PLAN PAID
TOTAL REMITTANCE TO
PHARMACY TOTAL
SPREAD SPREAD PER PAID CLAIM
SPREAD AS A PERCENT OF
TOTAL PLAN PAID
Community / Retail 9,701,292 $691,595,335 $606,514,212 $85,081,124 $8.77 12.3%
Mail Order 1,940 $431,445 $430,451 $994 $0.51 0.2%
Specialty 62,879 $203,477,883 $202,385,325 $1,092,558 $17.38 0.5%
Other 608,770 $50,651,607 $47,214,211 $3,437,396 $5.65 6.8%
Total 10,374,881 $946,156,270 $856,544,198 $89,612,072 $8.64 9.5%
TABLE 6.2: FLORIDA AGENCY FOR HEALTH CARE ADMINISTRATION – SUMMARY OF ANNUAL PHARMACY CLAIMS AND COST BY PHARMACY CHANNEL TYPE PLANS WITH PASS-THROUGH PRICING
PHARMACY CHANNEL TYPE
TOTAL PAID CLAIMS
TOTAL PLAN PAID
TOTAL REMITTANCE TO
PHARMACY TOTAL
SPREAD SPREAD PER PAID CLAIM
SPREAD AS A PERCENT OF
TOTAL PLAN PAID
Community / Retail 11,759,077 $871,073,704 $871,157,369 ($83,664) ($0.01) 0.0%
Mail Order 7,212 $720,492 $720,492 $0 $0.00 0.0%
Specialty 85,587 $277,828,593 $277,771,694 $56,899 $0.66 0.0%
Other 444,177 $42,038,380 $42,028,790 $9,590 $0.02 0.0%
Total 12,296,053 $1,191,661,169 $1,191,678,345 ($17,176) ($0.00) 0.0%
TABLE 7.1: FLORIDA AGENCY FOR HEALTH CARE ADMINISTRATION – SUMMARY OF ANNUAL PHARMACY CLAIMS AND COST BY PHARMACY OWNERSHIP TYPE PLANS WITH SPREAD PRICING RETAIL CHANNEL ONLY
PHARMACY OWNERSHIP TYPE
TOTAL PAID CLAIMS
TOTAL PLAN PAID
TOTAL REMITTANCE TO
PHARMACY TOTAL
SPREAD SPREAD PER PAID CLAIM
SPREAD AS A PERCENT OF
TOTAL PLAN PAID
Chain 5,847,250 $386,987,210 $329,796,431 $57,190,779 $9.78 14.8%
Independent 1,720,685 $152,335,673 $134,875,816 $17,459,857 $10.15 11.5%
PBM Owned 2,072,064 $144,219,118 $134,465,700 $9,753,418 $4.71 6.8%
Other 61,293 $8,053,335 $7,376,265 $677,070 $11.05 8.4%
TOTAL 9,701,292 $691,595,335 $606,514,212 $85,081,124 $8.77 12.3%
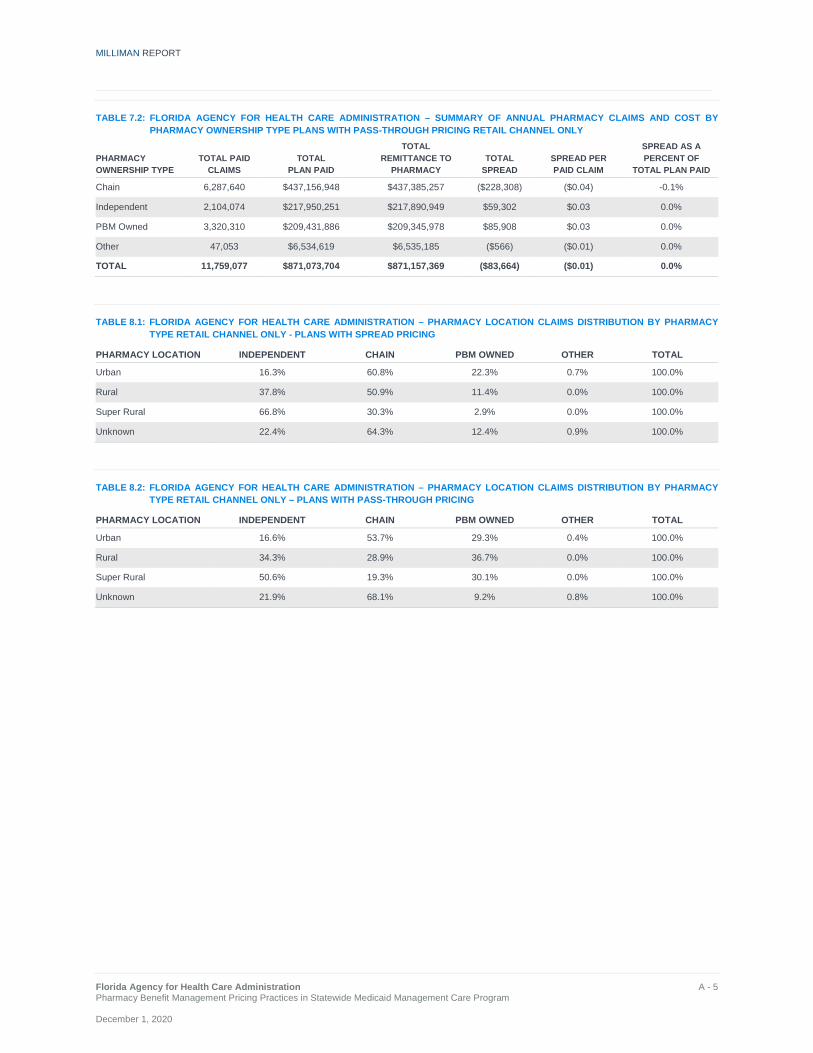
MILLIMAN REPORT
_______________________________________________________________________________________________________________________
Florida Agency for Health Care Administration A - 5 Pharmacy Benefit Management Pricing Practices in Statewide Medicaid Management Care Program December 1, 2020
TABLE 7.2: FLORIDA AGENCY FOR HEALTH CARE ADMINISTRATION – SUMMARY OF ANNUAL PHARMACY CLAIMS AND COST BY PHARMACY OWNERSHIP TYPE PLANS WITH PASS-THROUGH PRICING RETAIL CHANNEL ONLY
PHARMACY OWNERSHIP TYPE
TOTAL PAID CLAIMS
TOTAL PLAN PAID
TOTAL REMITTANCE TO
PHARMACY TOTAL
SPREAD SPREAD PER PAID CLAIM
SPREAD AS A PERCENT OF
TOTAL PLAN PAID
Chain 6,287,640 $437,156,948 $437,385,257 ($228,308) ($0.04) -0.1%
Independent 2,104,074 $217,950,251 $217,890,949 $59,302 $0.03 0.0%
PBM Owned 3,320,310 $209,431,886 $209,345,978 $85,908 $0.03 0.0%
Other 47,053 $6,534,619 $6,535,185 ($566) ($0.01) 0.0%
TOTAL 11,759,077 $871,073,704 $871,157,369 ($83,664) ($0.01) 0.0%
TABLE 8.1: FLORIDA AGENCY FOR HEALTH CARE ADMINISTRATION – PHARMACY LOCATION CLAIMS DISTRIBUTION BY PHARMACY TYPE RETAIL CHANNEL ONLY - PLANS WITH SPREAD PRICING
PHARMACY LOCATION INDEPENDENT CHAIN PBM OWNED OTHER TOTAL
Urban 16.3% 60.8% 22.3% 0.7% 100.0%
Rural 37.8% 50.9% 11.4% 0.0% 100.0%
Super Rural 66.8% 30.3% 2.9% 0.0% 100.0%
Unknown 22.4% 64.3% 12.4% 0.9% 100.0%
TABLE 8.2: FLORIDA AGENCY FOR HEALTH CARE ADMINISTRATION – PHARMACY LOCATION CLAIMS DISTRIBUTION BY PHARMACY TYPE RETAIL CHANNEL ONLY – PLANS WITH PASS-THROUGH PRICING
PHARMACY LOCATION INDEPENDENT CHAIN PBM OWNED OTHER TOTAL
Urban 16.6% 53.7% 29.3% 0.4% 100.0%
Rural 34.3% 28.9% 36.7% 0.0% 100.0%
Super Rural 50.6% 19.3% 30.1% 0.0% 100.0%
Unknown 21.9% 68.1% 9.2% 0.8% 100.0%
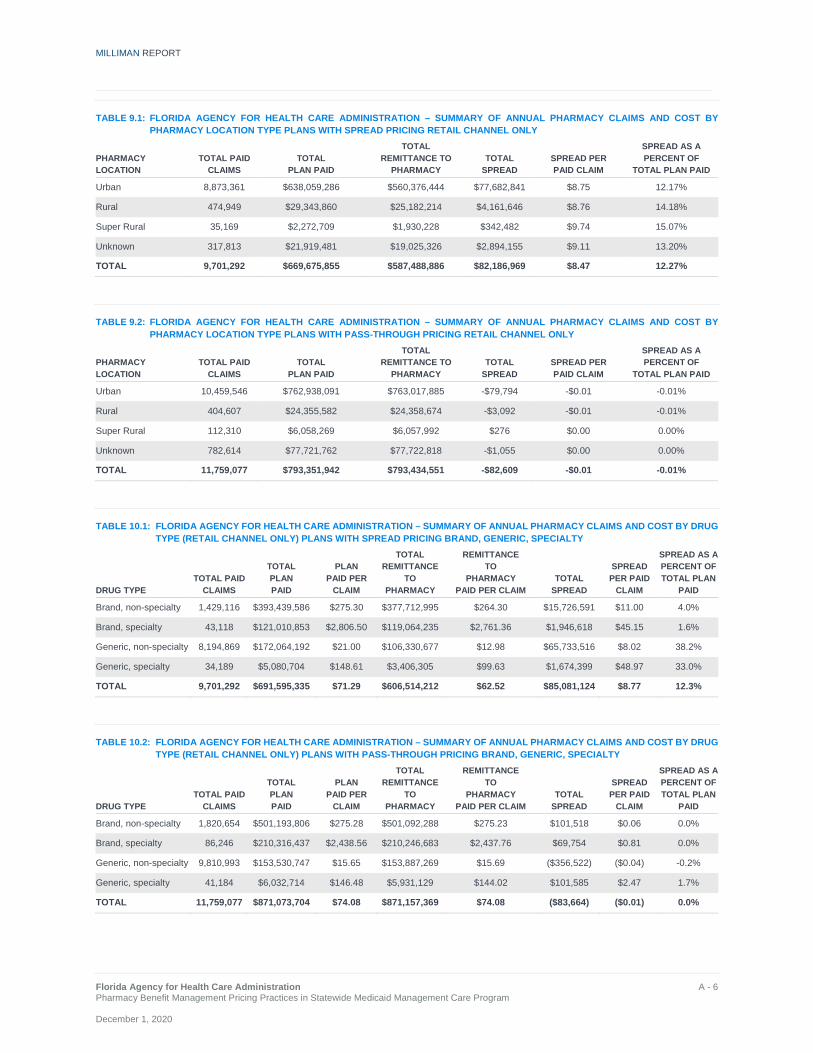
MILLIMAN REPORT
_______________________________________________________________________________________________________________________
Florida Agency for Health Care Administration A - 6 Pharmacy Benefit Management Pricing Practices in Statewide Medicaid Management Care Program December 1, 2020
TABLE 9.1: FLORIDA AGENCY FOR HEALTH CARE ADMINISTRATION – SUMMARY OF ANNUAL PHARMACY CLAIMS AND COST BY PHARMACY LOCATION TYPE PLANS WITH SPREAD PRICING RETAIL CHANNEL ONLY
PHARMACY LOCATION
TOTAL PAID CLAIMS
TOTAL PLAN PAID
TOTAL REMITTANCE TO
PHARMACY TOTAL
SPREAD SPREAD PER PAID CLAIM
SPREAD AS A PERCENT OF
TOTAL PLAN PAID
Urban 8,873,361 $638,059,286 $560,376,444 $77,682,841 $8.75 12.17%
Rural 474,949 $29,343,860 $25,182,214 $4,161,646 $8.76 14.18%
Super Rural 35,169 $2,272,709 $1,930,228 $342,482 $9.74 15.07%
Unknown 317,813 $21,919,481 $19,025,326 $2,894,155 $9.11 13.20%
TOTAL 9,701,292 $669,675,855 $587,488,886 $82,186,969 $8.47 12.27%
TABLE 9.2: FLORIDA AGENCY FOR HEALTH CARE ADMINISTRATION – SUMMARY OF ANNUAL PHARMACY CLAIMS AND COST BY PHARMACY LOCATION TYPE PLANS WITH PASS-THROUGH PRICING RETAIL CHANNEL ONLY
PHARMACY LOCATION
TOTAL PAID CLAIMS
TOTAL PLAN PAID
TOTAL REMITTANCE TO
PHARMACY TOTAL
SPREAD SPREAD PER PAID CLAIM
SPREAD AS A PERCENT OF
TOTAL PLAN PAID
Urban 10,459,546 $762,938,091 $763,017,885 -$79,794 -$0.01 -0.01%
Rural 404,607 $24,355,582 $24,358,674 -$3,092 -$0.01 -0.01%
Super Rural 112,310 $6,058,269 $6,057,992 $276 $0.00 0.00%
Unknown 782,614 $77,721,762 $77,722,818 -$1,055 $0.00 0.00%
TOTAL 11,759,077 $793,351,942 $793,434,551 -$82,609 -$0.01 -0.01%
TABLE 10.1: FLORIDA AGENCY FOR HEALTH CARE ADMINISTRATION – SUMMARY OF ANNUAL PHARMACY CLAIMS AND COST BY DRUG TYPE (RETAIL CHANNEL ONLY) PLANS WITH SPREAD PRICING BRAND, GENERIC, SPECIALTY
DRUG TYPE TOTAL PAID
CLAIMS
TOTAL PLAN PAID
PLAN PAID PER
CLAIM
TOTAL REMITTANCE
TO PHARMACY
REMITTANCE TO
PHARMACY PAID PER CLAIM
TOTAL SPREAD
SPREAD PER PAID
CLAIM
SPREAD AS A PERCENT OF TOTAL PLAN
PAID
Brand, non-specialty 1,429,116 $393,439,586 $275.30 $377,712,995 $264.30 $15,726,591 $11.00 4.0%
Brand, specialty 43,118 $121,010,853 $2,806.50 $119,064,235 $2,761.36 $1,946,618 $45.15 1.6%
Generic, non-specialty 8,194,869 $172,064,192 $21.00 $106,330,677 $12.98 $65,733,516 $8.02 38.2%
Generic, specialty 34,189 $5,080,704 $148.61 $3,406,305 $99.63 $1,674,399 $48.97 33.0%
TOTAL 9,701,292 $691,595,335 $71.29 $606,514,212 $62.52 $85,081,124 $8.77 12.3%
TABLE 10.2: FLORIDA AGENCY FOR HEALTH CARE ADMINISTRATION – SUMMARY OF ANNUAL PHARMACY CLAIMS AND COST BY DRUG TYPE (RETAIL CHANNEL ONLY) PLANS WITH PASS-THROUGH PRICING BRAND, GENERIC, SPECIALTY
DRUG TYPE TOTAL PAID
CLAIMS
TOTAL PLAN PAID
PLAN PAID PER
CLAIM
TOTAL REMITTANCE
TO PHARMACY
REMITTANCE TO
PHARMACY PAID PER CLAIM
TOTAL SPREAD
SPREAD PER PAID
CLAIM
SPREAD AS A PERCENT OF TOTAL PLAN
PAID
Brand, non-specialty 1,820,654 $501,193,806 $275.28 $501,092,288 $275.23 $101,518 $0.06 0.0%
Brand, specialty 86,246 $210,316,437 $2,438.56 $210,246,683 $2,437.76 $69,754 $0.81 0.0%
Generic, non-specialty 9,810,993 $153,530,747 $15.65 $153,887,269 $15.69 ($356,522) ($0.04) -0.2%
Generic, specialty 41,184 $6,032,714 $146.48 $5,931,129 $144.02 $101,585 $2.47 1.7%
TOTAL 11,759,077 $871,073,704 $74.08 $871,157,369 $74.08 ($83,664) ($0.01) 0.0%

MILLIMAN REPORT
_______________________________________________________________________________________________________________________
Florida Agency for Health Care Administration A - 7 Pharmacy Benefit Management Pricing Practices in Statewide Medicaid Management Care Program December 1, 2020
TABLE 11.1: FLORIDA AGENCY FOR HEALTH CARE ADMINISTRATION – SUMMARY OF ANNUAL PHARMACY CLAIMS AND COST BY DRUG TYPE AND DAY SUPPLY (RETAIL CHANNEL ONLY) PLANS WITH SPREAD PRICING 30 DAY AND 90 DAY PRESCRIPTIONS
DRUG TYPE
DAY SUPPLY
TOTAL PAID CLAIMS
TOTAL PLAN PAID
PLAN PAID PER
CLAIM
TOTAL REMITTANCE
TO PHARMACY
REMITTANCE TO
PHARMACY PAID PER CLAIM
TOTAL SPREAD
SPREAD PER PAID
CLAIM
SPREAD AS A PERCENT OF TOTAL PLAN PAID
Brand 30 day 1,470,723 $511,519,505 $347.80 $493,898,098 $335.82 $17,621,407 $11.98 3.4%
Brand 90 day 1,511 $2,930,934 $1,939.73 $2,879,132 $1,905.45 $51,802 $34.28 1.8%
Generic 30 day 8,110,294 $173,259,052 $21.36 $107,702,389 $13.28 $65,556,663 $8.08 37.8%
Generic 90 day 118,764 $3,885,845 $32.72 $2,034,593 $17.13 $1,851,251 $15.59 47.6%
TOTAL 9,701,292 $691,595,335 $71.29 $606,514,212 $62.52 $85,081,124 $8.77 12.3%
TABLE 11.2: FLORIDA AGENCY FOR HEALTH CARE ADMINISTRATION – SUMMARY OF ANNUAL PHARMACY CLAIMS AND COST BY DRUG TYPE AND DAY SUPPLY (RETAIL CHANNEL ONLY) PLANS WITH PASS-THROUGH PRICING 30 DAY AND 90 DAY PRESCRIPTIONS
DRUG TYPE
DAY SUPPLY
TOTAL PAID CLAIMS
TOTAL PLAN PAID
PLAN PAID PER
CLAIM
TOTAL REMITTANCE
TO PHARMACY
REMITTANCE TO
PHARMACY PAID PER CLAIM
TOTAL SPREAD
SPREAD PER PAID
CLAIM
SPREAD AS A PERCENT OF TOTAL PLAN PAID
Brand 30 day 1,902,601 $707,777,926 $372.01 $707,610,247 $371.92 $167,679 $0.09 0.0%
Brand 90 day 4,299 $3,732,318 $868.18 $3,728,724 $867.35 $3,594 $0.84 0.1%
Generic 30 day 9,701,363 $156,283,058 $16.11 $156,545,092 $16.14 ($262,034) ($0.03) -0.2%
Generic 90 day 150,814 $3,280,402 $21.75 $3,273,306 $21.70 $7,097 $0.05 0.2%
TOTAL 11,759,077 $871,073,704 $74.08 $871,157,369 $74.08 ($83,664) ($0.01) 0.0%
TABLE 12.1: FLORIDA AGENCY FOR HEALTH CARE ADMINISTRATION – SUMMARY OF TOP 10 DRUGS BY TOTAL SPREAD PLANS WITH SPREAD PRICING RETAIL CHANNEL ONLY
DRUG NAME DRUG TYPE
TOTAL PAID CLAIMS
TOTAL PLAN PAID
TOTAL REMITTANCE TO
PHARMACY TOTAL
SPREAD
SPREAD PER PAID
CLAIM
SPREAD AS A PERCENT OF TOTAL PLAN PAID
METHYLPHENIDATE HYDROCHLO G 71,602 $11,592,260 $7,929,762 $3,662,497 $51.15 31.6%
FLUTICASONE PROPIONATE G 190,382 $2,810,158 $1,063,510 $1,746,649 $9.17 62.2%
ATOMOXETINE G 14,725 $3,010,588 $1,272,344 $1,738,244 $118.05 57.7%
ALBUTEROL SULFATE G 180,872 $2,919,016 $1,379,772 $1,539,244 $8.51 52.7%
AMPHETAMINE / DEXTROAMPHETA G 65,077 $3,011,783 $1,655,975 $1,355,809 $20.83 45.0%
CEFDINIR G 70,364 $2,635,097 $1,295,206 $1,339,891 $19.04 50.8%
GUANFACINE ER G 49,960 $2,705,912 $1,386,083 $1,319,829 $26.42 48.8%
BROMPHEN / PSEUDOEPHEDRINE G 123,827 $2,115,343 $945,476 $1,169,866 $9.45 55.3%
KETOCONAZOLE G 53,925 $2,021,441 $841,870 $1,179,571 $21.87 58.4%
TAMIFLU B 44,137 $8,837,935 $7,698,426 $1,139,509 $25.82 12.9%
TOTAL: Top 10 drugs NA 864,871 $41,659,532 $25,468,424 $16,191,108 $18.72 38.9%
TOTAL of all drugs 9,701,292 $691,595,335 $606,514,212 $85,081,124 $8.77 12.3%
%TOTAL of all drugs 9% 6% 4% 19%

MILLIMAN REPORT
_______________________________________________________________________________________________________________________
Florida Agency for Health Care Administration A - 8 Pharmacy Benefit Management Pricing Practices in Statewide Medicaid Management Care Program December 1, 2020
TABLE 12.2: FLORIDA AGENCY FOR HEALTH CARE ADMINISTRATION – SUMMARY OF TOP 10 DRUGS BY TOTAL SPREAD PLANS WITH PASS-THROUGH PRICING RETAIL CHANNEL ONLY
DRUG NAME DRUG TYPE
TOTAL PAID CLAIMS
TOTAL PLAN PAID
TOTAL REMITTANCE TO
PHARMACY TOTAL
SPREAD
SPREAD PER PAID
CLAIM
SPREAD AS A PERCENT OF TOTAL PLAN PAID
METHYLPHENIDATE HYDROCHLO G 81,680 $13,280,765 $13,300,941 ($20,176) ($0) -0.2%
FLUTICASONE PROPIONATE G 265,901 $1,922,753 $1,923,319 ($566) ($0) 0.0%
ATOMOXETINE G 16,502 $2,007,337 $2,009,749 ($2,412) ($0) -0.1%
ALBUTEROL SULFATE G 207,708 $2,727,533 $2,738,954 ($11,421) ($0) -0.4%
AMPHETAMINE / DEXTROAMPHETA G 59,459 $1,687,639 $1,701,314 ($13,674) ($0) -0.8%
CEFDINIR G 80,524 $2,377,187 $2,384,992 ($7,805) ($0) -0.3%
GUANFACINE ER G 60,850 $965,473 $969,553 ($4,080) ($0) -0.4%
BROMPHEN / PSEUDOEPHEDRINE G 161,886 $2,237,365 $2,233,541 $3,824 $0 0.2%
KETOCONAZOLE G 69,405 $1,967,075 $1,974,183 ($7,108) ($0) -0.4%
TAMIFLU B 60,596 $12,725,194 $12,725,856 ($662) ($0) 0.0%
TOTAL: Top 10 drugs NA 1,064,511 $41,898,321 $41,962,402 ($64,081) ($0) -0.2%
TOTAL of all drugs 11,759,077 $871,073,704 $871,157,369 ($83,664) ($0) 0.0%
%TOTAL of all drugs 9% 5% 5% 77%
TABLE 12.3: FLORIDA AGENCY FOR HEALTH CARE ADMINISTRATION – SUMMARY OF TOP 10 DRUGS BY TOTAL GROSS SPEND PLANS WITH SPREAD PRICING RETAIL CHANNEL ONLY
DRUG NAME DRUG TYPE
TOTAL PAID CLAIMS
TOTAL PLAN PAID
TOTAL REMITTANCE TO
PHARMACY TOTAL
SPREAD
SPREAD PER PAID
CLAIM
SPREAD AS A PERCENT OF TOTAL PLAN PAID
VYVANSE B 84,131 $24,742,532 $23,957,880 $784,652 $9.33 3.2%
LATUDA B 15,737 $20,302,713 $19,407,245 $895,469 $56.90 4.4%
FLOVENT HFA B 65,330 $14,273,201 $13,855,353 $417,849 $6.40 2.9%
GENVOYA B 3,215 $9,438,355 $9,178,599 $259,756 $80.80 2.8%
ADVAIR DISKUS B $13,353,505 $12,922,535 $430,970 $13.03 3.2%
PROAIR HFA B $14,961,790 $14,181,344 $780,446 $3.44 5.2%
LYRICA B 26,319 $13,190,661 $12,823,521 $367,140 $13.95 2.8%
SYMBICORT B 40,201 $12,770,125 $12,435,800 $334,325 $8.32 2.6%
LANTUS SOLOSTAR B 31,781 $11,386,989 $11,100,336 $286,653 $9.02 2.5%
METHYLPHENIDATE HYDROCHLO G 71,602 $11,592,260 $7,929,762 $3,662,497 $51.15 31.6%
TOTAL: Top 10 drugs NA 597,931 $146,012,131 $137,792,375 $8,219,756 $13.75 5.6%
TOTAL of all drugs 9,701,292 $691,595,335 $606,514,212 $85,081,124 $8.77 12.3%
%TOTAL of all drugs 6% 21% 23% 10%

MILLIMAN REPORT
_______________________________________________________________________________________________________________________
Florida Agency for Health Care Administration A - 9 Pharmacy Benefit Management Pricing Practices in Statewide Medicaid Management Care Program December 1, 2020
TABLE 12.4: FLORIDA AGENCY FOR HEALTH CARE ADMINISTRATION – SUMMARY OF TOP 10 DRUGS BY TOTAL GROSS SPEND PLANS WITH PASS-THROUGH PRICING RETAIL CHANNEL ONLY
DRUG NAME DRUG TYPE
TOTAL PAID CLAIMS
TOTAL PLAN PAID
TOTAL REMITTANCE TO
PHARMACY TOTAL
SPREAD
SPREAD PER PAID
CLAIM
SPREAD AS A PERCENT OF TOTAL PLAN PAID
VYVANSE B 98,759 $27,925,282 $27,934,460 ($9,178) ($0) 0.0%
LATUDA B 13,173 $16,573,988 $16,572,984 $1,004 $0 0.0%
FLOVENT HFA B 106,679 $22,582,342 $22,592,792 ($10,450) ($0) 0.0%
GENVOYA B 9,168 $25,800,579 $25,790,709 $9,869 $1 0.0%
ADVAIR DISKUS B 47,727 $18,803,855 $18,803,149 $706 $0 0.0%
PROAIR HFA B 277,072 $17,058,677 $17,054,878 $3,799 $0 0.0%
LYRICA B 37,839 $18,754,849 $18,753,555 $1,294 $0 0.0%
SYMBICORT B 62,206 $19,136,815 $19,136,484 $331 $0 0.0%
LANTUS SOLOSTAR B 41,112 $15,746,529 $15,745,653 $876 $0 0.0%
METHYLPHENIDATE HYDROCHLO G 81,680 $13,280,765 $13,300,941 ($20,176) ($0) -0.2%
TOTAL: Top 10 drugs NA 775,415 $195,663,680 $195,685,604 ($21,924) ($0) 0.0%
TOTAL of all drugs 11,759,077 $871,073,704 $871,157,369 ($83,664) ($0) 0.0%
%TOTAL of all drugs 7% 22% 22% 26%
TABLE 12.5: FLORIDA AGENCY FOR HEALTH CARE ADMINISTRATION – SUMMARY OF TOP 10 DRUGS BY TOTAL UTILIZATION (DAYS SUPPLY) PLANS WITH SPREAD PRICING RETAIL CHANNEL ONLY
DRUG NAME DRUG TYPE
TOTAL PAID CLAIMS
TOTAL PLAN PAID
TOTAL REMITTANCE TO
PHARMACY TOTAL
SPREAD
SPREAD PER PAID
CLAIM
SPREAD AS A PERCENT OF TOTAL PLAN PAID
FLUTICASONE PROPIONATE G 190,382 $2,810,158 $1,063,510 $1,746,649 $9.17 62.2%
MONTELUKAST SODIUM G 186,724 $2,048,043 $1,318,322 $729,722 $3.91 35.6%
PROAIR HFA B 226,550 $14,961,790 $14,181,344 $780,446 $3.44 5.2%
LISINOPRIL G 137,190 $493,904 $339,740 $154,165 $1.12 31.2%
ATORVASTATIN CALCIUM G 161,339 $1,609,678 $1,110,819 $498,859 $3.09 31.0%
GABAPENTIN G 167,417 $2,358,399 $2,137,937 $220,462 $1.32 9.3%
AMLODIPINE BESYLATE G 128,369 $423,636 $328,226 $95,410 $0.74 22.5%
METFORMIN HYDROCHLORIDE G 99,114 $480,532 $382,381 $98,151 $0.99 20.4%
LEVOTHYROXINE SODIUM G 96,513 $1,281,518 $664,727 $616,791 $6.39 48.1%
OMEPRAZOLE G 88,708 $615,330 $571,717 $43,612 $0.49 7.1%
TOTAL: Top 10 drugs NA 1,482,306 $27,082,989 $22,098,723 $4,984,266 $3.36 18.4%
TOTAL of all drugs 9,701,292 $691,595,335 $606,514,212 $85,081,124 $8.77 12.3%
%TOTAL of all drugs 15% 4% 4% 6%
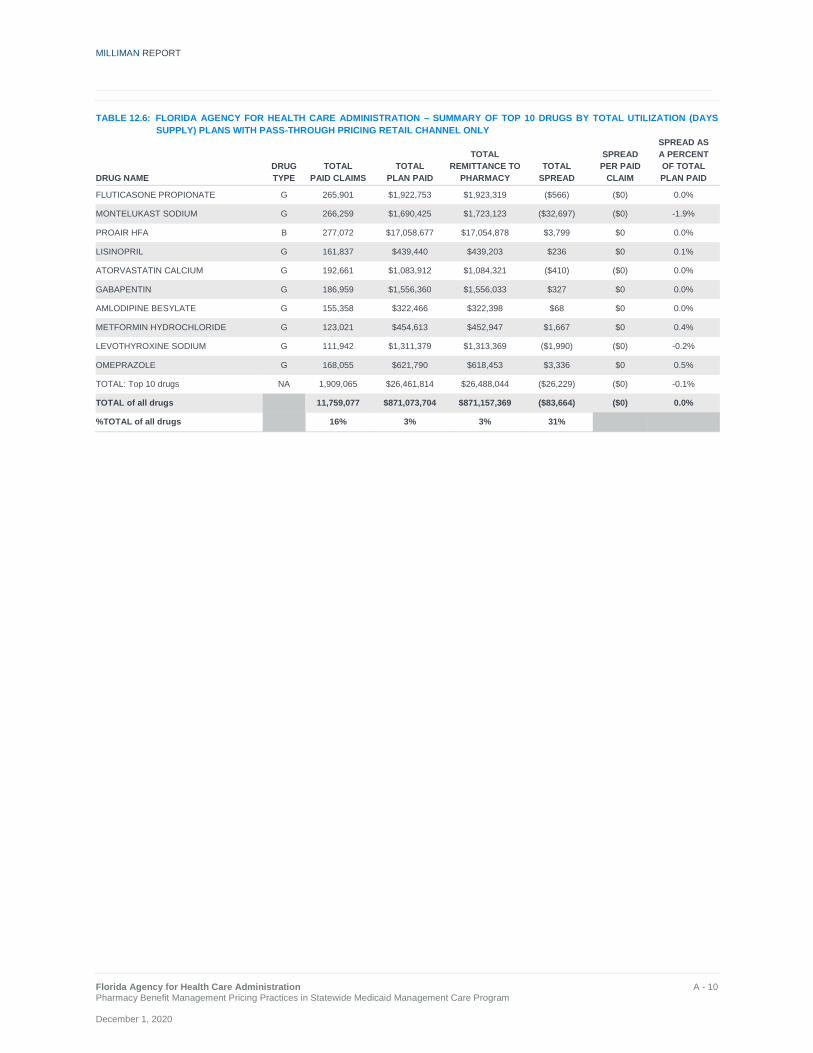
MILLIMAN REPORT
_______________________________________________________________________________________________________________________
Florida Agency for Health Care Administration A - 10 Pharmacy Benefit Management Pricing Practices in Statewide Medicaid Management Care Program December 1, 2020
TABLE 12.6: FLORIDA AGENCY FOR HEALTH CARE ADMINISTRATION – SUMMARY OF TOP 10 DRUGS BY TOTAL UTILIZATION (DAYS SUPPLY) PLANS WITH PASS-THROUGH PRICING RETAIL CHANNEL ONLY
DRUG NAME DRUG TYPE
TOTAL PAID CLAIMS
TOTAL PLAN PAID
TOTAL REMITTANCE TO
PHARMACY TOTAL
SPREAD
SPREAD PER PAID
CLAIM
SPREAD AS A PERCENT OF TOTAL PLAN PAID
FLUTICASONE PROPIONATE G 265,901 $1,922,753 $1,923,319 ($566) ($0) 0.0%
MONTELUKAST SODIUM G 266,259 $1,690,425 $1,723,123 ($32,697) ($0) -1.9%
PROAIR HFA B 277,072 $17,058,677 $17,054,878 $3,799 $0 0.0%
LISINOPRIL G 161,837 $439,440 $439,203 $236 $0 0.1%
ATORVASTATIN CALCIUM G 192,661 $1,083,912 $1,084,321 ($410) ($0) 0.0%
GABAPENTIN G 186,959 $1,556,360 $1,556,033 $327 $0 0.0%
AMLODIPINE BESYLATE G 155,358 $322,466 $322,398 $68 $0 0.0%
METFORMIN HYDROCHLORIDE G 123,021 $454,613 $452,947 $1,667 $0 0.4%
LEVOTHYROXINE SODIUM G 111,942 $1,311,379 $1,313,369 ($1,990) ($0) -0.2%
OMEPRAZOLE G 168,055 $621,790 $618,453 $3,336 $0 0.5%
TOTAL: Top 10 drugs NA 1,909,065 $26,461,814 $26,488,044 ($26,229) ($0) -0.1%
TOTAL of all drugs 11,759,077 $871,073,704 $871,157,369 ($83,664) ($0) 0.0%
%TOTAL of all drugs 16% 3% 3% 31%

MILLIMAN REPORT
_______________________________________________________________________________________________________________________
Florida Agency for Health Care Administration Pharmacy Benefit Management Pricing Practices in Statewide Medicaid Management Care Program December 1, 2020
Milliman is among the world’s largest providers of actuarial and related products and services. The firm has consulting practices in life insurance and financial services, property & casualty insurance, healthcare, and employee benefits. Founded in 1947, Milliman is an independent firm with offices in major cities around the globe.
milliman.com
© 2020 Milliman, Inc. All Rights Reserved. The materials in this document represent the opinion of the authors and are not representative of the views of Milliman, Inc. Milliman does not certify the information, nor does it guarantee the accuracy and completeness of such information. Use of such information is voluntary and should not be relied upon unless an independent review of its accuracy and completeness has been performed. Materials may not be reproduced without the express consent of Milliman.