MILLERCOORS’ GOALS FOR WATER SAVINGS AND … · millercoors’ goals for water . savings and...
20
MILLERCOORS’ GOALS FOR WATER SAVINGS AND APPROACH TO WATER REDUCTION JULIE SMITH, PE, OPTIMIZATION ENGINEER 8/14/14
-
Upload
vuongthuan -
Category
Documents
-
view
216 -
download
2
Transcript of MILLERCOORS’ GOALS FOR WATER SAVINGS AND … · millercoors’ goals for water . savings and...

MILLERCOORS’ GOALS FOR WATER SAVINGS AND APPROACH TO WATER REDUCTION JULIE SMITH, PE, OPTIMIZATION ENGINEER
8/14/14

Brewery Water Reduction - Overview
Corporate Goals and Score Carding Water Usage in the Brewery Processes Value
Evolution of Water Reduction 2013 Water Reduction Projects Water Re-Use Results Conclusions

Corporate Sustainability Goals
Energy Usage of 120 MJ/HL by 2015 Electricity Steam Vehicle Fuel
Water Usage of 3.18 HL/HL by 2012 Zero Waste to Landfill by 2015 CO2 Self-Sufficiency of 85% by 2015 50% Reduction in Green House Gas by 2020
BHAG – 4th Brewery or Better in MillerCoors

Monthly Indicator*
Mthly Actual Mthly Stretch Target
Mthly Budget Target
Actual YTD 2012
YTD Stretch Goal YTD Budget STPY % Change People/Process
Tech
MillerCoors 155 165 173 145 143 154 154 -5.7%Milwaukee 138 154 156 133 138 140 147 -9.5%Fort Worth 126 103 105 113 104 105 111 1.9%Eden 162 175 165 141 156 163 170 -17.1%Albany 134 142 156 130 132 145 140 -7.5%Irwindale 118 115 124 123 122 131 130 -5.2%Trenton 137 160 184 145 143 164 156 -7.1%Golden 252 288 307 226 215 229 234 -3.5%Shenandoah 128 109 116 106 99 106 106 -0.3%
Monthly Indicator*
Mthly Actual Mthly Stretch Target
Mthly Budget Target
Actual YTD 2012
YTD Stretch Goal YTD Budget STPY % Change People/Process
Tech
MillerCoors 3.86 3.92 4.01 3.82 3.83 3.92 4.07 -6.0%Milwaukee 3.63 3.68 3.75 4.07 3.85 3.92 4.77 -14.8%Fort Worth 3.59 3.31 3.38 3.47 3.41 3.48 3.53 -1.8%Eden 3.46 3.97 4.05 3.34 3.77 3.85 3.91 -14.6%Albany 3.53 3.54 3.62 3.67 3.60 3.68 3.81 -3.6%Irwindale 3.36 3.53 3.60 3.69 3.66 3.73 3.73 -1.1%Trenton 3.56 3.98 4.16 3.56 3.55 3.71 3.76 -5.2%Golden 5.35 4.85 5.01 4.63 4.56 4.71 4.82 -3.9% NP
Shenandoah 3.82 4.09 4.15 3.86 3.91 3.97 4.09 -5.8%
High Usage
Typical Usage
Reduced Usage
60- 80%
Stretch Reduction >80%
Water (hl/hl) FEWER
Monthly Indicator Monthly/YTD/Budget KPI FEWER - People/ Process & Technology*Monthly Indicator relative to 2009-2011 usage rates. Linear regression model factors include brewed, packed, weather, rainfall, electrical generation.
Above Upper Target
Nothing Planned - NP
< 60%
Between Stretch &Upper Target
December 2012
Total Energy (MJ/hl) FEWER
SIT Goals 2011 2012 2013 2014 2015
Water 4.07 3.83 3.57 3.38 3.18Energy 154 143 136 128 120

Brewery Process Overview Malting
Brewing
Fermenting
Conditioning
Packaging
Warehousing

Brewery Water Value • Value of Water Temperature Treatment Chemicals • Beer! • Condensate – Hot/RO • Hot CIP water • Ambient water – A Water, B Water • Chemicals • Cooling Water • Wastewater • “Clean” Wastewater
High $
Low $

Evolution of Water Reduction
I. Stop the Bleeding Leaks Turn it off
II. Process Changes Simple Complex
III. Focus on Energy Water Will Follow
IV. Capital Projects Metering CO2 Scrubber Condensate/Flash Steam Recovery
V. Water Re-Use
Where do we Start??

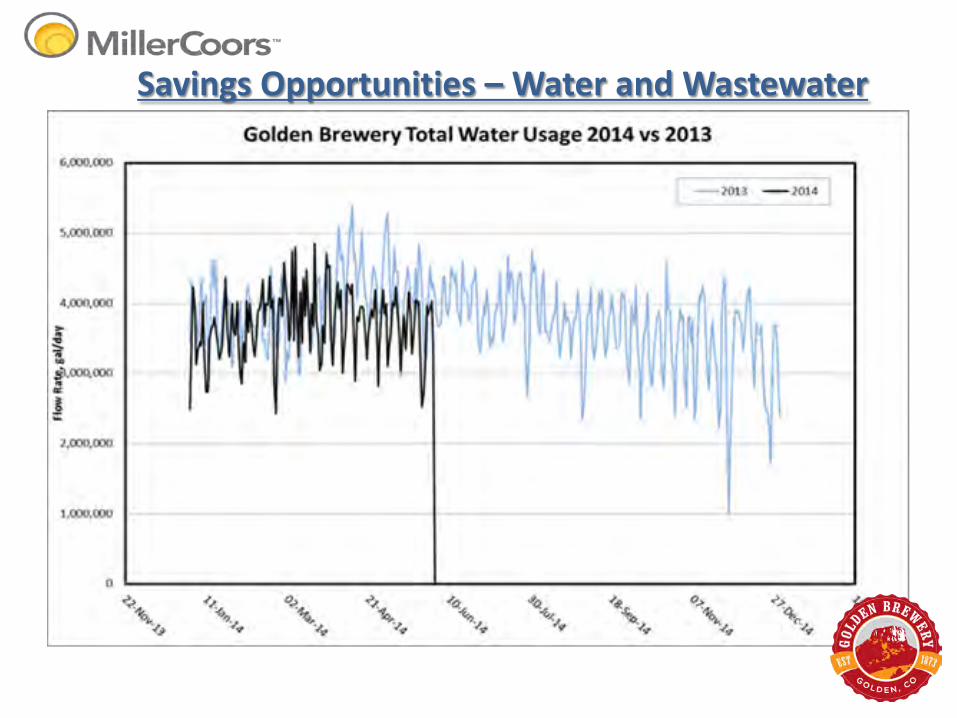
Savings Opportunities – Water and Wastewater

Savings Opportunities – Water and Wastewater

Golden Brewery Water Reduction - 2013 • Reduce Kettle Evaporation – 0.03 HL/HL • Packaging Shut off B Water to Full Can Rinsers – 0.023 HL/HL • C14 Fire Pump Seal Water Leak Repair – 0.02 HL/HL • Aging Recovery of CIP Rinse – 0.015 HL/HL • Brewing Shut off Dead Leg Bleeders DA Manifold – 0.004 HL/HL • UOPS Correct Condensate Leak to GBL – 0.015 HL/HL • Prevent Hot A Water Overflow – 0.11 HL/HL • 4-Can Condensate Recovery – 0.001 HL/HL • Facilities Turf Reduction Water Savings – 0.006 HL/HL • Facilities Evaporative Cooling Reduction – 0.023 HL/HL • Brewing FIT Water Savings – 0.059 HL/HL • PWTP Waterless Dechlorination – 0.003 HL/HL • C12 Hot Water Heater for Liquid Adjunct Pump – 0.016 HL/HL • UOPS B1 Cooling Water Evap Reduction – 0.044 HL/HL • C11 Cold Sanitization – 0.011 HL/HL • YDP CIP Re-Use of Still Bottoms – 0.005 HL/HL • Packaging Vacuum Pump Seal Water Reclaim – 0.005 HL/HL • Gov Cellar – re-use sanitization water for flushing tanks and headers – 0.00057 HL/HL • Brewing Hot Water Cycle Time Reduction – 0.025 HL/HL • Brewing Reduce Wort Cooler CIP Flush Rates – 0.0028 HL/HL • 7-Bottle Warmer Reduced Water Changes – 0.0005 HL/HL • Fermenting CIP Pulse Cleaning – 0.024 HL/HL • YDP B-Water Overflow Valve Corrected – 0.019 HL/HL • C12 Basement Hot Water Heater Replacement – 0.01 HL/HL • UOPS C1 Cooling Tower Evap Reduction – 0.15 HL/HL
1 HL/HL = 300 MG/Yr 600 gpm

Water Re-Use/Recovery Considerations
• Food Plant Hygiene • Simple Projects First • “Clean” Re-Use First • Look for “Dirty” Sinks • Distance to Process • Cooling Water • Consider Energy

Water Re-Use/Recovery
• YDP use of still bottoms • Liquid Adjunct Pump
Recirculation • Vac Pump seal water recirc • CIP Pre-rinse • Packaging Reclaim Cascade • CO2 Scrubber Water – Re-Use for
Regen Steam Cooling Water
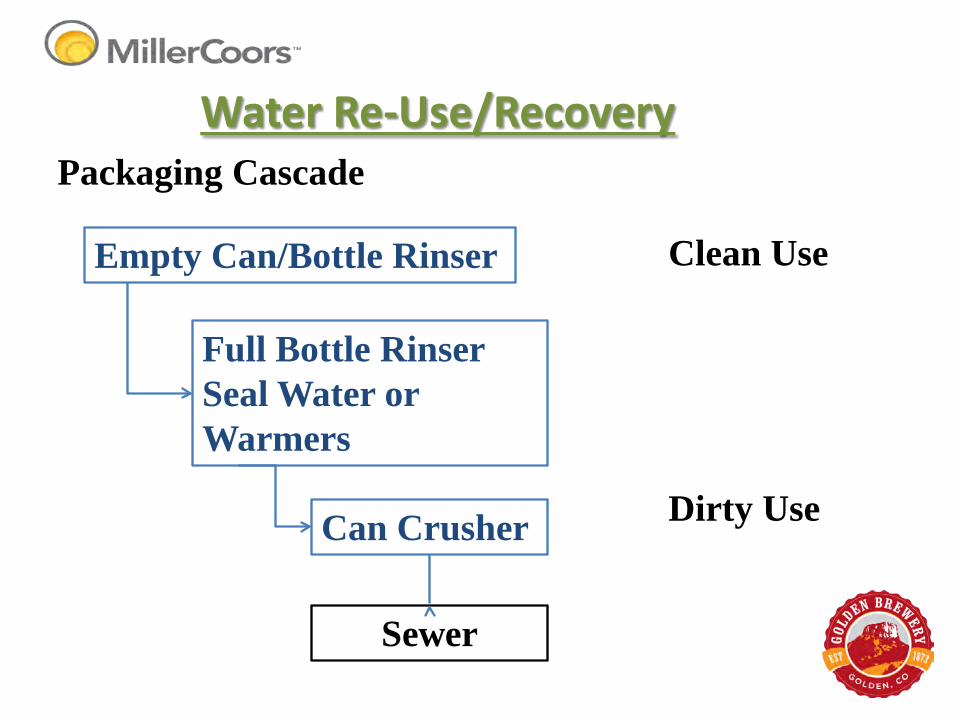
Water Re-Use/Recovery Packaging Cascade
Empty Can/Bottle Rinser
Full Bottle Rinser Seal Water or Warmers
Can Crusher Dirty Use
Clean Use
Sewer

Water Re-Use/Recovery

Water Re-Use/Recovery CO2 Scrubber Cooling Water
Chilled Water
Scrubbers Carbon Towers
Condenser
Steam In
Steam Out
Sewer

Golden Brewery Water Reduction - 2013

Mthly Actual Mthly SIT Mthly Glide Slope
2014 Actual YTD
YTD SIT YTD Glide Slope STPY % Change BHAG
Albany 118 113 117 124 117 118 120 3.3% 115Eden 111 110 112 141 131 135 141 0.2% 125Fort Worth 94 91 94 106 100 103 107 -1.8% 97Golden 119 108 112 146 129 134 146 -0.3% 130Irwindale 91 105 107 101 103 105 107 -6.1% 100Milwaukee 94 103 106 118 122 125 132 -10.7% 118Shenandoah 82 92 95 92 99 102 104 -11.8% 96Trenton 103 106 108 123 117 119 119 3.4% 115MillerCoors 103 104 107 121 116 119 124 -2.2% 114
Mthly Actual Mthly SIT Mthly Glide Slope
2014 Actual YTD
YTD SIT YTD Glide Slope STPY % Change BHAG
Albany 3.39 3.29 3.36 3.30 3.32 3.39 3.51 -6.2% 3.20Eden 2.99 2.88 2.97 3.09 3.01 3.06 3.09 0.0% 2.80Fort Worth 3.23 3.14 3.20 3.21 3.09 3.15 3.27 -2.0% 3.07Golden 3.58 3.50 3.56 4.00 3.80 3.87 4.12 -2.9% 3.75Irwindale 2.86 3.12 3.19 3.09 3.19 3.26 3.32 -6.9% 3.15Milwaukee 3.15 3.52 3.61 3.19 3.52 3.61 3.63 -12.3% 3.35Shenandoah 3.40 3.31 3.51 3.38 3.37 3.56 3.52 -4.0% 3.29Trenton 2.97 2.69 2.77 3.17 2.93 3.02 3.23 -1.7% 2.95MillerCoors 3.21 3.18 3.27 3.34 3.30 3.38 3.49 -4.5% 3.22
Total Energy (MJ/hl)
Water (hl/hl)
2011 Actual
2012 Actual
2013 Actual
2014 SIT Goal
2015 SIT Goal
F20 Goal
Water 4.07 3.82 3.48 3.31 3.18 3.00Energy 154 146 123 117 111 100

Conclusions 1. Leadership 2. Scorecarding 3. Shared Learnings 4. Start Simple – Build Momentum 5. Process Changes
• Minimum Cost • High Impact
6. Capital Projects • High Cost • Impact Depends on Culture

Golden Brewery Energy Savings Culture
Margaret Mead
“NEVER DOUBT THAT A SMALL GROUP OF THOUGHTFUL, COMMITTED PEOPLE CAN CHANGE THE WORLD. INDEED, IT IS THE ONLY THING THAT EVER HAS.”