Millennials’ Future · Millennials are a wave that will ripple through the economy as they...
18
Transcript of Millennials’ Future · Millennials are a wave that will ripple through the economy as they...

© 2017 Chase Intel, LLC
Conclusions
Millennials have numbers, but they will not halt the long-term trend of the weakening relative economic power of young people
Despite the size of the generation, the number of families in the US will rise only moderately through the next decade
In many ways Millennial spending patterns mimic those of prior generations, which can help you anticipate demand for family travel
Belief: Testing and applying the analyses that follow can help determine when and where to focus your efforts

© 2017 Chase Intel, LLC
Conclusions based on my analysis of Govt. estimates and millions of surveys
Social and Economic Supplement to the Current Population Survey**
Census Bureau: 1961 - 2016
American Community Survey**Census Bureau: 2005 – 2016
2014 National Population Projections DatasetsCensus Bureau: 2014
Survey of Consumer FinanceFederal Reserve: 1989 - 2016
Consumer Expenditure SurveyBureau of Labor Statistics 1996 – 2016
Natality information (Fertility Rates)Center for Disease Control: 2007 - 2016
**Steven Ruggles, Katie Genadek, Ronald Goeken, Josiah Grover, and Matthew Sobek.
Integrated Public Use Microdata Series: Version 7.0 [dataset]. Minneapolis:
University of Minnesota, 2017. https://doi.org/10.18128/D010.V7.0.

© 2017 Chase Intel, LLC
US-centric analysis, but these types of data are available in many countries
Census data for eighty-five countrieshttps://international.ipums.org/international/
Australian Bureau of Statistics [Access restricted]http://abs.gov.au/websitedbs/D3310114.nsf/
home/CURF:+About+the+ABS+Data+Laboratory+(ABSDL)

Presentation Flow
Generational income and wealth trends
Family formation and travel forecast
Suggestions for next steps

© 2017 Chase Intel, LLC
Definitions vary, but think of Millennials as a generation 9% larger than Gen X
Generation** Years # Years# People(Millions)
People/Yr(Millions)
Silent/Greatest < ‘46 29+ 28 1.0
Boomers ‘46 – ‘64 19 74 3.9
Gen X ’65 – ‘80 16 66 4.1
Millennials ’81 - 97 17 76 4.5
Gen Z > ‘97 20 82 4.1
**Generations as defined by Pew Research
Source: Summary oit States Census Bureau: 2014 National Population Projections Datasets: Table np2014-d1 :: 2017 Projections
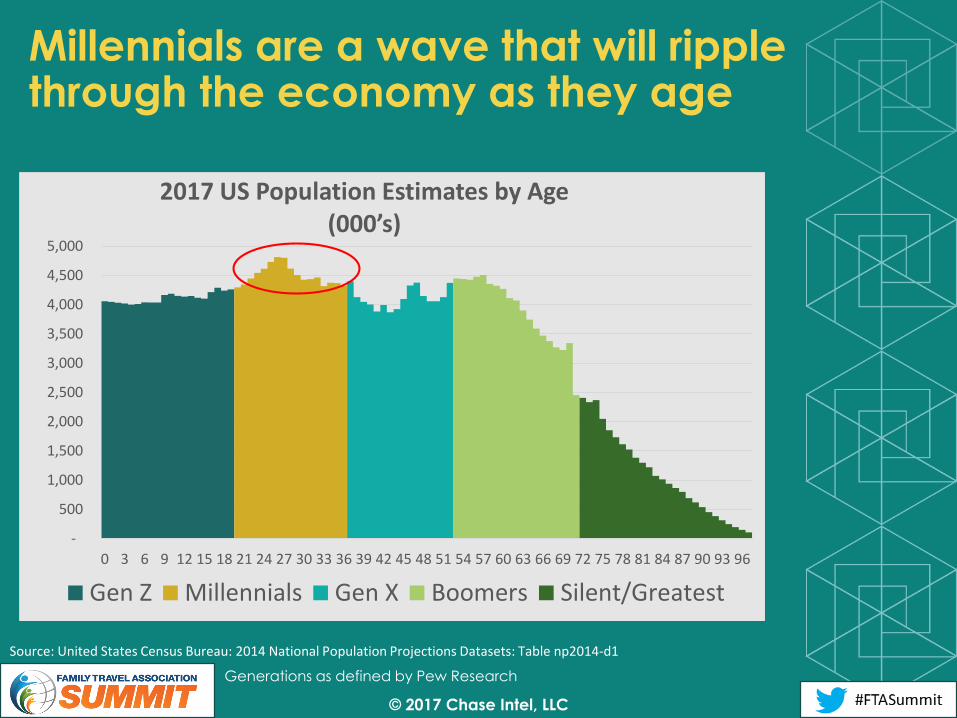
The Millennial generation has one more year of births than does Gen X• On an average, annual bases it has 4.5 million members per year• That is 9% more than Gen X’s 4.1 million
Note that Gen Z (with no defined end date) has the most members• That’s due to it having 20 years of births vs 17 for Millennials• On an adjusted basis it’s no larger than Gen X• But, it is anticipated to grow through immigration
© 2017 Chase Intel, LLC
Millennials are a wave that will ripple through the economy as they age
-
500
1,000
1,500
2,000
2,500
3,000
3,500
4,000
4,500
5,000
0 3 6 9 12 15 18 21 24 27 30 33 36 39 42 45 48 51 54 57 60 63 66 69 72 75 78 81 84 87 90 93 96
2017 US Population Estimates by Age(000’s)
Gen Z Millennials Gen X Boomers Silent/Greatest
Source: United States Census Bureau: 2014 National Population Projections Datasets: Table np2014-d1
Generations as defined by Pew Research

© 2017 Chase Intel, LLC
Boomers are an avalanche, transforming the distribution of wealth in the US
-
500
1,000
1,500
2,000
2,500
3,000
3,500
4,000
4,500
5,000
0 3 6 9 12 15 18 21 24 27 30 33 36 39 42 45 48 51 54 57 60 63 66 69 72 75 78 81 84 87 90 93 96
2017 US Population Estimates by Age(000’s)
Gen Z Millennials Gen X Boomers Silent/Greatest
Source: United States Census Bureau: 2014 National Population Projections Datasets: Table np2014-d1
Generations as defined by Pew Research
© 2017 Chase Intel, LLC
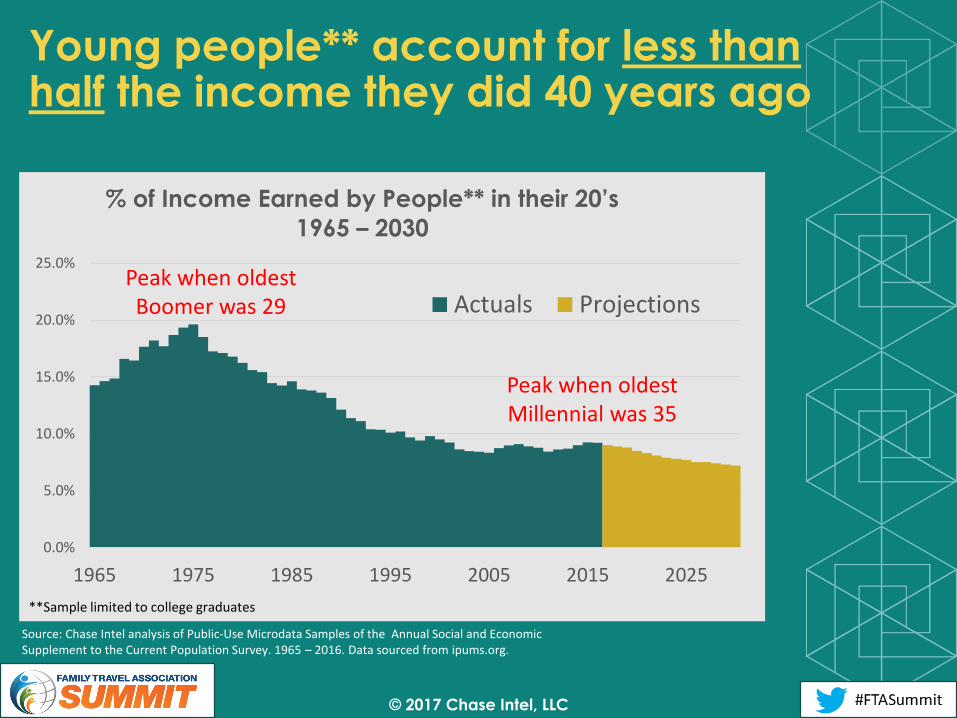
Young people** account for less than half the income they did 40 years ago
0.0%
5.0%
10.0%
15.0%
20.0%
25.0%
1965 1975 1985 1995 2005 2015 2025
% of Income Earned by People** in their 20’s
1965 – 2030
Actuals ProjectionsBoomer impact
**Sample limited to college graduates
Peak when oldest Boomer was 29
Peak when oldest Millennial was 35
Source: Chase Intel analysis of Public-Use Microdata Samples of the Annual Social and Economic Supplement to the Current Population Survey. 1965 – 2016. Data sourced from ipums.org.

© 2017 Chase Intel, LLC
Their share of income will continue going to people 60 and over.
0.0%
5.0%
10.0%
15.0%
20.0%
25.0%
30.0%
35.0%
40.0%
1965 1975 1985 1995 2005 2015 2025
% of Income Earned by People** 60 and Over
1965 – 2030
Actuals ProjectionsBoomer impact
Source: Chase Intel analysis of Public-Use Microdata Samples of the Annual Social and Economic Supplement to the Current Population Survey. 1965 – 2016. Data sourced from ipums.org.
**Sample limited to college graduates

© 2017 Chase Intel, LLC
Net worth is a more extreme version of the same story; Millennials hold <3%
< 35 35 - 44 45 - 54 55 - 64 65+
1989 2016
Proportion of household net worthby age of householder
Source: Survey of Consumer Finance: Table 4. Family net worth, by selected characteristics of families, 1989–2016 surveys

Family Formation and Travel

© 2017 Chase Intel, LLC
The number of children is anticipated to grow slowly over the next decade
0
10
20
30
40
50
60
70
80
90
1970 1980 1990 2000 2010 2020 2030
Number of 0-17 Aged Children
(Millions)
1970 - 2030
Actuals Projections
Growing for first time in ten
years
Percent growth in number of
children: 2017 - 2030
• Total: 3.4%
• Annual 0.3%
Growth will be concentrated
in households with younger
children
Why is growth so moderate?
• Fertility rate is down 10%
in past ten years
• Without immigration there
would be no growth
Source: 1970 – 2016 Chase Intel analysis of the Public-Use Microdata samples of the Annual Social and
Economic Supplement to Current Population Survey 1970 – 2016. ipums.org
2017 - 2030: https://census.gov/data/datasets/2014/demo/popproj/2014-popproj.html Table 1
:
© 2017 Chase Intel, LLC
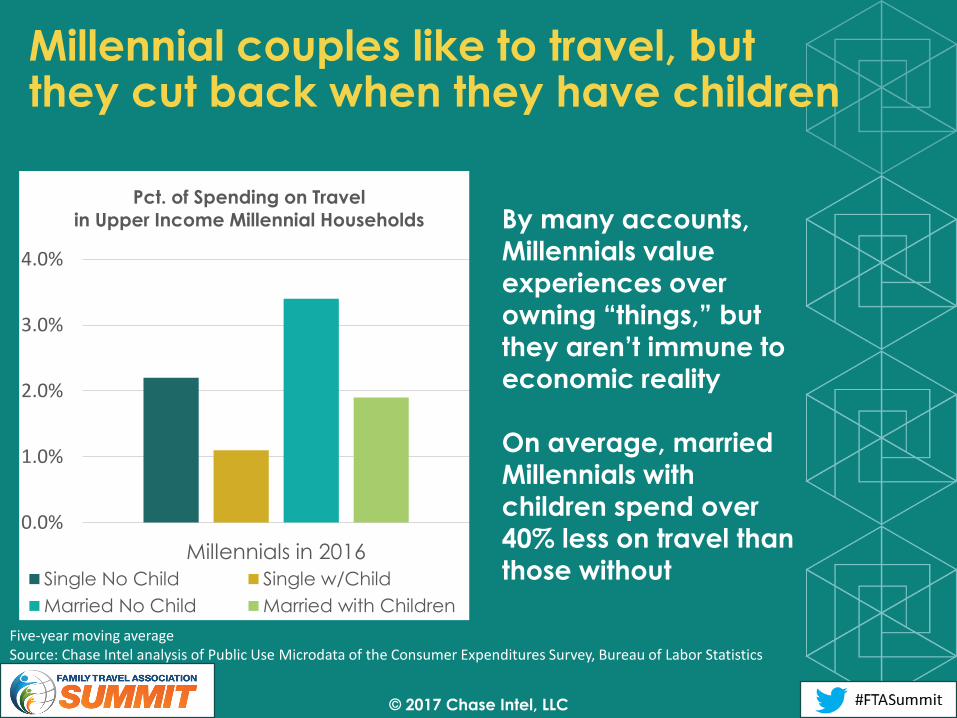
Millennial couples like to travel, butthey cut back when they have children
0.0%
1.0%
2.0%
3.0%
4.0%
Millennials in 2016
Pct. of Spending on Travel
in Upper Income Millennial Households
Single No Child Single w/Child
Married No Child Married with Children
By many accounts,
Millennials value
experiences over owning “things,” but
they aren’t immune to
economic reality
On average, married
Millennials with
children spend over
40% less on travel than
those without
Five-year moving averageSource: Chase Intel analysis of Public Use Microdata of the Consumer Expenditures Survey, Bureau of Labor Statistics

© 2017 Chase Intel, LLC
X’rs did the same thing when they were the same age as Millennials are now
0.0%
1.0%
2.0%
3.0%
4.0%
Gen X in 2000
Pct. of Spending on Travel
in Upper Income Gen X households
Single No Child Single w/Child
Married No Child Married with Children
Millennials with
children spend within
0.2% of what Gen X
did at the same age
This is true for other
categories of
spending as well
This predictability
facilitates effective
planning
Five-year moving averageSource: Chase Intel analysis of Public Use Microdata of the Consumer Expenditures Survey, Bureau of Labor Statistics

© 2017 Chase Intel, LLC
Among couples, empty-nest Boomers and Gen X families are the top travelers
-
5.00
10.00
15.00
20.00
25.00
Married No Children Married with Children
$ in
Bill
ion
s
Average Annual Travel Spend
2014 - 2016
Millennial Gen X BoomerSource: Chase Intel analysis of Public Use Microdata of the Consumer Expenditures Survey, Bureau of Labor Statistics2014-2016

© 2017 Chase Intel, LLC
Travel spending is likely to continue to shift to those with higher incomes
0%
10%
20%
30%
40%
50%
60%
70%
80%
Consumers Now Consumers of Same Age in 2000
% of Travel Spend from Upper Income
Households**
2016 v 2000
Millennial Gen X BoomerThree-Year Moving Average
** Sample includes only Married Householders with children
Source: Chase Intel analysis of Public Use Microdata of the Consumer Expenditures Survey, Bureau of Labor Statistics1998 - 2016

© 2017 Chase Intel, LLC
Concluding thoughts. . .
Set realistic goals for Millennials and other generations, timing your investments appropriately
Explore opportunities for multi-generational travel as a driver of growth
• Grandparents with money and cash-constrained parents who like to travel, sound like a match!
Monitor household formation, income and spending trends to ensure your plans remain in synch with the market
Refrain from relying on a sole source of information (including mine) to inform your decisions
• Compare these conclusions with what you see in your business and in your data
• Combined, these data can suggest insights to be tested and developed