Millenium Development Goals: Ukraine 2010
110
MILLENNIUM DEVELOPMENT GOALS UKRAINE – 2010 NATIONAL REPORT
-
Upload
united-nations-development-programme-in-ukraine -
Category
Documents
-
view
218 -
download
1
description
Millenium Development Goals: Ukraine 2010
Transcript of Millenium Development Goals: Ukraine 2010
MILLENNIUM DEVELOPMENT GOALS
UKRAINE – 2010
NATIONAL REPORT
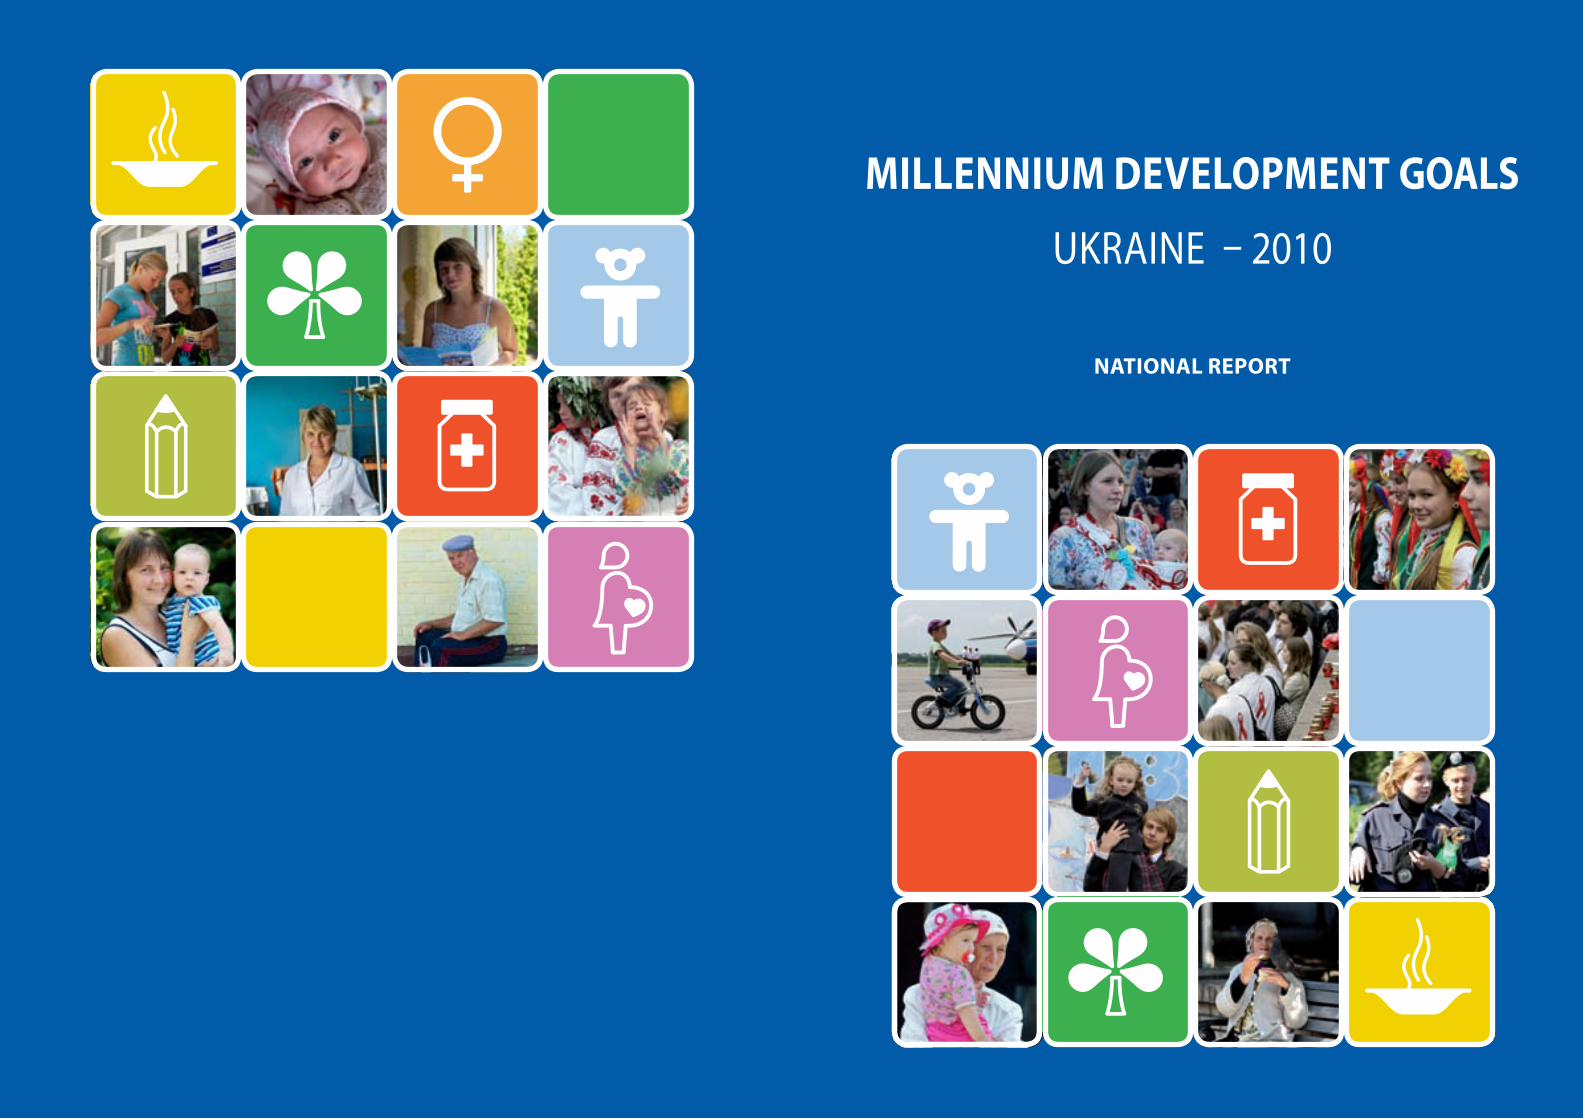
UKRAINE IN 2015 United Nations Millennium Declaration, adopted by 189 countries at the United Nations General Assembly session in September 2000, initiated the process towards achieving the Millennium Development Goals by 2015. Two thirds of the time has passed. What are the results of our efforts? The United Nations Summit on the Millennium Development Goals – a High-Level Plenary Meeting of the General Assembly – will bring together world leaders to review progress, identify gaps, and commit to a specific action agenda to achieve the MDGs and internationally agreed development goals. “Our world possesses the knowledge and the resources to achieve the MDGs. Our challenge today is to agree on an action agenda to achieve the MDGs” the UN Secretary-General Ban Ki-moon stated in his report in preparation for the September Summit.
The Millennium Development Goals defined for Ukraine are a set of time-bound, quantitative targets, representing a vision for the country’s medium-term development. These are 7 goals, 15 targets and 33 indicators.
GOAL 1: Reduce Poverty (3 targets and 5 indicators);
GOAL 2: Quality Lifelong Education (2 targets and 6 indicators);
GOAL 3: Promote Gender Equality (2 targets and 4 indicators);
GOAL 4: Reduce Child Mortality (1 target and 2 indicators);
GOAL 5: Improve Maternal Health (1 target and 2 indicators);
GOAL 6: Reduce and Slow Down the Spread of HIV/AIDS and Tuberculosis, and Initiate a Trend to Decrease their Scales (2 targets and 6 indicators);
GOAL 7: Ensure Environmental Sustainability (4 targets and 8 indicators).
The updated matrix of the targets and indicators was developed through a transparent and open strategic planning process and forecasting of development trends by 2015. MDGs-oriented strategic governance will serve as a driver of the national development and strength collaboration between government institutions, civil society organizations and business community to achieve the MDGs.

MINISTRY OF ECONOMY OF UKRAINE
MILLENNIUM DEVELOPMENT GOALS
UKRAINE – 2010
NATIONAL REPORT
Kyiv 2010

The Report analyses the status of achievement of the Millennium Development Goals (MDGs), presents a matrix of the MDG targets and indicators and sets milestones through 2015 using a wide range of informational, statistical and analytical materials. The Report assesses obstacles to Ukraine’s dynamic development, identifies major challenges at the current stage of the MDGs implementation and offers recommendations on optimal ways of addressing them.
This publication will be useful to Government officials, ministries and other governmental agencies, heads and ex-perts of local executive authorities, scientists, members of public organisations and all who deal with issues of socio-economic and human development.
Photo credits:Page 13 : Stanislav Serdyuk/UNIANPage 17 : Viktor Gurniak/UNIANPage 31 : Ruslan Kanyuka/The Day NewspaperPage 34 : Kostyantyn Grishin/The Day NewspaperPage 43 : Volodymyr Tokarec/UNIANPage 54 : Oleksandr Kosarev/Participant of The Day Newspaper International Photo ContestPage 63 : Robert Fyu/UNICEFPage 68 : Taras Kovalchuk/Participant of Contest: ‘MDGs: Our Challenges. Our Commitment!’Page 75 : Andrey Skakodub/UNIANPage 89 : Natalia Levina/Participant of Contest: ‘MDGs: Our Challenges. Our Commitment!’
Cover: Stanislav Serdyuk/UNIAN, Viktor Gurniak/UNIAN, Ruslan Kanyuka/The Day Newspaper, Kostyantyn Grishin/The Day Newspaper, Volodymyr Tokarec/UNIAN, Oleksandr Kosarev/Participant of The Day Newspaper International Pho-to Contest, Robert Fyu/UNICEF, Taras Kovalchuk/Participant of Contest: ‘MDGs: Our Challenges. Our Commitment!’, Andrey Skakodub /UNIAN, Volodymyr Zakharov/UNDP Ukraine.
This publication contains pictures from a video and multimedia contest: ‘Millennium Development Goals: Our Chal-lenges. Our Commitment!‘ and from the annual The Day Newspaper International Photo Contest. The ‘Millennium Development Goals: Our Challenges. Our Commitment!’ contest was conducted in 2010 by the United Nations Office in Ukraine together with the Ministry of Economy of Ukraine, with support from Samsung Electronics Ukraine, The Segodnya Newspaper, TV channel MTV and internet portal Korrespondent.net.
This publication has been produced within the Millennium Development Goals – Ukraine Project, implemented by the United Nations Development Programme in Ukraine. The views, findings and recommendations expressed in this publication are those of the authors alone. They do not necessarily represent the views of UNDP.
United Nations Development Programme (UNDP) is the UN’s global development network, advo-cating for change and connecting countries to knowledge, experience and resources to help people build a better life. We are on the ground in 166 countries, working with them on their own solutions to global and national development challenges. As they develop local capacity, they draw on the people of UNDP and our wide range of partners.
Since 1993, UN Development Programme has been committed to helping Ukraine on its way to better living standards, prosperity and democracy. We bring best international practices to helping the Gov-ernment, local authorities and communities to overcome human development challenges and imple-ment effective policies in Ukraine.
In cooperation with our partners, we support initiatives that work to reduce poverty and improve qual-ity and access to basic social services. We promote democratic governance and demonstrate how prin-ciples of transparency, accountability and quality of service can achieve tangible results in various areas of public policy and local development across the country. UNDP helps in reforming state institutions, protecting the environment and empowering women to play a more active role in decision making. In our activities, UNDP ensures a balance between policy and advocacy work, capacity-building activi-ties and pilot projects.
Helping to develop Ukrainian solutions to reach Ukrainian development goals.
Find out more about UNDP operations in Ukraine at www.undp.org.ua.
MILLENNIUM DEVELOPMENT GOALS. UKRAINE – 2010 3
Ukraine acceded to the globally recognized Millennium Development Goals in 2000, together with 189 other countries, and assumed a political obligation to achieve them and their implementation targets by 2015. Today, we are only five years from 2015 – the deadline for meeting this obligation.
In September 2010, a High-Level Plenary Meeting of the General Assembly will take place at the United Nations Headquarters, in New York, during which global leaders will assess progress achieved, identify emerging challenges and confirm their willingness to take specific measures to achieve the MDGs.
The Ministry of Economy of Ukraine, in cooperation with the Millennium Development Goals – Ukraine Project of the United Nations Development Programme in Ukraine, has reviewed the national MDGs and prepared an updated system of the national MDGs targets and indicators, considering the specifics of national development in a post-crisis period and the challenges of contemporary global development. This process involved more than 100 representatives of Government
institutions, think-tanks, United Nations agencies, international organisations, the Federation of Trade Unions of Ukraine and civil society organisations. It resulted in the National Report, Millennium Development Goals. Ukraine – 2010. In this process, efforts were made to analyse policy implications in various domains and to generate the updated targets for the Government until 2015.
Current socio-economic trends and progress made so far towards the MDGs highlight the need to undertake an in-depth analysis and interpretation of specific features of Ukraine’s social and economic context, in order to identify development priorities and ensure efficient measures are taken to achieve the MDGs as a component of the national long-term development strategy.
We express our sincere gratitude to the experts who contributed towards the preparation of the Report. We would also like to thank Vasyl Tsushko, Minister of Economy of Ukraine, and Olivier Adam, UN Resident Coordinator and UNDP Resident Representative, for their support.
MILLENNIUM DEVELOPMENT GOALS. UKRAINE – 20104
The Millennium Development Goals are a unifying platform to address challenges faced by the poorest and to achieve social cohesion of societies across the world. At the same time, they represent a broader agenda for the future development of nations. Millennium Development Goal targets are fully integrated into the long-term strategies and programmes of many countries, which gear their economic, social and environmental policies towards these key Goals.
Ukraine, having joined the United Nations Millennium Declaration a decade ago, together with 189 other countries, has made a commitment to reaching the MDGs by 2015. There are just five years left until 2015 – the deadline for fulfilling our commitments.
In recent years, significant changes have taken place in the world. The number of unemployed persons on the planet has grown by 34 million; for the first time in the history of humankind, over 1 billion people are starving; poor access to clean water and sanitation continues to present risks of deaths from infectious diseases. Ukraine, along with other countries, has felt the negative impacts of the recent financial and economic crisis, which neutralized its reconstructive growth over 2001–2007.
The time for change has come. To respond to people’s expectations, we will follow a course towards reform and towards systemic modernization of the country. The Economic Reform Programme for 2010–2014, ‘Prosperous Society, Competitive Economy and Effective Government,’ adopted following extensive public discussion, encompasses all spheres of public life and will establish the necessary preconditions for fulfilling obligations related to the implementation of the Millennium Development Goals.
Key priorities of this programme related to improving the living conditions of Ukrainian citizens are based on the revised system of targets and indicators of the national Goals. We support any effort to look for new ways to address the challenges presented by the globalized world.
Ukraine is initiating large-scale economic reforms at a difficult time. At the same time, it is not only our country fighting to overcome the crisis but the whole world. A search for new progressive development models is underway, for new ways to ensure human development aimed at the achievement of the Millennium Development Goals.
This is a challenge for the whole global community. And it is also an opportunity for the renewal and prosperity of our country.
VIKTOR YANUKOVYCHPRESIDENT OF UKRAINE
MILLENNIUM DEVELOPMENT GOALS. UKRAINE – 2010 5
When 189 world leaders met at the United Nations and endorsed the Millennium Declaration in September 2000, they made a strong commitment to work together to build a safer, more prosperous and more equitable world. The Declaration was translated worldwide into a roadmap setting out eight time-bound and measurable Goals, known as the Millennium Development Goals, to be reached by 2015. Their importance cannot be overstated. Ukraine adapted the global MDGs at the national level in 2003.
This year marks a decade of progress towards the MDGs. The results have been uneven across all Goals and within regions and nations. Ukraine has reduced absolute poverty and has made progress in achieving the targets set for education, maternal health and child mortality. At the same time, the relative poverty rate remains unchanged and reducing gender inequality continues to be an area where progress needs to be achieved. While meeting the environmental Goal is proving to be a challenge, the rapid growth of HIV infections, the increase in AIDS-related mortality and the spread of tuberculosis also remain critical areas in reaching the MDGs.
While it is clear that these are challenging times for all countries, and in particular for Ukraine, achieving the MDGs is possible, given an adequate level of commitment, efforts and resources. Creating effective national policies and developing capacities and ownership are essential to further empowering the people in Ukraine and improving their standards of living.
There is a range of tried and tested policies that can help Ukraine reach its commitments. These policies include fostering inclusive economic growth, ensuring equal access to quality health and education and scaling up HIV/AIDS and tuberculosis interventions. Improving social protection targeting, increasing employment opportunities, fostering climate change mitigation and focusing on biodiversity conservation must continue to be regarded as absolute priorities.
Let us use the next five years to improve the lives of all.
OLIVIER ADAM UN RESIDENT COORDINATOR IN UKRAINE

MILLENNIUM DEVELOPMENT GOALS. UKRAINE – 20106
AIDS Acquired Immune Deficiency Syndrome
CIS Commonwealth of Independent States
CSR Civil Status Registration
DAC Development Assistance Committee (OECD)
DOTS Directly Observed Treatment Short Course (Tuberculosis)
EU European Union
CSW Commercial Sex Workers
GDP Gross Domestic Product
GEI General Educational Institution
HDI Human Development Index
HEI Higher Educational Institution
HIPC Heavily Indebted Poor Country
HIV Human Immunodeficiency Virus
ICF International Charitable Foundation
IDU Injecting Drug User
ILO International Labour Organization
MDGs Millennium Development Goals
MoH Ministry of Health of Ukraine
MSM Men Who Have Sex with Men
NAS National Academy of Sciences
NRF Natural Reserve Fund of Ukraine
ODA Official Development Assistance
OECD Organisation for Economic Co-opera-tion and Development
PIRLS Progress in International Reading Literacy Study
PISA Programme for International Student Assessment
PEI Preschool Educational Institution
PPP Purchasing Power Parity
STI Sexually Transmitted Infection
TB Tuberculosis
TIMSS Trends in International Mathematics and Science Study
UNAIDS United Nations Joint Programme on HIV/AIDS
UNDP United Nations Development Programme
UNFCCC United Nations Framework Convention on Climate Change
UNFPA United Nations Population Fund
UNICEF United Nations Children’s Fund
VEI Vocational Educational Institution
WHO World Health Organization
WTO World Trade Organization
ACRONYMS AND AbbREVIATIONS
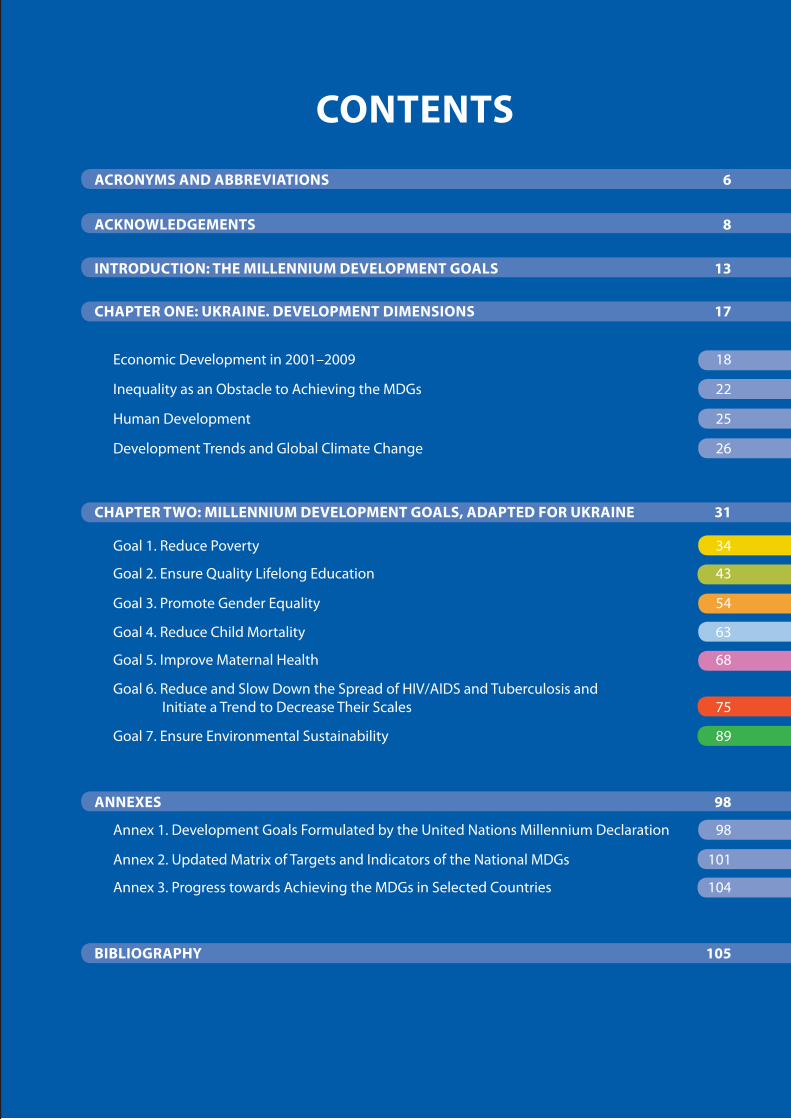
CONTENTS
ACRONYMS AND AbbREVIATIONS 6
ACKNOwLEDGEMENTS 8
INTRODUCTION: THE MILLENNIUM DEVELOPMENT GOALS 13
CHAPTER ONE: UKRAINE. DEVELOPMENT DIMENSIONS 17
Economic Development in 2001–2009 18
Inequality as an Obstacle to Achieving the MDGs 22
Human Development 25
Development Trends and Global Climate Change 26
CHAPTER TwO: MILLENNIUM DEVELOPMENT GOALS, ADAPTED FOR UKRAINE 31
Goal 1. Reduce Poverty 34
Goal 2. Ensure Quality Lifelong Education 43
Goal 3. Promote Gender Equality 54
Goal 4. Reduce Child Mortality 63
Goal 5. Improve Maternal Health 68
Goal 6. Reduce and Slow Down the Spread of HIV/AIDS and Tuberculosis and Initiate a Trend to Decrease Their Scales 75
Goal 7. Ensure Environmental Sustainability 89
ANNExES 98
Annex 1. Development Goals Formulated by the United Nations Millennium Declaration 98
Annex 2. Updated Matrix of Targets and Indicators of the National MDGs 101
Annex 3. Progress towards Achieving the MDGs in Selected Countries 104
bIbLIOGRAPHY 105
MILLENNIUM DEVELOPMENT GOALS. UKRAINE – 20108
Tuya Altangerel, Policy Specialist, MDG Support Team, Poverty Group, Bureau of Development Policy, UNDP
Victoria Andreevska, Communications Officer, United Nations in Ukraine
Lidia Andruschak, Social Mobilization and Part-nership Advisor, UNAIDS Ukraine
Natalia Astapova, Social Policy and Monitoring Officer, UNICEF Ukraine
ACKNOwLEDGEMENTS
The National Report, Millennium Development Goals. Ukraine – 2010 was prepared by a Working Group established by Order of the Minister of Economy of Ukraine. The general coordination of the preparation of this Report was led by Iryna Kryuchkova, Deputy Minister of Economy of Ukraine; Ella Libanova, Director of the Institute for Demography and Social Studies and Academician of the National Academy of Sciences of Ukraine; Lyudmyla Musina, Consultant to the Minister of Economy of Ukraine; Oleksander Savenko, Head of the Department for Social and Humanitarian Development, Ministry of Economy of Ukraine; and Natalia Sitnikova, Project Manager, Millennium Development Goals – Ukraine Project, UNDP Ukraine.
This Report includes comments and proposals received during expert and public discussions. It is also based on the outcomes of intensive discussions among Government officials, scientists, representatives of international development organisations, non-governmental organisations and the private sector The following experts contributed largely to its preparation: Larysa bochkova, Head of the Monitoring Unit of the Ukrainian Centre for AIDS Prevention; Tatiana bolila, Specialist, Millennium Development Goals – Ukraine Project, UNDP Ukraine; Lyudmyla Cherenko, Head of the Division for Studies of Population Living Standards, Institute for Demography and Social Studies, National Academy of Sciences of Ukraine; Nadia Dmytrenko, Deputy Head of the Department for Social and Humanitarian Development and Head of the Unit for Social Standards and Reforms, Ministry of Economy of Ukraine; Hanna Herasymenko, Senior Research Fellow, Institute for Demography and Social Studies, National Academy of Sciences of Ukraine; Yevhenia Kalishenko, Associate, Millennium Development Goals – Ukraine Project, UNDP Ukraine; Olga Karmazyna, Head of Division, Department for Statistics of Services, State Statistics Committee of Ukraine; Joanna Kazana–wisniowiecka, UNDP Deputy Resident Representative; Yevhen Khlobystov, Head of the Division for Sustainable Development and Ecological Security, Council for Productive Forces of Ukraine, National Academy of Sciences of Ukraine; Oksana Khmelevska, Senior Research Fellow, Department of Social Policy, Institute for Demography and Social Studies, National Academy of Sciences of Ukraine; Yuriy Kobyshcha, Technical Officer, STI/HIV/AIDS Strategic Information, WHO Office in Ukraine; Olena Makarova, Deputy Director, Institute for Demography and Social Studies, National Academy of Sciences of Ukraine; Anatoliy Maksyuta, First Deputy Minister of Economy of Ukraine; Valeriy Muntian, Deputy Minister of Economy of Ukraine; Pavlo Onyshchenko, Head of the Department for Strategic Planning, Ministry of Economy of Ukraine; Oksana Ovcharuk, Expert, UNDP Ukraine; Ricarda Rieger, UNDP Country Director; Katerina Rybalchenko, Senior Programme Manager, UNDP Ukraine; Natalia Rynhach, Leading Research Fellow, Institute for Demography and Social Studies, National Academy of Sciences of Ukraine; Ani Shakarishvili, Coordinator, UNAIDS Ukraine; Olena Sherstyuk, Child Development Officer, UNICEF Ukraine; Oleksiy Stelmakh, Head of the Division of Humanitarian Development, Department for Social and Humanitarian Development, Ministry of Economy of Ukraine; Natalia Vlasenko, Deputy Head of the State Statistics Committee of Ukraine; and Andriy Volkov, Head of the Sustainable Development Division, Department for Social and Humanitarian Development, Ministry of Economy of Ukraine.
We would like to express our sincere gratitude to the specialists who participated in activities of the Working Group. The following people made significant contributions to the preparation of this Report:

ACKNOWLEDGEMENTS 9
Olga balakireva, Head of Division for Monitoring Studies of Socio-Economic Transformation, In-stitute for Economics and Forecasting, Nation-al Academy of Sciences of Ukraine
Inna barchuk, Consultant, Millennium Develop-ment Goals – Ukraine Project, UNDP Ukraine
Natalia bielkina, Head of the Division for Special-ized Agencies and Functional Commissions, Department of the United Nations and Other International Organisations, Ministry of For-eign Affairs of Ukraine
Oksana biletska, Head of the Division for Analy-sis and Forecasting of Social and Cultural De-velopment of Regions, Ministry of Culture and Tourism of Ukraine
Kim boermans, Programme Analyst Poverty Re-duction, UNDP Europe and the CIS, Bratislava Regional Centre
Interna bondar, Chief Research Fellow, Division for Strategic Planning, Forecasting, Regulation of Economic and State Target Programmes, Scientific and Research Economic Institute, Ministry of Economy of Ukraine
Olena Chumakova, Chief Specialist, Division for Humanitarian Development, Department for Social and Humanitarian Development, Minis-try of Economy of Ukraine
Alexander Domaranskiy, Deputy Head of Secre-tariat, Committee on Education and Science, Parliament of Ukraine
Ruslan Doroshkevych, Deputy Head of Depart-ment of Financial Policy, Head of Division of Pension Policy and Wages, Administration of the President of Ukraine
Yuriy Feshchenko, Chief Tuberculosis Special-ist and Pulmonologist, Ministry of Health of Ukraine
Natalia Gahovych, Research Fellow, Institute for Economics and Forecasting, National Acad-emy of Sciences of Ukraine
Yulia Galustyan, Leading Research Fellow, Insti-tute for Economics and Forecasting, National Academy of Sciences of Ukraine
Valentyn Garaschenko, Chief Specialist of Di-vision for Preventing Negative Phenomena Among Youth, Ministry of Ukraine for Family, Youth and Sports
Valeriy Gladkiy, General Director, Analytical Cen-tre BEST
Halyna Goleusova, Head of the Social Security Department, Federation of Trade Unions of Ukraine
Vasyl Golovinov, Chief Consultant of the Com-mittee of Education and Sciences, Parliament of Ukraine
Igor Gorbasenko, Head of the Board, Internation-al Association of Journalists ‘Health without Borders’
Vladimir Gordeiko, Project Manager, Governance of HIV/AIDS Project, UNDP Ukraine
Nataliya Gorshkova, Head of the Macroeco-nomics Department, Ministry of Economy of Ukraine
Paola Gosset, EditorRoo Griffiths, EditorSergiy Grytsenko, Communications Officer,
UNDP UkraineSerhiy Gubin, Director of the National Press Club
‘Ukrainian Perspective’Nadiya Gryhorovych, Head of the Department
for Labour Statistics, State Statistics Commit-tee of Ukraine
Oksana Guziy, Chief Specialist of the Division for Promoting Gender Equality and Combat-ing Human Trafficking, Ministry of Ukraine for Family, Youth and Sports
Barbara Hall, Consultant EditorOlena Heylo, Technical Officer, TB Control Pro-
gramme, WHO Office in UkraineBalazs Horvath, Regional Poverty Reduction
Practice Leader for Eastern Europe and Central Asia, UNDP Bratislava Regional Centre
Anna Ilchenko, Chief Specialist of Division for Sustainable Development, Ministry of Econo-my of Ukraine
Tatyana Ivanenko, Deputy Director of Depart-ment of Promotion of Youth Development, Ministry of Ukraine for Family, Youth and Sports
Irina Kalachova, Head of Department of Services Statistics, State Statistics Committee of Ukraine
Ivanna Karabyts, Chief Specialist of Division of Analysis and Forecasting of Social and Cultural Development of Regions, Ministry of Culture and Tourism of Ukraine
Andriy Klepikov, Executive Director, ICF ‘Interna-tional HIV/AIDS Alliance in Ukraine’
Antonyna Klymenko, Head of the Department for Social and Economic Protection, Trade Un-ion of Education and Science Employees of Ukraine
Larysa Kobelyanska, Project Manager, Equal Op-portunities and Women’s Rights Programme, UNDP Ukraine
Victor Kolomiyets, Programme Manager, UNFPA Ukraine
Maria Korenyako, Expert, World Bank Office Ukraine
Sergiy Kondryuk, Deputy Chairman, Federation of Trade Unions of Ukraine
MILLENNIUM DEVELOPMENT GOALS. UKRAINE – 201010
Tatiana Kovalova, Chief Specialist of the Division of Social Standards and Reform, Ministry of Economy of Ukraine
Natalia Kozlova, Deputy Head of the Division of Humanitarian Development, Department for Social and Humanitarian Development, Minis-try of Economy of Ukraine
Genadiy Kulikov, Chief Research Fellow, Division of Social and Economic Issues, Institute for Eco-nomics and Forecasting, National Academy of Sciences of Ukraine
Irina Kurylo, Head of the Division of Demograph-ic Processes Quality, Institute for Demography and Social Research, National Academy of Sci-ences of Ukraine
Ella Lamah, Head of the Department of Family and Gender Policy and Organisation of Health Care, Ministry of Ukraine for Family, Youth and Sports
Valentyna Latik, Head of the Department of So-cial Strategy Development, Ministry of Labour and Social Policy of Ukraine
Vytaliy Lehkov, Chief Specialist, Federation of Trade Unions of Ukraine
Roman Levin, Senior Research Fellow, Institute for Economics and Forecasting, National Acad-emy of Sciences of Ukraine
Klavdia Maksimenko, Programme Manager Advi-sor, UNDP Ukraine
Igor Mantsurov, Director, Scientific and Research Economic Institute of the Ministry of Economy of Ukraine
Olga Martynyuk, Chief Specialist, Department of Agriculture and Environment Statistics, State Statistics Committee of Ukraine
Vasyl Melnyk, Head of the Division of Epidemio-logical and Organisational Problems of Phtisi-opulmonology, National Institute of Tubercu-losis and Pulmonology of F. Yanovsky
Jock Mendoza-wilson, Director of International and Investor Relations, System Capital Manage-ment, Head of the Organisational Committee of Global Compact (2006–2009, 2010–2011)
Vladimir Mikhalev, Policy Advisor, UNDP Bratis-lava Regional Centre
Koh Miyaoi, Gender Team, Practice Leader for Eastern Europe and Central Asia, UNDP Bratis-lava Regional Centre
Inna Motrych, Head of the Division for Monitor-ing of Anti-Tuberculosis Activities, Ukrainian Centre for Tuberculosis Control, Ministry of Health of Ukraine
Valentyna Nidzelska, Head of the Department of State Education Standards, Kyiv Business Lyceum
Natalia Nizova, Director, Ukrainian Centre for AIDS Prevention, Ministry of Health of Ukraine
John O’brien, Regional Technical Advisor, UNDP Bratislava Regional Centre
Anna Olefir, Education Economist, World Bank Office in Ukraine
Natalia Orlovska, Head of the Division for Family and Demographic Policy, Ministry of Ukraine for Family, Youth and Sports
Olena Osinkina, Senior Expert, Analytical Centre BEST
Inna Osypova, Head of the Department of Household Survey, State Statistics Committee of Ukraine
Olena Ovchynnikova, Executive Associate to the United Nations Resident Coordinator and UNDP Resident Representative
Valentyna Pedan, Deputy Director, Department of Motherhood, Childhood and Sanatorium Care, Ministry of Health of Ukraine
Vladyslava Pekarska, Intern, UNDP UkraineNatalia Petelyna, Chief Specialist, State Social
Service, Ministry of Ukraine for Family, Youth and Sports
Natalia Pidlisna, Executive Director, Coalition of HIV Service Organisations
Vadym Pishcheyko, First Deputy Head, State Sta-tistics Committee of Ukraine
Igor Pokanevych, Head, WHO Office in UkraineOleksander Polusmyak, Head of Division for
Analysis and Forecasting of Educational In-stitutions, Ministry of Culture and Tourism of Ukraine
Olga Popova, Leading Research Fellow, Institute for Economics and Forecasting, National Acad-emy of Sciences of Ukraine
Vyacheslav Potapenko, Consultant to the Mem-ber of the Parliament of Ukraine
Olga Prokhorenko, Specialist on Gender Issues, Department for Family and Gender Policy, Min-istry of Ukraine for Family, Youth and Sports
Oleg Prokopenko, Head of Department for Ag-ricultural and Environmental Statistics, State Statistics Committee of Ukraine
Natalia Protasova, Head of Education De-partment, National Academy of Public Administration
Mykola Puzyrin, Head of the Department of Protection of Labour and Environment, Chief Technical Inspector of Labour, Federation of Trade Unions of Ukraine
Nina Pydluzhna, Deputy Director of Department of Social Development, Ministry of Labour and Social Policy of Ukraine
ACKNOWLEDGEMENTS 11
Bogdan Pydverbytskiy, Head of Division for Neg-ative Phenomena Prevention among Youth, Ministry of Ukraine for Family, Youth and Sports
Olga Rodenko, Chief Specialist of the Division for Family and Demographic Policy, Department for Family and Gender Policy and Organisa-tion of Health Recovery, Ministry of Ukraine for Family, Youth and Sports
Mykhailo Rohozha, Head of the Division for Hu-manitarian Education, Department of Higher Education, Ministry of Education and Science of Ukraine
Vytaliy Rudenko, Chairman, Public Movement ‘Ukrainians against TB’ Foundation
Olga Sakalska, Head of Department for Socially Dangerous Diseases, Committee to Counter HIV/AIDS and Other Socially Dangerous Dis-eases, Ministry of Health of Ukraine
Olena Sakovych, Youth and Adolescent Develop-ment Officer, UNICEF Ukraine
Inna Samchenko, Deputy Director, Department for Statistics of Services, State Statistics Com-mittee of Ukraine
Serhiy Savchuk, First Secretary of the Depart-ment of the UN and other International Organi-sations, Ministry of Foreign Affairs of Ukraine
Shombi Sharp, Regional HIV/AIDS Practice Lead-er, Europe and the CIS, UNDP
Yuliya Shcherbinina, Public-Private Partnership Officer, United Nations in Ukraine
Lubov Shnerenko, Head of the Department for Development of Entities of Social Work in the Regions, State Social Service for Family, Chil-dren and Youth, Ministry of Ukraine for Family, Youth and Sports
Natalia Shumar, Chief Consultant of the Commit-tee on Education and Science, Parliament of Ukraine
Ihor Shumylo, Executive Director on Economic Is-sues, National Bank of Ukraine
Ben Slay, Senior Economist, UNDP Bratislava Re-gional Centre
Oleksiy Slenzak, Senior Project Coordinator in Environmental Protection, World Bank Office in Ukraine
Oksana Smetanyna, Director, Ukrainian Centre for Tuberculosis Control, Ministry of Health of Ukraine
Nina Solomatina, Head of the Department for Economic Protection, Federation of Trade Un-ions of Ukraine
Svitlana Spesyva-Ukhova, Deputy Director of the Department for Household Budget Sur-veys, State Statistics Committee of Ukraine
Lyudmyla Storozhuk, Deputy Director, Ukrainian Centre for AIDS Prevention, Ministry of Health of Ukraine
Anatoliy Stovbun, Chief Specialist, Technical In-spector of Labour, Federation of Trade Unions of Ukraine
Denis Strekozov, Head of Division of Analysis and Planning of Strategic Development Adminis-tration and Economics of Management of Na-ture, Ministry for Environmental Protection of Ukraine
Olena Suslova, Coordinator on Gender Issues, Parliament Development Project
Yuliya Svavolya, UN Coordination Analyst, UN Of-fice in Ukraine
Marcin Swiecicki, Director, EU/UNDP Blue Ribbon Analytical and Advisory Centre
Viktoria Syryachenko, Country Officer, World Bank Office Ukraine
Tatiana Tarasova, HIV/AIDS Officer, UNICEF in Ukraine
Dudley Tarlton, Regional HIV/AIDS Programme Advisor, Europe and the CIS, UNDP
Georgiy Truhanov, Deputy Head of the Central Committee, Trade Union of Education and Sci-ence Employees of Ukraine
Lyudmyla Udova, Senior Research Fellow, Insti-tute for Economics and Forecasting, National Academy of Sciences of Ukraine
Olga Varetska, Head of the Division for Moni-toring and Evaluation, ICF ‘International HIV/AIDS Alliance in Ukraine’
Sergiy Volkov, Senior Programme Manager, UNDP Ukraine
Valeriya Voytenko, Deputy Head of the Division of Macroeconomic Forecasting, Ministry of Economy of Ukraine
Tetyana Yasko, Head, All-Ukrainian Trade Union of Workers and Entrepreneurs in Trade, Cater-ing and Services
Natalia Zabolotna, Chief Specialist of the Division for Economic Analysis, Ministry of Economy of Ukraine
Lubov Zadoyenko, Head of the Division for De-mographic Statistics, State Statistics Commit-tee of Ukraine
Alexandra Zayarna, Sustainability Manager, Sys-tem Capital Management
Paola Zhorzhat, Specialist in Gender Policy for Eastern Europe and Central Asia, UNDP Bratis-lava Regional Centre
Volodymyr Zhovtyak, Head, All-Ukrainian Net-work of People Living with HIV/AIDS
Igor Zhylyayev, Deputy Director of the Commit-tee Secretariat, Committee on Education and Science, Parliament of Ukraine


INTRODUCTION:
THE MILLENNIUM DEVELOPMENT GOALS
MILLENNIUM DEVELOPMENT GOALS. UKRAINE – 201014
The United Nations Millennium Declaration, adopted by 189 countries at the United Nations General Assembly session in 2000, initiat-ed the process towards achieving the Millennium Development Goals (MDGs) by 2015. These Goals were set by the world community to ad-dress the starkest inequalities in global human development. The Goals include reducing hun-ger and poverty, achieving access to education, promoting gender equality, reducing maternal and child mortality, slowing down the spread of HIV/AIDS and other infectious diseases, ensuring environmental sustainability and harmonizing foreign aid to developing countries.
The internationally agreed framework of the MDGs contains eight Goals, 21 targets and 60 in-dicators to measure progress. The MDGs are a set of time-bound, quantitative targets represent-ing a common vision for development. To help track progress on the commitments made in the Millennium Declaration, international and na-tional statistical experts selected relevant indica-tors to be used to assess progress over the period from 1990–2015. In 2007, the MDG monitoring framework was revised to include new targets agreed by member states at the 2005 World Summit and recommended in 2006 by the United Nations Secretary-General.
In close collaboration with agencies and organi-sations within and outside the United Nations system, the United Nations Statistics Division co-ordinates data analysis to assess progress made towards the MDGs and maintains the database containing data related to the selected indica-tors, as well as other background data intended to supplement these. National statistics services provide information to the international statis-tics system after checking its accuracy to ensure comparability. When national statistics services do not provide updated data on time, or do not produce the data required for an assessment of progress on the indicators, authorized agencies make estimates based on the data available on re-lated variables or by using other methodologies. Since periodic assessment of progress towards the MDGs began, the international statistical community has been concerned about the lack of adequate data in many parts of the developing world to assess progress on the MDG indicators. At the same time, the monitoring requirements
themselves have helped focus attention on this shortcoming and have raised awareness on the urgency of launching initiatives for statistical capacity building. The official list of MDG indica-tors, effective as of 15 January 2008, is provided in Annex 1.
United Nations reports on progress towards achieving the MDGs are published annually and contain analysis of actual statistical data for all re-gions of the world, allowing for an understanding of how humanity is moving towards achieving these Goals. The reports also present estimated achievements on a world scale and trends in spe-cific regions.
In 2000, the United Nations Millennium Declara-tion set Goals to be achieved by 2015. Two-thirds of this time has passed. What are the results of this consolidated effort? In 2010, the United Nations Summit on the Millennium Develop-ment Goals – a High-Level Plenary Meeting of the General Assembly – will bring together world leaders to review progress, identify gaps and commit to a specific action agenda to achieve the MDGs and internationally agreed develop-ment targets. Heads of states and governments, together with leaders of civil society, foundations and business, are expected to announce new ini-tiatives to accelerate progress.
In preparation for the Summit, at which Ukraine’s progress is to be presented, the Ministry of Economy of Ukraine, in cooperation with the UNDP Millennium Development Goals – Ukraine Project, reviewed the national MDGs and elabo-rated an updated system of targets and indica-tors, taking into account the specifics of national development in a post-crisis period and current challenges in global development. This proc-ess involved more than 100 representatives of Government institutions, think-tanks, United Nations agencies, international organisations, the Federation of Trade Unions of Ukraine and civil society organisations. It resulted in the new National Report, Millennium Development Goals. Ukraine – 2010. In this process, efforts were made to analyse policy implications in various domains and to generate the updated targets for the G overnment until 2015. These will be used in go-vernmental policy documents as a medium-term perspective.

INTRODUCTION: MILLENIUM DEVELOPMENT GOALS 15
The overall objectives of this Report are to: (1) raise the public’s awareness of the importance of the MDGs and their linkages to their liveli-hoods and those of future generations; (2) inform Government institutions, civil society and the pub-lic on how the MDGs can inform their activities; (3) link the MDGs and strategic planning processes by ensuring that indicators and national targets are integrated into strategic planning documents; (4) facilitate debates between national and inter-national communities on future development; (5) emphasize to the Government, civil society and the business community the necessity of specific actions aimed at achieving the MDGs (first of all on poverty alleviation); and (6) strengthen coor-dination and collaboration between Government institutions, civil society organisations and the business community to achieve sustainable hu-man development.
To achieve the MDGs, it is important to consoli-date the efforts of the three components of so-ciety – Government, business and the public. Establishing partnerships between Government and business and increasing dialogue between the state and society are key to this. These rela-tionships are based on the following principles: the state assumes responsibility for achieving the MDGs, improving the population’s living stand-ards and ensuring social protection and, as a re-sult, obtains legitimacy and public support; the
state guarantees property rights, a favourable business climate and the promotion of business, in compliance with state-established rules and regulations; and a balance between society and capital is created, on the principle of ‘honest busi-ness – supporting its interests and actions by society.’
Effective cooperation between social partners – the state, employers, trade unions and the pub-lic – and an optimal balance and division of re-sponsibilities between the state, business and communities should accelerate human develop-ment. Efforts should take into account challenges related to the MDGs, global development, en-gagement of domestic businesses in European markets, cooperation with foreign investors and growing competition in the global market. Cor-porate social responsibility – as the active en-gagement of entrepreneurs, using their experi-ence and knowledge, in socio-economic policy development – is a key to this. This requires com-pliance with generally accepted world standards on social responsibility, transparency and willing-ness to be accountable to the community. Creating mechanisms for achieving consensus between the Government, business and civil so-ciety should help ensure implementation of the MDGs and necessary reforms in Ukraine.


CHAPTER ONE
UKRAINE: DEVELOPMENT DIMENSIONS

MILLENNIUM DEVELOPMENT GOALS. UKRAINE – 201018
This chapter presents an analysis of the social and economic development of Ukraine in 2000–2009. It reviews economic development trends, inequality issues, challenges of global climate change and hu-man development in the country.
Economic Development in 2000–2009
In 2000–2007, Ukraine demonstrated rapid eco-nomic growth – at an average of 7.5 percent per year (Figure 1).
Economic growth was supported by positive changes and reforms in domestic economic policy and was influenced by: (1) a significant increase in domestic consumer demand, based
on a stable increase in household incomes and dynamic growth in the availability of consum-er credits; (2) a significant increase in exports, stimulated by global and regional economic growth; and (3) relatively strong investment demand.
As a result, during 2000–2007, the gross domestic product (GDP) of Ukraine increased cumulatively by almost 77.7 percent and labour productivity by almost 72 percent, which in general surpassed the growth figures of developed countries.
However, as with any economic system that starts its recovery after a long period of sharp decline, growth was mainly extensive. First of all, production capacities expanded, which sta-tistically distorted (increased) indicators of la-bour and capital productivity. The significant
‐14.2
‐22.9‐12.2
‐10.0
‐3.0
‐1.9
‐ 0.2
5.9
9.2
5.2
9.6
12.1
2.7
7.3
7.9
2.3
‐15.1
‐25.0 ‐20.0 ‐15.0 ‐10.0 ‐5.0
1993
1994
1995
1996
1997
1998
1999
2000
2001
2002
2003
2004
2005
2006
2007
2008
2009
0.0 5.0 10.0 15.0
Figure 1. Real GDP Growth, 1993–2009, %

CHAPTER ONE. UKRAINE: DEVELOPMENT DIMENSIONS 19
initial depreciation of the national currency and declining unit labour costs increased the price competitiveness of Ukrainian production. Accel-erated labour productivity growth was not ac-companied by processes common to developed countries, whereby a change in development dynamics is possible as a result of new high technologies being introduced into production, i.e. growth depends on scientific and technical advancement.
Box 1. According to the International Labour Organization (ILO) data, labour productivity in Ukraine (based on GDP in purchasing power parity (PPP)) was US $ 10,900 in 2007, compared to US $ 63,800 in the United States, US $ 54,900 in France, US $ 42,600 in Germany and US $17,900 in the Russian Federation.
In addition, some structural changes took place in Ukraine during the pre-crisis period; and the share of the services sector in the economy increased (to 22.8 percent in 2007 against 17.2 percent in 2001). However, these changes were not guided by a consistent strategic policy framework.
Overall, these trends – a decrease in the share of the industrial sector and an increase in the share of the services sector in gross output – fully corre-spond with global economic trends in transition-al economies. The national economy structure gradually transforms into a structure like those in highly developed countries, in which the services sector plays a dominant role. However, some im-balances are observed in the development of the service sector.
Trade demonstrated extremely high growth rates during 2001–2007 (15 percent on average dur-ing the period), which significantly exceeded GDP growth rates (7.5 percent). This led to an in-crease in the share of trade in both GDP and the gross value-added of the services sector.
Increased output volumes of industry and trade, increased incomes and growth in housing con-struction and mortgage credits stimulated the development of economic activities in the real estate sector, including leasing (residential and non-residential). As a result, growth rates for real estate transactions, leasing, engineering and serv-ices provision to entrepreneurs also exceeded av-
erage GDP growth and amounted to 116 percent during the period.
The financial sector also had a significant impact on the development of the services sector and on the economy in general. The growth rates of the financial services sector amounted to, on aver-age, 123 percent during the period, whereas its share in GDP increased to 5.9 percent in 2007, against 2.6 percent in 2001. This can be explained by factors on both the supply side (active entry of foreign banks into the domestic market, pursuing aggressive policies to gain a market share) and the demand side (the rise of a consumer class, which actively started to improve its own hous-ing and living conditions through access to credit schemes).
During this period, the industry sector also de-veloped rapidly, owing to a favourable foreign economic business environment and growth in consumer credits, which supported an increase in both domestic and foreign demand for industrial goods. However, growth in this sector was not characterized by modernization and restructur-ing. Other factors, such as the price of imported natural gas, influenced industry dynamics dur-ing 2005–2007. The price of natural gas influ-enced prices in the manufacturing industries that depend most on natural gas.
Increased production averaged 9.5 percent as a result of both restrictive and stimulating factors, whereas the share of industry in GDP remained almost unchanged, at 27.1–27.5 percent during 2001–2007. Here, some disparity within sub-sec-tors remained, owing to a lack of investment and innovation programmes to modernize manufac-turing. Raw material industries and industries with low levels of processing technology pre-vailed. These industries made up Ukraine’s main exports. At the same time, industries focused on the domestic market gradually decreased their market share, leaving space for imported goods. In particular, the technological structure of pro-duction in Ukraine during this period differed significantly from that of developed economies, where sectors with a high share of intermedi-ate consumption and with low value-added do not influence on the macroeconomic situation significantly.

MILLENNIUM DEVELOPMENT GOALS. UKRAINE – 201020
In sum, Ukraine’s economic development in 2000–2007 was influenced by a combination of factors. On the one hand were some positive economic trends, caused by a favourable foreign business environment. On the other hand, given that man-ufacturing did not undergo modernization and reconstruction during the period of growth, all changes were spontaneous and caused by mar-ket-determined factors. Therefore, Ukraine did not capitalize on nine years of GDP growth by re-structuring and modernizing its industry.
As a result, abrupt changes in development trends emerged in August 2008. Most Ukrainian export-ers lost their foreign sales markets as a result of the decline in world demand for Ukrainian goods and the abrupt decline in prices of raw materi-als. For the first time since 2000, a rapid decline in the manufacturing volumes of export-oriented industries was observed.
Data from September to December 2008, com-pared with those of the corresponding period of 2007, show a significant rate of decline in the production of leading industries. Through the chain of inter-industry relationships, this caused a decline in the production of coke and oil process-ing products and in the extraction of mineral re-sources (Table 1 and Figure 2).
The effects of the abrupt decline in production were observed at the end of 2008, with recovery and a return to previous production levels likely to be a complex process.
Ukraine’s abrupt industrial slowdown resulted not only from declining demand in foreign mar-
kets but also from deterioration in the foreign business environment.
The decrease in metallurgical production was also caused by a significant decrease in domestic demand, first of all by major consumers of metal-lurgical products, such as in the machinery build-ing and construction sectors. However, negative trends were observed not only in the manufactur-ing sector but also in other areas of the economy, particularly in services and trade, which serve as indicators of business activity. The number of pri-vate deposits decreased, as did the nominal vol-ume of credits provided to both legal entities and private persons. The situation in the banking sec-tor worsened under currency destabilization.
The global economic crisis, which started in 2008 and spread to Ukraine, highlighted structural de-ficiencies within the national economy and re-vealed the risk of relying mainly on the export of raw materials. The decline in the banking sector, which was unable to mitigate the effects of the economic crisis when national producers were in extreme need of financial resources, was an addi-tional factor that stimulated a decline in industry and other types of economic activity.
As such, it seems that industry was highly de-pendent on the global business environment. The sector’s performance in 2008–2009 (a decline by 26.0 percent, including 21.9 percent in 2009 and 5.2 percent in 2008) was caused by accumulated systemic shortcomings. The sector’s growth had led to the development of closely related types of economic activity, mainly wholesale trade and transport, which later suffered significantly from a
Table 1. Rate of Decline in Industrial Production, September–December 2008, %
IndustrySeptember October November December
2008 against 2007, month to month
Metallurgy –20.7 –39.9 –52.3 –44.4
Chemical and petrochemical industries
–6.0 –22.6 –33.7 –36.7
Production of coke and oil-refining products
–20.7 –40.9 –11.8 –5.2
Mining operations (except production of fuel and energy)
–10.2 –28.3 –55.2 –42.3
Industry overall –5.2 –19.9 –31.0 –28.0

CHAPTER ONE. UKRAINE: DEVELOPMENT DIMENSIONS 21
decrease in output in 2009 (16.9 percent and 9.3 percent, respectively).
As a consequence, the GDP declined by 15.1 per-cent, which was among the steepest in the world in 2009. (Growth slowed down in nine months of 2008 from 6.3–2.3 percent, i.e. the decline in the fourth quarter was 7.8 percent.)
A country’s progressive and dynamic develop-ment should rely on inclusive economic growth,
giving greatest consideration to the population’s needs and interests. It should also fully consider the population’s incentives to engage in pro-ductive labour activities, to help people realize their own potential as well as obtaining decent remuneration for their labour. Reforms are only successful when their objectives and tasks are aligned with the population’s interests and ex-pectations.
Figure 2. Annual Rates of Decline in Industrial Output, 2009, %
Source: State Statistics Committee, Eurostat, National Statistics Services publications.
Figure 3. GDP Growth Rates for Selected Countries, 2009, %
Source: State Statistics Committee, Eurostat.
United States
Poland
Romania
United Kingdom
Russia
EU-27
Lithuania
Latvia
Spain
Germany
Hungary
Sloveni
Bulgaria
Italy
Finland
Ukraine
Estonia
-15,8
-16,3
-17,4
-17,5
-18,2
-18,4
-21,2
-21,9
-25,9
-30 -25 -20 -15 -10 -5 0
-15,8
-14,6
-13,9
-10,8
-10,3
-5,9
Turkey-5,7
-3,6
-2,4
Sweden-17,9
Latvia
Ukraine
Estonia
Romania
Slovakia
Hungary
Germany
Japan
United Kingdom
Czech RepublicEU-27
Spain
United States
Norway
Poland
-20 -15 -10 -5 0 5
-18.0
-15.1
-14.1
-7.1
-4.7
-6.3
-4.9
-5.2
-4.9
-4.1
-4.2
-3.6
-2.6
-1.4
1.7
Lithuania
-14.8
MILLENNIUM DEVELOPMENT GOALS. UKRAINE – 201022
Inequality as an Obstacle to Achieving the MDGs
Since Ukraine achieved independence in 1991, its previously egalitarian society has been char-acterized by very high levels of inequality, which relates to incomes, access to basic social services (information, communications, education, health care, social services, etc), health status, life ex-pectancy, living conditions and quality of life and the access to labour market.
The modern interpretation of inequality assumes exclusion along not only economic but also so-cial, political and ethno-cultural lines. Different groups of the population can suffer from particu-lar types of inequality as a result of violations of their rights; however, the most critical is a com-bination of several types of inequality. Extremely negative and threatening phenomena, such as exclusion of population groups from public life (social exclusion), polarization and marginaliza-tion, occur as a result of the cumulative impacts of different types of inequality.
Within the context of the MDGs, the most obvi-ous form of inequality relates to Goal 1: Reduce Poverty, namely, income inequality, which is re-flected by the existence of poor and rich groups in the population. Income inequality deepens in-equality in relation to access to key social services (quality health care, education and housing) and resources (financial, particularly credit, land, etc) and to the exercise of fundamental rights in gen-eral (rights to health, life and security). At the same time, income inequality itself is a consequence of other types of inequality. In particular, children from poor families, who do not have sufficient ac-cess to quality education, more often live below the poverty line. Meanwhile, a significant number of those with higher education do not work in their area of specialization or work in unskilled jobs. From 1999, a stable direct correlation has been observed between education and income levels. This includes inequality in life expectancy owing to an inability to maintain a healthy life-style, lack of access to quality health care services and lack of a clean environment. Consequently, children from poor families have a higher risk of premature death or illness and fewer opportuni-ties to realize their potential.
High inequality and poverty levels cause social tension and conflicts and increases in crime. The consequences of these, particularly under con-ditions of political instability, are an increase in economic risks and decreased attractiveness of the country’s investment environment. This in-evitably slows down economic growth. On the other hand, inequality is an indicator not only of criminalization but also of corruption. Economic inequality is a barrier to democratic reforms.
Income inequality often causes macroeconomic instability. Significant inequality in the population is a factor of poverty, and requires a large-scale secondary redistribution of income through social transfers which, other things being equal, could af-fect the budget deficit and also inflation (which af-fects the income of poor groups of the population more strongly, exacerbating inequality).
Economic buoyancy caused significant – and quite positive – structural changes in terms of in-equality within the population: wage income has increased notably (from 20.9 percent in 1999 to 41.6 percent in 2008), as has income from entre-preneurial activities (from 2.4 percent to 7.9 per-cent). At the same time, income from unregistered economic activities, which reached 42.6 percent at transition, (more than wages, pensions and in-come from private subsidiary plots combined), is currently at only 17.9 percent. The importance of income from private subsidiary plots has not only significantly decreased but also now counters in-equality, since these remain a source of income predominantly for the poor population. The in-comes of the poor have approached those of the average population. However, the economic crisis of 2008 to 2009 had an impact on these structural changes.
Inequality in the context of Goal 2: Ensure Quality Lifelong Education deserves special at-tention. Quality education can be a major cush-ion against shocks and, at the same time, is an ex-tremely important factor in economic inequality. At present, socio-economic status is closely relat-ed to educational level in Ukraine: among people who have completed higher education, 11 per-cent are poor, 35 percent have an average income and 7.5 percent are rich; among those who have completed only general secondary education (i.e. without systematic professional training), 29 per-

CHAPTER ONE. UKRAINE: DEVELOPMENT DIMENSIONS 23
cent are poor, 18 percent have an average income and 2 percent are rich.
Higher education decreases the risk of poverty by 2.3 and increases the probability of obtaining an average income by 1.6. Also, it significantly in-fluences standards of living, particularly consumer behaviour. Furthermore, the share of people who save is higher among those with higher educa-tion – 14 percent against 6 percent of those with-out secondary education. Individuals with higher education spend a larger share of funds (even if limited) on educating their children; 90 percent of people with higher education construct houses with bank credit.
A direct relationship between educational level and competitiveness in the labour market is also observed in Ukraine. It is worth noting the sig-nificant impact of high levels of vocational and educational training on increased economic ac-tivity. Even at over 70 years of age, 3.4 percent of the population with higher education still work, compared with 0.5 percent of those with-out higher education. A higher level of education provides better opportunities in the labour mar-ket: only 4.5 percent of people with higher edu-cation are unemployed compared with 7.9 per-cent of people with incomplete higher education and 15.6 percent with secondary education. The share of employees and employers is directly proportional to educational level. There are three times more employers among those with com-pleted higher education than among those with secondary education.
Modern life is characterized by the rapid spread of advanced information and communication technologies in all spheres of life. They spread fastest among those who can access information-al resources. Since information resources are not decreased through sale or use, simplification of access to them could contribute towards solving one of the major problems of human develop-ment – overcoming inequality of access to differ-ent socio-economic and socio-cultural benefits. This would enable all members of society to ac-cess appropriate knowledge on their social and economic environment, rules of behaviour and healthy lifestyles and, finally, their rights.
With respect to Goal 3: Ensure Gender Equality, education also influences gender disparities in employment. Employment of women with sec-ondary education is significantly lower than that of men (after reaching retirement age, uneducat-ed women stop working completely). The situa-tion is less straightforward for people with higher education, at least those over 45 years of age. In addition, among people with higher education who leave the labour force at a later age, women of 65–69 years of age work more often than men of the same age, despite reaching the retirement age five years earlier.
Gender disparities in relation to the risk of unem-ployment differ according to the age group. Men over 50 are at significantly more risk of job loss than women of the same age group, although this is related to different retirement ages for men and women. Meanwhile, the gap between rural and urban populations in relation to unemploy-ment risks is generally wider. The high risk of un-employment among urban youth is caused by a lack of jobs for unskilled workers: a significant share of the urban population attends school and receives professional training up to 24 years of age, unlike the rural population, which enters the labour market significantly earlier.
Inequality also means unequal responsibilities. Some population groups and some individuals, for different reasons, feel more able to take re-sponsibility for their own lives and for the lives of their family and friends who largely depend on them. Others prefer to wait until their problems are resolved by others, mainly putting the onus on the authorities and the state.
Dissatisfaction with the results of economic trans-formation (particularly, with increased inequality) has not resulted in increased citizenship and has instead generated despair and feelings of futil-ity among certain population groups. This has re-sulted in a lack of motivation, most notably among youth. In January 2009, 35.1 percent of households interviewed during a state Household Budget Sur-vey (36.8 percent in 2007 data) felt that the state should be (fully or mostly) responsible for their well-being and only 9 percent thought that they themselves should ensure their own well-being. Three-quarters of the population aged 15–49 cited low income as the main reason for them postpon-
MILLENNIUM DEVELOPMENT GOALS. UKRAINE – 201024
ing having a child, but only 46 percent expressed the intention to make an effort to increase their in-come. Only 35 percent of the population thought that their life (fully or mostly) depended on them alone, and only 16 percent had adapted to the new life conditions.
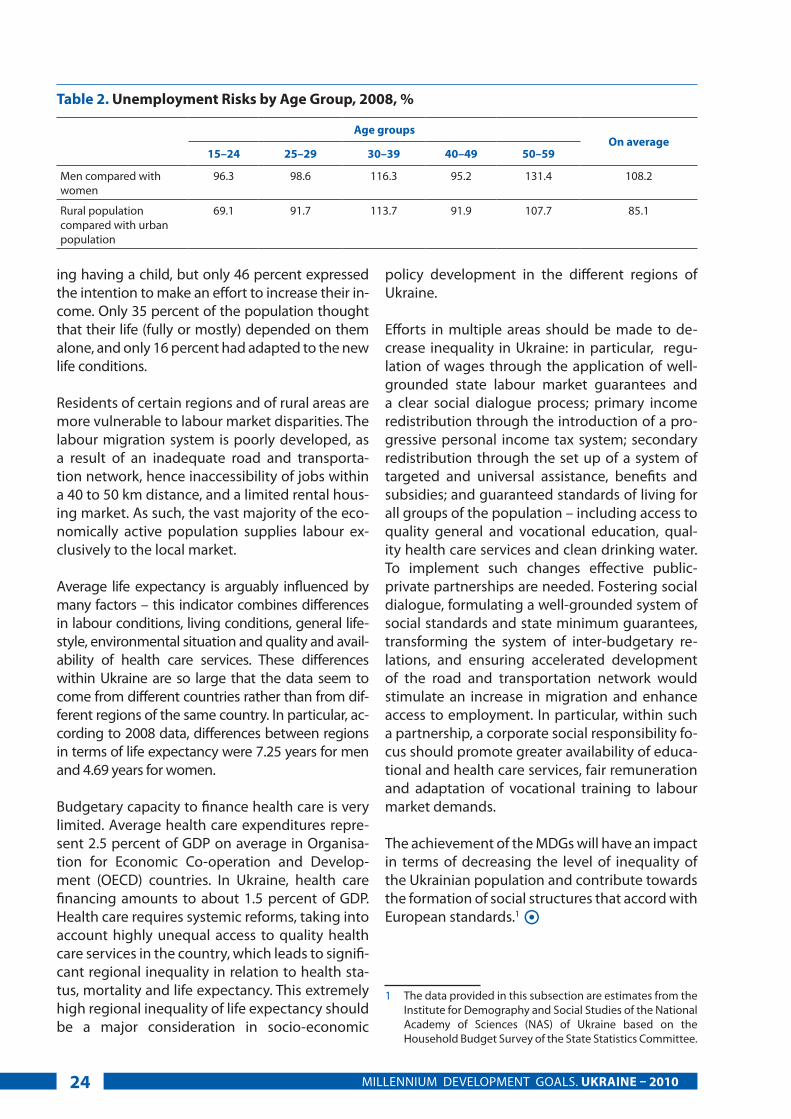
Residents of certain regions and of rural areas are more vulnerable to labour market disparities. The labour migration system is poorly developed, as a result of an inadequate road and transporta-tion network, hence inaccessibility of jobs within a 40 to 50 km distance, and a limited rental hous-ing market. As such, the vast majority of the eco-nomically active population supplies labour ex-clusively to the local market.
Average life expectancy is arguably influenced by many factors – this indicator combines differences in labour conditions, living conditions, general life-style, environmental situation and quality and avail-ability of health care services. These differences within Ukraine are so large that the data seem to come from different countries rather than from dif-ferent regions of the same country. In particular, ac-cording to 2008 data, differences between regions in terms of life expectancy were 7.25 years for men and 4.69 years for women.
Budgetary capacity to finance health care is very limited. Average health care expenditures repre-sent 2.5 percent of GDP on average in Organisa-tion for Economic Co-operation and Develop-ment (OECD) countries. In Ukraine, health care financing amounts to about 1.5 percent of GDP. Health care requires systemic reforms, taking into account highly unequal access to quality health care services in the country, which leads to signifi-cant regional inequality in relation to health sta-tus, mortality and life expectancy. This extremely high regional inequality of life expectancy should be a major consideration in socio-economic
policy development in the different regions of Ukraine.
Efforts in multiple areas should be made to de-crease inequality in Ukraine: in particular, regu-lation of wages through the application of well-grounded state labour market guarantees and a clear social dialogue process; primary income redistribution through the introduction of a pro-gressive personal income tax system; secondary redistribution through the set up of a system of targeted and universal assistance, benefits and subsidies; and guaranteed standards of living for all groups of the population – including access to quality general and vocational education, qual-ity health care services and clean drinking water. To implement such changes effective public-private partnerships are needed. Fostering social dialogue, formulating a well-grounded system of social standards and state minimum guarantees, transforming the system of inter-budgetary re-lations, and ensuring accelerated development of the road and transportation network would stimulate an increase in migration and enhance access to employment. In particular, within such a partnership, a corporate social responsibility fo-cus should promote greater availability of educa-tional and health care services, fair remuneration and adaptation of vocational training to labour market demands.
The achievement of the MDGs will have an impact in terms of decreasing the level of inequality of the Ukrainian population and contribute towards the formation of social structures that accord with European standards.1
1 The data provided in this subsection are estimates from the Institute for Demography and Social Studies of the National Academy of Sciences (NAS) of Ukraine based on the Household Budget Survey of the State Statistics Committee.
Table 2. Unemployment Risks by Age Group, 2008, %
Age groupsOn average
15–24 25–29 30–39 40–49 50–59
Men compared with women
96.3 98.6 116.3 95.2 131.4 108.2
Rural population compared with urban population
69.1 91.7 113.7 91.9 107.7 85.1

CHAPTER ONE. UKRAINE: DEVELOPMENT DIMENSIONS 25
Human Development
Human development is the major goal in the ef-fort to achieve social progress. It has three key objectives: the ability to live a long and healthy life; the ability to access knowledge and obtain an education; and the ability to enjoy decent living standards. The human development concept em-phasizes: (1) increased investment in education, health care, healthy lifestyle and proper vocation-al training to ensure people’s active participation in production and the fair distribution of benefits; (2) fairer distribution of income and wealth to ensure an economic foundation to develop the human potential of the less competitive groups of the population; (3) balancing of social expendi-tures to strengthen the economic foundation of the social sphere; and (4) strengthening individu-als’ abilities to make their own choices in political, social and economic spheres.
One of the main aspects of the human develop-ment concept is the introduction of measures to overcome poverty, unemployment, loss of health, etc, by stimulating human development, strengthening individuals’ role in society and en-hancing their capacity to make decisions on their
lives while increasing their responsibility for these decisions and for their implementation.
UNDP’s organisational framework for the intro-duction of the concept of human development into the public administration promoted social progress. UNDP Human Development Reports have been published in various languages since 1990 and have gone on to enhance and enrich our understanding of human development, mak-ing it possible to formulate new and promising approaches to the design of socio-economic policies.
In 1993, the Human Development Index (HDI) was first calculated for Ukraine (in the UNDP Human Development Report). In the first years, when Ukraine was first included in HDI calculations, it ranked 45th, and was placed in a group of coun-tries with high human development. Over time, though, the country’s global ranking decreased significantly and it ended up in the middle hu-man development group. In the 2009 Human Development Report, Ukraine ranked 85th on the HDI, having gone down nine positions from 2005, when it ranked 76th out of 177 countries.
Table 3. Human Development Index of Ukraine, 1993–2007, calculated by UNDP
Year of data calculation HDI of Ukraine world HDI
Ranking of Ukraine on the
HDI
Number of countries
Publication year of the UNDP Hu-
man Development Report
1990 0.809 – 45 173 1993
1995 0.756 0.772 102 174 1998
1997 0.721 0.706 91 174 1999
1998 0.744 0.712 78 174 2000
1999 0.742 0.716 74 162 2001
2000 0.754 0.722 80 173 2002
2001 0.766 0.722 75 175 2003
2002 0.777 0.729 70 177 2004
2003 0.766 0.741 78 177 2005
2004 0.774 0.741 77 177 2006
2005 0.783 0.743 76 177 2007/2008
2006 0.789 0.753 84 182 2009
2007 0.796 0.753 85 182 2009
Source: UNDP. Human Development Reports,1993–2009.

MILLENNIUM DEVELOPMENT GOALS. UKRAINE – 201026
Development Trends and Global Climate Change
Climate change is a critical issue in the 21st Cen-tury. Global climate change as a result of eco-nomic activities, according to scientific estimates, represents one of the most dangerous threats to the planet. The Fourth Assessment Report of the Intergovernmental Panel on Climate Change (2007) states: ‘Warming of the climate system is unequivocal. Most of the observed increase in global average temperatures since the mid-20th Century is very likely due to the observed increase in anthropogenic greenhouse gas concentrations.’
A Survey on Climate Change Perceptions in Ukraine was conducted under the aegis of the United Nations in 2009. The vast majority of ex-perts participating in the survey associated glo-bal climate change with serious risks for both hu-manity in general, and Ukraine in particular.
Risks mentioned in the survey can be divided into natural, economic and socio-political. The natural risks are: (1) shifts in climatic zones, weather in-stability (high temperature fluctuations in short periods of time) and general changes in the en-vironmental conditions of living organisms; (2) decreases in biodiversity; (3) deterioration in the health of living organisms, including humans (particularly increases in cancer); (4) mutagenesis of all living creatures, primarily bacteria, mush-rooms and viruses; (5) flooding of large areas of dry land and onset of dangerous geological proc-esses, particularly abrasion, shifts and satura-
tions; (6) desertification; (7) lack of drinking water (particularly in the eastern and southern regions of Ukraine); and (8) increased number of natural disasters (including forest fires, floods and land-slides) and negative weather phenomena (hurri-canes, droughts, flooding, etc).
Natural risks – if they materialize – can have the following economic consequences: (1) irrevers-ible loss or considerable shortage of natural re-sources; (2) changes in the territorial structure of the economy, particularly because of flooding or drinking water shortages, etc; and (3) increased burden on the state budget (which has to miti-gate the consequences of natural disasters, cope with an increased number of people with disabili-ties, implement agricultural subsidies, etc). These risks particularly concern agriculture, construc-tion, housing and utility services, tourism and insurance (given the growing number of natural disasters and cataclysms and deteriorations in the population’s health, for example).
The social risks related to climate change include: (1) issues related to the increase in scope and in-tensity of migration; (2) lack of food and increased food prices, which will initially affect the poor-est; (3) social consequences of natural disasters; and (4) reduction of territories suitable for living, which can lead to the emergence of new – and the escalation of old – conflicts, including armed conflicts.
The response to climate change includes both mitigation of greenhouse gas emissions and ad-aptation to climate change. Mitigation promotes
Table 4. Human Development Index Rankings by Component, as of 2007
HDI value Life expectancy at birth (years) Adult literacy rate (%)
Combined gross enrolment ratio in
education (%)
GDP per capita (PPP US $)
1. Norway (0.971) 1. Japan (82.7) 1. Georgia (100.0) 1. Australia (114.2) 1. Liechtenstein (85,382)
83. Lebanon (0.803)84. Armenia (0.798)85. Ukraine (0.796)86. Azerbaijan (0.787)87.Thailand (0.783)
108. Fiji (68.7)109. Moldova (68.3)110. Ukraine (68.2)111. Azerbaijan (68.2)112. Kyrgyzstan (67.6)
4. Latvia (99.8)5. Estonia (99.8)6. Ukraine (99.7)7. Belarus (99.7)8. Lithuania (99.7)
30. Hungary (90.2)31. Latvia (90.2)32. Ukraine (90.0)33. Israel (89.9)34. UK (89.2)
92. Grenada (7,344)93. Albania (7,041)94. Ukraine (6,914)95. Cuba (6,876)96. Belize (6,734)
182. Niger (0.340) 176. Afghanistan(43.6)
151. Mali (26.2) 177. Djibouti (25.5) 181. Democratic Republic of the Congo (298)
Source: UNDP. Human Development Report 2009: Overcoming Barriers: Human Mobility and Development. New York: UNDP, 2009. – 229 p.
CHAPTER ONE. UKRAINE: DEVELOPMENT DIMENSIONS 27
the development of renewable energy technolo-gies and increased energy efficiency. Adapta-tion consists of identifying actions and seeking a system to ensure that we can adapt to climate changes. This will require significant additional fi-nancial resources and strengthened institutional capacities.
During the 20th Century, 43 years of drought were recorded in Ukraine, including seven dur-ing the last 15 years. At the beginning of the new millennium, the occurrence of other natural phe-nomena, such as dry winds, floods, overflow and saturations, etc, all of which are impacted by en-vironmental and climate changes, has become more frequent.
Complex research devoted to identifying the positive and negative consequences of global warming has been conducted in Ukraine, aimed at introducing measures to mitigate the conse-quences of climate change. This research covers different fields of economic activities and the en-vironment both countrywide and in the different regions. Furthermore, continuous hydro-meteor-ological surveys are conducted and the informa-tion gathered is provided to the World Meteoro-logical Organization.
Although forecasting the possible effects of cli-mate change on Ukraine’s socio-economic de-velopment is complex, several examples can be provided.
Agriculture. According to the Ukrainian Hydrom-eteorological Centre, the contribution of mete-orological factors to yield fluctuations in gen-eral reaches 20 to 50 percent for winter cereals and 35 to 75 percent for spring cereals. In some years, yield losses caused by unfavourable condi-tions and events can reach 45 to 50 percent. Dur-ing the past 20 years, there has been an increase in the frequency of certain meteorological events, which in some cases have become catastrophes and have led to losses in agricultural production (rains, lightning, storms, hailstorms, whirlwinds and windstorms). Changes in the amount of con-densation and temperature changes will have a significant influence on crop yields, increasing the number of plant pests and triggering erosion processes.
According to the Fourth Assessment Report of the Intergovernmental Panel on Climate Change, the average annual air temperature within the zone could increase by 2–3°С by 2025–2030. With such warming rates, and with insignificant fluctu-ations in the annual amount of atmospheric con-densation, Ukraine may see an increase in farm-
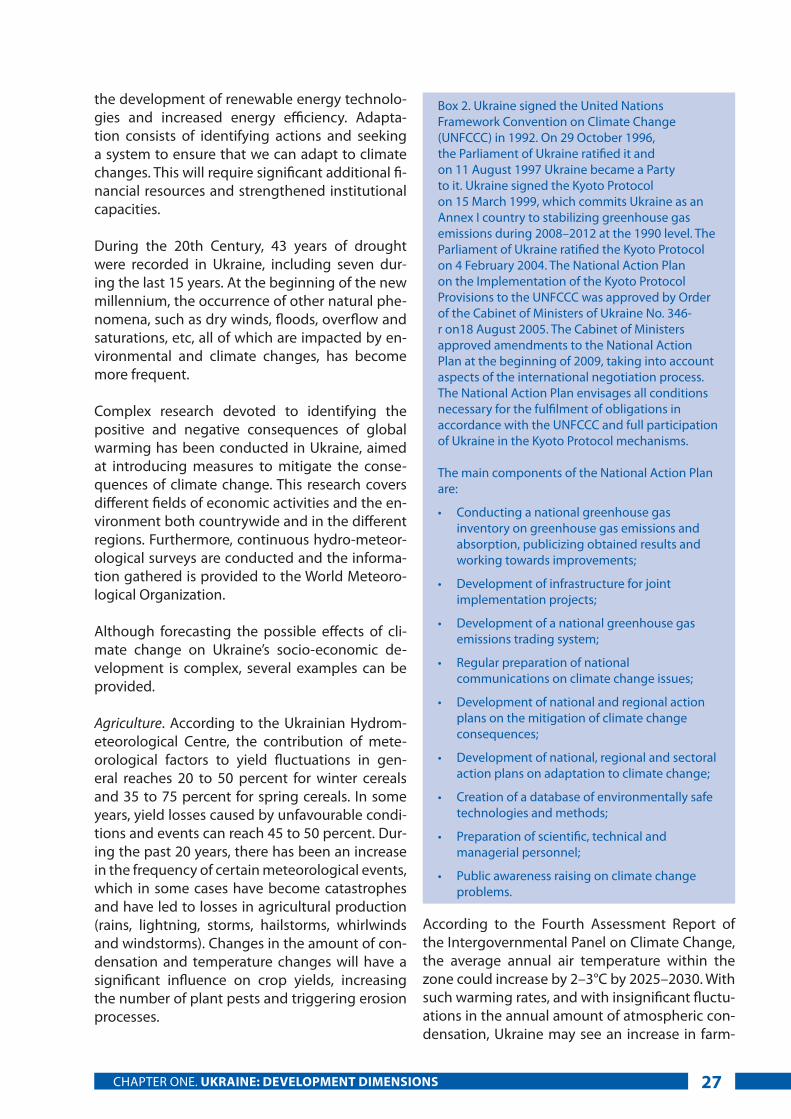
Box 2. Ukraine signed the United Nations Framework Convention on Climate Change (UNFCCC) in 1992. On 29 October 1996, the Parliament of Ukraine ratified it and on 11 August 1997 Ukraine became a Party to it. Ukraine signed the Kyoto Protocol on 15 March 1999, which commits Ukraine as an Annex I country to stabilizing greenhouse gas emissions during 2008–2012 at the 1990 level. The Parliament of Ukraine ratified the Kyoto Protocol on 4 February 2004. The National Action Plan on the Implementation of the Kyoto Protocol Provisions to the UNFCCC was approved by Order of the Cabinet of Ministers of Ukraine No. 346-r on18 August 2005. The Cabinet of Ministers approved amendments to the National Action Plan at the beginning of 2009, taking into account aspects of the international negotiation process. The National Action Plan envisages all conditions necessary for the fulfilment of obligations in accordance with the UNFCCC and full participation of Ukraine in the Kyoto Protocol mechanisms.
The main components of the National Action Plan are:
• Conducting a national greenhouse gas inventory on greenhouse gas emissions and absorption, publicizing obtained results and working towards improvements;
• Development of infrastructure for joint implementation projects;
• Development of a national greenhouse gas emissions trading system;
• Regular preparation of national communications on climate change issues;
• Development of national and regional action plans on the mitigation of climate change consequences;
• Development of national, regional and sectoral action plans on adaptation to climate change;
• Creation of a database of environmentally safe technologies and methods;
• Preparation of scientific, technical and managerial personnel;
• Public awareness raising on climate change problems.
MILLENNIUM DEVELOPMENT GOALS. UKRAINE – 201028
ers’ yields in the immediate future, in both crop yields and gross harvests. (However, an increase in carbon dioxide volumes will cause a decrease in grain quality, in particular a decrease in nitric content, proteins and, as a result, nutritional val-ue.) An acceleration in the photosynthesis proc-ess by 30–100 percent will be observed. Such an increase will in turn accelerate growth and the post-harvest of wheat, barley and sunflowers, and will increase harvest potential by 20–30 per-cent. In Polissia in particular, the winter wheat yield may increase by 20–40 percent; in the for-est steppe by 10 percent; and in the steppe by on average 20–30 percent. However, yields may also decrease owing to the shortening of the vegeta-tion period.
At the same time, negative climate change im-pacts may cause a decrease in agricultural pro-duction by 15–50 percent in Ukraine. Changes in the temperature can influence the physical con-dition of animals. Climate changes will influence the conditions of forage production, which in turn will determine the growth rate of the livestock population. Production of forage crops under cli-mate change may decrease by 12–17 percent. A decrease in production is possible, particularly in milk production, by approximately 9 percent, and in beef production, by approximately 25 per-cent, compared with 1989. This is because, first, the term of the forage crop seeding and the seed-ing rate will change; second, the vegetation pe-riod and the dates of the phonological phase of forage crop development will change; and third, the number and acreage of the leaf mass area will increase. However, if acreage and the structure of farmers’ seeds change as a result of warming, then favourable conditions for cattle farming de-velopment will be created in Ukraine.
Forestry. An increase in the number of forest fires is forecast. Furthermore, it is probable that chang-es will occur in forest types, forest floristic compo-sition, productivity and stability. General reduc-tion of forests as a result of droughts and changes in temperature could be compensated for by the creation of new forest plantations.
Water resources. Changes in water resource dis-tribution as a result of climate change influence how the water needs of the population and of industry are ensured. According to the statistical
data, water-related emergencies rank the highest among natural disasters in terms of frequency, territorial spread and gross average annual loss-es. It is anticipated that problems with the water supply of the southern and south-eastern regions of Ukraine will be aggravated – these regions al-ready suffer from droughts during the summer and the people already have less access to clean drinking water. Overflowing and saturation proc-esses will intensify in Polissia, the Carpathian region and the Transcarpathians where, in the past 10 years, catastrophic floods and high waters have become the major reason for disruption of the normal living conditions of the population. In addition, some changes in the hydrological regime of rivers are expected as a consequence of climate change, which may result in a lack of freshwater reserves.
The negative consequences of expected climate changes in the medium term may include: (1) increased health risks (morbidity and mortality rates) of vulnerable groups of the population; (2) increased number of natural disasters (including high waters and landslides) and negative weath-er events (hurricanes, droughts, abundant rains, etc); (3) increased number of fire hazards in for-ests; (4) disruption of the ecological equilibrium, with some biological species replaced by others; (5) increased desertification (in the steppe areas); and (6) intensified erosion processes. The follow-ing expected climate changes can be considered positive: (1) decreased energy consumption, especially during the heating season; and (2) in-creased yield potential of certain types of agricul-tural crops.
Climate changes at the global level can be differ-ent from those at the regional (local) level. The de-velopment of different ecosystem types (swamps, forests and steppes) may vary, even within a par-ticular region. In particular, swamps, organic mat-ter and peat will decompose faster and nitrogen will mineralize faster in areas with higher temper-atures. Swamps could be overgrown by forest and swamp species may disappear. The depauperiza-tion of ecosystems and the spreading of drought-resistant species, which could replace common plants, are forecast for Polissia in the case of a change in the hydrothermal regime (increases in temperature and humidity). An increase in forest fires is possible, as well as the transformation of

CHAPTER ONE. UKRAINE: DEVELOPMENT DIMENSIONS 29
forest types and the composition, productivity and stability of forest species. Deepening prob-lems with water supply of southern and south-eastern regions are predicted.
Changes in the hydrological regime of rivers are expected in the long-term perspective, as a con-sequence of anthropogenic climate change. As a result, decreases in freshwater reserves and dete-rioration in quality are possible. Climate changes may lead to an increase in the scale and frequen-cy of dangerous natural events, such as floods, high waters, mudslides, avalanches, droughts and hurricanes. Climate change and increasing tem-peratures may lead to a rise in the water levels of the Black and Azov Seas. This will in turn increase bank abrasion, saturation, overflowing and soil salinization in the Black Sea region and will cause significant changes to the ecosystems of the river deltas of the Danube, the Dnieper and the Dni-ester. Erosion of the coastal lines of the Black and Azov Seas may cause house destruction and a de-crease in the size of agricultural land and indus-trial zones.
With regard to the impact of climate change on the achievement of the MDGs in Ukraine, the fol-lowing should be noted. The poor are undoubt-edly the most affected by climate change. Climate change will deepen problems of extreme poverty
related to inadequate nutrition and morbidity. Changes in infrastructure and labour productiv-ity caused by climate change will impact the eco-nomic growth rate. This will in turn increase the risk of urban populations ending up below the poverty line as a result of loss of jobs or decreases in income. Poverty and unemployment will re-duce opportunities to receive a quality education.
The direct effects of climate change include in-creases in mortality and illnesses related to fluctu-ations in temperature, especially among the eld-erly and the urban poor. The number of fatalities in winter owing to cold weather is already increas-ing in some regions. Extreme weather events also lead to an increase in accident rates. Meanwhile, the indirect influences of climate change on health are more significant. Climate change de-creases the amount and quality of drinking water. This is a precondition for a high prevalence rate and spreading of infectious diseases, particularly those related to drinking water.
Issues of climate change prevention are reflected in the Strategy of the National Environmental Policy of Ukraine by 2020, which is planned to be approved in 2010. In particular, the amount of greenhouse gas emissions should be decreased by 20 percent by 2020.


CHAPTER TWO
MILLENNIUM DEVELOPMENT GOALS, ADAPTED FOR UKRAINE

MILLENNIUM DEVELOPMENT GOALS. UKRAINE – 201032
This chapter provides information on the MDG framework in Ukraine. The subchapters cover the main challenges in achieving each Goal and suggest recommendations on ways to resolve these. This chapter also provides an analysis of progress on each MDG and an updated matrix of targets and indicators (see Annex 2). A matrix of each MDG’s targets and indicators is provided at the beginning of each subchapter, giving actual data and values of indicators, taking into account forecast devel-opment trend and against a 2000 baseline. These figures are the result of consensus achieved among all stakeholders who participated in the Report preparation.
The process of establishing an MDG framework in Ukraine started in 2000, when the President of Ukraine signed the United Nations Millennium Declaration. The global MDGs were adopted at national level in 2003. The Ministry of Economy of Ukraine, with support from UNDP, conducted an-alytical, consolidating and organisational work on adapting adapted the global Goal to the national context. The National Report Millennium Devel-opment Goals – Ukraine was an outcome of this work, determining the country’s long-term Goals. This contained the main human and sustainable environment development indicators by 2015, which were aligned with forecast macroeconom-ic indicators.
Originally, the national MDG framework consisted of 6 Goals, 13 targets and 33 indicators, to sup-port the annual monitoring of progress on the MDGs. The following national Goals were defined for Ukraine:
Goal 1. Poverty Reduction (2 targets and 2 indicators);
Goal 2. Quality Lifelong Education (2 targets and 8 indicators);
Goal 3. Sustainable Environmental Development (3 targets and 4 indicators);
Goal 4. Improved Maternal Health and Reduced Child Mortality (2 targets and 4 indicators);
Goal 5. Reducing and Slowing Down the Spread of HIV/AIDS and Tuberculosis (2 targets and 5 indicators);
Goal 6. Gender Equality (2 targets and 10 indicators).
In 2009, the Ministry of Economy of Ukraine ini-tiated a review of the MDG targets and their re-spective indicators in accordance with current developments and projected trends in the post-crisis period. As the central executive authority responsible for development and implementa-tion of economic policy and strategy, the Ministry coordinated this effort. A Working Group was es-tablished, consisting of Government employees, scientists, civil society representatives, United Na-tions agencies, UNDP experts and international organisations. The Report preparation included: (1) formulation of a set of targets and indicators; (2) policy analysis (identification of issues and options to resolve them); (3) elaboration of rec-ommendations for state policies; and (4) estab-lishment of a framework for monitoring by civil society of the implementation of governmental policy aimed at achieving the determined Goals.
Numerous roundtables were held to ensure ex-pert assessment of achievements in relation to the MDGs as well as new challenges. This al-lowed for an analysis of the progress (or regres-sion) and for the proposal of an updated matrix of the MDG targets and indicators. The updated matrix (15 targets and 33 indicators) was devel-oped through a transparent and open strategic planning process and through forecasting of de-velopment trends by 2015. The following Goals were set:

CHAPTER TWO. MILLENNIUM DEVELOPMENT GOALS, ADAPTED FOR UKRAINE 33
Goal 1. Reduce Poverty (3 targets and 5 indicators);
Goal 2. Ensure Quality Lifelong Education (2 targets and 6 indicators);
Goal 3. Promote Gender Equality (2 targets and 4 indicators);
Goal 4. Reduce Child Mortality (1 target and 2 indicators);
Goal 5. Improve Maternal Health (1 target and 2 indicators);
Goal 6. Reduce and Slow Down the Spread of HIV/AIDS and Tuberculosis and Initiate a Trend to Decrease their Scales (2 targets and 6 indicators);
Goal 7. Ensure Environmental Sustainability (4 targets and 8 indicators).
The updated MDG targets and indicators will be used in the preparation of Government stra-tegic and programme documents. Some of the key tasks in achieving the MDGs lie in establish-ing a system for the integrated implementation of identified measures and the management of changes.
Success in achieving the updated MDG targets depends significantly on the state’s ability to ensure sustainable economic growth by: using highly developed human capital; applying infor-mational and resource, energy and nature conser-vation technologies; and ensuring a stable link-
age between economic growth and the welfare of the population.
Achieving the MDG targets will have an impact in relation to:
• Ensuring economic stability (creating an in-novative and environmentally efficient econ-omy, raising the competitiveness of the na-tional economy, etc);
• Ensuring quality of life and raising the welfare of the population (increasing average life ex-pectancy and quality of education, ensuring human rights, following principles of equal opportunities, etc);
• Ensuring an environmental balance (pre-serving and renewing natural ecosystems, improving the environment for humans, sta-bilizing and improving the quality of the en-vironment, etc);
• Enhancing the quality of institutional changes.
It is important for Ukraine to opt for economic development that takes environmental and so-cial components into account in a single and in-tegrated model. Harmonizing human, economic and environmental development can ensure social progress that fits the needs of each indi-vidual. Strategic development activities require improvements in the regulating mechanisms that emerged during Ukraine’s transition period, as well as efforts to ensure economic, political and civil liberties. Achieving the country’s develop-ment Goals is possible only if efforts at central and regional levels are aligned, based on the further development of mechanisms of market liberali-zation, political democracy, national and cultural pluralism and other self-regulation tools that are common in a developed civil society.
Making the best choice among various options for the socio-political and economic development of Ukraine is extremely important. It is necessary to foresee and assess the impact of economic and social reforms, and their consequences for future generations while planning and implementing them. Updating the MDG targets must become a driver towards improving regulating mechanisms that emerged during the country’s transforma-tion, while ensuring economic, political and civil liberties.
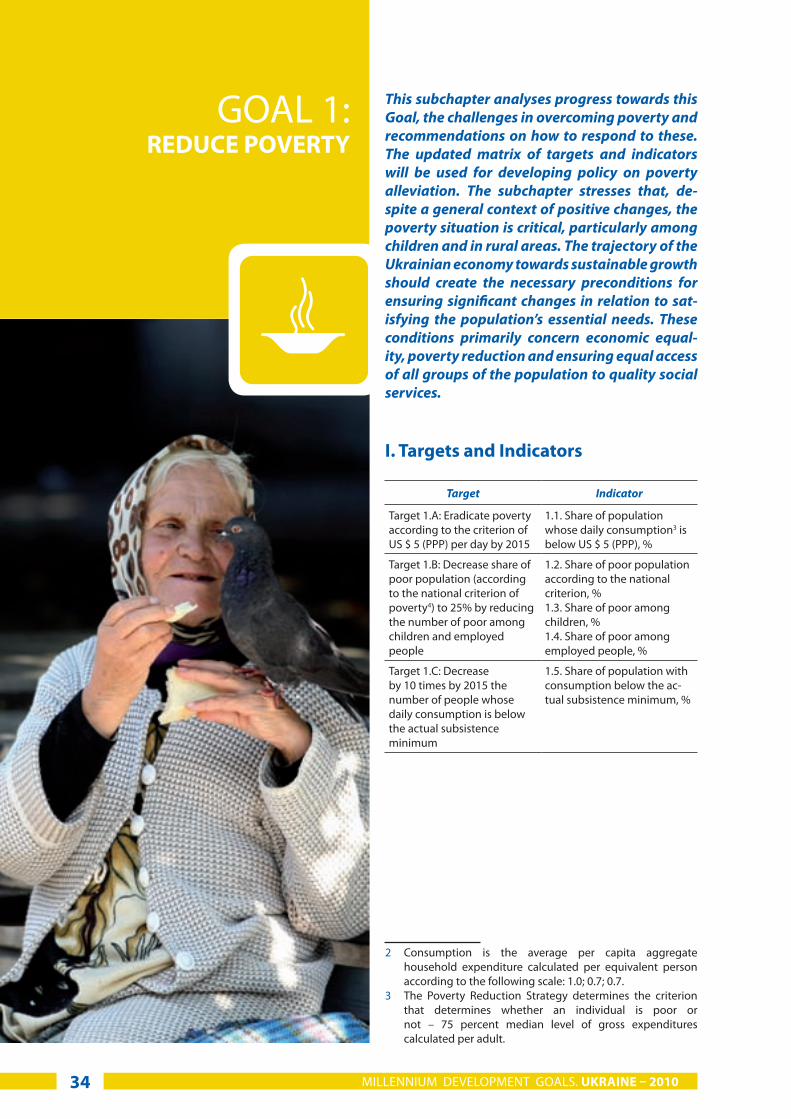
MILLENNIUM DEVELOPMENT GOALS. UKRAINE – 2010
GOAL 1: REDUCE POVERTY
This subchapter analyses progress towards this Goal, the challenges in overcoming poverty and recommendations on how to respond to these. The updated matrix of targets and indicators will be used for developing policy on poverty alleviation. The subchapter stresses that, de-spite a general context of positive changes, the poverty situation is critical, particularly among children and in rural areas. The trajectory of the Ukrainian economy towards sustainable growth should create the necessary preconditions for ensuring significant changes in relation to sat-isfying the population’s essential needs. These conditions primarily concern economic equal-ity, poverty reduction and ensuring equal access of all groups of the population to quality social services.
І. Targets and Indicators
Target Indicator
Target 1.A: Eradicate poverty according to the criterion of US $ 5 (PPP) per day by 2015
1.1. Share of population whose daily consumption3 is below US $ 5 (PPP), %
Target 1.B: Decrease share of poor population (according to the national criterion of poverty4) to 25% by reducing the number of poor among children and employed people
1.2. Share of poor population according to the national criterion, %1.3. Share of poor among children, %1.4. Share of poor among employed people, %
Target 1.C: Decrease by 10 times by 2015 the number of people whose daily consumption is below the actual subsistence minimum
1.5. Share of population with consumption below the ac-tual subsistence minimum, %
23
2 Consumption is the average per capita aggregate household expenditure calculated per equivalent person according to the following scale: 1.0; 0.7; 0.7.
3 The Poverty Reduction Strategy determines the criterion that determines whether an individual is poor or not – 75 percent median level of gross expenditures calculated per adult.
34

CHAPTER TWO. MILLENNIUM DEVELOPMENT GOALS, ADAPTED FOR UKRAINE
ІІ. Situation Analysis
Some positive changes in terms of reducing pov-erty have been achieved in recent years. In par-ticular, the scale of absolute poverty has been reduced owing to an increase in wages, pensions and the main types of social assistance for fami-lies. The economic crisis that broke out in 2008 al-lowed for a further increase in state social guaran-tees and increased social expenditure.
Established trends of income differentiation and relative poverty levels continued during the pe-riod of economic growth. This led to an increase in income inequality and inequality in relation to living conditions. Traditionally, the highest risks of poverty are observed among children and rural inhabitants. The relative poverty among children remains steadily high during this period, and the indicator for the rural population increases an-nually. Generally, low wage standards remain a specific problem for Ukraine, leading to poverty among the employed population: 79 percent of the poor today are from households with at least one employed person.
Given the implementation of a well-grounded state social policy, the economic crisis will at least not increase the differentiation in incomes. It is expected that the share of the poor according to the national (relative) poverty line will decrease in the near future.
It should be noted that a decrease in the poverty level determined according to the national crite-rion requires an improvement in the situation of children and employed people. Previously, the share of the poor population (determined ac-cording to the national poverty line) was to be de-creased to 18.4 percent by 2015. However, moni-toring of the poverty situation for 1999–2008 has shown that it is impossible to decrease the relative poverty level without introducing changes to the basic redistribution process. It became clear that it is impossible to achieve the declared target in-dicator by 2015. As such, it has been necessary to establish a more realistic value – at 25 percent – considering the current socio-economic situation in the country and the likely development pros-pects for the next five years.
35
2000 2001 2002 2003 2004 2005 2006 2007 2008 2009 2010 2011 2013 2015
Indicator 1.1. Share of population whose daily consumption is below US $ 5 (4.30) (PPP), %
11.9* 11.0* 3.0* 4.0* 2.0* 1.3*9.0 6.0 6.6 3.8 4.5 5.0 4.0 3.0 <0.5
Indicator 1.2. Share of poor population according to the national criterion, %
26.4 27.2 27.2 26.6 27.3 27.1 28.1 27.3 27.0 27.0 27.0 26.5 26.0 25.0
Indicator 1.3. Share of poor among children, %
33.4 34.9 34.0 34.9 35.0 36.7 36.6 36.3 35.1 35.0 34.5 33.0 31.0 29.0
Indicator 1.4. Share of poor among employed people, %
21.6 22.6 22.0 21.1 21.6 22.3 27.2 21.7 21.1 21.0 20.0 19.0 17.0 15.0
Indicator 1.5. Share of population with consumption below the actual subsistence minimum,5 %
71.2 69.2 65.0 59.9 51.0 38.7 31.0 30.5 19.9 22.0 20.0 15.0 10.0 7.04
* US $ 4.30 per day (PPP).
The table presents actual data by 2009,5 expected data for 2009 and expected outcomes of the draft Poverty Reduction Programme in Ukraine for 2010–2015.
4 According to poverty monitoring, use of the officially established subsistence level to define the poverty level does not provide adequate information. Therefore, it is suggested to use the actual subsistence level, calculated in terms of prices in the corresponding period.
5 Hereinafter, data of the Household Budget Survey conducted by the State Statistics Committee serve as a source of information on actual poverty levels, determined by different criteria, and also on inequality of the population.

It is important to set a new target – ‘reducing the share of the poor according to the subsistence minimum’ – based on the need to decrease the scale of absolute poverty. In using the specifics of the subsistence minimum as the basis for iden-tifying state social guarantees as dependent on the state’s financial capacity, the actual subsist-ence minimum calculated based on the prices of the corresponding period should be considered the poverty line.6 The trend of the indicator dur-ing 2000–2008 provides the basis for establish-ing the target benchmark – i.e. reduce the share of the population with a per capita consumption level below the current subsistence minimum by tenfold by 2015 against the level in 2000.
An analysis of the poverty situation in Ukraine during 1999–2008 shows that positive results in terms of economic growth allowed for a reduc-tion in the absolute poverty level. However, they did not influence the situation of relative poverty, since income differentiation was not halted. The Gini coefficient value7 remained at around 30 per-cent during the whole period, which shows that inequality trends that emerged in the transition processes of the 1990s have become stronger. A major feature of inequality in the country is a high concentration of the population close to the poverty line. Thus, the share of the non-poor population with an income slightly higher than the poverty line may, in an unfavourable eco-nomic situation, end up below the poverty line. At the same time, income differentiation among the poor is insignificant, and the fluctuation in the depth of poverty is around 23–25 percent.
Poverty level indicators under the subsist-ence minimum criterion demonstrate impres-sively positive dynamics (from 72.5 percent in 2002 to 12.6 percent in 2008). In addition, pov-erty and extreme poverty indicators according to relative criteria (75 percent and 60 percent of the median level of aggregate equivalent expendi-tures, respectively) remain almost unchanged –
6 The subsistence level is established annually based on budget capacity. When the standard is established without full incorporation of the previous year’s inflation and the current year’s forecast inflation, the subsistence level is artificially depreciated. This leads to a decline in the monitored absolute poverty which does not reflect the real situation.
7 Calculations are based on the Gini-Theil formula.
at around 26–28 percent and 13–15 percent, respectively.
The decrease in the poverty level, determined based on the subsistence minimum criterion, con-tinued at high rates in 2008. However, the state social standard (the subsistence minimum) was revised for 2008, and 2007–2008 inflation rates were not adequately incorporated. This artificially reduced the absolute poverty line and influenced the poverty level indicator. According to experts, the poverty level based on the subsistence mini-mum criterion is estimated at 19.9 percent, and not 16.1 percent. This does not change the posi-tive dynamics overall, but rather decreases the rate of reduction of the poverty level.
Poverty alleviation policy, implemented through the Strategy to Alleviate Poverty from 2001, did not provide the expected results: two ma-jor problems, i.e. reducing poverty risks among families with children and among the rural pop-ulation, were not resolved during the strategy’s timeframe.
Based on the national criterion, from year to year, the poverty level among households with children traditionally exceeds that among the households without children by 1.7-2.0: 33.1 per-cent against 19.7 percent in 2008. The situation for families with children improves from year to year based on the subsistence minimum criterion but the poverty level steadily exceeds the corre-sponding value among households without chil-dren. In 2008, these two indicators drew closer to each other. The poverty level among families with children reached 17.0 percent against 7.5 per-cent among households without children. How-ever, this owes mostly to a reduction in the overall group of the poor and not to a relative improve-ment in the situation for families with children (Figure 4).
The direst situation among families without children is traditionally observed in households where all members are older than 75. The high-est poverty level for the period from 2000 is regis-tered within these groups in 2008, at 29 percent. This shows a direct decrease in the purchasing power of the minimum pension payment, since people from the older age groups cannot earn an income additional to their pension income.
MILLENNIUM DEVELOPMENT GOALS. UKRAINE – 201036
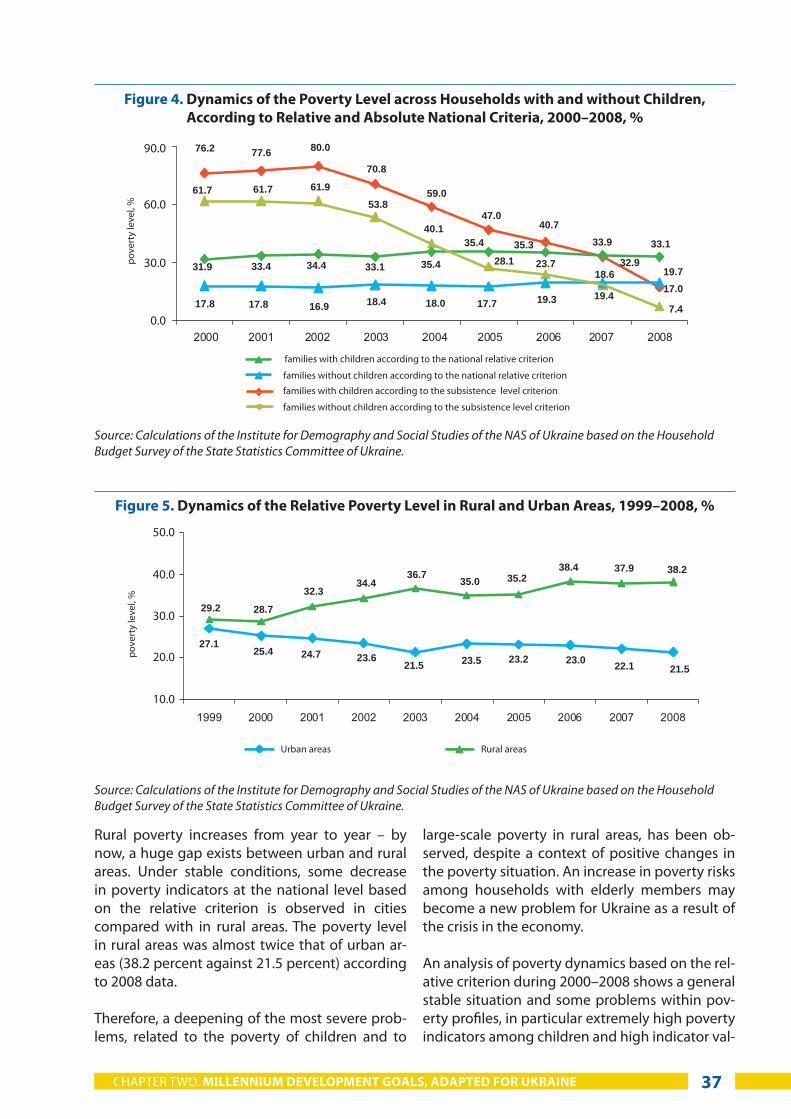
Rural poverty increases from year to year – by now, a huge gap exists between urban and rural areas. Under stable conditions, some decrease in poverty indicators at the national level based on the relative criterion is observed in cities compared with in rural areas. The poverty level in rural areas was almost twice that of urban ar-eas (38.2 percent against 21.5 percent) according to 2008 data.
Therefore, a deepening of the most severe prob-lems, related to the poverty of children and to
large-scale poverty in rural areas, has been ob-served, despite a context of positive changes in the poverty situation. An increase in poverty risks among households with elderly members may become a new problem for Ukraine as a result of the crisis in the economy.
An analysis of poverty dynamics based on the rel-ative criterion during 2000–2008 shows a general stable situation and some problems within pov-erty profiles, in particular extremely high poverty indicators among children and high indicator val-
Figure 4. Dynamics of the Poverty Level across Households with and without Children, According to Relative and Absolute National Criteria, 2000–2008, %
Source: Calculations of the Institute for Demography and Social Studies of the NAS of Ukraine based on the Household Budget Survey of the State Statistics Committee of Ukraine.
Figure 5. Dynamics of the Relative Poverty Level in Rural and Urban Areas, 1999–2008, %
Source: Calculations of the Institute for Demography and Social Studies of the NAS of Ukraine based on the Household Budget Survey of the State Statistics Committee of Ukraine.
CHAPTER TWO. MILLENNIUM DEVELOPMENT GOALS, ADAPTED FOR UKRAINE 37
Urban areas Rural areas
pove
rty
leve
l, %
0.0
10.0
20.0
30.0
40.0
50.0
30.0
60.0
90.0
pove
rty
leve
l, %
families with children according to the national relative criterion
families without children according to the national relative criterion
families with children according to the subsistence level criterion
families without children according to the subsistence level criterion
76.2 77.6 80.0
70.8
59.0
47.040.7
19.717.0
7.4
23.718.6
19.419.317.8 17.8 16.9 18.4 18.0 17.7
61.7 61.7 61.953.8
40.1
28.131.9 33.4 34.4 33.1 35.4
35.4 35.3 33.9 33.1
32.9
22.1
38.237.938.435.235.036.7
34.432.3
28.729.2
27.125.4 24.7 23.6
21.5 23.5 23.2 23.021.5
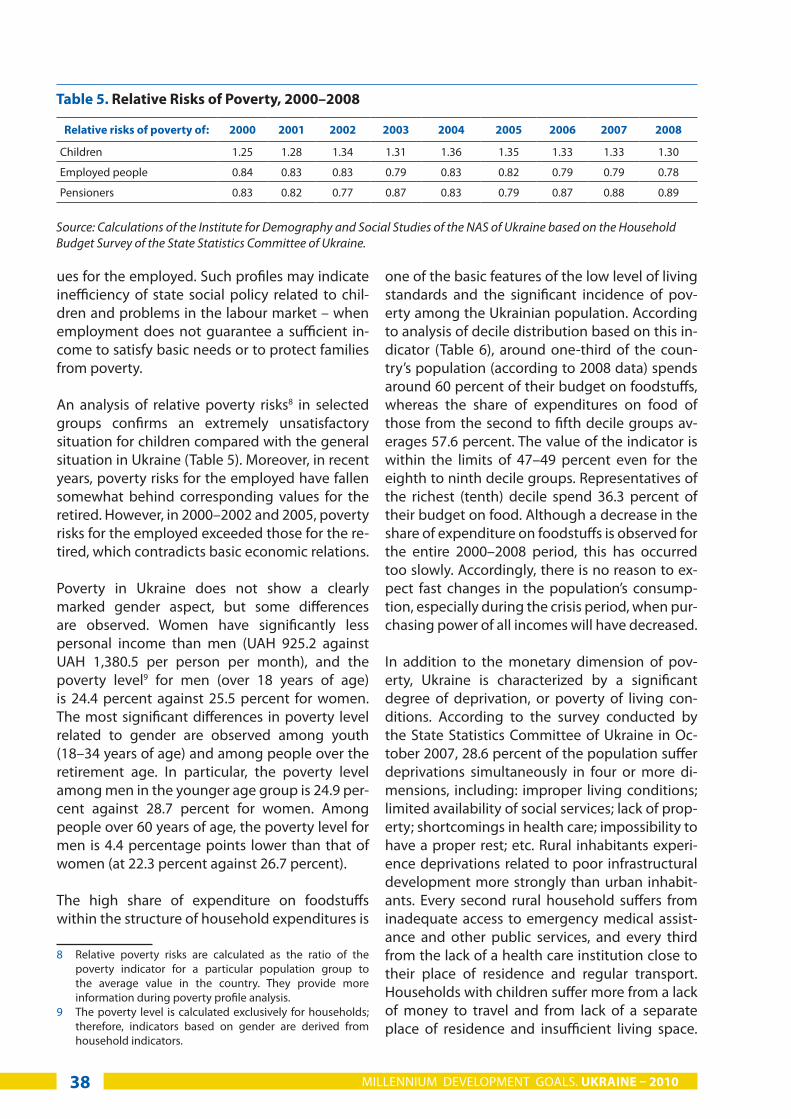
ues for the employed. Such profiles may indicate inefficiency of state social policy related to chil-dren and problems in the labour market – when employment does not guarantee a sufficient in-come to satisfy basic needs or to protect families from poverty.
An analysis of relative poverty risks8 in selected groups confirms an extremely unsatisfactory situation for children compared with the general situation in Ukraine (Table 5). Moreover, in recent years, poverty risks for the employed have fallen somewhat behind corresponding values for the retired. However, in 2000–2002 and 2005, poverty risks for the employed exceeded those for the re-tired, which contradicts basic economic relations.
Poverty in Ukraine does not show a clearly marked gender aspect, but some differences are observed. Women have significantly less personal income than men (UAH 925.2 against UAH 1,380.5 per person per month), and the poverty level9 for men (over 18 years of age) is 24.4 percent against 25.5 percent for women. The most significant differences in poverty level related to gender are observed among youth (18–34 years of age) and among people over the retirement age. In particular, the poverty level among men in the younger age group is 24.9 per-cent against 28.7 percent for women. Among people over 60 years of age, the poverty level for men is 4.4 percentage points lower than that of women (at 22.3 percent against 26.7 percent).
The high share of expenditure on foodstuffs within the structure of household expenditures is
8 Relative poverty risks are calculated as the ratio of the poverty indicator for a particular population group to the average value in the country. They provide more information during poverty profile analysis.
9 The poverty level is calculated exclusively for households; therefore, indicators based on gender are derived from household indicators.
one of the basic features of the low level of living standards and the significant incidence of pov-erty among the Ukrainian population. According to analysis of decile distribution based on this in-dicator (Table 6), around one-third of the coun-try’s population (according to 2008 data) spends around 60 percent of their budget on foodstuffs, whereas the share of expenditures on food of those from the second to fifth decile groups av-erages 57.6 percent. The value of the indicator is within the limits of 47–49 percent even for the eighth to ninth decile groups. Representatives of the richest (tenth) decile spend 36.3 percent of their budget on food. Although a decrease in the share of expenditure on foodstuffs is observed for the entire 2000–2008 period, this has occurred too slowly. Accordingly, there is no reason to ex-pect fast changes in the population’s consump-tion, especially during the crisis period, when pur-chasing power of all incomes will have decreased.
In addition to the monetary dimension of pov-erty, Ukraine is characterized by a significant degree of deprivation, or poverty of living con-ditions. According to the survey conducted by the State Statistics Committee of Ukraine in Oc-tober 2007, 28.6 percent of the population suffer deprivations simultaneously in four or more di-mensions, including: improper living conditions; limited availability of social services; lack of prop-erty; shortcomings in health care; impossibility to have a proper rest; etc. Rural inhabitants experi-ence deprivations related to poor infrastructural development more strongly than urban inhabit-ants. Every second rural household suffers from inadequate access to emergency medical assist-ance and other public services, and every third from the lack of a health care institution close to their place of residence and regular transport. Households with children suffer more from a lack of money to travel and from lack of a separate place of residence and insufficient living space.
Table 5. Relative Risks of Poverty, 2000–2008
Relative risks of poverty of: 2000 2001 2002 2003 2004 2005 2006 2007 2008
Children 1.25 1.28 1.34 1.31 1.36 1.35 1.33 1.33 1.30
Employed people 0.84 0.83 0.83 0.79 0.83 0.82 0.79 0.79 0.78
Pensioners 0.83 0.82 0.77 0.87 0.83 0.79 0.87 0.88 0.89
Source: Calculations of the Institute for Demography and Social Studies of the NAS of Ukraine based on the Household Budget Survey of the State Statistics Committee of Ukraine.
MILLENNIUM DEVELOPMENT GOALS. UKRAINE – 201038

Households without children usually do not have the financial capacity to pay for health care.
The economic crisis significantly influenced the incomes of the employed. Despite nominal wage growth in 2008–2009, the real wage decreased. In particular, wages in 2009 (in comparable pric-es of 2007) were significantly behind the corre-sponding month of 2008 (Figure 6). It was pos-sible to bring the average wage (in comparable prices) to the level of December 2008 only in De-
cember 2009; during all other months of 2009, the average wage was less than that of the previ-ous year, by 9.97 percent.
The past two years, 2008 and 2009, are character-ized by a sharp increase in wage arrears: at the beginning of 2008, this was at UAH 668.7 mil-lion; as of 1 January 2010, it reached the level of UAH 1,473.3 million, which is equal to 6.2 percent of the wages fund of December 2009. If the cri-sis deepens or economic development stagnates,
Table 6. Share of Household Consumption Expenditures Spent on Food and Non-Alcoholic beverages (including Foods from Outside the Home), 2000–2008, %
Decile group 2000 2001 2002 2003 2004 2005 2006 2007 2008
1 75.0 73.0 71.0 70.6 70.1 70.5 68.2 65.7 64.9
2 72.0 69.3 66.6 68.6 66.4 66.9 64.9 60.5 59.1
3 69.1 66.3 64.7 64.9 64.6 63.8 62.5 59.0 58.8
4 68.9 66.6 64.0 63.4 63.4 62.6 60.8 57.9 55.7
5 67.7 65.1 63.7 63.1 61.7 61.0 59.4 57.2 56.6
6 65.4 64.5 61.6 62.7 60.9 60.7 58.2 56.2 52.6
7 65.6 63.7 61.6 61.0 60.2 59.7 55.8 53.6 50.5
8 63.8 62.1 59.5 58.4 58.3 57.9 53.9 51.7 49.4
9 62.1 60.4 56.3 57.4 56.6 56.4 52.5 48.1 47.3
10 56.1 52.6 50.8 48.9 47.8 45.6 41.2 40.3 46.3
Country average
64.9 62.6 60.2 59.9 58.9 58.1 54.9 53.2 50.8
Source: Data of the state Household Budget Survey of the State Statistics Committee of Ukraine.
Figure 6. Average Monthly wages, 2008–2009 (in December 2007 prices), UAH
Source: Calculations of the Institute for Demography and Social Studies of the NAS of Ukraine based on data of the State Statistics Committee of Ukraine.
1636
1522
162416
51
1631
1680
1631
1548
1534
1552
1545
1478
1626
1436
144814
72
1449
1514
1491
1409
1412
1403
1349
1323
1300
1400
1500
1600
1700
Janu
ary
Febr
uary
Mar
ch
Apr
il
May
June July
Aug
ust
Sept
embe
r
Oct
ober
Nov
embe
r
Dec
embe
r
UAH.
2008
2009
CHAPTER TWO. MILLENNIUM DEVELOPMENT GOALS, ADAPTED FOR UKRAINE 39

there may be a heightened risk of a decrease in the purchasing power of wage rates and an in-crease in wage arrears.
The poorest groups of the population already felt the influence of the economic crisis in 2009: ac-cording to the US $ 5 (PPP) poverty line, the pov-erty level increased to 4.7 percent during the first half of the year, compared with 4.0 percent during the corresponding period of 2008. The positive trend in terms of the decrease of absolute pov-erty came to a halt in 2009, and the general pov-erty situation will not be able to change in 2010, even under conditions of favourable economic development.
ІІІ. Challenges
Poverty is one of the uppermost social issues in Ukraine. It determines limitations in access to de-velopment resources such as quality services in education, health care, culture and child develop-ment. Low income levels of a significant share of families, combined with considerable disparity in incomes, cause social tension, restrict the coun-try’s overall development and lead to crises in the family and in society.
Challenges to reducing poverty lie in the follow-ing areas: (1) inefficient redistribution of incomes; (2) low level of remuneration; (3) poverty among families with children; (4) unfair distribution of state transfers directed towards social sup-port; (5) impact of the global economic crisis; and (6) spread of a ‘welfare mentality’ and social inactivity.
Inefficient redistribution of incomes, concern-ing both primary and secondary redistribution. Expenditures on social protection in Ukraine (including on state social insurance and health care) amount to approximately 26 percent of GDP, which is similar to levels in highly developed countries. However, these funds are spent inef-ficiently. The social protection system is poorly targeted and excludes people who really need it. Most types of assistance, benefits and subsidies do not protect socially vulnerable populations from poverty.
High social polarization (extreme wealth and lux-ury, on the one hand, and subsistence at the pov-erty line, on the other hand) and lack of wealth re-distribution between the rich and the poor cause outrage and a sense of social unfairness among a large share of the population. It also hinders pov-erty alleviation.
Given financial constrains, state policies on pov-erty alleviation are directed primarily at minimiz-ing the worst forms of poverty, i.e. supporting the poorest groups of the population and assist-ing them to increase their income levels, which are significantly lower than the poverty level. Meanwhile, there is disconnect between social policy and poverty: the latter is determined ac-cording to one criterion (relative) and the former is determined according to another (the subsist-ence minimum and the level to ensure minimum subsistence). Furthermore, an assessment of all expenditures directly or indirectly earmarked to support the poor reveals that assistance is often received by people who are not the most in need.
The problem of poor targeting has not yet been fully addressed. The mechanism for assessing families’ poverty level requires significant ex-penditures but has not provided the necessary results. The low level of coverage of the poor by social assistance negates the state’s efforts to overcome extreme poverty. To ensure an effective social assistance system capable of strengthening the impact on the poverty situation in the coun-try will require large-scale changes.
Low wages. Wages in Ukraine are among the lowest in Europe. Today, one employed person cannot ensure full subsistence for even one addi-tional unemployed family member. This situation, whereby poverty is spread even among highly qualified workers with high educational levels, is unacceptable in relation to developed world standards.
The high poverty level among the employed population is caused by problems in the labour market, such as its inability to ensure decent work conditions and acceptable wages, and also by maintenance of a large number of low-productiv-ity and marginal working posts.
MILLENNIUM DEVELOPMENT GOALS. UKRAINE – 201040

Poverty among rural inhabitants is especially se-vere. The poverty level of the rural population is two times higher (38.2 percent) than that in big cities (17.5 percent). Some of those in rural areas settle into stagnant poverty and later into inher-ited poverty.
One of the specific features of poverty in Ukraine is a relatively small poverty gap and high concen-trations of people close to the poverty line. There-fore, there is a risk that unemployment caused by the general economic decline or by structural reforms will cause a sharp increase in the number of the poor, in particular poor families that do not receive guaranteed state assistance in the form of social transfers.
Impact of the global economic crisis. Poverty al-leviation and social policy in Ukraine have been complicated by systemic crisis and reduced state financial capacity caused by the global economic crisis. The crisis made impossible to further in-crease state social guarantees and public expen-ditures on social development.
Development of a ‘welfare mentality’ and so-cial inactivity is reflected in the gap between the population’s expectations of state support and the state’s failure to fulfil them. The expectation of full care by the state is inherited from the So-viet period and rooted in the consciousness of a significant part of the population (especially the elderly). The poor of today, who have been poor for a long time, have marginal awareness, are eco-nomically and socially inactive, have norms and values justifying their continued condition and do not feel able to pull themselves out of this situation.
Ensuring citizens’ constitutional rights to a decent standard of living, addressing their dissatisfaction with the economic situation and with their own material situation and changing the way of as-sessing poverty under current conditions require elaboration of new approaches towards poverty alleviation.
IV. Moving Forward
Ukraine’s recovery from the economic crisis and the renewal of positive economic trends are pre-conditions for solving current issues related to poverty alleviation. Effective functioning of the domestic economy and productive economic activity are the key to success in achieving the MDGs.
It is necessary to direct social policy towards ensuring high standards of living, enhancing the role of civil institutions and supporting civil initia-tives on social protection.
Modernization of the social assistance system is urgent. It will be impossible to solve critical prob-lems by carrying out a simple adjustment of the current social protection system – it is necessary to shift to a more efficient system of support of population groups in need while focusing on bet-ter targeting of social assistance.
In order to resolve particular issues of poverty al-leviation, certain meaningful measures are neces-sary. Radical reforms of the primary income re-distribution system must be conducted to avoid excessive income differentiation and to achieve fairer redistribution, in particular tax exemptions on incomes below the subsistence minimum, in-troduction of taxes on wealth, excessive real es-tate and heritage, etc.
Amendments to secondary income redistribu-tion policy are needed to ensure effective and efficient protection from poverty. To do so, it is necessary to: transform social assistance insti-tutions; improve targeting of social assistance through a gradual changeover to an integral pro-gramme of social protection based on the princi-ples of assessing family income; and improve the state social standards and guarantees system as the basis for determining structural relationships within income policy and the social protection system. Also, monitoring and evaluation of the social protection system should be introduced, particularly of financial flows, in order to facilitate the increased efficiency of social protection and the rationalization of amounts and directions of state expenditures.
CHAPTER TWO. MILLENNIUM DEVELOPMENT GOALS, ADAPTED FOR UKRAINE 41

A system of standards for providing social serv-ices to the population should be established in order to unify the consumption standards of so-cial benefits and services across regions and to ensure optimization of allocated expenditures in the social sector by local self-governing authori-ties. The system must become a basis for a formu-la to equalize inter-budgetary transfers.
To prevent the spread of poverty among em-ployed people, changes should be introduced into wage remuneration policy, labour remu-neration and employment should be consist-
ently guaranteed and state control over employ-ers’ observance of labour legislation needs to be strengthened, including the rights and guaran-tees of employees while decreasing the number of employed and introducing part-time work..
To resolve issues related to poverty alleviation, it is necessary to consolidate and promote the ef-forts of all civil society representatives, implement principles of gender equality, strengthen social dialogue and improve the legal base through the participation of civil society institutions in social policy implementation.
GOAL 2. ENSURE QUALITY
LIFELONG EDUCATION
MILLENNIUM DEVELOPMENT GOALS. UKRAINE – 201042

CHAPTER TWO. MILLENNIUM DEVELOPMENT GOALS, ADAPTED FOR UKRAINE 43
GOAL 2. ENSURE QUALITY
LIFELONG EDUCATION
This subchapter discusses obstacles in ensuring equal access to quality education and analyses the situation in education, by level (preschool, general secondary, out-of-school, vocational, higher and postgraduate). Ukraine maintains high indicators in education (coverage by com-pulsory secondary education, public expendi-tures on education, etc). A new legislative and regulatory framework for education has been established and institutional barriers for its im-plementation have been removed. At the same time, access to quality education at all levels for Ukrainian citizens remains critical. The subchap-ter emphasizes that education remains a prior-ity area in relation to society’s socio-economic, spiritual and cultural development.
І. Targets and Indicators
Targets Indicators
Target 2.A: Increase enrol-ment rates in education
2.1. Net enrolment rate in pre-school educational institutions for children aged 3–5 in urban areas, %2.2. Net enrolment rate in pre-school educational institutions for children aged 3–5 in rural areas, %2.3. Net enrolment rate for children in secondary educa-tion, %2.4. Net enrolment rate in post-secondary institutions for those aged 17–22, %2.5. Cumulative gross rate of persons undergoing retraining or professional development, thousand people
Target 2.B: Raise the quality of education
2.6. Number of general educa-tional institutions with internet access, %

MILLENNIUM DEVELOPMENT GOALS. UKRAINE – 201044
The targets aimed at achieving this Goal are in-terlinked. Indicators for monitoring progress on the Goal’s achievement, set up in 2003, inade-quately reflect the situation in the education sec-tor. Therefore, the matrix of indicators needs to be updated to take into account recent reforms in education. In particular, the net enrolment rate of children aged three to four in preschool edu-cational institutions (PEIs) and that of those aged five in PEIs should be combined. The value of the enrolment rate for children aged six to nine has been stable for the past 10 years (99.2–99.3 per-cent). The value of the indicator ‘proportion of cur-rent state education standards that comply with those in the EU (%) (within joining the Bologna process)’ cannot be monitored owing to a lack of state standards for higher education, which are determined and approved at the legislative level. Also, approaches to statistical surveys on educa-tion have recently been changed.10
10 Share of graduates of 9th grade continuing their education to complete general secondary education (students of 10th grade in secondary schools, first-year students of vocational educational institutions (VEIs), first-year students of higher educational institutions (HEIs)).
II. Situation Analysis
The main priorities of development in this sec-tor include improving the quality of education, ensuring equal access to quality education at all levels and enhancing the competitiveness of the national educational system and its integration into the European education environment.
The main indicators of competitiveness of na-tional educational systems, according to World Economic Forum assessments, are: quality of the educational system; quality of maths and sci-ences education; quality of the management of schools; capacity of scientific research institu-tions for innovative changes; extent of staff train-ing; availability of professional managers; quality of scientific and research institutions; and capac-ity of scientists and engineers for innovation. An analysis of Ukraine’s position with respect to its educational system meeting the requirements of innovation shows that the country is significantly behind developed countries on this indicator. In particular, Ukraine is lagging behind in relation to the capacity of its scientists and engineers for innovation (it is at 4.6 points compared with 6.0 for Finland, 5.8 for the United States and 6.1 for Singapore). With respect to developing personnel retraining systems, which is the basis for the edu-
2000 2001 2002 2003 2004 2005 2006 2007 2008 2009 2011 2013 2015
Indicator 2.1. Net enrolment rate in preschool educational institutions for children aged 3–5 in urban areas, %
– – 79.5 82.6 85.8 86.9 87.2 87.3 88.0 89 91 93 95
Indicator 2.2. Net enrolment rate in preschool educational institutions for children aged 3–5 in rural areas, %
– – 27.5 29.9 33.2 38.0 41.7 44.9 47.6 50 52 55 60
Indicator 2.3. Net enrolment rate for children in secondary education, %11
– 98.1 – 97.8 99.1 99.3 99.4 99.5 99.7 99.7 99.8 99.8 99.9
Indicator 2.4. Net enrolment rate in post-secondary institutions for those aged 17–22, %
– 32.5 – 35.0 32.7 41.8 44.1 45.4 46.3 48.0 52.0 54.0 56.0
Indicator 2.5. Cumulative gross rate of persons undergoing retraining or professional development, thousand people
– 158 – 167 188 193 193 197 292 294 297 310 320
Indicator 2.6. Number of general educational institutions with internet access, %
– – – – – – – – 42 43 55 75 90
The table presents actual data by 2009, expected data for 2009 and forecast calculated values of indicators for 2010–2015.

CHAPTER TWO. MILLENNIUM DEVELOPMENT GOALS, ADAPTED FOR UKRAINE 45
cation system, Ukraine scored almost two times lower than the leading countries in the ranking (Finland, the United States, Sweden, Singapore and Germany).
The Law of Ukraine on Education has a range of shortcomings. The legislative basis for regulat-ing the educational market and the public ad-ministration system of education both require modernization. The Constitution of Ukraine (Arti-cle 53) determines that the state needs to ensure that preschool, complete general secondary, vo-cational, higher, out-of-school and postgraduate education are available and free of charge. How-ever, this list is not exhaustive. Important levels such as continued education, adult education (which is not always exclusively vocational), dis-tance learning, inclusive education, etc, are not included.
Preschool education. The individual personality is formed during the early years. Knowledge and skills achieved in childhood influence a person’s life journey and his/her harmonious develop-ment. Decreased enrolment rates in preschool programmes in Ukraine are mainly related to the consequences of the socio-economic crisis in the 1990s, lower birth rates and, as a result, a sharp decline in the network of PEIs. In earlier years, a significant number of the state-owned PEIs were closed, reoriented and transferred to other ownership forms. The PEI network de-creased by 39.2 percent during 1990–2004. Over-all, there were 15,400 PEIs (1,200 of which were not operational) in 2008 as against 24,500 in 1990. The lowest value of this indicator was observed in 2004, at 14,900. During 2000–2004, there were less than 1 million children in these insti-tutions (the lowest value was 968,000 in 2001). In 2008, the number of children in PEIs had reached 1,195,000 (57 percent of all children of the corresponding age).
General secondary education. An overall de-crease in the number of school-age children in Ukraine has negatively affected the network of general educational institutions (GEIs). This has resulted in lower average school occupancy lev-els and a greater number of GEIs with a small number of pupils, which in turn has led to higher costs per pupil and a lower pedagogical load on teachers. The most affected have been schools in
rural areas. Owing to shortcomings in the current situation of financial, economic, material, human resources and scientific methodological support, implementation of a full-fledged curriculum in many educational institutions, primarily in ru-ral areas, remains problematic. The situation of rural schools in remote areas remains difficult. In the 2009/10 academic year, rural schools were attended by only 83.9 percent of those pupils who were in need (329,500).
In 2009, 391,257 children obtained a certifi-cate of completed general secondary education (against 505,477 in 2001). Specialized education is being introduced in senior school (10th–12th grades). As of September 2008, specialized educa-tion covered 1.35 million pupils of GEIs, or 28 per-cent.11 The Model Regulation on the Educational District was approved in 2006 to ensure that pu-pils living in remote areas would obtain a special-ized education. The primary education standards approved in 2005 require revision. The new state standards for general secondary education are be-ing developed. Gradual computerization of gen-eral secondary education is taking place: 93 per-cent of the schools in the country have computer classes.12 The School Bus Programme works in all regions of Ukraine; however, limited fuel supply, funded by local budgets, as well as ageing bus parks and lack of sufficient financing for their ren-ovation, remain critical issues.
Since 2008, Ukraine has been carrying out a gen-eral external evaluation of graduates of second-ary schools, which is mandatory for applicants to national higher educational institutions.
It is important for Ukraine to ensure integration into the system of comparative international studies. The Trends in International Mathemat-ics and Science Study (TIMMS) was conducted for the first time in Ukraine in 2007. According to its results, particularly those of international per-formance tests for the 4th and 8th grades, Ukraine ranked below the Russian Federation, Kazakhstan, Armenia and the Baltic countries. Agreements have been reached to include Ukraine in the Pro-11 Academy of Pedagogical Sciences of Ukraine. White Book of
the National Education. Part І. Kyiv: Academy of Pedagogical Sciences of Ukraine, 2009. – 185 p.
12 Cabinet of Ministers of Ukraine. Report on Situation and Development of Informatization in Ukraine in 2009, 8 November 2009.
gramme for International Student Assessment (PISA) and TIMSS in 2011. As a result, Ukraine will approach international standards of quality as-sessment of general secondary education.
Box 3. One of the priorities of state policy is to ensure the rights of orphans and children without parental care. The number of deprived children in Ukraine has increased during the past five years. There were 103,500 orphans and children without parental care in the country as of the beginning of 2009, 568 more than in 2008. An insignificant decrease in the number of educational institutions for orphans and children without parental care (in 2009 there were 203 institutions, as against 206 institutions in 2008) has been observed in the general secondary and preschool education system, resulting from the development of family education. The number of orphans and children without parental care in social rehabilitation institutions is not decreasing, however. The network of such institutions contains 11 general education schools and three vocational schools. Around 600 children are raised in the social rehabilitation institutions, in which the overall share of orphans and children without parental care is around 3 percent.
Out-of-school education. Out-of-school educa-tion is part of the continued education system. However, modernization and increased state sup-port are necessary in order to be able to secure further development of out-of-school education-al institutions and to provide additional oppor-tunities for the spiritual, intellectual and physical development of children and youth, who wish to acquire out-of-school education in various ar-eas (arts and aesthetics, tourism and local stud-ies, ecology and nature, science and technology, research and experimentation, physical train-ing and sports, military patriotic education, etc). In 2009, there were 625,700 children in children’s and youths’ sports schools; this is 98,000 fewer than in the previous year and 12.6 percent of the total number of pupils aged 6–18 (in 2008, this was 723,800, or 13.6 percent). In Ukraine, owing to the lack of sufficient financing for study, train-ing, necessary equipment and proper sports facil-ities, sports schools for children and youth are not able to prepare a reserve for the national teams and do not create the necessary competition for these. Funds earmarked for children’s and youths’ sports schools cover 76 percent of the wages of trainers and personnel; 5.4 percent of the total fi-
nancing covers study and training work. It should be noted that a similar situation can be observed in all educational institutions of the country, since key budget expenditure items are directed to pay wages and utility payments. Hence, out-of-school educational institutions have insufficient funding to ensure the educational and develop-ment process or to buy necessary accessories and equipment.
Vocational education. The number of graduates of VEIs was 239,355 in 2009 (against 266,757 in 2000). The vocational and educational orientation of Ukrainian youth has been affected by factors such as the declining prestige of occupations as a result of the recession in the 1990s, the increasing social significance of higher education in society and expanding public and commercial education sectors. These have increased demand for higher education among young people. For example, in the 2008/09 academic year, the ratio between the number of students at HEIs and the number of stu-dents at VEIs was 6.3 per 10,000 population, com-pared with 3.7 in 2000/01. Although the current list of occupations contains more than 7,000 po-sitions, vocational education fails to respond to actual demand in the labour market. The current dynamics of industry development common to a market economy requires professional education of a certain quality and efficiency, which can be integrated smoothly into the economy and which is flexible enough to respond to constant chang-es in the demand and supply of personnel.
Higher education. Significant reforms have been implemented within the national higher educa-tion system during the years since independence. These reforms correspond to the tenets of the Bologna Declaration: (1) Bachelor’s and Master’s degrees were introduced (the diploma certifi-cate was introduced much earlier); (2) a system of higher education cycles was introduced, with a completed higher education (a specialist’s or Mas-ter’s degree qualification) impossible to achieve without completion of the first cycle (Bachelor’s degree); (3) the ‘credit’ dimension of the labour intensiveness of education disciplines was intro-duced in 1994; (4) nowadays, more students and scientists study or work abroad compared with in 1991; and (5) cooperation has been enhanced with foreign educational institutions in education and research.
MILLENNIUM DEVELOPMENT GOALS. UKRAINE – 201046
Box 4. The number of students at HEIs of I-IV accreditation levels has increased during the years since independence, reaching the maximum level at the beginning of the 2007/08 academic year – 2,813,800 – and gradually decreasing later on: in the 2008/09 academic year – 2,763,900 – and in the 2009/10 academic year – 2,599,400 (i.e. the quantitative indicator in 2009 is at the 2004 level). This occurred because of: (1) a significant decrease in the admission rate, the maximum being at the beginning of the 2005/06 academic year – 672,300 – and the minimum at the beginning of the 2009/10 academic year – 463,900; (2) an increase in the number of graduates (in 2009 there were 642,100); (3) a loss of popularity of HEIs of the I-II level accreditation levels (at the beginning of the 2009/10 academic year, there were 354,200 students, whereas in 1995/96, there were 617,7000; 93,400 were admitted into HEIs at the beginning of the 2009/10 academic year, compared with 188,800 during the 1995/96 academic year); (4) a significant decrease in the admission rate to private HEIs (46,100 students in 2009, compared with 103,000 in 2005); and (5) the expulsion of students whose studies are funded by individuals (mostly because of the deterioration of households’ financial situation). In 2009, in full-time education at the expense of the state budget, 58,100 students out of 122,300 were admitted to Master’s degree courses and 109,900 students out of 215,700 to the Bachelor’s degree courses.
A set of legislative documents to improve the higher education system has been developed in Ukraine aimed at enabling the country to join the Bologna Process, in particular introducing a list of specialist qualification levels.
The Compass Programme, which created the HEI ranking among employers, was introduced in Ukraine in 2008. It should be noted that the number of applicants choosing prestigious spe-cializations owing to the increased range of edu-cational institutions – not just state- but also non-state-owned – is growing. Non-state institutions, which try to obtain licences to provide educa-tional services and issue educational certificates, specialize mostly in educating students majoring in specializations required by business (manage-ment, marketing, banking, economics and law). The long-term trends of demand and supply in the labour market are not always taken into account, which may lead to an increase in tensions in the
labour market in the future. The share of special-ists in disciplines such as economics, commerce and entrepreneurship out of the overall number of graduates of HEIs increased from 28.3 percent in 2000 to 33.3 percent in 2006.
Multiple attempts to reform the higher education system have not been integrated or systemic. Sec-tors producing public wealth, goods and services and sectors preparing respective specialists and conducting scientific research should be consid-ered in an integrated manner. Furthermore, while making forecasts of socio-economic develop-ment for the medium term, expected labour mar-ket needs, in line the scope of the Government’s need for specialists, must be taken into account.
Box 5. A de-stabilization of the higher educational services market is related to a significant forecast shortage in the number of graduates of VEIs and HEIs in upcoming years. There is a risk that these trends will aggravate the following: (1) a large-scale decrease in the number of scientific and teaching employees in HEIs, worsening of their financial situation and destabilization of general activities of HEIs; (2) a significant decrease in the supply of qualified workers and specialists with higher education in the national and regional labour markets.
Postgraduate education. Postgraduate educa-tion is an ongoing component of the national educational system, to ensure expansion and updating of professional knowledge and skills. In 2008, the total number of workers who had been retrained and raised their qualifications was 292,000, which significantly exceeded the level of previous years (2007–197,000 people). However, when comparing this with the number of registered enterprises and organisations, ac-cording to the National State Registry of Ukrain-ian Enterprises and Organisations (1,228,900 as of 1 January 2009), on average only one worker per four enterprises increased his/her skills level.
The current level of development of the modern economy and science and information technolo-gies requires new approaches to retraining and upgrading qualifications, and additional profes-sional education of students, from secondary education up to postgraduate and doctoral lev-els. There is a need to ensure the development of
CHAPTER TWO. MILLENNIUM DEVELOPMENT GOALS, ADAPTED FOR UKRAINE 47

continuous professional education (from second-ary school to university) following the multiver-sity model and applying innovative educational technologies based on the promotion of self-ed-ucation of pupils and students. Previous qualifi-cations must correspond with updated qualifica-tion requirements or be brought up to the level needed for work in new professions or new types of labour activities. Retraining teaching and man-agerial staff in the educational sector is equally important. The Law on Post-Graduate Education has still not been adopted in Ukraine.
Lifelong education (adult education). Rapidly changing demands in technology require con-tinuous skills enhancement and retraining of workers to allow them to enter into new profes-sions. Widespread economic changes and the in-creased flexibility of the labour market also mean that people need to change jobs and even pro-fessions, meaning an ever greater shift from tra-ditional forms of employment towards more flex-ible ones and the use of innovative technologies in professional training. This especially concerns the organisation of professional training for the unemployed, aiming at enhancing their competi-tiveness in the labour market.
Box 6. According to a sociological survey in Ukraine in 2007, 12.1 percent of respondents replied ‘yes’ to the question ‘Have you participated in any courses, lectures, training or lessons during the last 12 months prior to the survey that aimed to improve knowledge or skills needed for your job?’ (For comparison: Norway – 49.8 percent, Finland – 49.6 percent, Denmark – 47.2 percent, Sweden – 49.0 percent, Switzerland – 44.6 percent and Iceland – 51.8 percent). Ukraine’s ranking based on the indicator of positive replies is 23rd out of 25 countries (Source: Institute of Sociology of NAS of Ukraine).
Lifelong education must be available to all. This requires a change in approach in the coming years, towards reforming the educational system, stepping up the motivation to continuously im-prove education levels and creating efficient adult education establishments to satisfy the needs of the labour market. Implementing the continuous education concept envisages the removal of all restrictions to lifelong education.
ІІІ. Challenges
Challenges to achieving this Goal are cross-cut-ting. The main issues that prevent adaptation of the educational system to the current situation in-clude: (1) decrease in access to and lack of quality of education to meet current needs; (2) non-com-pliance of the education system with the needs of the labour market and discrepancy between the training of specialists and employers’ demands; (3) inefficient state financing mechanisms, while budget expenditures on education are constantly growing; and (4) overly centralized administra-tion. It is necessary to improve the efficiency of funds, which are currently spent mostly on the maintenance of educational institutions and not on improving educational outcomes.
Preschool and general secondary education. The lack of available places in PEIs and an absence of PEIs altogether in some settlements are most serious problems. In response, a range of alterna-tive institutions specializing in early childhood development have emerged. In several regions of Ukraine, social and pedagogical patronage has been established. The number of children aged three to five increased in preschool institu-tions in urban areas by 17.6 percent and in rural areas by 23.4 percent compared with 2005. How-ever, the introduction of various forms of enrol-ment for children in preschool education (short stay groups for children, weekend groups, family groups, child development centres, etc) remains a critical issue.
School buildings are outdated and uncomfort-able for children and teachers. In particular, ac-cording to data of the basic survey of 2005–2008 (conducted by the Institute of Sociological Technologies in 187 schools in six pilot districts of Ukraine within the framework of the Equal Ac-cess to Quality Education in Ukraine Project of the Ministry of Education and Science, supported by the World Bank), the average age of schools is 37 years. School buildings need urgent repairs, both structural and operational. Just 27.8 per-cent of general educational institutions have op-erational medical aid units. Educational resources are insufficient: only 68.6 percent of pupils are provided with textbooks for all subjects. There is a significant number of unused buildings: there
MILLENNIUM DEVELOPMENT GOALS. UKRAINE – 201048

are over 100 GEI buildings, with only 70 percent operational.
Vocational education. Growing negative trends are observed in the national professional educa-tion system, including: (1) weak adaptation of the educational services market to the needs of the labour market and the lack of systemic monitor-ing and forecasting of changes in the educational market that consider the labour market environ-ment; (2) slow rate of employment restructuring and inadequate changes in qualified personnel training; (3) deterioration of the quality of educa-tional services in VEIs and lack of a state system for ensuring the quality of vocational education; (4) insufficient financing of the development of vocational education and underdevelopment of its infrastructure; (5) disconnect between educa-tional institutions and employers; and (6) lack of incentives among teachers to introduce innova-tive educational technologies.
Inefficiency in relation to the choice of professions is caused by a lack of strategic analysis on labour market development, by the application of tradi-tional educational systems that are not adapted to changes in the requirements of youth and labour markets and by underdevelopment of a system of step-by-step professional training and continued education. Overcoming these obstacles will allow for an increase in youth’s adaptation potential, helping them to learn socially active behaviour and to become socialized professionally.
Higher education. The inadequacy of the admin-istration system of HEIs is characterized by its fragmented structure. In particular, at the begin-ning of the 2009/10 academic year, 293 HEIs of I-IV levels of accreditation were under the admin-istration of the Ministry of Education and Science of Ukraine; 56 were under the Ministry of Health of Ukraine; 47 the Ministry of Agricultural Policy of Ukraine; 35 the Ministry of Culture and Tourism of Ukraine; 20 the Ministry of Transport and Com-munication of Ukraine; 13 the Ministry of Internal Affairs of Ukraine; 10 the Ministry of Ukraine for Family, Youth, and Sports; and 8 the State Com-mittee of Forestry of Ukraine. In addition, five HEIs of I-IV level of accreditation are under the ad-ministration of the Ministry of Defence of Ukraine and the Ministry of Labour and Social Policy of
Ukraine, with 169 HEIs of I-IV levels of accredita-tion under the administration of other ministries.
There is a lack of cooperation between employers and HEIs, which limits employment opportunities for HEI graduates. Only a few Ukrainian employ-ers are ready to invest in education, as shown by the low level of tuition paid for students by the legal entities (enterprises). In particular, 52 junior specialists (out of 145,100), 923 Bachelor’s degree students (out of 315,600), 686 specialists (out of 277,000) and 94 Master’s degree students (out of 98,200) were admitted to HEIs paid by legal en-tities in 2009.
A competency-based curriculum for HEIs needs to be developed, which would allow knowledge obtained to be applied in the labour market. In addition, there is inadequate development of qualification frameworks for specialists, who must be trained by educational institutions of different types, and an insufficient level of assessment of the regional labour market’s needs for qualified staff. Particularly important issues are education-al plans, especially the ratio of basic and variable components within them. Work to improve lists of courses and qualifications for training special-ists with higher education is inadequate: the de-velopment of ’third generation’ higher education standards has slowed down.
Box 7. Problems in training and skills improvement of experts in the education area include: (1) insufficient provision of VEIs with highly qualified teaching staff: only 85 percent of the need is satisfied. Currently, 10,800 (21.9 percent) of teaching employees of pre-retirement and retirement age still work and 39 percent of teaching employees have not completed higher education; (2) insufficient professional training of teaching staff and limited institutional opportunities to enhance their qualifications: only 63.4 percent of managers of GEIs have obtained specialized education or have completed special courses to assume their posts and 84.1 percent of teachers consider mastering modern and interactive educational technologies during the teaching process as a part of skills improvement; (3) incomplete numbers of teaching staff in GEIs and VEIs, which impacts the quality of service provision; and (4) the current staff training programmes, forms and methods need significant improvement.
CHAPTER TWO. MILLENNIUM DEVELOPMENT GOALS, ADAPTED FOR UKRAINE 49

Owing to the imbalance between the labour market and the educational system, a reorienta-tion of higher education towards a multilevel sys-tem of personnel training is needed. An HEI can strengthen its position within the ‘institute – stu-dent – employer’ system simply by identifying po-tential consumers’/employers’ demands for com-petitive specialists in the labour market. Ukraine’s current educational system does not ensure the rapid development of professionally oriented higher education.
Weak competency in specialization. Inconsist-ency of educational content with the demands of the labour market. Educational programmes are overloaded with factual information. Selec-tion of programmes is not allowed, textbooks are of poor quality, educational innovations take place ineffectively and teaching methods need improvement.
Standards in both general secondary and higher education are in the process of continuous trans-formation and modernization. The major criteria in evaluating the educational system are the de-mand in the labour market for graduates and their high competitiveness during assessment of their qualification level by employers. Experts consider that efficiency, i.e. students’ ability to use the ac-quired knowledge and skills in practice, is one of the most problematic aspects of the higher edu-cation system.
Given the current lack of a coordinated and con-sistent policy in developing the ‘triangle of knowl-edge’ of education, science and innovation, these fields function independently, without coordi-nation and joint objectives. Higher educational institutions play a secondary role in conducting advanced scientific research, which is the basis for elite university training. In this context, a system of state priorities was built and university educa-tion took on an enlightening, supporting role but not a productive and innovative one.
Access to quality education. As mentioned, prob-lems of equal opportunities for all to access qual-ity education, starting from preschool education, remain. Quality education is limited by problems of staff, retraining and teachers’ skills, as well as by material, technical, scientific and methodologi-cal issues in terms of providing education. Access
to preschool education is problematic in big cit-ies and in rural areas, whereas access to quality secondary education causes problems primarily in remote rural areas. Education of children with special needs remains critical too. For example, there is a lack of textbooks and specialized litera-ture for children with visual and hearing impair-ments. There are difficulties in access to qual-ity education for children who live in boarding schools under the social protection system, which do not conduct any educational activities and do not have appropriate specialists and teachers. There are cases of child refugees not attending school.13
Box 8. According to the data of the annual reports of Ukrainian Helsinki Human Rights Union, almost 20,000 children of school age did not attend schools in 2005 (the 2007 report suggests that the situation had not changed) (Source: Y. Zakharova, I. Rapp, V. Yavorsky / Ukrainian Helsinki Human Rights Union. Human Rights in Ukraine – 2007. Kharkiv: Prava Ludyny, 2008.).
The excessive number of disciplines in the study plan and the burden on teachers decrease the quality of education. The issue of access to quality education must be resolved, especially higher ed-ucation, which becomes more paid, i.e. which is inaccessible for families with low income levels. A financial support programme for youth from low-income families has been established, entailing provision of educational credits (the programme budget amounted to UAH 15 million in 2008/09). Lack of demand for qualifications among gradu-ates, insufficient work experience and not being psychologically ready to make their own deci-sions are among the causes of youth unemploy-ment. An effective system of lifelong education and enhancing qualifications in modern profes-sions would help to facilitate economic recovery.
13 United Nations Children’s Fund (UNICEF). Alternative Report on Ukraine’s Implementation of the United Nations Convention on the Rights of the Child 2002–2008. Kyiv: UNICEF, 2009. – 90 p.
MILLENNIUM DEVELOPMENT GOALS. UKRAINE – 201050

IV. Moving Forward
To further develop the preschool education sys-tem it is important to ensure that the network of PEIs is optimal and balanced enough to respond to the population’s needs and demographic situa-tion. In this direction, it is necessary to: (1) increase the number of places within the PEIs of com-munal property according to need and transfer ministerial PEIs and those financed by collective agricultural enterprises to communal property; (2) develop the network of PEIs of compensating and combined types owing to an increase in child morbidity and continue the development of child development centres; (3) strengthen scientific and methodological support to preschool educa-tion, update its standards and introduce on wide scale a new generation of preschool education programmes; (4) enhance functions of preschool institutions by introducing socio-pedagogical patronage by families who raise children of pre-school age, including those with psychological impairments who, for different reasons, do not attend preschool institutions; and (5) support the establishment of educational associations of ‘pre-school institutions – schools.’
In order to enhance the population’s access to general secondary education and raise its quali-ty, it is necessary to: (1) create an optimal network of GEIs by enlarging specialized senior schools and enhance the network of educational institu-tions based on the ‘schools – families,’ principally by taking into account the specifics of the local and demographic situation; (2) provide transpor-tation services (including the state Programme on School Bus) for all pupils in rural areas who live at a distance of more than 3 km from schools and arrange transportation to school; (3) fully im-plement computerization of VEIs, HEIs and inter-school vocational training and production plants (including equipping schools with modern com-puters, licensed software and telecommunica-tions, as well access to the internet); and (4) im-plement the Action Plan for the Development of Natural Sciences and Mathematical Education as well as the State Programme on Work with Gifted Youth for 2007–2010 and expand the State Pro-gramme on the School of the Future to all regions of the country.
In order to ensure monitoring and quality con-trol of secondary education, it is necessary to: (1) create a system of monitoring studies on the quality of education of pupils of GEIs; (2) ensure participation in comparative studies (TIMMS and Progress in International Reading Literacy Study (PIRLS)); and (3) introduce a ranking system for GEIs by taking into account results of an external independent evaluation on knowledge and pub-lications of relevant information.
In order to enhance access to education, it is im-portant to: (1) introduce a strategy of inclusive ed-ucation and integration of children with special needs; (2) create a sufficient number and quality of educational materials and train personnel to teach children of national minorities; and (3) pro-mote the education of children from marginal-ized families in GEIs.
In order to facilitate the education of children with special needs and enable inclusive education, it is necessary to: (1) adopt strategies of inclusive edu-cation at the state level and bring Ukraine in line with European standards; (2) ensure special train-ing and enhance qualifications in psychophysi-cal development of teaching staff working with children with special needs, within the frame-work of inclusive education in preschool, general education and out-of-school- educational institu-tions; (3) widely disseminate forms of integrated (inclusive) education of children with special needs; (4) identify an employment mechanism for graduates with special needs; (5) provide special GEIs with equipment for individual and collective use under the Programme on Correctional Educa-tion; and (6) create the conditions for unhindered access by individuals with special needs to social infrastructure of educational institutions.
In order to promote the education of children of national minorities, it is recommended to: (1) im-plement sectoral programmes for improving the study of the Ukrainian language in educational institutions as well as national minority languag-es; (2) provide GEIs that teach national minority languages with up-to-date textbooks and edu-cational and methodological materials; (3) facili-tate the operations of weekend schools, in which languages of national minorities are studied, and provide these schools with educational and methodological literature and appropriate edu-
CHAPTER TWO. MILLENNIUM DEVELOPMENT GOALS, ADAPTED FOR UKRAINE 51

cational means; and create proper conditions for enhancing teachers’ qualifications.
In order to increase the level of coverage of chil-dren of out-of-school education and to improve its quality, it is necessary to: (1) elaborate the Concept of the Out-of-school Education Develop-ment for 2010–2014; (2) implement the State Pro-gramme on the Youth of Ukraine for 2009–2015; (3) provide out-of-school educational institutions with technical education equipment and educa-tional and methodological materials; etc.
In order to increase the quality of vocational education, it is important to: (1) develop the Con-cept of the Vocational Education Development in Ukraine for 2010–2020; (2) facilitate the introduc-tion of flexible module technologies for profes-sional training of personnel at work; (3) create a system of independent qualification attestation; (4) ensure that the computerization of vocation-al education responds to the informational and communicational needs of the participants of the study process; (5) develop minimum standards in providing training workshops, stations, labora-tories and grounds in state VEIs with new equip-ment, machines, etc.
In addition, measures need to be taken on: (1) op-timization of the network of VEIs in line with the prospective needs of the economy, taking into account the demographic situation and labour market needs; and (2) creation of an experimen-tal teaching network based on VEIs by respective sectors aimed at the development and introduc-tion of state standards for blue-collar jobs.
In order to overcome complications in the transi-tion period towards harmonization of higher ed-ucation development with European trends, the following must be ensured: (1) expansion of edu-cational institutions’ autonomy; (2) reform of the HEI network by expanding and creating regional universities and strengthening cooperation of employers with HEIs; (3) decrease fragmentation of HEIs’ subordination in order to eliminate dupli-cation in training of specialists and more rational utilization of funds earmarked for higher educa-tion; (4) promotion of integration processes in the educational system by creating an educational and an educational-scientific-manufacturing in-terface; and (5) development and provision of
computer equipment, licensed software products and telecommunication equipment in distance learning centre networks.
Procedures for admission tests must be improved by balancing the results of external independ-ent evaluations of educational achievements of graduates of secondary educational institutions, results of entrance exams and average marks on the school certificate, aiming at ensuring equal constitutional rights in youth’s access to higher education.
In order to implement the Bologna Declaration provisions, a range of measures must be system-ized, particularly to: (1) develop and ensure the adoption of certain governmental documents on the restructuring of professions of training spe-cialists with Master’s degrees and junior specialist educational qualifications; (2) introduce a system of academic educational and professional quali-fications, grades and appendices to diplomas in line with European requirements; (3) create con-ditions for the mobility of students and teachers of HEIs, aiming at ensuring their competitiveness in the European labour market; and (4) facilitate Ukraine’s participation in international educa-tional and scientific projects. It is also necessary to develop the National Qualifications Framework in line with the general qualification framework in European higher education and to follow a strat-egy of joining the European Quality Assurance Register for Higher Education.
Expedient measures include: (1) enhancing so-cial partnerships among HEIs and employers, the population and their associations, and inviting them to take part in working out and adopting decisions on higher education issues; (2) optimiz-ing volumes of training and retraining for staff with higher education in the context of innova-tive development of the national economy; and (3) providing state support to training specialists dealing with high priority industries of the econo-my in the form of ‘science-education-technology’ through integration with scientific institutions and manufacturing.
The following are needed in terms of quality en-hancement: (1) establishing a system of quality monitoring and ranking of education of students and activities of HEIs; and (2) creating and intro-
MILLENNIUM DEVELOPMENT GOALS. UKRAINE – 201052

ducing employment monitoring of graduates of HEIs at regional and state levels by involving cen-tral and local authorities and employers.
To enhance the functioning of the higher edu-cation system, the following needs to be under-taken: (1) improving the state order system for the training of specialists; (2) ensuring develop-ment of distance learning as a form of training and retraining and increasing qualifications; (3) implementing the State Programme on Informa-tion and Communicational Technologies in Edu-cation and Science for 2006–2010; (4) ensuring an increase in the quality of professional and practi-cal training of educational stakeholders; and (5) developing standards in relation to the burden of academic responsibilities on teachers and the fi-nancial resources per student in HEIs, etc.
In order to develop a modern system of contin-ued professional education, it is necessary to: (1) increase the number of institutions that pro-vide services in professional education and staff
training (inter alia, by attracting civil society or-ganisations); (2) create conditions for enhancing civil and professional mechanisms of attestation and accreditation of educational programmes; (3) enhance the role of civil society organisations in educational management; (4) design a general national system to assess education quality and implement educational programmes; and (5) cre-ate conditions to ensure the educational mobility of students.
Development of education content should en-sure: formation of competences for personal de-velopment; participation in the democratic pro-cedures of civil society; adaptation to the labour market; and lifelong education. The following is necessary in this direction: (1) coordinating edu-cational standards with best international prac-tices and standards; (2) creating a free market for textbooks and independent commissions for competition among authors; and (3) creating re-gional distance learning centres.
CHAPTER TWO. MILLENNIUM DEVELOPMENT GOALS, ADAPTED FOR UKRAINE 53
This subchapter analyses the current situa-tion with respect to ensuring gender equality. The basic gender development principles in Ukraine are determined by the Constitution of Ukraine. This provides that all citizens, regard-less of their gender, have equal constitutional rights and liberties. This is ensured by provid-ing women with equal rights and opportuni-ties for self-affirmation in all spheres of life. However, the constitutional provisions can be implemented only when they are embedded within the legislation system in general and are being enforced by means of proper institu-tional mechanisms.
І. Targets and Indicators
Targets Indicators
Target 3.A: Ensure gender representativeness at the level of no less than 30–70% in representative bodies and high-level executive authorities
3.1. Gender ratio among the members of the Parliament of Ukraine, number of women/number of men3.2. Gender ratio among the members of local authorities, number of women/number of men3.3. Gender ratio among the higher-level civil servants (1–2 categories), number of women/number of men
Target 3.B: Halve the gap in incomes between women and men
3.4. Ratio of average wages between women and men, %
GOAL 3: PROMOTE
GENDER EQUALITY
MILLENNIUM DEVELOPMENT GOALS. UKRAINE – 201054
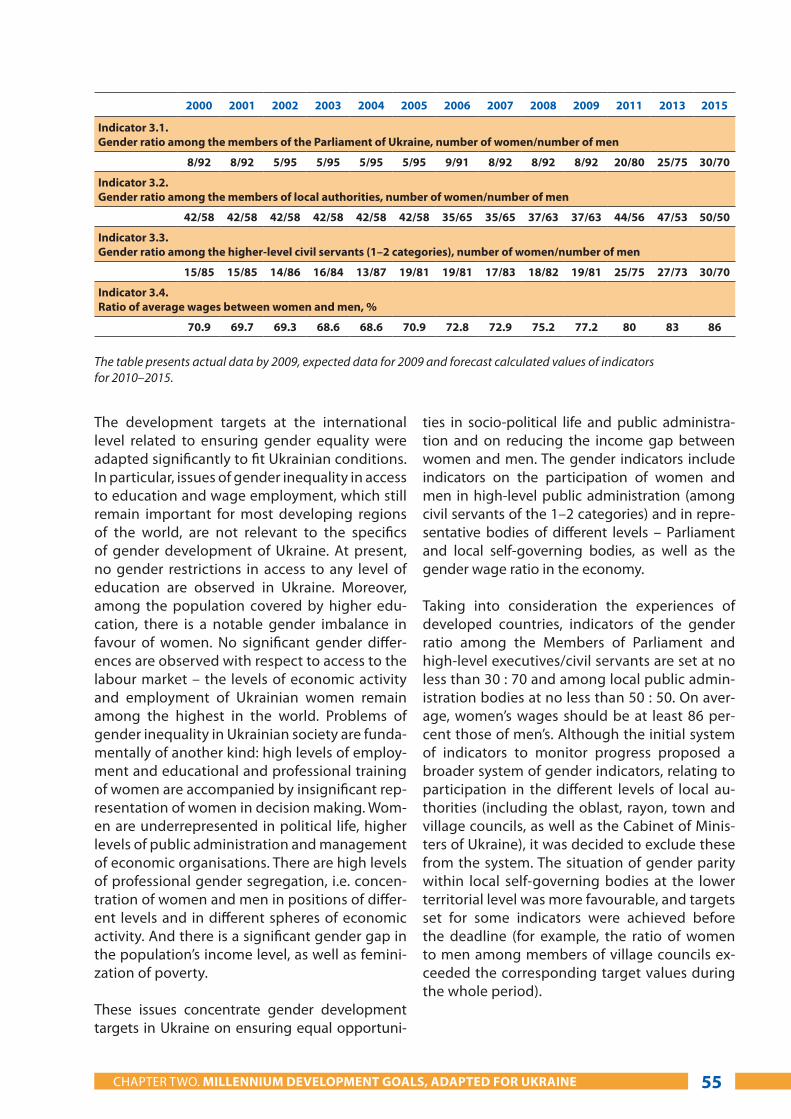
The development targets at the international level related to ensuring gender equality were adapted significantly to fit Ukrainian conditions. In particular, issues of gender inequality in access to education and wage employment, which still remain important for most developing regions of the world, are not relevant to the specifics of gender development of Ukraine. At present, no gender restrictions in access to any level of education are observed in Ukraine. Moreover, among the population covered by higher edu-cation, there is a notable gender imbalance in favour of women. No significant gender differ-ences are observed with respect to access to the labour market – the levels of economic activity and employment of Ukrainian women remain among the highest in the world. Problems of gender inequality in Ukrainian society are funda-mentally of another kind: high levels of employ-ment and educational and professional training of women are accompanied by insignificant rep-resentation of women in decision making. Wom-en are underrepresented in political life, higher levels of public administration and management of economic organisations. There are high levels of professional gender segregation, i.e. concen-tration of women and men in positions of differ-ent levels and in different spheres of economic activity. And there is a significant gender gap in the population’s income level, as well as femini-zation of poverty.
These issues concentrate gender development targets in Ukraine on ensuring equal opportuni-
ties in socio-political life and public administra-tion and on reducing the income gap between women and men. The gender indicators include indicators on the participation of women and men in high-level public administration (among civil servants of the 1–2 categories) and in repre-sentative bodies of different levels – Parliament and local self-governing bodies, as well as the gender wage ratio in the economy.
Taking into consideration the experiences of developed countries, indicators of the gender ratio among the Members of Parliament and high-level executives/civil servants are set at no less than 30 : 70 and among local public admin-istration bodies at no less than 50 : 50. On aver-age, women’s wages should be at least 86 per-cent those of men’s. Although the initial system of indicators to monitor progress proposed a broader system of gender indicators, relating to participation in the different levels of local au-thorities (including the oblast, rayon, town and village councils, as well as the Cabinet of Minis-ters of Ukraine), it was decided to exclude these from the system. The situation of gender parity within local self-governing bodies at the lower territorial level was more favourable, and targets set for some indicators were achieved before the deadline (for example, the ratio of women to men among members of village councils ex-ceeded the corresponding target values during the whole period).
2000 2001 2002 2003 2004 2005 2006 2007 2008 2009 2011 2013 2015
Indicator 3.1. Gender ratio among the members of the Parliament of Ukraine, number of women/number of men
8/92 8/92 5/95 5/95 5/95 5/95 9/91 8/92 8/92 8/92 20/80 25/75 30/70
Indicator 3.2. Gender ratio among the members of local authorities, number of women/number of men
42/58 42/58 42/58 42/58 42/58 42/58 35/65 35/65 37/63 37/63 44/56 47/53 50/50
Indicator 3.3. Gender ratio among the higher-level civil servants (1–2 categories), number of women/number of men
15/85 15/85 14/86 16/84 13/87 19/81 19/81 17/83 18/82 19/81 25/75 27/73 30/70
Indicator 3.4. Ratio of average wages between women and men, %
70.9 69.7 69.3 68.6 68.6 70.9 72.8 72.9 75.2 77.2 80 83 86
The table presents actual data by 2009, expected data for 2009 and forecast calculated values of indicators for 2010–2015.
CHAPTER TWO. MILLENNIUM DEVELOPMENT GOALS, ADAPTED FOR UKRAINE 55

II. Situation Analysis
The low level of gender development in society has led to a deepening of gender-based socio-economic differentiation. It has also led to limited realization of gender equality as declared in the Constitution of Ukraine as well as in the principles of democratic society. Moreover, the existence of gender inequality slows down opportunities for economic development, weakens the public ad-ministration system and reduces the efficiency of human development strategies.
Equal participation of women and men in politi-cal life and in higher levels of the public admin-istration is a requirement not just for fairness and democracy but also for obtaining equality in so-ciety and promoting gender-sensitive policy in other spheres of life. Interregional comparisons also prove that higher indicators of women’s participation in governmental structures in each country are accompanied by lower levels of cor-ruption, and help strengthen the social orienta-tion of state policy.
Ukraine’s unfavourable position on this indica-tor is determined by representation of women in the Parliament: during the entire period since independence, their share among Members has not exceeded 8 percent and, during 2002–2006, it even decreased to 5 percent. At the same time, women occupy on average around 30 percent of parliamentary seats in the EU and even higher in northern European countries that have been suc-cessful in attaining higher levels of progress on gender equality (for example, in Sweden, the share of seats in the Parliament occupied by women is equal to 47 percent, in Netherlands 42 percent, in Finland 40 percent and in Norway 39 percent).14 At present, Ukraine not only is behind the best European examples, but also comes in below the average indicator of women’s participation in other national parliaments (18.7 percent).
The current exclusion of Ukrainian women from decision making at the highest political levels is in-consistent with high indicators on their participa-tion in the lower levels of the public services sec-tor. In general, there are fewer women than men civil servants – at both managerial and specialist
14 Data of the Inter-Parliamentary Union as of 31 December 2009: www.ipu.org/wmn-e/regions.htm.
levels (64.8 percent and 79.5 percent, respective-ly, as of the beginning of 2009). However, women constitute the absolute majority of civil servants in lower-level positions – this requires lower qual-ifications and does not entail significant respon-sibility (Figure 7). As we go higher up, their share decreases, reaching only 13.3 percent in the first position category of managers who participate in decision making at the state level. Although at the beginning of the decade an increase was ob-served in the share of women among higher-level civil servants in 1–2 categories (from 15 percent in 2001 to 19 percent in 2005), this trend was un-stable: according to 2008 data, women in Ukraine comprise 18 percent of higher-level civil servants.
Women are much better represented at the local level of administrative bodies through-out the world, including in Ukraine. According to 2008 data, the share of women’s representation within local administrative authorities was 37 per-cent; among the members of oblast-level au-thorities 12 percent; rayon authorities 23 percent; town authorities 28 percent; and small and big village councils 51 and 46 percent, respectively. Less power to access economic resources and their distribution, as well as in decision making at the local level, remain the determining factors in ensuring a higher level of women’s activity within local administrative authorities.
Some concern is raised by the decrease in wom-en’s representation within administrative au-thorities compared with 2001 data, when women accounted for 40 percent of members of local councils. However, owing to a higher level of gen-der parity at the local level, one can observe a cadre of quality personnel among women who have the same educational and professional level as men as well as the necessary working experi-ence, and who are able to work in the higher lev-els of public administration at the national level. With appropriate career development support for competent female personnel at the local level, such as leadership skills training, promotion of role models and the provision of family care sup-port, these women may be mobilized to higher management positions at the national level.
The possibility of accessing economic resources remains an important component of the gen-der equality concept. The gender gap in the in-
MILLENNIUM DEVELOPMENT GOALS. UKRAINE – 201056

come level in Ukraine is very large. According to the Household Budget Survey conducted by the State Statistics Committee of Ukraine in 2008, women’s average income is only 65.2 percent of the average income of men, i.e. UAH 8,018 against UAH 12,305 per year, respectively. Obviously, such significant differences in income level are unjusti-fied, considering the equal educational and quali-fication potential of women and men, women’s high level of economic activity and employment and the lack of significant gender differences in unemployment indicators.
Gender disproportions in the material welfare of the population are reflected not just in wom-en’s lower incomes but also in differences in the sources of incomes. In comparing income source structures between men and women, gender inequality in the labour market is evident, since women’s incomes, to a great extent, are from non-labour sources (pensions, stipends and benefits), whereas the share of men’s employment income, including both remuneration and income from entrepreneurial and self-employed activities, is significantly higher. Moreover, the latter sources of income contribute the most to the gender gap: i.e. women’s average income from entrepreneur-
ial activities is only 34.3 percent of that of men, and women’s average income from self-employ-ment is 39.5 percent of that of men.
The gender gap in the income level increases if we consider the uncalculated share of income re-lated to unpaid work within the household and care for family members, i.e. activities conducted mostly by women. In particular, according to data from sociological studies,15 the vast majority of men (60 percent of interviewees) are engaged in 1–15 hours of housework per week (34 percent do 5–15 hours a week); the vast majority of wom-en (60 percent of respondents) do 5–30 hours a week (30 percent do 15–30 hours a week). There is a significantly lower share of men engaged in housework for 30–60 hours a week (13 percent against 25 percent for women). In sum, wom-en’s roles are significantly broader than those of men and cover household activities and rais-ing children as well as professional activities. For men, employment in the labour market remains the major activity. This leads to women’s double workload, limiting their opportunities for person-
15 Y. Saienko. Gender Stereotypes and Society’s Attitude towards Gender Problems in the Ukrainian Society. Кyiv: UNDP, Center for Social Expertise of the Institute of Sociology of NAS of Ukraine, 2007. – 70 p.
Figure 7. Gender Structure of Civil Servants in Ukraine by Position Categories, at the beginning of 2010
Source: Data of the State Statistics Committee of Ukraine.
83.8
79.1
71.1
62.3
64.1
46.2
70.0
69.1
48.7
41.5
25.6
13.3
16.2
20.9
28.9
37.7
35.9
53.8
30.0
30.9
51.3
58.5
74.4
86.7
0% 10% 20% 30% 40% 50% 60% 70% 80% 90% 100%
the first
the second
the third
the fourth
the sixth
the second
the third
the fourth
the sixth
the seventh
Women, %
Men, %
spec
ialis
ts b
y po
sitio
n ca
tego
ries
man
ager
s by
pos
ition
ca
tego
ries
the fifth
the fifth
CHAPTER TWO. MILLENNIUM DEVELOPMENT GOALS, ADAPTED FOR UKRAINE 57

al growth, professional development, leisure and self-fulfilment.
Official statistics on the domestic labour market show less significant differences in remuneration than are seen in the data of the Household Budg-et Survey: the gender gap in the average wage fluctuated at 30 percent during 2000–2009. How-ever, a positive trend of reducing differences in this field started from 2004 (Figure 8). As a result, women’s average wage increased to 77.2 percent that of men’s average wage (UAH 1,677 against UAH 2,173 a month, respectively, in 2009). The gender gap in the wage level is caused by a range of objective reasons, including: inter-industry dif-ferences and differences between wages; spe-cificities of educational and qualification levels; working conditions; overall input into labour results; duration of labour period; and work schedule. In particular, women more often work part-time; are employed more than men in low-er-paying industries (particularly, in the public sphere – education, health care and social serv-ices); have a shorter length of service; and, to a lower extent, are employed under harmful work-ing conditions and do not receive the appropriate compensations.
At the same time, ‘vertical’ professional segrega-tion remains the major manifestation of gender discrimination in remuneration in Ukraine, which results in women being concentrated mostly in positions with lower wages: the steady relation-ship between the gender gap in income levels and socio-economic status of the population is proof of this. According to data from the House-hold Budget Survey in Ukraine, a larger gender gap in remuneration is observed among employ-ers (women’s average income is 50.7 percent of men’s income), whereas among employees the ratio increases to 79.3 percent and among the self-employed to 97.5 percent.
Since wages are the major source of income for the population, the gender gap in this field leads to an excessive risk of the feminization of pov-erty, since women dominate in the vulnerable categories of the Ukrainian population (one-par-ent families with children and the elderly living alone). Although data on the intra-family distri-bution of incomes disaggregated by gender are almost inaccessible, since the household is the focus of research in the national statistics system, analysis of family incomes depending on gender of the household head identifies some gender differences, which grow in single-person house-
Figure 8. Ratio of Average wages of women and Men in Ukraine, 2000–2009
Source: State Statistics Committee of Ukraine.
0
500
1000
1500
2000
2500
2000 2001 2002 2003 2004 2005 2006 2007 2008 2009
UA
H p
er m
onth
50.0
55.0
60.0
65.0
70.0
75.0
80.0
%
Average wage of women, UAH per month
Average wage of men, UAH per month
Ratio of the average wage of women and men, %
MILLENNIUM DEVELOPMENT GOALS. UKRAINE – 201058

holds. In particular, from a gender point of view, women of retirement age living alone experience the highest risk of poverty in Ukraine (Table 7).
Obviously, problems of poverty feminization have deepened as a result of the economic crisis, whose consequences are fully visible in Ukraine. A decrease in the already low wage level and an accumulation of arrears in wage payments have influenced women’s situation as representatives of the less-protected groups of population.
It is also recognized at the international level that the global economic crisis may lead to a deteri-oration of the situation of women in the labour market owing to accelerated unemployment.16 However, the situation is less straightforward in Ukraine. Although the number of unemployed women registered in the State Employment Serv-ice of Ukraine exceeds the number of men (Fig-ure 9), such gender-related unemployment is tra-ditional in Ukraine. On the other hand, an analysis of data on the real labour force supply in the la-bour market shows that, during the past decade, the unemployment level among economically ac-tive men of 15–70 years of age has insignificantly exceeded that of women in the same category (6.6 percent against 6.1 percent in 2008; 10.3 per-cent against 7.3 percent in 2009), owing to eco-nomic restructuring and closure of large indus-trial enterprises in traditionally male spheres of activity.
Considering the immediate negative impact of the current economic crisis on the heavy indus-try of Ukraine, where men prevail among the
16 United Nations (UN). The Millennium Development Goals Report 2009. New York: UN, 2009. – 56 p.
employed, the trend is preserved. The construc-tion industry, in which women represent fewer than 20 percent of the average number of work-ers, has also experienced losses. On the other hand, women constitute the majority of workers within the public sector (particularly, education, health care, social services provision, public ad-ministration system, etc), thus are more protected with respect to employment guarantees.
Problems of unequal opportunities for women and men in Ukraine are not limited to socio-po-litical life, the labour market and income levels. Numerous gender inconsistencies are present within the socio-demographic sphere and are related to the health and life expectancy of the population, family legal relationships and issues of family violence, labour migration, including il-legal migration, and also human trafficking. There is a large gender gap of 12 years in terms of av-erage life expectancy of the population (average life expectancy at birth is 74 years for women against 62 years for men), which remains a signifi-cant indication of inequality. The major compo-nent of this gap is made up of losses of men at the most productive age, that is, the extremely high mortality rate among men of working age. In par-ticular, according to demographic calculations, as of 2008, the probability of not living until 60 years of age was 39 percent for boys of 16 years of age against 14.5 percent for girls of the same age. Ex-ternal reasons play a significant role in this ‘male’ mortality, which may be eliminated with an im-provement in lifestyle.
A well-defined ‘gender character’ is also common to the structure of population morbidity – espe-cially for socially determined diseases, whose
Table 7. Gender Indicators of Poverty of Ukrainian Population, 2008
Types of households Poverty level, % Extreme poverty level, %
Households headed by men, out of which 26.3 13.2
- households consisting of one person 17.8 8.1
- households of retirees living alone 17.5 6.6
Households headed by women, out of which 27.8 14.2
- households consisting of one person 19.1 7.8
- households of retirees living alone 21.3 8.6
Source: Calculated based on the data of the Household Budget Survey of the State Statistics Committee of Ukraine.
CHAPTER TWO. MILLENNIUM DEVELOPMENT GOALS, ADAPTED FOR UKRAINE 59
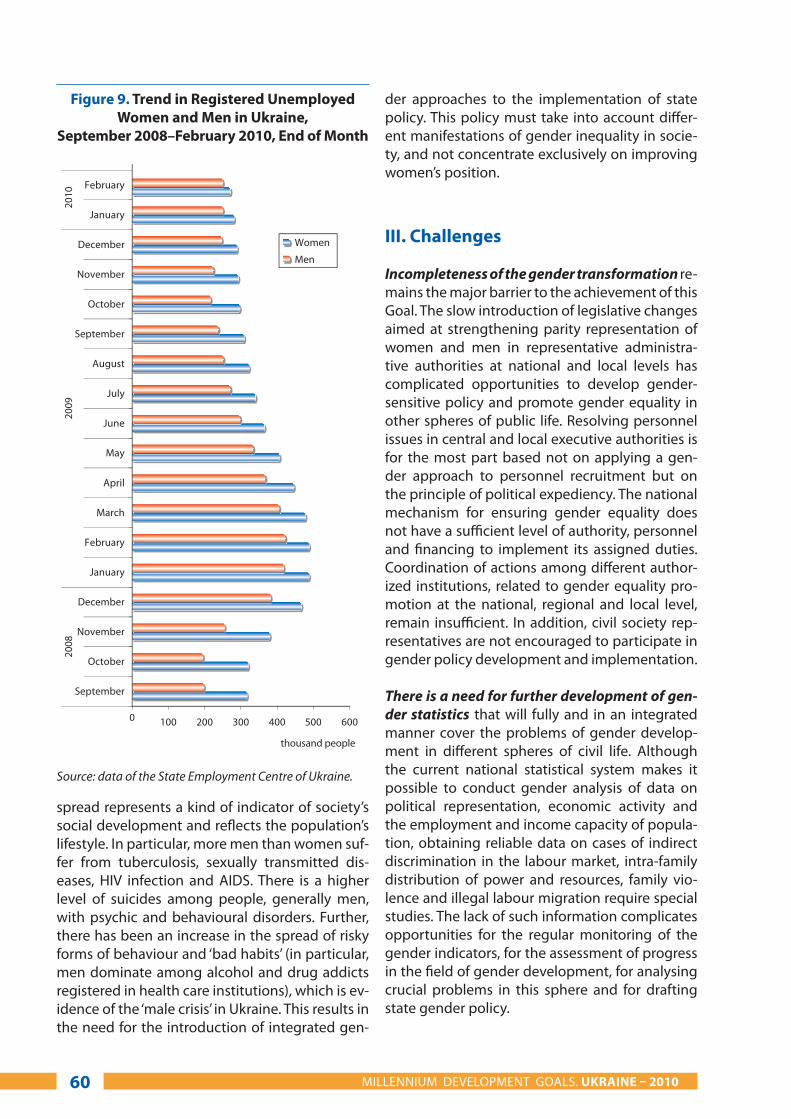
spread represents a kind of indicator of society’s social development and reflects the population’s lifestyle. In particular, more men than women suf-fer from tuberculosis, sexually transmitted dis-eases, HIV infection and AIDS. There is a higher level of suicides among people, generally men, with psychic and behavioural disorders. Further, there has been an increase in the spread of risky forms of behaviour and ‘bad habits’ (in particular, men dominate among alcohol and drug addicts registered in health care institutions), which is ev-idence of the ‘male crisis’ in Ukraine. This results in the need for the introduction of integrated gen-
der approaches to the implementation of state policy. This policy must take into account differ-ent manifestations of gender inequality in socie-ty, and not concentrate exclusively on improving women’s position.
ІІІ. Challenges
Incompleteness of the gender transformation re-mains the major barrier to the achievement of this Goal. The slow introduction of legislative changes aimed at strengthening parity representation of women and men in representative administra-tive authorities at national and local levels has complicated opportunities to develop gender-sensitive policy and promote gender equality in other spheres of public life. Resolving personnel issues in central and local executive authorities is for the most part based not on applying a gen-der approach to personnel recruitment but on the principle of political expediency. The national mechanism for ensuring gender equality does not have a sufficient level of authority, personnel and financing to implement its assigned duties. Coordination of actions among different author-ized institutions, related to gender equality pro-motion at the national, regional and local level, remain insufficient. In addition, civil society rep-resentatives are not encouraged to participate in gender policy development and implementation.
There is a need for further development of gen-der statistics that will fully and in an integrated manner cover the problems of gender develop-ment in different spheres of civil life. Although the current national statistical system makes it possible to conduct gender analysis of data on political representation, economic activity and the employment and income capacity of popula-tion, obtaining reliable data on cases of indirect discrimination in the labour market, intra-family distribution of power and resources, family vio-lence and illegal labour migration require special studies. The lack of such information complicates opportunities for the regular monitoring of the gender indicators, for the assessment of progress in the field of gender development, for analysing crucial problems in this sphere and for drafting state gender policy.
Figure 9. Trend in Registered Unemployed women and Men in Ukraine,
September 2008–February 2010, End of Month
Source: data of the State Employment Centre of Ukraine.
MILLENNIUM DEVELOPMENT GOALS. UKRAINE – 201060
0
100 200 300 400 500 600
September
October
November
December
January
February
March
April
May
June
July
August
September
October
November
December
January
February
thousand people
Women
Men

There is an insufficient level of awareness of the legal aspects of ensuring the equal rights and op-portunities for women and men, of methods of prevention and of instruments to counter gen-der discrimination, and a low level of usage by the population of existing mechanisms to redress rights violations. The mass media’s insufficiently active position concerning covering current gen-der issues, ways to solve them and examples of best practices, as well as use of social advertising, also do not attract enough public attention to these issues. Moreover, the dominance of sexist advertisements renders ineffective any solitary attempts of the mass media to provide gender-sensitive information, and also deepen the gen-der imbalance.
Established gender stereotypes in society. Views on the traditional distribution of gender roles in civil and private life, employment in the labour market and within the household, ‘male’ and ‘fe-male’ professions and types of activities remain widespread in Ukrainian society. Insufficient en-gagement of men in fulfilling family and paternal duties makes it difficult for women to combine professional activities and housework, opportu-nities for career promotion, participation in po-litical life and important decision making for the community. Men are expected to be the bread-winners, and social reluctance to accept men who have fallen out of this role has also contributed towards driving them into high-risk behaviour. Traditional gender distribution of social roles is still consolidated by school textbooks and educa-tional programmes, and strengthened by the way women are represented in the mass media and advertisement campaigns.
Insufficient level of social infrastructure devel-opment. Lack of quality assistance in childbear-ing and housework remains the major factor hin-dering the professional activities of women. The lack of easy-to-access infrastructure to provide housing services, the reduced number of pre-school institutions and the low quality of their ed-ucational services and insufficient consideration by employers of women’s family obligations put women under a double workload – in the labour market and in the household.
IV. Moving Forward
Achieving gender parity within representative authorities and at higher levels of the public ad-ministration is possible by taking decisive meas-ures on the further adaptation of national legisla-tion to meet European standards. With regard to women’s limited access to the public administra-tion system, it is necessary to introduce legisla-tive changes in order to establish gender quotas within representative authorities and in higher levels of the public administration, in lists of can-didates of political parties and blocs (particularly with respect to the composition of party manage-ment). Quotas should be considered a temporary protectionist measure of the state with respect to gender and must compensate for persistent ne-glect of the gender equality principle in Ukrainian society. Of paramount importance in achieving the Goal is: eliminating the principle of political expediency in recruitment and promotion deci-sions in central and local executive authorities; providing gender expertise during the adop-tion of legislation and other state decisions that are important for the community; and introduc-ing gender approaches into the development of state strategies. By focusing on gender issues in budget policy and appropriating the necessary financial resources for implementing gender pol-icy, the state’s compliance with its obligations to promote gender equality will be ensured.
Ensuring gender equality in access to decent labour will be promoted by measures of the state employment policy, which must be imple-mented simultaneously in several directions: prevention of direct discrimination in the labour market; overcoming stereotypes of female and male professions, which are strengthened by low professional status and low remuneration levels in female-dominant industries; and enhancing opportunities to attract women to obtain lifelong education. There is a particular need to intro-duce gender approaches to social partnerships in Ukraine’s development through the obliga-tory inclusion in collective agreements of issues such as: the prohibition of gender discrimination; equal remuneration; equal opportunities for pro-fessional and career growth; favourable employ-ment conditions for workers with family obliga-tions; and work schedules.
CHAPTER TWO. MILLENNIUM DEVELOPMENT GOALS, ADAPTED FOR UKRAINE 61

Decreasing the gender gap in income levels re-quires the implementation of policy measures on remuneration, aiming at decreasing inter-in-dustry and inter-regional wage variations, to ap-proach remuneration levels in budget and non-budget spheres that would allow for a decrease of the gender gap in remuneration that results from professional segregation and also a general increase in the minimum wage, to bring it closer to the economically justified cost of labour. A de-crease in gender differences in income will also ensure the promotion of women’s entrepreneur-ship and employment, while improved the tar-geting of social assistance. The introduction of gender approaches into strategies of poverty al-leviation will promote more efficient protection of vulnerable population categories, in which women dominate. Taking into account the gen-der component in forming the state budget can be an efficient tool for decreasing the gender gap in income levels and improving performance on other corresponding indicators.
Ensuring opportunities for balanced employ-ment in the labour market and in the household plays a decisive role in promoting women’s pro-fessional activities, raising their professional sta-tus and, accordingly, equalizing the income of women and men. In this context, the following actions are essential: developing easy-to-access infrastructure of housing services; enhancing the system of child preschool institutions that provide quality educational services; and creating precon-ditions for men’s broader involvement in fulfilling family and parental duties, in particular encourag-ing fathers to take parental leave for three years in accordance with current legislation. Positive les-
sons learned from developed countries include recognizing non-paid housework, assessing its contribution to the GDP of the country, justifying the amount of direct payment for housework and its reflection in the national accounts system.
Transforming established stereotypes on the traditional distribution of gender roles in soci-ety is a precondition to achieving the objectives of gender development in Ukraine. Achieving this target requires coordinated activities by all civil society members and governmental institutions during the implementation of an information and educational campaign on creating an egalitarian perception of Ukrainian society. There should be broader inclusion of the mass media in gender awareness campaigns in Ukraine, enhanced de-velopment of ethics codes that will not tolerate the spreading of sexism through the mass media and the promotion of civil society activities aimed at preventing gender discrimination. The forma-tion of a general gender culture will be facilitated by introducing gender approaches to designing educational programmes in educational institu-tions of different levels; implementing gender education programmes for civil servants, educa-tional workers and representatives of the mass media; and using the resources of libraries and other cultural institutions for gender awareness campaigns. As a result of improving the national statistics system by expanding the list of gender-sensitive indicators, the base of scientific and ex-pert research in the field of ensuring equal rights and opportunities for women and men will be strengthened. It will also lead to more efficient monitoring and assessment of progress on gen-der development.
GOAL 4: REDUCE
CHILD MORTALITY
MILLENNIUM DEVELOPMENT GOALS. UKRAINE – 201062

This subchapter provides an analysis of chal-lenges and tasks of the national health care system in the attempt to reduce child mortality. Protection of child health is an integral part of the health care system, whose achievements greatly influence the prospects of the further development of society. Indicators of child and maternal mortality have socio-political impor-tance and reflect not only the quality and level of health care for children and mothers but also the development of the health care system and society in general.
І. Targets and Indicators
Targets Indicators
Target 4. A: Decrease the mortality rate among chil-dren up to 5 years of age by one-fourth
4.1. Mortality rate among children of up to 5 years of age, number of children of corresponding age who died per 1,000 live births4.2. Infant mortality rate, number of infants up to one year of age who died per 1,000 live births
GOAL 4: REDUCE
CHILD MORTALITY
CHAPTER TWO. MILLENNIUM DEVELOPMENT GOALS, ADAPTED FOR UKRAINE 63

MILLENNIUM DEVELOPMENT GOALS. UKRAINE – 201064
Several changes were introduced into the values of the expected indicators, to represent progress in terms of their achievement observed through mon-itoring. More ambitious benchmarks for 2015 were suggested, based on analysis of the positive chang-es that occurred during 2001–2009 and taking into account available capacity. Monitoring data from other global indicators of progress towards the achievement of the MDGs in Ukraine shows that, to-day, the situation in this area can be deemed satis-factory. For example, measles vaccination coverage of children of up to one year of age during recent years has remained at over 90 percent (in 2008 it was 94.3 percent). The vast majority (99 percent) of deliveries take place in health care institutions with qualified staff (over 90 percent of which are with the assistance of a doctor).
II. Situation Analysis
According to the Laws of Ukraine on Fundamen-tal Principles of Legislation on Health Care and on Protection of Childhood, the state guarantees each child the right to health care, through free of charge qualified medical assistance in state and communal health care institutions. Under these laws, the state should also ensure living condi-tions suitable for each child’s healthy develop-ment and adequate nutrition as well as the for-mation of a healthy lifestyle.
A decrease in infant mortality was observed in 1995–2009 (except for in 2005 and 2007): from 14.7 per 1,000 live births in 1995 to 9.4 per 1,000 live births in 2009 (Figure 10). The increase in the indicator value to 11 percent for 2007 was expected, since Ukraine started to apply new standards for assessing the criteria for the peri-natal period and live and stillbirths on 1 Janu-ary 2007. The infant mortality indicator decreased in 2008, and in 2009 it amounted to 9.4 percent.
The mortality indicator of children up to one year of age is an indicator of the quality of life of the population, reflecting welfare level and distribu-tion of social and material benefits in society, en-
2000 2001 2002 2003 2004 2005 2006 2007 2008 2009 2011 2013 2015
Indicator 4.1. Mortality rate among children up to 5 years of age, number of children of corresponding age who died per 1,000 live births
16.0 14.4 13.6 12.9 12.4 12.9 12.4 13.6 12.2 11.3 11.2 11.1 11.0
Indicator 4.2. Infant mortality rate, number of infants up to one year of age who died per 1,000 live births
11.9 11.3 10.3 9.6 9.5 10.0 9.8 11.0 10.0 9.4 9.5 9.4 9.3
The table presents actual data by 2009 inclusive and forecast calculated values of indicators for 2010–2015.
Figure 10. Infant Mortality in Ukraine, Indicator per 1,000 of Life births, 1990–2008
Source: State Statistics Committee of Ukraine.
0.0 2.0 4.0 6.0 8.0 10.0 12.0 14.0

CHAPTER TWO. MILLENNIUM DEVELOPMENT GOALS, ADAPTED FOR UKRAINE 65
vironmental situation, level of education and cul-ture, effectiveness of prevention measures, level of availability and quality of health care, etc. Infant mortality is a key indicator not just of the health and survival of children but also of efficiency and fairness in state service provision.
Today, more than half of infant deaths are caused by specific conditions emerging during perinatal life. When adding these causes of death to over-all congenital development defects, the share becomes three-fourths of the overall number of deaths of children of up to one year of age.
In 2007, Ukraine established an international-level system of accounting and statistics for the identi-fication of criteria on perinatal life, live births and stillbirths, as well as procedures for the registra-tion of live births and stillbirths.17 Taking into ac-count this reform, aimed at improving health care provision to pre-term children with extremely low body mass at birth, the Ministry of Health of Ukraine developed and approved the appropri-ate medical examination protocol.
Box 9. Two-thirds of deaths from trauma (and most non-fatal trauma) in the European region could be prevented. It has been assessed that €1 spent on prevention ensures savings, particularly on: smoke-sensitive alarms – €69, child safety seats – €32, patronage visits and education of parents on child abuse – €19 (Source: Sethi D. Injuries and Violence in Europe. Why They Matter and What Can Be Done? Copenhagen: WHO, 2006. – 23 p).
At the global level, reasons such as drowning, car accidents and burns occupy 8th, 9th and 11th places, respectively, and are among the major causes of death of children aged one to five; 95 percent of child deaths from non-deliberate trauma occur in low- and middle-income countries (Source: World Health Organization. World Report on Child Injury Prevention. Geneva: WHO, 2008. – 39 p.)
Infant mortality is a determining factor in Ukraine in the death rate of children of up to five years of age. The probability of dying decreases sharply when a child reaches one year of age. The major reason for differences between Ukraine and de-
17 Adoption of Amendments to Article 281 of the Civil Code of Ukraine and to the respective Decree of the Cabinet of Ministers of Ukraine No. 144 of 15 February 2006 on its implementation.
veloped European countries with respect to mor-tality of children of up to five years of age owes to external reasons, i.e. those that can be prevented.
According to State Statistics Committee data, al-most every third child out of overall child deaths in 2009 died as a result of trauma, poisoning or other external factors (270 out of 888 deaths of children of up to five years of age). The absolute majority of these deaths could be avoided with the appropriate childcare.
Breastfeeding helps decrease child morbidity and child mortality and improves the mother’s health. In addition to positive results in terms of prevent-ing post-delivery complications, breastfeeding decreases the risk of a woman getting breast can-cer and positively influences the normal physical, intellectual, emotional and social development of a child. The policy of promoting and supporting breastfeeding is implemented consistently, both by enhancing the awareness of the population on the advantages of breastfeeding an infant and by managing respective health care institutions. Today, 245 health care institutions in all oblasts of Ukraine have the status of ‘Child-Friendly Clinic,’ whereas in 2001 there were only four such clinics. Almost every second child was born in these clin-ics in 2008. The National Action Plan on the Im-plementation of the United Nations Convention on the Rights of the Child18 envisages that no less than 90 percent of children will be born in institu-tions that meet the requirements of the status of Child-Friendly Clinic by 2010.
Another intervention that has helped decrease the number of deaths of children of up to five years of age is improving the efficiency of diag-nostics and treatment of neoformations. An in-crease in the number of lives saved of children with cancer pathologies is expected as a result of introducing modern methods of diagnostics and treatment, as well as improving the provision of cancer (haematology) departments with equip-ment during implementation of the State Pro-gramme on Child Oncology. 19
18 Parliament of Ukraine. Law on the State Programme on National Action Plan on Realization of the United Nations Convention of Rights of the Child by 2016, 5 March 2009. No. 1065-VI.
19 Cabinet of Ministers of Ukraine. Resolution on Approval of the State Programme on Child Oncology for 2006–2010, 19 July 2006. No. 983.

A positive shift towards an decrease in child mor-tality became possible as a result of measures in the field of mother and child health care, par-ticularly: introduction of contemporary perinatal technologies; implementation of a clinical proto-col of health care provision to mothers and chil-dren, developed on the basis of evidence-based medicine; opening of the Academic and Research Medical Centre of Child Cardiology and Cardio-surgery; etc. Approval of the State Programme on the National Action Plan on the Implementation of the United Nations Convention on the Rights of the Child by 2016 was another step forward.
Solving problems related to children’s health con-ditions and prevention of diseases remains one of the priorities for Ukraine. In order to improve health care services in GEIs and to engage par-ents in the process of ensuring children’s health, the Ministry of Health of Ukraine developed an Order on the Improvement of Health Services for Students at General Educational Institutions. The main distinctive feature of the new proce-dures for the provision of health care services is the need to carry out annual preventive examina-tions of school-age children at a health care facil-ity at their place of residence, with the mandatory presence of their parents. The examinations are held at a time convenient for both parents and children, throughout the calendar year. In 2009, mandatory medical preventive examinations of students at GEIs were conducted in accordance with the Comprehensive Plan of Action for the Development of Education in Ukraine for the Pe-riod until 2011. Based on the results of the man-datory preventive examination, students were divided into groups for physical education class-es: 62.2 percent were included in the main physi-cal education group; 25.9 percent the basic group; and 11.5 percent in the special group; 0.4 percent of children were exempt from physical exertion in physical education classes.
The share of adolescents (15–17 years of age) in the child population amounts to 20.8 percent. Health status, development and comprehensive upbringing of adolescents are top priorities. Med-ical and pharmaceutical HEIs of the I–IV accredi-tation levels, postgraduate educational facilities, research institutions and health care facilities im-plement the Action Plan for Implementation of the Educational Work Programme for 2008–2010.
An important component in this plan is the crea-tion of conditions to develop a sense of respon-sibility for one’s own health and an awareness of the need to choose a healthy lifestyle. In many oblasts, ‘Youth-Friendly Clinics’ (centres, depart-ments, consulting offices for health care and so-cial support to children and youth) operate, pro-viding health care services to children and young people using the friendly approach principles, as recommended by the World Health Organization (WHO). A total of 73 of these clinics have been established in Ukraine. The work in such institu-tions is conducted by medical specialists in active social partnership with workers of social services centres for families, children and youth, and in collaboration with teachers at GEIs. Clinic activi-ties are aimed at: preservation of mental health, specifically in difficult life circumstances; preven-tion of risky behaviour and mitigation of its nega-tive effects; prevention of sexually transmitted diseases, including HIV/AIDS; preservation of re-productive health and preparation for informed parenthood; and development of responsible behaviour in children with respect to gender and interpersonal relationships and healthy behav-ioural patterns, among others.
ІІІ. Challenges
Challenges to achieving Goal 4 include general ones related to the crisis in the health care system in Ukraine and the complicated socio-economic situation, which influence public health and func-tioning of this sphere, and within this mother and child health care. This concerns, above all, lack of state social standards in health care, focus of the health care system on illness and not on health and slow development of a healthy lifestyle foundation within society, etc. There is a lack of parental awareness of the need to build healthy lifestyle skills and self-preserving behaviour with their children, as well as to organize adequate nu-trition and care for them.
Specific challenges related to maternity and childhood care services should be noted, particu-larly: insufficient number of primary care doctors; disproportion between primary, secondary and tertiary health care to mothers and children; irra-tional use of the hospital bed fund; and lack of pri-
MILLENNIUM DEVELOPMENT GOALS. UKRAINE – 201066
oritization of financing for all levels of the national maternity and childhood care programmes. Most of these challenges are more critical in rural areas.
The lower availability of primary health care and sanitary and specialized medical assistance for children living in rural areas should be noted. Problems include lack of timely transportation of patients to health care institutions and difficulty for patients in reaching emergency medical care, as well as a lack of the necessary specialists.
Social influences, such as family instability and having one or both parents addicted to alcohol or drugs, lead to inappropriate childcare and in-creased numbers of orphans and children with-out parental care. All of these issues raise the risk of child deaths caused by external reasons, in-cluding violent death, the spread of early, unsafe sexual relations and sexually transmitted diseas-es, above all HIV/AIDS.
IV. Moving Forward
Healthy lifestyles should be promoted in Ukrain-ian society by informing and educating the population on mother and child health care. In-formation should relate to responsible sexual behaviour, prevention of unwanted pregnancy, childcare issues and prevention of trauma, and generally should deal with ensuring responsible parenthood. A real (not just declared) commit-ment to prioritizing prevention within the nation-al health care system will serve this purpose.
Improvements in mother and child health care will require increasing the quality of this care; fur-ther dissemination of contemporary perinatal and reproductive technologies; and the practice of scientifically grounded standards and protocols of treatment aimed at preventing losses of child lives that could be avoided or prevented through the development of medical science and practice. The system of obligatory medical examinations of children requires significant improvement.
It is essential to ensure the application of a sin-gle, unified technology of health care provision to pre-term babies with extremely low weight at birth, aiming at decreasing perinatal losses.
A decrease in the number of children’s lives lost as a result of unnatural causes will facilitate the spread of knowledge among the population, above all parents of minors, on first aid health care provision in the case of trauma and acci-dents. It will also strengthen state control of living conditions and childcare in the family.
Achievements have been made in terms of pre-vention of mother-to-child HIV transmission, by maintaining and increasing levels of coverage of voluntary HIV testing among pregnant women and coverage of preventive antiretroviral treat-ment to HIV-infected women.
A change in approach is necessary: traditional ways of developing a healthy lifestyle should be revised and authorities and society should join ef-forts to promote this. The development of respon-sible behaviour among children and youth needs addressing, particularly in terms of personal se-curity and health, including issues of sexual and interpersonal relationships. In addition, healthy lifestyle models should be created, which cover the physical, psychological, social and spiritual di-mensions of life (prevention or cessation of bad habits, increased physical activity, consumption of quality food and drinking water, etc). Special attention should be paid to recognize the harm from smoking tobacco and alcohol and drug abuse, among others, to ensure that more healthy children are born in the future.
The network of Youth-Friendly Clinics, which pro-vide health care and social assistance to children and youth based on a friendly approach, should be expanded. The principles of an inter-sectoral approach to solving child health care problems should be followed.
CHAPTER TWO. MILLENNIUM DEVELOPMENT GOALS, ADAPTED FOR UKRAINE 67
MILLENNIUM DEVELOPMENT GOALS. UKRAINE – 201068
This subchapter covers issues related to im-provements in maternal health, which is an im-portant task not only for today but also for the future development of Ukraine in general. Ma-ternal health is one of the highest values in a so-ciety, as it lays the foundations for the economic and spiritual development of the country and improvements in the demographic situation. Maternal health is one of the decisive factors in determining the health of new generations, and the health of children determines future labour and the intellectual potential of the country.
І. Targets and Indicators
Targets Indicators
Target 5.A: Halve the mater-nal mortality rate
5.1. Maternal mortality rate, number of maternal deaths per 100,000 live births5.2. Abortion level, number of abortions per 1,000 women of fertile age
GOAL 5: IMPROVE
MATERNAL HEALTH

CHAPTER TWO. MILLENNIUM DEVELOPMENT GOALS, ADAPTED FOR UKRAINE 69
Considering positive trends during 2001–2008 towards achieving this Goal, and taking into account forecast socio-economic development trends, it was suggested to generate more ambi-tious results for 2015 than were put in place at the beginning of the millennium.
Trends on other global indicators in relation to achieving this Goal in Ukraine are fully satisfac-tory. Almost all deliveries in the country (99 per-cent) occur in health care institutions with qualified staff. Contraception has also spread: according to data from the Medical and De-mographic Survey of the Ukrainian Population of 2007, two thirds (67 percent) of married wom-en use contraception. Compared with the same survey in 1999, the level of coverage of contra-ception has remained almost unchanged, but a positive trend has occurred – there is increased usage of contemporary methods rather than tra-ditional ones. A relatively low birth rate among teenagers is observed, at around two cases per 10,000 girls of up to 14 years of age inclusive-ly, and slightly more than 13 cases per 1,000 of girls of 15–17 years of age inclusively. Almost all mothers are provided with pre-delivery care by qualified medical workers, with an insignificant difference observed between urban and rural areas.
II. Situation Analysis
A decrease in the maternal mortality level has been observed in Ukraine, from 24.7 per 100,000 live births in 2000 to 15.5 per 100,000 live births in 2008.
However, a comparison of values on the indica-tor throughout 2000–2008 is impossible, since from 2005 Ukraine has been coding mortality data according to the International Statistical Classifica-tion of Diseases, Tenth Revision. Indicators calculat-ed before and after this are not comparable. In gen-eral, by assessing monitoring data, conclusions can be made on progress towards this Goal.
Box 10. In the past, programmes and actions on reproductive health care and family planning focused mainly on the woman and her childbearing functions. Modern Ukrainian policy in this area focuses efforts on all family members (including children and men). The State Programme on Reproductive Health of the Nation by 2015 covers issues of promoting and protecting reproductive health during the entire lifetime. Improvement of the family planning system, and as a result, preservation of the reproductive health of the whole population, is equally important. The programme is targeted at improving reproductive health as a result of improvements in the quality and availability of medical assistance and the promotion of healthy lifestyles, responsible paternity and safe maternity. The introduction of scientifically grounded standards and protocols of treatment and contemporary perinatal technologies into activities of health care institutions continues.
Among all deaths of women during pregnancy, delivery or the post-natal period in 2005–2008, an average of two thirds were related to obstetric reasons (Table 8).
Each maternal death is carefully studied and ana-lysed. Continuous monitoring of death cases of women during pregnancy, delivery or the post-natal
2000 2001 2002 2003 2004 2005 2006 2007 2008 2009 2011 2013 2015
Indicator 5.1. Maternal mortality rate, number of maternal deaths per 100,000 live births
24.7 23.9 21.7 17.4 13.1*
17.6 15.2 20.7 15.5 25.8 14.5 14.0 13.0
Indicator 5.2. Abortion level, number of abortions per 1,000 women of fertile age
32.1 29.4 25.8 25.3 23.2 21.3 18.7 18.5 17.95 17.9 17.5 16.4 15.1
*Ukraine transferred to mortality coding according to the International Statistical Classification of Diseases, Tenth Revision, in 2005. The indicators calculated before and after this transfer are not comparable, and therefore Indicator 5.1. is presented by two dynamic series.
The table presents actual data by 2009 inclusive and forecast calculated values of indicators for 2010–2015.
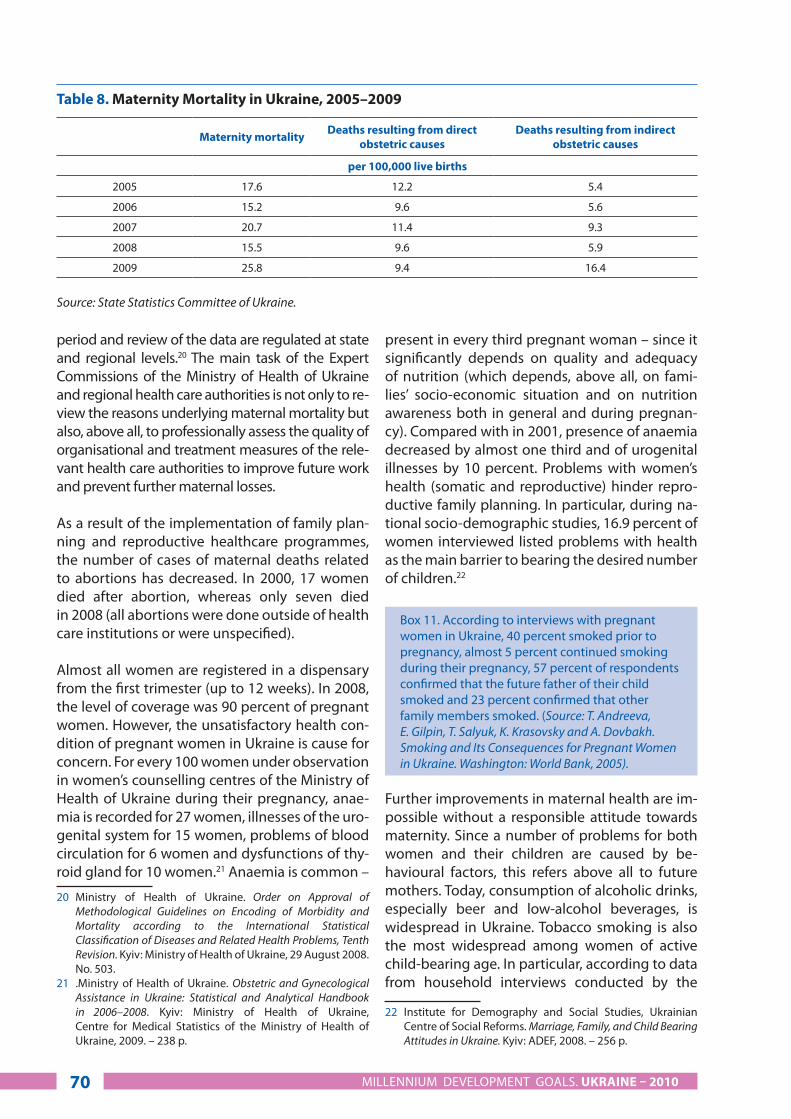
period and review of the data are regulated at state and regional levels.20 The main task of the Expert Commissions of the Ministry of Health of Ukraine and regional health care authorities is not only to re-view the reasons underlying maternal mortality but also, above all, to professionally assess the quality of organisational and treatment measures of the rele-vant health care authorities to improve future work and prevent further maternal losses.
As a result of the implementation of family plan-ning and reproductive healthcare programmes, the number of cases of maternal deaths related to abortions has decreased. In 2000, 17 women died after abortion, whereas only seven died in 2008 (all abortions were done outside of health care institutions or were unspecified).
Almost all women are registered in a dispensary from the first trimester (up to 12 weeks). In 2008, the level of coverage was 90 percent of pregnant women. However, the unsatisfactory health con-dition of pregnant women in Ukraine is cause for concern. For every 100 women under observation in women’s counselling centres of the Ministry of Health of Ukraine during their pregnancy, anae-mia is recorded for 27 women, illnesses of the uro-genital system for 15 women, problems of blood circulation for 6 women and dysfunctions of thy-roid gland for 10 women.21 Anaemia is common –
20 Ministry of Health of Ukraine. Order on Approval of Methodological Guidelines on Encoding of Morbidity and Mortality according to the International Statistical Classification of Diseases and Related Health Problems, Tenth Revision. Kyiv: Ministry of Health of Ukraine, 29 August 2008. No. 503.
21 .Ministry of Health of Ukraine. Obstetric and Gynecological Assistance in Ukraine: Statistical and Analytical Handbook in 2006–2008. Kyiv: Ministry of Health of Ukraine, Centre for Medical Statistics of the Ministry of Health of Ukraine, 2009. – 238 p.
present in every third pregnant woman – since it significantly depends on quality and adequacy of nutrition (which depends, above all, on fami-lies’ socio-economic situation and on nutrition awareness both in general and during pregnan-cy). Compared with in 2001, presence of anaemia decreased by almost one third and of urogenital illnesses by 10 percent. Problems with women’s health (somatic and reproductive) hinder repro-ductive family planning. In particular, during na-tional socio-demographic studies, 16.9 percent of women interviewed listed problems with health as the main barrier to bearing the desired number of children.22
Box 11. According to interviews with pregnant women in Ukraine, 40 percent smoked prior to pregnancy, almost 5 percent continued smoking during their pregnancy, 57 percent of respondents confirmed that the future father of their child smoked and 23 percent confirmed that other family members smoked. (Source: T. Andreeva, E. Gilpin, T. Salyuk, K. Krasovsky and A. Dovbakh. Smoking and Its Consequences for Pregnant Women in Ukraine. Washington: World Bank, 2005).
Further improvements in maternal health are im-possible without a responsible attitude towards maternity. Since a number of problems for both women and their children are caused by be-havioural factors, this refers above all to future mothers. Today, consumption of alcoholic drinks, especially beer and low-alcohol beverages, is widespread in Ukraine. Tobacco smoking is also the most widespread among women of active child-bearing age. In particular, according to data from household interviews conducted by the
22 Institute for Demography and Social Studies, Ukrainian Centre of Social Reforms. Marriage, Family, and Child Bearing Attitudes in Ukraine. Kyiv: ADEF, 2008. – 256 p.
Table 8. Maternity Mortality in Ukraine, 2005–2009
Maternity mortality Deaths resulting from direct obstetric causes
Deaths resulting from indirect obstetric causes
per 100,000 live births
2005 17.6 12.2 5.4
2006 15.2 9.6 5.6
2007 20.7 11.4 9.3
2008 15.5 9.6 5.9
2009 25.8 9.4 16.4
Source: State Statistics Committee of Ukraine.
MILLENNIUM DEVELOPMENT GOALS. UKRAINE – 201070
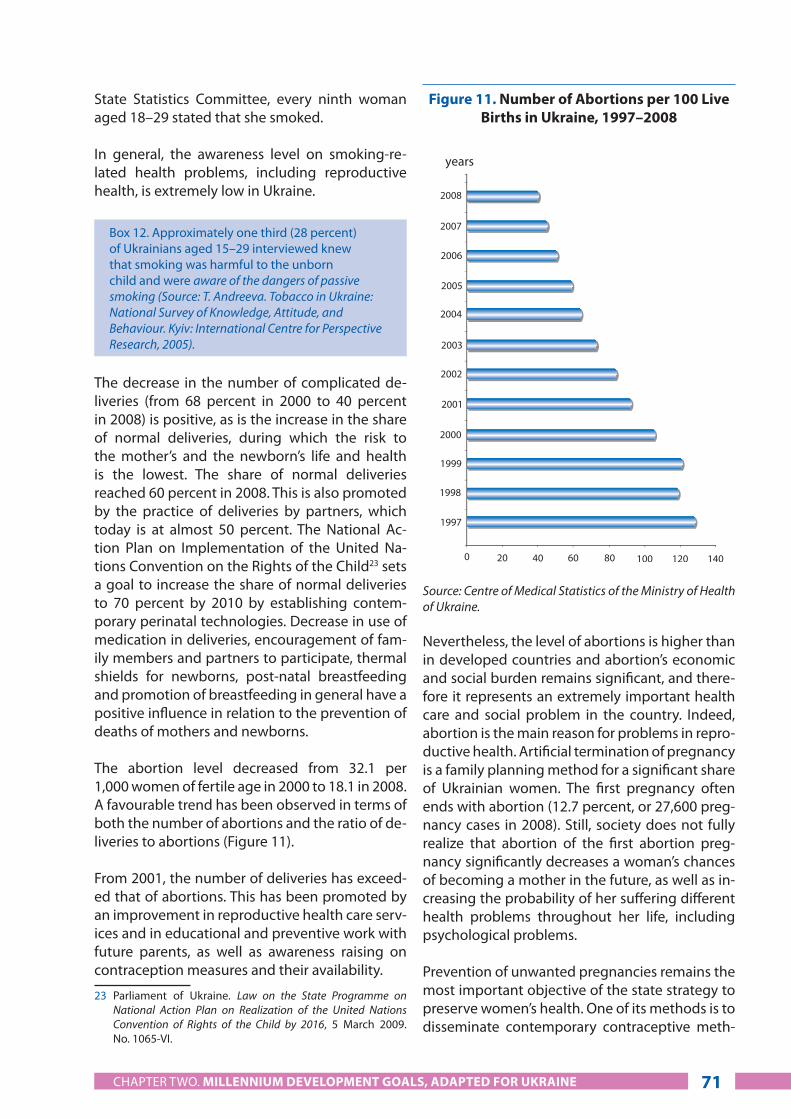
State Statistics Committee, every ninth woman aged 18–29 stated that she smoked.
In general, the awareness level on smoking-re-lated health problems, including reproductive health, is extremely low in Ukraine.
Box 12. Approximately one third (28 percent) of Ukrainians aged 15–29 interviewed knew that smoking was harmful to the unborn child and were aware of the dangers of passive smoking (Source: T. Andreeva. Tobacco in Ukraine: National Survey of Knowledge, Attitude, and Behaviour. Kyiv: International Centre for Perspective Research, 2005).
The decrease in the number of complicated de-liveries (from 68 percent in 2000 to 40 percent in 2008) is positive, as is the increase in the share of normal deliveries, during which the risk to the mother’s and the newborn’s life and health is the lowest. The share of normal deliveries reached 60 percent in 2008. This is also promoted by the practice of deliveries by partners, which today is at almost 50 percent. The National Ac-tion Plan on Implementation of the United Na-tions Convention on the Rights of the Child23 sets a goal to increase the share of normal deliveries to 70 percent by 2010 by establishing contem-porary perinatal technologies. Decrease in use of medication in deliveries, encouragement of fam-ily members and partners to participate, thermal shields for newborns, post-natal breastfeeding and promotion of breastfeeding in general have a positive influence in relation to the prevention of deaths of mothers and newborns.
The abortion level decreased from 32.1 per 1,000 women of fertile age in 2000 to 18.1 in 2008. A favourable trend has been observed in terms of both the number of abortions and the ratio of de-liveries to abortions (Figure 11).
From 2001, the number of deliveries has exceed-ed that of abortions. This has been promoted by an improvement in reproductive health care serv-ices and in educational and preventive work with future parents, as well as awareness raising on contraception measures and their availability.
23 Parliament of Ukraine. Law on the State Programme on National Action Plan on Realization of the United Nations Convention of Rights of the Child by 2016, 5 March 2009. No. 1065-VI.
Nevertheless, the level of abortions is higher than in developed countries and abortion’s economic and social burden remains significant, and there-fore it represents an extremely important health care and social problem in the country. Indeed, abortion is the main reason for problems in repro-ductive health. Artificial termination of pregnancy is a family planning method for a significant share of Ukrainian women. The first pregnancy often ends with abortion (12.7 percent, or 27,600 preg-nancy cases in 2008). Still, society does not fully realize that abortion of the first abortion preg-nancy significantly decreases a woman’s chances of becoming a mother in the future, as well as in-creasing the probability of her suffering different health problems throughout her life, including psychological problems.
Prevention of unwanted pregnancies remains the most important objective of the state strategy to preserve women’s health. One of its methods is to disseminate contemporary contraceptive meth-
Figure 11. Number of Abortions per 100 Live births in Ukraine, 1997–2008
Source: Centre of Medical Statistics of the Ministry of Health of Ukraine.
years
CHAPTER TWO. MILLENNIUM DEVELOPMENT GOALS, ADAPTED FOR UKRAINE 71

ods. In particular, in 2008, the level of contracep-tion as an alternative to unwanted pregnancy in-creased and reached 308.4 per 1,000 women of fertile age.
Reasons for the high numbers of abortions have been the subject of thorough study by experts and civil society, assessing: community knowl-edge; behaviour and attitude of specialists, pa-tients and society towards the issues; and qual-ity of the main service provision in this field.24 It should be stressed that, although a significant share of the population can afford oral contracep-tives at the middle price range, there is a share that needs free procurement.
It is important that the development of joint measures to overcome high level of abortion be broadly discussed, and not limited to medical as-pects. The position of the Government is for the promotion of wide cooperation among repre-sentatives of health care, education, different re-ligions and civil society organisations in the field of abortion, but not its prohibition. Responsible behaviour, which is the most effective method of preventing abortion and sexually transmitted dis-eases, is supported through promoting: a healthy lifestyle; spiritual, ethical and cultural values; and foregoing an early sex life and pre- and extramari-tal sexual relations. Despite the current diversity of ideas and positions concerning the artificial termination of pregnancy, there is an unanimous vision in the country as to the value of new hu-man life and perceptions of civil and personal re-sponsibility to preserve this.
Positive changes in terms of preserving the health of mothers and decreasing infant mortality be-came possible as a result of measures in mother and child health care, in particular: the introduc-tion of contemporary perinatal technologies; clin-ical protocols of health care provision to mothers and children, developed on the basis of evidence-based medicine; the introduction of measures of the State Programme on Reproductive Health of Nation by 2015 and the sectoral Programme on Support of Breast Feeding in Ukraine for 2006–2010; and the opening of the Academic and Re-
24 Ministry of Health of Ukraine. Abortions and Contraception in Ukraine. Strategic Assessment of Policy, Programmes, and Studies. Kyiv: Ministry of Health of Ukraine, 2008. – 88 p.
search Medical Centre of Child Cardiology and Cardiosurgery.
Schools of Responsible Parenthood operate ef-ficiently in Ukraine. Future mothers and fathers are being prepared to deliver healthy children and to nurse newborns. More and more future mothers and fathers are becoming students of these schools, which have led to an increase in the number of normal deliveries and deliveries by partners and improvements on indicators re-lated to breastfeeding and child development in the first year of life. Special attention is given to the father’s assistance during childbearing and delivery.
In Ukraine, inequality of access to quality, timely health care for mothers and children is related not only to income level, place of residence or shortcomings in the organisation and provision of medical assistance, but also to behavioural factors. Even though there are some problems in rural areas related to the remoteness of health care institutions, lack of specialists or an inability of poor citizens to pay for necessary medicine or services, maternity and childhood protection services, including reproductive health care and family planning, are generally far-reaching and provide citizens with a sufficient level of access. The biggest problems and threats to the lives and health of mothers and children appear among so-cial risk groups, especially when there are precipi-tating causes: risky sexual behaviour; numerous abortions; women not breastfeeding; irresponsi-ble attitude towards timely monitoring and treat-ment of reproductive illnesses; spread of sub-stance abuse; and inappropriate child nursing.
The socio-economic situation in the country is an important determinant of public health, in-cluding reproductive health. The most important way the global economic crisis has affected the achievement of this Goal is through the budget deficit. The state’s decreased ability to ensure fi-nancing of social programmes and actions such as those on maternity and childhood protection, despite their prioritization, can negatively influ-ence the implementation of the planned meas-ures. The depreciation of the hryvnia and a de-crease in the real value of allocated funds have led to a situation whereby certain purchased medicines, equipment and services will gradually
MILLENNIUM DEVELOPMENT GOALS. UKRAINE – 201072

decrease as their price increases. Increases in the number of the unemployed or partially employed facilitate the spread of poverty, declines in nutri-tion (which can influence the health of pregnant women and those practising breastfeeding), an increase in the number of risk groups and the promotion of less-than-healthy lifestyles or risky forms of behaviour. Furthermore, a worsening of the sanitary and epidemiologic situation is pos-sible. In particular, heating problems or electric shutdowns in health care facilities may represent a hazard to life and health, particularly of mothers and children. Overall, all of this is related to a lack of correspondence of state financing with social needs and decreases the access of the population to prevention services and treatment.
ІІІ. Challenges
A range of problems related to the crisis of health care system operations and to the economic cri-sis, which coincided with complex transforma-tion processes in modern Ukraine, impede the achievement of Goal 5. All of these problems di-rectly influence community health in general and maternal health in particular. Lack of integrated approaches to reforming the health care system, slow introduction of healthy lifestyle principles in society, insufficient impacts of information and educational programmes, popularity of tobacco smoking, consumption of alcohol and drugs and the spread of risky sexual behaviour, especially among youth, exacerbate the situation.
Issues include the spread of sexually transmit-ted diseases related to the sexual revolution, a decrease in the living standards of some groups of the population, unemployment, increases in population mobility and intense migration within the country and abroad. The morbidity level and the contribution of infections to the deterioration of mothers’ reproductive health are much higher in Ukraine than in developed European countries.
There are some specific problems related to the organisation of maternity and childhood protec-tion services: an insufficient number of doctors for primary health care, especially in rural areas; inefficient and disproportionately higher financ-ing of higher levels of health care provision for
mothers and children; non-adherence to the prin-ciple of prioritizing the implementation of the na-tional maternity and childhood protection pro-grammes; contraception services and abortions in Ukraine that are not in line with WHO stand-ards; inadequate quality control of health care (in both state and private institutions); and low awareness levels (of both patients and medics) on contemporary contraception methods. As with Goal 4, the acuteness of the listed problems is much higher in rural areas.
Furthermore, other social problems include: in-sufficient preparation of youth for responsible parenthood; lack of an adequate number of spe-cialists trained to work with children and youth on the issues of responsible parenting as a meth-od of early prevention of social orphanhood; sig-nificant numbers of marginalized families; and inadequacy of the interdepartmental approach to health care and social support to vulnerable families.
ІV. Moving Forward
The basis for healthy lifestyle behaviour in society in general should be established through informa-tional and educational campaigns among the pop-ulation. This should focus on problems and ways to preserve the health of mothers and children. Nec-essary conditions for success here include the ac-tive inter-sectoral cooperation of medical and edu-cational workers and representatives of the mass media and civil society organisations.
Introduction of the ‘ABC strategy’ (‘abstinence,’ i.e. beginning sexual life at an older age, ‘be faith-ful’ – loyalty in relationships – and ‘condom use’), which is now quite popular among youth, could become an effective measure.
Improvement of mother and child protection re-quires enhancement of the quality of their medi-cal assistance, further promotion of contempo-rary perinatal and reproductive technologies and implementation of scientifically grounded treat-ment standards and protocols. Significant efforts are needed to counteract the high level of abor-tions, including dissemination of contemporary methods of preventing unwanted pregnancy. A single unified technology for providing health
CHAPTER TWO. MILLENNIUM DEVELOPMENT GOALS, ADAPTED FOR UKRAINE 73

care to pre-term children with extremely low weight at birth should be ensured, aiming at de-creasing perinatal losses.
Special attention should be paid to issues of re-productive health among children and youth, preparing future parents for pregnancy and child-birth. In particular, this concerns the fostering of responsible paternity foundations, avoiding bad habits in the period before and during pregnancy, improving future mothers’ health, understanding the need for medical examination before plan-ning on pregnancy and medical observation during pregnancy. Special attention is needed to ensure adequate, complete and balanced nutri-tion, by providing adequate energy and nutrient intake and composition of micro-elements and vitamins during pregnancy and breastfeeding.
It is important to improve access to reproductive health care and family planning services and to contemporary contraception methods, to ensure women’s equal and sustainable access (independ-ently of their place of residence and social status) to quality medical assistance during pregnancy and delivery and to create the conditions for safe maternity.
The awareness level of the population (both women and men) needs to be raised concerning safe and efficient methods and means of family planning and the potential consequences of sex-ually transmitted diseases and ways to prevent infection.
To reduce the negative impact of social factors, a primary focus should be on: issues of mothers and children from vulnerable families; contin-ued enhancement of the network of mother and child social centres; provision of social support to young families; and improvements in the family planning system and specialists’ training on re-sponsible parenthood. The mass media and civil society must be involved in preventing social or-phanhood, which contributes towards worsening a child’s health and also generating future prob-lems for the child as an adult.
Application of these measures will make it pos-sible to address issues of reproductive health, strengthen health care of mothers and children and, in general, improve the demographic situa-tion in Ukraine.
GOAL 6: REDUCE AND SLOw DOwN
THE SPREAD OF HIV/AIDS AND TUbERCULOSIS
AND INITIATE A TREND TO DECREASE THEIR SCALES
MILLENNIUM DEVELOPMENT GOALS. UKRAINE – 201074

This subchapter covers issues concerning the spread of HIV infection/AIDS and tuberculo-sis. The HIV/AIDS epidemic in Ukraine remains critical. Lessons learned in other countries show that the spread of HIV/AIDS and tuberculosis causes a decrease in the average life expectan-cy, an increase in the need for health care and a deepening of poverty, social inequality and orphanhood.
І. Targets and Indicators
Targets Indicators
Target 6.A: Decrease HIV prevalence rates by 13%
6.1. Number of people newly diagnosed with HIV per 100,000 population6.2. HIV prevalence rate, %6.3. Number of peo-ple who died from AIDS, per 100,000 population6.4. Level of mother-to-child transmission of HIV, %
Target 6.B: Decrease tubercu-losis morbidity level by 20% (compared with 2005)
6.5. Number of people diagnosed with tuberculosis for the first time (including tuberculosis of respiratory or-gans) per 100,000 population6.6. Number of tu-berculosis deaths per 100,000 population
GOAL 6: REDUCE AND SLOw DOwN
THE SPREAD OF HIV/AIDS AND TUbERCULOSIS
AND INITIATE A TREND TO DECREASE THEIR SCALES
CHAPTER TWO. MILLENNIUM DEVELOPMENT GOALS, ADAPTED FOR UKRAINE 75
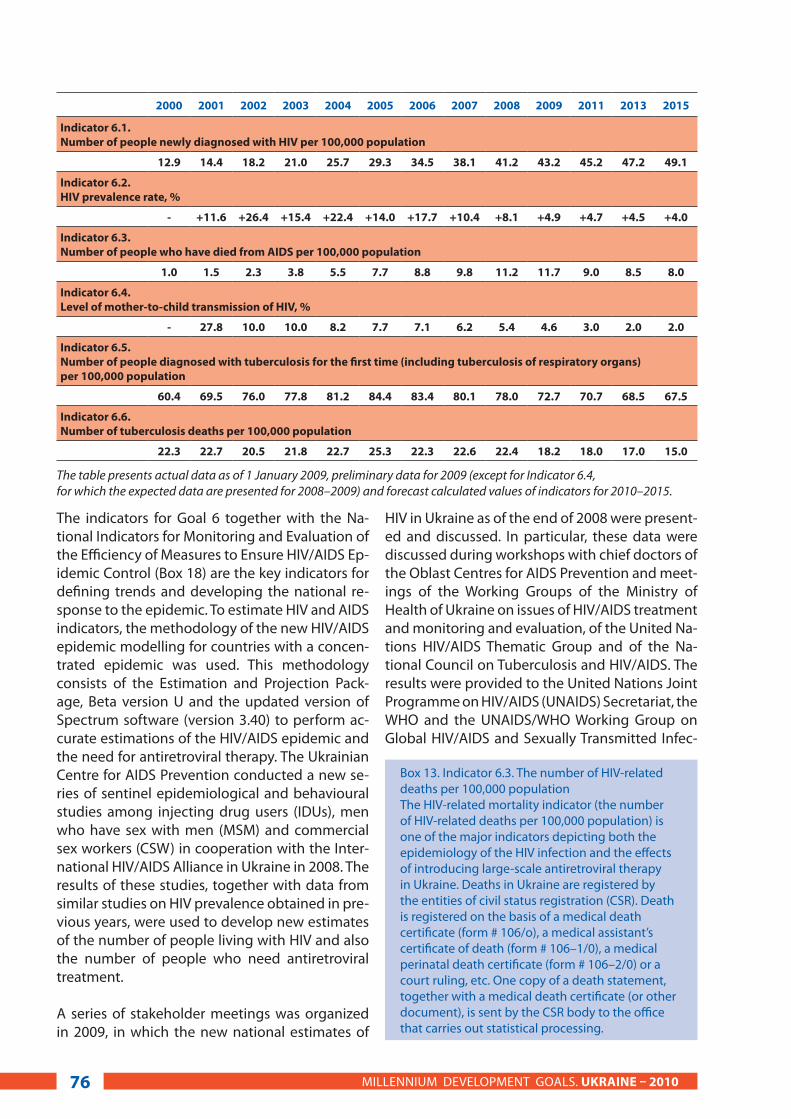
The indicators for Goal 6 together with the Na-tional Indicators for Monitoring and Evaluation of the Efficiency of Measures to Ensure HIV/AIDS Ep-idemic Control (Box 18) are the key indicators for defining trends and developing the national re-sponse to the epidemic. To estimate HIV and AIDS indicators, the methodology of the new HIV/AIDS epidemic modelling for countries with a concen-trated epidemic was used. This methodology consists of the Estimation and Projection Pack-age, Beta version U and the updated version of Spectrum software (version 3.40) to perform ac-curate estimations of the HIV/AIDS epidemic and the need for antiretroviral therapy. The Ukrainian Centre for AIDS Prevention conducted a new se-ries of sentinel epidemiological and behavioural studies among injecting drug users (IDUs), men who have sex with men (MSM) and commercial sex workers (CSW) in cooperation with the Inter-national HIV/AIDS Alliance in Ukraine in 2008. The results of these studies, together with data from similar studies on HIV prevalence obtained in pre-vious years, were used to develop new estimates of the number of people living with HIV and also the number of people who need antiretroviral treatment.
A series of stakeholder meetings was organized in 2009, in which the new national estimates of
HIV in Ukraine as of the end of 2008 were present-ed and discussed. In particular, these data were discussed during workshops with chief doctors of the Oblast Centres for AIDS Prevention and meet-ings of the Working Groups of the Ministry of Health of Ukraine on issues of HIV/AIDS treatment and monitoring and evaluation, of the United Na-tions HIV/AIDS Thematic Group and of the Na-tional Council on Tuberculosis and HIV/AIDS. The results were provided to the United Nations Joint Programme on HIV/AIDS (UNAIDS) Secretariat, the WHO and the UNAIDS/WHO Working Group on Global HIV/AIDS and Sexually Transmitted Infec-
2000 2001 2002 2003 2004 2005 2006 2007 2008 2009 2011 2013 2015
Indicator 6.1. Number of people newly diagnosed with HIV per 100,000 population
12.9 14.4 18.2 21.0 25.7 29.3 34.5 38.1 41.2 43.2 45.2 47.2 49.1
Indicator 6.2. HIV prevalence rate, %
- +11.6 +26.4 +15.4 +22.4 +14.0 +17.7 +10.4 +8.1 +4.9 +4.7 +4.5 +4.0
Indicator 6.3. Number of people who have died from AIDS per 100,000 population
1.0 1.5 2.3 3.8 5.5 7.7 8.8 9.8 11.2 11.7 9.0 8.5 8.0
Indicator 6.4. Level of mother-to-child transmission of HIV, %
- 27.8 10.0 10.0 8.2 7.7 7.1 6.2 5.4 4.6 3.0 2.0 2.0
Indicator 6.5. Number of people diagnosed with tuberculosis for the first time (including tuberculosis of respiratory organs) per 100,000 population
60.4 69.5 76.0 77.8 81.2 84.4 83.4 80.1 78.0 72.7 70.7 68.5 67.5
Indicator 6.6. Number of tuberculosis deaths per 100,000 population
22.3 22.7 20.5 21.8 22.7 25.3 22.3 22.6 22.4 18.2 18.0 17.0 15.0
The table presents actual data as of 1 January 2009, preliminary data for 2009 (except for Indicator 6.4, for which the expected data are presented for 2008–2009) and forecast calculated values of indicators for 2010–2015.
MILLENNIUM DEVELOPMENT GOALS. UKRAINE – 201076
Box 13. Indicator 6.3. The number of HIV-related deaths per 100,000 populationThe HIV-related mortality indicator (the number of HIV-related deaths per 100,000 population) is one of the major indicators depicting both the epidemiology of the HIV infection and the effects of introducing large-scale antiretroviral therapy in Ukraine. Deaths in Ukraine are registered by the entities of civil status registration (CSR). Death is registered on the basis of a medical death certificate (form # 106/o), a medical assistant’s certificate of death (form # 106–1/0), a medical perinatal death certificate (form # 106–2/0) or a court ruling, etc. One copy of a death statement, together with a medical death certificate (or other document), is sent by the CSR body to the office that carries out statistical processing.

tions (STI) Surveillance for their review and con-sideration, and were positively received. Evalua-tions presented concerning HIV/AIDS in Ukraine were used during the preparation of the regular National Report on the Execution of Decisions of the Declaration of Commitment of HIV/AIDS.
II. Situation Analysis
HIV /AIDS and tuberculosis are among the most complex socio-political and medical problems globally.
The HIV epidemic. The scale of the HIV epidemic continues to grow in Ukraine. From 1987 to 1 Jan-uary 2010, 161,000 cases of HIV infection were reg-istered. The highest number of new HIV infection cases for the entire period was recorded in 2009–19,840; 31,241 people have been diagnosed with AIDS since the beginning of the epidemic and 17,791 individuals have died. According to the State Statistics Committee, 22,824 people died in 2005–2009 from diseases caused by HIV.
It is widely known that official data do not reflect the real situation of the HIV epidemic, particularly the current number of people living with HIV. The data provide information only on the number of people who, according to their test results, have
been diagnosed with HIV. A significantly greater number of Ukrainians may be infected but una-ware of their status. This stresses the need for generalized estimated data.
Figure 12. Trends in New Officially Registered HIV Cases among the Ukrainian
Population, 1987–2009
At present, prevention of mother-to-child HIV transmission is one of the most success-ful prevention measures in the country. Begin-ning in 2003, the level of coverage of voluntary HIV testing among pregnant women has continu-ously exceeded 95 percent. The level of coverage of preventive antiretroviral treatment of women diagnosed with HIV during their pregnancy in-creased from 9 percent in 1999 to 92.5 percent in 2007 and 94.9 percent in 2009. This resulted in a significant decrease in the level of mother-to-child HIV transmission from 27.8 percent
8497
5822
6299
6965
9992
12165
years
number on HIV-infected persons
CHAPTER TWO. MILLENNIUM DEVELOPMENT GOALS, ADAPTED FOR UKRAINE 77
Since 2005, processing of causes of death has been carried out according to the International Statistical Classification of Diseases and Related Health Problems, Tenth Revision. Statistics reporting on AIDS-caused deaths prepared by the Ukrainian Centre for AIDS Prevention is based on data on fatalities of those who were in dispensary care at Regional Centres for AIDS Prevention. Statistical data of the State Statistics Committee exceed data on similar AIDS mortality indicators prepared by the Ukrainian Centre for AIDS Prevention by almost two times. This difference in reporting is explained by the incomplete registration of HIV-infected individuals at Regional Centres for AIDS Prevention, i.e. some HIV-positive persons are under the care of medical staff of other services (tuberculosis, narcological, infections, etc). Deaths of such patients are not registered by Regional Centres for AIDS Prevention. To rectify the situation, it would be reasonable for Regional Centres for AIDS Prevention to regularly review, together with oblast statistical departments, each AIDS-related death.
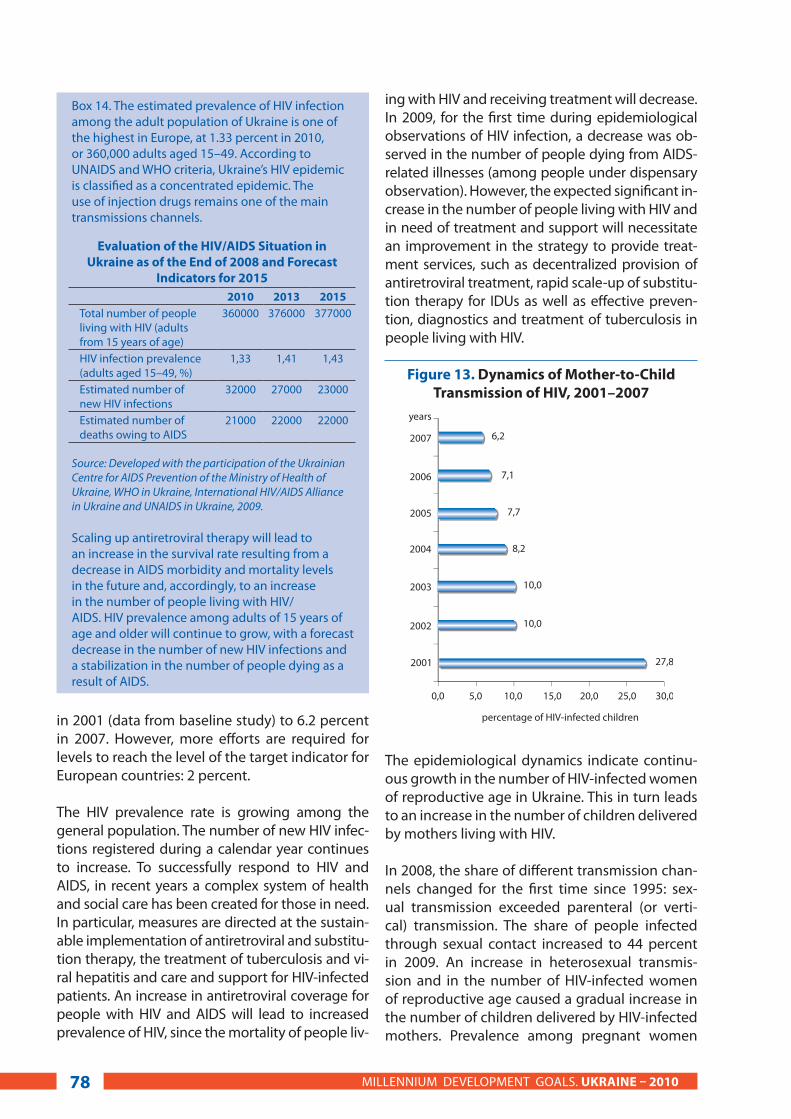
in 2001 (data from baseline study) to 6.2 percent in 2007. However, more efforts are required for levels to reach the level of the target indicator for European countries: 2 percent.
The HIV prevalence rate is growing among the general population. The number of new HIV infec-tions registered during a calendar year continues to increase. To successfully respond to HIV and AIDS, in recent years a complex system of health and social care has been created for those in need. In particular, measures are directed at the sustain-able implementation of antiretroviral and substitu-tion therapy, the treatment of tuberculosis and vi-ral hepatitis and care and support for HIV-infected patients. An increase in antiretroviral coverage for people with HIV and AIDS will lead to increased prevalence of HIV, since the mortality of people liv-
ing with HIV and receiving treatment will decrease. In 2009, for the first time during epidemiological observations of HIV infection, a decrease was ob-served in the number of people dying from AIDS-related illnesses (among people under dispensary observation). However, the expected significant in-crease in the number of people living with HIV and in need of treatment and support will necessitate an improvement in the strategy to provide treat-ment services, such as decentralized provision of antiretroviral treatment, rapid scale-up of substitu-tion therapy for IDUs as well as effective preven-tion, diagnostics and treatment of tuberculosis in people living with HIV.
Figure 13. Dynamics of Mother-to-Child Transmission of HIV, 2001–2007
The epidemiological dynamics indicate continu-ous growth in the number of HIV-infected women of reproductive age in Ukraine. This in turn leads to an increase in the number of children delivered by mothers living with HIV.
In 2008, the share of different transmission chan-nels changed for the first time since 1995: sex-ual transmission exceeded parenteral (or verti-cal) transmission. The share of people infected through sexual contact increased to 44 percent in 2009. An increase in heterosexual transmis-sion and in the number of HIV-infected women of reproductive age caused a gradual increase in the number of children delivered by HIV-infected mothers. Prevalence among pregnant women
percentage of HIV-infected children
years
MILLENNIUM DEVELOPMENT GOALS. UKRAINE – 201078
Box 14. The estimated prevalence of HIV infection among the adult population of Ukraine is one of the highest in Europe, at 1.33 percent in 2010, or 360,000 adults aged 15–49. According to UNAIDS and WHO criteria, Ukraine’s HIV epidemic is classified as a concentrated epidemic. The use of injection drugs remains one of the main transmissions channels.
Source: Developed with the participation of the Ukrainian Centre for AIDS Prevention of the Ministry of Health of Ukraine, WHO in Ukraine, International HIV/AIDS Alliance in Ukraine and UNAIDS in Ukraine, 2009.
Scaling up antiretroviral therapy will lead to an increase in the survival rate resulting from a decrease in AIDS morbidity and mortality levels in the future and, accordingly, to an increase in the number of people living with HIV/AIDS. HIV prevalence among adults of 15 years of age and older will continue to grow, with a forecast decrease in the number of new HIV infections and a stabilization in the number of people dying as a result of AIDS.
Evaluation of the HIV/AIDS Situation in Ukraine as of the End of 2008 and Forecast
Indicators for 20152010 2013 2015
Total number of people living with HIV (adults from 15 years of age)
360000 376000 377000
HIV infection prevalence (adults aged 15–49, %)
1,33 1,41 1,43
Estimated number of new HIV infections
32000 27000 23000
Estimated number of deaths owing to AIDS
21000 22000 22000

and blood donors reflects prevalence among the general population in the country. Prevalence among pregnant women was 0.33–0.34 percent in the past three years, and among blood do-nors 0.13–0.14 percent. At the same time, on av-erage, HIV prevalence among pregnant women was 0.55 percent in the country. An analysis of the regional data shows that this indicator fluc-tuated greatly by region in 2009–0.04 percent in Zakarpaska, 1.59 percent in Kyivska oblast and over 1 percent in Mykolayivska, Dnipropetrovska and Kirovogradska oblasts. Such data may indi-cate a possible generalization of the HIV epidem-ic in some regions of Ukraine.
Figure 14. Number of Registered HIV-Infected women of 15–49 Years of Age and the
Children born to Them, 1995–2009
Gender aspects. Although insignificant attention is often paid to gender issues, they play a decisive role by determining both the biological suscepti-
bility of a woman to HIV infection and vulnerability to its consequences. Since HIV infection is affect-ing a growing number of women in Ukraine, po-litical measures and prevention programmes have become increasingly focused on eliminating the basis of gender inequality and enhancing women’s opportunities to improve their health, education, legal protection and economic independence. Other important gender-specific measures include increasing understanding and resolving problems of HIV transmission among sexual minorities, in-cluding MSM. Studies and in-depth interviews with HIV-positive women suggest the following three factors of women’s enhanced vulnerability to HIV: discrimination in the labour market; non-uni-form distribution of family obligations; and viola-tion of their reproductive and sexual rights.
With regard to the tuberculosis epidemic in Ukraine, considering the social basis of the disease, the country cannot expect its mitigation. The cur-rent target ensures the appropriate control of the infection’s spread, which particularly includes in-creased efficiency of tuberculosis treatment and a decrease in the resulting mortality rate.
A deterioration of the tuberculosis epidemio-logical situation began in 1990; 1995 was con-sidered the beginning of the full-fledged tuber-culosis epidemic. Tuberculosis incidence grew continuously from 1995–2005 and increased from 41.8 to 84.4 cases per 100,000 population. At the same time, significant political support for the control of tuberculosis, and improved efficien-cy of resource use, including a significant increase in financing, led to some positive results. In recent years, a decreasing trend has been observed in relation to indicators of morbidity and mortality from tuberculosis. Today, however, the tubercu-losis situation remains critical in Ukraine: more than 30,000 new cases are recorded each year. A significant portion of the impact is on poor and socially marginalized populations, whose num-bers increased in Ukraine during the economic crisis. Unemployed individuals of working age represented 53.1 percent of those who became ill with tuberculosis for the first time.25 The tuber-
25 Data of the Centre for Medical Statistics of the MoH for 2009;Ministry of Health of Ukraine. Tuberculosis in Ukraine: Analytical and Statistical Handbook, 1998 – 2008. Kyiv: Ministry of Health of Ukraine, Centre for Medical Statistics of the Ministry of Health of Ukraine, 2009. – 90 p.
HIV-infected women of 15-49 years of age
Children delivered by HIV-infected women
Year
s
CHAPTER TWO. MILLENNIUM DEVELOPMENT GOALS, ADAPTED FOR UKRAINE 79

culosis incidence rate increases in penitentiary institutions, which is facilitated by the high con-centration of prisoners in cells and by unsatisfac-tory nutrition. The highest levels of incidence of all forms of tuberculosis are in the south-eastern regions of Ukraine: Khersonska, Dnipropetrovska, Mykolaivska, Luganska, Donetska oblast and the Autonomous Republic of Crimea.
Although some decline in tuberculosis incidence has been observed in Ukraine during the past four years, WHO and the national strategy for over-coming the tuberculosis epidemic have estab-lished that its prevalence and mortality rate must be reduced by 50 percent compared with 1990.
Box 15. The following forecast indicators of all forms of tuberculosis morbidity and mortality in Ukraine were obtained through the statistical extrapolation method:
The mortality rate is one of the major indicators characterizing the epidemiologic situation of tu-berculosis during recent years. Over 10,000 peo-ple die each year from tuberculosis in Ukraine.This high mortality level is caused by the eco-nomic decline in recent years, which has affected the HIV epidemic, and the insufficient availability of health care services.
Tuberculosis remains the primary cause of death among adults from infectious diseases in Ukraine. Tuberculosis strikes above all those who suffer most from poverty and undernutrition and from generally unsatisfactory sanitary conditions. It is also the main cause of death among people living with HIV, owing to their weakened immune sys-tems – a quarter of a million cases of death from tuberculosis worldwide are related to HIV. The tu-berculosis epidemic exacerbates the HIV epidem-ic and vice versa.
III. Challenges
The worsening situation with respect to HIV and tuberculosis infections has been caused by low awareness in society and a range of socio-eco-nomic causes: the rate of development of medical and social care infrastructure has not correspond-ed to rates of epidemic prevalence, exacerbated by insufficient financing of measures on preven-tion and treatment.
Some of the changes taking place in the transition to a market economy have been accompanied by destructive processes, resulting in a favourable environment for the spread of infectious diseases such as HIV and tuberculosis.
There have been regional disparities in the eco-nomic downturn period and an increase in structural unemployment (explicit and hidden) in Ukraine. The employment crisis has been felt strongly in oblasts with developed heavy indus-try. There is a relationship between the morbidity rate and infectious diseases, unemployment lev-els and the number of IDUs, as well as between enhanced migration, frequent change of sex part-ners and the number of sex workers temporarily or permanently involved in the sex industry. This relationship leads to prevalence in communi-ties and regions that are especially vulnerable to these diseases.
With stable trends of new HIV and tuberculosis infections and low efficiency of countermeasures, the consequences may significantly deepen the already complex demographic crisis in the near future, leading to a decline in the quality of the productive forces of society and of other compo-nents of socio-economic development.
HIV epidemic-related challenges. Currently, Ukraine remains in the category of countries that have an HIV epidemic concentrated among some groups that are at the highest risk of infec-tion (IDUs, CSWs, MSM). According to the sentinel epidemiological survey, HIV prevalence varies among these population groups but is alarmingly high. Data show that the new wave of HIV infec-tion through sexual contact is closely related to risky sexual behaviour of IDUs and their partners.
2011 2013 2015
Level of morbidity for all tuberculosis forms (per 100,000 population )
70,7 68,5 67,5
Number of deaths from tuberculosis (per 100,000 population)
18,0 17,0 15,0
MILLENNIUM DEVELOPMENT GOALS. UKRAINE – 201080

Other population groups that are increasingly affected by the epidemic are prisoners and indi-viduals under investigation. Although prisoners are not isolated as a risk group, there are data showing high levels of risky behaviour among them. Epidemiological monitoring shows the need to categorize prisoners within the groups at increased risk of HIV infection, which require ad-ditional attention, resources and support.
Prevention among most-at-risk populations. The scale and quality of preventive measures among most-at-risk populations and their sexual partners play a decisive role in identifying the fur-ther development of the HIV infection epidemic in Ukraine. Global experience shows that IDUs are the most vulnerable to HIV, and the spread of the infection among them is the fastest.
According to sociological studies in 2009, the level of coverage of prevention programmes of IDUs (the most at-risk group in the country) was just 32 percent. Prisoners are the only risk groups that can easily be covered with complex preven-tion programmes. However, according to this 2009 data, just 15 percent of prisoners were re-ceiving some kind of prevention service. To date, most prevention measures among most-at-risk groups are supported by contributions from ex-ternal donor organisations and implemented by non-governmental and some religious organisa-tions, with almost no support from the state. At the same time, in the past four years, the quality and intensity of these priority interventions have improved, leading to the stabilization of the epi-demic among IDUs and, consequently, a decrease in intensity of new HIV infections in the country. This is shown by a decrease in the growth rate of new HIV infections, by three and a half times in 2006 compared with 2005 (+16. percent) and in 2009 compared with 2008 (+4.6 percent). At present, a decrease in the rates of HIV infection is being observed in Ukraine.
However, the scale, quality and intensity of these measures are insufficient to stop the spread of HIV within these groups and to limit the poten-tial of HIV spreading to the general population. It should be noted that the current State Pro-gramme on HIV/AIDS does not set any clear prior-ities corresponding to the concentrated epidemic
stage in Ukraine, which is moving threateningly close to the generalized stage of the epidemic.
Prevention among the general population. Al-though awareness of HIV and HIV prevention measures among the general population has im-proved to some extent during the past several years, most of the key general population groups (youth, students) are still not supported by effec-tive measures. The spread of the HIV epidemic in most countries is mainly through the sexual trans-mission of the virus by new generations of young people. Availability of correct knowledge about HIV is an important component to decrease risky behaviours with respect to HIV transmission.
At present, students of higher and secondary vocational educational institutions, the most sexually active age group, are not covered by any consistent HIV prevention measures at the na-tional level. According to data from sociological interviews in 2007 and 2009, 40 percent of young people in Ukraine correctly identified ways of pre-venting the sexual transmission of HIV. Because of a lack of trained teachers, though, there has been limited introduction of consistent and compre-hensive HIV awareness programmes in Ukrain-ian schools. In 2006, only 57 percent of GEIs had teachers trained to ensure the education of pupils in accordance with programmes of healthy life skills development regarding HIV prevention; this figure increased in 2009 to 58.7 percent. Develop-ing healthy life skills is an important component of educational activities, helping young people deal with the problems and demands of everyday life. Innovative means of promoting HIV aware-ness among the general population, such as ad-vertisements on the radio and television or inte-gration of HIV awareness-raising campaigns into high-level sports or cultural events, have not yet been introduced in the country.
Voluntary counselling and testing. Coverage of HIV counselling and testing among group representatives (IDUs, patients with tuberculo-sis and STIs and prisoners) is low and inconsist-ent. There are huge differences in the coverage of HIV counselling and testing services between regions, caused on the one hand by deficits in lo-cal budgets and on the other hand by a lack of understanding of the role of these groups’ rep-resentatives in addressing HIV. These differences
CHAPTER TWO. MILLENNIUM DEVELOPMENT GOALS, ADAPTED FOR UKRAINE 81

can mean that the real scale of HIV prevalence is hidden in oblasts where inadequate resources are allocated for purchasing testing systems and where people from risk groups do not have easy access to counselling and testing services.
Laboratory diagnostics. The quality of labora-tory diagnostic services is a determining fac-tor in ensuring the accuracy of epidemiological data and making decisions on the treatment of HIV patients. If laboratory services at the national level are not expanded and their potential is not strengthened, it will be impossible to reach the objectives of increasing HIV counselling and test-ing of people from risk groups as well as providing antiretroviral treatment for all who will need such treatment. Contemporary accreditation of labora-tories; assuring the quality of laboratory studies, including external quality control; and a procure-ment and supply system for laboratory equip-ment and materials have not been introduced in the country. There are also serious shortcomings in registration, procurement and the supply of HIV diagnostic testing systems. Most HIV studies in Ukraine are conducted through the application of testing systems from one Ukrainian producer. Although these testing systems are considered reliable, a regular independent assessment (in ac-cordance with international standards) has never been conducted in Ukraine.
Medical care and treatment. In 2008 and 2009, 41 percent of adults and 48 percent of children with progressive HIV infection received antiretroviral therapy. However, coverage is insuf-ficient to satisfy the needs of a growing number of patients. The expected increase in the number of people living with HIV who will need treatment is a serious problem for the health care system.
Non-medical care and support. There is still very low coverage of care and support services, which do not correspond to the scale and complexity of current and future needs. Only a small group of clients receive integrated care and support services, while a large and growing group of peo-ple living with HIV lack access to them. Further, medical and social expert commissions are insuf-ficiently efficient, since people living with HIV are provided with limited assistance for short periods of time only.
Planning, budgeting and financing. Procure-ment and supply management. State planning, budgeting and monitoring of the financing of measures to respond to and prevent AIDS are ex-tremely complicated. They do not fully reflect the contributions of all partners. The lack of financ-ing for the scale-up of prevention programmes is one of the key problems hindering an effective national response to the HIV epidemic in Ukraine. HIV/AIDS expenditure assessments show that more than half of the expenditures in the coun-try are covered by contributions from external donors and individual citizens. A significant in-crease in financing by the State Programme to Combat HIV Infection/AIDS has been observed in recent years. However, its underfunding in 2009 amounted to 47 percent, and it is expected that underfunding will reach 48 percent in 2010. State financing is not earmarked for purchasing medicine for the treatment of STIs, opportunistic infections or viral hepatitis. The country does not have a clear national policy for the procurement and supply management of goods, equipment and services related to HIV and AIDS. This leads to inadequate coordination between key national partners.
Box 16. The resources of the state are being supplemented by a significant contribution from the Global Fund to Fight AIDS, Tuberculosis and Malaria, and also by contributions from other international and bilateral donors. Epidemiological trends of HIV infection in Ukraine demand more attention and support from the country’s bilateral and multilateral partners. Considering significant and growing needs in prevention, treatment and care, it is expected that Ukraine will need further external support for these activities, which correspond to national interests, above all to the State Programme to Ensure Prevention of HIV Infection, Treatment and Support of HIV-Infected and AIDS Patients for 2009–2013.
Human rights. Despite numerous regulations in Ukrainian legislation guaranteeing the protection of human rights, such practices are not always followed. People who live with HIV or who are affected by the epidemic suffer from stigma and discrimination. This is a serious hindrance to ac-cess to efficient services.
As a result of its negative influence on the demo-graphic situation, tuberculosis in Ukraine has become a threatening health and social problem.
MILLENNIUM DEVELOPMENT GOALS. UKRAINE – 201082

The main reasons for the problem include: the continued socio-economic crisis in the country, a decrease in living standards, a decrease in com-munity immunity, insufficient preventive orien-tation of the health care system and insufficient health care financing.
Lack of diagnostic and treatment of tuberculosis among some marginalized groups of the popu-lation (homeless, street children, migrants, refu-gees, some ethnic minorities, residents of remote villages, etc) prevents an adequately assessment of the level of the epidemic within these groups.
There are discrepancies among some legisla-tive documents in relation to implementation of the Global Stop TB Strategy. Implementation of the Directly Observed Treatment Short Course (DOTS) strategy is efficient in oblasts where there are external sources of financing. State budget funds are limited and are not fully or adequate-ly utilized for the introduction of economically efficient, international standards to overcome tuberculosis.
Insufficient coordination and lack of govern-ance. The State Programme to Combat Tubercu-losis for 2007–2011 was developed and adopted by the Law of Ukraine in 2007, with the aim of re-ducing the burden of tuberculosis in the country. In accordance with this Programme, anti-tubercu-losis institutions should be provided with equip-ment, medicine and medical supplies through centralized procurement. However, at present, state financing of activities conducted accord-ing to the Programme does not satisfy 100 per-cent of the need both for anti-tuberculosis med-icine of the II level and for laboratory and X-ray equipment.
There is an excessive number of laboratories. In addition, the role of the National Reference Laboratory, which should coordinate the work of laboratories of all levels, including work on issues of ensuring quality of studies, is insufficient.
There is an insufficient level of cooperation and coordination on treatment between specialized anti-tuberculosis and HIV infection treatment in-stitutions, particularly with regard to treatment of patients with co-infection. The network of pri-mary health care institutions is not inadequate-
ly involved to provide services to people with tuberculosis.
There is a high and constantly growing number of multidrug-resistant cases of tuberculosis (i.e. resistant to the therapeutic effect of standard an-ti-tuberculosis medications). The situation is com-plicated by the fact that the number of cases of multiple and extreme drug-resistant tuberculosis is rapidly growing in Ukraine. This raises the cost of treatment by almost 100 times. For example, in recent years, it was revealed that patients’ primary chemo-resistance of the tuberculosis causative agent to key anti-tuberculosis medicines was 25–30 percent, and secondary was 70 percent. The high level of chemo-resistance indicators is a re-sult of inadequate implementation of the main approaches to overcoming tuberculosis, particu-larly infection control and the DOTS.
Box 17. Globally, 425,000 cases of multidrug-resistant illness occur each year; the highest indicators are observed in the former Soviet Union and in China. Furthermore, recent cases have been reported of almost incurable forms of tuberculosis.
The large number of acute forms of tuberculosis linked to HIV infection reveals the peculiarities of modern tuberculosis. This leads to a decrease in the efficiency of treatment and, consequently, to an increase in indicators of tuberculosis morbid-ity and mortality.
Overcoming tuberculosis requires comprehen-sive decisions at the state level, since tuberculosis is not only a health care issue but also a socio-economic one.
IV. Moving Forward
The experiences of European countries show that eliminating problems related to HIV and tubercu-losis requires that these issues become top health care and social priorities. The implementation of state policy on prevention, treatment, care and support of people living with HIV and tubercu-losis must be ensured by the joint efforts of the state authorities, society, churches, private sector and international organisations.
CHAPTER TWO. MILLENNIUM DEVELOPMENT GOALS, ADAPTED FOR UKRAINE 83

Prevention among most-at-risk population. There is an urgent need to increase the effective-ness of the prevention of further spreading of the epidemics. In order to stop the spread of HIV, the following are urgently needed: intensification of the coverage of most-at-risk groups by revising the implementation mechanisms of preventive measures and enhancing them through the in-tegration of the state social protection system, health care and other sectors in rural settings; and ensuring their long-term stability through ef-ficient public administration at all levels.
Prevention among the general population. Pri-mary HIV prevention and awareness raising play important roles in the complex measures against the epidemic. Political commitment is needed, as well as an enhanced use of resources through the introduction of economic approaches, increased state resources and appropriate programmes for maintaining the current low rates of HIV infec-tion prevalence among the general population, above all among youth. The epidemic raises the need for initiatives aimed at improving reproduc-tive health and creating the conditions for ensur-ing gender equality. At present, global actions are being implemented for women, which aim to develop new HIV prevention methods. Enhancing prevention programmes, which can have a signifi-cant effect on further decreasing mother-to-child transmission, is a key component of the set of ac-tions developed as a response to HIV. Prevention measures and awareness raising of the general population, including through sexual and repro-ductive health programmes as well as elimina-tion of stigma and discrimination, are important components in mitigating the impact of the HIV/AIDS epidemic.
Voluntary counselling and testing. Consider-ing that two thirds of people living with HIV do not know their status, it is necessary to enhance the level of coverage and quality of counselling and testing services for representatives of groups at the greatest risk of HIV infection. This is very important for both the prevention of new infec-tion cases and for decreasing mortality, which re-quires greater efficiency in the policy and strategy of testing.
Laboratory diagnostics. A complex system of laboratory accreditation; ensuring the quality of
studies, including external quality control; and procurement management systems must be es-tablished immediately. These would aim at en-suring a regular and timely supply of laboratory equipment and materials, including blood banks.
Medical care and treatment. It is necessary to revise and improve strategies for providing treat-ment services and to analyse the availability of adequate infrastructure and other resources aimed at moving services closer to patients’ place of residence. It is also necessary to decentralize the provision of antiretroviral therapy, increase the level of coverage of substitution therapy and increase the efficiency of prevention, diagnostics and treatment of tuberculosis among people liv-ing with HIV.
Non-medical care and support. Plans for care and support services should be revised to ensure that social services supporting people living with HIV are integrated into the state social protection system, aiming at more uniform coverage and sustainability of the most important of them. It is necessary to review the state system of disability privileges provided to people living with AIDS.
Planning, budgeting and financing. Procure-ment and supply management. In order to ful-fil the guarantees and obligations of universal access to prevention, treatment, care and sup-port, as set out in the Law of Ukraine on Preven-tion of Acquired Immune Deficiency Syndrome (AIDS) and Social Protection of the Population as well as the State Programme to Ensure Preven-tion of HIV Infection, Treatment and Support of HIV-Infected and AIDS Patients for 2009–2013, it is necessary to use resources efficiently, and not just significantly increase their amount. The State Programme to Ensure Prevention of HIV Infec-tion, Treatment and Support of HIV-Infected and AIDS Patients for 2009–2013 was approved un-der the Law of Ukraine in 2009 for the first time. Enhancing the legal status of a new programme should ensure the prioritization of its budget fi-nancing at all levels (national, oblast and rayon). In addition, the programme envisages unprec-edented resources for non-health ministries. It is necessary to approve a strategic approach to pro-curement management, which would take into account the acute needs of this programme, in-cluding the optimization of expenditures based
MILLENNIUM DEVELOPMENT GOALS. UKRAINE – 201084

on the principles of timeliness and economic efficiency.
Human rights. It is necessary to develop and implement national policy on the protection of most-at-risk groups and people living with HIV from rights violations, stigmatization and discrimination during service provision and to strengthen mechanisms to enforce these norms.
The annual number of lives lost to tuberculosis has reached more than 10,000. Under the current socio-economic conditions and given the insuf-ficient financing of tuberculosis services, the fol-lowing measures for overcoming tuberculosis are prioritized.
Improvement of access to treatment of vulner-able population groups through: (1) implemen-tation of the DOTS in regions that currently have insufficient infrastructure; (2) increased numbers of patients with multidrug-resistant tuberculo-sis receiving treatment; (3) introduction of an efficient system for overcoming tuberculosis in the penitentiary system; (4) improvement of the multidisciplinary approach for patients with tu-berculosis and tuberculosis/HIV co-infection: de-centralization and the guarantee of quality medi-cal services at primary health care level; and (5) establishment of an economically efficient strat-egy of overcoming tuberculosis, primarily among vulnerable populations, and enhancement of strategic planning and management.
Improvement of diagnostics in civil and peni-tentiary health care systems should lead to im-provements in the situation through: (1) appli-cation of contemporary tuberculosis diagnostic methods, i.e. microscopic examination of sputum swabs and the creation of proper conditions in health care institutions to detect the disease; (2) conducting of tuberculinodiagnostics among contacted individuals and those belonging to tuberculosis risk groups; (3) training provided to medical workers of health care institutions on contemporary technologies for conducting ex-aminations and consulting patients with tubercu-losis symptoms; and (4) development of national standards for laboratory diagnostics of tuberculo-sis and establishment of a quality control system for laboratory studies.
Strengthening of material support and staffing of the tuberculosis service, including that of spe-cialized departments of academic and research institutions, through: (1) provision of tubercu-losis institutions with anti-microbacterial medi-cines and other necessary supplies; and (2) im-provement of the pre-degree and postgraduate training system of psychiatrists and staffing of tuberculosis institutions with highly professional personnel.
Integration of activities of anti-tuberculosis services into the general network of clinics, sanitary and epidemiological services and other respective executive authorities (services of inter-nal affairs, execution of sentences, migration, etc) through: (1) coordination of the anti-tuberculosis institutions under a single state administration authority on combating HIV and other socially dangerous diseases; (2) coordination of the ac-tivities of ministries, other executive authorities and local self-governing bodies and community organisations in tuberculosis prevention; and (3) encouragement of health care institutions of all forms of ownership to conduct timely laboratory diagnostics of tuberculosis by applying the meth-od of sputum swab microscopic evaluation.
Development and implementation of a system for monitoring tuberculosis countermeasures through: (1) introduction of monitoring of the treatment process and observation of the appli-cation of the standardized treatment of patients; (2) improvement of the registration and report-ing system, taking into account WHO recommen-dations; and (3) creation of national and regional tuberculosis registries.
Social mobilization for reducing stigma and discrimination related to tuberculosis and en-hancing awareness of overcoming tuberculosis through: (1) systematic awareness raising of the population on issues of tuberculosis prevention and treatment, as well as information campaigns on healthy lifestyles; and (2) the provision of so-cial services to people living with tuberculosis with the involvement of civil society.
CHAPTER TWO. MILLENNIUM DEVELOPMENT GOALS, ADAPTED FOR UKRAINE 85

Box 18.
National Indicators for Monitoring and Evaluation of the Efficiency of Measures to Ensure HIV/AIDS Epidemic Control
No. National indicators Indicator Value
National Commitment and Actions
1 Domestic and international AIDS spending by categories and financing sources
2007:Total: US $ 79.3 million(UAH 400.7 million), including US $ 16.7 million (UAH 84.2 million) from the state budget2008:Total: US $ 102.4 million (UAH 539.8 million), including US $ 30.7 million (UAH 162 million) from the state budget
2 National Composite Policy Index 2009: -
National Programmes (blood safety, antiretroviral therapy coverage, prevention of mother-to-child transmission, co-management of TB and HIV treatment, HIV testing, prevention programmes, services for orphans and vulnerable children, and education)
3 Percentage of donated blood units screened for HIV in a quality-assured manner
2009: 0%
4 Percentage of adults and children with advanced HIV infection receiving antiretroviral therapy
2008: 40%Children: 90%2009: 48%Children: 100%
5 Percentage of HIV-infected pregnant women who received antiretrovirals to reduce the risk of mother-to-child transmission
2008: 95.5%2009: 94.9%
6 Percentage of estimated HIV-positive incident TB cases that received treatment for TB and HIV
2008: 21%
7 Percentage of women and men aged 15–49 who received an HIV test in the last 12 months and who know their results
2009: 13%
8 Percentage of most-at-risk populations who received an HIV test in the last 12 months and who know their results:– Injecting drug users– Commercial sex workers – Men who have sex with men– Prisoners
2009:
IDUs – 26%CSWs – 59%MSM – 43%Prisoners – 12%
MILLENNIUM DEVELOPMENT GOALS. UKRAINE – 201086

CHAPTER TWO. MILLENNIUM DEVELOPMENT GOALS, ADAPTED FOR UKRAINE 87
9 Percentage of most-at-risk populations reached with HIV prevention programmes:– Injecting drug users;– Commercial sex workers;– Men who have sex with men;– Prisoners
2009:
IDUs – 32%CSWs – 59%MSM – 63%Prisoners – 15%
10 Percentage of orphaned and vulnerable children aged 0–17 whose households received free basic external support in caring for the child
Does not correspond to the epidemic recorded in Ukraine
11 Percentage of schools that provided life skills-based HIV education in the last academic year
2009: 58.7%
Knowledge and behaviour
12 Current school attendance by child orphans and children with parents who are 10–14 years old
Does not correspond to the epidemic recorded in Ukraine
13 Percentage of young people 15–24 years of age who correctly identify ways of preventing HIV infection sexual transmission and know how the infection can be transmitted
2009: 40%
14 Percentage of most-at-risk populations who both correctly identify ways of preventing the sexual transmission of HIV and reject major misconceptions about HIV transmission:– Injecting drug users;– Commercial sex workers;– Men who have sex with men– Prisoners
2009:
IDUs – 55%CSWs – 51%MSMs – 71%Prisoners – 41%
15 Percentage of young women and men aged 15–24 who have had sexual intercourse before the age of 15
2009: 2.4%
16 Percentage of women and men aged 15–49 who had sexual intercourse with more than one partner in the last 12 months
2009: 15%
17 Percentage of women and men aged 15–49 who had more than one partner in the past 12 months who used a condom during their last sexual intercourse
2009: 61%
18 Percentage of female and male sex workers reporting the use of a condom with their most recent client
2009: 88%
19 Percentage of men reporting the use of a condom during the last time they had anal sex with a male partner
2009: 64%
20 Percentage of IDUs reporting the use of a condom during the last time they had sexual intercourse
2009: 48%
21 Percentage of IDUs reporting the use of sterile injecting equipment during the last time they injected
2009: 87%
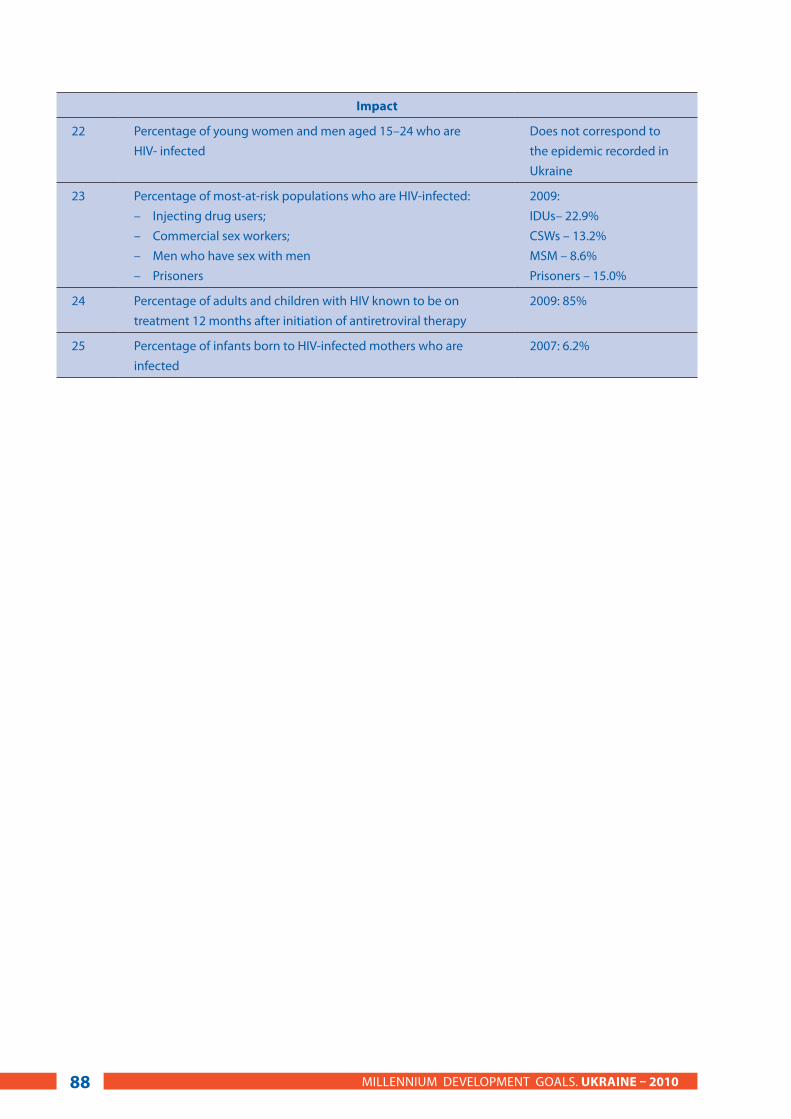
GOAL 7: ENSURE ENVIRONMENTAL
SUSTAINAbILITY
MILLENNIUM DEVELOPMENT GOALS. UKRAINE – 201088
Impact
22 Percentage of young women and men aged 15–24 who are HIV- infected
Does not correspond to the epidemic recorded in Ukraine
23 Percentage of most-at-risk populations who are HIV-infected:– Injecting drug users;– Commercial sex workers;– Men who have sex with men– Prisoners
2009:IDUs– 22.9%CSWs – 13.2%MSM – 8.6%Prisoners – 15.0%
24 Percentage of adults and children with HIV known to be on treatment 12 months after initiation of antiretroviral therapy
2009: 85%
25 Percentage of infants born to HIV-infected mothers who are infected
2007: 6.2%

This subchapter presents an analysis of sustain-able environmental development. The impact of human activities on biological resources re-mains high in Ukraine. The environmental is-sues that require urgent attention include, inter alia, conserving and improving land and water resources, protecting the atmosphere and con-serving biodiversity and increasing the efficien-cy of energy use, among others. A priority task for Ukraine is to resolve those issues that have a negative impact on health and living condi-tions, especially of the poorest groups of the population. These issues include primarily air pollution and the availability of drinking water.
І. Targets and Indicators
Targets Indicators
Target 7.A: Increase by 2015 share of the population with access to centralized water supply, inter alia 90% of the urban population and 30% of the rural population
7.1. Share of urban population with access to centralized wa-ter supply, % of overall urban population7.2. Share of rural population with access to centralized water supply, % of overall rural population
Target 7.B: Stabilize by 2020 greenhouse gas emissions at 20% below 1990 levels
7.3. Volume of emissions of pollutants into atmosphere from stationary sources, mil-lion tonnes per year7.4. Volume of emissions of pollutants into atmosphere from mobile sources, million tonnes per year
Target 7.C: Stabilize pol-lution of water reservoirs by 2015. Stabilize at the level of 8,500 million tonnes per year the volume of sewage disposal to surface water reservoirs, million cubic metres per year
7.5. Volume of reused water disposals, million cubic metres per year
Target 7.D: Increase forest cover of the territory of Ukraine to 16.1% and area of nature reserve territory by 2015Enhance the network of nature reserves, biosphere reserves and national natu-ral parks to 3.5% of the over-all territory of Ukraine and to 9.0% of the overall area of territories and objects of the natural reserve fund
7.6. Forest cover and ratio of lands covered with forests, % of overall area of the territory of Ukraine7.7. Share of area of natural reserves, biosphere reserves and national natural parks, % of overall area of the territory of Ukraine7.8. Share of area of territories and objects of the natural reserve fund, % of overall area of the territory of Ukraine
GOAL 7: ENSURE ENVIRONMENTAL
SUSTAINAbILITY
CHAPTER TWO. MILLENNIUM DEVELOPMENT GOALS, ADAPTED FOR UKRAINE 89
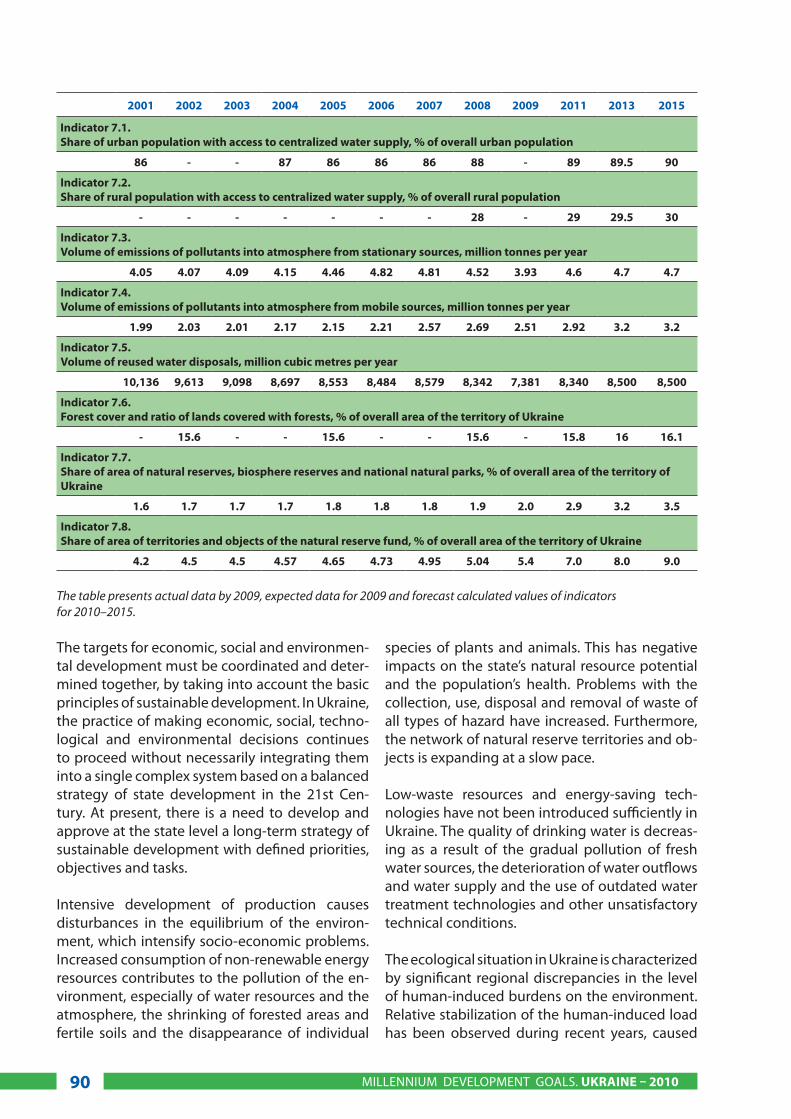
The targets for economic, social and environmen-tal development must be coordinated and deter-mined together, by taking into account the basic principles of sustainable development. In Ukraine, the practice of making economic, social, techno-logical and environmental decisions continues to proceed without necessarily integrating them into a single complex system based on a balanced strategy of state development in the 21st Cen-tury. At present, there is a need to develop and approve at the state level a long-term strategy of sustainable development with defined priorities, objectives and tasks.
Intensive development of production causes disturbances in the equilibrium of the environ-ment, which intensify socio-economic problems. Increased consumption of non-renewable energy resources contributes to the pollution of the en-vironment, especially of water resources and the atmosphere, the shrinking of forested areas and fertile soils and the disappearance of individual
species of plants and animals. This has negative impacts on the state’s natural resource potential and the population’s health. Problems with the collection, use, disposal and removal of waste of all types of hazard have increased. Furthermore, the network of natural reserve territories and ob-jects is expanding at a slow pace.
Low-waste resources and energy-saving tech-nologies have not been introduced sufficiently in Ukraine. The quality of drinking water is decreas-ing as a result of the gradual pollution of fresh water sources, the deterioration of water outflows and water supply and the use of outdated water treatment technologies and other unsatisfactory technical conditions.
The ecological situation in Ukraine is characterized by significant regional discrepancies in the level of human-induced burdens on the environment. Relative stabilization of the human-induced load has been observed during recent years, caused
2001 2002 2003 2004 2005 2006 2007 2008 2009 2011 2013 2015
Indicator 7.1. Share of urban population with access to centralized water supply, % of overall urban population
86 - - 87 86 86 86 88 - 89 89.5 90
Indicator 7.2. Share of rural population with access to centralized water supply, % of overall rural population
- - - - - - - 28 - 29 29.5 30
Indicator 7.3. Volume of emissions of pollutants into atmosphere from stationary sources, million tonnes per year
4.05 4.07 4.09 4.15 4.46 4.82 4.81 4.52 3.93 4.6 4.7 4.7
Indicator 7.4. Volume of emissions of pollutants into atmosphere from mobile sources, million tonnes per year
1.99 2.03 2.01 2.17 2.15 2.21 2.57 2.69 2.51 2.92 3.2 3.2
Indicator 7.5. Volume of reused water disposals, million cubic metres per year
10,136 9,613 9,098 8,697 8,553 8,484 8,579 8,342 7,381 8,340 8,500 8,500
Indicator 7.6. Forest cover and ratio of lands covered with forests, % of overall area of the territory of Ukraine
- 15.6 - - 15.6 - - 15.6 - 15.8 16 16.1
Indicator 7.7. Share of area of natural reserves, biosphere reserves and national natural parks, % of overall area of the territory of Ukraine
1.6 1.7 1.7 1.7 1.8 1.8 1.8 1.9 2.0 2.9 3.2 3.5
Indicator 7.8. Share of area of territories and objects of the natural reserve fund, % of overall area of the territory of Ukraine
4.2 4.5 4.5 4.57 4.65 4.73 4.95 5.04 5.4 7.0 8.0 9.0
The table presents actual data by 2009, expected data for 2009 and forecast calculated values of indicators for 2010–2015.
MILLENNIUM DEVELOPMENT GOALS. UKRAINE – 201090
by structural changes in the economy and a de-cline in production related to the consequences of the financial and economic crisis. These issues required adjustments of the major target and in-dicators for 2015.
ІІ. Situation Analysis
Access to drinking water (centralized water sup-ply). The population of Ukraine has in general ad-equate access to drinking water which complies with national quality standards. At the same time, there are significant inequalities in the provision of drinking water between urban and rural areas. These inequalities include different water lev-els of provision to the centralized water supply, which is tested regularly for quality. In particu-lar, today, 88 percent of the urban population of Ukraine (100 percent of the population of large cities) is provided with water from the centralized supply compared with only 28 percent of the ru-ral population (excluding well water).
In 2008, 66 percent of centralized water supply enterprises in urban areas in Ukraine provided drinking water that did not comply with national quality standards for water. Almost half of central-ized water supply systems in rural areas operate with defects. Imperfect exploitation and ageing equipment means that the water supply cannot be guaranteed as being of a standard quality.
Decentralized water supply objects in rural ar-eas, which include pit wells (over 2.1 million), catchments (around 1,000) and deep water wells (around 90,000) and wells with small pipes (over 350,000) are mostly in unsatisfactory a technical and sanitary condition. Almost one third of the infrastructure for underground and groundwater intake does not have appropriately equipped sanitary control areas.
As a result of a significant financing deficit of the Complex Programme on the Provision of Central-ized Water Supply Systems to Rural Areas that Utilize Imported Water during the 2001–2005 Pe-riod and Forecast by 2010 and of the State Tar-get Social Programme on Primary Provision with Centralized Water Supply of Rural Areas that Use Imported Water by 2010, which were developed to improve the unsatisfactory provision of wa-
ter to areas that lack their own sources of qual-ity drinking water, Ukraine has been unable to achieve its goals. In particular, measures of the Complex Programme envisaged drinking water provision for 362 rural areas and an allocation of UAH 302.4 million from the state budget for these purposes. During this period, UAH 23.4 million, or just 7.7 percent, of these measures were financed. The financing situation of these programmes did not change during 2006–2008. In particu-lar, UAH 50 million should have been allocated to finance the State Programme in 2008, but in fact only UAH 39.45 was allocated (underfund-ing of the programme’s measures at 21.1 percent in 2008). Therefore, there is a need to revise the indicators of achievement.
Greenhouse gas emissions. Greenhouse gas emissions in Ukraine declined dramatically by over 50 percent over the period after 1990, follow-ing the collapse of the former Soviet Union. This owed to the collapse in economic activity over this period. However, since then, greenhouse gas emis-sions have continued to rise, and Ukraine continues to be one of the least energy-efficient countries in the world, with one of the highest greenhouse gas emissions level per unit of GDP among all Com-monwealth of Independent States (CIS) countries. The UNFCCC national greenhouse gas inven-tory estimates that total emissions from Ukraine in 2007 were 436.0 million tonnes of CO2 equivalent (the corresponding figure for 2006 was 436.8 mil-lion tonnes). This is 53 percent less than the Kyoto Protocol baseline for 1990 (926.0 million tonnes), but it has been growing steadily together with the increase in economic activity since 2000, adding an average of 6.6 million tonnes of greenhouse gas emissions a year. This results in a per capita emission of 9.45 tonnes of CO2 equivalent per year (for comparison, annual per capita green-house gas emissions is 19.78 tonnes for the United States, 10.40 tonnes for Germany and 12.00 tonnes for the Russian Federation). Consequently, Ukraine is ranked 19th among the world’s largest emitters of greenhouse gases. The largest sector for emis-sions is the energy sector, with the largest sources of greenhouse gas emissions from the oil and gas sectors. Combined, the energy sector alone ac-counts for approximately 70 percent of Ukraine’s total greenhouse gas emissions.
CHAPTER TWO. MILLENNIUM DEVELOPMENT GOALS, ADAPTED FOR UKRAINE 91

High energy consumption compared with GDP is a result of a lack of investment in the moderniza-tion of industry since the collapse of the Soviet Union. Insufficient implementation of new ener-gy-efficient technologies in Ukraine limits global industrial competitiveness and causes severe im-pacts on the local and global environment. It is worth noting that low energy efficiency was one of the major factors exacerbating the financial crisis in the Ukrainian economy. The means to reduce greenhouse gas emissions in Ukraine in-clude increasing energy efficiency and promoting renewable energy, fuel-switching activities and developing sustainable and low emission trans-port solutions.
Air pollution. Pollution of the atmosphere re-mains one of the most pressing environmental issues in Ukraine. In 2001–2007, the increase in production levels of the major industries caused a steady increase in the volumes of hazardous emissions into the atmosphere from station-ary pollution sources, particularly from 2001 to 2007 (4.05 million tonnes to 4.81 million tonnes, or by 0.76 million tonnes – 18.7 percent). At the same time, a decrease in industrial output was observed during the financial and economic cri-sis starting in 2008 and, as a result, a decrease in emissions into the atmosphere air from stationary sources of pollution: emissions of pollutants de-creased by more than 0.288 million tonnes, or by 6 percent compared with 2007. The major air con-taminators in the country in 2008 were process-ing industry enterprises (the chemical industry, the coke and chemical industry and metallurgy) at 33 percent, mining industry enterprises, at 21 percent of hazardous emissions, and producers of electric energy, gas and water, at 37 percent.
The density of emissions from stationary sourc-es of pollution calculated per square kilometre amounts to 7.5 tonnes of pollutants and 98 kg per person. However, in some regions, these in-dicators significantly exceed the average level of the country. In particular, in Donetska oblast, a region with heavy coal mining activity, emission volumes calculated per square kilometre were higher by 7.7 times and by 3.5 times per person; in Dnipropetrovska oblast by 4.0 and 2.9 times; in Luganska oblast by 2.8 and 2.5 times; in Ivano-Frankivska oblast by 2.3 and 1.8 times; and in Zaporizka oblast by 1.1 and 1.2 times. Kyiv en-
terprises generated emissions of 32.3 tonnes of pollutants per square kilometre, which exceeded the average indicator in the country by four times. The following areas of the country experience the highest human-induced burden from the stationary sources of polluting cities: Kryvyy Rig (449,400 tonnes), Mariupol (359,300 tonnes) and Burshtyn (218,300 tonnes).
According to data of the State Statistics Com-mittee for 2009, a decrease in emissions into the atmosphere from stationary sources has been observed. In particular, the inflow of pol-lutants into the air basin was 3.9 million tonnes (by 597,000 tonnes, or 13.2 percent, less than in 2008). The above-mentioned increase in emis-sions in 2001–2007 and their decrease in 2008–2009 require the introduction of changes into the values of expected indicators, particularly concerning volumes of hazardous emissions into the atmosphere from stationary sources in 2010–2015.
It should be noted that air pollution from mobile sources is significantly hazardous to the popula-tion’s health, especially the urban population. In 2008, the inflow of pollutants into the atmos-phere from mobile sources reached 2,700 tonnes, the vast majority of which – 2,420,300 tonnes, or 90.1 percent – are emissions from automo-biles; 66,600 tonnes, or 2.5 percent, are from the railroads; 16,400 tonnes, or 0.6 percent, are from wastewater; 14,400 tonnes, or 0.5 percent, are from aviation transport; and 167,700 tonnes, or 6.3 percent, are from production machinery. Around 1.7 million tonnes (63 percent) of the over-all amount of pollutant emissions are caused by automobiles privately owned by the population.
Gases from automobile engines consist of 100 dif-ferent chemical components, most of which are toxic ones. Major toxic air pollutants released from vehicles and production machinery are: carbon monoxide (74.2 percent, or 1,991.500 tonnes), ni-trogen dioxide (11.6 percent, or 311,100 tonnes), non-light organic methane compounds (11.5 per-cent, or 308.300 tonnes), soot (1.2 percent or 33,300 tonnes) and sulphur dioxide (1.1 per-cent or 30,000 tonnes). The rest of the emissions consist of nitrogen oxide, methane, benzopyrene and ammonia (0.4 percent, or 11,200 tonnes).
MILLENNIUM DEVELOPMENT GOALS. UKRAINE – 201092

From year to year, the number of automobiles on the roads in Ukraine increases and, accordingly, so does the concentration of pollutants. Annual increases in the volume of pollutants into the at-mosphere from mobile sources were observed in 2001–2009. In particular, these emissions from mobile sources increased by 0.52 million tonnes, or by 26.1 percent, in 2009 compared with 2001, reaching 2.51 million tonnes. As a result of the above-mentioned factors, a new indicator needs to be introduced – volume of pollution into the atmosphere from mobile sources.
Groundwater pollution. The issue of ensuring appropriate ecological conditions for water re-sources remains crucial for all regions of the coun-try. Almost all the groundwater and a significant share of underground water resources, especially in regions with large industrial complexes, suffer from human-induced impacts, such as pollution, exhaustion and degradation.
According to data of the Central Geophysical Observatory of the Ministry of Emergencies and Affairs of Population Protection from the Con-sequences of the Chernobyl Catastrophe of Ukraine, the country’s water objects remain pol-luted mostly by compounds of heavy metals, am-monium and nitrite nitrogen and sulphates. Cas-es of high pollution are registered most often in the Western Bug, Danube, Dnister, Southern Bug and Dnieper rivers, the rivers of Azov region and Siversk Donets and also the Kyiv, Kaniv, Kremen-chug, Dniprodzerzhynsk and Dniper reservoirs.
Owing to the low quality of purification of reused waters, the inflow of polluted reused waters into groundwater reservoirs increased almost each year in 2001–2007, and reached 3,854 million cubic metres in 2007, which is 846 cubic metres or 28.13 percent more than in 2001.
At the same time, during the financial and eco-nomic crisis, in 2008–2009 the disposal of pol-luted sewage waters into water reservoirs de-creased. In particular, 2,728 million cubic metres were disposed of in 2008 and 1,766 million cubic metres in 2009, which is 280 million cubic metres and 1,242 million cubic metres less than in 2001, respectively.
Overall, 7,381 million cubic metres (includ-ing 1,766 million cubic metres of polluted re-used waters) of sewage waters were disposed of in 2009, which consisted of 961 million cubic me-tres or 12 percent less than in 2008 (8,342 million cubic metres). The largest contaminators are in-dustrial enterprises, mainly of the power-generat-ing sector, the ferrous metal industry and the coal industry (Zaporizka, Donetska, Luganska and Dni-propetrovska oblasts) and the housing and util-ity industry (mostly cities of Kyiv, Dnipropetrovsk, Lviv, Odesa, Kryvyy Rig and Zaporizhzhia). At the same time, in 2007–2008, a decreasing trend was observed in the disposal of waste, including pol-luted reused waters, explained mainly by the de-crease in industrial production rather than by ef-ficiently implemented environmental measures.
The quality of reused waters does not comply to a great extent with established standards. Further-more, inefficient purification plants are observed in many oblasts. These factors worsen the quality of water resources.
Therefore, a newly introduced indicator – volume of reused waters disposed of into groundwater reservoirs – is one of the major indicators char-acterizing the influence of human activities on the environment, particularly on quality of water resources that are used, inter alia, to satisfy the population’s needs.
Increasing forest cover of the territories. The to-tal land area of forestry and forests in other cat-egories of lands is 10.8 million ha, 9.5 million ha of which is covered with forest vegetation. The level of forest cover over the territory of Ukraine, which is 15.6 percent, did not change in 2001–2008 and remains insufficient. Forest cover differs signifi-cantly in different natural zones of the country. In particular, forest cover of Polissia is 26.8 per-cent (the optimal level is 32 percent); of forest and steppe 13 percent (the optimal level is 18 per-cent); of steppe 5.3 percent (the optimal level is 9 percent); Carpathians 42 percent (the optimal level is 45 percent); and of Crimea 10.4 percent (the optimal level is 19 percent). In terms of area of forest and forest reserves, Ukraine belongs to the group of sparsely forested and forest-deficit countries. For the above reasons, a new indicator, forest cover, must be introduced.
CHAPTER TWO. MILLENNIUM DEVELOPMENT GOALS, ADAPTED FOR UKRAINE 93
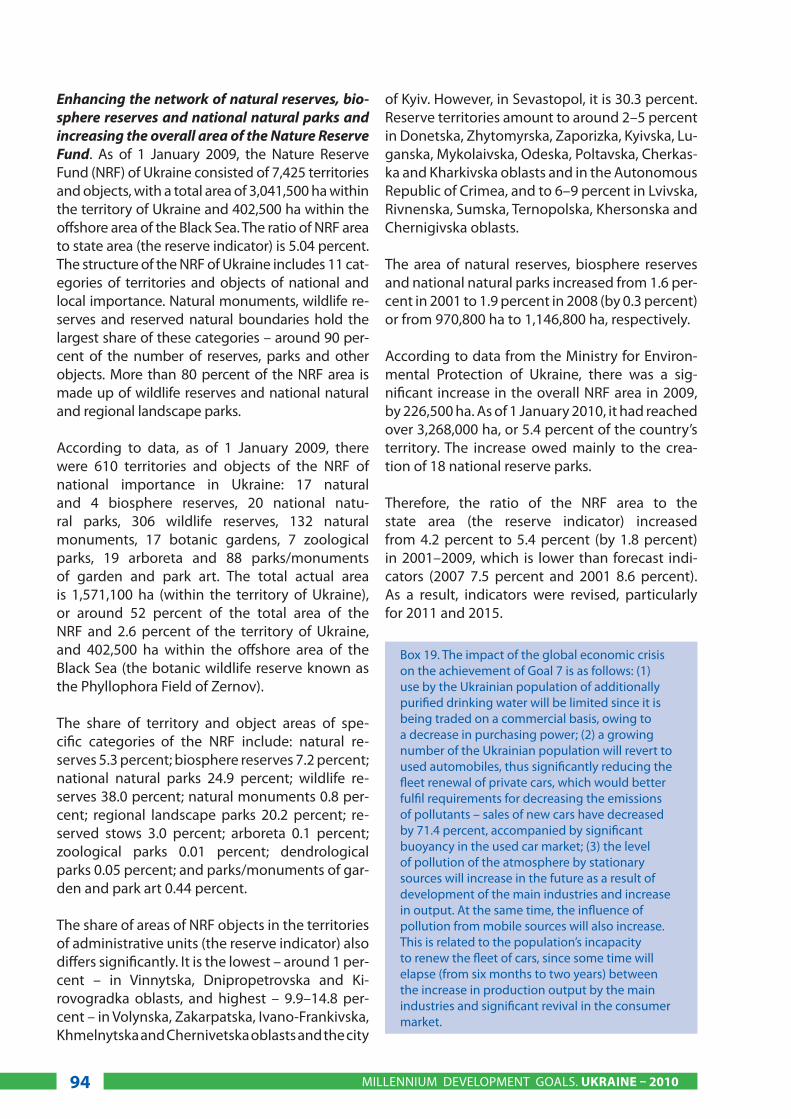
Enhancing the network of natural reserves, bio-sphere reserves and national natural parks and increasing the overall area of the Nature Reserve Fund. As of 1 January 2009, the Nature Reserve Fund (NRF) of Ukraine consisted of 7,425 territories and objects, with a total area of 3,041,500 ha within the territory of Ukraine and 402,500 ha within the offshore area of the Black Sea. The ratio of NRF area to state area (the reserve indicator) is 5.04 percent. The structure of the NRF of Ukraine includes 11 cat-egories of territories and objects of national and local importance. Natural monuments, wildlife re-serves and reserved natural boundaries hold the largest share of these categories – around 90 per-cent of the number of reserves, parks and other objects. More than 80 percent of the NRF area is made up of wildlife reserves and national natural and regional landscape parks.
According to data, as of 1 January 2009, there were 610 territories and objects of the NRF of national importance in Ukraine: 17 natural and 4 biosphere reserves, 20 national natu-ral parks, 306 wildlife reserves, 132 natural monuments, 17 botanic gardens, 7 zoological parks, 19 arboreta and 88 parks/monuments of garden and park art. The total actual area is 1,571,100 ha (within the territory of Ukraine), or around 52 percent of the total area of the NRF and 2.6 percent of the territory of Ukraine, and 402,500 ha within the offshore area of the Black Sea (the botanic wildlife reserve known as the Phyllophora Field of Zernov).
The share of territory and object areas of spe-cific categories of the NRF include: natural re-serves 5.3 percent; biosphere reserves 7.2 percent; national natural parks 24.9 percent; wildlife re-serves 38.0 percent; natural monuments 0.8 per-cent; regional landscape parks 20.2 percent; re-served stows 3.0 percent; arboreta 0.1 percent; zoological parks 0.01 percent; dendrological parks 0.05 percent; and parks/monuments of gar-den and park art 0.44 percent.
The share of areas of NRF objects in the territories of administrative units (the reserve indicator) also differs significantly. It is the lowest – around 1 per-cent – in Vinnytska, Dnipropetrovska and Ki-rovogradka oblasts, and highest – 9.9–14.8 per-cent – in Volynska, Zakarpatska, Ivano-Frankivska, Khmelnytska and Chernivetska oblasts and the city
of Kyiv. However, in Sevastopol, it is 30.3 percent. Reserve territories amount to around 2–5 percent in Donetska, Zhytomyrska, Zaporizka, Kyivska, Lu-ganska, Mykolaivska, Odeska, Poltavska, Cherkas-ka and Kharkivska oblasts and in the Autonomous Republic of Crimea, and to 6–9 percent in Lvivska, Rivnenska, Sumska, Ternopolska, Khersonska and Chernigivska oblasts.
The area of natural reserves, biosphere reserves and national natural parks increased from 1.6 per-cent in 2001 to 1.9 percent in 2008 (by 0.3 percent) or from 970,800 ha to 1,146,800 ha, respectively.
According to data from the Ministry for Environ-mental Protection of Ukraine, there was a sig-nificant increase in the overall NRF area in 2009, by 226,500 ha. As of 1 January 2010, it had reached over 3,268,000 ha, or 5.4 percent of the country’s territory. The increase owed mainly to the crea-tion of 18 national reserve parks.
Therefore, the ratio of the NRF area to the state area (the reserve indicator) increased from 4.2 percent to 5.4 percent (by 1.8 percent) in 2001–2009, which is lower than forecast indi-cators (2007 7.5 percent and 2001 8.6 percent). As a result, indicators were revised, particularly for 2011 and 2015.
Box 19. The impact of the global economic crisis on the achievement of Goal 7 is as follows: (1) use by the Ukrainian population of additionally purified drinking water will be limited since it is being traded on a commercial basis, owing to a decrease in purchasing power; (2) a growing number of the Ukrainian population will revert to used automobiles, thus significantly reducing the fleet renewal of private cars, which would better fulfil requirements for decreasing the emissions of pollutants – sales of new cars have decreased by 71.4 percent, accompanied by significant buoyancy in the used car market; (3) the level of pollution of the atmosphere by stationary sources will increase in the future as a result of development of the main industries and increase in output. At the same time, the influence of pollution from mobile sources will also increase. This is related to the population’s incapacity to renew the fleet of cars, since some time will elapse (from six months to two years) between the increase in production output by the main industries and significant revival in the consumer market.
MILLENNIUM DEVELOPMENT GOALS. UKRAINE – 201094

ІІІ. Challenges
Access to drinking water (centralized supply). Consumption of low quality water has negative impacts on the health of the population and, ul-timately, the possibility of ensuring sustainable development. The problem is not just an unsat-isfactory environmental situation with respect to water resources, and non-compliance with wa-ter sanitary standards in many areas, but also, in general, the lack of centralized water supply sys-tems, mostly in rural areas. Insufficient financing, particularly of construction and reconstruction of central water supply systems, is a serious problem hindering the achievement of Goal 7, which con-cerns access of the population to drinking water.
The main problems are: (1) unsatisfactory envi-ronmental conditions of groundwater and under-ground sources of drinking water; (2) non-compli-ance with sanitary protection principles at many sources and drinking water supply objects; (3) unsatisfactory technical conditions and deterio-ration of water supply and water outflow systems; (4) insufficient level of resources and energy-sav-ing technologies in enterprises providing drink-ing water as well as water outflow; and (5) unsat-isfactory financing of activities envisaged by the State Programme on Drinking Water of Ukraine for 2006–2020 and the Complex Programme on the Provision of Centralized Water Supply Systems to Rural Areas that Utilize Imported Water, during the 2001–2005 Period and Forecast by 2010.
Air pollution. The high level of air pollution re-mains an important challenge for the state. The annual concentration of dust, nitrogen oxides, formaldehyde, sulphur dioxide and other sub-stances exceeds established standards.
The main challenges regarding this unsatisfactory situation are the following: (1) non-fulfilment of measures by polluting enterprises in terms of de-creasing volumes of emissions within set terms; (2) low rates of introduction of modern technologies for emission purification; (3) lack of efficient pu-rification of enterprises’ emissions from extrane-ous gas substances; (4) lack of sanitary protection areas between industrial and residential districts; (5) inadequate financing of measures for decreas-ing emissions into the atmosphere at state and local levels; (6) elimination of green zones within
areas; and (7) continuous increases in the number of automobiles and decreasing renovation rates of the motor vehicle fleet.
Pollution of groundwater reservoirs. Major chal-lenges in implementing actions to stabilize vol-umes of disposal of sewage waters in ground-water reservoirs and to gradually decrease their pollution are: (1) the significant deterioration of sewage systems and purification facilities; (2) non-implementation of measures for improving the quality of sewage water disposal into water reservoirs by contaminating enterprises during set time intervals; (3) non-implementation of the latest technologies for sewage water purifica-tion; and (4) degradation of the ecosystems of the Azov and Black Seas.
Enhancement of forest cover of territories. Plant-ing highly productive forests and sustainable protective forest plantations and increasing the size of the forest area are of special importance for Ukraine. In this regard, the main priority in the forestry sector is the timely and quality replant-ing of forests immediately after felling, increasing their area at the expense of agricultural lands and creating protective forest plantations and affor-estation belts, with the aim of ensuring broad-ened recovery and increased productivity of for-est plantations. According to scientific studies, in order to reach the optimal level of forest cover (around 19–20 percent) it is necessary to increase the area of forests by 2 million ha. This will help preserve the environmental balance in almost all territories of the state and will help increase the resource potential of forests.
The major problems and obstacles in enhancing forest cover in Ukraine are: (1) slow rates of tree planting to create new forests, particularly affor-estation belts; (2) obsolescence of forestry-based and fire-fighting equipment; (3) inadequate in-ventory of forests; (4) inadequate system of for-est management, inventory and monitoring; and (5) insufficient financing of activities of the Pro-gramme on Forests of Ukraine.
Enhancement of the network of natural re-serves, biosphere reserves and national natu-ral parks and increasing the general area of the NRF of Ukraine. Low rates in relation to enhanc-ing and creating new territories and objects of
CHAPTER TWO. MILLENNIUM DEVELOPMENT GOALS, ADAPTED FOR UKRAINE 95

the NRF, as well as losses of biodiversity, are cause for concern.
Major problems include: (1) insufficient develop-ment of the system of territories and objects of the NRF of Ukraine; (2) the financing deficit of ex-isting and newly created objects of the NRF and unsatisfactory financing of activities for forming eco-networks; (3) lack of fixed borders of NRF ob-jects; (4) slow rates of natural recovery (on locality) of coastal lines of water reservoirs; (5) insufficient level of development of the recreational infra-structure of NRF institutions; and (6) the threat of disappearance of many animals and plant species that are registered in the Red Book of Ukraine.
IV. Moving Forward
A wide range of environmental issues to achieve Goal 7 must be resolved, including the popula-tion’s access to drinking water (a centralized wa-ter supply) of improved quality as well as stabiliz-ing environmental pollution.
Furthermore, the focus should be put on improv-ing water resources management, supporting international cooperation on environmental pro-tection and nature conservation issues. A consist-ent environmental policy must include increased accessibility of good quality drinking water for the population, stabilization of the disposal of pollut-ants by 2015 and an increase in the NRF area and forest cover.
With regard to sustainable environment develop-ment, efforts should be aimed at:
(1) Creating systems of centralized water sup-ply in areas that use imported or low qual-ity drinking water; stabilizing the financial and economic situation of water supply and water outflow enterprises; improving standardization and rate-setting systems for drinking water sup-ply, particularly through their compliance with EU requirements; increasing quality of water in centralized water supply sources; completing the ‘passportization’ of water supply sources and tak-ing measures for their protection; improving the difficult situation of and ensuring compliance with regimes of sanitary control of drinking wa-
Box 20. Influence of climate changes on achieving Goal 7.Based on the analytical review of possible influences of forecast climate changes, it can be stated that:
• Each year, Ukraine has increased the amount of CO2-equivalent emissions that it emits into the atmosphere. Greenhouse gas emissions have grown continuously – from 395 million tonnes in 2000 to 443.18 million tonnes in 2006. Without taking into account the effects of the economic crisis with respect to the main contributors to greenhouse gas emissions, that is, the metallurgy and chemical industry, the overall increase in greenhouse gas emissions is 8 million tonnes a year.
• Independently from variations in temperature, climate changes will lead to economic losses for the population, decreases in living standards for the most vulnerable population groups and increases in social tension within society, which will demand additional state efforts to resolve.
• Changes will facilitate technological development, promote scientific research and attract investments. This can spur on the economy’s ‘ecologization’ processes, particularly in relation to gas consumption, making gas reduction joint implementation projects more attractive and ensuring a decrease in gas consumption by up to 1,218 million cubic metres per year.
• Overcoming consequences of climate changes will cost 1–2 percent of GDP annually for the country.
• In order to adequately respond to changes, there is a need to improve the environmental protection system, based on the development of targeted projects and the attraction of non-state financial sources to implement them. This would aim to overcome negative environmental consequences and conduct preventive measures to halt biodiversity loss, including through the degradation of soils and pollution, to improve the quality of groundwater and underground water and to eliminate and mitigate the related impacts of natural and human-induced emergencies, etc.
• Efficiency in implementing changes within the environmental protection system would ensure the needed systemic approach and consistency and coherence with the development of other national protection components.
MILLENNIUM DEVELOPMENT GOALS. UKRAINE – 201096

ter supply sources; improving technological proc-esses of drinking water purification; introducing technologies into industries intend to use marine, mineral underground and mine waters; prevent-ing underground water pollution; enhancing works creating a network of artesian wells aiming at providing the population with drinking water; improving quality control and control of the in-tegrity of the distribution network, which will en-sure a decrease in water losses; standardizing pol-lutant emissions; allocating waste in compliance with the requirements of European Council Di-rective 96/61/EU; establishing the basin principle of water resources management; cleaning river beds and maintaining the necessary sanitary con-dition of rivers; decreasing volumes of untreated reused water disposal; conserving the ecosystem of the Black and Azov Seas; recovering the situa-tion of marine, deltoid, coastal and river ecosys-tems; creating and normalizing water protection zones and coastal protection lines and recovering their natural borders;
(2) Improving systems for treating residential and industrial waste and creating capacities for waste deactivation and processing; implementing Eu-ropean directives and rules of procedure with re-spect to waste treatment; decreasing background concentrations of emissions to the maximum al-lowed level, particularly in carbon oxides, nitro-gen and sulphur, dust, formaldehyde and phenol; developing technological standards for pollutant emissions into the atmosphere, particularly for metallurgical production; decreasing emissions of pollutants from automobiles by introducing ecological norms on the content of pollutants in flue gases in accordance with Euro III and Euro IV standards;
(3) Systemically adjusting taxes for emissions of pollutants depending on their volume and on air pollution, and conducting annual indexation; preventing climate change and ozone layer de-struction; introducing further economic mecha-nisms determined by the Kyoto Protocol to the UNFCCC, particularly a functioning and workable Green Investment Scheme to allow for sale of as-signment amount units, with the proceeds be-ing invested in greenhouse gas emission reduc-
tion projects; developing national, regional and sectoral plans on adaptation to climate change; establishing a data bank on environmentally friendly technologies and methods to decrease the volume of human-induced emissions of con-taminants and greenhouse gases, increasing their absorption; establishing a system of control over human-induced emissions and absorption of greenhouse gases by legal bodies; introducing a system of monitoring and reporting on usage of ozone-depleting substances and ensuring its continuous functioning in accordance with the requirements of the Montreal Protocol;
(4) Decreasing the volume of massive forest fell-ing; increasing forest area through afforestation efforts; improving forest quality and the age com-position of forests; rehabilitating forests that are polluted with radionuclides; and ensuring that state forest inventory and monitoring are prop-erly carried out;
(5) Enhancing the network of the NRF; preserving the plant and animal gene pool within territories and objects of the NRF; ensuring environmentally balanced nature resource management within territories and objects of the NRF; creating ma-rine natural reserve zones and forming a marine eco-network; creating a recreational base within institutions of the NRF; developing ecotourism; halting biodiversity losses and improving natu-ral ecosystems and landscapes; developing and implementing state target programmes on de-veloping natural reserves; strengthening quality control for the water industry, centralized water supply for rural areas and treatment of hazard-ous waste; strengthening the responsibilities of officials and citizens in relation to violations of administrative legislation on natural environmen-tal protection; and eliminating the imbalance be-tween harm caused to natural resources and fine amounts.
Another important step to ensure sustainable environmental development would be the ap-proval of the Strategy of National Environmental Policy and Strategy of Sustainable Development of Ukraine.
CHAPTER TWO. MILLENNIUM DEVELOPMENT GOALS, ADAPTED FOR UKRAINE 97

MILLENNIUM DEVELOPMENT GOALS. UKRAINE – 201098
Annex 1
DEVELOPMENT GOALS FORMULATED bY THE UNITED NATIONS MILLENNIUM DECLARATIONOfficial List of MDG Indicators (effective from 15 January 2008)
Goals and Targets(from the Millennium Declaration) Indicators for monitoring progress
GOAL 1: Eradicate extreme poverty and hunger
Target 1.A: Halve, between 1990 and 2015, the proportion of people whose income is less than one dollar a day
1.1 Proportion of population below $1 (PPP) per day1.2 Poverty gap ratio1.3 Share of poorest quintile in national
consumption
Target 1.B: Achieve full and productive employment and decent work for all, including women and young people
1.4 Growth rate of the GDP per person employed1.5 Employment-to-population ratio1.6 Proportion of employed people living below
$1 (PPP) per day1.7 Proportion of own-account and contributing
family workers in total employment
Target 1.C: Halve, between 1990 and 2015, the proportion of people who suffer from hunger
1.8 Prevalence of underweight children under-five years of age
1.9 Proportion of population below minimum level of dietary energy consumption
GOAL 2: Achieve universal primary education
Target 2.A: Ensure that, by 2015, children everywhere, boys and girls alike, will be able to complete a full course of primary schooling
2.1 Net enrolment ratio in primary education2.2 Proportion of pupils starting grade 1 who reach
last grade of primary2.3 Literacy rate of 15–24 year-olds, women and
men
GOAL 3: Promote gender equality and empower women
Target 3.A: Eliminate gender disparity in primary and secondary education, preferably by 2005, and in all levels of education no later than 2015
3.1 Ratios of girls to boys in primary, secondary and tertiary education
3.2 Share of women in wage employment in the non-agricultural sector
3.3 Proportion of seats held by women in national parliament
GOAL 4: Reduce child mortality
Target 4.A: Reduce by two-thirds, between 1990 and 2015, the under-five mortality rate
4.1 Under-five mortality rate4.2 Infant mortality rate4.3 Proportion of 1 year-old children immunized
against measles
ANNExES

ANNEX 99
GOAL 5: Improve maternal health
Target 5.A: Reduce by three quarters, between 1990 and 2015, the maternal mortality ratio
5.1 Maternal mortality ratio5.2 Proportion of births attended by skilled health
personnel
Target 5.B: Achieve, by 2015, universal access to reproductive health
5.3 Contraceptive prevalence rate5.4 Adolescent birth rate5.5 Antenatal care coverage (at least one visit and at
least four visits)5.6 Unmet need for family planning
GOAL 6: Combat HIV/AIDS, malaria and other diseases
Target 6.A: Have halted by 2015 and begun to reverse the spread of HIV/AIDS
6.1 HIV prevalence among population aged 15–24 years
6.2 Condom use at last high-risk sex6.3 Proportion of population aged 15–24 years with
comprehensive correct knowledge of HIV/AIDS6.4 Ratio of school attendance of orphans to school
attendance of non-orphans aged 10–14 years
Target 6.B: Achieve, by 2010, universal access to treatment for HIV/AIDS for all those who need it
6.5 Proportion of population with advanced HIV in-fection with access to antiretroviral drugs
Target 6.C: Have halted by 2015 and begun to reverse the incidence of malaria and other major diseases
6.6 Incidence and death rates associated with malaria
6.7 Proportion of children under 5 sleeping under insecticide-treated bednets
6.8 Proportion of children under 5 with fever who are treated with appropriate anti-malarial drugs
6.9 Incidence, prevalence and death rates associated with tuberculosis
6.10 Proportion of tuberculosis cases detected and cured under directly observed treatment short course
GOAL 7: Ensure environmental sustainability
Target 7.A: Integrate the principles of sustainable development into country policies and programmes and reverse the loss of environmental resources
Target 7.B: Reduce biodiversity loss, achieving, by 2010, a significant reduction in the rate of loss
7.1 Proportion of land area covered by forest7.2 CO2 emissions, total, per capita and per
$1 GDP (PPP)7.3 Consumption of ozone-depleting substances7.4 Proportion of fish stocks within safe biological
limits7.5 Proportion of total water resources used7.6 Proportion of terrestrial and marine areas
protected7.7 Proportion of species threatened with extinction
Target 7.C: Halve, by 2015, the proportion of people without sustainable access to safe drinking water and basic sanitation
7.8 Proportion of population using an improved drinking water source
7.9 Proportion of population using an improved sanitation facility
Target 7.D: By 2020, to have achieved a significant improvement in the lives of at least 100 million slum dwellers
7.10 Proportion of urban population living in slums
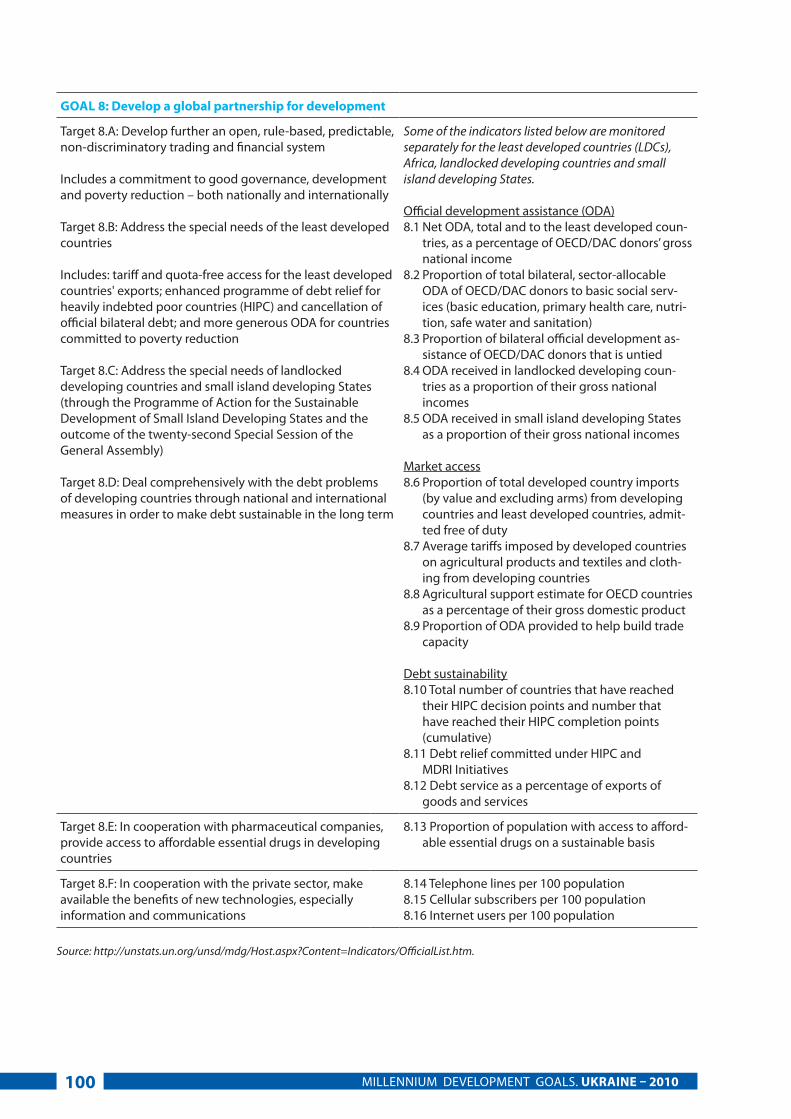
MILLENNIUM DEVELOPMENT GOALS. UKRAINE – 2010100
GOAL 8: Develop a global partnership for development
Target 8.A: Develop further an open, rule-based, predictable, non-discriminatory trading and financial system
Includes a commitment to good governance, development and poverty reduction – both nationally and internationally
Target 8.B: Address the special needs of the least developed countries
Includes: tariff and quota-free access for the least developed countries' exports; enhanced programme of debt relief for heavily indebted poor countries (HIPC) and cancellation of official bilateral debt; and more generous ODA for countries committed to poverty reduction
Target 8.C: Address the special needs of landlocked developing countries and small island developing States (through the Programme of Action for the Sustainable Development of Small Island Developing States and the outcome of the twenty-second Special Session of the General Assembly)
Target 8.D: Deal comprehensively with the debt problems of developing countries through national and international measures in order to make debt sustainable in the long term
Some of the indicators listed below are monitored separately for the least developed countries (LDCs), Africa, landlocked developing countries and small island developing States.
Official development assistance (ODA)8.1 Net ODA, total and to the least developed coun-
tries, as a percentage of OECD/DAC donors’ gross national income
8.2 Proportion of total bilateral, sector-allocable ODA of OECD/DAC donors to basic social serv-ices (basic education, primary health care, nutri-tion, safe water and sanitation)
8.3 Proportion of bilateral official development as-sistance of OECD/DAC donors that is untied
8.4 ODA received in landlocked developing coun-tries as a proportion of their gross national incomes
8.5 ODA received in small island developing States as a proportion of their gross national incomes
Market access8.6 Proportion of total developed country imports
(by value and excluding arms) from developing countries and least developed countries, admit-ted free of duty
8.7 Average tariffs imposed by developed countries on agricultural products and textiles and cloth-ing from developing countries
8.8 Agricultural support estimate for OECD countries as a percentage of their gross domestic product
8.9 Proportion of ODA provided to help build trade capacity
Debt sustainability8.10 Total number of countries that have reached
their HIPC decision points and number that have reached their HIPC completion points (cumulative)
8.11 Debt relief committed under HIPC and MDRI Initiatives
8.12 Debt service as a percentage of exports of goods and services
Target 8.E: In cooperation with pharmaceutical companies, provide access to affordable essential drugs in developing countries
8.13 Proportion of population with access to afford-able essential drugs on a sustainable basis
Target 8.F: In cooperation with the private sector, make available the benefits of new technologies, especially information and communications
8.14 Telephone lines per 100 population8.15 Cellular subscribers per 100 population8.16 Internet users per 100 population
Source: http://unstats.un.org/unsd/mdg/Host.aspx?Content=Indicators/OfficialList.htm.
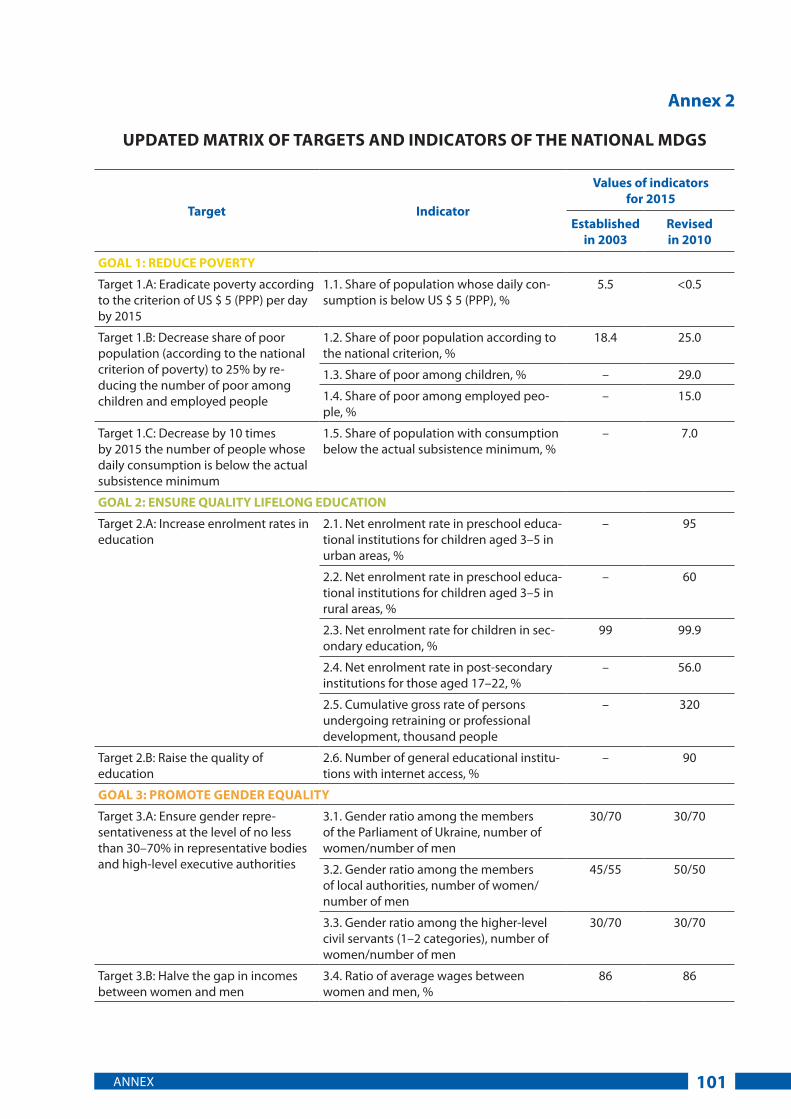
ANNEX 101
Annex 2
UPDATED MATRIx OF TARGETS AND INDICATORS OF THE NATIONAL MDGS
Target Indicator
Values of indicators for 2015
Established in 2003
Revised in 2010
GOAL 1: REDUCE POVERTY
Target 1.A: Eradicate poverty according to the criterion of US $ 5 (PPP) per day by 2015
1.1. Share of population whose daily con-sumption is below US $ 5 (PPP), %
5.5 <0.5
Target 1.B: Decrease share of poor population (according to the national criterion of poverty) to 25% by re-ducing the number of poor among children and employed people
1.2. Share of poor population according to the national criterion, %
18.4 25.0
1.3. Share of poor among children, % – 29.0
1.4. Share of poor among employed peo-ple, %
– 15.0
Target 1.C: Decrease by 10 times by 2015 the number of people whose daily consumption is below the actual subsistence minimum
1.5. Share of population with consumption below the actual subsistence minimum, %
– 7.0
GOAL 2: ENSURE QUALITY LIFELONG EDUCATION
Target 2.A: Increase enrolment rates in education
2.1. Net enrolment rate in preschool educa-tional institutions for children aged 3–5 in urban areas, %
– 95
2.2. Net enrolment rate in preschool educa-tional institutions for children aged 3–5 in rural areas, %
– 60
2.3. Net enrolment rate for children in sec-ondary education, %
99 99.9
2.4. Net enrolment rate in post-secondary institutions for those aged 17–22, %
– 56.0
2.5. Cumulative gross rate of persons undergoing retraining or professional development, thousand people
– 320
Target 2.B: Raise the quality of education
2.6. Number of general educational institu-tions with internet access, %
– 90
GOAL 3: PROMOTE GENDER EQUALITY
Target 3.A: Ensure gender repre-sentativeness at the level of no less than 30–70% in representative bodies and high-level executive authorities
3.1. Gender ratio among the members of the Parliament of Ukraine, number of women/number of men
30/70 30/70
3.2. Gender ratio among the members of local authorities, number of women/number of men
45/55 50/50
3.3. Gender ratio among the higher-level civil servants (1–2 categories), number of women/number of men
30/70 30/70
Target 3.B: Halve the gap in incomes between women and men
3.4. Ratio of average wages between women and men, %
86 86
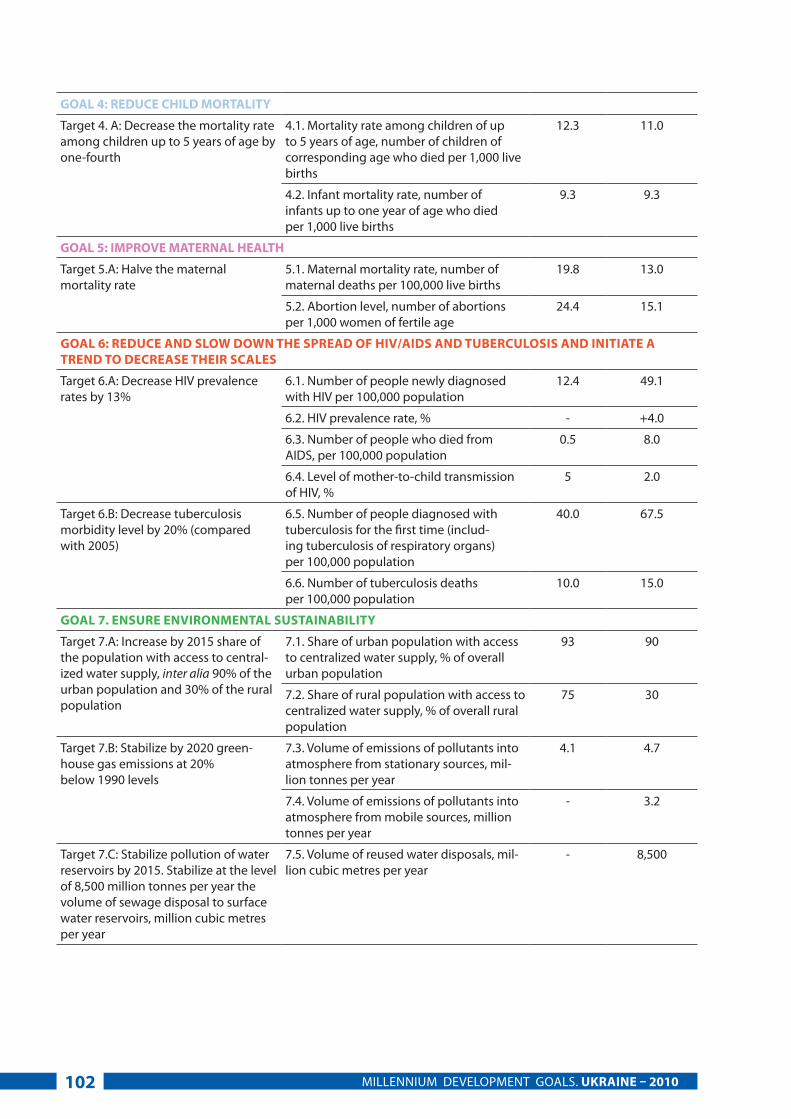
MILLENNIUM DEVELOPMENT GOALS. UKRAINE – 2010102
GOAL 4: REDUCE CHILD MORTALITY
Target 4. A: Decrease the mortality rate among children up to 5 years of age by one-fourth
4.1. Mortality rate among children of up to 5 years of age, number of children of corresponding age who died per 1,000 live births
12.3 11.0
4.2. Infant mortality rate, number of infants up to one year of age who died per 1,000 live births
9.3 9.3
GOAL 5: IMPROVE MATERNAL HEALTH
Target 5.A: Halve the maternal mortality rate
5.1. Maternal mortality rate, number of maternal deaths per 100,000 live births
19.8 13.0
5.2. Abortion level, number of abortions per 1,000 women of fertile age
24.4 15.1
GOAL 6: REDUCE AND SLOw DOwN THE SPREAD OF HIV/AIDS AND TUbERCULOSIS AND INITIATE A TREND TO DECREASE THEIR SCALES
Target 6.A: Decrease HIV prevalence rates by 13%
6.1. Number of people newly diagnosed with HIV per 100,000 population
12.4 49.1
6.2. HIV prevalence rate, % - +4.0
6.3. Number of people who died from AIDS, per 100,000 population
0.5 8.0
6.4. Level of mother-to-child transmission of HIV, %
5 2.0
Target 6.B: Decrease tuberculosis morbidity level by 20% (compared with 2005)
6.5. Number of people diagnosed with tuberculosis for the first time (includ-ing tuberculosis of respiratory organs) per 100,000 population
40.0 67.5
6.6. Number of tuberculosis deaths per 100,000 population
10.0 15.0
GOAL 7. ENSURE ENVIRONMENTAL SUSTAINAbILITY
Target 7.A: Increase by 2015 share of the population with access to central-ized water supply, inter alia 90% of the urban population and 30% of the rural population
7.1. Share of urban population with access to centralized water supply, % of overall urban population
93 90
7.2. Share of rural population with access to centralized water supply, % of overall rural population
75 30
Target 7.B: Stabilize by 2020 green-house gas emissions at 20% below 1990 levels
7.3. Volume of emissions of pollutants into atmosphere from stationary sources, mil-lion tonnes per year
4.1 4.7
7.4. Volume of emissions of pollutants into atmosphere from mobile sources, million tonnes per year
- 3.2
Target 7.C: Stabilize pollution of water reservoirs by 2015. Stabilize at the level of 8,500 million tonnes per year the volume of sewage disposal to surface water reservoirs, million cubic metres per year
7.5. Volume of reused water disposals, mil-lion cubic metres per year
- 8,500
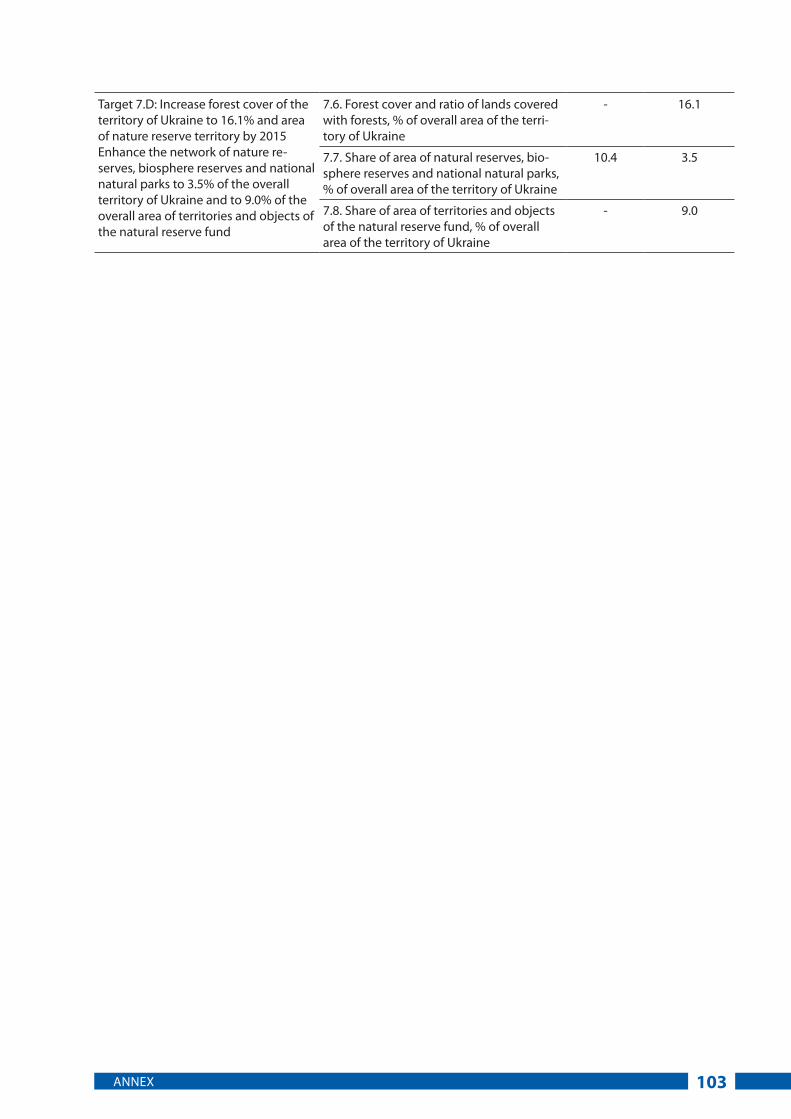
ANNEX 103
Target 7.D: Increase forest cover of the territory of Ukraine to 16.1% and area of nature reserve territory by 2015Enhance the network of nature re-serves, biosphere reserves and national natural parks to 3.5% of the overall territory of Ukraine and to 9.0% of the overall area of territories and objects of the natural reserve fund
7.6. Forest cover and ratio of lands covered with forests, % of overall area of the terri-tory of Ukraine
- 16.1
7.7. Share of area of natural reserves, bio-sphere reserves and national natural parks, % of overall area of the territory of Ukraine
10.4 3.5
7.8. Share of area of territories and objects of the natural reserve fund, % of overall area of the territory of Ukraine
- 9.0
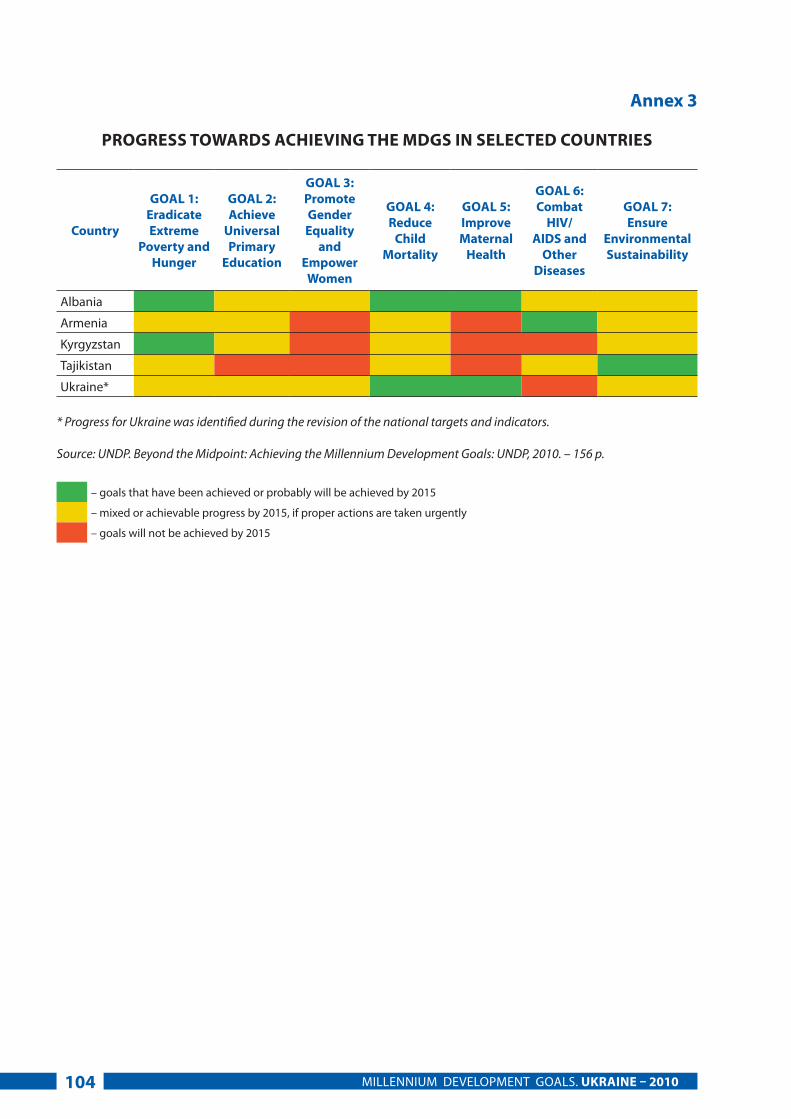
MILLENNIUM DEVELOPMENT GOALS. UKRAINE – 2010104
Annex 3
PROGRESS TOwARDS ACHIEVING THE MDGS IN SELECTED COUNTRIES
Country
GOAL 1:Eradicate Extreme
Poverty and Hunger
GOAL 2: Achieve
Universal Primary
Education
GOAL 3:Promote GenderEquality
and Empower
women
GOAL 4:Reduce
ChildMortality
GOAL 5:Improve Maternal
Health
GOAL 6:Combat
HIV/AIDS and
Other Diseases
GOAL 7:Ensure
Environmental Sustainability
Albania
Armenia
Kyrgyzstan
Tajikistan
Ukraine*
* Progress for Ukraine was identified during the revision of the national targets and indicators.
Source: UNDP. Beyond the Midpoint: Achieving the Millennium Development Goals: UNDP, 2010. – 156 p.
– goals that have been achieved or probably will be achieved by 2015
– mixed or achievable progress by 2015, if proper actions are taken urgently
– goals will not be achieved by 2015

BIBLIOGRAPHY 105
1. Academy of Pedagogical Sciences of Ukraine. White Book of the National Education. Part І. Kyiv: Academy of Pedagogical Sciences of Ukraine, 2009. – 185 p.
2. T. Andreeva. Tobacco in Ukraine: National Survey of Knowledge, Attitude, and Behaviour. Kyiv: International Centre for Perspective Re-search, 2005. – 94 p.
3. T. Andreeva, E. Gilpin, T. Salyuk, K. Krasovsky and A. Dovbakh. Smoking and Its Consequences for Pregnant Women in Ukraine. Washington: World Bank, 2005. – 21 p.
4. Cabinet of Ministers of Ukraine. Resolution on the Complex Programme on Provision of Central-ized Water Supply Systems to Rural Areas which Utilize Imported Water, during the 2001–2005 Pe-riod and Forecast by 2010, 23 November 2000. No. 1735.
5. Cabinet of Ministers of Ukraine. Regulation on the National Action Plan on Implementation of Provisions of the Kyoto Protocol to the United Nations Framework Convention on Climate Change, 18 August 2005. No. 346-r.
6. Cabinet of Ministers of Ukraine. Resolution on Enforcement of Article 281 of the Civil Code of Ukraine, 15 February 2006. No. 144.
7. Cabinet of Ministers of Ukraine. Resolution on Approval of the State Programme on Child Oncol-ogy for 2006–2010, 19 July 2006. No. 983.
8. Cabinet of Ministers of Ukraine. Resolution on Adoption of the State Programme on Re-productive Health of the Nation for the Period by 2015, 27 December 2006. No. 1849.
9. Cabinet of Ministers of Ukraine. Resolution on Adoption of the State Programme on Provision of Support to Families for the Period by 2010, 19 Feb-ruary 2007. No. 244.
10. Cabinet of Ministers of Ukraine. Resolution on Adoption of the State Target Social Programme on Provision of Centralized Water Supply Systems to Rural Areas which Utilize Imported Water, for the Period by 2010, 27 August 2008. No. 741.
11. Cabinet of Ministers of Ukraine. Regulation on Amendments to the National Action Plan on the Realization of Provisions of the Kyoto Protocol to the United Nations Framework Convention on Cli-mate Change, 5 March 2009. No. 272-r.
12. Cabinet of Ministers of Ukraine. Resolution on Adoption of the State Target Programme on Forest of Ukraine for 2010–2015, 16 September 2009. No. 977.
13. Cabinet of Ministers of Ukraine. Report on Situ-ation and Development of Informatization in Ukraine in 2009, 8 November 2009.
14. Council of the European Union. Directive on the Integrated Pollution Prevention and Control (IPPC), 24 September 1996. 96/91/EU.
15. European Union (EU). Joint Declaration of the European Ministers of Educations the European Dimension in the Sphere of Higher Education. Bo-logna: EU, 19 June 1999.
16. European Union (EU). Key Data on Education in Europe 2009: Information on Educational Sys-tems and Policies in Europe. Brussels: Education, Audiovisual and Culture Executive Agency (EA-CEA), 16 July 2009.
17. Institute for Demography and Social Studies, Ukrainian Centre of Social Reforms. Marriage, Family, and Child Bearing Attitudes in Ukraine. Kyiv: ADEF, 2008. – 256 p.
18. Intergovernmental Panel on Climate Change (IPCC). Climate Change 2007: The Physical Sci-ence Basis. Contribution of Working Group I, II and III to the Fourth Assessment Report of the Intergovernmental Panel on Climate Change. Ge-neva: IPCC, 2007. – 104 p.
19. International Association for the Evaluation of Educational Achievement (IEA). International Trends in International Mathematics and Sci-ence – TIMMS, 2007.
20. Ministry of Economy of Ukraine. Millennium Development Goals. Ukraine. Kyiv: Ministry of Economy of Ukraine, 2003. – 26 p.
21. Ministry of Education and Science of Ukraine. Or-der on Approval of the Programme for the Imple-mentation of the Bologna Declaration in Higher Education and Science of Ukraine. Kyiv: Ministry of Education and Science of Ukraine, 23 Janu-ary 2004. No 49,
22. Ministry of Education and Science of Ukraine. Order on Adoption of Exemplary Regulation on Educational District. Kyiv: Ministry of Education and Science of Ukraine, 5 April 2006. No. 267.
23. Ministry of Education and Science of Ukraine. Order on Action Plan on Ensuring Quality of
bIbLIOGRAPHY
MILLENNIUM DEVELOPMENT GOALS. UKRAINE – 2010106
Higher Education in Ukraine and Its Integration into the European and World Educational Com-munity, for the Period by 2010. Kyiv: Ministry of Education and Science of Ukraine,13 July 2007. No. 612.
24. Ministry of Health of Ukraine. Abortions and Contraception in Ukraine. Strategic Assessment of Policy, Programmes, and Studies. Kyiv: Minis-try of Health of Ukraine, 2008. – 88 p.
25. Ministry of Education and Science of Ukraine. Order on Establishment of the European Credit and Transfer System in Higher Educational Institu-tions of Ukraine. Kyiv: Ministry of Education and Science of Ukraine, 16 October 2009. No. 943.
26. Ministry of Health of Ukraine. Order on Meas-ures on the Implementation of Provisions of the Bologna Declaration in the System of Training and Post-Graduate Education of Junior Medical and Pharmaceutical Specialists and Bachelors of Medicine. Kyiv: Ministry of Education and Sci-ence of Ukraine, 11 August 2004. No. 409.
27. Ministry of Health of Ukraine. Order on Adoption of the List of National Monitoring and Evalua-tion Indicators for Efficiency of Measures Ensur-ing Control over the Situation with HIV/AIDS Epi-demics and of Instruction concerning Estimation of these Indicators. Kyiv: Ministry of Health of Ukraine, 17 May 2006. No. 280.
28. Ministry of Health of Ukraine. Order on Adop-tion of the Industry Programme on Provision of Support to Breast Feeding of Children in Ukraine for 2006–2010. Kyiv: Ministry of Health of Ukraine, 31 July 2006. No. 529/49.
29. Ministry of Health of Ukraine. Order on Approval of Methodological Guidelines on Encoding of Morbidity and Mortality according to the Inter-national Statistical Classification of Diseases and Related Health Problems, Tenth Revision. Kyiv: Ministry of Health of Ukraine, 29 August 2008. No. 503.
30. Ministry of Health of Ukraine. Tuberculosis in Ukraine: Analytical and Statistical Hand-book, 1998 – 2008. Kyiv: Ministry of Health of Ukraine, Centre for Medical Statistics of the Ministry of Health of Ukraine, 2009. – 90 p.
31. Ministry of Health of Ukraine. Obstetric and Gynecological Assistance in Ukraine: Statisti-cal and Analytical Handbook in 2006–2008. Kyiv: Ministry of Health of Ukraine, Centre for Medical Statistics of the Ministry of Health of Ukraine, 2009. – 238 p.
32. Parliament of Ukraine. Resolution on Ratification of the United Nations Convention on the Rights of the Child, 27 February 1991. No. 789-XII.
33. Parliament of Ukraine. Law on Educa-tion, 23 May 1991. No. 1060-XII.
34. Parliament of Ukraine. Law on Prevention In-cidence with Acquired Immune Deficiency Syn-drome (AIDS) and Social Protection of Popula-tion, 12 December 1991. No. 1972-XII.
35. Parliament of Ukraine. The Constitution of Ukraine, 28 June 1996. No. 254k/96-VR.
36. Parliament of Ukraine. Law on Ratification of the United Nations Framework Convention on Cli-mate Change, 29 October 1996. No. 435/96-VR.
37. Parliament of Ukraine. Law on Protection of Childhood, 26 April 2001. No. 2402-III.
38. Parliament of Ukraine. Law on Higher Educa-tion, 17 January 2002. No. 2984-III.
39. Parliament of Ukraine. Law on the Red Book of Ukraine, 7 February 2002. No. 3055-III.
40. Parliament of Ukraine. Civil Code of Ukraine, 16 January 2003. No. 435-IV.
41. Parliament of Ukraine. Law on Ratification of Kyoto Protocol to the United Nations Frame-work Convention on Climate Change, 4 Febru-ary 2004. No. 1430-IV.
42. Parliament of Ukraine. Law on the State Programme on Drinking Water of Ukraine for 2006-2020, 3 March 2005. No. 2455-IV.
43. Parliament of Ukraine. Law on Adoption of the State Programme of Counteraction to Tuberculo-sis in 2007-2011, 8 February 2007. No. 648-V.
44. Parliament of Ukraine. Law on Adoption of the State Programme of Ensuring HIV infection Pre-vention, Treatment, Care, and Support for HIV-infected and Diseased with AIDS for the period of 2009–2013, 19 February 2009. No. 1026-VI.
45. Parliament of Ukraine. Law on the State Pro-gramme on National Action Plan on Realization of the United Nations Convention of Rights of the Child by 2016, 5 March 2009. No. 1065-VI.
46. Y. Saienko. Gender Stereotypes and Society’s Attitude towards Gender Problems in the Ukrain-ian Society. Кyiv: UNDP, Center for Social Ex-pertise of the Institute of Sociology of NAS of Ukraine, 2007. – 70 p.
47. D. Sethi. Injuries and Violence in Europe. Why They Matter and What Can Be Done? Copenha-gen: WHO, 2006. – 23 p.
48. State Statistics Committee of Ukraine. Statistical Yearbook 1999. Kyiv: State Statistics Committee of Ukraine, 2000.
49. State Statistics Committee of Ukraine. Statistical Yearbook 2000. Kyiv: State Statistics Committee of Ukraine, 2001.
50. State Statistics Committee of Ukraine. Statisti-cal Yearbooks 2000: Expenditures and Resources
BIBLIOGRAPHY 107
of Households of Ukraine (Household Budget Sur-vey Data). Kyiv: State Statistics Committee of Ukraine, 2001.
51. State Statistics Committee of Ukraine. Statistical Yearbook 2001. Kyiv: State Statistics Committee of Ukraine, 2002.
52. State Statistics Committee of Ukraine. Statisti-cal Yearbooks 2001: Expenditures and Resources of Households of Ukraine (Household Budget Sur-vey Data). Kyiv: State Statistics Committee of Ukraine, 2002.
53. State Statistics Committee of Ukraine. Statistical Yearbook 2002. Kyiv: State Statistics Committee of Ukraine, 2003.
54. State Statistics Committee of Ukraine. Statisti-cal Yearbooks 2002: Expenditures and Resources of Households of Ukraine (Household Budget Sur-vey Data). Kyiv: State Statistics Committee of Ukraine, 2003.
55. State Statistics Committee of Ukraine. Statistical Yearbook 2003. Kyiv: State Statistics Committee of Ukraine, 2004.
56. State Statistics Committee of Ukraine. Statisti-cal Yearbooks 2003: Expenditures and Resources of Households of Ukraine (Household Budget Sur-vey Data). Kyiv: State Statistics Committee of Ukraine, 2004.
57. State Statistics Committee of Ukraine. Statistical Yearbook 2004. Kyiv: State Statistics Committee of Ukraine, 2005.
58. State Statistics Committee of Ukraine. Statisti-cal Yearbooks 2004: Expenditures and Resources of Households of Ukraine (Household Budget Sur-vey Data). Kyiv: State Statistics Committee of Ukraine, 2005.
59. State Statistics Committee of Ukraine. Statistical Yearbook 2005. Kyiv: State Statistics Committee of Ukraine, 2006.
60. State Statistics Committee of Ukraine. Statisti-cal Yearbooks 2005: Expenditures and Resources of Households of Ukraine (Household Budget Sur-vey Data). Kyiv: State Statistics Committee of Ukraine, 2006.
61. State Statistics Committee of Ukraine. Statistical Yearbook 2006. Kyiv: State Statistics Committee of Ukraine, 2007.
62. State Statistics Committee of Ukraine. Statisti-cal Yearbooks 2006: Expenditures and Resources of Households of Ukraine (Household Budget Sur-vey Data). Kyiv: State Statistics Committee of Ukraine, 2007.
63. State Statistics Committee of Ukraine. Statistical Yearbook 2007. Kyiv: State Statistics Committee of Ukraine, 2008.
64. State Statistics Committee of Ukraine. Statisti-cal Yearbooks 2007: Expenditures and Resources of Households of Ukraine (Household Budget Sur-vey Data). Kyiv: State Statistics Committee of Ukraine, 2008.
65. State Statistics Committee of Ukraine. Statistical Yearbook 2007: Self-Assessment by Households of Ukraine of Their Profit Level (Household Budget Survey Data). Kyiv: State Statistics Committee of Ukraine, 2008.
66. State Statistics Committee of Ukraine. Statistical Yearbook 2008. Kyiv: State Statistics Committee of Ukraine, 2009.
67. State Statistics Committee of Ukraine. Statisti-cal Yearbooks 2008: Expenditures and Resources of Households of Ukraine (Household Budget Sur-vey Data). Kyiv: State Statistics Committee of Ukraine, 2009.
68. State Statistics Committee of Ukraine. Statistical Yearbook 2009: Self-Assessment by Households of Ukraine of Their Profit Level (Household Budget Survey Data). Kyiv: State Statistics Committee of Ukraine, 2010.
69. The President of Ukraine. Decree on Strat-egy for Overcoming Poverty, 15 August 2001. No. 637/2001.
70. United Nations (UN). The Millennium De-velopment Goals Report 2009. New York: UN, 2009. – 56 p.
71. United Nations Children’s Fund (UNICEF). Alter-native Report on Ukraine’s Implementation of the United Nations Convention on the Rights of the Child 2002–2008. Kyiv: UNICEF, 2009. – 90 p.
72. United Nations Development Pro-gramme (UNDP). Human Development Re-port 1993: People’s Participation. New York: UNDP, 1993. – 267 p.
73. United Nations Development Programme (UNDP). Human Development Report 1994: New Dimensions of Human Security. New York: UNDP, 1994. – 289 p.
74. United Nations Development Programme (UNDP). Human Development Report 1995: Gender and Human Development. New York: UNDP, 1995. – 301 p.
75. United Nations Development Programme (UNDP). Human Development Report 1996: Economic Growth and Human Development. New York: UNDP, 1996. – 287 p.
76. United Nations Development Programme (UNDP). Human Development Report 1997: Hu-man Development to Eradicate Poverty. New York: UNDP, 1997. – 254 p.
MILLENNIUM DEVELOPMENT GOALS. UKRAINE – 2010108
77. United Nations Development Programme (UNDP). Human Development Report 1998: Con-sumption for Human Development. New York: UNDP, 1998. – 226 p.
78. United Nations Development Programme (UNDP). Human Development Report 1999: Globalization with a Human Face. New York: UNDP, 1999. – 172 p.
79. United Nations Development Programme (UNDP). Human Development Report 2000: Hu-man Rights and Human Development. New York: UNDP, 2000. – 309 p.
80. United Nations Development Programme (UNDP). Human Development Report 2001: Mak-ing New Technologies Work for Human Develop-ment. New York: UNDP, 2001. – 274 p.
81. United Nations Development Programme (UNDP). Human Development Report 2002: Deepening in a Fragmented World. New York: UNDP, 2002. – 292 p.
82. United Nations Development Programme (UNDP). Human Development Report 2003: Mil-lennium Development Goals: A Compact among Nations to End Human Poverty. New York: UNDP, 2003. – 368 p.
83. United Nations Development Programme (UNDP). Human Development Report 2004: Cul-tural Liberty in Today’s Diverse World. New York: UNDP, 2004. – 299 p.
84. United Nations Development Programme (UNDP). Human Development Report 2005: Inter-national Cooperation at a Crossroads: Aid, Trade and Security in an Unequal World. New York: UNDP, 2005. – 388 p.
85. United Nations Development Programme (UNDP). Human Development Report 2006: Be-yond Scarcity: Power, Poverty and the Global Wa-ter Crisis. New York: UNDP, 2006. – 440 p.
86. United Nations Development Programme (UNDP). Human Development Report 2007/2008: Fighting Climate Change: Human Solidarity in a Divided World. New York: UNDP, 2008. – 399 p.
87. United Nations Development Programme (UNDP). Human Development Report 2009: Over-coming Barriers: Human Mobility and Develop-ment. New York: UNDP, 2009. – 229 p.
88. United Nations Development Programme (UNDP). Survey on Climate Change Perceptions in Ukraine. Kyiv: UNDP, 2009. – 56 p.
89. United Nations Development Programme (UNDP). Beyond the Midpoint: Achiev-ing the Millennium Development Goals: UNDP, 2010. – 175 p.
90. World Health Organization. World Report on Child Injury Prevention. Geneva: WHO, 2008. – 39 p.
91. Y. Zakharova, I. Rapp, V. Yavorsky / Ukrain-ian Helsinki Human Rights Union. Human Rights in Ukraine – 2007. Kharkiv: Prava Ludy-ny, 2008. – 304 p.