Milk Cows and Production - Cornell University...Milk Cows and Production Final Estimates 2008-2012...
33
United States Department of Agriculture National Agricultural Statistics Service Statistical Bulletin Number 1036 Milk Cows and Production Final Estimates 2008-2012 September 2014
Transcript of Milk Cows and Production - Cornell University...Milk Cows and Production Final Estimates 2008-2012...

United States Department of Agriculture National Agricultural Statistics Service
Statistical Bulletin Number 1036
Milk Cows and Production Final Estimates 2008-2012 September 2014


Milk Cows and Production Final Estimates 2008-2012 (September 2014) 3 USDA, National Agricultural Statistics Service
Contents
Summary .................................................................................................................................................................... 5
Milk Cows and Production – United States: 2008-2012 ............................................................................................ 6
Milk Cows – States and United States: 2008-2012 .................................................................................................... 7
Milk Production per Cow – States and United States: 2008-2012 ............................................................................. 8
Milk Production – States and United States: 2008-2012 ........................................................................................... 9
Milk Cows, Milk Production per Cow, and Milk Production by Month – 23 State
Total: 2008-2012 ...................................................................................................................................................... 10
Milk Cows by Month – 23 Selected States, 23 State Total, and United States: 2008.............................................. 11
Milk Cows by Month – 23 Selected States, 23 State Total, and United States: 2009.............................................. 12
Milk Cows by Month – 23 Selected States, 23 State Total and United States: 2010............................................... 13
Milk Cows by Month – 23 Selected States, 23 State Total, and United States: 2011.............................................. 14
Milk Cows by Month – 23 Selected States, 23 State Total, and United States: 2012.............................................. 15
Milk Produced per Cow by Month – 23 Selected States, 23 State Total, and United States: 2008 ......................... 16
Milk Produced per Cow by Month – 23 Selected States, 23 State Total, and United States: 2009 ......................... 17
Milk Produced per Cow by Month – 23 Selected States, 23 State Total, and United States: 2010 ......................... 18
Milk Produced per Cow by Month – 23 Selected States, 23 State Total, and United States: 2011 ......................... 19
Milk Produced per Cow by Month – 23 Selected States, 23 State Total, and United States: 2012 ......................... 20
Milk Production by Month – 23 Selected States, 23 State Total, and United States: 2008 ..................................... 21
Milk Production by Month – 23 Selected States, 23 State Total, and United States: 2009 ..................................... 22
Milk Production by Month – 23 Selected States, 23 State Total, and United States: 2010 ..................................... 23
Milk Production by Month – 23 Selected States, 23 State Total, and United States: 2011 ..................................... 24
Milk Production by Month – 23 Selected States, 23 State Total, and United States: 2012 ..................................... 25
Milk Cows and Production by Quarter – States and United States: 2008................................................................ 26
Milk Cows and Production by Quarter – States and United States: 2009................................................................ 27
Milk Cows and Production by Quarter – States and United States: 2010................................................................ 28
Milk Cows and Production by Quarter – States and United States: 2011................................................................ 29
Milk Cows and Production by Quarter – States and United States: 2012................................................................ 30

4 Milk Cows and Production Final Estimates 2008-2012 (September 2014) USDA, National Agricultural Statistics Service
Information Contacts ................................................................................................................................................ 31
Statistical Bulletin Publication Schedule and other ASB Services .......................................................................... 33

Milk Cows and Production Final Estimates 2008-2012 (September 2014) 5 USDA, National Agricultural Statistics Service
Summary
Milk: Final Estimates by State, 2008-2012, U.S. Department of Agriculture, Agricultural Statistics Board, National
Agricultural Statistics Service, Statistical Bulletin No. 1036.
Introduction: This bulletin presents final estimates, including revisions made by the Agricultural Statistics Board (ASB),
for the production years 2008 through 2012. Number of milk cows, production per cow, and total production were
published during calendar years 2008-2012 in periodic ASB reports. Disposition and Income data will be published in the
Milk Disposition and Income - Final Estimates 2008-2012 Statistical Bulletin No. 1041.
Procedures: Revisions were made after a thorough review of the original survey data and all additional data now
available, including the 2012 Census of Agriculture. Other data series considered included Federal Milk Market Orders,
State Departments of Agriculture, receipts of milk by plants and dealers, checkoff receipts, and any other available
administrative information. The 2008-2012 estimates shown herein are considered final and will not be revised again.
At the National level, revisions to estimates of milk production and annual number of milk cows were less than one
percent.
Annual total milk production Annual number of milk cows
Year Previous Final Change Year Previous Final Change
(million
pounds)
(million
pounds)
(percent) (1,000 head) (1,000 head) (percent)
2008 189,982 189,978 - 2008 9,315 9,314 -
2009 189,334 189,202 -0.1 2009 9,203 9,202 -
2010 192,848 192,877 - 2010 9,119 9,123 -
2011 196,164 196,255 - 2011 9,194 9,199 0.1
2012 200,537 200,642 0.1 2012 9,233 9,237 -
Historic Estimates: Final estimates of Milk in earlier years are available in Statistical Bulletins No. 1022 for 2003-07,
No. 988 for 1998-02, No. 952 for 1993-97, No. 909 for 1988-92, No. 802 for 1983-87, No. 722 for 1979-82, No. 651 for
1975-78, No. 591 for 1970-74, No. 509 for 1965-69, No. 390 for 1960-64, No. 282 for 1955-59, and No. 289 for 1930-59.

6 Milk Cows and Production Final Estimates 2008-2012 (September 2014) USDA, National Agricultural Statistics Service
Milk Cows and Production – United States: 2008-2012
Year Milk cows1
Production per cow2 Milk production
2
Milk Total
(1,000 head) (pounds) (million pounds)
2008 ...... 2009 ...... 2010 ...... 2011 ...... 2012 ......
9,314 9,202 9,123 9,199 9,237
20,397 20,561 21,142 21,334 21,722
189,978 189,202 192,877 196,255 200,642
1 Average number during year, excluding heifers not yet fresh.
2 Excludes milk sucked by calves.

Milk Cows and Production Final Estimates 2008-2012 (September 2014) 7 USDA, National Agricultural Statistics Service
Milk Cows – States and United States: 2008-2012 [May not add due to rounding]
State Milk cows
1
2008 2009 2010 2011 2012
(1,000 head) (1,000 head) (1,000 head) (1,000 head) (1,000 head)
Alabama ........................... Alaska .............................. Arizona ............................. Arkansas .......................... California .......................... Colorado ........................... Connecticut ...................... Delaware .......................... Florida .............................. Georgia ............................ Hawaii .............................. Idaho ................................ Illinois ............................... Indiana ............................. Iowa .................................. Kansas ............................. Kentucky ........................... Louisiana .......................... Maine ............................... Maryland ........................... Massachusetts .................. Michigan ........................... Minnesota ......................... Mississippi ........................ Missouri ............................ Montana ........................... Nebraska .......................... Nevada ............................. New Hampshire ................ New Jersey ....................... New Mexico ...................... New York .......................... North Carolina .................. North Dakota .................... Ohio .................................. Oklahoma ......................... Oregon ............................. Pennsylvania .................... Rhode Island .................... South Carolina .................. South Dakota .................... Tennessee ........................ Texas ............................... Utah .................................. Vermont ............................ Virginia ............................. Washington ...................... West Virginia .................... Wisconsin ......................... Wyoming .......................... United States ....................
12.0 0.6
186.0 15.0
1,844.0 128.0
19.0 6.5
120.0 76.0
1.7
549.0 102.0 167.0 213.0 117.0
89.0 26.0 33.0 56.0
15.0
350.0 464.0
20.0 110.0
17.0 58.0 28.0 15.0 10.0
338.0 626.0
47.0 26.0
280.0 64.0
114.0 549.0
1.1 18.0
90.0 59.0
418.0 85.0
140.0 98.0
244.0 12.0
1,252.0 7.0
9,314.0
11.0 0.6
177.0 13.0
1,796.0 123.0 19.0 6.0
115.0 77.0
1.5
550.0 102.0 168.0 214.0 118.0 84.0 23.0 33.0 55.0
14.0
355.0 469.0 18.0
107.0 15.0 61.0 28.0 15.0 9.0
325.0 619.0 45.0 23.0
277.0 59.0
114.0 545.0
1.1 17.0
94.0 56.0
423.0 84.0
135.0 96.0
240.0 11.0
1,257.0 5.5
9,202.0
11.0 0.6
177.0 12.0
1,754.0 119.0 19.0 5.3
114.0 79.0
1.9
564.0 100.0 170.0 210.0 119.0 78.0 20.0 32.0 54.0
14.0
358.0 470.0 17.0 99.0 14.0 59.0 28.0 15.0 8.0
321.0 611.0 44.0 21.0
271.0 56.0
118.0 541.0
1.1 16.0
92.0 52.0
413.0 88.0
136.0 95.0
251.0 10.0
1,262.0 6.0
9,123.0
10.0 0.5
188.0 12.0
1,769.0 128.0
19.0 5.0
119.0 79.0
1.9
578.0 98.0
172.0 204.0 123.0
76.0 18.0 32.0 52.0
13.0
366.0 468.0
14.0 95.0 14.0 57.0 29.0 14.0 8.0
329.0 610.0
45.0 19.0
268.0 53.0
121.0 541.0
1.1 16.0
91.0 50.0
431.0 93.0
134.0 96.0
260.0 10.0
1,265.0 6.0
9,199.0
10.0 0.4
188.0 10.0
1,782.0 133.0 18.0 4.8
123.0 80.0
2.0
580.0 98.0
175.0 205.0 126.0 74.0 17.0 33.0 51.0
12.0
375.0 465.0 14.0 94.0 14.0 56.0 29.0 14.0 7.0
330.0 610.0 46.0 18.0
270.0 48.0
123.0 536.0
1.1 16.0
92.0 50.0
436.0 95.0
133.0 96.0
262.0 10.0
1,270.0 6.0
9,237.0
1 Number of milk cows is average number during year, excludes heifers not yet fresh.

8 Milk Cows and Production Final Estimates 2008-2012 (September 2014) USDA, National Agricultural Statistics Service
Milk Production per Cow – States and United States: 2008-2012 [May not add due to rounding]
State Milk production per cow
1
2008 2009 2010 2011 2012
(pounds) (pounds) (pounds) (pounds) (pounds)
Alabama ........................... Alaska ............................... Arizona ............................. Arkansas ........................... California .......................... Colorado ........................... Connecticut ....................... Delaware .......................... Florida ............................... Georgia ............................. Hawaii ............................... Idaho ................................. Illinois ................................ Indiana .............................. Iowa .................................. Kansas .............................. Kentucky ........................... Louisiana .......................... Maine ................................ Maryland ........................... Massachusetts .................. Michigan ........................... Minnesota ......................... Mississippi ........................ Missouri ............................ Montana ............................ Nebraska .......................... Nevada ............................. New Hampshire ................ New Jersey ....................... New Mexico ...................... New York .......................... North Carolina ................... North Dakota ..................... Ohio .................................. Oklahoma ......................... Oregon .............................. Pennsylvania .................... Rhode Island ..................... South Carolina .................. South Dakota .................... Tennessee ........................ Texas ................................ Utah .................................. Vermont ............................ Virginia .............................. Washington ....................... West Virginia ..................... Wisconsin ......................... Wyoming ........................... United States ....................
15,333 12,000 23,392 12,400 22,344 22,930 19,158 16,923 17,175 17,829
10,882 22,432 18,255 19,683 19,887 20,641 13,596 12,269 18,273 18,375
16,933 22,180 18,927 14,550 14,682 18,412 18,672 23,321 19,933 16,900
23,269 19,859 18,979 16,077 18,339 16,578 19,772 19,262 18,091 17,944
19,956 16,068 20,134 20,988 18,400 17,612 23,344 15,083 19,546 19,386
20,397
14,909 10,000 23,062 12,692 22,000 23,065 18,579 17,000 18,087 18,182
14,200 22,091 18,255 20,137 20,098 21,085 14,190 11,783 18,061 18,255
17,571 22,445 19,230 13,889 14,654 19,933 19,639 21,893 19,533 17,556
24,320 20,071 19,644 16,826 18,744 16,983 19,719 19,360 17,818 19,118
20,128 16,232 20,898 21,083 18,289 18,083 23,171 14,727 20,079 19,036
20,561
14,182 11,833 23,452 12,750 23,025 23,664 19,158 16,981 18,711 17,658
13,316 22,647 18,400 20,094 20,676 20,983 14,769 11,750 18,344 18,537
17,286 23,277 19,366 13,118 14,596 20,643 19,797 23,714 19,600 17,500
24,551 20,807 19,682 18,286 19,446 17,125 20,331 19,847 17,727 17,875
20,478 16,346 21,375 21,898 18,537 18,095 23,514 15,700 20,630 20,067
21,142
14,300 13,800 23,473 11,917 23,438 23,430 19,000 18,300 19,067 18,354
14,421 22,926 18,510 20,657 21,191 21,016 14,342 12,889 18,688 18,654
16,923 23,164 18,996 14,571 14,611 20,571 20,579 22,966 20,429 16,875
24,854 21,046 20,089 18,158 19,194 17,415 20,488 19,495 17,909 17,438
20,582 16,200 22,232 22,161 18,940 17,906 23,727 15,700 20,599 20,517
21,334
13,000 14,250 23,979 13,300 23,457 24,158 19,889 19,542 19,024 19,138
14,200 23,376 19,061 21,440 22,015 21,683 15,135 13,059 18,576 19,196
18,250 23,976 19,512 14,214 14,979 21,357 21,179 22,931 19,643 18,571
24,694 21,623 20,435 19,278 19,833 17,896 20,431 19,549 16,636 17,250
21,391 16,100 22,009 22,863 19,316 17,990 23,794 15,400 21,436 20,650
21,722
1 Excludes milk sucked by calves.

Milk Cows and Production Final Estimates 2008-2012 (September 2014) 9 USDA, National Agricultural Statistics Service
Milk Production – States and United States: 2008-2012 [Totals may not add due to rounding]
State Milk production
1
2008 2009 2010 2011 2012
(million pounds) (million pounds) (million pounds) (million pounds) (million pounds)
Alabama ........................... Alaska .............................. Arizona ............................. Arkansas .......................... California .......................... Colorado ........................... Connecticut ...................... Delaware .......................... Florida .............................. Georgia ............................ Hawaii .............................. Idaho ................................ Illinois ............................... Indiana ............................. Iowa .................................. Kansas ............................. Kentucky ........................... Louisiana .......................... Maine ............................... Maryland ........................... Massachusetts .................. Michigan ........................... Minnesota ......................... Mississippi ........................ Missouri ............................ Montana ........................... Nebraska .......................... Nevada ............................. New Hampshire ................ New Jersey ....................... New Mexico ...................... New York .......................... North Carolina .................. North Dakota .................... Ohio .................................. Oklahoma ......................... Oregon ............................. Pennsylvania .................... Rhode Island .................... South Carolina .................. South Dakota .................... Tennessee ........................ Texas ............................... Utah .................................. Vermont ............................ Virginia ............................. Washington ...................... West Virginia .................... Wisconsin ......................... Wyoming .......................... United States ....................
184.0 7.2
4,351.0 186.0
41,203.0 2,935.0
364.0 110.0
2,061.0 1,355.0
18.5
12,315.0 1,862.0 3,287.0 4,236.0 2,415.0 1,210.0
319.0 603.0
1,029.0
254.0 7,763.0 8,782.0
291.0 1,615.0
313.0 1,083.0
653.0 299.0 169.0
7,865.0
12,432.0 892.0 418.0
5,135.0 1,061.0 2,254.0
10,575.0 19.9
323.0
1,796.0 948.0
8,416.0 1,784.0 2,576.0 1,726.0 5,696.0
181.0 24,472.0
135.7
189,978.0
164.0 6.0
4,082.0 165.0
39,512.0 2,837.0
353.0 102.0
2,080.0 1,400.0
21.3
12,150.0 1,862.0 3,383.0 4,301.0 2,488.0 1,192.0
271.0 596.0
1,004.0
246.0 7,968.0 9,019.0
250.0 1,568.0
299.0 1,198.0
613.0 293.0 158.0
7,904.0
12,424.0 884.0 387.0
5,192.0 1,002.0 2,248.0
10,551.0 19.6
325.0
1,892.0 909.0
8,840.0 1,771.0 2,469.0 1,736.0 5,561.0
162.0 25,239.0
104.7
189,202.0
156.0 7.1
4,151.0 153.0
40,385.0 2,816.0
364.0 90.0
2,133.0 1,395.0
25.3
12,773.0 1,840.0 3,416.0 4,342.0 2,497.0 1,152.0
235.0 587.0
1,001.0
242.0 8,333.0 9,102.0
223.0 1,445.0
289.0 1,168.0
664.0 294.0 140.0
7,881.0
12,713.0 866.0 384.0
5,270.0 959.0
2,399.0 10,737.0
19.5 286.0
1,884.0
850.0 8,828.0 1,927.0 2,521.0 1,719.0 5,902.0
157.0 26,035.0
120.4
192,877.0
143.0 6.9
4,413.0 143.0
41,462.0 2,999.0
361.0 91.5
2,269.0 1,450.0
27.4
13,251.0 1,814.0 3,553.0 4,323.0 2,585.0 1,090.0
232.0 598.0 970.0
220.0
8,478.0 8,890.0
204.0 1,388.0
288.0 1,173.0
666.0 286.0 135.0
8,177.0
12,838.0 904.0 345.0
5,144.0 923.0
2,479.0 10,547.0
19.7 279.0
1,873.0
810.0 9,582.0 2,061.0 2,538.0 1,719.0 6,169.0
157.0 26,058.0
123.1
196,255.0
130.0 5.7
4,508.0 133.0
41,801.0 3,213.0
358.0 93.8
2,340.0 1,531.0
28.4
13,558.0 1,868.0 3,752.0 4,513.0 2,732.0 1,120.0
222.0 613.0 979.0
219.0
8,991.0 9,073.0
199.0 1,408.0
299.0 1,186.0
665.0 275.0 130.0
8,149.0
13,190.0 940.0 347.0
5,355.0 859.0
2,513.0 10,478.0
18.3 276.0
1,968.0
805.0 9,596.0 2,172.0 2,569.0 1,727.0 6,234.0
154.0 27,224.0
123.9
200,642.0 1 Excludes milk sucked by calves.

10 Milk Cows and Production Final Estimates 2008-2012 (September 2014) USDA, National Agricultural Statistics Service
Milk Cows, Milk Production per Cow, and Milk Production by Month – 23 State Total: 2008-2012 [Totals may not add due to rounding]
Month Milk cows
1
2008 2009 2010 2011 2012
(1,000 head) (1,000 head) (1,000 head) (1,000 head) (1,000 head)
January ............ February .......... March ............... April ................. May .................. June ................. July .................. August ............. September ....... October ............ November ........ December ........ Year .................
8,443 8,456 8,465 8,478 8,492 8,496 8,512 8,512 8,507 8,509 8,517 8,519
8,492
8,505 8,484 8,480 8,477 8,473 8,432 8,396 8,371 8,334 8,315 8,313 8,312
8,408
8,319 8,323 8,330 8,337 8,351 8,361 8,382 8,377 8,380 8,381 8,383 8,394
8,360
8,410 8,415 8,428 8,433 8,449 8,456 8,465 8,469 8,474 8,482 8,483 8,491
8,455
8,507 8,519 8,531 8,533 8,528 8,512 8,499 8,497 8,477 8,471 8,480 8,495
8,504
Milk production per cow 2
(pounds) (pounds) (pounds) (pounds) (pounds)
January ............ February .......... March ............... April ................. May .................. June ................. July .................. August ............. September ....... October ............ November ........ December ........ Year .................
1,746 1,656 1,794 1,756 1,818 1,736 1,743 1,717 1,649 1,699 1,654 1,729
20,697
1,751 1,604 1,793 1,758 1,833 1,748 1,770 1,744 1,674 1,720 1,680 1,759
20,834
1,783 1,641 1,846 1,824 1,892 1,817 1,829 1,792 1,729 1,767 1,722 1,791
21,433
1,810 1,663 1,871 1,836 1,902 1,819 1,819 1,812 1,739 1,787 1,737 1,818
21,613
1,862 1,783 1,933 1,882 1,924 1,830 1,826 1,806 1,731 1,793 1,762 1,851
21,983
Milk production 2
(million pounds) (million pounds) (million pounds) (million pounds) (million pounds)
January ............ February .......... March ............... April ................. May .................. June ................. July .................. August ............. September ....... October ............ November ........ December ........ Year .................
14,745 14,006 15,187 14,885 15,442 14,747 14,839 14,612 14,025 14,456 14,085 14,727
175,756
14,890 13,608 15,207 14,906 15,529 14,743 14,862 14,601 13,949 14,299 13,969 14,622
175,185
14,830 13,659 15,379 15,205 15,802 15,189 15,327 15,009 14,490 14,808 14,436 15,031
179,165
15,224 13,995 15,773 15,482 16,067 15,378 15,399 15,346 14,738 15,160 14,738 15,437
182,737
15,841 15,186 16,493 16,059 16,412 15,581 15,518 15,347 14,677 15,185 14,939 15,726
186,964
1 Includes dry cows, excludes heifers not yet fresh.
2 Excludes milk sucked by calves.

Milk Cows and Production Final Estimates 2008-2012 (September 2014) 11 USDA, National Agricultural Statistics Service
Milk Cows by Month – 23 Selected States, 23 State Total, and United States: 2008 [Includes dry cows, excludes heifers not yet fresh]
State January February March April May June
(1,000 head) (1,000 head) (1,000 head) (1,000 head) (1,000 head) (1,000 head)
Arizona .............................. California ........................... Colorado ............................ Florida ............................... Idaho ................................. Illinois ................................ Indiana .............................. Iowa ................................... Kansas .............................. Michigan ............................ Minnesota .......................... Missouri ............................. New Mexico ....................... New York ........................... Ohio ................................... Oregon .............................. Pennsylvania ..................... Texas ................................ Utah ................................... Vermont ............................. Virginia .............................. Washington ....................... Wisconsin .......................... 23-States ........................... United States
1 ...................
185 1,838
126 120 534 102 167 215 115 344
463 110 336 626 278 114 552 402 85
140
98 243
1,250
8,443
9,274
185 1,840
126 120 537 102 167 215 115 344
463 110 340 626 280 114 551 404 85
140
98 244
1,250
8,456
9,287
186 1,842
126 120 540 102 166 214 115 345
463 110 340 626 280 114 549 408 85
140
98 245
1,251
8,465
9,295
186 1,845
127 120 543 102 168 212 115 347
463 111 342 626 281 113 549 410 85
140
98 244
1,251
8,478
9,303
186 1,847
127 120 550 102 168 212 115 350
463 111 342 626 282 113 548 412 85
140
98 244
1,251
8,492
9,314
186 1,847
128 120 551 102 166 212 116 351
463 110 340 626 282 114 546 417 85
140
98 244
1,252
8,496
9,317
July August September October November December Annual Avg
2
(1,000 head) (1,000 head) (1,000 head) (1,000 head) (1,000 head) (1,000 head) (1,000 head)
Arizona .............................. California ........................... Colorado ............................ Florida ............................... Idaho ................................. Illinois ................................ Indiana .............................. Iowa ................................... Kansas .............................. Michigan ............................ Minnesota .......................... Missouri ............................. New Mexico ....................... New York ........................... Ohio ................................... Oregon .............................. Pennsylvania ..................... Texas ................................ Utah ................................... Vermont ............................. Virginia .............................. Washington ....................... Wisconsin .......................... 23-States ........................... United States
1 ...................
185 1,847
129 120 556 102 166 212 117 352
465 111 340 626 281 115 546 423 85
140
97 245
1,252
8,512
9,332
185 1,846
130 120 555 102 166 212 117 352
465 112 337 626 280 115 548 425 85
140
97 245
1,252
8,512
9,329
185 1,845
130 120 554 102 166 212 117 352
465 111 336 626 279 115 548 425 85
139
97 245
1,253
8,507
9,321
186 1,845
130 119 554 102 166 212 118 353
466 110 334 625 278 115 549 428 85
139
97 245
1,253
8,509
9,325
188 1,845
130 119 554 102 167 213 121 353
467 110 334 624 277 115 548 430 85
139
97 245
1,254
8,517
9,333
190 1,840
130 118 554 102 167 215 124 354
467 109 335 625 276 115 548 430 85
139
97 244
1,255
8,519
9,334
186 1,844
128 120 549 102 167 213 117 350
464 110 338 626 280 114 549 418 85
140
98 244
1,252
8,492
9,314 1 U.S. monthly estimates are derived by proportionally allocating the quarterly estimate using the 23-State monthly totals.
2 Average based on monthly totals.

12 Milk Cows and Production Final Estimates 2008-2012 (September 2014) USDA, National Agricultural Statistics Service
Milk Cows by Month – 23 Selected States, 23 State Total, and United States: 2009 [Includes dry cows, excludes heifers not yet fresh]
State January February March April May June
(1,000 head) (1,000 head) (1,000 head) (1,000 head) (1,000 head) (1,000 head)
Arizona .............................. California ........................... Colorado ............................ Florida ................................ Idaho .................................. Illinois ................................. Indiana ............................... Iowa ................................... Kansas ............................... Michigan ............................ Minnesota .......................... Missouri ............................. New Mexico ....................... New York ........................... Ohio ................................... Oregon ............................... Pennsylvania ..................... Texas ................................. Utah ................................... Vermont ............................. Virginia ............................... Washington ........................ Wisconsin .......................... 23-States ........................... United States
1 ...................
189 1,832
129 118 554 102 167 214 125 354
468 108 334 624 277 115 550 430 85
137
97 241
1,255
8,505
9,312
189 1,825
128 117 549 102 167 213 124 354
468 107 333 623 277 114 551 430 85
136
97 240
1,255
8,484
9,289
189 1,821
128 117 550 102 167 213 122 355
468 108 333 623 277 114 550 430 85
136
97 239
1,256
8,480
9,284
188 1,821
128 117 551 102 167 213 120 356
468 110 332 623 277 114 549 430 84
136
96 239
1,256
8,477
9,281
184 1,815
128 117 553 102 168 213 121 357
469 110 332 623 278 114 547 430 84
136
96 240
1,256
8,473
9,275
176 1,804
126 116 549 102 168 213 118 357
469 109 327 623 278 114 545 428 83
135
96 239
1,257
8,432
9,230
July August September October November December Annual Avg
2
(1,000 head) (1,000 head) (1,000 head) (1,000 head) (1,000 head) (1,000 head) (1,000 head)
Arizona .............................. California ........................... Colorado ............................ Florida ................................ Idaho .................................. Illinois ................................. Indiana ............................... Iowa ................................... Kansas ............................... Michigan ............................ Minnesota .......................... Missouri ............................. New Mexico ....................... New York ........................... Ohio ................................... Oregon ............................... Pennsylvania ..................... Texas ................................. Utah ................................... Vermont ............................. Virginia ............................... Washington ........................ Wisconsin .......................... 23-States ........................... United States
1 ...................
171 1,790
124 115 550 102 168 214 117 356
469 108 321 621 278 114 545 423 83
135
96 239
1,257
8,396
9,190
171 1,782
123 114 548 102 167 214 117 355
469 106 320 618 278 114 545 420 83
135
96 237
1,257
8,371
9,162
167 1,769
117 114 546 102 168 214 114 355
469 105 318 617 278 114 542 416 83
134
96 238
1,258
8,334
9,122
166 1,767
116 113 546 101 168 214 112 355
469 105 317 614 276 114 539 413 83
134
95 240
1,258
8,315
9,097
168 1,765
116 113 548 101 169 214 113 354
469 105 317 611 274 114 538 413 83
134
95 241
1,258
8,313
9,093
167 1,762
116 112 550 101 169 215 115 354
470 103 318 610 272 114 539 411 83
134
95 243
1,259
8,312
9,085
177 1,796
123 115 550 102 168 214 118 355
469 107 325 619 277 114 545 423 84
135
96 240
1,257
8,408
9,202 1 U.S. monthly estimates are derived by proportionally allocating the quarterly estimate using the 23-State monthly totals.
2 Average based on monthly totals.

Milk Cows and Production Final Estimates 2008-2012 (September 2014) 13 USDA, National Agricultural Statistics Service
Milk Cows by Month – 23 Selected States, 23 State Total and United States: 2010 [Includes dry cows, excludes heifers not yet fresh]
State January February March April May June
(1,000 head) (1,000 head) (1,000 head) (1,000 head) (1,000 head) (1,000 head)
Arizona .............................. California ........................... Colorado ............................ Florida ............................... Idaho ................................. Illinois ................................ Indiana .............................. Iowa ................................... Kansas .............................. Michigan ............................ Minnesota .......................... Missouri ............................. New Mexico ....................... New York ........................... Ohio ................................... Oregon .............................. Pennsylvania ..................... Texas ................................ Utah ................................... Vermont ............................. Virginia .............................. Washington ....................... Wisconsin .......................... 23-States ........................... United States
1 ...................
169 1,760
116 112 551 101 169 214 116 354
470 102 318 610 272 115 541 410 84
134
95 246
1,260
8,319
9,091
170 1,760
116 113 554 101 169 213 116 355
470 101 318 610 272 115 541 410 84
134
95 246
1,260
8,323
9,094
170 1,758
116 114 554 101 169 211 116 357
470 101 321 610 272 115 541 410 84
136
95 249
1,260
8,330
9,100
171 1,755
117 114 557 101 169 211 116 357
470 101 323 610 272 115 541 410 85
137
95 249
1,261
8,337
9,109
173 1,755
117 115 559 101 171 212 116 359
470 101 324 610 271 116 541 410 87
137
95 250
1,261
8,351
9,122
176 1,754
118 115 562 100 171 212 118 359
470 100 325 610 270 118 541 410 89
136
95 250
1,262
8,361
9,132
July August September October November December Annual Avg
2
(1,000 head) (1,000 head) (1,000 head) (1,000 head) (1,000 head) (1,000 head) (1,000 head)
Arizona .............................. California ........................... Colorado ............................ Florida ............................... Idaho ................................. Illinois ................................ Indiana .............................. Iowa ................................... Kansas .............................. Michigan ............................ Minnesota .......................... Missouri ............................. New Mexico ....................... New York ........................... Ohio ................................... Oregon .............................. Pennsylvania ..................... Texas ................................ Utah ................................... Vermont ............................. Virginia .............................. Washington ....................... Wisconsin .......................... 23-States ........................... United States
1 ...................
179 1,753
119 115 569 100 170 211 120 359
470 100 324 611 270 120 541 415 90
136
95 252
1,263
8,382
9,144
180 1,753
120 114 570 99
170 209 120 359
470 99
318 611 270 121 541 415 91
137
95 252
1,263
8,377
9,130
182 1,752
122 113 571 99
170 207 121 359
470 98
318 611 270 121 542 415 91
136
95 253
1,264
8,380
9,131
183 1,752
122 114 572 98
170 206 121 360
470 97
318 611 270 121 541 415 91
136
95 254
1,264
8,381
9,133
183 1,751
122 114 572 98
171 207 121 360
470 96
319 611 270 121 542 415 91
136
95 253
1,265
8,383
9,135
184 1,749
123 114 574 98
171 209 122 361
470 95
321 611 270 121 543 420 91
135
95 252
1,265
8,394
9,148
177 1,754
119 114 564 100 170 210 119 358
470 99
321 611 271 118 541 413 88
136
95 251
1,262
8,360
9,123 1 U.S. monthly estimates are derived by proportionally allocating the quarterly estimate using the 23-State monthly totals.
2 Average based on monthly totals.
14 Milk Cows and Production Final Estimates 2008-2012 (September 2014) USDA, National Agricultural Statistics Service
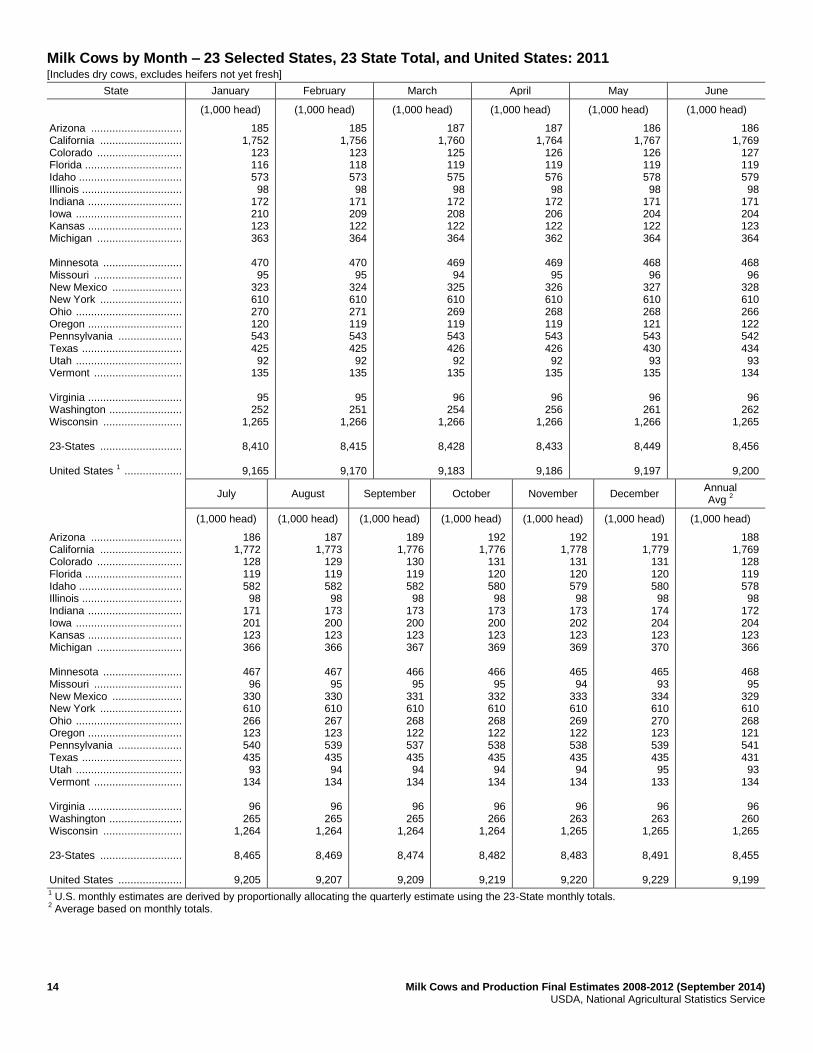
Milk Cows by Month – 23 Selected States, 23 State Total, and United States: 2011 [Includes dry cows, excludes heifers not yet fresh]
State January February March April May June
(1,000 head) (1,000 head) (1,000 head) (1,000 head) (1,000 head) (1,000 head)
Arizona .............................. California ........................... Colorado ............................ Florida ................................ Idaho .................................. Illinois ................................. Indiana ............................... Iowa ................................... Kansas ............................... Michigan ............................ Minnesota .......................... Missouri ............................. New Mexico ....................... New York ........................... Ohio ................................... Oregon ............................... Pennsylvania ..................... Texas ................................. Utah ................................... Vermont ............................. Virginia ............................... Washington ........................ Wisconsin .......................... 23-States ........................... United States
1 ...................
185 1,752
123 116 573 98
172 210 123 363
470 95
323 610 270 120 543 425 92
135
95 252
1,265
8,410
9,165
185 1,756
123 118 573 98
171 209 122 364
470 95
324 610 271 119 543 425 92
135
95 251
1,266
8,415
9,170
187 1,760
125 119 575 98
172 208 122 364
469 94
325 610 269 119 543 426 92
135
96 254
1,266
8,428
9,183
187 1,764
126 119 576 98
172 206 122 362
469 95
326 610 268 119 543 426 92
135
96 256
1,266
8,433
9,186
186 1,767
126 119 578 98
171 204 122 364
468 96
327 610 268 121 543 430 93
135
96 261
1,266
8,449
9,197
186 1,769
127 119 579 98
171 204 123 364
468 96
328 610 266 122 542 434 93
134
96 262
1,265
8,456
9,200
July August September October November December Annual Avg
2
(1,000 head) (1,000 head) (1,000 head) (1,000 head) (1,000 head) (1,000 head) (1,000 head)
Arizona .............................. California ........................... Colorado ............................ Florida ................................ Idaho .................................. Illinois ................................. Indiana ............................... Iowa ................................... Kansas ............................... Michigan ............................ Minnesota .......................... Missouri ............................. New Mexico ....................... New York ........................... Ohio ................................... Oregon ............................... Pennsylvania ..................... Texas ................................. Utah ................................... Vermont ............................. Virginia ............................... Washington ........................ Wisconsin .......................... 23-States ........................... United States .....................
186 1,772
128 119 582 98
171 201 123 366
467 96
330 610 266 123 540 435 93
134
96 265
1,264
8,465
9,205
187 1,773
129 119 582 98
173 200 123 366
467 95
330 610 267 123 539 435 94
134
96 265
1,264
8,469
9,207
189 1,776
130 119 582 98
173 200 123 367
466 95
331 610 268 122 537 435 94
134
96 265
1,264
8,474
9,209
192 1,776
131 120 580 98
173 200 123 369
466 95
332 610 268 122 538 435 94
134
96 266
1,264
8,482
9,219
192 1,778
131 120 579 98
173 202 123 369
465 94
333 610 269 122 538 435 94
134
96 263
1,265
8,483
9,220
191 1,779
131 120 580 98
174 204 123 370
465 93
334 610 270 123 539 435 95
133
96 263
1,265
8,491
9,229
188 1,769
128 119 578 98
172 204 123 366
468 95
329 610 268 121 541 431 93
134
96 260
1,265
8,455
9,199 1 U.S. monthly estimates are derived by proportionally allocating the quarterly estimate using the 23-State monthly totals.
2 Average based on monthly totals.
Milk Cows and Production Final Estimates 2008-2012 (September 2014) 15 USDA, National Agricultural Statistics Service
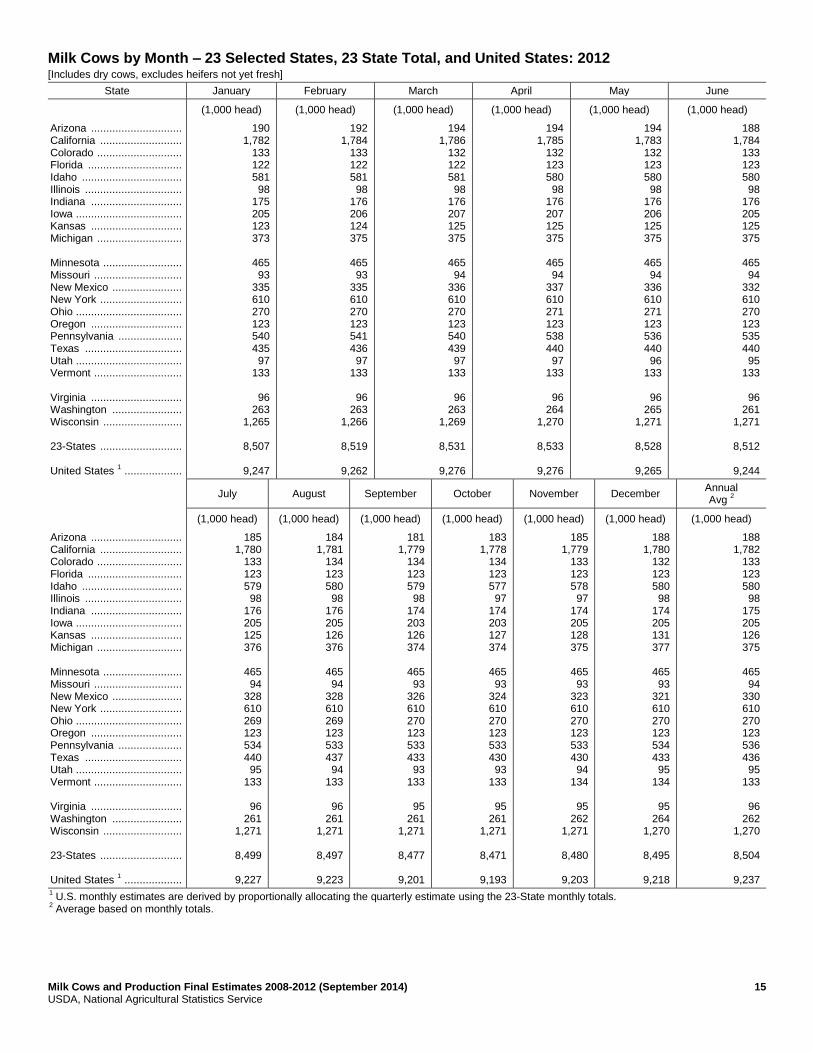
Milk Cows by Month – 23 Selected States, 23 State Total, and United States: 2012 [Includes dry cows, excludes heifers not yet fresh]
State January February March April May June
(1,000 head) (1,000 head) (1,000 head) (1,000 head) (1,000 head) (1,000 head)
Arizona .............................. California ........................... Colorado ............................ Florida ............................... Idaho ................................. Illinois ................................ Indiana .............................. Iowa ................................... Kansas .............................. Michigan ............................ Minnesota .......................... Missouri ............................. New Mexico ....................... New York ........................... Ohio ................................... Oregon .............................. Pennsylvania ..................... Texas ................................ Utah ................................... Vermont ............................. Virginia .............................. Washington ....................... Wisconsin .......................... 23-States ........................... United States
1 ...................
190 1,782
133 122 581 98
175 205 123 373
465 93
335 610 270 123 540 435 97
133
96 263
1,265
8,507
9,247
192 1,784
133 122 581 98
176 206 124 375
465 93
335 610 270 123 541 436 97
133
96 263
1,266
8,519
9,262
194 1,786
132 122 581 98
176 207 125 375
465 94
336 610 270 123 540 439 97
133
96 263
1,269
8,531
9,276
194 1,785
132 123 580 98
176 207 125 375
465 94
337 610 271 123 538 440 97
133
96 264
1,270
8,533
9,276
194 1,783
132 123 580 98
176 206 125 375
465 94
336 610 271 123 536 440 96
133
96 265
1,271
8,528
9,265
188 1,784
133 123 580 98
176 205 125 375
465 94
332 610 270 123 535 440 95
133
96 261
1,271
8,512
9,244
July August September October November December Annual Avg
2
(1,000 head) (1,000 head) (1,000 head) (1,000 head) (1,000 head) (1,000 head) (1,000 head)
Arizona .............................. California ........................... Colorado ............................ Florida ............................... Idaho ................................. Illinois ................................ Indiana .............................. Iowa ................................... Kansas .............................. Michigan ............................ Minnesota .......................... Missouri ............................. New Mexico ....................... New York ........................... Ohio ................................... Oregon .............................. Pennsylvania ..................... Texas ................................ Utah ................................... Vermont ............................. Virginia .............................. Washington ....................... Wisconsin .......................... 23-States ........................... United States
1 ...................
185 1,780
133 123 579 98
176 205 125 376
465 94
328 610 269 123 534 440 95
133
96 261
1,271
8,499
9,227
184 1,781
134 123 580 98
176 205 126 376
465 94
328 610 269 123 533 437 94
133
96 261
1,271
8,497
9,223
181 1,779
134 123 579 98
174 203 126 374
465 93
326 610 270 123 533 433 93
133
95 261
1,271
8,477
9,201
183 1,778
134 123 577 97
174 203 127 374
465 93
324 610 270 123 533 430 93
133
95 261
1,271
8,471
9,193
185 1,779
133 123 578 97
174 205 128 375
465 93
323 610 270 123 533 430 94
134
95 262
1,271
8,480
9,203
188 1,780
132 123 580 98
174 205 131 377
465 93
321 610 270 123 534 433 95
134
95 264
1,270
8,495
9,218
188 1,782
133 123 580 98
175 205 126 375
465 94
330 610 270 123 536 436 95
133
96 262
1,270
8,504
9,237 1 U.S. monthly estimates are derived by proportionally allocating the quarterly estimate using the 23-State monthly totals.
2 Average based on monthly totals.

16 Milk Cows and Production Final Estimates 2008-2012 (September 2014) USDA, National Agricultural Statistics Service
Milk Produced per Cow by Month – 23 Selected States, 23 State Total, and United States: 2008 [Excludes milk sucked by calves]
State January February March April May June
(pounds) (pounds) (pounds) (pounds) (pounds) (pounds)
Arizona .............................. California ........................... Colorado ............................ Florida ................................ Idaho .................................. Illinois ................................. Indiana ............................... Iowa ................................... Kansas ............................... Michigan ............................ Minnesota .......................... Missouri ............................. New Mexico ....................... New York ........................... Ohio ................................... Oregon ............................... Pennsylvania ..................... Texas ................................. Utah ................................... Vermont ............................. Virginia ............................... Washington ........................ Wisconsin .......................... 23-States ........................... United States
1 ...................
2,020 1,900 1,880 1,550 1,870 1,610 1,710 1,680 1,720 1,910
1,610 1,225 1,900 1,660 1,540 1,685 1,630 1,685 1,690 1,580
1,540 1,965 1,635
1,746
1,723
1,960 1,810 1,800 1,530 1,750 1,515 1,605 1,600 1,645 1,760
1,520 1,170 1,785 1,590 1,445 1,580 1,540 1,635 1,600 1,490
1,470 1,850 1,545
1,656
1,635
2,190 1,975 1,945 1,655 1,885 1,640 1,705 1,720 1,790 1,870
1,630 1,300 1,990 1,690 1,560 1,700 1,680 1,800 1,730 1,590
1,590 1,990 1,660
1,794
1,771
2,145 1,905 1,910 1,568 1,850 1,610 1,640 1,670 1,740 1,840
1,580 1,325 1,990 1,670 1,580 1,680 1,670 1,770 1,720 1,560
1,570 1,950 1,620
1,756
1,733
2,165 1,940 1,990 1,625 1,930 1,665 1,730 1,730 1,790 1,935
1,645 1,365 2,040 1,770 1,660 1,745 1,720 1,800 1,800 1,600
1,580 2,025 1,710
1,818
1,793
1,950 1,850 1,940 1,440 1,900 1,510 1,650 1,655 1,680 1,860
1,585 1,240 1,970 1,680 1,560 1,660 1,630 1,690 1,790 1,565
1,410 1,970 1,650
1,736
1,711
July August September October November December Annual Avg
2
(pounds) (pounds) (pounds) (pounds) (pounds) (pounds) (pounds)
Arizona .............................. California ........................... Colorado ............................ Florida ................................ Idaho .................................. Illinois ................................. Indiana ............................... Iowa ................................... Kansas ............................... Michigan ............................ Minnesota .......................... Missouri ............................. New Mexico ....................... New York ........................... Ohio ................................... Oregon ............................... Pennsylvania ..................... Texas ................................. Utah ................................... Vermont ............................. Virginia ............................... Washington ........................ Wisconsin .......................... 23-States ........................... United States
1 ...................
1,815 1,850 1,950 1,380 1,960 1,480 1,650 1,650 1,725 1,900
1,595 1,170 1,990 1,690 1,550 1,670 1,630 1,675 1,845 1,585
1,425 2,000 1,670
1,743
1,713
1,755 1,840 1,930 1,240 1,970 1,420 1,585 1,635 1,710 1,860
1,565 1,110 1,920 1,690 1,520 1,645 1,590 1,605 1,835 1,535
1,410 1,990 1,650
1,717
1,688
1,710 1,775 1,850 1,160 1,870 1,380 1,550 1,590 1,665 1,790
1,490 1,100 1,880 1,590 1,450 1,590 1,530 1,550 1,755 1,470
1,360 1,900 1,580
1,649
1,623
1,835 1,835 1,890 1,225 1,870 1,450 1,625 1,665 1,720 1,845
1,555 1,180 1,920 1,620 1,510 1,615 1,570 1,625 1,775 1,490
1,435 1,920 1,625
1,699
1,675
1,845 1,795 1,845 1,320 1,770 1,440 1,585 1,625 1,695 1,780
1,525 1,175 1,900 1,580 1,460 1,555 1,510 1,600 1,695 1,455
1,410 1,840 1,565
1,654
1,630
1,985 1,870 1,940 1,520 1,820 1,530 1,675 1,665 1,740 1,850
1,605 1,270 1,975 1,640 1,530 1,590 1,580 1,715 1,755 1,525
1,495 1,900 1,635
1,729
1,704
23,392 22,344 22,930 17,175 22,432 18,255 19,683 19,887 20,641 22,180
18,927 14,682 23,269 19,859 18,339 19,772 19,262 20,134 20,988 18,400
17,612 23,344 19,546
20,697
20,397
1 U.S. monthly estimates are derived by proportionally allocating the quarterly estimate using the 23-State monthly totals.
2 Average per cow for the year.

Milk Cows and Production Final Estimates 2008-2012 (September 2014) 17 USDA, National Agricultural Statistics Service
Milk Produced per Cow by Month – 23 Selected States, 23 State Total, and United States: 2009 [Excludes milk sucked by calves]
State January February March April May June
(pounds) (pounds) (pounds) (pounds) (pounds) (pounds)
Arizona .............................. California ........................... Colorado ............................ Florida ............................... Idaho ................................. Illinois ................................ Indiana .............................. Iowa ................................... Kansas .............................. Michigan ............................ Minnesota .......................... Missouri ............................. New Mexico ....................... New York ........................... Ohio ................................... Oregon .............................. Pennsylvania ..................... Texas ................................ Utah ................................... Vermont ............................. Virginia .............................. Washington ....................... Wisconsin .......................... 23-States ........................... United States
1 ...................
1,990 1,885 1,940 1,660 1,810 1,570 1,695 1,670 1,800 1,865
1,620 1,270 2,015 1,670 1,550 1,650 1,630 1,780 1,720 1,545
1,545 1,925 1,645
1,751
1,731
1,865 1,720 1,780 1,540 1,640 1,440 1,560 1,520 1,655 1,700
1,475 1,150 1,880 1,540 1,430 1,520 1,490 1,650 1,570 1,415
1,425 1,750 1,505
1,604
1,587
2,120 1,925 1,980 1,760 1,840 1,625 1,750 1,690 1,835 1,895
1,640 1,320 2,110 1,700 1,610 1,710 1,670 1,850 1,740 1,565
1,600 1,950 1,675
1,793
1,774
2,060 1,885 1,920 1,710 1,800 1,600 1,710 1,670 1,775 1,865
1,605 1,320 2,070 1,670 1,590 1,675 1,640 1,810 1,720 1,520
1,585 1,920 1,650
1,758
1,738
2,060 1,935 2,000 1,710 1,910 1,645 1,785 1,745 1,835 1,955
1,680 1,330 2,145 1,820 1,670 1,735 1,710 1,835 1,810 1,595
1,615 2,015 1,745
1,833
1,810
1,940 1,820 1,940 1,535 1,880 1,510 1,685 1,700 1,735 1,890
1,630 1,195 2,050 1,700 1,590 1,675 1,630 1,710 1,790 1,550
1,500 1,970 1,700
1,748
1,726
July August September October November December Annual Avg
2
(pounds) (pounds) (pounds) (pounds) (pounds) (pounds) (pounds)
Arizona .............................. California ........................... Colorado ............................ Florida ............................... Idaho ................................. Illinois ................................ Indiana .............................. Iowa ................................... Kansas .............................. Michigan ............................ Minnesota .......................... Missouri ............................. New Mexico ....................... New York ........................... Ohio ................................... Oregon .............................. Pennsylvania ..................... Texas ................................ Utah ................................... Vermont ............................. Virginia .............................. Washington ....................... Wisconsin .......................... 23-States ........................... United States
1 ...................
1,800 1,815 1,960 1,450 1,930 1,540 1,725 1,745 1,735 1,945
1,670 1,195 2,050 1,735 1,630 1,695 1,640 1,700 1,855 1,570
1,510 2,015 1,765
1,770
1,742
1,790 1,820 1,950 1,330 1,940 1,470 1,670 1,705 1,745 1,910
1,620 1,180 2,000 1,690 1,570 1,650 1,610 1,680 1,845 1,520
1,450 1,995 1,730
1,744
1,717
1,690 1,735 1,875 1,180 1,850 1,410 1,620 1,630 1,675 1,835
1,545 1,110 1,980 1,620 1,500 1,595 1,560 1,660 1,770 1,485
1,405 1,915 1,655
1,674
1,649
1,840 1,815 1,920 1,230 1,870 1,475 1,680 1,690 1,750 1,860
1,580 1,170 2,020 1,640 1,540 1,615 1,600 1,720 1,805 1,495
1,475 1,940 1,675
1,720
1,695
1,840 1,775 1,855 1,360 1,790 1,465 1,610 1,650 1,725 1,805
1,545 1,170 1,970 1,605 1,510 1,560 1,560 1,710 1,760 1,460
1,455 1,865 1,630
1,680
1,656
2,010 1,865 1,900 1,545 1,850 1,545 1,675 1,710 1,785 1,910
1,630 1,230 2,015 1,675 1,580 1,625 1,620 1,795 1,795 1,545
1,525 1,940 1,705
1,759
1,735
23,062 22,000 23,065 18,087 22,091 18,255 20,137 20,098 21,085 22,445
19,230 14,654 24,320 20,071 18,744 19,719 19,360 20,898 21,083 18,289
18,083 23,171 20,079
20,834
20,561
1 U.S. monthly estimates are derived by proportionally allocating the quarterly estimate using the 23-State monthly totals.
2 Average per cow for the year.

18 Milk Cows and Production Final Estimates 2008-2012 (September 2014) USDA, National Agricultural Statistics Service
Milk Produced per Cow by Month – 23 Selected States, 23 State Total, and United States: 2010 [Excludes milk sucked by calves]
State January February March April May June
(pounds) (pounds) (pounds) (pounds) (pounds) (pounds)
Arizona .............................. California ........................... Colorado ............................ Florida ................................ Idaho .................................. Illinois ................................. Indiana ............................... Iowa ................................... Kansas ............................... Michigan ............................ Minnesota .......................... Missouri ............................. New Mexico ....................... New York ........................... Ohio ................................... Oregon ............................... Pennsylvania ..................... Texas ................................. Utah ................................... Vermont ............................. Virginia ............................... Washington ........................ Wisconsin .......................... 23-States ........................... United States
1 ...................
2,055 1,915 1,930 1,640 1,860 1,555 1,680 1,715 1,765 1,920
1,645 1,220 2,015 1,700 1,600 1,690 1,630 1,805 1,785 1,575
1,535 1,980 1,720
1,783
1,761
1,940 1,755 1,800 1,600 1,690 1,465 1,550 1,565 1,620 1,765
1,510 1,100 1,870 1,560 1,490 1,565 1,520 1,640 1,630 1,440
1,400 1,825 1,585
1,641
1,622
2,180 1,980 2,000 1,815 1,880 1,655 1,745 1,765 1,820 1,990
1,675 1,295 2,105 1,755 1,690 1,760 1,730 1,890 1,820 1,595
1,570 2,025 1,770
1,846
1,825
2,145 1,955 1,975 1,770 1,845 1,625 1,725 1,740 1,805 1,970
1,650 1,325 2,090 1,755 1,680 1,730 1,715 1,855 1,790 1,565
1,590 1,980 1,745
1,824
1,803
2,160 2,020 2,050 1,700 1,940 1,675 1,780 1,815 1,860 2,065
1,725 1,340 2,160 1,850 1,765 1,780 1,750 1,880 1,885 1,625
1,640 2,030 1,840
1,892
1,868
2,025 1,935 2,010 1,600 1,910 1,570 1,705 1,755 1,760 2,000
1,670 1,230 2,080 1,770 1,660 1,695 1,660 1,775 1,845 1,565
1,515 1,970 1,780
1,817
1,791
July August September October November December Annual Avg
2
(pounds) (pounds) (pounds) (pounds) (pounds) (pounds) (pounds)
Arizona .............................. California ........................... Colorado ............................ Florida ................................ Idaho .................................. Illinois ................................. Indiana ............................... Iowa ................................... Kansas ............................... Michigan ............................ Minnesota .......................... Missouri ............................. New Mexico ....................... New York ........................... Ohio ................................... Oregon ............................... Pennsylvania ..................... Texas ................................. Utah ................................... Vermont ............................. Virginia ............................... Washington ........................ Wisconsin .......................... 23-States ........................... United States
1 ...................
1,870 1,940 2,050 1,530 2,000 1,530 1,705 1,765 1,760 2,020
1,675 1,190 2,095 1,790 1,640 1,730 1,680 1,775 1,920 1,550
1,505 2,030 1,795
1,829
1,799
1,765 1,940 2,025 1,335 2,000 1,435 1,635 1,695 1,725 1,955
1,595 1,150 2,040 1,790 1,610 1,730 1,670 1,695 1,900 1,570
1,475 2,015 1,725
1,792
1,764
1,750 1,880 1,945 1,255 1,900 1,415 1,590 1,665 1,685 1,885
1,530 1,125 2,015 1,695 1,560 1,660 1,600 1,695 1,815 1,485
1,430 1,935 1,650
1,729
1,703
1,825 1,910 1,975 1,335 1,930 1,490 1,660 1,725 1,750 1,915
1,560 1,180 2,055 1,725 1,600 1,690 1,640 1,775 1,845 1,520
1,465 1,950 1,680
1,767
1,742
1,845 1,865 1,920 1,470 1,830 1,470 1,645 1,700 1,730 1,840
1,525 1,180 1,985 1,680 1,560 1,610 1,600 1,750 1,770 1,485
1,465 1,870 1,630
1,722
1,698
1,970 1,925 1,985 1,660 1,865 1,560 1,670 1,760 1,780 1,935
1,605 1,230 2,065 1,750 1,610 1,660 1,640 1,845 1,835 1,575
1,510 1,945 1,705
1,791
1,767
23,452 23,025 23,664 18,711 22,647 18,400 20,094 20,676 20,983 23,277
19,366 14,596 24,551 20,807 19,446 20,331 19,847 21,375 21,898 18,537
18,095 23,514 20,630
21,433
21,142
1 U.S. monthly estimates are derived by proportionally allocating the quarterly estimate using the 23-State monthly totals.
2 Average per cow for the year.

Milk Cows and Production Final Estimates 2008-2012 (September 2014) 19 USDA, National Agricultural Statistics Service
Milk Produced per Cow by Month – 23 Selected States, 23 State Total, and United States: 2011 [Excludes milk sucked by calves]
State January February March April May June
(pounds) (pounds) (pounds) (pounds) (pounds) (pounds)
Arizona .............................. California ........................... Colorado ............................ Florida ............................... Idaho ................................. Illinois ................................ Indiana .............................. Iowa ................................... Kansas .............................. Michigan ............................ Minnesota .......................... Missouri ............................. New Mexico ....................... New York ........................... Ohio ................................... Oregon .............................. Pennsylvania ..................... Texas ................................ Utah ................................... Vermont ............................. Virginia .............................. Washington ....................... Wisconsin .......................... 23-States ........................... United States
1 ...................
2,020 1,935 1,975 1,775 1,860 1,610 1,720 1,770 1,775 1,960
1,630 1,240 2,105 1,775 1,625 1,685 1,640 1,875 1,785 1,605
1,545 1,975 1,730
1,810
1,789
1,915 1,800 1,795 1,690 1,690 1,480 1,585 1,610 1,615 1,790
1,485 1,140 1,890 1,620 1,500 1,555 1,510 1,720 1,630 1,465
1,440 1,820 1,580
1,663
1,644
2,180 2,040 2,015 1,865 1,880 1,675 1,810 1,810 1,830 1,985
1,660 1,365 2,150 1,810 1,660 1,750 1,710 1,945 1,835 1,635
1,615 2,025 1,770
1,871
1,850
2,125 1,995 1,985 1,740 1,870 1,635 1,785 1,790 1,805 1,955
1,620 1,380 2,125 1,770 1,620 1,730 1,685 1,915 1,815 1,595
1,585 1,990 1,730
1,836
1,813
2,140 2,080 2,040 1,725 1,980 1,655 1,835 1,860 1,855 2,040
1,680 1,360 2,180 1,845 1,680 1,790 1,720 1,955 1,905 1,655
1,585 2,055 1,800
1,902
1,879
1,980 1,985 1,990 1,630 1,955 1,520 1,725 1,765 1,765 1,960
1,610 1,210 2,100 1,770 1,575 1,730 1,605 1,850 1,880 1,580
1,450 2,000 1,735
1,819
1,795
July August September October November December Annual Avg
2
(pounds) (pounds) (pounds) (pounds) (pounds) (pounds) (pounds)
Arizona .............................. California ........................... Colorado ............................ Florida ............................... Idaho ................................. Illinois ................................ Indiana .............................. Iowa ................................... Kansas .............................. Michigan ............................ Minnesota .......................... Missouri ............................. New Mexico ....................... New York ........................... Ohio ................................... Oregon .............................. Pennsylvania ..................... Texas ................................ Utah ................................... Vermont ............................. Virginia .............................. Washington ....................... Wisconsin .......................... 23-States ........................... United States
1 ...................
1,885 1,995 2,010 1,520 2,050 1,440 1,690 1,710 1,755 1,945
1,545 1,110 2,105 1,790 1,580 1,790 1,615 1,835 1,970 1,600
1,440 2,055 1,720
1,819
1,790
1,815 1,975 2,000 1,400 2,030 1,440 1,705 1,770 1,750 1,940
1,570 1,105 2,065 1,785 1,590 1,760 1,635 1,795 1,925 1,580
1,460 2,040 1,740
1,812
1,784
1,765 1,865 1,930 1,300 1,920 1,430 1,655 1,725 1,705 1,870
1,520 1,110 2,020 1,700 1,550 1,680 1,575 1,780 1,840 1,515
1,405 1,945 1,675
1,739
1,714
1,865 1,930 1,955 1,350 1,930 1,510 1,715 1,790 1,765 1,925
1,555 1,180 2,100 1,725 1,600 1,705 1,605 1,870 1,870 1,560
1,450 1,965 1,710
1,787
1,765
1,855 1,880 1,870 1,460 1,840 1,510 1,660 1,740 1,715 1,865
1,520 1,190 2,020 1,680 1,560 1,615 1,565 1,815 1,800 1,510
1,440 1,880 1,660
1,737
1,716
1,970 1,965 1,955 1,630 1,910 1,610 1,755 1,860 1,750 1,950
1,620 1,240 2,025 1,775 1,625 1,660 1,640 1,860 1,865 1,595
1,530 1,950 1,750
1,818
1,795
23,473 23,438 23,430 19,067 22,926 18,510 20,657 21,191 21,016 23,164
18,996 14,611 24,854 21,046 19,194 20,488 19,495 22,232 22,161 18,940
17,906 23,727 20,599
21,613
21,334
1 U.S. monthly estimates are derived by proportionally allocating the quarterly estimate using the 23-State monthly totals.
2 Average per cow for the year.

20 Milk Cows and Production Final Estimates 2008-2012 (September 2014) USDA, National Agricultural Statistics Service
Milk Produced per Cow by Month – 23 Selected States, 23 State Total, and United States: 2012 [Excludes milk sucked by calves]
State January February March April May June
(pounds) (pounds) (pounds) (pounds) (pounds) (pounds)
Arizona .............................. California ........................... Colorado ............................ Florida ................................ Idaho .................................. Illinois ................................. Indiana ............................... Iowa ................................... Kansas ............................... Michigan ............................ Minnesota .......................... Missouri ............................. New Mexico ....................... New York ........................... Ohio ................................... Oregon ............................... Pennsylvania ..................... Texas ................................. Utah ................................... Vermont ............................. Virginia ............................... Washington ........................ Wisconsin .......................... 23-States ........................... United States
1 ...................
2,100 2,030 1,970 1,780 1,920 1,675 1,800 1,895 1,800 2,015
1,660 1,270 2,045 1,800 1,655 1,685 1,660 1,900 1,895 1,625
1,575 1,995 1,790
1,862
1,844
2,060 1,965 1,865 1,720 1,800 1,610 1,740 1,775 1,725 1,910
1,580 1,215 1,985 1,730 1,610 1,600 1,570 1,835 1,775 1,535
1,510 1,895 1,700
1,783
1,764
2,240 2,130 2,045 1,865 1,940 1,745 1,875 1,910 1,910 2,070
1,705 1,455 2,190 1,865 1,740 1,750 1,710 1,995 1,905 1,660
1,645 2,040 1,835
1,933
1,913
2,155 2,035 2,030 1,805 1,910 1,715 1,860 1,870 1,860 2,035
1,655 1,465 2,130 1,825 1,730 1,725 1,680 1,915 1,885 1,625
1,595 2,000 1,800
1,882
1,860
2,155 2,100 2,105 1,770 2,020 1,685 1,875 1,875 1,890 2,070
1,670 1,390 2,150 1,890 1,735 1,810 1,705 1,925 1,970 1,675
1,575 2,075 1,840
1,924
1,903
2,010 1,975 2,015 1,625 1,990 1,580 1,760 1,795 1,790 1,995
1,600 1,265 2,020 1,800 1,630 1,740 1,605 1,785 1,945 1,610
1,460 2,000 1,780
1,830
1,808
July August September October November December Annual Avg
2
(pounds) (pounds) (pounds) (pounds) (pounds) (pounds) (pounds)
Arizona .............................. California ........................... Colorado ............................ Florida ................................ Idaho .................................. Illinois ................................. Indiana ............................... Iowa ................................... Kansas ............................... Michigan ............................ Minnesota .......................... Missouri ............................. New Mexico ....................... New York ........................... Ohio ................................... Oregon ............................... Pennsylvania ..................... Texas ................................. Utah ................................... Vermont ............................. Virginia ............................... Washington ........................ Wisconsin .......................... 23-States ........................... United States
1 ...................
1,915 1,965 2,050 1,520 2,050 1,480 1,710 1,745 1,775 1,985
1,580 1,170 2,060 1,825 1,595 1,770 1,610 1,770 2,000 1,640
1,425 2,015 1,775
1,826
1,800
1,770 1,855 2,050 1,410 2,040 1,500 1,780 1,815 1,795 2,015
1,620 1,120 2,015 1,810 1,620 1,740 1,615 1,750 1,945 1,610
1,440 2,005 1,820
1,806
1,782
1,745 1,790 1,970 1,250 1,930 1,420 1,685 1,745 1,740 1,930
1,550 1,110 1,960 1,740 1,540 1,665 1,535 1,705 1,860 1,550
1,380 1,935 1,730
1,731
1,708
1,875 1,860 2,030 1,300 1,970 1,535 1,735 1,830 1,805 1,985
1,605 1,180 2,025 1,775 1,650 1,685 1,610 1,795 1,890 1,595
1,465 1,960 1,775
1,793
1,771
1,890 1,835 1,970 1,450 1,890 1,525 1,740 1,810 1,770 1,945
1,590 1,180 2,000 1,735 1,610 1,600 1,580 1,770 1,830 1,545
1,445 1,880 1,745
1,762
1,740
1,995 1,920 2,070 1,570 1,930 1,620 1,850 1,935 1,845 2,025
1,695 1,230 2,100 1,830 1,710 1,660 1,675 1,855 1,895 1,630
1,545 1,950 1,850
1,851
1,829
23,979 23,457 24,158 19,024 23,376 19,061 21,440 22,015 21,683 23,976
19,512 14,979 24,694 21,623 19,833 20,431 19,549 22,009 22,863 19,316
17,990 23,794 21,436
21,983
21,722
1 U.S. monthly estimates are derived by proportionally allocating the quarterly estimate using the 23-State monthly totals.
2 Average per cow for year.

Milk Cows and Production Final Estimates 2008-2012 (September 2014) 21 USDA, National Agricultural Statistics Service
Milk Production by Month – 23 Selected States, 23 State Total, and United States: 2008 [Excludes milk sucked by calves]
State January February March April May June
(million pounds) (million pounds) (million pounds) (million pounds) (million pounds) (million pounds)
Arizona .............................. California ........................... Colorado ............................ Florida ............................... Idaho ................................. Illinois ................................ Indiana .............................. Iowa ................................... Kansas .............................. Michigan ............................ Minnesota .......................... Missouri ............................. New Mexico ....................... New York ........................... Ohio ................................... Oregon .............................. Pennsylvania ..................... Texas ................................ Utah ................................... Vermont ............................. Virginia .............................. Washington ....................... Wisconsin .......................... 23-States ........................... United States
1 ...................
374 3,492
237 186 999 164 286 361 198 657
745 135 638
1,039 428 192 900 677 144 221
151 477
2,044
14,745
15,980
363 3,330
227 184 940 155 268 344 189 605
704 129 607 995 405 180 849 661 136 209
144 451
1,931
14,006
15,180
407 3,638
245 199
1,018 167 283 368 206 645
755 143 677
1,058 437 194 922 734 147 223
156 488
2,077
15,187
16,462
399 3,515
243 188
1,005 164 276 354 200 638
732 147 681
1,045 444 190 917 726 146 218
154 476
2,027
14,885
16,118
403 3,583
253 195
1,062 170 291 367 206 677
762 152 698
1,108 468 197 943 742 153 224
155 494
2,139
15,442
16,703
363 3,417
248 173
1,047 154 274 351 195 653
734 136 670
1,052 440 189 890 705 152 219
138 481
2,066
14,747
15,940
July August September October November December Annual Total
2
(million pounds) (million pounds) (million pounds) (million pounds) (million pounds) (million pounds) (million pounds)
Arizona .............................. California ........................... Colorado ............................ Florida ............................... Idaho ................................. Illinois ................................ Indiana .............................. Iowa ................................... Kansas .............................. Michigan ............................ Minnesota .......................... Missouri ............................. New Mexico ....................... New York ........................... Ohio ................................... Oregon .............................. Pennsylvania ..................... Texas ................................ Utah ................................... Vermont ............................. Virginia .............................. Washington ....................... Wisconsin .......................... 23-States ........................... United States
1 ...................
336 3,417
252 166
1,090 151 274 350 202 669
742 130 677
1,058 436 192 890 709 157 222
138 490
2,091
14,839
15,988
325 3,397
251 149
1,093 145 263 347 200 655
728 124 647
1,058 426 189 871 682 156 215
137 488
2,066
14,612
15,747
316 3,275
241 139
1,036 141 257 337 195 630
693 122 632 995 405 183 838 659 149 204
132 466
1,980
14,025
15,124
341 3,386
246 146
1,036 148 270 353 203 651
725 130 641
1,013 420 186 862 696 151 207
139 470
2,036
14,456
15,615
347 3,312
240 157 981 147 265 346 205 628
712 129 635 986 404 179 827 688 144 202
137 451
1,963
14,085
15,213
377 3,441
252 179
1,008 156 280 358 216 655
750 138 662
1,025 422 183 866 737 149 212
145 464
2,052
14,727
15,908
4,351 41,203 2,935 2,061
12,315 1,862 3,287 4,236 2,415 7,763
8,782 1,615 7,865
12,432 5,135 2,254
10,575 8,416 1,784 2,576
1,726 5,696
24,472
175,756
189,978 1 U.S. monthly estimates are derived by proportionally allocating the quarterly estimate using the 23-State monthly totals.
2 Total milk production for the year.

22 Milk Cows and Production Final Estimates 2008-2012 (September 2014) USDA, National Agricultural Statistics Service
Milk Production by Month – 23 Selected States, 23 State Total, and United States: 2009
State January February March April May June
(million pounds) (million pounds) (million pounds) (million pounds) (million pounds) (million pounds)
Arizona .............................. California ........................... Colorado ............................ Florida ................................ Idaho .................................. Illinois ................................. Indiana ............................... Iowa ................................... Kansas ............................... Michigan ............................ Minnesota .......................... Missouri ............................. New Mexico ....................... New York ........................... Ohio ................................... Oregon ............................... Pennsylvania ..................... Texas ................................. Utah ................................... Vermont ............................. Virginia ............................... Washington ........................ Wisconsin .......................... 23-States ........................... United States
1 ...................
376 3,453
250 196
1,003 160 283 357 225 660
758 137 673
1,042 429 190 897 765 146 212
150 464
2,064
14,890
16,123
352 3,139
228 180 900 147 261 324 205 602
690 123 626 959 396 173 821 710 133 192
138 420
1,889
13,608
14,738
401 3,505
253 206
1,012 166 292 360 224 673
768 143 703
1,059 446 195 919 796 148 213
155 466
2,104
15,207
16,471
387 3,433
246 200 992 163 286 356 213 664
751 145 687
1,040 440 191 900 778 144 207
152 459
2,072
14,906
16,130
379 3,512
256 200
1,056 168 300 372 222 698
788 146 712
1,134 464 198 935 789 152 217
155 484
2,192
15,529
16,792
341 3,283
244 178
1,032 154 283 362 205 675
764 130 670
1,059 442 191 888 732 149 209
144 471
2,137
14,743
15,928
July August September October November December Annual Total
2
(million pounds) (million pounds) (million pounds) (million pounds) (million pounds) (million pounds) (million pounds)
Arizona .............................. California ........................... Colorado ............................ Florida ................................ Idaho .................................. Illinois ................................. Indiana ............................... Iowa ................................... Kansas ............................... Michigan ............................ Minnesota .......................... Missouri ............................. New Mexico ....................... New York ........................... Ohio ................................... Oregon ............................... Pennsylvania ..................... Texas ................................. Utah ................................... Vermont ............................. Virginia ............................... Washington ........................ Wisconsin .......................... 23-States ........................... United States
1 ...................
308 3,249
243 167
1,062 157 290 373 203 692
783 129 658
1,077 453 193 894 719 154 212
145 482
2,219
14,862
16,011
306 3,243
240 152
1,063 150 279 365 204 678
760 125 640
1,044 436 188 877 706 153 205
139 473
2,175
14,601
15,732
282 3,069
219 135
1,010 144 272 349 191 651
725 117 630
1,000 417 182 846 691 147 199
135 456
2,082
13,949
15,039
305 3,207
223 139
1,021 149 282 362 196 660
741 123 640
1,007 425 184 862 710 150 200
140 466
2,107
14,299
15,415
309 3,133
215 154 981 148 272 353 195 639
725 123 624 981 414 178 839 706 146 196
138 449
2,051
13,969
15,060
336 3,286
220 173
1,018 156 283 368 205 676
766 127 641
1,022 430 185 873 738 149 207
145 471
2,147
14,622
15,763
4,082 39,512 2,837 2,080
12,150 1,862 3,383 4,301 2,488 7,968
9,019 1,568 7,904
12,424 5,192 2,248
10,551 8,840 1,771 2,469
1,736 5,561
25,239
175,185
189,202 1 U.S. monthly estimates are derived by proportionally allocating the quarterly estimate using the 23-State monthly totals.
2 Total milk production for the year.
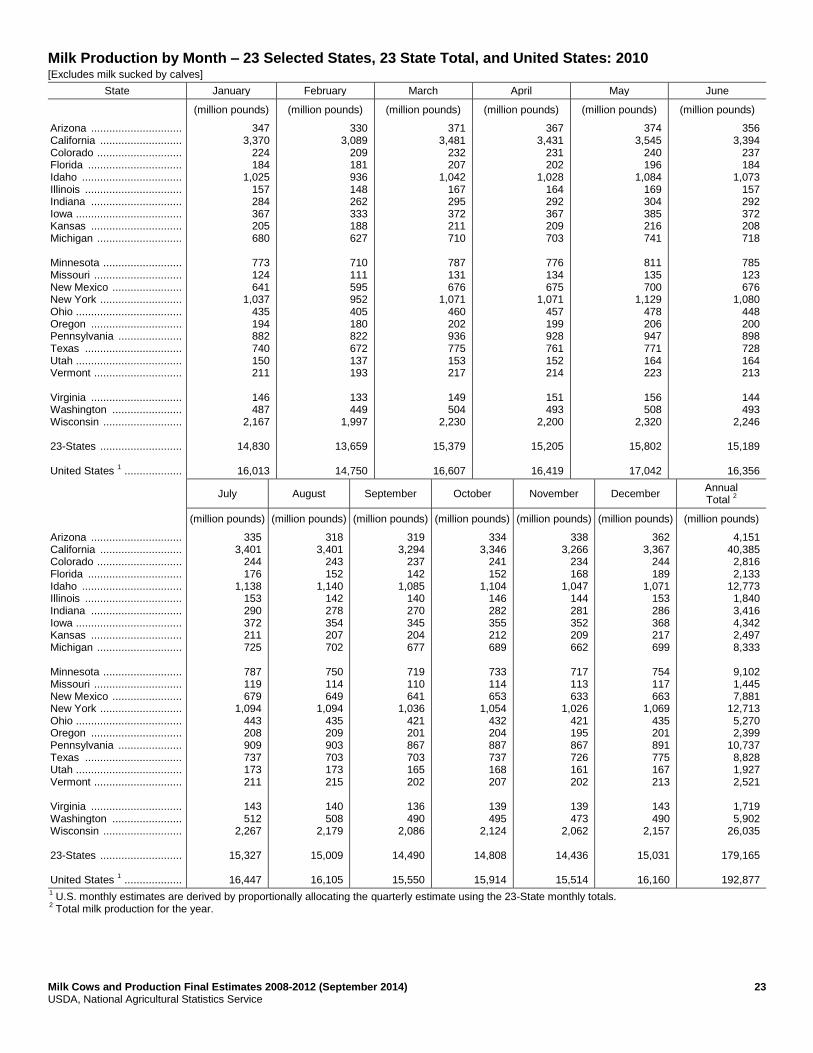
Milk Cows and Production Final Estimates 2008-2012 (September 2014) 23 USDA, National Agricultural Statistics Service
Milk Production by Month – 23 Selected States, 23 State Total, and United States: 2010 [Excludes milk sucked by calves]
State January February March April May June
(million pounds) (million pounds) (million pounds) (million pounds) (million pounds) (million pounds)
Arizona .............................. California ........................... Colorado ............................ Florida ............................... Idaho ................................. Illinois ................................ Indiana .............................. Iowa ................................... Kansas .............................. Michigan ............................ Minnesota .......................... Missouri ............................. New Mexico ....................... New York ........................... Ohio ................................... Oregon .............................. Pennsylvania ..................... Texas ................................ Utah ................................... Vermont ............................. Virginia .............................. Washington ....................... Wisconsin .......................... 23-States ........................... United States
1 ...................
347 3,370
224 184
1,025 157 284 367 205 680
773 124 641
1,037 435 194 882 740 150 211
146 487
2,167
14,830
16,013
330 3,089
209 181 936 148 262 333 188 627
710 111 595 952 405 180 822 672 137 193
133 449
1,997
13,659
14,750
371 3,481
232 207
1,042 167 295 372 211 710
787 131 676
1,071 460 202 936 775 153 217
149 504
2,230
15,379
16,607
367 3,431
231 202
1,028 164 292 367 209 703
776 134 675
1,071 457 199 928 761 152 214
151 493
2,200
15,205
16,419
374 3,545
240 196
1,084 169 304 385 216 741
811 135 700
1,129 478 206 947 771 164 223
156 508
2,320
15,802
17,042
356 3,394
237 184
1,073 157 292 372 208 718
785 123 676
1,080 448 200 898 728 164 213
144 493
2,246
15,189
16,356
July August September October November December Annual Total
2
(million pounds) (million pounds) (million pounds) (million pounds) (million pounds) (million pounds) (million pounds)
Arizona .............................. California ........................... Colorado ............................ Florida ............................... Idaho ................................. Illinois ................................ Indiana .............................. Iowa ................................... Kansas .............................. Michigan ............................ Minnesota .......................... Missouri ............................. New Mexico ....................... New York ........................... Ohio ................................... Oregon .............................. Pennsylvania ..................... Texas ................................ Utah ................................... Vermont ............................. Virginia .............................. Washington ....................... Wisconsin .......................... 23-States ........................... United States
1 ...................
335 3,401
244 176
1,138 153 290 372 211 725
787 119 679
1,094 443 208 909 737 173 211
143 512
2,267
15,327
16,447
318 3,401
243 152
1,140 142 278 354 207 702
750 114 649
1,094 435 209 903 703 173 215
140 508
2,179
15,009
16,105
319 3,294
237 142
1,085 140 270 345 204 677
719 110 641
1,036 421 201 867 703 165 202
136 490
2,086
14,490
15,550
334 3,346
241 152
1,104 146 282 355 212 689
733 114 653
1,054 432 204 887 737 168 207
139 495
2,124
14,808
15,914
338 3,266
234 168
1,047 144 281 352 209 662
717 113 633
1,026 421 195 867 726 161 202
139 473
2,062
14,436
15,514
362 3,367
244 189
1,071 153 286 368 217 699
754 117 663
1,069 435 201 891 775 167 213
143 490
2,157
15,031
16,160
4,151 40,385 2,816 2,133
12,773 1,840 3,416 4,342 2,497 8,333
9,102 1,445 7,881
12,713 5,270 2,399
10,737 8,828 1,927 2,521
1,719 5,902
26,035
179,165
192,877 1 U.S. monthly estimates are derived by proportionally allocating the quarterly estimate using the 23-State monthly totals.
2 Total milk production for the year.

24 Milk Cows and Production Final Estimates 2008-2012 (September 2014) USDA, National Agricultural Statistics Service
Milk Production by Month – 23 Selected States, 23 State Total, and United States: 2011 [Excludes milk sucked by calves]
State January February March April May June
(million pounds) (million pounds) (million pounds) (million pounds) (million pounds) (million pounds)
Arizona .............................. California ........................... Colorado ............................ Florida ................................ Idaho .................................. Illinois ................................. Indiana ............................... Iowa ................................... Kansas ............................... Michigan ............................ Minnesota .......................... Missouri ............................. New Mexico ....................... New York ........................... Ohio ................................... Oregon ............................... Pennsylvania ..................... Texas ................................. Utah ................................... Vermont ............................. Virginia ............................... Washington ........................ Wisconsin .......................... 23-States ........................... United States
1 ...................
374 3,390
243 206
1,066 158 296 372 218 711
766 118 680
1,083 439 202 891 797 164 217
147 498
2,188
15,224
16,396
354 3,161
221 199 968 145 271 336 197 652
698 108 612 988 407 185 820 731 150 198
137 457
2,000
13,995
15,075
408 3,590
252 222
1,081 164 311 376 223 723
779 128 699
1,104 447 208 929 829 169 221
155 514
2,241
15,773
16,990
397 3,519
250 207
1,077 160 307 369 220 708
760 131 693
1,080 434 206 915 816 167 215
152 509
2,190
15,482
16,657
398 3,675
257 205
1,144 162 314 379 226 743
786 131 713
1,125 450 217 934 841 177 223
152 536
2,279
16,067
17,279
368 3,511
253 194
1,132 149 295 360 217 713
753 116 689
1,080 419 211 870 803 175 212
139 524
2,195
15,378
16,514
July August September October November December Annual Total
2
(million pounds) (million pounds) (million pounds) (million pounds) (million pounds) (million pounds) (million pounds)
Arizona .............................. California ........................... Colorado ............................ Florida ................................ Idaho .................................. Illinois ................................. Indiana ............................... Iowa ................................... Kansas ............................... Michigan ............................ Minnesota .......................... Missouri ............................. New Mexico ....................... New York ........................... Ohio ................................... Oregon ............................... Pennsylvania ..................... Texas ................................. Utah ................................... Vermont ............................. Virginia ............................... Washington ........................ Wisconsin .......................... 23-States ........................... United States
1 ...................
351 3,535
257 181
1,193 141 289 344 216 712
722 107 695
1,092 420 220 872 798 183 214
138 545
2,174
15,399
16,478
339 3,502
258 167
1,181 141 295 354 215 710
733 105 681
1,089 425 216 881 781 181 212
140 541
2,199
15,346
16,425
334 3,312
251 155
1,117 140 286 345 210 686
708 105 669
1,037 415 205 846 774 173 203
135 515
2,117
14,738
15,780
358 3,428
256 162
1,119 148 297 358 217 710
725 112 697
1,052 429 208 863 813 176 209
139 523
2,161
15,160
16,272
356 3,343
245 175
1,065 148 287 351 211 688
707 112 673
1,025 420 197 842 790 169 202
138 494
2,100
14,738
15,820
376 3,496
256 196
1,108 158 305 379 215 722
753 115 676
1,083 439 204 884 809 177 212
147 513
2,214
15,437
16,569
4,413 41,462 2,999 2,269
13,251 1,814 3,553 4,323 2,585 8,478
8,890 1,388 8,177
12,838 5,144 2,479
10,547 9,582 2,061 2,538
1,719 6,169
26,058
182,737
196,255 1 U.S. monthly estimates are derived by proportionally allocating the quarterly estimate using the 23-State monthly totals.
2 Total milk production for the year.

Milk Cows and Production Final Estimates 2008-2012 (September 2014) 25 USDA, National Agricultural Statistics Service
Milk Production by Month – 23 Selected States, 23 State Total, and United States: 2012 [Excludes milk sucked by calves]
State January February March April May June
(million pounds) (million pounds) (million pounds) (million pounds) (million pounds) (million pounds)
Arizona .............................. California ........................... Colorado ............................ Florida ............................... Idaho ................................. Illinois ................................ Indiana .............................. Iowa ................................... Kansas .............................. Michigan ............................ Minnesota .......................... Missouri ............................. New Mexico ....................... New York ........................... Ohio ................................... Oregon .............................. Pennsylvania ..................... Texas ................................ Utah ................................... Vermont ............................. Virginia .............................. Washington ....................... Wisconsin .......................... 23-States ........................... United States
1 ...................
399 3,617
262 217
1,116 164 315 388 221 752
772 118 685
1,098 447 207 896 827 184 216
151 525
2,264
15,841
17,048
396 3,506
248 210
1,046 158 306 366 214 716
735 113 665
1,055 435 197 849 800 172 204
145 498
2,152
15,186
16,342
435 3,804
270 228
1,127 171 330 395 239 776
793 137 736
1,138 470 215 923 876 185 221
158 537
2,329
16,493
17,746
418 3,632
268 222
1,108 168 327 387 233 763
770 138 718
1,113 469 212 904 843 183 216
153 528
2,286
16,059
17,257
418 3,744
278 218
1,172 165 330 386 236 776
777 131 722
1,153 470 223 914 847 189 223
151 550
2,339
16,412
17,631
378 3,523
268 200
1,154 155 310 368 224 748
744 119 671
1,098 440 214 859 785 185 214
140 522
2,262
15,581
16,712
July August September October November December Annual Total
2
(million pounds) (million pounds) (million pounds) (million pounds) (million pounds) (million pounds) (million pounds)
Arizona .............................. California ........................... Colorado ............................ Florida ............................... Idaho ................................. Illinois ................................ Indiana .............................. Iowa ................................... Kansas .............................. Michigan ............................ Minnesota .......................... Missouri ............................. New Mexico ....................... New York ........................... Ohio ................................... Oregon .............................. Pennsylvania ..................... Texas ................................ Utah ................................... Vermont ............................. Virginia .............................. Washington ....................... Wisconsin .......................... 23-States ........................... United States
1 ...................
354 3,498
273 187
1,187 145 301 358 222 746
735 110 676
1,113 429 218 860 779 190 218
137 526
2,256
15,518
16,610
326 3,304
275 173
1,183 147 313 372 226 758
753 105 661
1,104 436 214 861 765 183 214
138 523
2,313
15,347
16,431
316 3,184
264 154
1,117 139 293 354 219 722
721 103 639
1,061 416 205 818 738 173 206
131 505
2,199
14,677
15,713
343 3,307
272 160
1,137 149 302 371 229 742
746 110 656
1,083 446 207 858 772 176 212
139 512
2,256
15,185
16,277
350 3,264
262 178
1,092 148 303 371 227 729
739 110 646
1,058 435 197 842 761 172 207
137 493
2,218
14,939
16,015
375 3,418
273 193
1,119 159 322 397 242 763
788 114 674
1,116 462 204 894 803 180 218
147 515
2,350
15,726
16,860
4,508 41,801 3,213 2,340
13,558 1,868 3,752 4,513 2,732 8,991
9,073 1,408 8,149
13,190 5,355 2,513
10,478 9,596 2,172 2,569
1,727 6,234
27,224
186,964
200,642 1 U.S. monthly estimates are derived by proportionally allocating the quarterly estimate using the 23-State monthly totals.
2 Total milk production for the year.

26 Milk Cows and Production Final Estimates 2008-2012 (September 2014) USDA, National Agricultural Statistics Service
Milk Cows and Production by Quarter – States and United States: 2008 [May not add due to rounding]
State Milk cows
1 Milk production
2
Jan-Mar Apr-Jun Jul-Sep Oct-Dec Jan-Mar Apr-Jun Jul-Sep Oct-Dec
(1,000 head) (1,000 head) (1,000 head) (1,000 head) (million pounds)
(million pounds)
(million pounds)
(million pounds)
Alabama ................ Alaska .................... Arizona .................. Arkansas ................ California ............... Colorado ................ Connecticut ............ Delaware ............... Florida .................... Georgia .................. Hawaii .................... Idaho ...................... Illinois ..................... Indiana ................... Iowa ....................... Kansas ................... Kentucky ................ Louisiana ............... Maine ..................... Maryland ................ Massachusetts ....... Michigan ................ Minnesota .............. Mississippi ............. Missouri ................. Montana ................. Nebraska ............... Nevada .................. New Hampshire ..... New Jersey ............ New Mexico ........... New York ............... North Carolina ........ North Dakota .......... Ohio ....................... Oklahoma .............. Oregon ................... Pennsylvania ......... Rhode Island .......... South Carolina ....... South Dakota ......... Tennessee ............. Texas ..................... Utah ....................... Vermont ................. Virginia ................... Washington ............ West Virginia .......... Wisconsin .............. Wyoming ................ United States .........
12.0 0.6
185.0 16.0
1,840.0 126.0 19.0 6.5
120.0 77.0
2.0
537.0 102.0 167.0 215.0 115.0 91.0 27.0 33.0 57.0
15.0
344.0 463.0 21.0
110.0 17.0 57.0 28.0 15.0 10.0
339.0 626.0 48.0 26.0
279.0 66.0
114.0 551.0
1.1 18.0
87.0 61.0
405.0 85.0
140.0 98.0
244.0 12.0
1,250.0 7.0
9,285.0
12.0 0.6
186.0 15.0
1,846.0 127.0 19.0 6.5
120.0 77.0
1.7
548.0 102.0 167.0 212.0 115.0 91.0 26.0 33.0 56.0
15.0
349.0 463.0 21.0
111.0 17.0 57.0 28.0 15.0 10.0
341.0 626.0 47.0 26.0
282.0 64.0
113.0 548.0
1.1 18.0
89.0 59.0
413.0 85.0
140.0 98.0
244.0 12.0
1,251.0 7.0
9,311.0
12.0 0.6
185.0 14.0
1,846.0 130.0 19.0 6.5
120.0 75.0
1.6
555.0 102.0 166.0 212.0 117.0 88.0 26.0 33.0 56.0
14.5
352.0 465.0 20.0
111.0 17.0 59.0 28.0 15.0 9.5
338.0 626.0 46.0 26.0
280.0 63.0
115.0 547.0
1.1 18.0
91.0 58.0
424.0 85.0
140.0 97.0
245.0 12.0
1,252.0 7.0
9,327.0
12.0 0.6
188.0 14.0
1,843.0 130.0 19.0 6.5
119.0 75.0
1.6
554.0 102.0 167.0 213.0 121.0 87.0 25.0 33.0 56.0
14.5
353.0 467.0 19.0
110.0 16.0 59.0 29.0 15.0 9.5
334.0 625.0 46.0 25.0
277.0 63.0
115.0 548.0
1.1 18.0
93.0 59.0
429.0 85.0
139.0 97.0
245.0 12.0
1,254.0 7.0
9,331.0
53.0 2.1
1,144.0 52.0
10,460.0 709.0 94.0 30.0
569.0 361.0
4.7
2,957.0 486.0 837.0
1,073.0 593.0 323.0 95.0
147.0 271.0
64.0
1,907.0 2,204.0
86.0 407.0 76.0
265.0 161.0 76.0 44.0
1,922.0 3,092.0
239.0 107.0
1,270.0 277.0 566.0
2,671.0 4.8
90.0
426.0 256.0
2,072.0 427.0 653.0 451.0
1,416.0 46.0
6,052.0 33.6
47,622.0
51.0 1.8
1,165.0 52.0
10,515.0 744.0 94.0 29.0
556.0 364.0
4.6
3,114.0 488.0 841.0
1,072.0 601.0 324.0 90.0
154.0 267.0
66.0
1,968.0 2,228.0
80.0 435.0 80.0
268.0 157.0 77.0 45.0
2,049.0 3,205.0
233.0 107.0
1,352.0 268.0 576.0
2,750.0 5.2
88.0
446.0 255.0
2,173.0 451.0 661.0 447.0
1,451.0 46.0
6,232.0 34.5
48,761.0
38.0 1.7
977.0 41.0
10,089.0 744.0 88.0 25.0
454.0 305.0
4.4
3,219.0 437.0 794.0
1,034.0 597.0 272.0 66.0
154.0 242.0
63.0
1,954.0 2,163.0
62.0 376.0 80.0
272.0 164.0 74.0 40.0
1,956.0 3,111.0
207.0 104.0
1,267.0 255.0 564.0
2,599.0 5.0
71.0
458.0 212.0
2,050.0 462.0 641.0 407.0
1,444.0 45.0
6,137.0 34.1
46,859.0
42.0 1.6
1,065.0 41.0
10,139.0 738.0 88.0 26.0
482.0 325.0
4.8
3,025.0 451.0 815.0
1,057.0 624.0 291.0 68.0
148.0 249.0
61.0
1,934.0 2,187.0
63.0 397.0 77.0
278.0 171.0 72.0 40.0
1,938.0 3,024.0
213.0 100.0
1,246.0 261.0 548.0
2,555.0 4.9
74.0
466.0 225.0
2,121.0 444.0 621.0 421.0
1,385.0 44.0
6,051.0 33.5
46,736.0
1 Quarterly average includes dry cows, excludes heifers not yet fresh.
2 Excludes milk sucked by calves.

Milk Cows and Production Final Estimates 2008-2012 (September 2014) 27 USDA, National Agricultural Statistics Service
Milk Cows and Production by Quarter – States and United States: 2009 [May not add due to rounding]
State Milk cows
1 Milk production
2
Jan-Mar Apr-Jun Jul-Sep Oct-Dec Jan-Mar Apr-Jun Jul-Sep Oct-Dec
(1,000 head) (1,000 head) (1,000 head) (1,000 head) (million pounds)
(million pounds)
(million pounds)
(million pounds)
Alabama ................ Alaska ................... Arizona .................. Arkansas ............... California ............... Colorado ................ Connecticut ........... Delaware ............... Florida ................... Georgia ................. Hawaii ................... Idaho ..................... Illinois .................... Indiana .................. Iowa ....................... Kansas .................. Kentucky ................ Louisiana ............... Maine .................... Maryland ................ Massachusetts ....... Michigan ................ Minnesota .............. Mississippi ............. Missouri ................. Montana ................ Nebraska ............... Nevada .................. New Hampshire ..... New Jersey ............ New Mexico ........... New York ............... North Carolina ....... North Dakota ......... Ohio ....................... Oklahoma .............. Oregon .................. Pennsylvania ......... Rhode Island ......... South Carolina ....... South Dakota ......... Tennessee ............. Texas .................... Utah ....................... Vermont ................. Virginia .................. Washington ........... West Virginia ......... Wisconsin .............. Wyoming ............... United States .........
11.0 0.6
189.0 13.5
1,826.0 128.0 18.5 6.5
117.0 76.0
1.5
551.0 102.0 167.0 213.0 124.0 86.0 24.0 33.0 56.0
14.5
354.0 468.0 19.0
108.0 15.0 61.0 28.0 15.0 9.5
333.0 623.0 46.0 25.0
277.0 62.0
114.0 550.0
1.1 17.0
94.0 58.0
430.0 85.0
136.0 97.0
240.0 11.0
1,255.0 5.0
9,295.0
11.0 0.6
183.0 13.0
1,813.0 127.0 18.5 6.0
117.0 77.0
1.5
551.0 102.0 168.0 213.0 120.0 84.0 23.0 33.0 56.0
14.5
357.0 469.0 18.5
110.0 15.0 62.0 28.0 15.0 9.0
330.0 623.0 46.0 23.0
278.0 60.0
114.0 547.0
1.1 17.5
95.0 56.0
429.0 84.0
136.0 96.0
239.0 11.0
1,256.0 5.0
9,262.0
11.0 0.6
170.0 13.0
1,780.0 121.0 18.5 5.5
114.0 78.0
1.5
548.0 102.0 168.0 214.0 116.0 83.0 22.0 33.0 55.0
14.0
355.0 469.0 17.5
106.0 15.0 61.0 28.0 15.0 9.0
320.0 619.0 45.0 22.0
278.0 58.0
114.0 544.0
1.1 17.5
95.0 55.0
420.0 83.0
135.0 96.0
238.0 11.0
1,257.0 6.0
9,158.0
11.0 0.6
167.0 13.0
1,765.0 116.0 18.5 6.0
113.0 78.0
1.6
548.0 101.0 169.0 214.0 113.0 81.0 21.0 33.0 54.0
14.0
354.0 469.0 17.0
104.0 15.0 60.0 28.0 15.0 8.5
317.0 612.0 44.0 22.0
274.0 57.0
114.0 539.0
1.1 17.5
93.0 54.0
412.0 83.0
134.0 95.0
241.0 10.0
1,258.0 6.0
9,092.0
48.0 1.5
1,129.0 43.0
10,097.0 731.0 91.0 28.0
582.0 378.0
5.3
2,915.0 473.0 836.0
1,041.0 654.0 313.0 82.0
146.0 260.0
62.0
1,935.0 2,216.0
74.0 403.0 75.0
296.0 152.0 73.0 42.0
2,002.0 3,060.0
234.0 98.0
1,271.0 265.0 558.0
2,637.0 5.0
87.0
460.0 244.0
2,271.0 427.0 617.0 443.0
1,350.0 41.0
6,057.0 23.3
47,332.0
45.0 1.5
1,107.0 46.0
10,228.0 746.0 90.0 27.0
578.0 379.0
5.5
3,080.0 485.0 869.0
1,090.0 640.0 320.0 76.0
152.0 262.0
64.0
2,037.0 2,303.0
70.0 421.0 76.0
308.0 155.0 76.0 41.0
2,069.0 3,233.0
235.0 98.0
1,346.0 260.0 580.0
2,723.0 5.2
86.0
483.0 246.0
2,299.0 445.0 633.0 451.0
1,414.0 42.0
6,401.0 22.9
48,850.0
35.0 1.5
896.0 38.0
9,561.0 702.0 86.0 23.0
454.0 320.0
5.2
3,135.0 451.0 841.0
1,087.0 598.0 280.0 55.0
152.0 238.0
61.0
2,021.0 2,268.0
51.0 371.0 75.0
302.0 154.0 73.0 39.0
1,928.0 3,121.0
207.0 96.0
1,306.0 238.0 563.0
2,617.0 4.8
74.0
481.0 210.0
2,116.0 454.0 616.0 419.0
1,411.0 41.0
6,476.0 29.2
46,782.0
36.0 1.5
950.0 38.0
9,626.0 658.0 86.0 24.0
466.0 323.0
5.3
3,020.0 453.0 837.0
1,083.0 596.0 279.0 58.0
146.0 244.0
59.0
1,975.0 2,232.0
55.0 373.0 73.0
292.0 152.0 71.0 36.0
1,905.0 3,010.0
208.0 95.0
1,269.0 239.0 547.0
2,574.0 4.6
78.0
468.0 209.0
2,154.0 445.0 603.0 423.0
1,386.0 38.0
6,305.0 29.3
46,238.0
1 Quarterly average includes dry cows, excludes heifers not yet fresh.
2 Excludes milk sucked by calves.

28 Milk Cows and Production Final Estimates 2008-2012 (September 2014) USDA, National Agricultural Statistics Service
Milk Cows and Production by Quarter – States and United States: 2010 [May not add due to rounding]
State Milk cows
1 Milk production
2
Jan-Mar Apr-Jun Jul-Sep Oct-Dec Jan-Mar Apr-Jun Jul-Sep Oct-Dec
(1,000 head) (1,000 head) (1,000 head) (1,000 head) (million pounds)
(million pounds)
(million pounds)
(million pounds)
Alabama ................ Alaska .................... Arizona .................. Arkansas ................ California ............... Colorado ................ Connecticut ............ Delaware ............... Florida .................... Georgia .................. Hawaii .................... Idaho ...................... Illinois ..................... Indiana ................... Iowa ....................... Kansas ................... Kentucky ................ Louisiana ............... Maine ..................... Maryland ................ Massachusetts ....... Michigan ................ Minnesota .............. Mississippi ............. Missouri ................. Montana ................. Nebraska ............... Nevada .................. New Hampshire ..... New Jersey ............ New Mexico ........... New York ............... North Carolina ........ North Dakota .......... Ohio ....................... Oklahoma .............. Oregon ................... Pennsylvania ......... Rhode Island .......... South Carolina ....... South Dakota ......... Tennessee ............. Texas ..................... Utah ....................... Vermont ................. Virginia ................... Washington ............ West Virginia .......... Wisconsin .............. Wyoming ................ United States .........
11.0 0.6
170.0 13.0
1,759.0 116.0 18.5 5.5
113.0 79.0
1.9
553.0 101.0 169.0 213.0 116.0 79.0 20.0 32.0 54.0
14.0
355.0 470.0 17.0
101.0 14.0 59.0 28.0 15.0 8.5
319.0 610.0 43.0 21.0
272.0 57.0
115.0 541.0
1.1 17.0
93.0 53.0
410.0 84.0
135.0 95.0
247.0 10.0
1,260.0 6.0
9,095.0
11.0 0.6
173.0 12.5
1,755.0 117.0 19.0 5.5
115.0 79.0
1.9
559.0 101.0 170.0 212.0 117.0 79.0 20.0 32.0 54.0
14.0
358.0 470.0 17.0
101.0 14.0 59.0 28.0 15.0 8.0
324.0 610.0 44.0 21.0
271.0 57.0
116.0 541.0
1.1 16.5
93.0 53.0
410.0 87.0
137.0 95.0
250.0 10.0
1,261.0 6.0
9,121.0
11.0 0.6
180.0 12.0
1,753.0 120.0 19.0 5.0
114.0 78.0
1.9
570.0 99.0
170.0 209.0 120.0 78.0 19.0 32.0 53.0
13.5
359.0 470.0 16.0 99.0 14.0 58.0 28.0 15.0 7.5
320.0 611.0 44.0 21.0
270.0 54.0
121.0 541.0
1.1 16.0
91.0 52.0
415.0 91.0
136.0 95.0
252.0 10.0
1,263.0 6.0
9,135.0
11.0 0.5
183.0 12.0
1,751.0 122.0 19.0 5.0
114.0 78.0
2.0
573.0 98.0
171.0 207.0 121.0 77.0 19.0 32.0 53.0
13.5
360.0 470.0 16.0 96.0 14.0 58.0 28.0 15.0 7.5
319.0 611.0 44.0 20.0
270.0 54.0
121.0 542.0
1.1 16.0
90.0 51.0
417.0 91.0
136.0 95.0
253.0 10.0
1,265.0 6.0
9,139.0
44.0 1.5
1,048.0 41.0
9,940.0 665.0 91.0 24.0
572.0 371.0
6.3
3,003.0 472.0 841.0
1,072.0 604.0 296.0 67.0
144.0 257.0
62.0
2,017.0 2,270.0
63.0 366.0 72.0
290.0 160.0 74.0 37.0
1,912.0 3,060.0
216.0 94.0
1,300.0 249.0 576.0
2,640.0 4.6
82.0
466.0 222.0
2,187.0 440.0 621.0 428.0
1,440.0 39.0
6,394.0 28.6
47,370.0
44.0 1.9
1,097.0 43.0
10,370.0 708.0 95.0 24.0
582.0 381.0
6.6
3,185.0 490.0 888.0
1,124.0 633.0 318.0 66.0
150.0 259.0
64.0
2,162.0 2,372.0
63.0 392.0 75.0
300.0 171.0 77.0 36.0
2,051.0 3,280.0
229.0 99.0
1,383.0 252.0 605.0
2,773.0 5.2
78.0
482.0 232.0
2,260.0 480.0 650.0 451.0
1,494.0 40.0
6,766.0 29.5
49,817.0
33.0 2.1
972.0 34.0
10,096.0 724.0 89.0 21.0
470.0 314.0
6.2
3,363.0 435.0 838.0
1,071.0 622.0 262.0 49.0
148.0 241.0
59.0
2,104.0 2,256.0
47.0 343.0 72.0
290.0 171.0 72.0 34.0
1,969.0 3,224.0
207.0 98.0
1,299.0 224.0 618.0
2,679.0 4.9
60.0
473.0 194.0
2,143.0 511.0 628.0 419.0
1,510.0 39.0
6,532.0 31.4
48,102.0
35.0 1.6
1,034.0 35.0
9,979.0 719.0 89.0 21.0
509.0 329.0
6.2
3,222.0 443.0 849.0
1,075.0 638.0 276.0 53.0
145.0 244.0
57.0
2,050.0 2,204.0
50.0 344.0 70.0
288.0 162.0 71.0 33.0
1,949.0 3,149.0
214.0 93.0
1,288.0 234.0 600.0
2,645.0 4.8
66.0
463.0 202.0
2,238.0 496.0 622.0 421.0
1,458.0 39.0
6,343.0 30.9
47,588.0
1 Quarterly average includes dry cows, excludes heifers not yet fresh.
2 Excludes milk sucked by calves.

Milk Cows and Production Final Estimates 2008-2012 (September 2014) 29 USDA, National Agricultural Statistics Service
Milk Cows and Production by Quarter – States and United States: 2011 [May not add due to rounding]
State Milk cows
1 Milk production
2
Jan-Mar Apr-Jun Jul-Sep Oct-Dec Jan-Mar Apr-Jun Jul-Sep Oct-Dec
(1,000 head) (1,000 head) (1,000 head) (1,000 head) (million pounds)
(million pounds)
(million pounds)
(million pounds)
Alabama ................ Alaska ................... Arizona .................. Arkansas ............... California ............... Colorado ................ Connecticut ........... Delaware ............... Florida ................... Georgia ................. Hawaii ................... Idaho ..................... Illinois .................... Indiana .................. Iowa ....................... Kansas .................. Kentucky ................ Louisiana ............... Maine .................... Maryland ................ Massachusetts ....... Michigan ................ Minnesota .............. Mississippi ............. Missouri ................. Montana ................ Nebraska ............... Nevada .................. New Hampshire ..... New Jersey ............ New Mexico ........... New York ............... North Carolina ....... North Dakota ......... Ohio ....................... Oklahoma .............. Oregon .................. Pennsylvania ......... Rhode Island ......... South Carolina ....... South Dakota ......... Tennessee ............. Texas .................... Utah ....................... Vermont ................. Virginia .................. Washington ........... West Virginia ......... Wisconsin .............. Wyoming ............... United States .........
11.0 0.6
186.0 12.0
1,756.0 124.0 18.5 5.0
118.0 80.0
1.9
574.0 98.0
172.0 209.0 122.0 76.0 19.0 32.0 53.0
13.5
364.0 470.0 15.0 95.0 14.0 57.0 29.0 15.0 8.0
324.0 610.0 45.0 20.0
270.0 54.0
119.0 543.0
1.1 16.0
91.0 50.0
425.0 92.0
135.0 95.0
252.0 10.0
1,266.0 6.0
9,173.0
10.5 0.5
186.0 12.0
1,767.0 126.0 18.5 5.0
119.0 80.0
1.9
578.0 98.0
171.0 205.0 122.0 76.0 18.0 32.0 52.0
13.0
363.0 468.0 14.0 96.0 14.0 57.0 29.0 14.5 8.0
327.0 610.0 45.0 19.0
267.0 53.0
121.0 543.0
1.1 16.0
92.0 49.0
430.0 93.0
135.0 96.0
260.0 10.0
1,266.0 6.0
9,194.0
10.0 0.5
187.0 11.0
1,774.0 129.0 18.5 5.0
119.0 78.0
1.9
582.0 98.0
172.0 200.0 123.0 75.0 18.0 32.0 52.0
12.0
366.0 467.0 14.0 95.0 14.0 57.0 29.0 14.0 7.5
330.0 610.0 45.0 19.0
267.0 52.0
123.0 539.0
1.1 16.0
90.0 49.0
435.0 94.0
134.0 96.0
265.0 10.0
1,264.0 6.0
9,207.0
10.0 0.5
192.0 11.0
1,778.0 131.0 18.5 5.0
120.0 78.0
1.9
580.0 98.0
173.0 202.0 123.0 75.0 18.0 32.0 52.0
12.0
369.0 465.0 14.0 94.0 14.0 57.0 29.0 14.0 7.5
333.0 610.0 45.0 18.0
269.0 52.0
122.0 538.0
1.1 16.0
90.0 50.0
435.0 94.0
134.0 96.0
264.0 10.0
1,265.0 6.0
9,223.0
42.0 1.8
1,136.0 40.0
10,141.0 716.0 92.0 24.3
627.0 380.0
6.9
3,115.0 467.0 878.0
1,084.0 638.0 285.0 69.0
147.0 253.0
57.0
2,086.0 2,243.0
59.0 354.0 69.0
290.0 159.0 75.0 35.0
1,991.0 3,175.0
230.0 88.0
1,293.0 241.0 595.0
2,640.0 4.8
75.0
460.0 216.0
2,357.0 483.0 636.0 439.0
1,469.0 39.0
6,429.0 30.4
48,461.0
39.0 1.7
1,163.0 40.0
10,705.0 760.0 93.0 23.5
606.0 382.0
7.3
3,353.0 471.0 916.0
1,108.0 663.0 296.0 61.0
152.0 251.0
58.0
2,164.0 2,299.0
55.0 378.0 72.0
301.0 171.0 74.0 35.0
2,095.0 3,285.0
234.0 89.0
1,303.0 244.0 634.0
2,719.0 5.2
74.0
480.0 212.0
2,460.0 519.0 650.0 443.0
1,569.0 41.0
6,664.0 31.5
50,450.0
30.0 1.7
1,024.0 30.0
10,349.0 766.0 88.0 21.7
503.0 330.0
6.8
3,491.0 422.0 870.0
1,043.0 641.0 243.0 48.0
150.0 230.0
53.0
2,108.0 2,163.0
43.0 317.0 74.0
288.0 170.0 69.0 33.0
2,045.0 3,218.0
213.0 85.0
1,260.0 215.0 641.0
2,599.0 4.9
60.0
461.0 182.0
2,353.0 537.0 629.0 413.0
1,601.0 39.0
6,490.0 31.2
48,683.0
32.0 1.7
1,090.0 33.0
10,267.0 757.0 88.0 22.0
533.0 358.0
6.4
3,292.0 454.0 889.0
1,088.0 643.0 266.0 54.0
149.0 236.0
52.0
2,120.0 2,185.0
47.0 339.0 73.0
294.0 166.0 68.0 32.0
2,046.0 3,160.0
227.0 83.0
1,288.0 223.0 609.0
2,589.0 4.8
70.0
472.0 200.0
2,412.0 522.0 623.0 424.0
1,530.0 38.0
6,475.0 30.0
48,661.0
1 Quarterly average includes dry cows, excludes heifers not yet fresh.
2 Excludes milk sucked by calves.
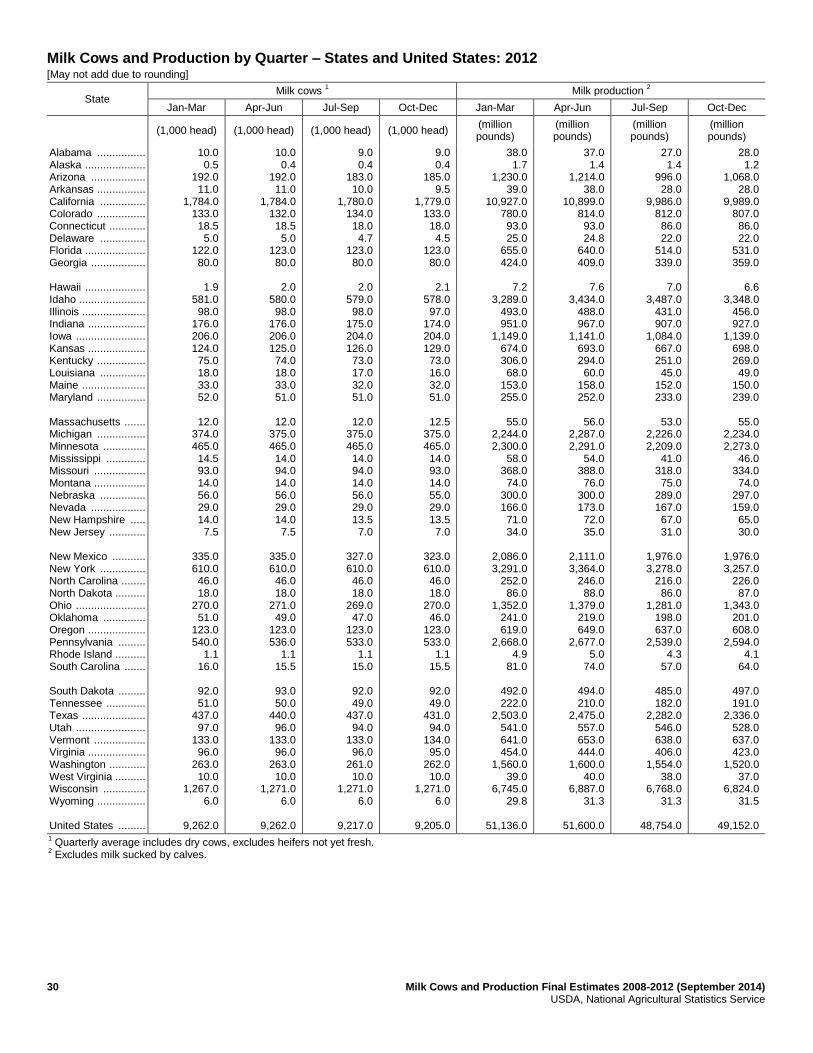
30 Milk Cows and Production Final Estimates 2008-2012 (September 2014) USDA, National Agricultural Statistics Service
Milk Cows and Production by Quarter – States and United States: 2012 [May not add due to rounding]
State Milk cows
1 Milk production
2
Jan-Mar Apr-Jun Jul-Sep Oct-Dec Jan-Mar Apr-Jun Jul-Sep Oct-Dec
(1,000 head) (1,000 head) (1,000 head) (1,000 head) (million pounds)
(million pounds)
(million pounds)
(million pounds)
Alabama ................ Alaska .................... Arizona .................. Arkansas ................ California ............... Colorado ................ Connecticut ............ Delaware ............... Florida .................... Georgia .................. Hawaii .................... Idaho ...................... Illinois ..................... Indiana ................... Iowa ....................... Kansas ................... Kentucky ................ Louisiana ............... Maine ..................... Maryland ................ Massachusetts ....... Michigan ................ Minnesota .............. Mississippi ............. Missouri ................. Montana ................. Nebraska ............... Nevada .................. New Hampshire ..... New Jersey ............ New Mexico ........... New York ............... North Carolina ........ North Dakota .......... Ohio ....................... Oklahoma .............. Oregon ................... Pennsylvania ......... Rhode Island .......... South Carolina ....... South Dakota ......... Tennessee ............. Texas ..................... Utah ....................... Vermont ................. Virginia ................... Washington ............ West Virginia .......... Wisconsin .............. Wyoming ................ United States .........
10.0 0.5
192.0 11.0
1,784.0 133.0 18.5 5.0
122.0 80.0
1.9
581.0 98.0
176.0 206.0 124.0 75.0 18.0 33.0 52.0
12.0
374.0 465.0 14.5 93.0 14.0 56.0 29.0 14.0 7.5
335.0 610.0 46.0 18.0
270.0 51.0
123.0 540.0
1.1 16.0
92.0 51.0
437.0 97.0
133.0 96.0
263.0 10.0
1,267.0 6.0
9,262.0
10.0 0.4
192.0 11.0
1,784.0 132.0 18.5 5.0
123.0 80.0
2.0
580.0 98.0
176.0 206.0 125.0 74.0 18.0 33.0 51.0
12.0
375.0 465.0 14.0 94.0 14.0 56.0 29.0 14.0 7.5
335.0 610.0 46.0 18.0
271.0 49.0
123.0 536.0
1.1 15.5
93.0 50.0
440.0 96.0
133.0 96.0
263.0 10.0
1,271.0 6.0
9,262.0
9.0 0.4
183.0 10.0
1,780.0 134.0 18.0 4.7
123.0 80.0
2.0
579.0 98.0
175.0 204.0 126.0 73.0 17.0 32.0 51.0
12.0
375.0 465.0 14.0 94.0 14.0 56.0 29.0 13.5 7.0
327.0 610.0 46.0 18.0
269.0 47.0
123.0 533.0
1.1 15.0
92.0 49.0
437.0 94.0
133.0 96.0
261.0 10.0
1,271.0 6.0
9,217.0
9.0 0.4
185.0 9.5
1,779.0 133.0 18.0 4.5
123.0 80.0
2.1
578.0 97.0
174.0 204.0 129.0 73.0 16.0 32.0 51.0
12.5
375.0 465.0 14.0 93.0 14.0 55.0 29.0 13.5 7.0
323.0 610.0 46.0 18.0
270.0 46.0
123.0 533.0
1.1 15.5
92.0 49.0
431.0 94.0
134.0 95.0
262.0 10.0
1,271.0 6.0
9,205.0
38.0 1.7
1,230.0 39.0
10,927.0 780.0 93.0 25.0
655.0 424.0
7.2
3,289.0 493.0 951.0
1,149.0 674.0 306.0 68.0
153.0 255.0
55.0
2,244.0 2,300.0
58.0 368.0 74.0
300.0 166.0 71.0 34.0
2,086.0 3,291.0
252.0 86.0
1,352.0 241.0 619.0
2,668.0 4.9
81.0
492.0 222.0
2,503.0 541.0 641.0 454.0
1,560.0 39.0
6,745.0 29.8
51,136.0
37.0 1.4
1,214.0 38.0
10,899.0 814.0 93.0 24.8
640.0 409.0
7.6
3,434.0 488.0 967.0
1,141.0 693.0 294.0 60.0
158.0 252.0
56.0
2,287.0 2,291.0
54.0 388.0 76.0
300.0 173.0 72.0 35.0
2,111.0 3,364.0
246.0 88.0
1,379.0 219.0 649.0
2,677.0 5.0
74.0
494.0 210.0
2,475.0 557.0 653.0 444.0
1,600.0 40.0
6,887.0 31.3
51,600.0
27.0 1.4
996.0 28.0
9,986.0 812.0 86.0 22.0
514.0 339.0
7.0
3,487.0 431.0 907.0
1,084.0 667.0 251.0 45.0
152.0 233.0
53.0
2,226.0 2,209.0
41.0 318.0 75.0
289.0 167.0 67.0 31.0
1,976.0 3,278.0
216.0 86.0
1,281.0 198.0 637.0
2,539.0 4.3
57.0
485.0 182.0
2,282.0 546.0 638.0 406.0
1,554.0 38.0
6,768.0 31.3
48,754.0
28.0 1.2
1,068.0 28.0
9,989.0 807.0 86.0 22.0
531.0 359.0
6.6
3,348.0 456.0 927.0
1,139.0 698.0 269.0 49.0
150.0 239.0
55.0
2,234.0 2,273.0
46.0 334.0 74.0
297.0 159.0 65.0 30.0
1,976.0 3,257.0
226.0 87.0
1,343.0 201.0 608.0
2,594.0 4.1
64.0
497.0 191.0
2,336.0 528.0 637.0 423.0
1,520.0 37.0
6,824.0 31.5
49,152.0
1 Quarterly average includes dry cows, excludes heifers not yet fresh.
2 Excludes milk sucked by calves.

Milk Cows and Production Final Estimates 2008-2012 (September 2014) 31 USDA, National Agricultural Statistics Service
Information Contacts
Listed below are the commodity specialists in the Livestock Branch of the National Agricultural Statistics Service to
contact for additional information. E-mail inquiries may be sent to [email protected].
Dan Kerestes, Chief, Livestock Branch .......................................................................................................... (202) 720-3570
Scott Hollis, Head, Livestock Section ............................................................................................................ (202) 690-2424
Travis Averill – Cattle, Cattle on Feed ..................................................................................................... (202) 720-3040
Doug Bounds – Hogs and Pigs ................................................................................................................. (202) 720-3106
Donnie Fike – Dairy Products .................................................................................................................. (202) 690-3236
Tiffany Hora – Livestock Slaughter ......................................................................................................... (515) 284-4340
Mike Miller – Milk Production and Milk Cows ....................................................................................... (202) 720-3278
Vacant – Sheep and Goats ......................................................................................................................... (202) 720-3570

Access to NASS Reports
For your convenience, you may access NASS reports and products the following ways:
All reports are available electronically, at no cost, on the NASS web site: http://www.nass.usda.gov.
Both national and state specific reports are available via a free e-mail subscription. To set-up this free
subscription, visit http://www.nass.usda.gov and in the “Follow NASS” box under “Receive reports by Email,”
click on “National” or “State” to select the reports you would like to receive.
For more information on NASS surveys and reports, call the NASS Agricultural Statistics Hotline at (800) 727-9540,
7:30 a.m. to 4:00 p.m. ET, or e-mail: [email protected].
The U.S. Department of Agriculture (USDA) prohibits discrimination against its customers, employees, and
applicants for employment on the bases of race, color, national origin, age, disability, sex, gender identity,
religion, reprisal, and where applicable, political beliefs, marital status, familial or parental status, sexual
orientation, or all or part of an individual's income is derived from any public assistance program, or protected
genetic information in employment or in any program or activity conducted or funded by the Department. (Not
all prohibited bases will apply to all programs and/or employment activities.)
If you wish to file a Civil Rights program complaint of discrimination, complete the USDA Program
Discrimination Complaint Form (PDF), found online at http://www.ascr.usda.gov/complaint_filing_cust.html,
or at any USDA office, or call (866) 632-9992 to request the form. You may also write a letter containing all of
the information requested in the form. Send your completed complaint form or letter to us by mail at U.S.
Department of Agriculture, Director, Office of Adjudication, 1400 Independence Avenue, S.W., Washington,
D.C. 20250-9410, by fax (202) 690-7442 or e-mail at [email protected].

Milk Cows and Production Final Estimates 2008-2012 (September 2014) 33 USDA, National Agricultural Statistics Service
Statistical Bulletin Publication Schedule
Statistical Bulletins (SB): The National Agricultural Statistics Service will issue a series of nineteen bulletins containing
final estimates for agricultural data series based on the review of the 2012 Census of Agriculture and other information.
The product number, bulletin title, and tentative release dates are as follows.
SB1030 Farms and Land in Farms – Final Estimates 2008-2012 05/28/14
SB1031 Agricultural Land Values – Final Estimates 2009-2013 06/19/14
SB1032 Citrus Fruits – Final Estimates 2008-2012 08/26/14
SB1033 Vegetables – Final Estimates 2008-2012 08/26/14
SB1034 Cattle – Final Estimates 2009-2013 09/04/14
SB1035 Hogs and Pigs – Final Estimates 2008-2012 09/04/14
SB1036 Milk Cows and Production – Final Estimates 2008-2012 09/04/14
SB1037 Sheep and Goats – Final Estimates 2009-2013 09/04/14
SB1038 Chickens and Eggs – Final Estimates 2008-2012 09/04/14
SB1039 Honey – Final Estimates 2008-2012 09/04/14
SB1040 Meat Animals, PDI – Final Estimates 2008-2012 10/29/14
SB1041 Milk Disposition and Income – Final Estimates 2008-2012 10/29/14
SB1042 Poultry Production and Value – Final Estimates 2008-2012 10/29/14
SB1043 Noncitrus Fruits and Nuts – Final Estimates 2008-2012 10/30/14
SB1044 Field Crops – Final Estimates 2008-2012 11/03/14
SB1045 Rice Stocks – Final Estimates 2008-2013 11/03/14
SB1046 Stocks of Grains, Oilseeds, and Hay – Final Estimates 2008-2013 11/03/14
SB1047 Potatoes and Sweet Potatoes – Final Estimates 2008-2012 11/03/14
SB1048 Crop Values – Final Estimates 2008-2012 11/03/14
Agricultural Census Publications: The U. S. Department of Agriculture's National Agricultural Statistics Service
(NASS) released several products from the 2012 Census of Agriculture on May 2, 2014. The Census is the leading source
of statistics about the Nation’s agricultural production and the only source of consistent, comparable data at the county,
State, and national levels. The Census includes all places from which $1,000 or more of agricultural products, including
government payments, were produced and sold, or normally would have been sold, during the census year. Census
publications also include demographic items such as sex of operator, residence on or off the farm, days worked off farm,
years present on farm, age group categories, race, and number of persons living in each household.