Milk Adulteration with Melamine - Screening, Testing … · Milk Adulteration with Melamine –...
6
Milk Adulteration with Melamine – Screening, Testing and Real-Time Detection The adulteration of protein-based food products with melamine is now a well-known issue. Five years ago, the increasing number of renal failures in dogs and cats alerted the authorities to a problem in the pet food supply chain. We now know this was due to the mixture of melamine and cyanuric acid found inside pet food 1 . These chemicals were introduced into the pet food in China by food ingredient producers with the intent to exploit the long-standing system of payment for ingredients. Rather than payment by weight, which was often exploited throughout history, the food industry for the last 100 years has paid ingredient suppliers based on nutritional parameters such as protein or fat. Protein content is invariably quantified using either the Kjeldahl wet chemistry or Dumas combustion methods. These industry- standard tests for protein content measure nitrogen and correlate the result to protein. This means that adding high nitrogen content compounds to protein-containing foods generates a higher protein content reading and hence a higher price. In the case of the 2008 milk adulteration scandal, the additional melamine allowed further dilution of the milk to give a consistent protein reading, increasing profits dishonestly 2 . The reason why this case was higher profile, however, was that it directly affected the human food supply chain as melamine-laced infant formula killed a number of babies and hospitalized a greater number. CASE STUDY Food Fraud
Transcript of Milk Adulteration with Melamine - Screening, Testing … · Milk Adulteration with Melamine –...
Milk Adulteration with Melamine – Screening, Testing and Real-Time Detection
The adulteration of protein-based food products with melamine is now a well-known issue. Five years ago, the increasing number of renal failures in dogs and cats alerted the authorities to a problem in the pet food supply chain. We now know this was
due to the mixture of melamine and cyanuric acid found inside pet food1. These chemicals were introduced into the pet food in China by food ingredient producers with the intent to exploit the long-standing system of payment for ingredients. Rather than payment by weight, which was often exploited throughout history, the food industry for the last 100 years has paid ingredient suppliers based on nutritional parameters such as protein or fat. Protein content is invariably quantified using either the Kjeldahl wet chemistry or Dumas combustion methods. These industry-standard tests for protein content measure nitrogen and correlate the result to protein. This means that adding high nitrogen content compounds to protein-containing foods generates a higher protein content reading and hence a higher price.
In the case of the 2008 milk adulteration scandal, the additional melamine allowed further dilution of the milk to give a consistent protein reading, increasing profits dishonestly2. The reason why this case was higher profile, however, was that it directly affected the human food supply chain as melamine-laced infant formula killed a number of babies and hospitalized a greater number.
CASE STUDY
Food Fraud
A Regulated Issue
In response to the crisis, regulators implemented stringent rules on the levels of melamine permissible in milk, such as the Codex Alimentarius that set limits of 2.5 mg/kg for general food and feed as well as 1 mg/kg in infant formula3 (and new for 2012, 0.15 mg/kg in liquid infant formula4). To analyze these levels, chromatography techniques, both gas and liquid, have been traditionally utilized.
Meanwhile, the food processors, in addition to implementing testing for regulated limits of melamine, have also been investigating infrared (IR) spectroscopy techniques as screening tools for their ingredients (such as the PerkinElmer® Frontier™ NIR). Understanding that, although regulatory limits cannot be reached, the technology allows more samples to be screened for percent levels of melamine and can be carried out onsite, meaning that adulterated ingredients do not enter their production lines and therefore reach their consumers.
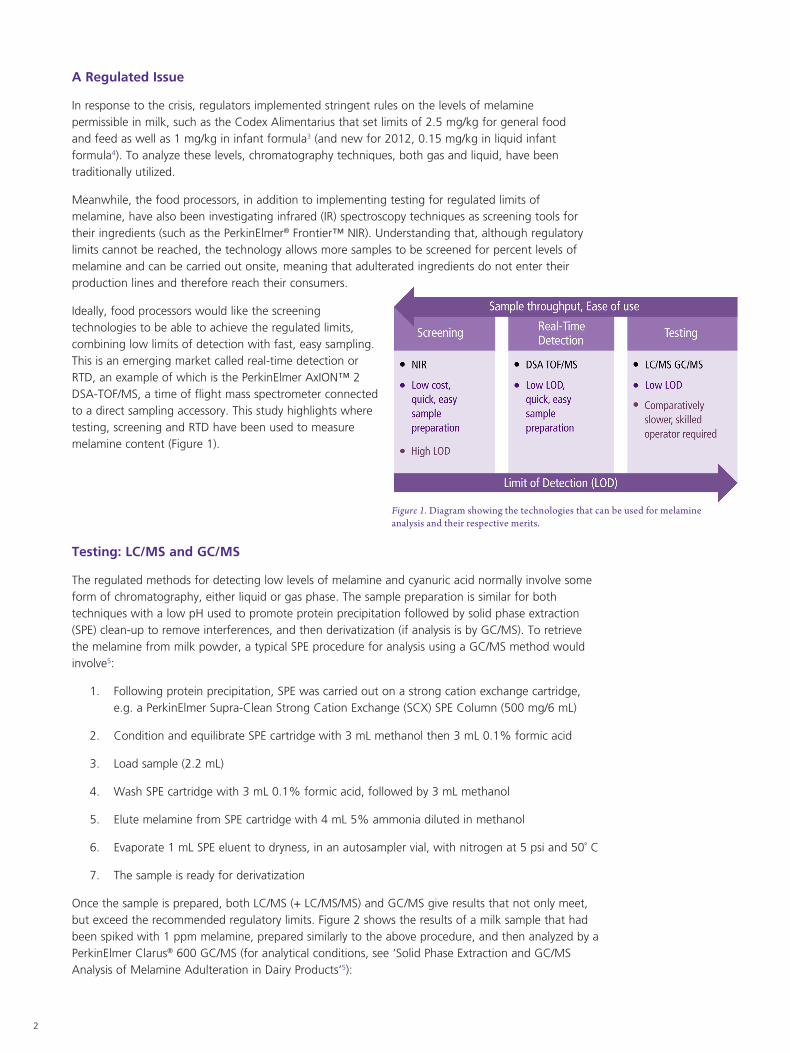
Ideally, food processors would like the screening technologies to be able to achieve the regulated limits, combining low limits of detection with fast, easy sampling. This is an emerging market called real-time detection or RTD, an example of which is the PerkinElmer AxION™ 2 DSA-TOF/MS, a time of flight mass spectrometer connected to a direct sampling accessory. This study highlights where testing, screening and RTD have been used to measure melamine content (Figure 1).
2
Figure 1. Diagram showing the technologies that can be used for melamine analysis and their respective merits.
Testing: LC/MS and GC/MS
The regulated methods for detecting low levels of melamine and cyanuric acid normally involve some form of chromatography, either liquid or gas phase. The sample preparation is similar for both techniques with a low pH used to promote protein precipitation followed by solid phase extraction (SPE) clean-up to remove interferences, and then derivatization (if analysis is by GC/MS). To retrieve the melamine from milk powder, a typical SPE procedure for analysis using a GC/MS method would involve5:
1. Following protein precipitation, SPE was carried out on a strong cation exchange cartridge, e.g. a PerkinElmer Supra-Clean Strong Cation Exchange (SCX) SPE Column (500 mg/6 mL)
2. Condition and equilibrate SPE cartridge with 3 mL methanol then 3 mL 0.1% formic acid
3. Load sample (2.2 mL)
4. Wash SPE cartridge with 3 mL 0.1% formic acid, followed by 3 mL methanol
5. Elute melamine from SPE cartridge with 4 mL 5% ammonia diluted in methanol
6. Evaporate 1 mL SPE eluent to dryness, in an autosampler vial, with nitrogen at 5 psi and 50˚ C
7. The sample is ready for derivatization
Once the sample is prepared, both LC/MS (+ LC/MS/MS) and GC/MS give results that not only meet, but exceed the recommended regulatory limits. Figure 2 shows the results of a milk sample that had been spiked with 1 ppm melamine, prepared similarly to the above procedure, and then analyzed by a PerkinElmer Clarus® 600 GC/MS (for analytical conditions, see ‘Solid Phase Extraction and GC/MS Analysis of Melamine Adulteration in Dairy Products’5):
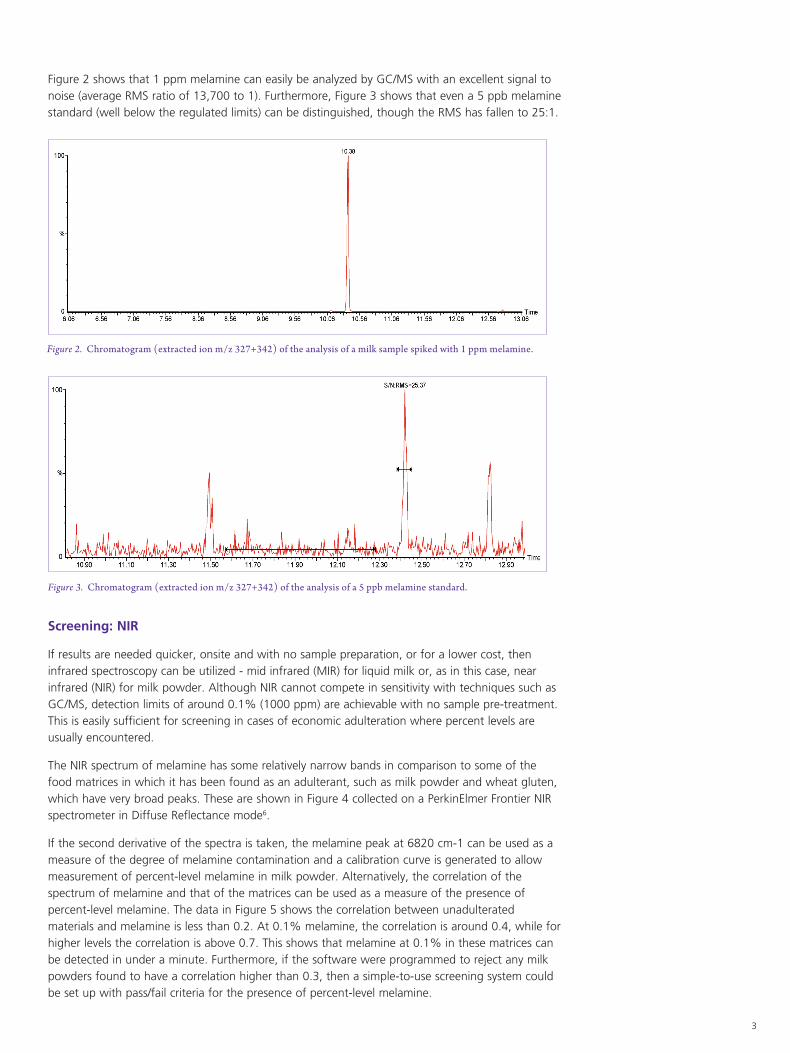
Figure 2. Chromatogram (extracted ion m/z 327+342) of the analysis of a milk sample spiked with 1 ppm melamine.
3
Figure 2 shows that 1 ppm melamine can easily be analyzed by GC/MS with an excellent signal to noise (average RMS ratio of 13,700 to 1). Furthermore, Figure 3 shows that even a 5 ppb melamine standard (well below the regulated limits) can be distinguished, though the RMS has fallen to 25:1.
Screening: NIR
If results are needed quicker, onsite and with no sample preparation, or for a lower cost, then infrared spectroscopy can be utilized - mid infrared (MIR) for liquid milk or, as in this case, near infrared (NIR) for milk powder. Although NIR cannot compete in sensitivity with techniques such as GC/MS, detection limits of around 0.1% (1000 ppm) are achievable with no sample pre-treatment. This is easily sufficient for screening in cases of economic adulteration where percent levels are usually encountered.
The NIR spectrum of melamine has some relatively narrow bands in comparison to some of the food matrices in which it has been found as an adulterant, such as milk powder and wheat gluten, which have very broad peaks. These are shown in Figure 4 collected on a PerkinElmer Frontier NIR spectrometer in Diffuse Reflectance mode6.
If the second derivative of the spectra is taken, the melamine peak at 6820 cm-1 can be used as a measure of the degree of melamine contamination and a calibration curve is generated to allow measurement of percent-level melamine in milk powder. Alternatively, the correlation of the spectrum of melamine and that of the matrices can be used as a measure of the presence of percent-level melamine. The data in Figure 5 shows the correlation between unadulterated materials and melamine is less than 0.2. At 0.1% melamine, the correlation is around 0.4, while for higher levels the correlation is above 0.7. This shows that melamine at 0.1% in these matrices can be detected in under a minute. Furthermore, if the software were programmed to reject any milk powders found to have a correlation higher than 0.3, then a simple-to-use screening system could be set up with pass/fail criteria for the presence of percent-level melamine.
Figure 3. Chromatogram (extracted ion m/z 327+342) of the analysis of a 5 ppb melamine standard.
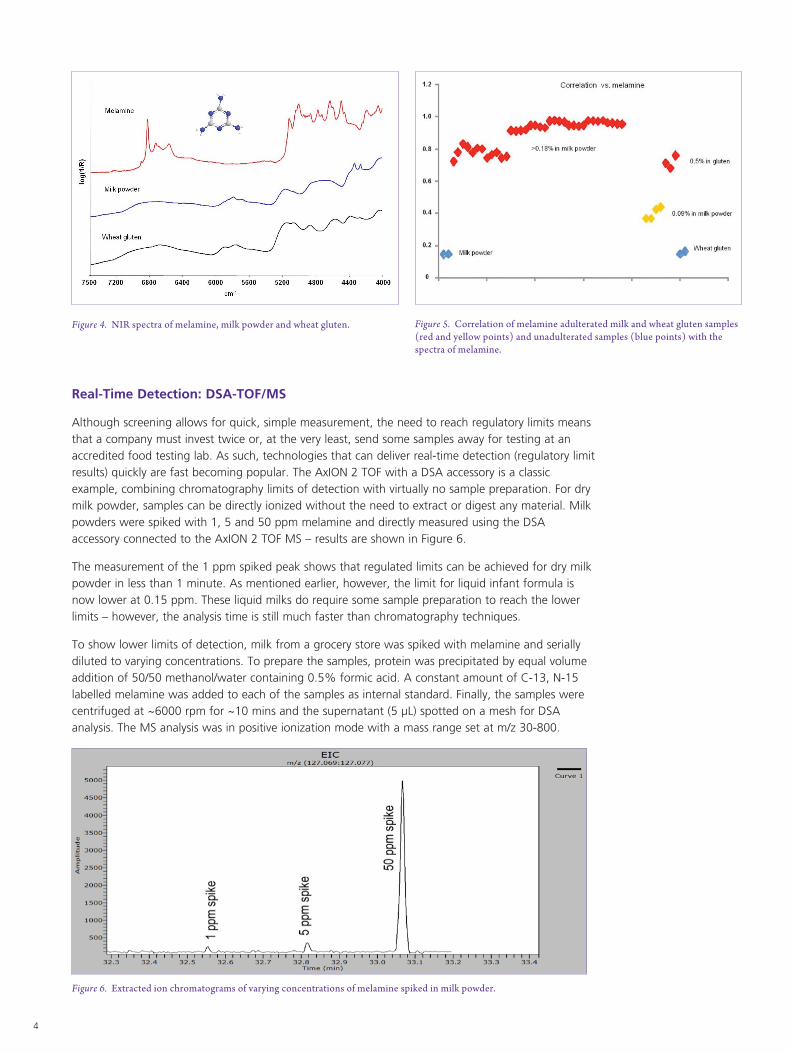
Figure 4. NIR spectra of melamine, milk powder and wheat gluten.
Real-Time Detection: DSA-TOF/MS
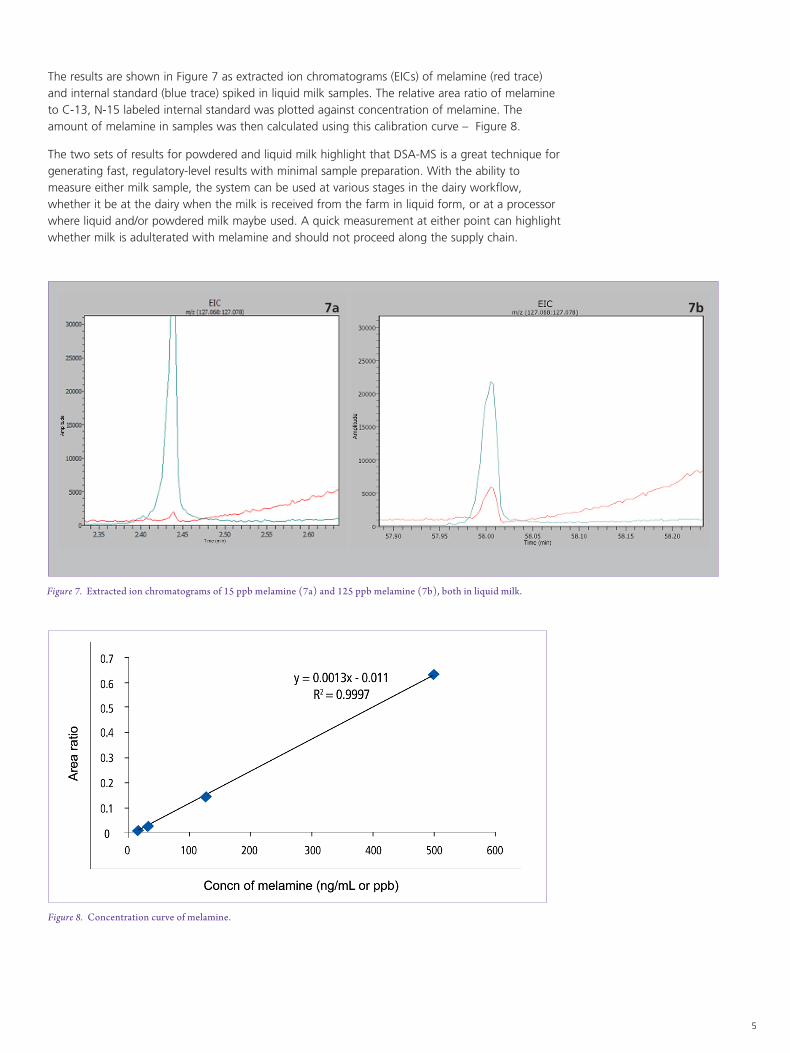
Although screening allows for quick, simple measurement, the need to reach regulatory limits means that a company must invest twice or, at the very least, send some samples away for testing at an accredited food testing lab. As such, technologies that can deliver real-time detection (regulatory limit results) quickly are fast becoming popular. The AxION 2 TOF with a DSA accessory is a classic example, combining chromatography limits of detection with virtually no sample preparation. For dry milk powder, samples can be directly ionized without the need to extract or digest any material. Milk powders were spiked with 1, 5 and 50 ppm melamine and directly measured using the DSA accessory connected to the AxION 2 TOF MS – results are shown in Figure 6.
The measurement of the 1 ppm spiked peak shows that regulated limits can be achieved for dry milk powder in less than 1 minute. As mentioned earlier, however, the limit for liquid infant formula is now lower at 0.15 ppm. These liquid milks do require some sample preparation to reach the lower limits – however, the analysis time is still much faster than chromatography techniques.
To show lower limits of detection, milk from a grocery store was spiked with melamine and serially diluted to varying concentrations. To prepare the samples, protein was precipitated by equal volume addition of 50/50 methanol/water containing 0.5% formic acid. A constant amount of C-13, N-15 labelled melamine was added to each of the samples as internal standard. Finally, the samples were centrifuged at ~6000 rpm for ~10 mins and the supernatant (5 μL) spotted on a mesh for DSA analysis. The MS analysis was in positive ionization mode with a mass range set at m/z 30-800.
4
Figure 5. Correlation of melamine adulterated milk and wheat gluten samples (red and yellow points) and unadulterated samples (blue points) with the spectra of melamine.
Figure 6. Extracted ion chromatograms of varying concentrations of melamine spiked in milk powder.
5
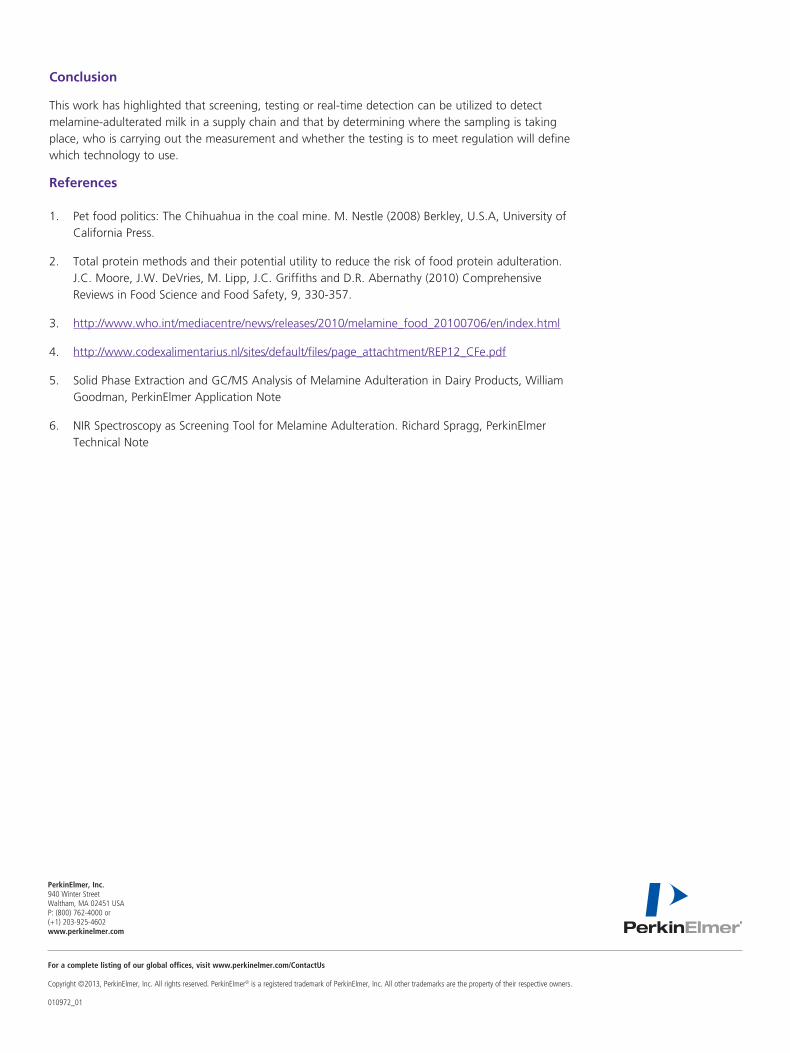
The results are shown in Figure 7 as extracted ion chromatograms (EICs) of melamine (red trace) and internal standard (blue trace) spiked in liquid milk samples. The relative area ratio of melamine to C-13, N-15 labeled internal standard was plotted against concentration of melamine. The amount of melamine in samples was then calculated using this calibration curve – Figure 8.
The two sets of results for powdered and liquid milk highlight that DSA-MS is a great technique for generating fast, regulatory-level results with minimal sample preparation. With the ability to measure either milk sample, the system can be used at various stages in the dairy workflow, whether it be at the dairy when the milk is received from the farm in liquid form, or at a processor where liquid and/or powdered milk maybe used. A quick measurement at either point can highlight whether milk is adulterated with melamine and should not proceed along the supply chain.
Figure 7. Extracted ion chromatograms of 15 ppb melamine (7a) and 125 ppb melamine (7b), both in liquid milk.
Figure 8. Concentration curve of melamine.
7a 7b
For a complete listing of our global offices, visit www.perkinelmer.com/ContactUs
Copyright ©2013, PerkinElmer, Inc. All rights reserved. PerkinElmer® is a registered trademark of PerkinElmer, Inc. All other trademarks are the property of their respective owners. 010972_01
PerkinElmer, Inc. 940 Winter Street Waltham, MA 02451 USA P: (800) 762-4000 or (+1) 203-925-4602www.perkinelmer.com
Conclusion
This work has highlighted that screening, testing or real-time detection can be utilized to detect melamine-adulterated milk in a supply chain and that by determining where the sampling is taking place, who is carrying out the measurement and whether the testing is to meet regulation will define which technology to use.
References
1. Pet food politics: The Chihuahua in the coal mine. M. Nestle (2008) Berkley, U.S.A, University of California Press.
2. Total protein methods and their potential utility to reduce the risk of food protein adulteration. J.C. Moore, J.W. DeVries, M. Lipp, J.C. Griffiths and D.R. Abernathy (2010) Comprehensive Reviews in Food Science and Food Safety, 9, 330-357.
3. http://www.who.int/mediacentre/news/releases/2010/melamine_food_20100706/en/index.html
4. http://www.codexalimentarius.nl/sites/default/files/page_attachtment/REP12_CFe.pdf
5. Solid Phase Extraction and GC/MS Analysis of Melamine Adulteration in Dairy Products, William Goodman, PerkinElmer Application Note
6. NIR Spectroscopy as Screening Tool for Melamine Adulteration. Richard Spragg, PerkinElmer Technical Note
3.
4.


![Colorimetric detection of melamine in milk by using gold ... › 6896 › a9b4db8498e4...[19]. Several studies have already been conducted for the colorimetric detection of melamine](https://static.fdocuments.in/doc/165x107/5f03c56c7e708231d40ab066/colorimetric-detection-of-melamine-in-milk-by-using-gold-a-6896-a-a9b4db8498e4.jpg)