Milingimbi remote towns jobs profile - nt.gov.au€¦ · Web viewThis jobs profile provides a...
73
Remote Towns Jobs Profiles MILINGIMBI JOBS PROFILE MILINGIMBI 1
Transcript of Milingimbi remote towns jobs profile - nt.gov.au€¦ · Web viewThis jobs profile provides a...

Remote Towns Jobs Profiles
MILINGIMBI
JOBS PROFILE MILINGIMBI1

© Northern Territory of Australia 2018
Preferred Reference: Department of Trade, Business and Innovation, 2017 Remote Towns Jobs Profiles, Northern Territory Government, June 2018, Darwin.
Disclaimer
The data in this publication were predominantly collected by conducting a face-to-face survey of businesses within town boundaries during mid-2017. The collection methodology was created in accordance with Australian Bureau of Statistics data quality framework principles. Data in this publication are only reflective of those businesses reported on as operating in the town at the time of data collection (see table at the end of publication for list of businesses reported on).
To comply with privacy legislation or where appropriate, some data in this publication may have been adjusted and will not reflect the actual data reported by businesses. As a result of this, combined with certain data not being reported by some businesses, some components may not add to totals. Changes over time may also reflect business' change in propensity to report on certain data items rather than actual changes over time. Total figures have generally not been adjusted.
Caution is advised when interpreting the comparisons made to the earlier 2011 and 2014 publications as the businesses identified and reported on and the corresponding jobs may differ between publications.
Notes for each table and chart are alphabetically ordered and listed at the end of the publication.
Any use of this report for commercial purposes is not endorsed by the Department of Trade, Business and Innovation.
JOBS PROFILE MILINGIMBI2

Contents
Milingimbi.......................................................................................................................4Introduction.................................................................................................................... 5Summary........................................................................................................................ 6Jobs Overview................................................................................................................. 7Jobs by Aboriginal Status................................................................................................8Jobs by Sector: Private and Public................................................................................10Job Status: Permanent and Temporary.........................................................................16Job Vacancies............................................................................................................... 19Jobs by Industry............................................................................................................21Jobs by Occupation.......................................................................................................27Jobs by Industry by Occupation....................................................................................30Jobs by Gender.............................................................................................................32Jobs by Age...................................................................................................................37Vocational Education and Training...............................................................................42Population..................................................................................................................... 46Community Development Programme.........................................................................48Businesses....................................................................................................................49Notes............................................................................................................................ 50Abbreviations and Acronyms........................................................................................51
JOBS PROFILE MILINGIMBI3

MilingimbiMilingimbi is located approximately 500 kilometres east of Darwin and half a kilometre off the mainland on the northern edge of Arnhem Land, with a population of 1414 residents.
Source: Department of Trade, Business and Innovation
JOBS PROFILE MILINGIMBI4

IntroductionThis jobs profile provides a snapshot of jobs and the characteristics of job holders in Milingimbi as at July 2017. It also outlines trends from the 2014 and 2011 surveys.This job profile is one of 28 profiles developed for remote towns in the Northern Territory. It is anticipated these and subsequent profiles will contribute to a robust evidence base to inform decision making in and relating to these remote Territory towns. This profile contains information collected by the Northern Territory Department of Trade, Business and Innovation from businesses operating within the town and is supplemented by other administrative data sets and information.Each profile provides up-to-date information that is intended to inform the planning and design of current and future government programs and as an evidence base to inform decision making relating to workforce development, enterprise and job opportunities.The data collection methodology and corresponding questionnaire were created in partnership with the Australian Bureau of Statistics (ABS) and in accordance with ABS data quality framework and survey principles.The surveys were predominantly conducted by the Department’s Small Business Champions and Workforce Training Coordinators, on a face-to-face basis with business representatives.The information collected and reported on represents a significant goodwill investment by those businesses and organisations that participated. Each business is listed at the end of this publication.
JOBS PROFILE MILINGIMBI5

SummaryThe 2017 jobs profile was developed based on responses from 13 businesses operating within the Milingimbi town boundary, 1 more than in the 2014 survey. Of these, there were: 10 businesses from the private sector, accounting for 191 filled jobs or 69% of
total filled jobs 3 businesses from the public sector, accounting for 85 filled jobs or 31% of total
filled jobs 6 businesses participated in all three surveys (completed in 2011, 2014 and 2017).A total of 300 filled and vacant jobs in Milingimbi were reported, a decrease of 62 jobs from 2014.1 The 2017 profile highlights: there were 276 filled jobs of which:
o 229 jobs (83%) were filled by Aboriginal persons, an increase of 75 jobs from 2014
o 47 jobs (17%) were filled by non-Aboriginal persons, a decrease of 26 jobs from 2014
o 62% of employed Aboriginal people are working in the private sectoro Aboriginal persons accounted for 83% of job holders in the town compared to
68% in 2014o Aboriginal females made up 44% of total Aboriginal filled jobs in the town
compared to 55% in 2014. there were 24 vacant jobs, of which:
o job vacancies as a percentage of jobs increased to 8% in 2017 from 5% in 2014
o job vacancies equate to 1 in 12 jobso 9 vacancies were in the Professional area
Retail Trade continues to be the largest industry employer, with increases in filled jobs over the three survey periods
Construction had 38 filled jobs in 2017, having recorded nil filled jobs in 2014 and 2011.
Arts and Recreation had the highest decrease in filled jobs of 20 between 2017 and 2014
training decreased by 19 student numbers between 2016 and 2013 Community Services, Health and Education had the highest increase in student
numbers of 41 between 2016 and 2013 Arts, Entertainment, Sports and Recreation and Sales and Personal Service had the
highest decrease in student numbers of 54 and 46 respectively.The overall population in Milingimbi increased by 396 persons (39%) between 2006 and 2016 to 1414 persons.In comparison, the overall Northern Territory population increased by 16.5% between 2006 and 2016.1 The number of filled jobs does not represent numbers of persons as a person may have several jobs or one job may
be shared by more than one person.JOBS PROFILE MILINGIMBI
6

In 2016, the working age population (15 years and over) in Milingimbi was an estimated 1,055 persons compared to 807 in 2006 an increase of 31%.There were 0.3 jobs in Milingimbi per working age person compared to 0.4 jobs per working age person across the 28 remote towns in the Northern Territory.
JOBS PROFILE MILINGIMBI7

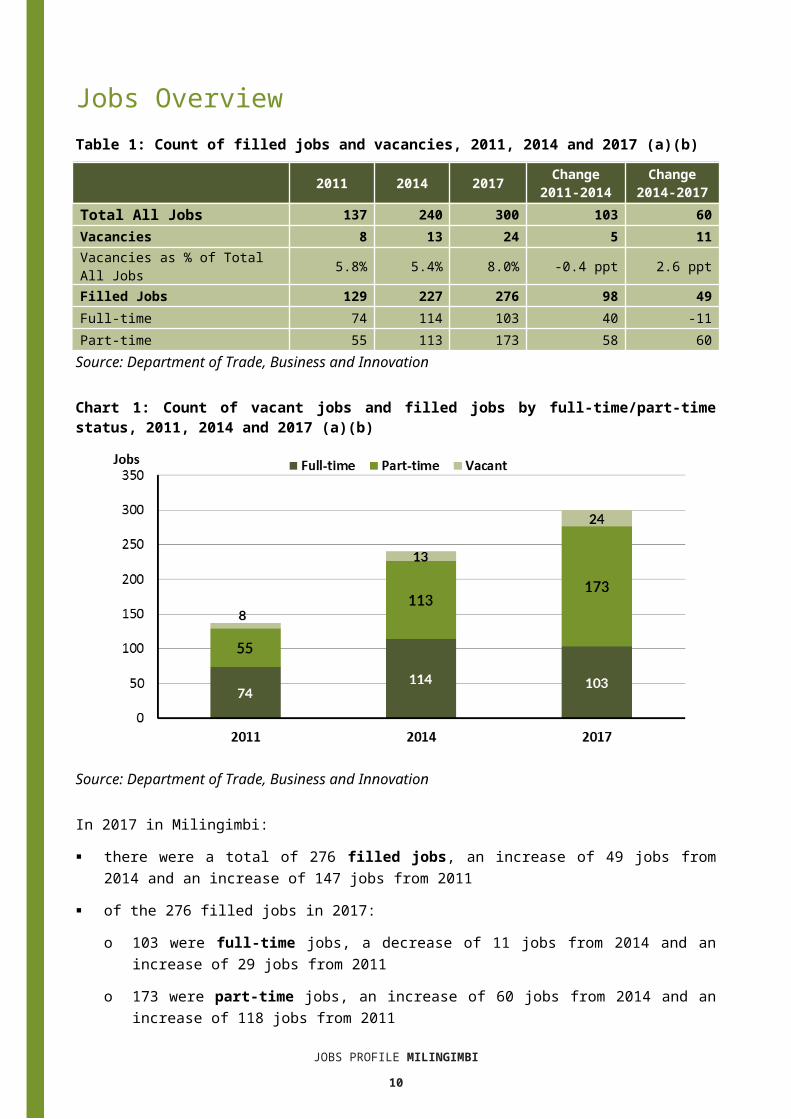
Jobs OverviewTable 1: Count of filled jobs and vacancies, 2011, 2014 and 2017 (a)(b)
2011 2014 2017 Change2011-2014
Change2014-2017
Total All Jobs 137 240 300 103 60Vacancies 8 13 24 5 11Vacancies as % of Total All Jobs 5.8% 5.4% 8.0% -0.4 ppt 2.6 pptFilled Jobs 129 227 276 98 49Full-time 74 114 103 40 -11Part-time 55 113 173 58 60Source: Department of Trade, Business and Innovation
Chart 1: Count of vacant jobs and filled jobs by full-time/part-time status, 2011, 2014 and 2017 (a)(b)
Source: Department of Trade, Business and Innovation
In 2017 in Milingimbi: there were a total of 276 filled jobs, an increase of 49 jobs from 2014 and an
increase of 147 jobs from 2011 of the 276 filled jobs in 2017:
o 103 were full-time jobs, a decrease of 11 jobs from 2014 and an increase of 29 jobs from 2011
o 173 were part-time jobs, an increase of 60 jobs from 2014 and an increase of 118 jobs from 2011
there were 24 total job vacancies in 2017, an increase of 11 vacancies from 2014 and an increase of 16 vacancies from 2011.
JOBS PROFILE MILINGIMBI8

Jobs by Aboriginal StatusChart 2: Count of filled jobs by Aboriginal status, 2011, 2014 and 2017 (a)(c)
Source: Department of Trade, Business and Innovation
In 2017 in Milingimbi: of the 276 filled jobs:
o 229 jobs were filled by Aboriginal persons, an increase of 75 jobs from 2014 and an increase of 139 jobs from 2011
o 47 jobs were filled by non-Aboriginal persons, a decrease of 26 jobs from 2014 and an increase of 8 jobs from 2011
Aboriginal persons accounted for 83% of job holders compared to 68% in 2014 and 70% in 2011.
Table 2: Count of filled jobs by full-time/part-time status and Aboriginal status of person in job, 2011, 2014 and 2017 (a)(b)(c)
Indicator
2011 2014 2017Change
2011-2014Change
2014-2017
Ab
orig
inal
Non
-Ab
orig
inal
Tot
al
Ab
orig
inal
Non
-Ab
orig
inal
Tot
al
Ab
orig
inal
Non
-Ab
orig
inal
Tot
al
Ab
orig
inal
Non
-Ab
orig
inal
Tot
al
Ab
orig
inal
Non
-Ab
orig
inal
Tot
al
Full-time 37 37 74 49 65 114 58 45 10
3 12 28 40 9 -20 -11
Part-time 53 2 55 105 8 11
317
1 2 173 52 6 58 66 -6 60
Total 90 39 12 15 73 22 22 47 27 64 34 98 75 -26 49JOBS PROFILE MILINGIMBI
9
9 4 7 9 6Source: Department of Trade, Business and Innovation
Chart 3: Count of filled jobs by full-time/part-time status and Aboriginal status of person in job, 2011, 2014 and 2017 (a)(b)(c)
Source: Department of Trade, Business and Innovation
In 2017 in Milingimbi: of the 276 filled jobs:
o 58 were full-time jobs filled by Aboriginal persons, an increase of 9 jobs from 2014 and an increase of 21 jobs from 2011
o 171 were part-time jobs filled by Aboriginal persons, an increase of 66 jobs from 2014 and an increase of 118 jobs from 2011
o 45 were full-time jobs filled by non-Aboriginal persons, a decrease of 20 jobs from 2014 and an increase of 8 jobs from 2011
o 2 were part-time jobs filled by non-Aboriginal persons, a decrease of 6 jobs from 2014 and unchanged from 2011.
JOBS PROFILE MILINGIMBI10
Jobs by Sector: Private and PublicTable 3: Count of filled jobs by sector of business and by Aboriginal status of person employed in job, 2011, 2014 and 2017 (a)(b)(c)
Indicator
2011 2014 2017Change
2011-2014Change
2014-2017
Abor
igin
al
Non
-Abo
rigi
nal
Tot
al
Ab
orig
inal
Non
-Abo
rigi
nal
Tot
al
Ab
orig
inal
Non
-Abo
rigi
nal
Tot
al
Ab
orig
inal
Non
-Abo
rigi
nal
Tot
al
Ab
orig
inal
Non
-Abo
rigi
nal
Tot
al
Public Sector 50 33 83 65 49 114 59 26 85 15 16 31 -6 -23 -
29Australian Government 1 1 2 1 0 1 1 0 1 0 -1 -1 0 0 0Territory Government 24 21 45 27 36 63 17 22 39 3 15 18 -10 -14 -
24Local Government 25 11 36 37 13 50 41 4 45 12 2 14 4 -9 -5Private Sector 40 6 46 89 24 11
317
0 21 191 49 18 67 81 -3 78
Total 90 39 129
154 73 22
722
9 47 276 64 34 98 75 -
26 49Source: Department of Trade, Business and Innovation
Chart 4: Count of filled jobs by sector of business, 2011, 2014 and 2017 (a)(d)
Source: Department of Trade, Business and Innovation
JOBS PROFILE MILINGIMBI11

Chart 5: Percentage of filled jobs by sector of business in 2017 (a)(d)
Source: Department of Trade, Business and Innovation
In 2017 in Milingimbi: there were 85 jobs in the public sector, a decrease of 29 jobs from 2014 and an
increase of 2 jobs from 2011 of the 85 jobs in the public sector in 2017:
o 1 job was in the Australian Government, unchanged from 2014 and a decrease of 1 job from 2011
o 39 jobs were in the Territory Government, a decrease of 24 jobs from 2014 and a decrease of 6 jobs from 2011
o 45 jobs were in the Local Government, a decrease of 5 jobs from 2014 and an increase of 9 jobs from 2011
there were 191 jobs in the private sector, an increase of 78 jobs from 2014 and an increase of 145 jobs from 2011.
JOBS PROFILE MILINGIMBI12

Chart 6: Count of filled jobs by sector and Aboriginal status of person in job, 2011, 2014 and 2017 (a)(c)(d)
Source: Department of Trade, Business and Innovation
In 2017 in Milingimbi: of the 85 jobs in the public sector:
o 59 jobs were filled by Aboriginal persons, a decrease of 6 jobs from 2014 and an increase of 9 jobs from 2011
o 26 jobs were filled by non-Aboriginal persons, a decrease of 23 jobs from 2014 and a decrease of 7 jobs from 2011
of the 191 jobs in the private sector:o 170 jobs were filled by Aboriginal persons, an increase of 81 jobs from 2014
and an increase of 130 jobs from 2011o 21 jobs were filled by non-Aboriginal persons, a decrease of 3 jobs from 2014
and an increase of 15 jobs from 2011.
JOBS PROFILE MILINGIMBI13

Chart 7: Count of filled jobs by sector and full-time/part-time status of person in job, 2011, 2014 and 2017 (a)(b)(d)
Source: Department of Trade, Business and Innovation
In 2017 in Milingimbi there were: of the 85 jobs in the public sector:
o 54 were full-time jobs, a decrease of 28 jobs from 2014 and a decrease of 14 jobs from 2011
o 31 were part-time jobs, a decrease of 1 job from 2014 and an increase of 16 jobs from 2011
of the 191 jobs in the private sector:o 49 were full-time jobs, an increase of 17 jobs from 2014 and an increase of 43
jobs from 2011o 142 were part-time jobs, an increase of 61 jobs from 2014 and an increase of
102 jobs from 2011.
JOBS PROFILE MILINGIMBI14

Table 4: Count of filled jobs by full-time/part-time status and Aboriginal status of person in job by sector, 2011, 2014, and 2017 (a)(b)(c)(d)
Indicator2011
Aboriginal Non-Aboriginal TotalFull-time
Part-time Total Full-
timePart-time Total Full-
timePart-time Total
Public Sector 37 13 50 31 2 33 68 15 83Private Sector 0 40 40 6 0 6 6 40 46Total 37 53 90 37 2 39 74 55 129
Indicator2014
Aboriginal Non-Aboriginal TotalFull-time
Part-time Total Full-
timePart-time Total Full-
timePart-time Total
Public Sector 39 26 65 43 6 49 82 32 114Private Sector 10 79 89 22 2 24 32 81 113Total 49 105 154 65 8 73 114 113 227
Indicator2017
Aboriginal Non-Aboriginal TotalFull-time
Part-time Total Full-
timePart-time Total Full-
timePart-time Total
Public Sector 28 31 59 26 0 26 54 31 85Private Sector 30 140 170 19 2 21 49 142 191Total 49 105 229 45 2 47 103 173 276
Source: Department of Trade, Business and Innovation
In 2017 in Milingimbi there were: 59 jobs in the public sector filled by Aboriginal persons, a decrease of 6 jobs
from 2014 and an increase of 9 jobs from 2011, of which:o 28 were full-time jobs, a decrease of 11 jobs from 2014 and a decrease of 9
jobs from 2011o 31 were part-time jobs, an increase of 5 jobs from 2014 and an increase of 18
jobs from 2011 170 jobs in the private sector filled by Aboriginal persons, an increase of 81
jobs from 2014 and an increase of 130 jobs from 2011, of which:o 30 were full-time jobs, an increase of 20 jobs from 2014 and an increase of 30
jobs from 2011o 140 were part-time jobs, an increase of 61 jobs from 2014 and an increase of
100 jobs from 2011 26 jobs in the public sector filled by non-Aboriginal persons, a decrease of 23
jobs from 2014 and a decrease of 7 jobs from 2011, of which:o 26 were full-time jobs, a decrease of 17 jobs from 2014 and a decrease of 5
jobs from 2011o none were part-time jobs, a decrease of 6 jobs from 2014 and a decrease of 2
jobs from 2011
JOBS PROFILE MILINGIMBI15

21 jobs in the private sector filled by non-Aboriginal persons, a decrease of 3 jobs from 2014 and an increase of 15 jobs from 2011, of which:o 19 were full-time jobs, a decrease of 3 jobs from 2014 and an increase of 13
jobs from 2011o 2 were part-time jobs, unchanged from 2014 and an increase of 2 jobs from
2011.
JOBS PROFILE MILINGIMBI16

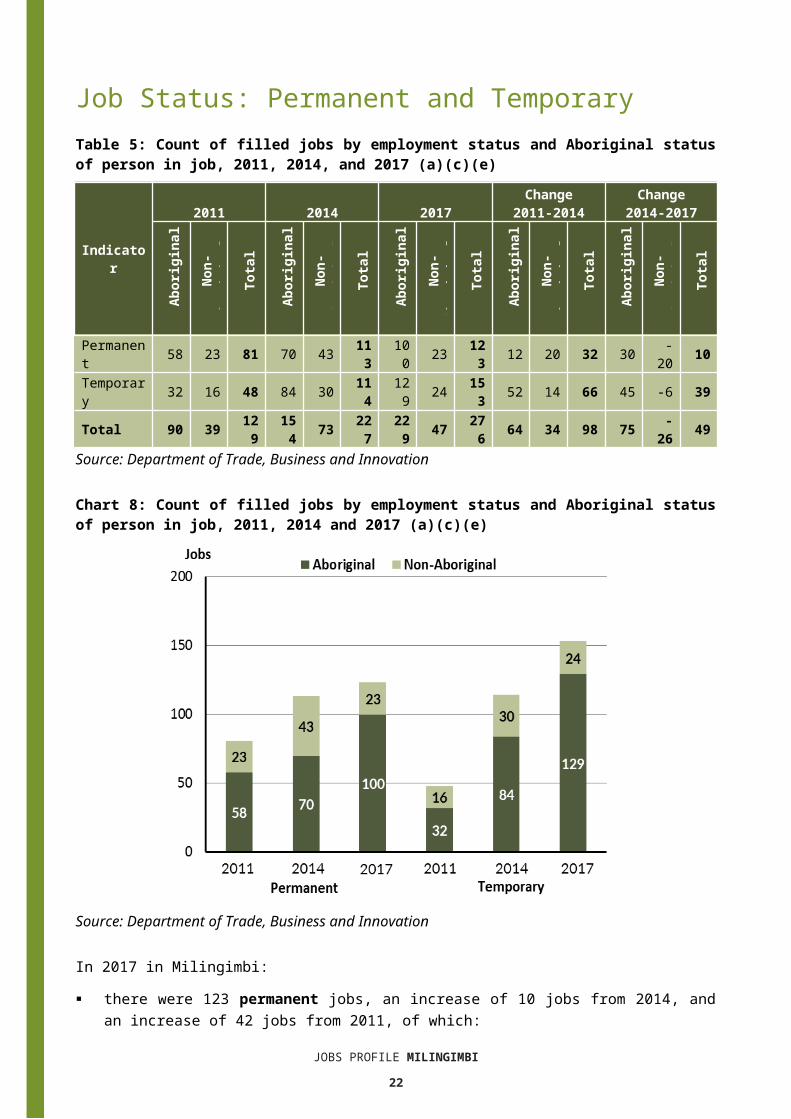
Job Status: Permanent and TemporaryTable 5: Count of filled jobs by employment status and Aboriginal status of person in job, 2011, 2014, and 2017 (a)(c)(e)
Indicator
2011 2014 2017Change
2011-2014Change
2014-2017
Ab
orig
inal
Non
-Ab
orig
inal
Tot
al
Ab
orig
inal
Non
-Ab
orig
inal
Tot
al
Ab
orig
inal
Non
-Ab
orig
inal
Tot
al
Ab
orig
inal
Non
-Ab
orig
inal
Tot
al
Ab
orig
inal
Non
-Ab
orig
inal
Tot
al
Permanent 58 23 81 70 43 11
310
0 23 123 12 20 32 30 -20 10
Temporary 32 16 48 84 30 11
412
9 24 153 52 14 66 45 -6 39
Total 90 39 129
154 73 22
722
9 47 276 64 34 98 75 -
26 49Source: Department of Trade, Business and Innovation
Chart 8: Count of filled jobs by employment status and Aboriginal status of person in job, 2011, 2014 and 2017 (a)(c)(e)
Source: Department of Trade, Business and Innovation
In 2017 in Milingimbi: there were 123 permanent jobs, an increase of 10 jobs from 2014, and an
increase of 42 jobs from 2011, of which:o 100 jobs were filled by Aboriginal persons, an increase of 30 jobs from 2014
and an increase of 42 jobs from 2011
JOBS PROFILE MILINGIMBI17

o 23 jobs were filled by non-Aboriginal persons, a decrease of 20 jobs from 2014 and unchanged from 2011
there were 153 temporary jobs, an increase of 39 jobs from 2014 and an increase of 105 jobs from 2011, of which:o 129 jobs were filled by Aboriginal persons, an increase of 45 jobs from 2014
and an increase of 97 jobs from 2011o 24 jobs were filled by non-Aboriginal persons, a decrease of 6 jobs from 2014
and an increase of 8 jobs from 2011.
Table 6: Count of filled jobs by sector, Aboriginal status and employment status of person in job, 2011, 2014 and 2017 (a)(c)(d)(e)
Indicator2011
Aboriginal Non-Aboriginal TotalPerm Temp Total Perm Temp Total Perm Temp Total
Public Sector 35 15 50 23 10 33 58 25 83Private Sector 23 17 40 0 6 6 23 23 46Total 58 32 90 23 16 39 81 48 129
Indicator
2014Aboriginal Non-Aboriginal Total
Perm
Temp Total Per
mTem
p Total Perm
Temp
Total
Public Sector 27 38 65 34 15 49 61 53 114Private Sector 43 46 89 9 15 24 52 61 113Total 70 84 154 43 30 73 113 114 227
Indicator2017
Aboriginal Non-Aboriginal TotalPerm Temp Total Perm Temp Total Perm Temp Total
Public Sector 34 25 59 14 12 26 48 37 85Private Sector 66 104 170 9 12 21 75 116 191Total 100 129 229 23 24 47 123 153 276
Source: Department of Trade, Business and Innovation
In 2017 in Milingimbi there were: 85 jobs in the public sector, a decrease of 29 jobs from 2014 and an increase of
2 jobs from 2011, of which:o 48 jobs were permanent, a decrease of 13 jobs from 2014 and a decrease of
10 jobs from 2011, of which: 34 jobs were filled by Aboriginal persons, an increase of 7 jobs from 2014
and a decrease of 1 job from 2011 14 jobs were filled by non-Aboriginal persons, a decrease of 20 jobs from
2014 and a decrease of 9 jobs from 2011
JOBS PROFILE MILINGIMBI18

o 37 jobs were temporary, a decrease of 16 jobs from 2014 and an increase of 12 jobs from 2011, of which: 25 jobs were filled by Aboriginal persons, a decrease of 13 jobs from
2014 and an increase of 10 jobs from 2011 12 jobs were filled by non-Aboriginal persons, a decrease of 3 jobs from
2014 and an increase of 2 jobs from 2011 191 jobs in the private sector, an increase of 78 jobs from 2014 and an increase
of 145 jobs from 2011, of which:o 75 jobs were permanent, an increase of 23 jobs from 2014 and an increase of
52 jobs from 2011, of which: 66 jobs were filled by Aboriginal persons, an increase of 23 jobs from
2014 and an increase of 43 jobs from 2011 9 jobs were filled by non-Aboriginal persons, unchanged from 2014 and
an increase of 9 jobs from 2011o 116 jobs were temporary, an increase of 55 jobs from 2014 and an increase of
93 jobs from 2011, of which: 104 jobs were filled by Aboriginal persons, an increase of 58 jobs from
2014 and an increase of 87 jobs from 2011 12 jobs were filled by non-Aboriginal persons, a decrease of 3 jobs from
2014 and an increase of 6 jobs from 2011.
JOBS PROFILE MILINGIMBI19
Job VacanciesTable 7: Job vacancies, 2011, 2014, and 2017
Indicator 2011 2014 2017Change2011-2014
Change2014-2017
Job vacancies 8 13 24 5 11Source: Department of Trade, Business and Innovation
Table 8: Job vacancies by occupation, 2011, 2014, and 2017 (f)(g)
Occupation (ANZSCO major group) 2011 2014 2017 Change
2011-2014Change
2014-2017Clerical and Administrative Workers 0 1 7 1 6Community and Personal Service Workers 4 5 7 1 2Managers 0 0 1 0 1Professionals 3 6 9 3 3Technicians and Trades Workers 0 1 0 1 -1Other Occupations 1 0 0 -1 0Total 8 13 24 5 11
Source: Department of Trade, Business and Innovation
Table 9: Job vacancies by job title, July 2017 (f)Job Vacancy No.
General Clerk 6Registered Nurses nec 3Teachers' Aide 3Community Worker 2Teacher of English to Speakers of Other Languages 1Early Childhood (pre primary school) teacher 1Primary School Teacher 1Aged or Disabled Carer 1Corporate Services Manager 1Recreation Officer 1Aboriginal and Torres Strait Islander Health Worker 1Registered Nurse (Child and Family Health) 1General Medical Practitioner 1Bank Worker 1 24
Source: Department of Trade, Business and Innovation
In 2017 in Milingimbi: there were 24 vacancies reported, an increase of 11 vacancies from 2014 and an
increase of 16 vacancies from 2011
JOBS PROFILE MILINGIMBI20

of the 24 reported vacancies, the largest requirements were for:o 9 Professionals, the majority of which is in the following job:
Registered Nurseo 7 Clerical and Administrative Workers, the majority of which is in the following
job: General Clerk
o 7 Community and Personal Service Workers, the majority of which are in the following jobs: Teachers’ Aide Community Worker.
JOBS PROFILE MILINGIMBI21
Jobs by IndustryTable 10: Count of filled jobs by industry of business, 2011, 2014 and 2017 (a)(h)
Industry (ANZSIC Division)
2011 2014 2017
Chan
ge20
11-2
014
Chan
ge20
14-2
017
Total
% of Total
Total
% of Total
Total
% of Total Total Tot
al
Accommodation and Food Services 0 0.0% 0 0.0% 7 2.5% 0 7Arts and Recreation Services 0 0.0% 30 13.2% 10 3.6% 30 -20Construction 0 0.0% 0 0.0% 38 13.8% 0 38Education and Training 37 28.7% 50 22.0% 40 14.5% 13 -10Electricity, Gas, Water and Waste Services 0 0.0% 2 0.9% 0 0.0% 2 -2Financial and Insurance Services 4 3.1% 4 1.8% 3 1.1% 0 -1Health Care and Social Assistance 9 7.0% 14 6.2% 22 8.0% 5 8Public Administration and Safety 38 29.5% 51 22.5% 46 16.7% 13 -5Retail Trade 39 30.2% 73 32.2% 108 39.1% 34 35Transport, Postal and Warehousing 2 1.6% 3 1.3% 2 0.7% 1 -1
Total 129 100.0% 227 100.0
% 276 100.0% 98 49
Source: Department of Trade, Business and Innovation
In 2017 in Milingimbi: the Retail Trade industry was the largest industry employer, with 108 filled jobs
or 39.1% of filled jobs, an increase of 35 jobs from 2014 and an increase of 69 jobs from 2011
other significant industry employers were:o Public Administration and Safety with 46 jobs (or 16.7% of filled jobs), a
decrease of 5 jobs from 2014 and an increase of 8 jobs from 2011o Education and Training with 40 jobs (or 14.5% of filled jobs), a decrease of 10
jobs from 2014 and an increase of 3 jobs from 2011o Construction with 38 jobs (or 13.8% of filled jobs), an increase of 38 jobs from
2014 and 2011.
JOBS PROFILE MILINGIMBI22

Table 11: Count of filled jobs by industry of business and Aboriginal status of person in job, 2011, 2014, and 2017 (a)(c)(h)
Industry (ANZSIC division)
2011 2014 2017 Change2011-2014
Change 2014-2017
Ab
orig
inal
Non
-
Tot
al
Ab
orig
inal
Non
-
Tot
al
Ab
orig
inal
Non
-Ab
orig
inal
Tot
al
Ab
orig
inal
Non
-Ab
orig
inal
Tot
al
Ab
orig
inal
Non
-Ab
orig
inal
Tot
al
Accommodation and Food Services 0 0 0 0 0 0 7 0 7 0 0 0 7 0 7
Arts and Recreation Services 0 0 0 22 8 30 8 2 10 22 8 30 -14 -6 -20
Construction 0 0 0 0 0 0 28 10 38 0 0 0 28 10 38
Education and Training 18 19 37 21 29 50 17 23 40 3 10 13 -4 -6 -10
Electricity, Gas, Water and Waste Services 0 0 0 1 1 2 0 0 0 1 1 2 -1 -1 -2
Financial and Insurance Services 4 0 4 4 0 4 3 0 3 0 0 0 -1 0 -1Health Care and Social Assistance 7 2 9 6 8 14 16 6 22 -1 6 5 10 -2 8Public Administration and Safety 26 12 38 38 13 51 42 4 46 12 1 13 4 -9 -5
Retail Trade 35 4 39 62 11 73 108 0 108 27 7 34 46 -11 35
Transport, Postal and Warehousing 0 2 2 0 3 3 0 2 2 0 1 1 0 -1 -1
Total 90
39 129 154 7
3 227 229 47 27
6 64 34 98 75 -26 49
Source: Department of Trade, Business and Innovation
JOBS PROFILE MILINGIMBI23

Chart 9: Count of filled jobs by top 5 industries of business and Aboriginal status of person in job, 2017 (a)(c)(h)
Source: Department of Trade, Business and Innovation
In 2017 in Milingimbi: of the 229 jobs filled by Aboriginal persons, there were:
o 108 jobs in Retail Trade, an increase of 46 jobs from 2014 and an increase of 73 jobs from 2011
o 42 jobs in Public Administration and Safety, an increase of 4 jobs from 2014 and an increase of 16 jobs from 2011
o 17 jobs in Education and Training, a decrease of 4 jobs from 2014 and a decrease of 1 job from 2011
of the 47 jobs filled by non-Aboriginal persons, there were:o none were in Retail Trade, a decrease of 11 jobs from 2014 and a decrease of
4 jobs from 2011o 4 jobs in Public Administration and Safety, a decrease of 9 jobs from 2014 and
a decrease of 8 jobs from 2011o 23 jobs in Education and Training, a decrease of 6 jobs from 2014 and an
increase of 4 jobs from 2011.
JOBS PROFILE MILINGIMBI24
Table 12: Count of filled jobs by industry, employment status and Aboriginal status of person in job, 2011 (a)(c)(e)(h)
Industry (ANZSIC division)
2011Aboriginal Non-Aboriginal Total
Perm
Temp
Total
Perm
Temp
Total
Perm
Temp
Total
Education and Training 11 7 18 13 6 19 24 13 37Financial and Insurance Services 3 1 4 0 0 0 3 1 4Health Care and Social Assistance 3 4 7 1 1 2 4 5 9Public Administration and Safety 21 5 26 9 3 12 30 8 38
Retail Trade 20 15 35 0 4 4 20 19 39Transport, Postal and Warehousing 0 0 0 0 2 2 0 2 2
Total 58 32 90 23 16 39 81 48 129Source: Department of Trade, Business and Innovation
Table 13: Count of filled jobs by industry, employment status and Aboriginal status of person in job, 2014 (a)(c)(e)(h)
Industry (ANZSIC division)
2014Aboriginal Non-Aboriginal Total
Perm
Temp
Total
Perm
Temp
Total
Perm
Temp
Total
Arts and Recreation Services 12 10 22 4 4 8 16 14 30
Education and Training 7 14 21 19 10 29 26 24 50Electricity, Gas, Water and Waste Services 0 1 1 0 1 1 0 2 2Financial and Insurance Services 4 0 4 0 0 0 4 0 4Health Care and Social Assistance 6 0 6 8 0 8 14 0 14Public Administration and Safety 14 24 38 7 6 13 21 30 51
Retail Trade 27 35 62 4 7 11 31 42 73Transport, Postal and Warehousing 0 0 0 1 2 3 1 2 3
Total 70 84 154 43 30 73 113 114 227Source: Department of Trade, Business and Innovation
JOBS PROFILE MILINGIMBI25

Table 14: Count of filled jobs by industry, employment status and Aboriginal status of person in job, 2017 (a)(c)(e)(h)
Industry (ANZSIC division)
2017Aboriginal Non-Aboriginal Total
Perm
Temp
Total
Perm
Temp
Total
Perm
Temp
Total
Accommodation and Food Services 0 7 7 0 0 0 0 7 7
Arts and Recreation Services 0 8 8 0 2 2 0 10 10
Construction 17 11 28 7 3 10 24 14 38Education and Training 12 5 17 10 13 23 22 18 40Financial and Insurance Services 3 0 3 0 0 0 3 0 3Health Care and Social Assistance 4 12 16 1 5 6 5 17 22Public Administration and Safety 22 20 42 4 0 4 26 20 46
Retail Trade 42 66 108 0 0 0 42 66 108Transport, Postal and Warehousing 0 0 0 1 1 2 1 1 2
Total 100 129 229 23 24 47 123 153 276Source: Department of Trade, Business and Innovation
In 2017 in Milingimbi: of the 123 permanent jobs, there were:
o 42 jobs in Retail Trade, an increase of 11 jobs from 2014 and an increase of 22 jobs from 2011, including: 42 jobs filled by Aboriginal persons, an increase of 15 jobs from 2014 and
an increase of 22 jobs from 2011 none were filled by non-Aboriginal persons, a decrease of 4 jobs from
2014 and unchanged from 2011o 26 jobs in Public Administration and Safety, an increase of 5 jobs from 2014
and a decrease of 4 jobs from 2011, including: 22 jobs filled by Aboriginal persons, an increase of 8 jobs from 2014 and
an increase of 1 job from 2011 4 jobs filled by non-Aboriginal persons, a decrease of 3 jobs from 2014
and a decrease of 5 jobs from 2011o 24 jobs in Construction, an increase of 24 jobs from 2014 and an increase of
24 jobs from 2011, including: 17 jobs filled by Aboriginal persons, an increase of 17 jobs from 2014 and
an increase of 17 jobs from 2011 7 jobs filled by non-Aboriginal persons, an increase of 7 jobs from 2014
and an increase of 7 jobs from 2011
JOBS PROFILE MILINGIMBI26

of the 153 temporary jobs, there were:o 66 jobs in Retail Trade, an increase of 24 jobs from 2014 and an increase of 47
jobs from 2011, including: 66 jobs filled by Aboriginal persons, an increase of 31 jobs from 2014 and
an increase of 51 jobs from 2011 none were filled by non-Aboriginal persons, a decrease of 7 jobs from
2014 and a decrease of 4 jobs from 2011o 20 jobs in Public Administration and Safety, a decrease of 10 jobs from 2014
and an increase of 12 jobs from 2011, including: 20 jobs filled by Aboriginal persons, a decrease of 4 jobs from 2014 and
an increase of 15 jobs from 2011 none were filled by non-Aboriginal persons, a decrease of 6 jobs from
2014 and a decrease of 3 jobs from 2011o 18 jobs in Education and Training, a decrease of 6 jobs from 2014 and an
increase of 5 jobs from 2011, including: 5 jobs filled by Aboriginal persons, a decrease of 9 jobs from 2014 and a
decrease of 2 jobs from 2011 13 jobs filled by non-Aboriginal persons, an increase of 3 jobs from 2014
and an increase of 7 jobs from 2011.
JOBS PROFILE MILINGIMBI27

Jobs by OccupationTable 15: Count of filled jobs by occupation, 2011, 2014 and 2017 (a)(f)(g)
Occupation (ANZSCO major group)
2011 2014 2017
Chan
ge20
11-
2014
Chan
ge20
14-
2017
Total
% of Total
Total
% of Total
Total
% of Total
Total
Total
Clerical and Administrative Workers 15 11.6% 51 22.5% 31 11.2% 36 -20Community and Personal Service Workers 25 19.4% 56 24.7% 67 24.3% 31 11Labourers 11 8.5% 17 7.5% 63 22.8% 6 46Machinery Operators and Drivers 0 0.0% 0 0.0% 5 1.8% 0 5Managers 7 5.4% 12 5.3% 10 3.6% 5 -2Professionals 27 20.9% 62 27.3% 61 22.1% 35 -1Sales Workers 36 27.9% 27 11.9% 36 13.0% -9 9Technicians and Trades Workers 6 4.7% 2 0.9% 3 1.1% -4 1Other occupations 2 1.6% 0 0.0% 0 0.0% -2 0Total 129 100.0
% 227 100.0% 276 100.0
% 98 49Source: Department of Trade, Business and Innovation
Chart 10: Percentage and count of top 6 filled jobs by occupation, 2011, 2014 and 2017 (a)(f)(g)
Source: Department of Trade, Business and InnovationJOBS PROFILE MILINGIMBI
28

In 2017 in Milingimbi: Community and Personal Service Workers was the largest occupation
classification in terms of filled jobs, accounting for 67 jobs (24.3% of total filled jobs), an increase of 11 jobs from 2014 and an increase of 42 jobs from 2011
other significant occupation classifications were:o Labourers accounting for 63 jobs or 22.8% of total jobs an increase of 46 jobs
from 2014 and an increase of 52 jobs from 2011o Professionals accounting for 61 jobs or 22.1% of total jobs a decrease of 1 job
from 2014 and an increase of 34 jobs from 2011o Sales Workers accounting for 36 jobs or 13% of total jobs an increase of 9 jobs
from 2014 and unchanged from 2011.
Table 16 Count of filled jobs by ANZSCO occupation by Aboriginal status of person employed in job, 2011, 2014 and 2017 (a)(c)(f))g)
Occupation (ANZSCO major
group)
2011 2014 2017Change2011-2014
Change2014-2017
Ab
orig
inal
Non
-
Tot
al
Ab
orig
inal
Non
-
Tot
al
Ab
orig
inal
Non
-Ab
orig
inal
Tot
al
Ab
orig
inal
Non
-
Tot
al
Ab
orig
inal
Non
-Ab
orig
inal
Tot
al
Clerical and Administrative Workers 7 8 15 38 1
3 51 27 4 31 31 5 3
6-
11 -9 -20
Community and Personal Service Workers 24 1 25 47 9 56 64 3 67 2
3 8 31 17 -6 11
Labourers 9 2 11 15 2 17 63 0 63 6 0 6 48 -2 46Machinery Operators and Drivers 0 0 0 0 0 0 5 0 5 0 0 0 5 0 5
Managers 0 7 7 0 12 12 0 10 10 0 5 5 0 -2 -2
Professionals 9 18 27 27 3
5 62 34 27 61 18
17
35 7 -8 -1
Sales Workers 36 0 36 27 0 27 36 0 36 -9 0 -9 9 0 9Technicians and Trades Workers 3 3 6 0 2 2 0 3 3 -3 -1 -4 0 1 1
Total 90 39
129
154
73
227
229 47 27
664
34
98
75 -26 49
Source: Department of Trade, Business and Innovation
In 2017 in Milingimbi: of the 229 jobs filled by Aboriginal persons, there were:
o 64 Community and Personal Service Workers, an increase of 17 jobs from 2014 and an increase of 40 jobs from 2011
o 63 Labourers, an increase of 48 jobs from 2014 and an increase of 54 jobs from 2011
JOBS PROFILE MILINGIMBI29

o 36 Sales Workers, an increase of 9 jobs from 2014 and unchanged from 2011
JOBS PROFILE MILINGIMBI30

of the 47 jobs filled by non-Aboriginal persons, there were:o 27 Professionals, a decrease of 8 jobs from 2014 and an increase of 9 jobs
from 2011o 10 Managers, a decrease of 2 jobs from 2014 and an increase of 3 jobs from
2011o 4 Clerical and Administrative Workers, a decrease of 9 jobs from 2014 and a
decrease of 4 jobs from 2011.
JOBS PROFILE MILINGIMBI31

Jobs by Industry by OccupationTable 17: Count of filled jobs by industry by occupation, 2011 (a)(f)(g)(h)
2011
Industry (ANZSIC Division)
Occupation (ANZSCO major group)
Cl
eric
al a
nd
Adm
inis
trat
ive
Wor
kers
Co
mm
unit
y an
d Pe
rson
al S
ervi
ce
La
bour
ers
M
achi
nery
Ope
rato
rs
and
Dri
vers
M
anag
ers
Pr
ofes
sion
als
Sa
les
Wor
kers
Te
chni
cian
s an
d Tr
ades
Wor
kers
O
ther
occ
upat
ions
To
tal
Education and Training 4 13 1 0 1 18 0 0 0 37Financial and Insurance Services 3 0 0 0 0 1 0 0 0 4Health Care and Social Assistance 0 2 2 0 0 2 0 1 2 9Public Administration and Safety 8 10 8 0 2 4 1 5 0 38Retail Trade 0 0 0 0 4 0 35 0 0 39Transport, Postal and Warehousing 0 0 0 0 0 2 0 0 0 2Total 15 25 11 0 7 27 36 6 2 129Source: Department of Trade, Business and Innovation
Table 18: Count of filled jobs by industry by occupation, 2014 (a)(f)(g)(h)2014
Industry (ANZSIC Division)
Occupation (ANZSCO major group)
Cl
eric
al a
nd
Adm
inis
trat
ive
Co
mm
unit
y an
d Pe
rson
al S
ervi
ce
La
bour
ers
M
achi
nery
O
pera
tors
and
M
anag
ers
Pr
ofes
sion
als
Sa
les
Wor
kers
Te
chni
cian
s an
d Tr
ades
Wor
kers
O
ther
oc
cupa
tion
s
To
tal
Arts and Recreation Services 2 0 5 0 3 20 0 0 0 30Education and Training 5 13 3 0 3 26 0 0 0 50Electricity, Gas, Water and Waste Services 0 1 0 0 0 0 0 1 0 2Financial and Insurance Services 4 0 0 0 0 0 0 0 0 4Health Care and Social Assistance 0 6 2 0 1 5 0 0 0 14Public Administration and Safety 3 31 7 0 1 8 0 1 0 51Retail Trade 37 5 0 0 4 0 27 0 0 73Transport, Postal and Warehousing 0 0 0 0 0 3 0 0 0 3Total 51 56 17 0 12 62 27 2 0 227
Source: Department of Trade, Business and InnovationJOBS PROFILE MILINGIMBI
32

Table 19: Count of filled jobs by occupation and by industry, 2017(a)(f)(g)(h)2017
Industry (ANZSIC Division)
Occupation (ANZSCO major group)
Cl
eric
al a
nd
Adm
inis
trat
ive
Co
mm
unit
y an
d Pe
rson
al S
ervi
ce
La
bour
ers
M
achi
nery
Ope
rato
rs
and
Dri
vers
M
anag
ers
Pr
ofes
sion
als
Sa
les
Wor
kers
Te
chni
cian
s an
d Tr
ades
Wor
kers
O
ther
Occ
upat
ions
To
tal
Accommodation and Food Services 0 0 7 0 0 0 0 0 0 7Arts and Recreation Services 0 0 0 0 2 8 0 0 0 10Construction 2 0 13 0 3 18 0 2 0 38Education and Training 2 9 3 0 3 23 0 0 0 40Financial and Insurance Services 3 0 0 0 0 0 0 0 0 3Health Care and Social Assistance 4 6 2 5 2 3 0 0 0 22Public Administration and Safety 5 24 10 0 0 6 0 1 0 46Retail Trade 15 28 28 0 0 1 36 0 0 108Transport, Postal and Warehousing 0 0 0 0 0 2 0 0 0 2Total 31 67 63 5 10 61 36 3 0 276
Source: Department of Trade, Business and Innovation
In 2017 in Milingimbi: the majority of Community and Personal Service Workers (67) jobs (the largest
occupation group) were shared across the Retail Trade(28) and Public Administration and Safety (24) industries
in Retail Trade (the largest industry), there were 108 filled jobs shared across Sales Workers, Labourers, Community and Personal Service Workers and Clerical and Administrative Workers
Retail Trade showed an increase in filled jobs for each survey period of 35 jobs between 2017 and 2014 and 69 jobs between 2017 and 2011
the majority of Labourers (the second largest occupation group) filled jobs were shared across Retail Trade, Construction and Public Administration and Safety industries
Arts and Recreation Services showed the largest decrease in jobs of 20 between 2017 and 2014
Electricity, Gas, Water and Waste Services had 2 filled jobs in 2014 and nil in 2017 new industries in 2017 were Accommodation and Food Services and Construction
which filled 45 jobs; these industries had nil jobs filled in 2014.
JOBS PROFILE MILINGIMBI33

Jobs by GenderTable 20: Counts of filled jobs by gender2 and Aboriginal status of person employed in job 2011, 2014 and 2017 (a)(c)(i)
Indi
cato
r
2011 2014 2017 2011-2014 Change
2014-2017 Change
Ab
orig
inal
Non
-Ab
orig
inal
Tot
al
Ab
orig
inal
Non
-Ab
orig
inal
Tot
al
Ab
orig
inal
Non
-Ab
orig
inal
Tot
al
Ab
orig
inal
Non
-Ab
orig
inal
Tot
al
Ab
orig
inal
Non
-Ab
orig
inal
Tot
al
Male 33 22 55 70 4
311
3 125 20 145 3
7 21 58 55 -
2332
Female 57 17 74 84 3
011
4 100 27 127 2
7 13 40 16 -3 1
3Total 90 3
912
9 154 73
227 225 4
7 272 64 34 9
8 71 -26
45
Source: Department of Trade, Business and Innovation
Chart 11: Count of filled jobs by gender and Aboriginal status of person in job, 2011, 2014 and 2017 (a)(c)(i)
Source: Department of Trade, Business and Innovation
In 2017 in Milingimbi: there were 145 jobs filled by males, an increase of 32 jobs from 2014 and an
increase of 90 jobs from 2011
2 4 Aboriginal filled jobs gender status not identified in 2017JOBS PROFILE MILINGIMBI
34

JOBS PROFILE MILINGIMBI35

of the 145 jobs filled by males:o 125 were Aboriginal, an increase of 55 jobs from 2014 and an increase of 92
jobs from 2011o 20 were non-Aboriginal, a decrease of 23 jobs from 2014 and a decrease of 2
jobs from 2011 there were 127 jobs filled by females, an increase of 13 jobs from 2014 and an
increase of 53 jobs from 2011 of the 127 jobs filled by females:
o 100 were Aboriginal, an increase of 16 jobs from 2014 and an increase of 43 jobs from 2011
o 27 were non-Aboriginal, a decrease of 3 jobs from 2014 and an increase of 10 jobs from 2011.
Table 21: Counts of filled jobs by gender, by Aboriginal status of person in the job, by full-time/part-time status, by job permanency and by sector 2011 (a)(b)(c)(d)(e)(i)
2011
Indicator
Male Female Total
Ab
orig
inal
Non
-Ab
orig
inal
Tot
al
Ab
orig
inal
Non
-Ab
orig
inal
Tot
al
Ab
orig
inal
Non
-Ab
orig
inal
Tot
al
Full-time 16 22 38 21 15 36 37 37 74Part-time 17 0 17 36 2 38 53 2 55Total 33 22 55 57 17 74 90 39 129
Permanent 23 12 35 35 11 46 58 23 81Temporary 10 10 20 22 6 28 32 16 48Total 33 22 55 57 17 74 90 39 129
Public Sector 21 17 38 29 16 45 50 33 83Private Sector 12 5 17 28 1 29 40 6 46Total 33 22 55 57 17 74 90 39 129
Source: Department of Trade, Business and Innovation
JOBS PROFILE MILINGIMBI36

Table 22: Counts of filled jobs by gender, by Aboriginal status of person in the job, by full-time/part-time status, by job permanency and by sector 2014 (a)(b)(c)(d)(e)(i)
2014
Indicator
Male Female Total
Ab
orig
inal
Non
-Ab
orig
inal
Tot
al
Ab
orig
inal
Non
-Ab
orig
inal
Tot
al
Ab
orig
inal
Non
-Ab
orig
inal
Tot
al
Full-time 23 39 62 26 26 52 49 65 114Part-time 47 4 51 58 4 62 105 8 113Total 70 43 113 84 30 114 154 73 227
Permanent 30 21 51 40 22 62 70 43 113Temporary 40 22 62 44 8 52 84 30 114Total 70 43 113 84 30 114 154 73 227
Public Sector 28 26 54 37 23 60 65 49 114Private Sector 42 17 59 47 7 54 89 24 113Total 70 43 113 84 30 114 154 73 227
Source: Department of Trade, Business and Innovation
Table 23: Counts of filled jobs by gender3, by Aboriginal status of person in the job, by full-time/part-time status, by job permanency and by sector 2017 (a)(b)(c)(d)(e)(i)
2017
Indi
cato
r
Male Female Total
Ab
orig
inal
Non
-Ab
orig
inal
Tot
al
Ab
orig
inal
Non
-Ab
orig
inal
Tot
al
Ab
orig
inal
Non
-Ab
orig
inal
Tot
al
Full-time 30 19 49 25 26 51 58 45 103Part-time 95 1 96 75 1 76 171 2 173Total 125 20 145 100 27 127 229 47 276
Permanent 45 10 55 53 13 66 100 23 123Temporary 80 10 90 47 14 61 129 24 153Total 125 20 145 100 27 127 229 47 276
Public Sector 30 7 37 27 19 46 59 26 85Private Sector 95 13 108 73 8 81 170 21 191Total 125 20 145 100 27 127 229 47 276
Source: Department of Trade, Business and Innovation
3 4 Aboriginal filled jobs gender status not identified in 2017JOBS PROFILE MILINGIMBI
37

In 2017 in Milingimbi: of the 145 jobs filled by males, there were:
o 125 jobs filled by Aboriginal males, an increase of 55 jobs from 2014 and an increase of 92 jobs from 2011, including: 30 full-time jobs, an increase of 7 jobs from 2014 and an increase of 14
jobs from 2011 95 part-time jobs, an increase of 48 jobs from 2014 and an increase of 78
jobs from 2011 45 permanent jobs, an increase of 15 jobs from 2014 and an increase of 22
jobs from 2011 80 temporary jobs, an increase of 40 jobs from 2014 and an increase of 70
jobs from 2011 30 public sector jobs, an increase of 2 jobs from 2014 and an increase of 9
jobs from 2011 95 private sector jobs, an increase of 53 jobs from 2014 and an increase of
83 jobs from 2011o 20 jobs filled by non-Aboriginal males, a decrease of 23 jobs from 2014 and
a decrease of 2 jobs from 2011, including: 19 full-time jobs, a decrease of 20 jobs from 2014 and a decrease of 3 jobs
from 2011 1 was a part-time job, a decrease of 3 jobs from 2014 and an increase of 1
job from 2011 10 permanent jobs, a decrease of 11 jobs from 2014 and a decrease of 2
jobs from 2011 10 temporary jobs, a decrease of 12 jobs from 2014 and unchanged from
2011 7 public sector jobs, a decrease of 19 jobs from 2014 and a decrease of 10
jobs from 2011 13 private sector jobs, a decrease of 4 jobs from 2014 and an increase of 8
jobs from 2011 of the 127 jobs filled by females, there were:
o 100 jobs filled by Aboriginal females, an increase of 16 jobs from 2014 and an increase of 43 jobs from 2011, including: 25 full-time jobs, a decrease of 1 job from 2014 and an increase of 4 jobs
from 2011 75 part-time jobs, an increase of 17 jobs from 2014 and an increase of 39
jobs from 2011 53 permanent jobs, an increase of 13 jobs from 2014 and an increase of 18
jobs from 2011 47 temporary jobs, an increase of 3 jobs from 2014 and an increase of 25
jobs from 2011
JOBS PROFILE MILINGIMBI38

JOBS PROFILE MILINGIMBI39

27 public sector jobs, a decrease of 10 jobs from 2014 and a decrease of 2 jobs from 2011
73 private sector jobs, an increase of 26 jobs from 2014 and an increase of 45 jobs from 2011
o 27 jobs filled by non-Aboriginal females, a decrease of 3 jobs from 2014 and an increase of 10 jobs from 2011, including: 26 full-time jobs, unchanged from 2014 and an increase of 11 jobs from
2011 1 was q part-time job, a decrease of 3 jobs from 2014 and a decrease of 1
job from 2011 13 permanent jobs, a decrease of 9 jobs from 2014 and an increase of 2
jobs from 2011 14 temporary jobs, an increase of 6 jobs from 2014 and an increase of 8
jobs from 2011 19 public sector jobs, a decrease of 4 jobs from 2014 and an increase of 3
jobs from 2011 8 private sector jobs, an increase of 1 job from 2014 and an increase of 7
jobs from 2011.
JOBS PROFILE MILINGIMBI40

Jobs by AgeTable 24: Counts of filled jobs by age and Aboriginal status of person employed in job, 2011, 2014 and 2017 (a)(c)(j)
Indicator
2011 2014 2017 Change2011-2014
Change2014-2017
Ab
orig
inal
Non
-Ab
orig
inal
Tot
al
Ab
orig
inal
Non
-Ab
orig
inal
Tot
al
Ab
orig
inal
Non
-Ab
orig
inal
Tot
al
Ab
orig
inal
Non
-Ab
orig
inal
Tot
al
Ab
orig
inal
Non
-Ab
orig
inal
Tot
al
15-24 years 0 2 2 11 3 14 13 2 15 11 1 12 2 -1 1
25-44 years 55 10 65 91 33 124
147 25 17
2 36 23 59 56 -8 48
45+ years 35 27 62 52 37 89 66 20 86 17 10 27 14 -17 -3
Total 90 39 129
154 73 22
7229 47 27
6 64 34 98 75 -26 49
Source: Department of Trade, Business and Innovation
Chart 12: Count of filled jobs by age and Aboriginal status of person in job, 2011, 2014 and 2017 (a)(c)(j)
Source: Department of Trade, Business and Innovation
In 2017 in Milingimbi there were: 15 jobs filled by persons aged 15-24 years, an increase of 1 job from 2014 and
an increase of 13 jobs from 2011. Of these:
JOBS PROFILE MILINGIMBI41

JOBS PROFILE MILINGIMBI42

o 13 jobs were filled by Aboriginal persons, an increase of 2 jobs from 2014 and an increase of 13 jobs from 2011
o 2 jobs were filled by non-Aboriginal persons, a decrease of 1 job from 2014 and unchanged from 2011
172 jobs filled by persons aged 25-44 years, an increase of 48 jobs from 2014 and an increase of 107 jobs from 2011. Of these:o 147 jobs were filled by Aboriginal persons, an increase of 56 jobs from 2014
and an increase of 92 jobs from 2011o 25 jobs were filled by non-Aboriginal persons, a decrease of 8 jobs from 2014
and an increase of 15 jobs from 2011 86 jobs filled by persons aged 45+ years, a decrease of 3 jobs from 2011 and an
increase of 24 jobs from 2011. Of these:o 66 jobs were filled by Aboriginal persons, an increase of 14 jobs from 2014
and an increase of 31 jobs from 2011o 20 jobs were filled by non-Aboriginal persons, a decrease of 17 jobs from
2014 and a decrease of 7 jobs from 2011.
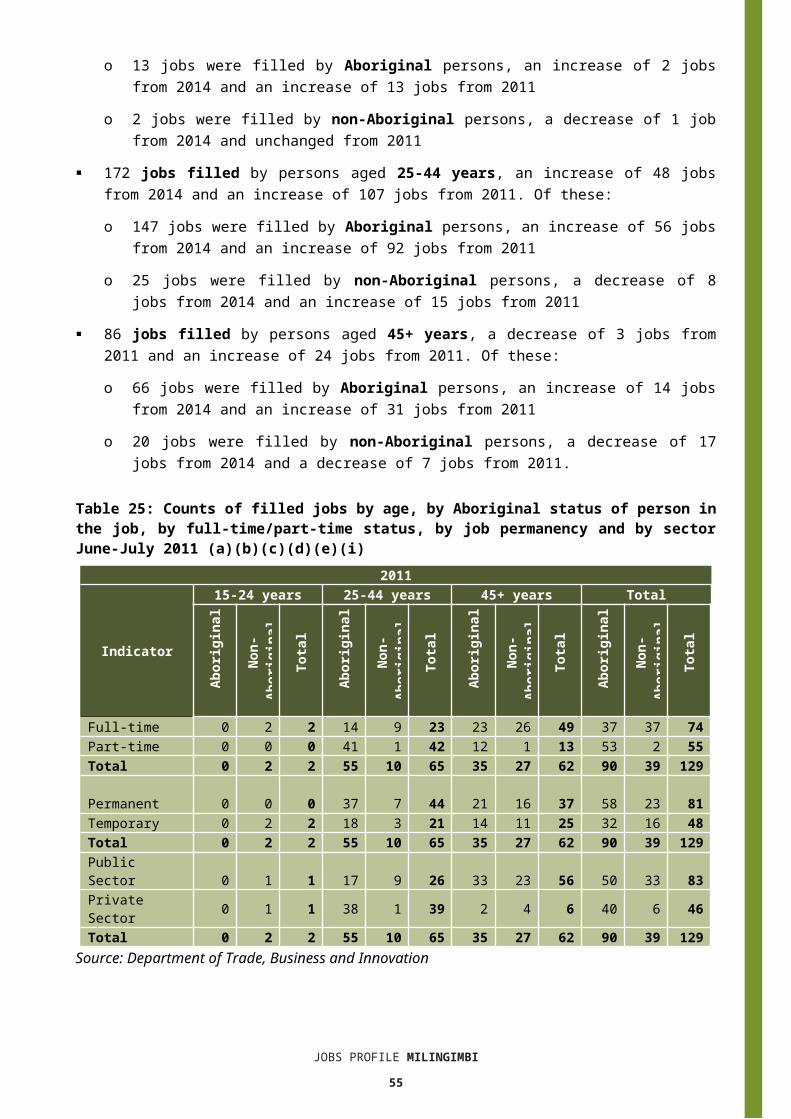
Table 25: Counts of filled jobs by age, by Aboriginal status of person in the job, by full-time/part-time status, by job permanency and by sector June-July 2011 (a)(b)(c)(d)(e)(i)
2011
Indicator
15-24 years 25-44 years 45+ years Total
Ab
orig
inal
Non
-Ab
orig
inal
Tot
al
Ab
orig
inal
Non
-Ab
orig
inal
Tot
al
Ab
orig
inal
Non
-Ab
orig
inal
Tot
al
Ab
orig
inal
Non
-Ab
orig
inal
Tot
alFull-time 0 2 2 14 9 23 23 26 49 37 37 74Part-time 0 0 0 41 1 42 12 1 13 53 2 55Total 0 2 2 55 10 65 35 27 62 90 39 129
Permanent 0 0 0 37 7 44 21 16 37 58 23 81Temporary 0 2 2 18 3 21 14 11 25 32 16 48Total 0 2 2 55 10 65 35 27 62 90 39 129
Public Sector 0 1 1 17 9 26 33 23 56 50 33 83Private Sector 0 1 1 38 1 39 2 4 6 40 6 46Total 0 2 2 55 10 65 35 27 62 90 39 129
Source: Department of Trade, Business and Innovation
JOBS PROFILE MILINGIMBI43

Table 26: Counts of filled jobs by age, by Aboriginal status of person in the job, by full-time/part-time status, by job permanency and by sector June-July 2014 (a)(b)(c)(d)(e)(i)
2014
Indicator
15-24 years 25-44 years 45+ years Total
Ab
orig
inal
Non
-Ab
orig
inal
Tot
al
Ab
orig
inal
Non
-Ab
orig
inal
Tot
al
Ab
orig
inal
Non
-Ab
orig
inal
Tot
al
Ab
orig
inal
Non
-Ab
orig
inal
Tot
al
Full-time 1 1 2 26 30 56 22 34 56 49 65 114Part-time 10 2 12 65 3 68 30 3 33 105 8 113Total 11 3 14 91 33 124 52 37 89 154 73 227
Permanent 2 1 3 37 19 56 31 23 54 70 43 113Temporary 9 2 11 54 14 68 21 14 35 84 30 114Total 11 3 14 91 33 124 52 37 89 154 73 227
Public Sector 2 2 4 33 24 57 30 23 53 65 49 114Private Sector 9 1 10 58 9 67 22 14 36 89 24 113Total 11 3 14 91 33 124 52 37 89 154 73 227Source: Department of Trade, Business and Innovation
Table 27: Counts of filled jobs by age, by Aboriginal status of person in the job, by full-time/part-time status, by job permanency and by sector June-July 2017 (a)(b)(c)(d)(e)(i)
2017
Indicator
15-24 years 25-44 years 45+ years Total
Ab
orig
inal
Non
-Ab
orig
inal
Tot
al
Ab
orig
inal
Non
-Ab
orig
inal
Tot
al
Ab
orig
inal
Non
-Ab
orig
inal
Tot
al
Ab
orig
inal
Non
-Ab
orig
inal
Tot
al
Full-time 1 2 3 36 24 60 18 19 37 58 45 103Part-time 12 0 12 111 1 112 48 1 49 171 2 173Total 13 2 15 147 25 172 66 20 86 229 47 276
Permanent 2 1 3 61 13 74 35 9 44 100 23 123Temporary 11 1 12 86 12 98 31 11 42 129 24 153Total 13 2 15 147 25 172 66 20 86 229 47 276
Public Sector 0 1 1 39 13 52 18 12 30 59 26 85Private Sector 13 1 14 108 12 120 48 8 56 170 21 191Total 13 2 15 147 25 172 66 20 86 229 47 276Source: Department of Trade, Business and Innovation
JOBS PROFILE MILINGIMBI44

In 2017 in Milingimbi: of the 15 jobs filled by persons aged 15-24 years, there were:
o 13 jobs filled by Aboriginal persons, of which: 1 was a full-time job, unchanged from 2014 and an increase of 1 job from
2011 12 were part-time jobs, an increase of 2 jobs from 2014 and an increase of
12 jobs from 2011 2 were permanent jobs, unchanged from 2014 and an increase of 2 jobs
from 2011 11 were temporary jobs, an increase of 2 jobs from 2014 and an increase
of 11 jobs from 2011 none were public sector jobs, a decrease of 2 jobs from 2014 and
unchanged from 2011 13 were private sector jobs, an increase of 4 jobs from 2014 and an
increase of 13 jobs from 2011o 2 jobs filled by non-Aboriginal persons, of which:
2 were full-time jobs, an increase of 1 job from 2014 and unchanged from 2011
none were part-time jobs, a decrease of 2 jobs from 2014 and unchanged from 2011
1 was a permanent job, unchanged from 2014 and an increase of 1 job from 2011
1 was a temporary job, a decrease of 1 job from 2014 and a decrease of 1 job from 2011
1 was a public sector job, a decrease of 1 job from 2014 and unchanged from 2011
1 was a private sector job, unchanged from 2014 and unchanged from 2011
of the 172 jobs filled by persons aged 25-44 years, there were:o 147 jobs filled by Aboriginal persons, of which:
36 were full-time jobs, an increase of 10 jobs from 2014 and an increase of 22 jobs from 2011
111 were part-time jobs, an increase of 46 jobs from 2014 and an increase of 70 jobs from 2011
61 were permanent jobs, an increase of 24 jobs from 2014 and an increase of 24 jobs from 2011
86 were temporary jobs, an increase of 32 jobs from 2014 and an increase of 68 jobs from 2011
39 were public sector jobs, an increase of 6 jobs from 2014 and an increase of 22 jobs from 2011
JOBS PROFILE MILINGIMBI45

108 were private sector jobs, an increase of 50 jobs from 2014 and an increase of 70 jobs from 2011
o 25 jobs filled by non-Aboriginal persons, of which: 24 were full-time jobs, a decrease of 6 jobs from 2014 and an increase of
15 jobs from 2011 1 was a part-time job, a decrease of 2 jobs from 2014 and unchanged from
2011 13 were permanent jobs, a decrease of 6 jobs from 2014 and an increase
of 6 jobs from 2011 12 were temporary jobs, a decrease of 2 jobs from 2014 and an increase of
9 jobs from 2011 13 were public sector jobs, a decrease of 11 jobs from 2014 and an
increase of 4 jobs from 2011 12 were private sector jobs, an increase of 3 jobs from 2014 and an
increase of 11 jobs from 2011 of the 86 jobs filled by persons aged 45+ years, there were:
o 66 jobs filled by Aboriginal persons, of which: 18 were full-time jobs, a decrease of 4 jobs from 2014 and a decrease of 5
jobs from 2011 48 were part-time jobs, an increase of 18 jobs from 2014 and an increase
of 36 jobs from 2011 35 were permanent jobs, an increase of 4 jobs from 2014 and an increase
of 14 jobs from 2011 31 were temporary jobs, an increase of 10 jobs from 2014 and an increase
of 17 jobs from 2011 18 were public sector jobs, a decrease of 12 jobs from 2014 and a
decrease of 15 jobs from 2011 48 were private sector jobs, an increase of 26 jobs from 2014 and an
increase of 46 jobs from 2011o 20 jobs filled by non-Aboriginal persons, of which:
19 were full-time jobs, a decrease of 15 jobs from 2014 and a decrease of 7 jobs from 2011
1 was a part-time job, a decrease of 2 jobs from 2014 and unchanged from 2011
9 were permanent jobs, a decrease of 14 jobs from 2014 and a decrease of 7 jobs from 2011
11 were temporary jobs, a decrease of 3 jobs from 2014 and unchanged from 2011
12 were public sector jobs, a decrease of 11 jobs from 2014 and a decrease of 11 jobs from 2011
8 were private sector jobs, a decrease of 6 jobs from 2014 and an increase JOBS PROFILE MILINGIMBI
46

of 4 jobs from 2011.
JOBS PROFILE MILINGIMBI47

Vocational Education and TrainingNote: Since previous publications, the 2010 data have fallen in line with the new standardised
reporting practices with an emphasis of all training activity undertaken in the remote town regardless of funding stream. As such, figures for 2010 VET data in this publication may differ from previous publications.
The impact of the Remote Jobs and Communities Program (RJCP) being established in 2013 has played a significant role in the downturn of accredited training in many remote towns across the Territory.
Table 28: Northern Territory Vocational Education and Training (VET) students, 2010, 2013 and 2016 (k)
VET Funding Group2010 2013 2016 Change
No. % of Total No. % of
Total No. % of Total
2010-
2013
2013-
2016Arts, Entertainment, Sports and Recreation 26 13 61 25 7 3 35 - 54Automotive 2 1 2 1 0 0 0 - 2Building and Construction 33 17 25 10 53 24 - 8 28Business and Clerical 15 8 1 0 0 0 - 14 - 1Community Services, Health and Education 48 24 31 13 72 32 - 17 41Engineering and Mining 0 0 8 3 1 0 8 - 7Finance, Banking and Insurance 7 4 3 1 3 1 - 4 0General Education and Training 2 1 16 7 0 0 14 - 16Primary Industry 0 0 28 12 38 17 28 10Sales and Personal Service 41 21 67 28 21 9 26 - 46Tourism and Hospitality 12 6 0 0 9 4 - 12 9Transport and Storage 10 5 0 0 19 9 - 10 19Total 196 100 242 100 223 100 46 - 19
Source: Department of Trade, Business and Innovation
In 2016 in Milingimbi: there were 223 VET students, a decrease of 19 students from 2013 and an
increase of 27 students from 2010 the areas of VET activity with the most students were Community Services, Health
and Education (72), Building and Construction (53), and Primary Industry (38) Community Services, Health and Education reported the largest increase in
students (41) compared to 2013 and Arts, Entertainment, Sports and Recreation reported the largest decrease in students (-54) over the same period.
JOBS PROFILE MILINGIMBI48

Table 29: Northern Territory Vocational Education and Training (VET) unit enrolments, 2010, 2013 and 2016 (l)
VET Funding Group2010 2013 2016 Change
No. % of Total No. % of
Total No. % of Total
2010-2013
2013-2016
Arts, Entertainment, Sports and Recreation 146 19 239 22 56 4 93 - 183Automotive 5 1 8 1 0 0 3 - 8Building and Construction 103 13 110 10 323 25 7 213Business and Clerical 15 2 10 1 0 0 - 5 - 10Community Services, Health and Education 115 15 99 9 337 26 - 16 238Engineering and Mining 0 0 31 3 1 0 31 - 30Finance, Banking and Insurance 28 4 10 1 12 1 - 18 2General Education and Training 4 1 39 4 0 0 35 - 39Primary Industry 0 0 116 11 169 13 116 53Sales and Personal Service 197 26 432 39 155 12 235 - 277Tourism and Hospitality 45 6 0 0 54 4 - 45 54Transport and Storage 110 14 0 0 199 15 - 110 199Total 768 100 1 094 100 1 306 100 326 212Source: Department of Trade, Business and Innovation
In 2016 in Milingimbi: there were 1306 VET unit enrolments, an increase of 212 unit enrolments from
2013 and an increase of 538 unit enrolments from 2010 the areas of VET activity with the most unit enrolments were Community Services,
Health and Education (337), Building and Construction (323), and Transport and Storage (199)
Community Services, Health and Education reported the largest increase in unit enrolments (238) compared to 2013 and Sales and Personal Service reported the largest decrease in unit enrolments (-277) over the same period.
JOBS PROFILE MILINGIMBI49

Table 30: Northern Territory Vocational Education and Training (VET) nominal hours, 2010, 2013 and 2016 (m)
VET Funding Group
2010 2013 2016 Change
No.% of
Total
No.% of
Total
No.% of Tota
l2010-2013
2013-2016
Arts, Entertainment, Sports and Recreation 5 820 25 7 044 21 0 0 1 224 -7 044Automotive 105 0 115 0 0 0 10 - 115Building and Construction 3 036 13 4 536 14 5 003 29 1 500 467Business and Clerical 300 1 430 1 0 0 130 - 430Community Services, Health and Education 3 157 14 3 147 9 815 5 - 10 -2 332Engineering and Mining 0 0 1 408 4 20 0 1 408 -1 388Finance, Banking and Insurance 915 4 275 1 255 1 - 640 - 20General Education and Training 280 1 1 160 3 0 0 880 -1 160Primary Industry 0 0 4 620 14 4 430 26 4 620 - 190Sales and Personal Service 5 815 25 10
788 32 3 375 20 4 973 -7 413Tourism and Hospitality 694 3 0 0 1 008 6 - 694 1 008Transport and Storage 3 000 13 0 0 2 345 14 -3 000 2 345Total 23
122 100 33 523 100 17
251 100 10 401
-16 272
Source: Department of Trade, Business and Innovation
In 2016 in Milingimbi: there were 17 251 VET nominal hours delivered, a decrease of 16 272 nominal
hours delivered from 2013 and a decrease of 5871 nominal hours delivered from 2010
the areas of VET activity with the most nominal hours delivered were Building and Construction (5003), Primary Industry (4430), and Sales and Personal Service (3375)
Transport and Storage reported the largest increase in nominal hours delivered (2345) compared to 2013 and Sales and Personal Service reported the largest decrease in nominal hours delivered (-7413) over the same period.
Caveat: Nominal hours are based on the hours funded through Department of Trade Business and Innovation contracts; students and units includes delivery that has been funded in a previous year, fee for service or training that did not meet the funding requirements. Because of this a direct match cannot be made between hours and student/units.
JOBS PROFILE MILINGIMBI50

Table 31: Northern Territory Vocational Education and Training (VET) unit completions, 2010, 2013 and 2016 (n)
VET Funding Group2010 2013 2016 Change
No. % of Total No. % of
Total No. % of Total
2010-2013
2013-2016
Arts, Entertainment, Sports and Recreation 2 0 75 13 8 1 73 - 67Automotive 4 1 7 1 0 0 3 - 7Building and Construction 62 13 25 4 207 23 - 37 182Business and Clerical 0 0 10 2 0 0 10 - 10Community Services, Health and Education 73 16 50 9 144 16 - 23 94Engineering and Mining 0 0 9 2 0 0 9 - 9Finance, Banking and Insurance 12 3 8 1 4 0 - 4 - 4General Education and Training 0 0 14 2 0 0 14 - 14Primary Industry 0 0 102 17 151 17 102 49Sales and Personal Service 184 40 283 49 140 16 99 - 143Tourism and Hospitality 17 4 0 0 48 5 - 17 48Transport and Storage 110 24 0 0 198 22 - 110 198Total 464 100 583 100 900 100 119 317Source: Department of Trade, Business and Innovation
In 2016 in Milingimbi: there were 900 VET unit completions, an increase of 317 unit completions from
2013 and an increase of 436 unit completions from 2010 the areas of VET activity with the most unit completions were Building and
Construction (207), Transport and Storage (198), and Primary Industry (151) Transport and Storage reported the largest increase in nominal hours delivered
(198) compared to 2013 and Sales and Personal Service reported the largest decrease in nominal hours delivered (-143) over the same period.
JOBS PROFILE MILINGIMBI51

PopulationTable 32: Population distribution by gender and age (p)(r)
Indicator2006 2016 Change
Male Female Total Male Femal
e Total Male Female Total
0-4 years 56 33 89 54 49 103 -2 16 145-14 years 53 69 122 143 113 256 90 44 13415-24 years 111 112 223 151 123 274 40 11 5125-44 years 190 194 384 250 228 478 60 34 9445-64 years 97 79 176 135 132 267 38 53 9165+ years 7 17 24 17 19 36 10 2 12TOTAL 514 504 1018 750 664 1414 236 160 396Source: Department of Trade, Business and Innovation
In 2016 in Milingimbi: there were an estimated 1414 persons, of which:
o 750 (53%) were maleo 664 (47%) were female
between 2006 and 2016, the overall population in Milingimbi increased by 396 persons from 2006, or an average of 3.3% per year compared to 0.7% across the 28 remote towns and 1.5% Territory wide
the male population increased by 236 persons from 2006 the female population increased by 160 persons from 2006 in 2016, the working age population (15 years and over) in Milingimbi was an
estimated 1055 persons (74.6% of the total population) compared with 807 persons (79.3% of the total population) in 2006. Of these:o 274 (19.4%) were between 15 and 24 years of ageo 478 (33.8%) were between 25 and 44 years of ageo 267 (18.9%) were between 45 and 64 years of ageo 36 (2.5%) were over 65 years of age
of the 1055 persons of working age:o 553 (52.4%) were maleo 502 (47.6%) were female.
There were 0.3 jobs in Milingimbi per working age person compared to 0.4 jobs per working age person across the 28 remote towns in the Northern Territory.
JOBS PROFILE MILINGIMBI52

Chart 13: Population by Aboriginal status compared to the 28 remote towns and the NT (p)(q)
Source: Department of Trade, Business and Innovation
In 2016 in Milingimbi: 95.2% of the population in Milingimbi were Aboriginal, compared to 95.3% in
2006 89.4% of the population across all 28 remote towns were Aboriginal 28.3% of the Northern Territory population were Aboriginal.
Table 33: Unemployment and participation rates by Aboriginal status compared to the NT (q)
Milingimbi Northern Territory
AboriginalNon-
Aboriginal
Total AboriginalNon-
Aboriginal
Total
Unemployment rate 40.9% 0.0% 35.1% 26.7% 3.8% 7.0%
Participation rate 35.4% 88.5% 38.6% 41.0% 79.9
% 70.6%
Source: Department of Trade, Business and Innovation
In 2016 in Milingimbi the: total unemployment rate was 35.1% compared to 7% for the total Northern
Territory Aboriginal unemployment rate was 40.9% compared to 26.7% for the total
Northern Territory non-Aboriginal unemployment rate was 0% compared to 3.8% for the total
Northern TerritoryJOBS PROFILE MILINGIMBI
53

total participation rate was 38.6% compared to 70.6% for the total Northern Territory
Aboriginal participation rate was 35.4% compared to 41% for the total Northern Territory
non-Aboriginal participation rate was 88.5% compared to 79.9% for the total Northern Territory.
JOBS PROFILE MILINGIMBI54
Community Development ProgrammeTable 34: Community Development Programme Aboriginal Job Seekers, 30 April 2018 (o)
Indicator AboriginalNo. %
Total Aboriginal Job Seekers 277 N/AAge (years)
15-24 41 14.825-44 156 56.345+ 80 28.9
Total 277 100.0Gender
Male 161 58.1Female 116 41.9
Total 277 100.0Employment Outcome - 1 July 2015 to 30 April 2018
13 Weeks 129 59.726 Weeks 87 40.3
Currently in Activities 203 Source: Department of Prime Minister and Cabinet
Chart 14: Community Development Programme Aboriginal Job Seekers by Gender and Age Group, 30 April 2018 (o)
16158.1%
11641.9%
Gender
Male Female
4114.8%
15656.3%
8028.9%
Age (years)
15-24 25-44 45+
Source: Department of Prime Minister and Cabinet
As at 30 April 2018, in Milingimbi, there were 277 CDP Aboriginal job seekers, of these: 161 (58.1%) were male and 116 (41.9%) were female 41 (14.8%) were aged 15-24 years, 156 (56.3%) were aged 25-44 years, and 80
(28.9%) were aged 45+ years between 1 July 2015 and 30 April 2018, 129 had reached the 13 week reporting
milestone and 87 had reached the 26 week reporting milestone 203 were currently in activities.
JOBS PROFILE MILINGIMBI55

JOBS PROFILE MILINGIMBI56

BusinessesTable 35: Businesses by sector (d)(s)
Business NameReported on in 2011?
Reported on in 2014?
Reported on in 2017?
PUBLIC SECTOR Department of Education Yes Yes YesDepartment of Health Yes Yes NoDepartment of the Prime Minister and Cabinet Yes Yes YesEast Arnhem Regional Council Yes Yes YesPRIVATE SECTORAbacus Plumbing and Electrical Pty Ltd No Yes NoAir Frontier Pty Ltd No Yes YesMAF International trading as Mission Aviation Fellowship Yes Yes YesMenzies School of Health Research Yes No NoMilingimbi & Outstations Progress Resource Assn Inc (MOPRA) No Yes Yes
Milingimbi Art and Culture Centre No Yes YesMiwatj Health Aboriginal Corporation No No YesSteps Group Australia Limited No Yes YesThe Arnhem Land Progress Aboriginal Corporation (ALPA) Yes Yes YesThe Trustee for Bukmak Constructions Trust - Bukmak Constructions - ALPA No No YesThe Trustee for Rulku Enterprises Trust t/a Rulku Lodge - ALPA No No Yes
Traditional Credit Union (TCU) Yes Yes YesSource: Department of Trade, Business and Innovation
Note: Business names captured across the three survey periods have been identified by the current 2017 Business ABN name listed as at 2017.
In 2017 in Milingimbi: there were 13 businesses reported on, of which:
o 3 businesses were from the public sector (23%)o 10 businesses were from the private sector (77%)
there were 7 businesses operating that were not operating in 2011.
JOBS PROFILE MILINGIMBI57
Notes(a) These counts represent numbers of filled jobs and not numbers of persons. As such the
totals represent the total number of filled jobs, not the total number of employees. This count is not directly comparable to the total number of employed persons as a person may have several jobs or one job may be shared by more than one person.
(b) Full-time is defined as a job usually requiring 35 hours or more per week or that required 35 hours or more work during the reference week. Part-time is defined as a job usually requiring less than 35 hours per week or that required less than 35 hours work during the reference week. The reference week refers to the period that respondents were asked to provide information about. In most instances it would be the week prior to the week the questionnaire was completed. Questionnaires were predominantly conducted in June and July.
(c) Care needs to be taken when analysing the counts of filled jobs by the Aboriginal status of persons in the jobs. The Aboriginal status of the person employed in a job was reported by the business representative completing the questionnaire.
(d) Sector was classified using the Standard Economic Sector of Classifications of Australia (SESCA), 2008.
(e) Job permanency is classified according to what the business believes the level of job permanency is based on guidelines provided by data collectors. Those guidelines state a permanent job has paid annual and/or sick leave entitlements while a temporary job includes casual and fixed-term contract jobs.
(f) Classified according to the Australian and New Zealand Standard Classification of Occupations (ANZSCO), 2006, major occupation level.
(g) Other occupations include jobs where occupation was not stated, not known or inadequately described.
(h) Classified using the Australian and New Zealand Standard Industrial Classification (ANZSIC), 2006, division level.
(i) Care needs to be taken when analysing the counts of filled jobs by the gender of persons in the jobs. The gender of the person employed in a job is reported by the business representative completing the questionnaire.
(j) Care needs to be taken when analysing the counts of filled jobs by the age of persons in the jobs. The age of the person employed in a job is reported by the business representative completing the questionnaire.
(k) Students represent the number of individual clients that enrolled in a Vocational Education and Training unit during the calendar year.
(l) Unit enrolments represent the count of individual units that students enrolled in during the calendar year.
(m)Nominal hours delivered is the sum of the nominal hours of the units commenced during the calendar year regardless of when the course enrolment commenced.
(n) Unit completions are the count of all successfully completed units reported in the calendar year regardless of the year of commencement of the units.
(o) The Community Development Programme (CDP) supports job seekers in remote Australia to build skills, address barriers and contribute to their communities through a range of flexible activities. Under the CDP, job seekers with activity requirements are expected to do up to 25 hours per week of work-like activities that benefit their community. It should be noted that some CDP participants may be reported on within the profile if they are attached to a filled position with an employer captured in the survey. Due to confidentiality issues, data below 20 people is not published.
(p) Population estimates for both 2006 and 2016 are taken from the estimated resident population (ERP) data produced by the Australian Bureau of Statistics (ABS) and based on Australian Statistical Geography Standard (ASGS) Statistical Area Level 1 (SA1) regions. ERP are official estimates of the Australian population, which link people to a place of usual residence with Australia. All ERP data sources, including the Census of Population and Housing (Census), are subject to error (including inaccuracies in collection, recording and processing data) and should be used with caution.
(q) Indigenous population proportions, unemployment and workforce participation rates are based on ABS Census counts at ASGS Indigenous Locations (ILOCs) for each remote town.
(r) Working-age population includes all residents aged 15 years and over (commonly referred to as the civilian population) and consists of persons that are employed, unemployed or not in the labour force.
JOBS PROFILE MILINGIMBI58
(s) A ‘business’ has been defined as any organisation that has undertaken productive activities in the last year, including companies, non-profit organisations, government departments and enterprises operating within the designated remote geography (town), and has one or more employees in paid employment and an Australian Business Number (ABN).
JOBS PROFILE MILINGIMBI59

Abbreviations and AcronymsABN Australian Business NumberABS Australian Bureau of StatisticsANZSCO Australian and New Zealand Standard Classification of OccupationsANZSIC Australian and New Zealand Standard Industrial ClassificationASGS Australian Statistical Geography StandardCDP Community Development ProgrammeERP Estimated Resident PopulationILOC Indigenous Locations nec Not Elsewhere ClassifiedNo. NumberPerm Permanentppt Percentage pointRJCP Remote Jobs and Communities ProgramTemp TemporarySA1 Statistical Area Level 1VET Vocational Education and Training
JOBS PROFILE MILINGIMBI60