Milford Investment Funds Monthly Review September 2021
12
Food for thought As we head into the final quarter of the year, investors have an awful lot to contend with. Many of these issues came to the fore last month, with global share markets posting their biggest monthly fall in a year. Some defensive positions helped cushion the Funds from this volatility. The potential collapse of China’s second largest property developer, Evergrande, made global headlines. It’s likely that any collapse will be carefully managed by the Chinese authorities; of bigger concern is the medium-term implications of China’s pivot away from using property to stimulate growth. Lower Chinese property investment has seen iron ore prices collapse. Anticipating this, we significantly reduced our exposure to Australian iron ore miners, helping insulate fund returns from the sharp falls in mining stocks this month. Instead, large holdings in defensive Australian companies such as Telstra and Charter Hall Group delivered positive returns in September. The other big change facing investors is tightening central bank policy. Robust global growth and persistent inflation mean central banks may start to withdraw stimulus over the next few months. This has sent global bond yields higher, with bond prices commensurately lower. For diversified funds that hold bonds this can be a drag on returns, but Milford’s Funds have protected against this scenario of rising interest rates by holding a significantly lower exposure to bonds over the past few quarters. Surging inflation also affects company profits. At a broad level, will consumers accept higher prices or will demand suffer? At a micro level, complex global supply chains are suffering major Covid related disruptions. How companies and industries will deal with this will be revealed in October as US companies report third quarter profits. Weaker share markets in September suggest investor expectations are being pared back. The outlook remains reasonable, even if there are some evident near-term risks. With the pandemic receding in the Western world, consumer spending should remain robust as social restrictions fade. Both government and central bank policy remains supportive, even if both are becoming less so. The devil is in the detail; the environment is conducive to creating winners and losers, we remain confident that our investment process can lead us to the former. Milford Investment Funds Monthly Review October 2021 Milford Asset Management Level 28, 48 Shortland Street, Auckland, 1010 Phone: 0800 662 345 Email: [email protected] milfordasset.com
Transcript of Milford Investment Funds Monthly Review September 2021

Food for thoughtAs we head into the final quarter of the year,investors have an awful lot to contend with. Manyof these issues came to the fore last month, withglobal share markets posting their biggestmonthly fall in a year. Some defensive positionshelped cushion the Funds from this volatility.
The potential collapse of China’s second largestproperty developer, Evergrande, made globalheadlines. It’s likely that any collapse will becarefully managed by the Chinese authorities; ofbigger concern is the medium-term implicationsof China’s pivot away from using property tostimulate growth.
Lower Chinese property investment has seen ironore prices collapse. Anticipating this, wesignificantly reduced our exposure to Australianiron ore miners, helping insulate fund returns fromthe sharp falls in mining stocks this month.Instead, large holdings in defensive Australiancompanies such as Telstra and Charter Hall Groupdelivered positive returns in September.
The other big change facing investors istightening central bank policy. Robust globalgrowth and persistent inflation mean centralbanks may start to withdraw stimulus over thenext few months. This has sent global bond yields
higher, with bond prices commensurately lower.For diversified funds that hold bonds this can be adrag on returns, but Milford’s Funds haveprotected against this scenario of rising interestrates by holding a significantly lower exposure tobonds over the past few quarters.
Surging inflation also affects company profits. Ata broad level, will consumers accept higher pricesor will demand suffer? At a micro level, complexglobal supply chains are suffering major Covidrelated disruptions. How companies and industrieswill deal with this will be revealed in October asUS companies report third quarter profits. Weakershare markets in September suggest investorexpectations are being pared back.
The outlook remains reasonable, even if there aresome evident near-term risks. With the pandemicreceding in the Western world, consumerspending should remain robust as socialrestrictions fade. Both government and centralbank policy remains supportive, even if both arebecoming less so. The devil is in the detail; theenvironment is conducive to creating winners andlosers, we remain confident that our investmentprocess can lead us to the former.
Milford Investment FundsMonthly Review October 2021
Milford Asset ManagementLevel 28, 48 Shortland Street, Auckland, 1010Phone: 0800 662 345Email: [email protected]

Milford Investment Funds Monthly Review as at 30 September 2021
Conservative FundPortfolio Manager: Paul Morris
The market volatility we had been wary of duly arrived in September. Bonds were weaker asmarket interest rates rose while shares were generally weaker. This resulted in a 0.5% loss inthe month but the Fund has returned 4.7% over 1-year.
Market interest rates rose reflecting expectations that the removal of emergency monetarypolicy settings is approaching. This weighed on many income-oriented shares but alsoshares of high growth companies (which have benefitted from lower rates). There is alsowariness that company earnings could be negatively impacted by supply shortages andhigher input costs. To an extent we were able to cushion returns from these headwindsthrough a lower than long-term neutral exposure to bonds and interest rates, but also byprogressively reducing share exposure during the month as it became clear risks weregrowing.
Looking forward, the medium-term economic and market outlook remains constructive butthe reopening from Delta is proving complicated which (i) increases near-term companyearnings risks and (ii) means labour and logistics issues keep inflation risks elevated.Markets also need to navigate likely waning monetary policy support, just as fiscal supportalso falls away. To traverse this tricky backdrop, we will for now retain what has become amore conservative setting, specifically with less shares but more bonds and cash than inrecent months. We will also limit interest rate exposure to cushion from rising rates. We willhowever look for weakness in markets to add selectively to bonds and shares of thosecompanies we believe will deliver attractive medium-term returns.
Actual investment mix1
Effective Cash#
13.22%New Zealand FixedInterest 22.98%International FixedInterest 48.47%New Zealand Equities2.72%
Australian Equities2.69%International Equities6.89%Listed Property 3.00%
Other* 0.03%
# The actual cash held by the Fund is 10.76%.Effective Cash reported above is adjusted to reflectthe Fund's notional positions (e.g. derivatives usedto increase or reduce market exposure).
Diversified Income FundPortfolio Manager: Paul Morris
The market volatility we had been wary of duly arrived in September, but the Fund stillmanaged to eke out a small positive return of 0.1%. Bonds were weaker as market interestrates rose while, excluding some outperformance in NZ, shares were generally weaker.
Market interest rates rose reflecting central bank signals that the removal of emergencymonetary policy settings is approaching. This weighed on income-oriented shares andshares of high growth companies (which have benefitted from lower rates) but there is alsowariness that company earnings may be negatively impacted by supply shortages andhigher input costs. The Fund’s lower interest rate exposure (which we retain) and belowlong-run neutral exposure to bonds cushioned returns from rising interest rates. The lowerthan historic allocation to income-oriented shares also helped, as the Fund’s reopeningwinners (e.g. Spanish airports Aena up 10.4%) and cyclical shares (e.g. Australian energycompany Santos up 18.5%) outperformed. Importantly, we reduced share exposure duringthe month which further limited losses.
Looking forward, the medium-term economic and market outlook remains constructive butthe reopening from Delta is proving complicated which (i) increases near-term companyearnings risks and (ii) means labour and logistics issues keep inflation risks elevated.Moreover, markets need to navigate likely waning monetary policy support, just as fiscalsupport also falls away. This is a tricky backdrop to traverse and so for now we keep thismore moderately conservative setting, specifically with less shares but more bonds andcash than in recent months. However, we will look for weakness in markets to addselectively to bonds and shares of those companies we believe will deliver attractivemedium-term returns.
Effective Cash# 8.34%
New Zealand FixedInterest 8.21%International FixedInterest 46.74%New Zealand Equities9.80%
Australian Equities9.69%International Equities6.71%Listed Property10.37%
Other* 0.14%
# The actual cash held by the Fund is 4.98%.Effective Cash reported above is adjusted to reflectthe Fund's notional positions (e.g. derivatives usedto increase or reduce market exposure).
*Other includes currency derivatives used to manage foreign exchange risk.1The actual investment mix incorporates the notional exposure value of equity derivatives and credit default swaps, where applicable.
Milford Investment Funds Monthly Review as at 30 September 2021
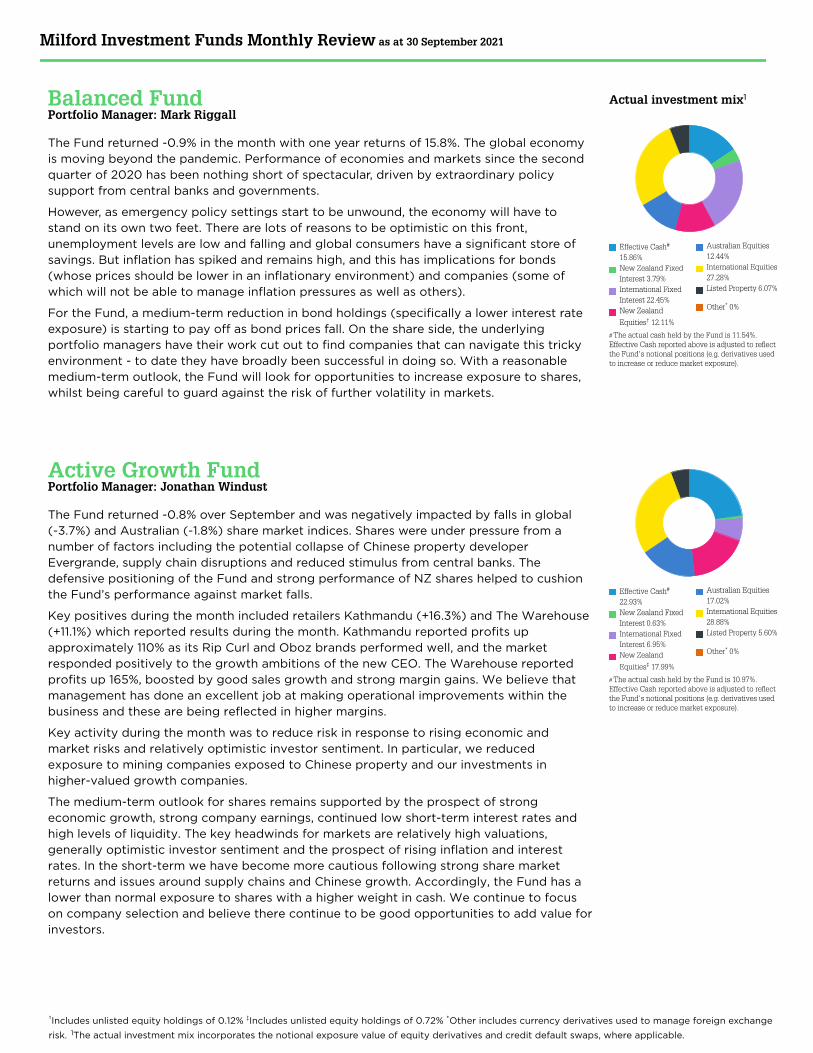
Actual investment mix1
Effective Cash#
15.86%New Zealand FixedInterest 3.79%International FixedInterest 22.45%New Zealand
Equities† 12.11%
Australian Equities12.44%International Equities27.28%Listed Property 6.07%
Other* 0%
# The actual cash held by the Fund is 11.54%.Effective Cash reported above is adjusted to reflectthe Fund's notional positions (e.g. derivatives usedto increase or reduce market exposure).
Balanced FundPortfolio Manager: Mark Riggall
The Fund returned -0.9% in the month with one year returns of 15.8%. The global economy is moving beyond the pandemic. Performance of economies and markets since the second quarter of 2020 has been nothing short of spectacular, driven by extraordinary policy support from central banks and governments.
However, as emergency policy settings start to be unwound, the economy will have to stand on its own two feet. There are lots of reasons to be optimistic on this front, unemployment levels are low and falling and global consumers have a significant store of savings. But inflation has spiked and remains high, and this has implications for bonds(whose prices should be lower in an inflationary environment) and companies (some of which will not be able to manage inflation pressures as well as others).
For the Fund, a medium-term reduction in bond holdings (specifically a lower interest rate exposure) is starting to pay off as bond prices fall. On the share side, the underlying portfolio managers have their work cut out to find companies that can navigate this tricky environment - to date they have broadly been successful in doing so. With a reasonable medium-term outlook, the Fund will look for opportunities to increase exposure to shares, whilst being careful to guard against the risk of further volatility in markets.
Active Growth FundPortfolio Manager: Jonathan Windust
The Fund returned -0.8% over September and was negatively impacted by falls in global (-3.7%) and Australian (-1.8%) share market indices. Shares were under pressure from a number of factors including the potential collapse of Chinese property developer Evergrande, supply chain disruptions and reduced stimulus from central banks. The defensive positioning of the Fund and strong performance of NZ shares helped to cushion the Fund’s performance against market falls.
Key positives during the month included retailers Kathmandu (+16.3%) and The Warehouse (+11.1%) which reported results during the month. Kathmandu reported profits up approximately 110% as its Rip Curl and Oboz brands performed well, and the market responded positively to the growth ambitions of the new CEO. The Warehouse reported profits up 165%, boosted by good sales growth and strong margin gains. We believe that management has done an excellent job at making operational improvements within the business and these are being reflected in higher margins.
Key activity during the month was to reduce risk in response to rising economic and market risks and relatively optimistic investor sentiment. In particular, we reduced exposure to mining companies exposed to Chinese property and our investments in higher-valued growth companies.
The medium-term outlook for shares remains supported by the prospect of strong economic growth, strong company earnings, continued low short-term interest rates and high levels of liquidity. The key headwinds for markets are relatively high valuations, generally optimistic investor sentiment and the prospect of rising inflation and interest rates. In the short-term we have become more cautious following strong share market returns and issues around supply chains and Chinese growth. Accordingly, the Fund has a lower than normal exposure to shares with a higher weight in cash. We continue to focus on company selection and believe there continue to be good opportunities to add value for investors.
Effective Cash#
22.93%New Zealand FixedInterest 0.63%International FixedInterest 6.95%New Zealand
Equities‡ 17.99%
Australian Equities17.02%International Equities28.88%Listed Property 5.60%
Other* 0%
# The actual cash held by the Fund is 10.97%.Effective Cash reported above is adjusted to reflectthe Fund's notional positions (e.g. derivatives usedto increase or reduce market exposure).
†Includes unlisted equity holdings of 0.12% ‡Includes unlisted equity holdings of 0.72% *Other includes currency derivatives used to manage foreign exchange
risk. 1The actual investment mix incorporates the notional exposure value of equity derivatives and credit default swaps, where applicable.

Milford Investment Funds Monthly Review as at 30 September 2021
Actual investment mix1
Effective Cash#
33.10%
New Zealand Equities4.00%Australian Equities53.76%
International Equities4.91%Listed Property 4.23%
Other* 0%
# The actual cash held by the Fund is 26.03%.Effective Cash reported above is adjusted to reflectthe Fund's notional positions (e.g. derivatives usedto increase or reduce market exposure).
Australian Absolute Growth FundPortfolio Manager: William Curtayne & Wayne Gentle
The Fund declined 1.1% in September as the Australian equity market fell nearly 2%. Fears that Chinese property developer Evergrande Group would collapse drove iron ores prices below $100 from over $200 in July. This saw large pullbacks in iron ore miners and other metals. Despite buying some BHP last month, we moved to reduce it again early in September as the outlook for the Chinese property sector and iron ore deteriorated, leaving the Fund with minimal exposure when prices collapsed.
The Fund has taken a more conservative invested position with cash at 26% and some derivative protection. While we don’t believe China’s Evergrande is a “Lehman moment”, it confirms that China’s economic focus has shifted from stimulating the property market at all costs to investing in future growth sectors such as technology. This may lead to longer term demand issues for iron ore that are not priced into the market expectations. Combine this with short-term headwinds of declining property starts, power outages and steel production curbs ahead of the winter Olympics, we have taken a more cautious stance on iron ore until we see more stimulus from policy makers.
In the meantime, there are still opportunities and winners in this environment. We believe the energy companies have a positive outlook given rising demand as economies reopen and supply shortages due to little new resource development over the past two years. Some banks and insurers will benefit from rising global interest rates and reasonably valued defensives may do well in an uncertain environment. We have increased our positions in these companies.
Aggressive FundPortfolio Manager: Stephen Johnston
The Fund fell 3.2% in September. It was a weak month for global share markets, as there were rising concerns about a slowdown in the global economy.
A key positive contributor for the month was US life sciences company Thermo Fisher Scientific (+3.0%), which performed well in a weak market. Thermo has been a key beneficiary of the pandemic, providing testing kits for Covid-19, as well as being heavily involved in vaccine development. The company is well positioned for the long term and recently raised its organic revenue growth outlook for the next three years, highlighting the strength in its end markets. One of the largest banks in the US, J.P. Morgan (+2.3%), also outperformed as investors rotated out of high growth names, into companies that benefit f rom higher interest rates. Another outperformer was semiconductor company Analog Devices (+2.8%), which is well placed to benefit from the increased electronic content in auto and industrial products, as well as benefitting from 5G wireless infrastructure buildouts.
In a month of rotation, the biggest detractors were technology heavyweights Alphabet(parent company of Google, -8.4%), Paypal (-9.9%) and Microsoft (-6.6%). Despite short-term weakness, we think the medium-term outlook remains positive for all these companies.
Australasian markets outperformed in September and one of the key contributors was IDP Education (+18.4%), which operates a network of international student placement centres. Other outperformers included investment bank and financial services company Macquarie Group (+9.2%) and Lifestyle Communities (+13.3%), which develops and manages communities for senior citizens.
Overall, despite short-term volatility, the backdrop remains favourable given supportive policy and the accelerated vaccine rollout. While the road ahead could be a little bumpy, we will take advantage of market weakness to add to companies that are aligned with our key investment themes.
Effective Cash# 7.08%
International FixedInterest 0.04%New Zealand Equities6.43%Australian Equities19.66%
International Equities64.50%Listed Property 2.29%
Other* 0%
# The actual cash held by the Fund is 7.88%.Effective Cash reported above is adjusted to reflectthe Fund's notional positions (e.g. derivatives usedto increase or reduce market exposure).
*Other includes currency derivatives used to manage foreign exchange risk.1The actual investment mix incorporates the notional exposure value of equity derivatives and credit default swaps, where applicable.

Milford Investment Funds Monthly Review as at 30 September 2021
Trans-Tasman Bond FundPortfolio Manager: Travis Murdoch
It was another eventful month in fixed income markets. Government bond yields movedhigher (prices lower) across the board as inflation pressures remained elevated andoffshore central banks in countries including the US and UK indicated they may tightenmonetary policy sooner than previously expected. Closer to home, the Assistant Governorof the Reserve Bank of New Zealand delivered a speech that appeared to rule out a 0.5%rise in the Official Cash Rate (OCR) at the October meeting. Bond market expectations of a0.5% hike were materially reduced post-speech; however the market remains fully pricedfor a 0.25% OCR rise in October.
The Fund returned -0.6% in the month. This was 0.1% higher than its benchmark thanks inpart to its lower than neutral interest rate exposure in offshore markets. The Fund tookadvantage of higher government bond yields to reduce this position during the month butretains a moderate below neutral positioning. It was another active month in primarymarkets. In Australia, the Fund added bonds in new issues from companies includingElectranet (utility) and Woolworths (consumer staples). In New Zealand, the Fundparticipated in the new 30-year bond issued by the NZ government and added new bondsfrom ANZ Bank and Oceania Healthcare.
Looking forward, inflationary pressures, ongoing risks from Covid and the potentialreduction of monetary and fiscal stimulus may keep market volatility elevated in the nearterm. Nonetheless, economic growth remains supportive of company balance sheets andthe Fund maintains its above neutral exposure to corporate bonds.
Actual investment mix1
Effective Cash# 0.16%
New Zealand FixedInterest 47.43%International FixedInterest 52.37%
Other* 0.04%
# The actual cash held by the Fund is -0.16%.Effective Cash reported above is adjusted to reflectthe Fund's notional positions (e.g. derivatives usedto increase or reduce market exposure).
Global Corporate Bond FundPortfolio Manager: Travis Murdoch
September was another eventful month in fixed income markets. Government bond yieldsmoved higher (prices lower) across the board as inflation pressures remained elevated andoffshore central banks in countries including the US and UK indicated they may tightenmonetary policy sooner than previously expected. Most notably, the US Federal Reserveindicated that an announcement on the tapering of asset purchases could come as soon asNovember, and perhaps more surprisingly for markets, could be complete by mid-2022.Corporate bonds had a more mixed month, with pockets of outperformance in US andEuropean investment grade.
The Fund returned -0.2% in the month. It outperformed its benchmark by a small amountthanks in part to its below neutral interest rate exposure, the magnitude of which wasreduced during the month as government bond yields moved higher. The Fund was activein primary markets where it bought bonds in new issues from companies including Nordea(Swedish bank), Woolworths (Australian supermarket) and ANZ Bank New Zealand.
Looking forward, we remain constructive on corporate bonds as global economic growthcontinues to underpin company balance sheets; albeit inflationary pressures, ongoing risksfrom Covid and the potential reduction of monetary and fiscal stimulus may keep marketvolatility elevated in the near term. The Fund maintains a below neutral allocation to theweakest parts of the high yield market and below neutral interest rate positioning tocushion against the potential impact a move higher in interest rates may have on bondreturns.
Effective Cash# 4.50%
New Zealand FixedInterest 1.83%International FixedInterest 93.11%
Other* 0.56%
# The actual cash held by the Fund is 2.50%.Effective Cash reported above is adjusted to reflectthe Fund's notional positions (e.g. derivatives usedto increase or reduce market exposure).
*Other includes currency derivatives used to manage foreign exchange risk.1The actual investment mix incorporates the notional exposure value of equity derivatives and credit default swaps, where applicable.

Milford Investment Funds Monthly Review as at 30 September 2021
Actual investment mix1
Effective Cash#
10.70%New Zealand FixedInterest 89.30%
Other* 0%
# The actual cash held by the Fund is 10.70%.Effective Cash reported above is adjusted to reflectthe Fund's notional positions (e.g. derivatives usedto increase or reduce market exposure).
Cash FundPortfolio Manager: Travis Murdoch & Katlyn Parker
In September the Fund generated a return of 0.04%, in line with its objective to deliver a return in excess of the Reserve Bank of New Zealand (RBNZ) Official Cash Rate (OCR) after fees.
Short-dated NZ Dollar interbank money market interest rates continued to move higher throughout the month. The market remains focused on the October RBNZ meeting which is very much live for a 0.25% increase in the OCR. In the first half of the month the market began to price in a considerable probability of a 50bps hike at the upcoming meeting but much of this was receded after a speech by the RBNZ Assistant Governor unambiguously outlining a more measured approach to gradually increasing the OCR from its current low base of 0.25%. Nonetheless, the expected direction is ultimately higher for the OCR which remains in line with our base case view.
The portfolio management of the Fund remains focused on maintaining its low-risk strategy which is built on a diversified portfolio of cash, short-dated debt securities and term deposits, so as to protect capital. As bank deposit rates remain low, we believe this should be an attractive, tax efficient (as a PIE vehicle), liquid (meaning investors have access to funds on request unlike term deposits) and low risk alternative to bank term deposits.
Global Equity FundPortfolio Manager: Felix Fok
The Fund fell 4.2% in September. Over two years, the Fund is up 42.0% (net of fees) compared to the market index which is up 33.4%.
A key positive contributor was US life sciences company Thermo Fisher Scientific (+3.0%), which performed well in a weak market (the US S&P500 index was down -4.7%). Thermo has been a key beneficiary of the pandemic, providing testing kits for Covid-19, as well as being heavily involved in vaccine development. The company is well positioned for the long term and recently raised its organic revenue growth outlook for the next three years, highlighting the strength in its end markets.
Aircraft parts supplier Transdigm (+2.8%) has completed its recovery from its pandemic depths. As borders reopen international air travel will benefit.
Technology heavyweights, however, came under pressure on broad based profit taking and interest rates moving higher. Alphabet (parent company of Google, -8.4%), PayPal (-9.9%) and Adobe (-13.3%) led decliners but despite short-term weakness their products and services should gain relevance and profitability over the medium term.
As economies emerge from the pandemic and support policies are moderated, investors will reposition for a changing outlook which could lead to volatility. The portfolio remains focused on our key investment themes and dominant companies which have strong medium-term prospects.
Effective Cash# 2.75%
International Equities95.39%
Listed Property 1.86%
Other* 0%
# The actual cash held by the Fund is 4.97%.Effective Cash reported above is adjusted to reflectthe Fund's notional positions (e.g. derivatives usedto increase or reduce market exposure).
*Other includes currency derivatives used to manage foreign exchange risk.1The actual investment mix incorporates the notional exposure value of equity derivatives and credit default swaps, where applicable.

Milford Investment Funds Monthly Review as at 30 September 2021
Actual investment mix1
Effective Cash# 5.98%
New Zealand Equities41.62%Australian Equities49.51%
Listed Property 2.71%
Other* 0.18%
# The actual cash held by the Fund is 5.67%.Effective Cash reported above is adjusted to reflectthe Fund's notional positions (e.g. derivatives usedto increase or reduce market exposure).
Trans-Tasman Equity FundPortfolio Manager: Sam Trethewey
The Fund fell -0.7% in September, however the one-year return remains very healthy at 26.1%. The Fund's September performance compares to a return of 0.4% for the NZX 50 index and -1.8% for the ASX 200. The NZX continued to be well supported after a strong August earnings season while the ASX declined largely due to its exposure to China and their reduced property investment.
Standout performers in September included cinema software developer Vista (+12.0%), oil and gas exposure Santos (+18.5%) and infrastructure investor Infratil (+6.5%). Vista Group continues to benefit from the re-opening of cinemas, with Disney announcing that all of their remaining films this year will open exclusively in cinemas. Santos benefitted from a rapid rally in energy prices as shortages appeared across several international markets. Infratil announced the establishment of a renewable energy development platform in Asia, building on their existing development platforms in the United States, Europe and New Zealand. Infratil have a long track record in renewable energy and continue to benefit from increasing investor demand for these assets. During the month we took advantage of market weakness to increase our holdings in both Xero and Fletcher Building. Elsewhere we reduced Auckland Airport and ANZ bank into strength.
Looking ahead, we expect the NZ economy to remain robust outside of the obvious pockets of extreme weakness in the tourism and hospitality sectors. The market is expecting the RBNZ to raise the official cash rate slightly in October, however we expect most of the factors causing the economic strength, such as pent-up consumer demand and supply chain tightness, to persist into 2022. Australia is facing a more mixed economic outlook given its China exposure and the RBA is a long way from increasing official cash rates. We have been decreasing the Fund's ASX holdings in response. The Fund is orientated towards stocks as that benefit from this economic strength and have seen their competitive position improve due to the pandemic. Irrespective of short-term market performance, long-term returns will be influenced by our stock selection. That is our ability to position the Fund in companies that can sustain earnings growth at above average rates (like Mainfreight, Xero and Fisher & Paykel Healthcare) and avoid those where we see stretched balance sheets, earnings or valuation risk.
Dynamic FundPortfolio Manager: William Curtayne & Michael Higgins
The Dynamic Fund fell 1.3% in September, moderately outperforming the S&P/ASX Small Ordinaries benchmark which dropped 2.1%. It’s been an incredibly strong period of equity market performance considering uncertainties like lockdowns, elevated government spending and inflationary pressures with the Fund returning 5.6% for the quarter and 33.4%for the year.
Performance was led by IDP Education which rallied 18.4% over the month on optimism about the great reopening. Lifestyle Communities (+13.3%) continued its stellar run over the past few months. Lifestyle is one of the key founder-led/founder-associated businesses which make up nearly 25% of the Dynamic Fund. Exposures which detracted from performance were gold miner Evolution Mining (-10.7%) and building materials companies Bluescope Steel (-17.1%). We also took the opportunity to take profits in Sealink after an incredible performance over the past 24 months.
While our recent performance has been strong, the market remains volatile. We remain cognisant that we are in a period of elevated uncertainty with a broad range of potential market moving scenarios in play. As we mentioned last month, we have continued to take profits in several of our core positions in favour of new ideas. This rotation also provides some dry powder to take advantage of any equity market weakness in the final quarter.
Effective Cash# 6.07%
New Zealand Equities8.20%Australian Equities76.85%
Listed Property 8.88%
Other* 0%
# The actual cash held by the Fund is 6.09%.Effective Cash reported above is adjusted to reflectthe Fund's notional positions (e.g. derivatives usedto increase or reduce market exposure).
*Other includes currency derivatives used to manage foreign exchange risk.1The actual investment mix incorporates the notional exposure value of equity derivatives and credit default swaps, where applicable.

Milford Investment Funds Monthly Review as at 30 September 2021
Fund PerformancePast month 1 year 3 years (p.a.) 5 years (p.a.)
Since Fundinception (p.a.)
Unit price $ Fund size $
Multi-Asset Funds
Conservative Fund* -0.47% 4.66% 5.53% 5.74% 6.11% 1.2435 619.2 M
Diversified Income Fund* 0.07% 10.84% 7.45% 7.79% 10.56% 1.9167 2,829.4 M
Balanced Fund -0.86% 15.82% 9.93% 9.86% 10.21% 2.9384 1,668.9 M
Active Growth Fund -0.75% 22.21% 12.13% 11.96% 12.92% 5.0984 2,206.2 M
Australian Absolute Growth Fund -1.14% 23.31% 10.98% — 10.93% 1.4442 519.4 M
Aggressive Fund -3.18% — — — — 1.0265 720.0 M
Cash and Fixed Income Funds
Trans-Tasman Bond Fund*^ -0.61% -0.50% 3.84% 3.82% 4.89% 1.1875 887.6 M
Global Corporate Bond Fund*^ -0.24% 3.42% 4.77% — 4.60% 1.1042 769.6 M
Cash Fund 0.04% 0.40% — — 0.96% 1.0251 108.6 M
Equity Funds
Global Equity Fund† -4.22% 19.76% 14.63% 14.01% 10.85% 2.3664 1,441.9 M
Trans-Tasman Equity Fund* -0.65% 26.13% 15.53% 15.81% 12.39% 4.0976 1,000.8 M
Dynamic Fund -1.32% 33.35% 15.81% 15.34% 15.09% 3.0407 918.7 M
For details of how investment performance is calculated, and returns at each PIR please see www.milfordasset.com/funds-performance/view-performance#tab-performance.Performance figures are after total Fund charges have been deducted and at 0% PIR.Please note past performance is not a guarantee of future returns.Inception dates for the Funds: Active Growth Fund: 1 October 2007, Trans-Tasman Equity Fund: 1 October 2007, Balanced Fund: 1 April 2010, Diversified Income Fund:1 April 2010, Global Equity Fund: 12 April 2013, Dynamic Fund: 1 October 2013, Trans-Tasman Bond Fund: 2 December 2013, Conservative Fund: 1 September 2015,Global Corporate Bond Fund: 1 February 2017, Australian Absolute Growth Fund: 1 March 2018, Cash Fund: 1 March 2019, Aggressive Fund: 21 June 2021.*Performance figures include the reinvestment of the Funds' distribution.^Returns prior to 1 March 2018 are from when the Fund was previously offered to wholesale investors only and have been adjusted for current Fund charges.†Returns prior to 1 October 2018 are from when the Fund was structured to achieve an absolute return.
Key Market IndicesPast month 1 year 3 years (p.a.) 5 years (p.a.) 7 years (p.a.)
S&P/NZX 50 Gross Index (with imputation credits) 0.63% 13.72% 13.24% 13.55% 15.33%
S&P/ASX 200 Accumulation Index (AUD) -1.85% 30.56% 9.65% 10.42% 9.14%
S&P/ASX 200 Accumulation Index (NZD) -1.02% 26.11% 8.15% 10.31% 8.07%
MSCI World Index (local currency)* -3.69% 29.05% 12.96% 13.80% 11.12%
MSCI World Index (NZD)* -2.21% 23.43% 11.65% 14.95% 12.45%
Bloomberg Barclays Global Agg. Bond (USD-Hedged) -0.94% -0.56% 4.64% 2.89% 3.44%
S&P/NZX NZ Government Bond Index -1.10% -7.12% 2.36% 2.43% 3.94%
*With net dividends reinvested

Milford Investment Funds Monthly Review as at 30 September 2021
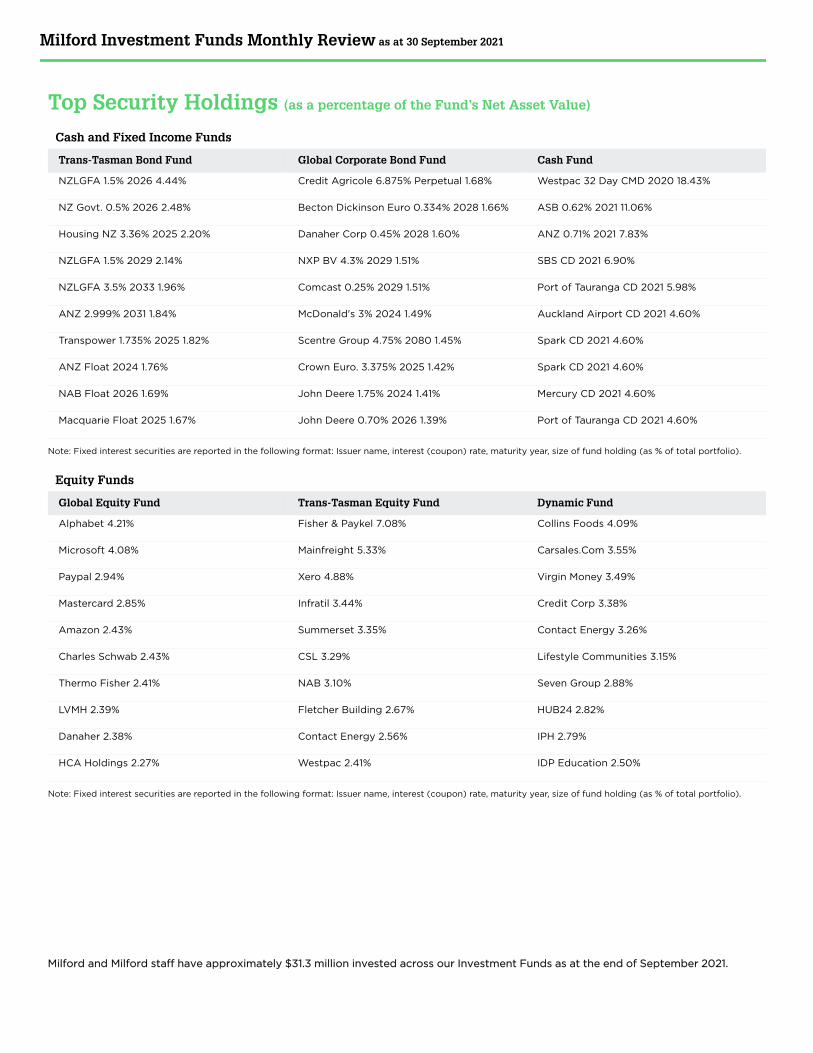
Top Security Holdings (as a percentage of the Fund’s Net Asset Value)
Multi-Asset Funds
Conservative Fund Diversified Income Fund Balanced Fund
Kiwibank 1.3% 2022 2.21% Contact Energy 2.27% Contact Energy 1.94%
NZLGFA 1.5% 2026 1.79% Scentre Group 5.125% 2080 1.58% Fisher & Paykel 1.63%
ANZ 2.999% 2031 1.39% Transurban 1.52% Alphabet 1.24%
NZ Govt. 0.5% 2026 0.96% Telstra 1.44% Microsoft 1.21%
Housing NZ 3.36% 2025 0.85% Spark 1.33% Virgin Money 1.10%
NZLGFA 1.5% 2029 0.83% Charter Hall Retail 1.27% Telstra 1.05%
Scentre Group 4.75% 2080 0.82% Goodman 1.24% Mainfreight 1.02%
NZLGFA 3.5% 2033 0.76% Meridian 1.20% Summerset 1.02%
Wesfarmers 1.941% 2028 0.73% Sydney Airport 1.12% Charter Hall Retail 0.96%
Transpower 1.735% 2025 0.70% NAB 1.08% HCA Holdings 0.95%
Active Growth Fund Australian Absolute Growth Fund Aggressive Fund
Contact Energy 3.41% NAB 5.37% Microsoft 2.76%
Virgin Money 3.33% Telstra 4.56% Alphabet 2.66%
Fisher & Paykel 3.01% CSL 3.96% Thermo Fisher 2.13%
Summerset 2.27% Sydney Airport 3.65% Mastercard 2.11%
Alphabet 2.20% Virgin Money 3.31% Paypal 1.83%
Microsoft 2.17% Santos 3.02% HDFC Bank 1.75%
Lowe's 1.88% Evolution Mining 3.00% Charles Schwab 1.72%
Charter Hall Retail 1.82% Aristocrat Leisure 2.41% TSMC 1.71%
HCA Holdings 1.76% Charter Hall Retail 2.28% Analog Devices 1.69%
Dr Horton 1.73% Collins Foods 2.17% Aon 1.58%
Note: Fixed interest securities are reported in the following format: Issuer name, interest (coupon) rate, maturity year, size of fund holding (as % of total portfolio).
Upcoming DistributionsTarget Payment Date
Conservative Fund 0.5 cents (Quarterly) 21/10/2021
Diversified Income Fund 1.1 cents (Quarterly) 18/11/2021
Trans-Tasman Bond Fund 0.45 cents (Quarterly) 16/12/2021
Global Corporate Bond Fund 0.45 cents (Quarterly) 16/12/2021
Trans-Tasman Equity Fund 1.5 cents (Biannually) 17/03/2022
Fund
Milford Investment Funds Monthly Review as at 30 September 2021
Top Security Holdings (as a percentage of the Fund’s Net Asset Value)
Cash and Fixed Income Funds
Trans-Tasman Bond Fund Global Corporate Bond Fund Cash Fund
NZLGFA 1.5% 2026 4.44% Credit Agricole 6.875% Perpetual 1.68% Westpac 32 Day CMD 2020 18.43%
NZ Govt. 0.5% 2026 2.48% Becton Dickinson Euro 0.334% 2028 1.66% ASB 0.62% 2021 11.06%
Housing NZ 3.36% 2025 2.20% Danaher Corp 0.45% 2028 1.60% ANZ 0.71% 2021 7.83%
NZLGFA 1.5% 2029 2.14% NXP BV 4.3% 2029 1.51% SBS CD 2021 6.90%
NZLGFA 3.5% 2033 1.96% Comcast 0.25% 2029 1.51% Port of Tauranga CD 2021 5.98%
ANZ 2.999% 2031 1.84% McDonald's 3% 2024 1.49% Auckland Airport CD 2021 4.60%
Transpower 1.735% 2025 1.82% Scentre Group 4.75% 2080 1.45% Spark CD 2021 4.60%
ANZ Float 2024 1.76% Crown Euro. 3.375% 2025 1.42% Spark CD 2021 4.60%
NAB Float 2026 1.69% John Deere 1.75% 2024 1.41% Mercury CD 2021 4.60%
Macquarie Float 2025 1.67% John Deere 0.70% 2026 1.39% Port of Tauranga CD 2021 4.60%
Note: Fixed interest securities are reported in the following format: Issuer name, interest (coupon) rate, maturity year, size of fund holding (as % of total portfolio).
Equity Funds
Global Equity Fund Trans-Tasman Equity Fund Dynamic Fund
Alphabet 4.21% Fisher & Paykel 7.08% Collins Foods 4.09%
Microsoft 4.08% Mainfreight 5.33% Carsales.Com 3.55%
Paypal 2.94% Xero 4.88% Virgin Money 3.49%
Mastercard 2.85% Infratil 3.44% Credit Corp 3.38%
Amazon 2.43% Summerset 3.35% Contact Energy 3.26%
Charles Schwab 2.43% CSL 3.29% Lifestyle Communities 3.15%
Thermo Fisher 2.41% NAB 3.10% Seven Group 2.88%
LVMH 2.39% Fletcher Building 2.67% HUB24 2.82%
Danaher 2.38% Contact Energy 2.56% IPH 2.79%
HCA Holdings 2.27% Westpac 2.41% IDP Education 2.50%
Note: Fixed interest securities are reported in the following format: Issuer name, interest (coupon) rate, maturity year, size of fund holding (as % of total portfolio).
Milford and Milford staff have approximately $31.3 million invested across our Investment Funds as at the end of September 2021.

Milford Investment Funds Monthly Review as at 30 September 2021Milford Investment Funds Monthly Review
Investment Highlight: Telstra
• Vodafone and TPG merged, removing a potential fourth entrant. This merger was a large drawn-out process given the ACCC tried to block it which proved to be a material distraction for both businesses.
• Huawei equipment was banned from being used on 5G networks. Vodafone and Optus had utilised Huawei hardware for their 3G and 4G networks and therefore needed to replace a lot of hardware if they were to offer 5G. This not only gave Telstra a head start with their 5G roll out but was also a very expensive exercise for its competitors.
• There was also a shift in competitive intensity from Optus as they changed their strategy from market share at any cost to profitable growth.
Roland Houghton Investment Analyst
Telstra is Australia’s largest telecommunication company with market leading positions in mobile, enterprise and residential broadband.
Early last decade it was regarded as a blue-chip income stock and its share price rose from $2.79 at the beginning of 2011 to $6.59 in 2015. At this point industry change weakened Telstra’s business and profits deteriorated. Telstra fell out of favour with investors which saw its share price decline to $2.73 in October last year.
As its share price reached its lows, the seeds of a business turnaround had firmly taken root providing a great contrarian investment opportunity in an Australian stalwart.
The issues Telstra owned Australia’s most substantial copper phone lines business which gave it a dominant market position in the provision of broadband services. The issues
however rose from the fact commercial entities such as Telstra had little incentive to build network capabilities in uneconomic areas therefore there was a materially different internet experience for Australians in regional locations. This led to the formation of The National Broadband Network initiative (‘nbn’ where the government essentially took control of Australia’s residential broadband networks to ensure all Australians had access to high quality internet.
Previously Telstra would offer internet services to a residential customer largely over their own copper network however they now had to pay the Government to use the nbn network. This saw margins, in what was a large division, fall significantly for a number of years.
Concurrent to this, deteriorating economics in residential broadband saw competitors encroach on Telstra’s more profitable enterprise segment, reducing profitability in this division as companies searched for other ways to monetise their network. Finally, mobile competition was becoming quite irrational as companies such as Optus focused on market share gains rather than profitability. This was exacerbated by TPG putting the pieces in place to launch a fourth competing mobile network.
This all led to a serious strategy reset at Telstra and a material cutting of the dividend from a peak of 31c per share in FY17 to 16c per share today.
The opportunityAll of these issues really reached their crescendo around two years ago and at this point the outlook for Telstra started to improve.
The nbn network roll out was nearing completion and therefore margins in their fixed business began to stabilise from what had been a bit of a free fall. The mobile market also began to improve as:
The final key thread to Telstra’s turnaround (which we believe the market really misunderstood at the time) was the declining capital intensity of the business. Whilst the nbn was terrible for the profitability of their broadband division, it did offload what is the most capital heavy part of its network. Hence, cash flow was set to improve significantly, despite accounting earnings being under pressure. This proved to be correct as in FY21 Telstra generated profit of $1.9b vs free cash flow of $3.2b. We therefore had high confidence the dividend was sustainable and could potentially grow.
Alongside all of this, Telstra started to explore ways to monetise some hidden value within their business. For example, they sold a 49% stake in their tower assets at a significant premium to the value they were held at on their balance sheet. Moreover, there are still more divestment opportunities available to Telstra.
Despite all of the above, the market has been very slow to react to what are clear improving trends on a number of fronts for Telstra. It is often hard to break the negative sentiment towards a business that has built up because of years of earnings downgrades and disappointing results. This market pessimism has allowed us to build a significant position at very attractive levels with the market seemingly paying limited attention to the continuing improvement in the fundamentals and outlook for the business. This highlights very good investment returns can be achieved in even the most mature of businesses.
Disclaimer: Milford is an active manager with views and portfolio positions subject to change. This article is intended to provide general information only. It does not take into account your investment needs or personal circumstances. It is not intended to be viewed as investment or financial advice. Should you require financial advice you should always speak to a Financial Adviser. Past performance is not a guarantee of future performance.

Disclaimer: The Milford Monthly Review has been prepared by Milford Funds Limited. It is based on information believed to be accurate andreliable although no guarantee can be given that this is the case. No reproduction of any material either in part or in full is permitted without priorpermission. For more information about the Funds please refer to the Product Disclosure Statement or the latest Quarterly Fund Update.