Miles assay for 2-way Anova vehicle 0.125 - control VEGF 0...
9
Supplementary Figure 1: Basal and VEGF-induced Evans blue leak in a Miles assay. Anesthetized mice were shaved free of back hair, injected i.v. with 100 μL filtered 1 % Evans blue/saline, and, 5 minutes later, injected intradermally with 100 ng of mouse VEGF 164 (R&D systems) in 50 μL Hanks/BSA at three sites evenly distributed along the right flank and Hanks/BSA control at three sites along the left flank. Thirty minutes later, mice were perfused with saline via the left ventricle to remove intravascular Evans blue. Pen-marked injection sites and control skin from untreated regions were excised with 8 mm skin biopsy punches and extracted in 0.5 mL of formamide at 55°C overnight. Evans blue content was determined as OD 620 - OD 720 of the formamide extract after correction for median OD of untreated skin from mice of the same genotype at both wavelengths. Left: mean +/- SEM. Right: Paired data, left flank to right flank for an individual mouse. Note increased Evans blue extravasation both at baseline and after VEGF in pS1Pless mice relative to controls. 0.000 0.025 0.050 0.075 0.100 0.125 - pS1Pless - control control pS1Pless 0.000 0.025 0.050 0.075 0.100 vehicle VEGF
-
Upload
hoangnguyet -
Category
Documents
-
view
213 -
download
0
Transcript of Miles assay for 2-way Anova vehicle 0.125 - control VEGF 0...

Supplementary Figure 1: Basal and VEGF-induced Evans blue leak in a Miles assay.Anesthetized mice were shaved free of back hair, injected i.v. with 100 µL filtered 1 % Evansblue/saline, and, 5 minutes later, injected intradermally with 100 ng of mouse VEGF164 (R&Dsystems) in 50 µL Hanks/BSA at three sites evenly distributed along the right flank andHanks/BSA control at three sites along the left flank. Thirty minutes later, mice were perfusedwith saline via the left ventricle to remove intravascular Evans blue. Pen-marked injection sitesand control skin from untreated regions were excised with 8 mm skin biopsy punches andextracted in 0.5 mL of formamide at 55°C overnight. Evans blue content was determined asOD620- OD720 of the formamide extract after correction for median OD of untreated skin frommice of the same genotype at both wavelengths. Left: mean +/- SEM. Right: Paired data, leftflank to right flank for an individual mouse. Note increased Evans blue extravasation both atbaseline and after VEGF in pS1Pless mice relative to controls.
0.000
0.025
0.050
0.075
0.100
0.125- pS1Pless- control
Miles assay for 2-way Anova
control pS1Pless0.000
0.025
0.050
0.075
0.100 vehicleVEGF

Supplementary Figure 2: Plasma S1P deficiency does not alter histamine levels duringpassive systemic anaphylaxis. Plasma histamine levels 90 seconds after DNP-albuminchallenge in PSA model (see Methods) as determined by histamine ELISA (Immunotech,Marseille, France) performed according to the manufacturer’s instructions. Plasma histaminelevels were less than 0.3 µM in the absence of PSA challenge. p value was determined bystudent’s t-test. Each point represents data for a separate mouse; horizontal bar denotesmean. A complex role for sphingosine kinases in the regulation of mast cells and histaminesecretion was recently described (Olivera A. et al, Immunity 26,287-297 (2007). Olivera andcolleagues reported decreased release of cytokines and granule constituents from fetal liver-derived mast cells from Sphk2-/- but not Sphk1-/- embryos, suggesting a positive role forSphk2 in release of mast cell mediators. They also reported an ~30% decrease in plasmahistamine levels after PSA in Sphk1-/- but not Sphk2-/- mice, as well as a strong correlationbetween plasma S1P and histamine levels after PSA. Plasma histamine and S1P levels wereapparently determined after induction of anaphylaxis. Thus, it is possible that the strongcorrelation in plasma levels reflects, at least in part, secretion of both in response toanaphylactic mediators. While the ranges of histamine levels in the control and Sphk1-/-
groups overlapped, median levels were ~30% different and this was statistically significant.The lack of an effect on histamine levels seen above in pS1Pless mice at plasma S1P levelssignificantly lower than those noted in the Sphk1-/- mice in the Olivera study suggest thatplasma levels of S1P per se are probably not an important determinant of histamine release.Loss of S1P supplied by Sphk1 to other compartments or other consequences of loss ofSphk1 may explain the Olivera study’s findings.
7.20.7. Effect of PSA at 90s:histamine
0
10
20
30
40p=ns
4.17.8. Effect of splenectomy on HCTresponse to 40ug/kg PAF. Note thatprebleed at -2' blunts PAF response,
but necessary to control for blood loss.
40
50
60
70
80p=0.005 p=0.0007
p=ns BA
Hanks PAF
C
M
L
H
S
Supplementary Figure 3: Characterization of the PAF model. (A) Hematocrit (HCT) wasmeasured before and 10 min after PAF (40 µg/kg PAF i.v.) in splenectomized or sham-operatedmice. p values were determined by student’s t-test (statistical comparisons as indicated),horizontal lines show mean values. Note that HCT increase was not altered by splenectomy,consistent with its being due to hemoconcentration rather than contraction of spleen and“autotransfusion”. Each point represents data for a separate mouse; horizontal bar denotes mean.(B) Intravenous fluid resuscitation (0.5 ml saline at 7 minutes) of mice from lethal responses to40 µg/kg PAF. p value determined by log rank test. (C) Evans blue leak in response to PAFchallenge in wild-type mice. Evans blue/Saline (1 mg/ 100 µl) was administered i.v. with PAF(40 µg/kg) or vehicle control. Ten minutes later, intravascular Evans blue dye was removed bysaline perfusion. H, heart; L, liver; S, skin; M, mesentery. Note increased Evans blueextravasation after PAF in multiple organs.
5.9.08. Fluid (0.5 ml saline at 7 min) rescue40ug/kg PAF in BL/6 males. n=7-10;
p<0.0004
0 10 20 30 40 50 60
0
20
40
60
80
100
PAF
PAF+saline
p=0.0004
minutes
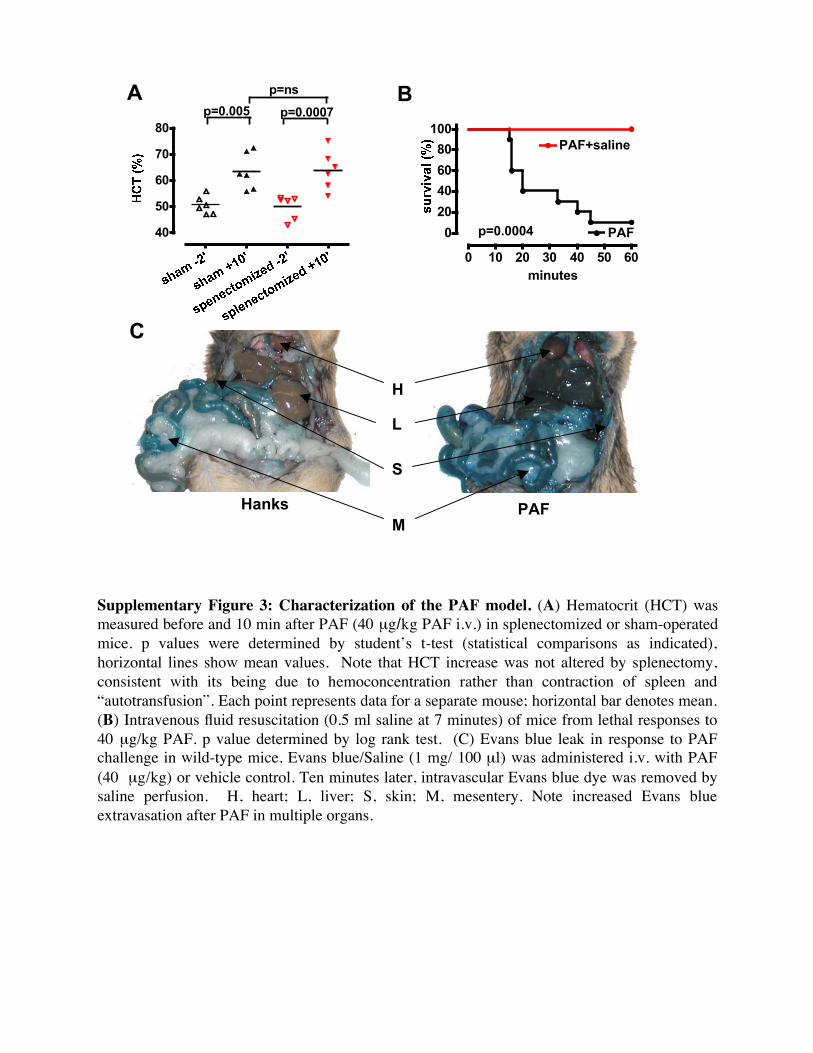
Supplementary Figure 4:pS1Pless mice exhibitincreased extravasation offluorescent microspheresvia interendothelial gaps.Additional representativeimages to complementFigure 4 are shown.Control and pS1Pless micewere injected intravenouslywith 500 nm fluorescentmicrospheres together withPAF (20 µg/kg) or vehicleas indicated, then perfused3 minutes later with salinethen with fixative. Tracheaewere removed, wholemountimmunostained for theendothelial markerPECAM, opened, laid flatand imaged using confocalfluorescence microscopy.Minimal leak ofmicrospheres was observedin vehicle-treated mice ofeither genotype (top fourrows). Accumulation ofmicrospheres was noted invenules in PAF-treatedcontrol mice but was lessthat that in PAF-treatedpS1Pless mice; a rare largeaccumulation is shown(row 6 from top/column 3from left). Venules withmultiple and largeaccumulations werecommon in PAF-treatedpS1Pless mice (bottom).Magnification refers toobjective used.
beads PECAM+500 nm beadspS
1Ple
ss, P
AF
60x
4x
cont
rol,
PA
F
60x
4x
pS1P
less
, veh
icle
60x
4x
cont
rol,
vehi
cle
60x
4x

*
control,vehicle
pS1Pless,vehicle
control,PSA
pS1Pless,PSA
pS1Pless,PSA
pS1Pless,PSA
pS1Pless,PSA
pS1Pless,PSA
*
*
*
Supplementary Figure 5: Transmission electron microscopy (TEM) of lung. Mice wereanesthetized 2 min after PSA induction. At 8 min, they were perfused with 0.1M sodium cacodylatebuffer pH 7.4. At 18 min, they were perfused with 2% glutaraldehyde/1% PFA in cacodylate buffer(fix). At 33 min, trachea were instilled at 20 cm H2O with fix with the chest cavity intact. Heart andlung were collected en bloc and fixed at 4 oC overnight, then processed for TEM by standardtechniques. Alveolar capillaries showed apparent basement membrane edema (asterisk) in bothcontrol and pS1Pless mice. Apparent hemoconcentration and vasoconstriction (RBCs packedagainst endothelium) was more dramatic in pS1Pless mice, which also showed more common andprominent endothelial gaps (arrows) and endothelial thinning and detachment (arrowhead). Scalebars = 1 µm.
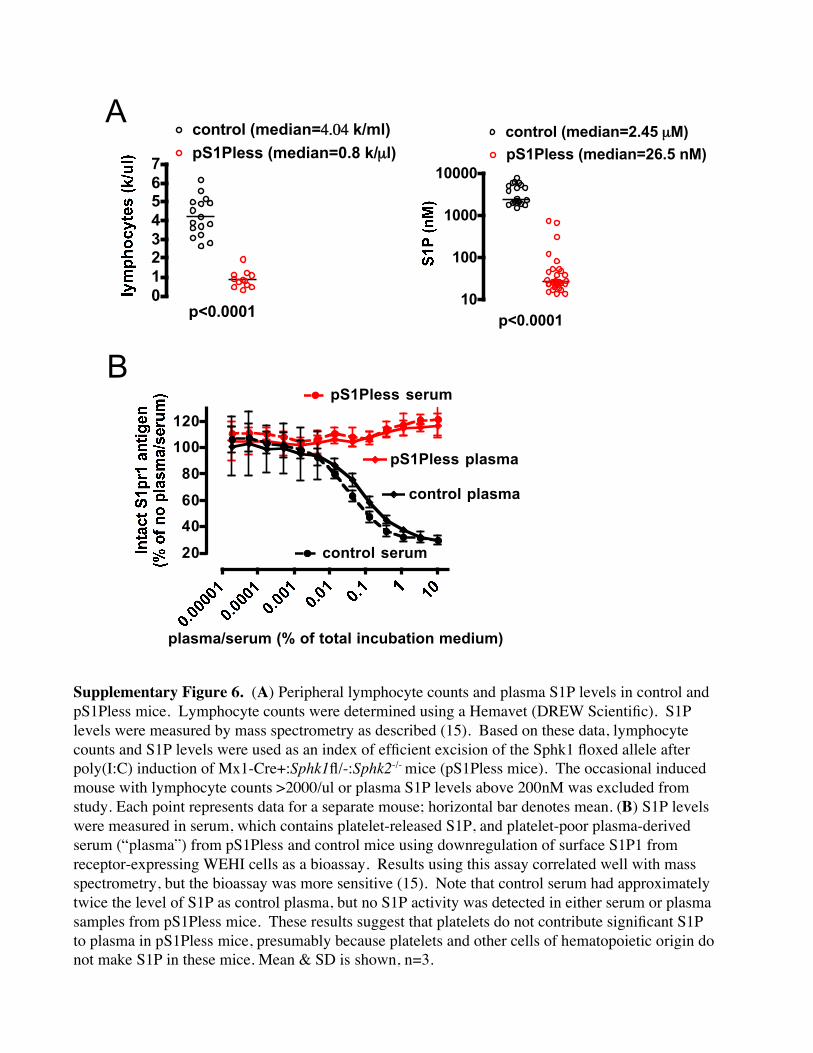
Supplementary Figure 6. (A) Peripheral lymphocyte counts and plasma S1P levels in control andpS1Pless mice. Lymphocyte counts were determined using a Hemavet (DREW Scientific). S1Plevels were measured by mass spectrometry as described (15). Based on these data, lymphocytecounts and S1P levels were used as an index of efficient excision of the Sphk1 floxed allele afterpoly(I:C) induction of Mx1-Cre+:Sphk1fl/-:Sphk2-/- mice (pS1Pless mice). The occasional inducedmouse with lymphocyte counts >2000/ul or plasma S1P levels above 200nM was excluded fromstudy. Each point represents data for a separate mouse; horizontal bar denotes mean. (B) S1P levelswere measured in serum, which contains platelet-released S1P, and platelet-poor plasma-derivedserum (“plasma”) from pS1Pless and control mice using downregulation of surface S1P1 fromreceptor-expressing WEHI cells as a bioassay. Results using this assay correlated well with massspectrometry, but the bioassay was more sensitive (15). Note that control serum had approximatelytwice the level of S1P as control plasma, but no S1P activity was detected in either serum or plasmasamples from pS1Pless mice. These results suggest that platelets do not contribute significant S1Pto plasma in pS1Pless mice, presumably because platelets and other cells of hematopoietic origin donot make S1P in these mice. Mean & SD is shown, n=3.
A
B
20
4060
80
100120
pS1Pless plasma
control plasma
pS1Pless serum
control serum
plasma/serum (% of total incubation medium)
10
100
1000
10000
p<0.0001
control (median=2.45 µM)
pS1Pless (median=26.5 nM)
p<0.00010
1
23
4
56
7
control (median=4.04 k/ml)
pS1Pless (median=0.8 k/µl)
Mx1-Cre/lacZ reporter Tie2-Cre/lacZ reporter
PECAM YFP merge
Mx1-Cre/ EYFP reporter
B
A
C
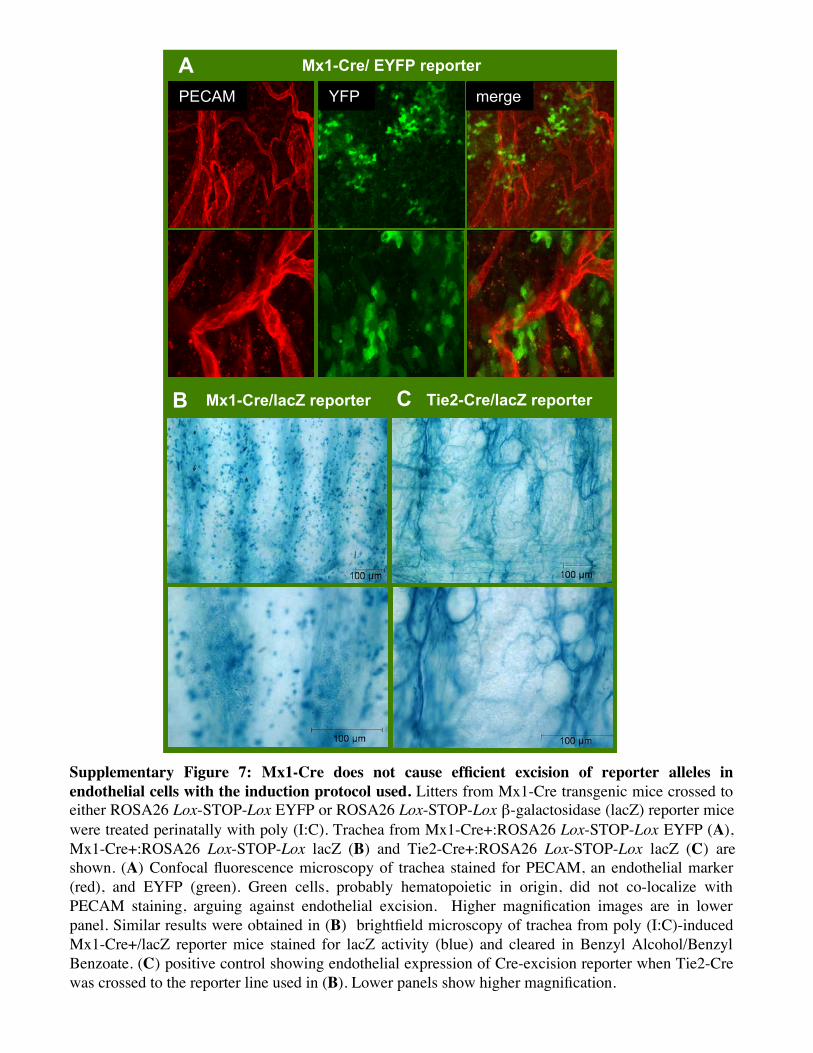
Supplementary Figure 7: Mx1-Cre does not cause efficient excision of reporter alleles inendothelial cells with the induction protocol used. Litters from Mx1-Cre transgenic mice crossed toeither ROSA26 Lox-STOP-Lox EYFP or ROSA26 Lox-STOP-Lox β-galactosidase (lacZ) reporter micewere treated perinatally with poly (I:C). Trachea from Mx1-Cre+:ROSA26 Lox-STOP-Lox EYFP (A),Mx1-Cre+:ROSA26 Lox-STOP-Lox lacZ (B) and Tie2-Cre+:ROSA26 Lox-STOP-Lox lacZ (C) areshown. (A) Confocal fluorescence microscopy of trachea stained for PECAM, an endothelial marker(red), and EYFP (green). Green cells, probably hematopoietic in origin, did not co-localize withPECAM staining, arguing against endothelial excision. Higher magnification images are in lowerpanel. Similar results were obtained in (B) brightfield microscopy of trachea from poly (I:C)-inducedMx1-Cre+/lacZ reporter mice stained for lacZ activity (blue) and cleared in Benzyl Alcohol/BenzylBenzoate. (C) positive control showing endothelial expression of Cre-excision reporter when Tie2-Crewas crossed to the reporter line used in (B). Lower panels show higher magnification.
B
A
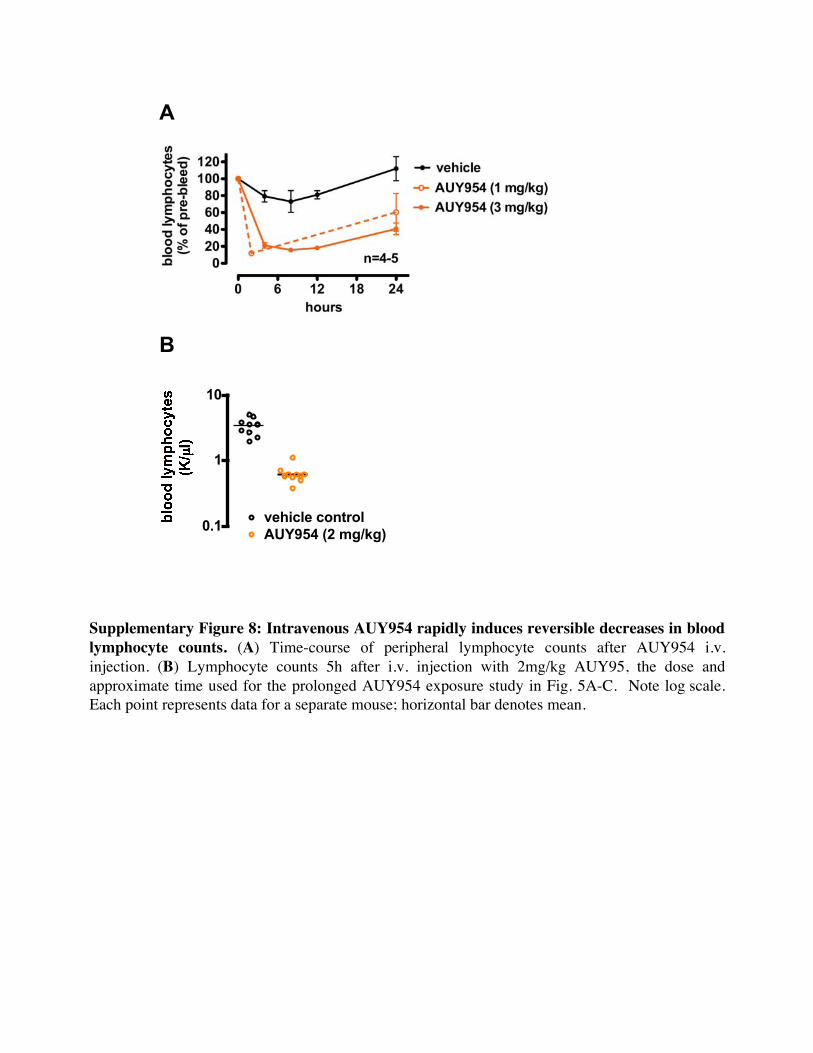
Supplementary Figure 8: Intravenous AUY954 rapidly induces reversible decreases in bloodlymphocyte counts. (A) Time-course of peripheral lymphocyte counts after AUY954 i.v.injection. (B) Lymphocyte counts 5h after i.v. injection with 2mg/kg AUY95, the dose andapproximate time used for the prolonged AUY954 exposure study in Fig. 5A-C. Note log scale.Each point represents data for a separate mouse; horizontal bar denotes mean.
5.12.8. Effect of 40min AYPGKF (4ul/g of 10mM)on HCT after AUY954 (2mg/kg 4h i.v.)
pretreatment. No sensitization observed despiteclear effect on lymphocytes. Purchased B6
males (re-used from PAF experiment).
0.1
1
10
vehicle controlAUY954 (2 mg/kg)
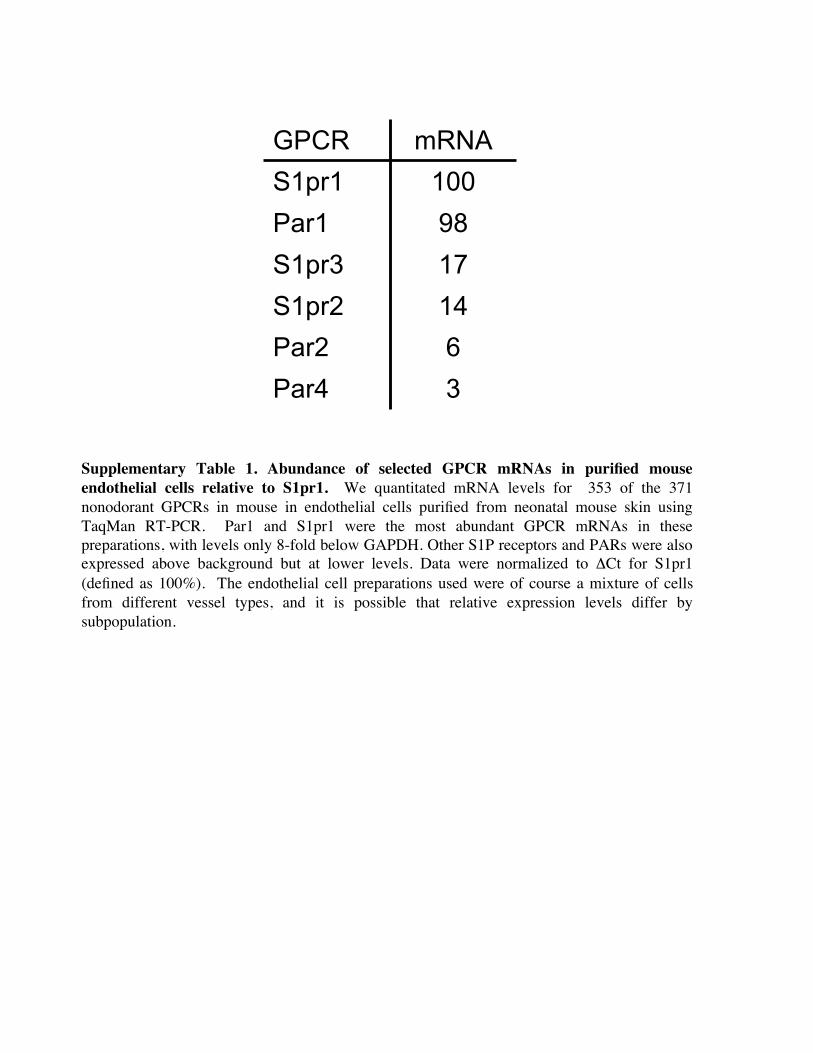
Supplementary Table 1. Abundance of selected GPCR mRNAs in purified mouseendothelial cells relative to S1pr1. We quantitated mRNA levels for 353 of the 371nonodorant GPCRs in mouse in endothelial cells purified from neonatal mouse skin usingTaqMan RT-PCR. Par1 and S1pr1 were the most abundant GPCR mRNAs in thesepreparations, with levels only 8-fold below GAPDH. Other S1P receptors and PARs were alsoexpressed above background but at lower levels. Data were normalized to ΔCt for S1pr1(defined as 100%). The endothelial cell preparations used were of course a mixture of cellsfrom different vessel types, and it is possible that relative expression levels differ bysubpopulation.
3Par46Par214S1pr217S1pr398Par1100S1pr1
mRNAGPCR