Mike Rainey North East Residuals What are PFAS? And why ... · What are PFAS? And why should we...
63
What are PFAS? And why should we care? Ned Beecher Mike Rainey North East Biosolids and Residuals Association @ MWEA Biosolids Conference Battle Creek, MI March 14, 2018
-
Upload
duongxuyen -
Category
Documents
-
view
224 -
download
0
Transcript of Mike Rainey North East Residuals What are PFAS? And why ... · What are PFAS? And why should we...

What are PFAS?And why should we care?
Ned BeecherMike Rainey
North East Biosolids and
Residuals Association
@ MWEA BiosolidsConference
Battle Creek, MI
March 14, 2018

Acknowledgements & SourcesInclusion on this list does not imply endorsement. Views expressed are those of the authors only.
• Sarita Croce, Merrimack NH WRRF Lab
• Stephen Zemba and Harrison Roakes, Sanborn Head Assocs.
• Linda Lee, Purdue University
• Many others: Ed Topp, Agriculture & Agrifood Canada; Lawrence Zintek, U. S. EPA Region 5, Charles Neslund, Eurofins; Kerri Malinowski, ME DEP; Sally Rowland, NY DEC; Mark Russell, formerly Chemours; Lakhwinder Hundal, formerly Chicago WRRF; Rufus Chaney, USDA (retired); Andrew Carpenter, Northern Tilth; Sally Brown, Univ. of WA; NH DES; NEBRA PFAS Advisory Group.
NEBRA’s PFAS work has been made possible by our members, with special support by:
Essity • Lystek • Resource Management Inc. • Waste Management
Chittenden (VT) Solid Waste District • Town of Merrimack, NH

Topics to Be CoveredWhy biosolids are recycled
What are PFAS?
Why the interest in PFAS related to biosolids / residuals
Look to the literature: some concerns
Northeast states evaluate locally
Perspective & summary

Why are PFAS a hot topic for biosolids/residuals now?(the “elevator talk” history of PFAS & wastewater / residuals)
• 2000s present: Increasing focus on PFOA & PFOS in the environment worldwide.
PFOA & PFOS voluntary phase-out by 2015.
• May 2016 EPA drinking water public health advisory (PHA) - - 70 ng/L (ppt) for PFOA & PFOS combined.
Rare ppt PHA.
• State agencies look for sources literature points to wastewater & residuals as some.
• Because they reflect modern life, wastewater, biosolids, & other residuals (e.g. from recycle paper mills)
contain low microgram/L (ppb) concentrations of PFAS.
• PFOA & PFOS chemistry and persistence Scant literature shows some leaching to groundwater possible at
levels approaching the EPA PHA concentration Regulators concerned. States’ cursory screening sampling
& analysis supports some concern. State reactions follow.
• 2107 – 2018: Public & legislative pressure drives efforts to lower the benchmark below EPA’s PHA of 70 ppt,
which could impact biosolids & residuals management.

But first, let’s remember why
biosolids are recycled.

Farms benefit
260 lb N/ac
Net Profit Increase = $250 – $500 per acre
FertilizerBiosolids

Research going back decades shows
benefits:Early growth of corn on control (left) and compost amended
(right)plots on Woodstown silt loam soil (Epstein and Chaney, 1974).

Numerous studies demonstrate the benefits derived from adding organic matter, such as biosolids, to soils: higher carbon content (carbon sequestration), increased microbial activity, increased water-holding capacity, and lower bulk density (which means easer tillage & handling).
Demonstrated & researched benefits of using biosolids:
– Dr. Sally Brown, Univ. of WA, 2011

Photos courtesy of King County,
WA
http://dnr.metrokc.gov/WTD/biosolids/
Photo courtesy of
Philadelphia Water Dept.
Biosolids use: Forestry
Speeds up harvest cycle in actively managed stands.
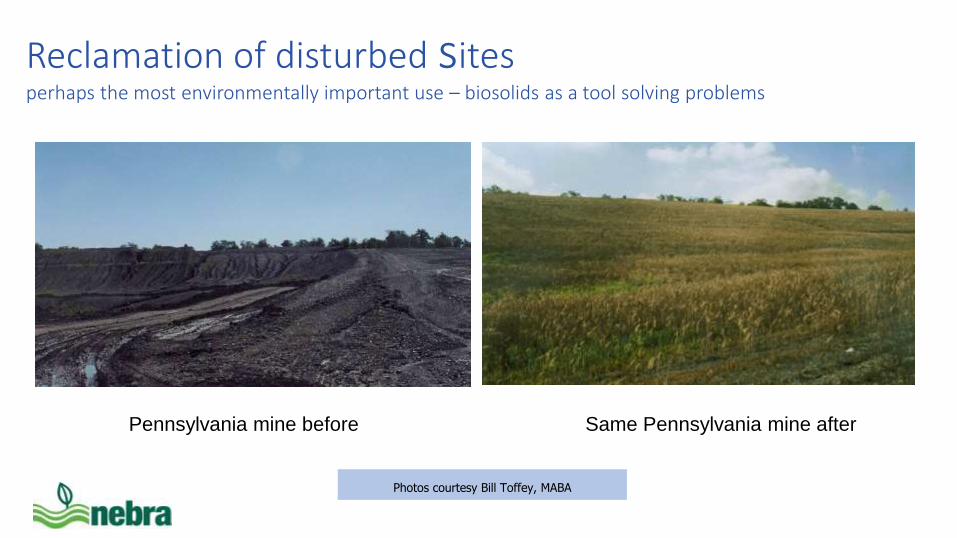
Reclamation of disturbed sites perhaps the most environmentally important use – biosolids as a tool solving problems
Pennsylvania mine before Same Pennsylvania mine after
Photos courtesy Bill Toffey, MABA
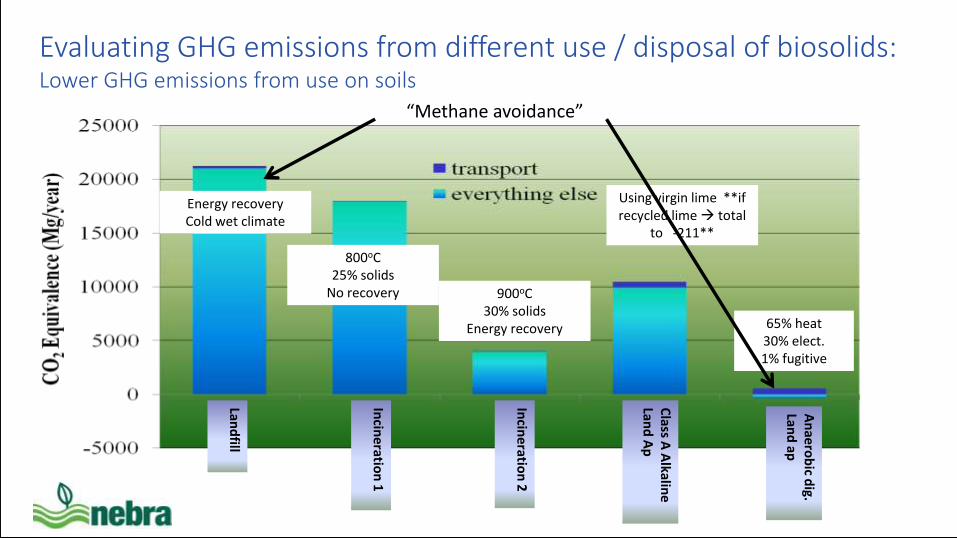
“Methane avoidance”
Energy recoveryCold wet climate
800oC25% solids
No recovery
65% heat 30% elect.1% fugitive
Land
fill
Incin
eratio
n 1
Incin
eratio
n 2
900oC30% solids
Energy recovery
Class A
Alkalin
e
Land
Ap
Using virgin lime **if recycled lime total
to -211**
An
aerob
ic dig.
Land
ap
Evaluating GHG emissions from different use / disposal of biosolids: Lower GHG emissions from use on soils

And biosolids manage many CECs / microconstituents.
• Myriad synthetic (and natural) organics in our daily lives – it’s inevitable• Focus on removing the most concerning POPs with source control.• Where should the rest end up? solids better than effluent and…… healthy soils better than air or water for managing most CECs*• In soils, over time, most either…
• degrade or• become less bioavailable and/or mobile
• How PFAS behave needs further research.
* “These terrestrial systems have orders of magnitude greater microbial capability and residence time to achieve decomposition and assimilation compared with aquatic systems.”
– Overcash, Sims, Sims, and Neiman, 2005

What are PFAS?

Background (general info)
• Per- and polyfluoroalkyl substances (PFAS)
• Large group of chemicals with many subgroups
• Man-made highly fluorinated alkyl (C2-C16) chemicals with unique properties
• Hydrophobic and lipophobic
• No natural counterparts
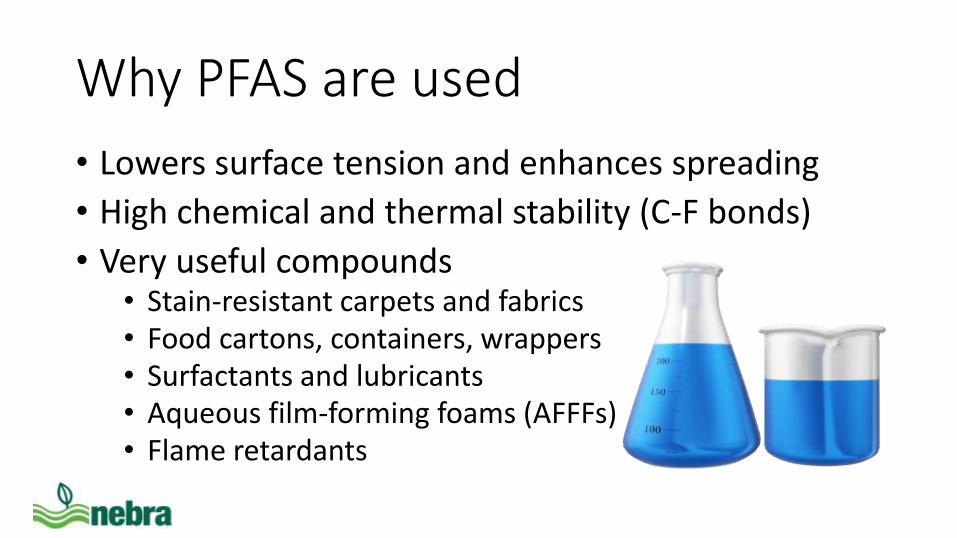
Why PFAS are used
• Lowers surface tension and enhances spreading
• High chemical and thermal stability (C-F bonds)
• Very useful compounds• Stain-resistant carpets and fabrics• Food cartons, containers, wrappers• Surfactants and lubricants • Aqueous film-forming foams (AFFFs)• Flame retardants

https://fluorocouncil.com/

Priori-tizingPFAS sites(State of Nebraska)

PFAS Chemistry/FateBuck et al. 2011. Perfluoroalkyland Polyfluoroalkyl Substances
in the Environment: Terminology, Classification, and
Origins.
Large number of chemical groups and individual chemicals
(>3000 used on the global market)
Similar properties valuable in commerce
Variable behavior in the
environment
PFAS products may contain multiple
isomers of the intended ingredients, residual
intermediary compounds,
byproducts, and – after release –degradation
products.

PFAS Chemistry/Fate• As acids and esters, PFAS compounds are susceptible to
ionization/dissociation and increased mobility
• Ionized forms likely to predominate in the environment and biota (including humans)
• Some PFAS compounds may degrade in the environment or biota, but will ultimately transform to very stable and persistent perfluoroalkyl acids (PFAAs)
• The yield rate of PFAAs from biotic and abiotic degradation depends on the precursors and degradation conditions
• Increasing C-chain length reduces leachability and increases bioaccumulation

Why the interest in PFAS related to
biosolids / residuals
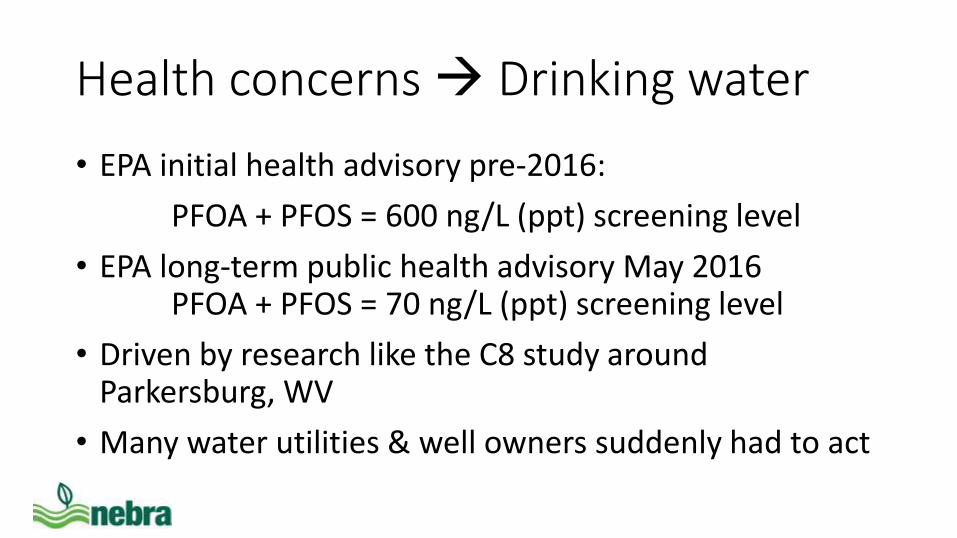
Health concerns Drinking water
• EPA initial health advisory pre-2016:
PFOA + PFOS = 600 ng/L (ppt) screening level
• EPA long-term public health advisory May 2016PFOA + PFOS = 70 ng/L (ppt) screening level
• Driven by research like the C8 study around Parkersburg, WV
• Many water utilities & well owners suddenly had to act

No probable links from
PFOA exposure
and…
• Diagnosed hypertension• Coronary artery disease• Chronic kidney disease• Liver disease• Osteoarthritis• Rheumatoid arthritis, lupus, Type I diabetes, Crohn’s disease, andmultiple sclerosis (autoimmune diseases other than ulcerative colitis)• Parkinson’s disease• Common infections (including influenza)• Neurodevelopmental disorders in children (e.g., ADD)• Asthma and chronic obstructive pulmonary disease (COPD)• Stroke• Nineteen types of cancer (other than kidney and testicular)• Type II diabetes• Birth defects• Miscarriages and stillbirths• Preterm birth and low birth weight

Probable links from
PFOA exposure
and…
• Diagnosed high cholesterol• Ulcerative colitis (autoimmune disease)• Thyroid disease• Testicular and kidney cancers• Pregnancy-induced hypertension
But, because of persistence in human body (~4+ years),
precaution requires reduced exposure.

PFOA/S drinking water standards / screening levels: diverse values drive differences in concern re residuals/biosolids.
MI DEQ criteria as of Jan. 2018: 70 ppt

And… There are data quality concerns for non-drinking water tests
• There’s 1 approved, consistent
analytical method - for drinking water
only (Method 537…)
• Thus, for other waters & solids/soils:
• Consistency & comparability of current data are
somewhat suspect
• Consider data on non-drinking water matrices –
including those presented here – to be for
screening and understanding only.

Current state concerns around PFAS were triggered by…
Water well testing around known industrial & landfill sites
Merrimack, NHSt. Gobain Performance Plastics, 2015 - 2016
Red = > 70 ng/L (ppt) Red = > 1000 ng/L (ppt)
Red = elevatedGreen / Blue = low
Coakley Landfill, NH
PFAS sources: Leaching from landfills or deposition from fabric coaters emitting PFAS to air soils groundwater.

Eastern NYNY DEC data 2016

Look to the literature: some concerns
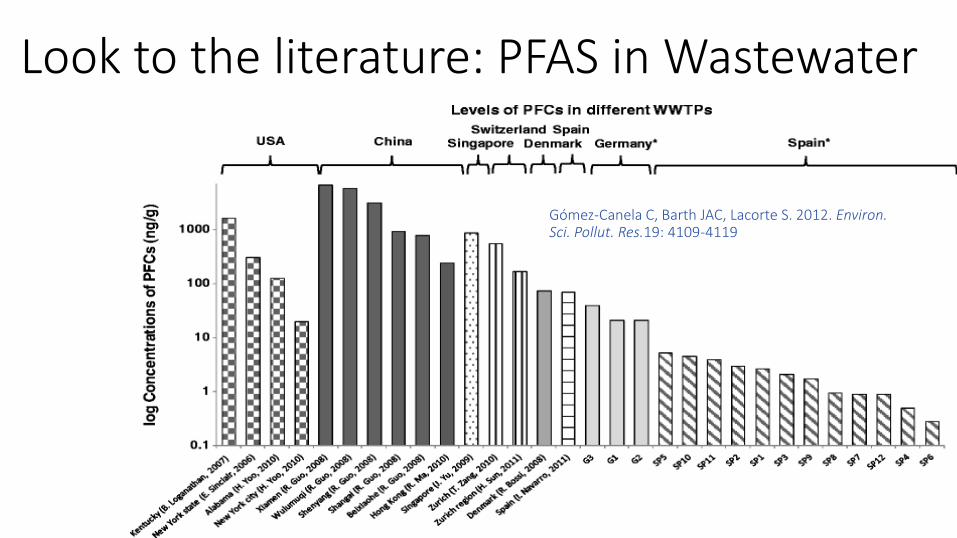
Look to the literature: PFAS in Wastewater
Gómez-Canela C, Barth JAC, Lacorte S. 2012. Environ. Sci. Pollut. Res.19: 4109-4119

Look to the literature: PFAS in septics groundwater(Schaider et al., 2014)
Compare to EPA PHA of 70 ng/L (ppt)

Look to the literature: PFAS in biosolidsClark and Smith, 2010
Total PFAS are ~ < 100 ng/g (ppb) in biosolids

PFOA/Smeasured in biosolids / residuals
vs.
PFOA/S in other media
PFOA (ppb) PFOS (ppb)
For comparison: Biosolids concentrations vs. other media

Look to the literature: PFAS in soil land application,
other sites
Source Type of loading PFOA (ug/kg) PFOS (ug/kg)
Washington et al., 2009, Decatur, AL biosolids
Industrially-impacted,high-PFAS biosolids 50 – 320 30 – 410
Sepulvado et al., 2011Chicago, IL biosolids Short-term
Long-term no data2 – 11
5.5 – 483
Gottschall et al., 2017, Ottawa, ON biosolids One-time 0.1 – 0.8 0.2 – 0.4
Garden control soils, MN (=6)
VT Dept. Health testing (n=100), for comparison
NH DES soil testing 2016 (n=160)
No significant PFAS source
Aerial deposition from nearby industry use
Aerial deposition from nearby industry use
0.29 – 0.54
ND – 45most < 10
ND – 33
0.93 – 2.1
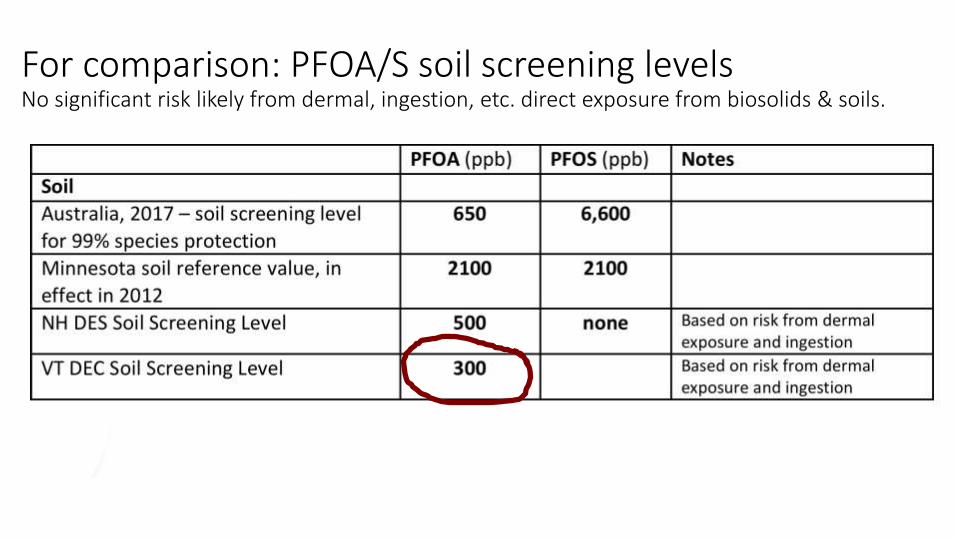
For comparison: PFOA/S soil screening levelsNo significant risk likely from dermal, ingestion, etc. direct exposure from biosolids & soils.

Concentrations of
PFOA and PFOS
with depth in the
long-term plots at
various loading
rates.
Control = 0 Mg/ha,
LR 1 = 553 Mg/ha,
LR 2 = 1109 Mg/ha,
LR 3 and LR 3 dup
= 2218 Mg/ha
(dry weight basis).
.
PFAS move some in soilSepulvado et al; Environ. Sci. Technol. 2011, 45, 8106-8112

Ratios of surface
concentration (Csurf) to
concentration in the bottom
soil core depth interval
(60−120 cm, Cdepth).
Ratios represent an
average of the ratios
calculated for the long-
term plots for each
biosolids loading rate.
.
Mobility varies with chemical structure (C chain length) Sepulvado et al; Environ. Sci. Technol. 2011, 45, 8106-8112

Movement of PFAS to tile drains & shallow groundwater
Study site in ON:• Humid continental climate
• Corn, wheat, soy rotations
• Very light tillage
• Systematic tiling, 15m spacing, about 1m depth
• Ottawa biosolids (mixed residential, industrial, commercial)
• 1.6 ug/kg PFOA, 7.2 ug/kg PFOS
• Treated by anaerobic digestion & centrifugation
• 22 Mg dw/ha (9.8 tons dw/ac)
• Moldboard plow to ~ 20cm
• Planted to winter wheat
Gottschall et. al. 2017. Sci. Total Environ. 574: 1345 – 1359

Gottschall et. al. 2017. Sci. Total Environ. 574: 1345 – 1359
ON study conclusions:
• Perfluorinated chemicals detected in both groundwater and tile discharge after a single large biosolids application.
• Chemicals detected for months after the application.
• The contributions of leaching through the soil matrix and preferential flow through macropores are unknown.
--Ed Topp, AAF Canada

PFAS risk & land applied biosolids/residuals (Mobility/Leaching)
Correlations from the literature:
• Biosolids/PFAS loading PFAS soil concentrations. Correlation is especially strong for longer chain (>C8) PFCA.
• Biosolids/PFAS loading groundwater and surface water concentrations
• For short-chain PFCAs, soil concentration may correlate better with time from last application.
• For short-chain PFAS, loading rate PFAS concentrations in well water and surface water
• Soil PFAS concentrations at depth may increase over time (slow leaching? degradation of precursors?)
• Presence in groundwater may follow release to surface soils by years if not decades, especially for longer chain PFAS (C8 and higher)

PFAS risk & land applied biosolids/residuals (Mobility/Leaching)
• Sorption in the soil does occur and may best be described as a sorption equilibrium reaction
• PFAS sorption equilibria are influenced by:
• PFAS carbon chain length
• Organic carbon content
• pH
• [Ca+2]
• Clay content
• Specific surface area
• More research needed.

PFAS risk and land applied biosolids/residuals (public health)
• Little evidence to date that residuals without obvious industrial PFAS contributions are a risk to public health via groundwater contamination following typical land application
• A determination of public health risk is influenced by several factors:
• Type and quality of wastewater residuals,
• PFAS compounds to be considered,
• Field conditions (climate, soil type, depth to groundwater, etc.), and
• Regulatory requirements (loading limits, land application restriction, drinking water standards, required setback, application rates).
• Differences in these factors from state to state can lead to different conclusions regarding public health risk.
• One potential set of conservative soil screening levels for protection of groundwater were calculated for PFOS (3 ug/kg) and PFOA (3 ug/kg) (Xiao et al. 2015). Other modeling suggests ~140 ug/kg may be appropriate. NY State is now using 72 ug/kg PFOA + PFOS for screening in particular permit conditions. These are the numbers state regulators want ASAP, but data is lacking for precision.

Northeast states evaluate locally

PFAS in wastewater (presence further confirmed, 2017 NH DES data)
PFBA PFHPA PFHXS PFHXA PFNA PFOA PFOS PFPEAC4 C7 C6-S C6 C9 C8 C8 C5
Small City Influent 13 <4 <4 7 <4 6 6 5
Small City Effluent 7 <4 <4 46 <4 6 7 21
Mid-size City Influent <9.6 7 7 10 <4.8 15 22 29
Mid-size City Effluent <9.6 5 8 20 <4.8 15 14 9
Municipality with industrial impacts
Influent56 8 <4 49 <4 50 4 36
Municipality with industrial impacts
Effluent73 19 <4 195 <4 49 <4 101
Northeast states evaluate locally…

PFAS in wastewater residuals 2017(presence further confirmed)
Chemical % detection
Conc. Range
(ug/kg) Ave. Conc. (ug/kg)
PFBA 20 0.54 – 140 34.6
PFPeA 8 18 – 27 22.5
PFHeA 84 0.21 – 75 11.0
PFHpA 26 0.077 – 2.8 1.1
PFOA 32 1.1 – 15 6.7
PFNA 30 1 – 3.6 2.6
PFBS 7 5.2 – 6.2 5.7
PFHxS 22 0.24 – 73 13.3
PFOS 62 0.59 - 390 34
Northeast states evaluate locally…

Regulatory response in March 2017 drove recycle paper mill residuals to landfill and composting business to laying off workers, due to non-drinking, surface water levels up to combined 240 ng/L (ppt). (Not drinking water. Do we need to have all surface water meet drinking water screening? Facility continues to operate, but is challenged.
Paper mill residuals & yard waste composting facility: water impacts…
Northeast states evaluate locally…

Monitoring well testing at biosolids monofill• Monofill used in 1980s. Since ~1996, all biosolids from WWTP (11.5 MGD) have been
land applied, some on farm field shown.
• Likely a worst-case scenario? No drinking water impacts found.
historic wastewater
solids monofill
ND4.840151
315
884
363
ND
46.5
25.6
12.4
ND
GW flow
ng/L PFOA + PFOS
0 (2 drinking water wells)
Northeast states evaluate locally…

Monitoring well testing at reclamation site• Historic land application use to ~2001.
• Likely a worst-case scenario. No drinking water impacts found.
historic reclamation area
NDupgradient 59
ng/L PFOA + PFOS
downgradient
56
561
Northeast states evaluate locally…

Attempts defining safe PFAS levels: soils & biosolids/residuals leaching to GW
• Alaska, 2016• Proposed migration-to-groundwater soil cleanup level: PFOA: 1.7 ug/kg (ppb)
PFOS: 3 ug/kg
• New York, 2017• DEC; interim preliminary screening level for specific permits: PFOA + PFOS: 72 ug/kg
• Maine, 2017-18
• Current provisional (adapted from EPA RSLs 2017): PFOA: 2.5 ug/kgPFOS: 5.2 ug/kg
• NEBRA is encouraging ME DEP to remove any residuals screening levelsat this time and wait for the science to catch up.
• VT, 2017 – added PFOA & PFOS to Haz. Waste list for liquids: PFOA + PFOS >20 ppt
The science has not caught up! It’s too early to set a defensible screening number!

Data on key parameters is variable (e.g. re Koc)
• “Applying lab-based log K(oc) distribution coefficients can therefore result in a serious overestimation of PFC concentrations in water and in turn to an underestimation of the residence time of PFOA and PFOS in contaminated soils” – Zareitabalad et al., 2013
• Understanding Koc for PFAS in biosolids & residuals depends on:• C chain length: longer-chain PFAS (e.g. PFOA, PFOS) have higher sorption (an estimated 0.5 log Koc
increase for each CF2 group (Higgins and Luthy, 2006, Env. Sci. & Tech)),
• sludge has a higher Koc than sediments (Chen et al., 2012),
• “organic rich soils retard movement of PFAS” (E. Houtz, 2017, Arcadis to NEWMOA, May 8-10, 2017),
• site-specific conditions.
Koc PFOA (L/kg) Koc PFOS (L/kg) Notes Reference
U. S. EPA 114.8 371.5 Used by ME DEP Data inputs to RSLs
Lab sorption experiments, average
631 1000 Higher values found in field experiments*.Zareitabalad et al. (2013), Chemosphere
Desorption experiments 204 2188 Sepulvado et al., 2011
Summary data 83 – 389 250 - 50,100 U. S. National Library of Medicine, 2017, Hazardous substances data bank

States are seeking consistency & collaboration.

Perspective & Summary

Perspective: Wastewater & biosolids mirror modern life.
• Wastewater solids management is not optional.
• Wastewater solids can be landfilled; incinerated; or treated, tested, & applied to soil as biosolids. The latter usually is best environmentally, overall.

Perspective
• PFAS are clearly mobile – found throughout the environment
• PFAS are in wastewater & residuals because they have been widely used for decades and are persistent in the environment
• Presence in wastewater & residuals is not necessarily evidence of risk or even significant exposure in excess of current everyday exposure
• Uncertainty continues regarding PFAS public health risk; health studies vary.
• PFOA & PFOS are phased out in No. America. Human blood serum levels down 50%+ over ~15 years.
• Is this is a legacy issue, at least for PFOA & PFOS? Modern biosolids / residuals are likely less of a concern than historic ones.

What about actual environmental impacts?Perspective: Bioassays get at whole system impacts.
• 1980s & ‘90s: Sopper (Penn State Univ.): testing of plant and rabbit health on sites reclaimed with
biosolids (with focus on heavy metals)
• 2000s: Brown (Univ. of WA), USDA, and others: testing of plant and rabbit health on sites reclaimed
with biosolids
• 2010: University of Guelph – fate of endocrine disruption during biosolids treatment processes
• 2010: College of William and Mary: bioavailability of PDBEs using earthworms and crickets in
laboratory
• 2013: Park, et al. (Tom Young team, UC Davis): Triclosan has “little relative impact on overall
community composition…” and “TCS slightly increased biomarkers of microbial stress, but stress
biomarkers were lower in all biosolid treated soils, presumably due to increased availability of nutrients
mitigating potential TCS toxicity.”
• 2013: Puddephat thesis (Lynda McCarthy team, Ryerson Univ.): lab bioassays in Ontario using
earthworms, springtails, brassica rapa, beans, corn, & aquatic organisms
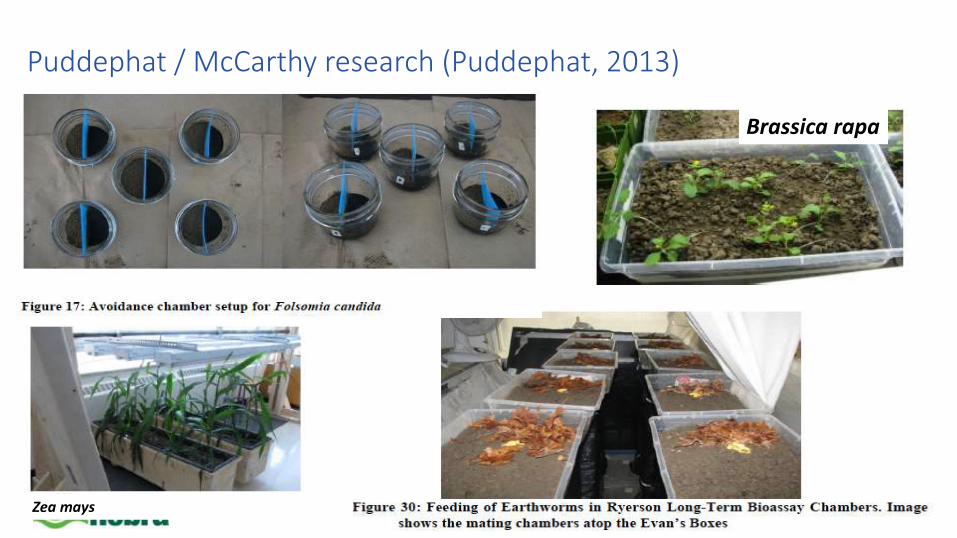
Puddephat / McCarthy research (Puddephat, 2013)
Brassica rapa
Zea mays

Conclusions of Puddephat / McCarthy:
Puddephat, 2013:“…biosolids had little negative impact on the terrestrial biota examined and as a general rule, there was no impact observed. Where effects were observed, the majority of instances were positive. In the few instances where there was negative impact observed, for example in the initial growth stages of the plant bioassays, with further development of the organism, there was no longer a significant difference between the reference and treatment plants.”
And PFAS were most likely in those biosolids at levels higher than today’s biosolids.

• The core concern for biosolids & residuals management is potential leaching of PFAS impacting drinking water or surface water. Period.
• Initial leaching modeling has instigated concern, but most of that modeling includes:
• worst-case-scenario assumptions
• output of concentrations in soil pore water / top of groundwater table
• no dispersion or dilution factors
Summary

• Regulatory agencies that adopt low (<70 ppt) PFAS standards for drinking water or groundwater are finding it hard to enforce and mitigate all locations, because there are many.
• EPA stresses that the 70 ppt is a public health advisory level for lifetimedrinking water; some call it overly conservative.
• With PFOA & PFOS levels already declining dramatically in humans, states need to assess what public health benefit is gained for considerable cost in chasing groundwater protection at lower levels.
• Biosolids managers should apply the same best management practices as for all biosolids and their CECs / microconstituents, including source control (e.g. landfill leachate), setbacks, and agronomic rate applications. And monitor this topic.
Summary (2)

The question: Where do normal, modern biosolids applications lie on the continuum of potential PFAS impacts to ground / surface waters?
Historic residuals impacted by PFAS
manufacturer
(e.g. 3M, Decatur, AL; NE farm with high PFOS
likely from 1980s papermill residuals use)
Historic / modern residuals heavily
applied repeatedly
(Sepulvado et al. 2011
Modern residuals applied semi-annually
with setbacks, etc. (Gotschall et al. 2017)
EQ biosolids used for several years -
home settings
(e.g. 3 sites in NH)
Higher concern Minimal to no concern
Where drinking water & ground water standards are set will determine our level

NEBRA Response to PFAS Concerns
• NEBRA pursuing answers via facilitation of relevant research and guidance (with very limited resources):
• PFAS Advisory Group• Fact Sheets & Perspective• PFAS & Residuals Sampling & Analysis Guidance• Literature Review• PFAS Research with UNH & NH DES• Webinars on PFAS issues
• Working with state agencies and legislatures to deal with PFAS risk in a measured and thoughtful manner (need to avoid regulatory over-reaction)
• Nationwide PFAS conference call – last Tuesday of every odd month, 1:30 Eastern (e.g. March 27, 2018) – all welcome.
• Some resources (e.g. recording of analysis webinar) are here:https://www.nebiosolids.org/nebra-publications
• More resources for members & upon request.
Core research question:
“Does land application of wastewater residuals (paper mill solids, municipal biosolids, etc.) at fertilizer rates with current common regulatory requirements and proper industrial source controls represent a risk to public health from PFAS contamination of groundwater via leaching and/or surface water via runoff?”

Ned Beecher, Executive DirectorNEBRATamworth, NH [email protected]
Thank you.
Biosolids compost for my

Selected References• Analyzing PFAS in Wastewater, Solids, & Soils: State of the Science Webinar, NEBRA Webinar, Sept. 14, 2017
• Buck, R., Franklin, J., Berger, U., Conder, Cousins, I., de Voogt, P., Jensen, A., Kannan, K., Mabury, S., van Leeuwenkket, S., 2011. Perfluoroalkyl and PolyfluoroalkylSubstances in the Environment: Terminology, Classification, and Origins. Integrated Environmental Assessment and Management, Vol. 7, No. 4, 513–541.
• Gottschall, N., Topp, E., Edwards, M., Payne, M., Kleywegt, S., Lapena, D.R., 2017. Brominated flame retardants and perfluoroalkyl acids in groundwater, tile drainage, soil, and crop grain following a high application of municipal biosolids to a field. Science of the Total Environment, 574, 1345–1359.
• Lindstrom, A., Strynar, M., Delinsky, A., Nakayama, S., McMillan, L., Libelo, L., Neill, M., Thomas, L., 2011. Application of WWTP Biosolids and Resulting PerfluorinatedCompound Contamination of Surface and Well Water in Decatur, Alabama, USA. Environmental Science & Technology, 45 (19), 8015–8021.
• Sepulvado, J., Blaine, A., Hundal, L., Higgins, C., 2011. Occurrence and Fate of Perfluorochemicals in Soil Following the Land Application of Municipal Biosolids. Environmental Science and Technology, 45 (19), 8106–8112.
• Venkatesan, K, and Halden, R., 2013. National inventory of perfluoroalkyl substances in archived U.S. biosolids from the 2001 EPA National Sewage Sludge Survey. Journal of Hazardous Materials, 252– 253, (2013), 413– 418.
• Washington, J., Ellington, J., Hoon, Y., and Jenkins, T., 2009. Results of the Analyses of Surface Soil Samples from Near Decatur, Alabama for Fluorinated Organic Compounds. U.S. EPA, Office of Research and Development
• Xiao, F., Simcik, M., Halbach, T., Gulliver, J., 2013. Perfluorooctane sulfonate (PFOS) and perfluorooctanoate (PFOA) in soils and groundwater of a U.S. metropolitan area: Migration and implications for human exposure. Water Research, 72 (2015), 64 74.
• Xiao, F., Gulliver, J., Simcik, M., 2013. Transport of Perfluorochemicals to Surface and Subsurface Soils. Center for Transportation Studies University of Minnesota, Report No. CTS 13-17.
• Zareitalabad, P., Siemens, J., Hamer, M., Amelung, W., 2013. Perfluorooctanoic acid (PFOA) and perfluorooctanesulfonic acid (PFOS) in surface waters, sediments, soils and wastewater – A review on concentrations and distribution coefficients. Chemosphere 91 (2013), 725–732.