MIGRATION ROUTES AND CHRONOLOGY OF AMERICAN BLACK DUCKS
51
MIGRATION ROUTES AND CHRONOLOGY OF AMERICAN BLACK DUCKS by Kurt A. Anderson A thesis submitted to the Faculty of the University of Delaware in partial fulfillment of the requirements for the degree of Master of Science in Wildlife Ecology Summer 2013 © 2013 Kurt A. Anderson All Rights Reserved
Transcript of MIGRATION ROUTES AND CHRONOLOGY OF AMERICAN BLACK DUCKS
MIGRATION ROUTES AND CHRONOLOGY OF
AMERICAN BLACK DUCKS
by
Kurt A. Anderson
A thesis submitted to the Faculty of the University of Delaware in partial
fulfillment of the requirements for the degree of Master of Science in Wildlife
Ecology
Summer 2013
© 2013 Kurt A. Anderson
All Rights Reserved

MIGRATION ROUTES AND CHRONOLOGY
OF AMERICAN BLACK DUCKS
by
Kurt A. Anderson
Approved: __________________________________________________________
Jacob L. Bowman, Ph.D.
Professor in charge of thesis on behalf of the Advisory Committee
Approved: __________________________________________________________
Douglas W. Tallamy, Ph.D.
Chair of the Department of Entomology and Wildlife Ecology
Approved: __________________________________________________________
Mark W. Rieger, Ph.D.
Dean of the College of Agriculture and Natural Resources
Approved: __________________________________________________________
James G. Richards, Ph.D.
Vice Provost for Graduate and Professional Education
iii
ACKNOWLEDGMENTS
I begin by thanking my advisor, Dr. Jacob Bowman, for his flexibility,
insight, and most of all, his persistence. I must also thank the other members
of my graduate committee, Dr. Greg Shriver and Dr. John Coluccy. Dr.
Shriver instilled in me a deeper appreciation for and more comprehensive
understanding of non-game birds, whereas Dr. Coluccy served as and
continues to be a personal mentor and dear friend. My graduate experience
and life are enriched as a result of my interactions with all of the above.
Further, I offer my sincere appreciation to the numerous colleagues,
professionals, technicians, volunteers, and others whose support made this
project possible. Last, I wish to recognize the outstanding contributions of
my wife, Johanna, to whom I am eternally grateful. Her enduring love and
patience motivated me during this project from start to finish and serve as the
foundation of our life together.
iv
TABLE OF CONTENTS
LIST OF TABLES ......................................................................................................... v
LIST OF FIGURES ....................................................................................................... vi ABSTRACT ................................................................................................................. vii
Chapter
1 INTRODUCTION .............................................................................................. 1
2 STUDY AREA ................................................................................................... 5
3 METHODS ......................................................................................................... 9
Study Design ...................................................................................................... 9
Data Analyses ................................................................................................... 11
4 RESULTS ......................................................................................................... 14
5 DISCUSSION ................................................................................................... 29
REFERENCES ............................................................................................................. 34

v
LIST OF TABLES
Table 1 Range of departure dates from wintering areas (mean), arrival
dates on inferred nesting areas (mean), # of stopovers (mean ±
SE), duration of stay (days; mean ± SE), and total distance
traveled (km; mean ± SE) of adult female American black ducks
PTT-tagged in New Jersey, Ohio, Virginia, Delaware, and New
York, USA during springs migrations 2008 and 2009. ............................. 16
Table 2 Migratory variables (mean ± SE) of adult female American
black ducks by region during spring 2008 and 2009. ................................ 17
Table 3 Migratory variables (mean ± SE) of adult female American
black ducks by latitude during spring 2008 and 2009. .............................. 19
Table 4 Migratory variables (mean ± SE) of adult female American
black ducks by longitude during spring 2008 and 2009. ........................... 21
Table 5 Relationships between migratory variables of adult female
American black ducks in eastern North America during spring
2008 and 2009. .......................................................................................... 26
Table 6 Range of departure dates from inferred nesting areas (mean),
arrival dates at wintering areas (mean), # of stopovers (mean ±
SE), duration of stay on stopovers (d; mean ± SE), and total
distance traveled (km; mean ± SE) of adult female American
black ducks PTT-tagged in New Jersey, Ohio, Virginia,
Delaware, and New York, USA during autumn migrations 2008
and 2009. ................................................................................................... 28
vi
LIST OF FIGURES
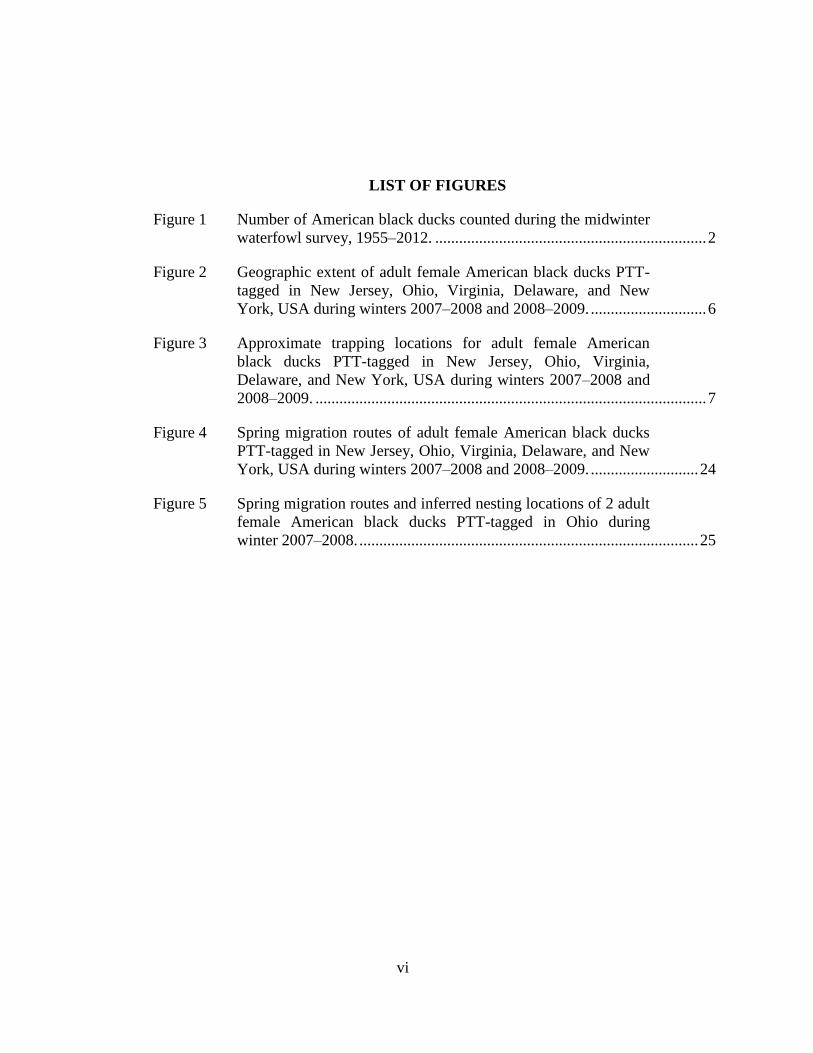
Figure 1 Number of American black ducks counted during the midwinter
waterfowl survey, 1955–2012. .................................................................... 2
Figure 2 Geographic extent of adult female American black ducks PTT-
tagged in New Jersey, Ohio, Virginia, Delaware, and New
York, USA during winters 2007–2008 and 2008–2009. ............................. 6
Figure 3 Approximate trapping locations for adult female American
black ducks PTT-tagged in New Jersey, Ohio, Virginia,
Delaware, and New York, USA during winters 2007–2008 and
2008–2009. .................................................................................................. 7
Figure 4 Spring migration routes of adult female American black ducks
PTT-tagged in New Jersey, Ohio, Virginia, Delaware, and New
York, USA during winters 2007–2008 and 2008–2009. ........................... 24
Figure 5 Spring migration routes and inferred nesting locations of 2 adult
female American black ducks PTT-tagged in Ohio during
winter 2007–2008. ..................................................................................... 25
vii
ABSTRACT
Migration influences the ecology, evolution, and conservation of
migratory animals (Webster et al. 2002), yet migration routes and timing
between breeding and wintering areas is virtually unknown for American
black ducks Anas rubripes. We used satellite telemetry to identify migration
routes and stopovers, estimate migration chronology, and describe variation
among black ducks marked between 2007–2009 in Delaware, New Jersey,
New York, Ohio, and Virginia. A total of 31 transmitters provided at least
one full data set during spring migrations. Black ducks departed wintering
areas March 18–June 7 ( x = April 17), averaged 3.35 stopovers (SE = 0.3
stopovers; range = 1–5 stopovers) and 6.44 d at stopovers (SE = 0.8 d; range
= 0.54–12.2 d), migrated 1,126 km (SE = 89.5 km; range = 270–1,396 km),
and arrived at inferred nesting areas April 16–June 28 ( x = May 9). South
Atlantic Flyway black ducks migrated almost twice as far and took nearly
twice as many stopovers as Mississippi and North Atlantic Flyway black
ducks; South and North Atlantic Flyway black ducks arrived at inferred
nesting areas approximately 2 and 4 weeks after those from the Mississippi
Flyway, respectively. Black ducks south of the 40th
parallel migrated more
than 50% farther, took nearly twice as many stopovers, and arrived at inferred
viii
nesting areas 2 weeks after those to the north. Black ducks east of the 76th
meridian migrated nearly 25% farther and arrived at inferred nesting areas 3
weeks after those to the west. Nine black ducks spent all or portions of spring
migration along the Atlantic Coast, and 10 used the Hudson and St. Lawrence
River valleys. Stopovers included Long Island Sound, NY, Narragansett Bay,
RI, Lake Champlain, VT, Merrymeeting Bay, ME, and the Gulf of St.
Lawrence, Canada. All 11 black ducks wintering in Ohio stopped at Lake St.
Clair, Saginaw Bay, St. Mary’s River, or the Georgian Bay. A total of 13
transmitters provided at least partial data during autumn migrations. Black
ducks departed inferred nesting or molting areas October 5–December 1 ( x =
October 24), averaged 2.0 stopovers (SE = 0.3 stopovers; range = 1–4
stopovers) and spent 12.6 d at stopovers (SE = 3.5 d; range = 0.25–41 d),
migrated 993 km (SE = 202.9 km; range = 277–1,485 km), and arrived at
wintering areas November 18–December 18 ( x = December 1). Our study
confirms the importance of known stopovers and emphasizes the continued
need for conservation and management of wetland habitats along established
migration corridors. Furthermore, migration chronology and stopover
duration of stay from our study should be incorporated into energetic carrying
capacity models to better inform and direct habitat goals for black ducks in
northeastern North America.
1
Chapter 1
INTRODUCTION
Populations of American black ducks Anas rubripes (hereafter black ducks)
have declined significantly over the last 50 years. Midwinter waterfowl survey counts
range from over 750,000 in 1955 to less than 300,000 in 1983 and 1984 (USFWS
2012). The 1986 North American Waterfowl Management Plan (NAWMP)
population goal for black ducks was set at the 1970s level of 385,000 wintering birds;
NAWMP also called for the formation of Joint Ventures (JV), including the Black
Duck JV, to help institute the standard by 2000 (NAWMP 1986). Despite increased
attention, the 2000 midwinter waterfowl survey count was 260,372 black ducks with
as few as 246,334 wintering black ducks counted in 2012 (USFWS 2012). Their
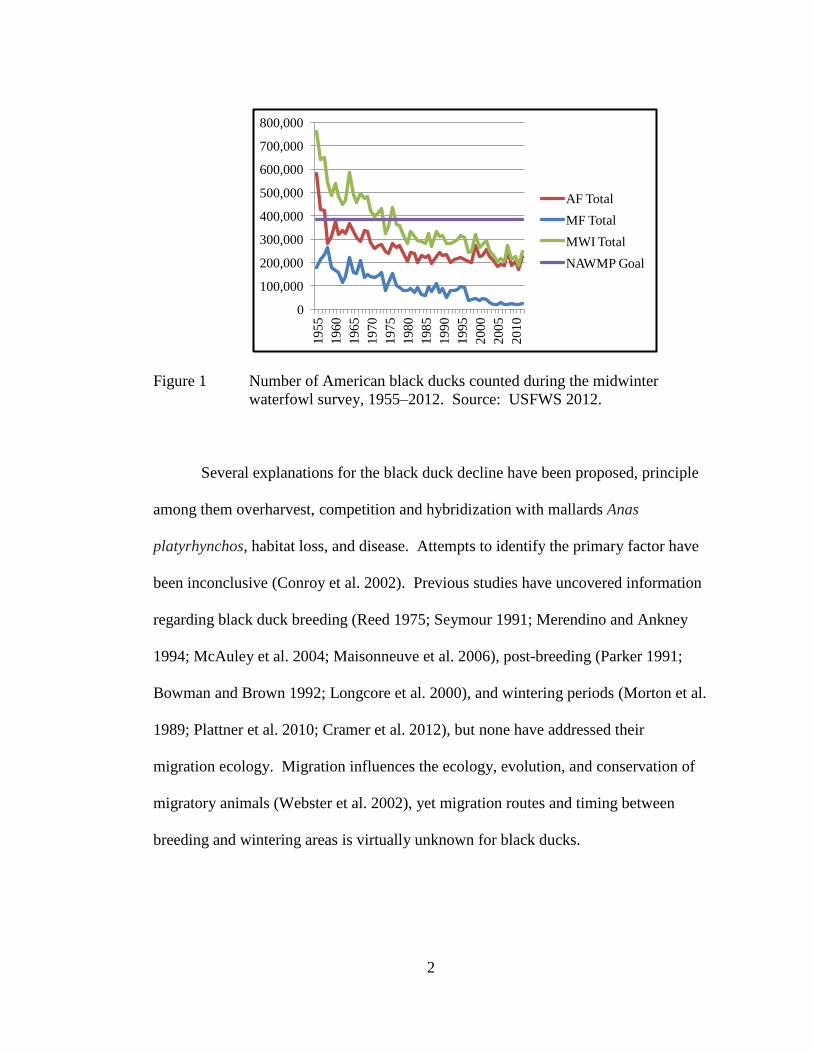
population remains more than 30% below the NAWMP goal (Figure 1).
2
Figure 1 Number of American black ducks counted during the midwinter
waterfowl survey, 1955–2012. Source: USFWS 2012.
Several explanations for the black duck decline have been proposed, principle
among them overharvest, competition and hybridization with mallards Anas
platyrhynchos, habitat loss, and disease. Attempts to identify the primary factor have
been inconclusive (Conroy et al. 2002). Previous studies have uncovered information
regarding black duck breeding (Reed 1975; Seymour 1991; Merendino and Ankney
1994; McAuley et al. 2004; Maisonneuve et al. 2006), post-breeding (Parker 1991;
Bowman and Brown 1992; Longcore et al. 2000), and wintering periods (Morton et al.
1989; Plattner et al. 2010; Cramer et al. 2012), but none have addressed their
migration ecology. Migration influences the ecology, evolution, and conservation of
migratory animals (Webster et al. 2002), yet migration routes and timing between
breeding and wintering areas is virtually unknown for black ducks.
0
100,000
200,000
300,000
400,000
500,000
600,000
700,000
800,000
1955
1960
1965
1970
1975
1980
1985
1990
1995
2000
2005
2010
AF Total
MF Total
MWI Total
NAWMP Goal

3
Information regarding chronology, length and duration of migration, and routes
and stopovers of black ducks is a priority information need identified by the Black
Duck (2008) and Upper Mississippi River and Great Lakes Region (UMRGLRJV;
Soulliere et al. 2007) JVs. It is required for developing black duck population
objectives, from which habitat objectives are estimated through the use of
bioenergetics models. Additionally, knowledge of primary black duck breeding,
staging, and wintering locations can help waterfowl managers direct conservation
efforts in key areas.
Current information regarding the migration routes of black ducks has been
derived primarily from band returns, which are generally limited to autumn and winter
(Addy 1953). Spring migration routes of black ducks have never been examined, and
spring migration routes do not necessarily retrace autumn routes in other waterfowl
species (Bellrose 1968; Wege and Raveling 1983; Ely et al. 1997). Band returns also
have provided limited insight into departure and arrival dates of black ducks during
autumn migration. Coulter (1955), Bellrose (1980), and Longcore et al. (2000)
offered generalizations on the timing of seasonal movements, identifying months
during which migration either occurs or peaks, and Chaulk and Turner (2007)
provided a similar description of arrival during spring migration by week. None are
explicit, however. The same paucity of information exists for time spent on migratory
stopovers (Arzel et al. 2006).
We used satellite telemetry to identify migration routes and stopovers, estimate
migration chronology, and describe variation among black ducks from different

4
regions, latitudes, and longitudes. Our study was the first attempt to examine
connectivity across biomes during their annual life cycle and will supplement current
research aimed at acquiring the necessary data to model habitat requirements of black
ducks across their entire range.
5
Chapter 2
STUDY AREA
Our study area included all black duck satellite telemetry locations from
winter, staging, and inferred nesting areas (Figure 2), which encompassed most of
eastern North America. Black ducks are endemic to eastern North America, with a
breeding range from Ontario to Newfoundland and south through the Great Lakes and
mid-Atlantic coast of the U.S., and a winter range from the Great Lakes and St.
Lawrence River south through the Mississippi and Atlantic Flyways (Bellrose 1980).
Bellrose (1980) suggested that the single most important migration corridor for black
ducks extended along the Atlantic Coast from Virginia to Atlantic Canada. Other
important migration corridors in the Atlantic Flyway extended from the New England
Coast to eastern Quebec and from the Chesapeake Bay to western Quebec and eastern
Ontario (Bellrose 1980). In the Mississippi Flyway, the majority of black ducks used
the marshes of western Lake Erie during migration into Ontario (Bellrose 1980).
6
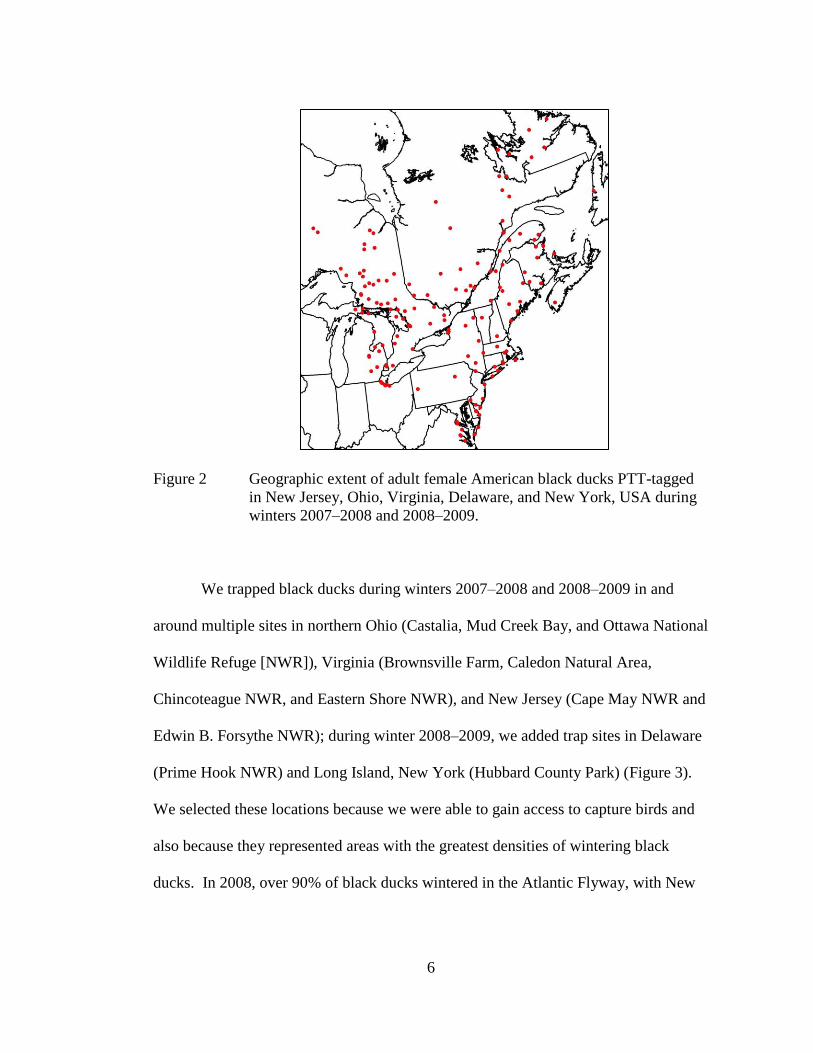
Figure 2 Geographic extent of adult female American black ducks PTT-tagged
in New Jersey, Ohio, Virginia, Delaware, and New York, USA during
winters 2007–2008 and 2008–2009.
We trapped black ducks during winters 2007–2008 and 2008–2009 in and
around multiple sites in northern Ohio (Castalia, Mud Creek Bay, and Ottawa National
Wildlife Refuge [NWR]), Virginia (Brownsville Farm, Caledon Natural Area,
Chincoteague NWR, and Eastern Shore NWR), and New Jersey (Cape May NWR and
Edwin B. Forsythe NWR); during winter 2008–2009, we added trap sites in Delaware
(Prime Hook NWR) and Long Island, New York (Hubbard County Park) (Figure 3).
We selected these locations because we were able to gain access to capture birds and
also because they represented areas with the greatest densities of wintering black
ducks. In 2008, over 90% of black ducks wintered in the Atlantic Flyway, with New

7
Jersey (136,520) holding more than half (USFWS 2012). Maryland (22,952), Maine
(19,099), Massachusetts (18,491), Virginia (15,355), and New York (15,060) also
were important for wintering black ducks in the Atlantic Flyway (USFWS 2012). In
the Mississippi Flyway, most black ducks over-wintered in either Tennessee (6,300) or
Ohio (5,644) in 2008 (USFWS 2012).
Figure 3 Approximate trapping locations for adult female American black ducks
PTT-tagged in New Jersey, Ohio, Virginia, Delaware, and New York,
USA during winters 2007–2008 and 2008–2009.
During winters 2007–2008 and 2008–2009, mean temperatures in the northeast
region of the United States were -2.5°C and -3.2°C, or 0.6°C and 0.1°C above the 100-
year average, respectively (NOAA 2013). Mean precipitation during winter 2007–
2008 was 44.5 cm, or 13.1 cm above the 100-year average, and ranked 1st in the
8
northeast region for the same period during the preceding century (NOAA 2013).
Mean precipitation during winter 2008–2009 was 32.3 cm, or 0.9 cm above the 100-
year average (NOAA 2013). In the central region of the United States, which included
Ohio and Tennessee, mean temperatures were 1.6°C during winters 2007–2008 and
2008–2009, nearly identical to the 100-year average (NOAA 2013). Mean
precipitation during winter 2007–2008 was 46.1 cm, or 13.8 cm above the 100-year
average, and ranked 3rd
in the central region for the same period during the preceding
century (NOAA 2013). Mean precipitation during winter 2008–2009 was 34.4 cm, or
2.1 cm above the 100-year average (NOAA 2013).
9
Chapter 3
METHODS
Study Design
We followed protocols described by Gaunt et al. (2010) during the capture and
handling of black ducks. We captured black ducks using cloverleaf (swim-in) traps,
walk-in traps, and rocket nets baited with corn. We used bill, cloacal, and feather
(Ashley et al. 2006) characteristics to identify and retain after second year females
because of their role in population dynamics and previous experience with migration
(Miller et al. 2005a). Additionally, we weighed after second year females and
selected only those that were ≥1000 g. Females with lower body mass are more likely
to be adversely affected by satellite transmitters because of mass or aerodynamic
impacts that result in aberrant behavior or mortality (Miller et al. 2005a).
We affixed to each selected female a standard USGS leg band and solar-
powered, satellite Model 100 Platform Transmitting Terminal (PTT; Microwave
Telemetry, Columbia, MD). Each PTT weighed 22 g, measured 62 mm x 22 mm x 21
mm, and had a 178 mm-long nylon-coated flexible-stranded stainless steel antenna
that protruded posteriorly at a 45° angle. We attached all PTTs mid-dorsally between
the wings by a 0.38 cm-wide harness made of Natural Tubular Teflon® tape (Bally
Ribbon Mills, Bally, PA). Each harness set was 13 g and included breast and belly
10
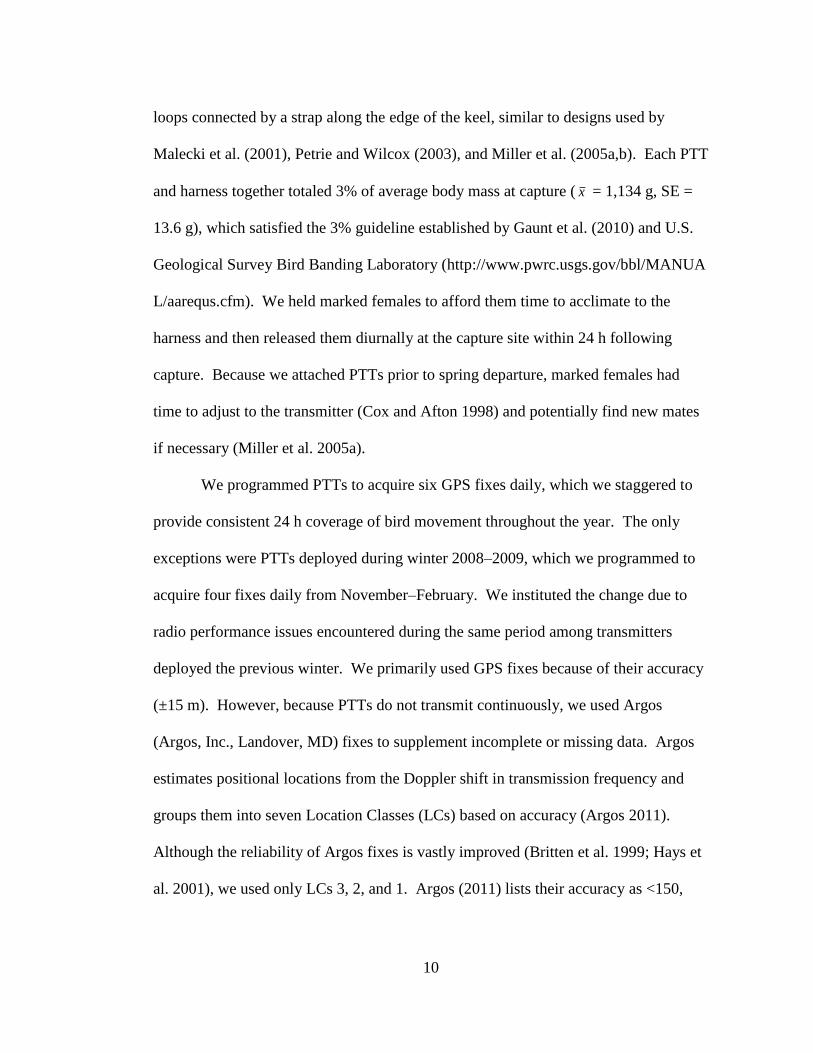
loops connected by a strap along the edge of the keel, similar to designs used by
Malecki et al. (2001), Petrie and Wilcox (2003), and Miller et al. (2005a,b). Each PTT
and harness together totaled 3% of average body mass at capture ( x = 1,134 g, SE =
13.6 g), which satisfied the 3% guideline established by Gaunt et al. (2010) and U.S.
Geological Survey Bird Banding Laboratory (http://www.pwrc.usgs.gov/bbl/MANUA
L/aarequs.cfm). We held marked females to afford them time to acclimate to the
harness and then released them diurnally at the capture site within 24 h following
capture. Because we attached PTTs prior to spring departure, marked females had
time to adjust to the transmitter (Cox and Afton 1998) and potentially find new mates
if necessary (Miller et al. 2005a).
We programmed PTTs to acquire six GPS fixes daily, which we staggered to
provide consistent 24 h coverage of bird movement throughout the year. The only
exceptions were PTTs deployed during winter 2008–2009, which we programmed to
acquire four fixes daily from November–February. We instituted the change due to
radio performance issues encountered during the same period among transmitters
deployed the previous winter. We primarily used GPS fixes because of their accuracy
(±15 m). However, because PTTs do not transmit continuously, we used Argos
(Argos, Inc., Landover, MD) fixes to supplement incomplete or missing data. Argos
estimates positional locations from the Doppler shift in transmission frequency and
groups them into seven Location Classes (LCs) based on accuracy (Argos 2011).
Although the reliability of Argos fixes is vastly improved (Britten et al. 1999; Hays et
al. 2001), we used only LCs 3, 2, and 1. Argos (2011) lists their accuracy as <150,

11
150–350, and 350–1000 m, respectively. Hays et al. (2001) determined the least
accuracy in LC 0 (>1000m), so we omitted fixes in this LC. Likewise, we omitted
LCs A, B, and Z because no measure of accuracy is provided (Argos 2011). Location
data from GPS and Argos fixes were uploaded every 3rd
day to the Argos satellite
tracking system (CLS America, Inc., Largo, MD). We tracked marked black ducks
until they died or we lost contact with the PTT. We considered a female dead when it
remained at the same location for more than two consecutive duty cycles
simultaneously with on-board activity and temperature sensors having indicated no
movement of the PTT and an irregular drop in temperature during that period,
respectively (Krementz et al. 2011).
Data Analyses
We characterized terminal positions (i.e., inferred nesting and wintering areas)
as movement ≤0.5 degrees latitude or longitude (Afton 2008) for ≥30 days at known
areas during those respective periods (Miller et al. 2005b; Krementz et al. 2011). We
defined each migratory move as a flight >0.5 degrees latitude or longitude and each
stopover as a clustered location (>1 fix) varying ≤0.5 degrees (Afton 2008). We also
defined arrival as the first fix at a clustered location and departure as the last fix at the
same location (Miller et al. 2005a; Haukos et al. 2006). When data gaps >1 day but
<10 days existed, and an individual bird made a migratory move during that time, we
redefined departure as the median date and time between the last known fix at the
previous clustered location and the first known fix at the next clustered location; we
12
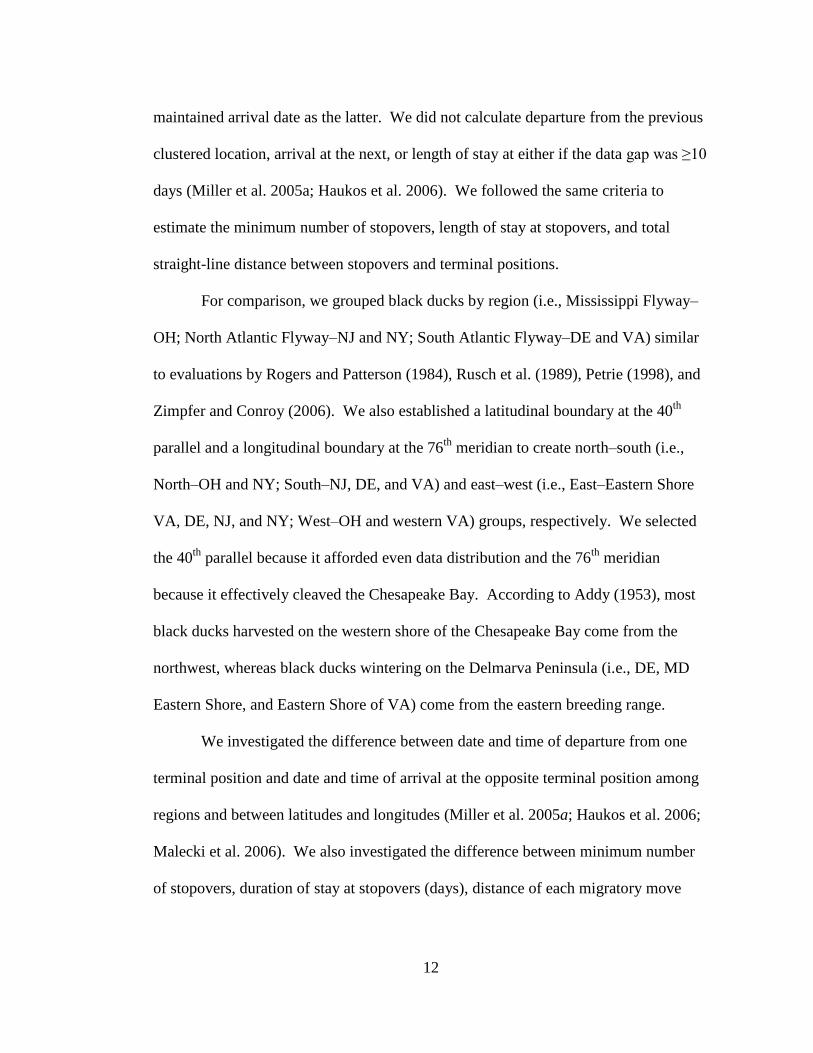
maintained arrival date as the latter. We did not calculate departure from the previous
clustered location, arrival at the next, or length of stay at either if the data gap was ≥10
days (Miller et al. 2005a; Haukos et al. 2006). We followed the same criteria to
estimate the minimum number of stopovers, length of stay at stopovers, and total
straight-line distance between stopovers and terminal positions.
For comparison, we grouped black ducks by region (i.e., Mississippi Flyway–
OH; North Atlantic Flyway–NJ and NY; South Atlantic Flyway–DE and VA) similar
to evaluations by Rogers and Patterson (1984), Rusch et al. (1989), Petrie (1998), and
Zimpfer and Conroy (2006). We also established a latitudinal boundary at the 40th
parallel and a longitudinal boundary at the 76th
meridian to create north–south (i.e.,
North–OH and NY; South–NJ, DE, and VA) and east–west (i.e., East–Eastern Shore
VA, DE, NJ, and NY; West–OH and western VA) groups, respectively. We selected
the 40th
parallel because it afforded even data distribution and the 76th
meridian
because it effectively cleaved the Chesapeake Bay. According to Addy (1953), most
black ducks harvested on the western shore of the Chesapeake Bay come from the
northwest, whereas black ducks wintering on the Delmarva Peninsula (i.e., DE, MD
Eastern Shore, and Eastern Shore of VA) come from the eastern breeding range.
We investigated the difference between date and time of departure from one
terminal position and date and time of arrival at the opposite terminal position among
regions and between latitudes and longitudes (Miller et al. 2005a; Haukos et al. 2006;
Malecki et al. 2006). We also investigated the difference between minimum number
of stopovers, duration of stay at stopovers (days), distance of each migratory move
13
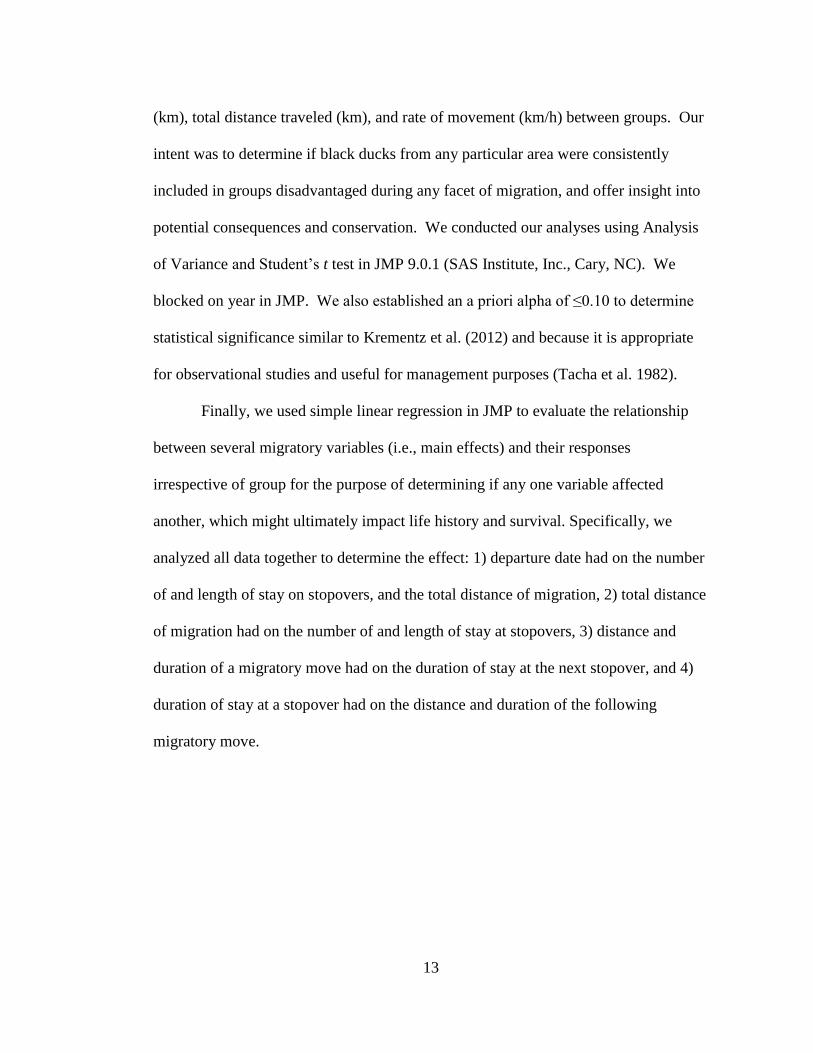
(km), total distance traveled (km), and rate of movement (km/h) between groups. Our
intent was to determine if black ducks from any particular area were consistently
included in groups disadvantaged during any facet of migration, and offer insight into
potential consequences and conservation. We conducted our analyses using Analysis
of Variance and Student’s t test in JMP 9.0.1 (SAS Institute, Inc., Cary, NC). We
blocked on year in JMP. We also established an a priori alpha of ≤0.10 to determine
statistical significance similar to Krementz et al. (2012) and because it is appropriate
for observational studies and useful for management purposes (Tacha et al. 1982).
Finally, we used simple linear regression in JMP to evaluate the relationship
between several migratory variables (i.e., main effects) and their responses
irrespective of group for the purpose of determining if any one variable affected
another, which might ultimately impact life history and survival. Specifically, we
analyzed all data together to determine the effect: 1) departure date had on the number
of and length of stay on stopovers, and the total distance of migration, 2) total distance
of migration had on the number of and length of stay at stopovers, 3) distance and
duration of a migratory move had on the duration of stay at the next stopover, and 4)
duration of stay at a stopover had on the distance and duration of the following
migratory move.
14
Chapter 4
RESULTS
We affixed PTTs to 29 black ducks during winter 2007–2008 (NJ, n = 10; OH,
n = 9; VA, n = 10) and another 39 black ducks during winter 2008–2009 (NJ, n = 10;
OH, n = 11; VA, n = 10; DE, n = 5; NY, n = 3). Of the 29 PTTs deployed in winter
2007–2008, 12 provided a full data set during spring migration 2008 (NJ, n = 1; OH, n
= 6; VA, n = 5). Two of the 2008 PTTs continued transmitting during winter 2008–
2009 and provided another full data set during spring migration 2009. Additionally,
17 of the 39 PTTs deployed during winter 2008–2009 provided a full data set during
spring migration 2009 (NJ, n = 1; OH, n = 5; VA, n = 4; DE, n = 5; NY, n = 2). Still
another PTT provided partial data during spring migration 2009, which we included in
our analyses where appropriate.
Black ducks departed wintering areas March 18–June 7 ( x = April 17) and
averaged 3.35 stopovers (SE = 0.3 stopovers; range 1–5 stopovers) and 6.44 d at
stopovers (SE = 0.8 d; range 0.54–12.2 d) during spring migrations 2008 and 2009
combined (Table 1). Departure date and duration of stay on stopovers did not vary by
region, latitude, or longitude (Tables 2–4). However, South Atlantic Flyway black
ducks took nearly twice as many stopovers as Mississippi and North Atlantic Flyway
black ducks (Table 2), as did black ducks south of the 40th
parallel (Table 3). During

15
spring migrations both years, black ducks migrated 1,126.1 km (SE = 89.5 km; range
270–1,396 km) before they arrived at inferred nesting areas April 16–June 28 ( x =
May 9). The average distance of each migratory move did not vary by region,
latitude, or longitude (Tables 2–4), although black ducks south of the 40th
parallel
migrated almost 10 km/h faster during each migratory move than northern black ducks
(Table 3). In total, South Atlantic Flyway black ducks migrated almost twice as far as
those from the Mississippi and North Atlantic Flyways (Table 2), black ducks south of
the 40th
parallel migrated more than 50% farther than those to the north (Table 3), and
black ducks east of the 76th
meridian migrated nearly 25% farther than those to the
west (Table 4). Likewise, black ducks from the South and North Atlantic Flyways
arrived at inferred nesting areas approximately 2 and 4 weeks after those from the
Mississippi Flyway, respectively (Table 2). Black ducks south of the 40th
parallel
arrived at inferred nesting areas 2 weeks after those to the north (Table 3), and black
ducks east of the 76th
meridian arrived at inferred nesting areas 3 weeks after those to
the west (Table 4).
16
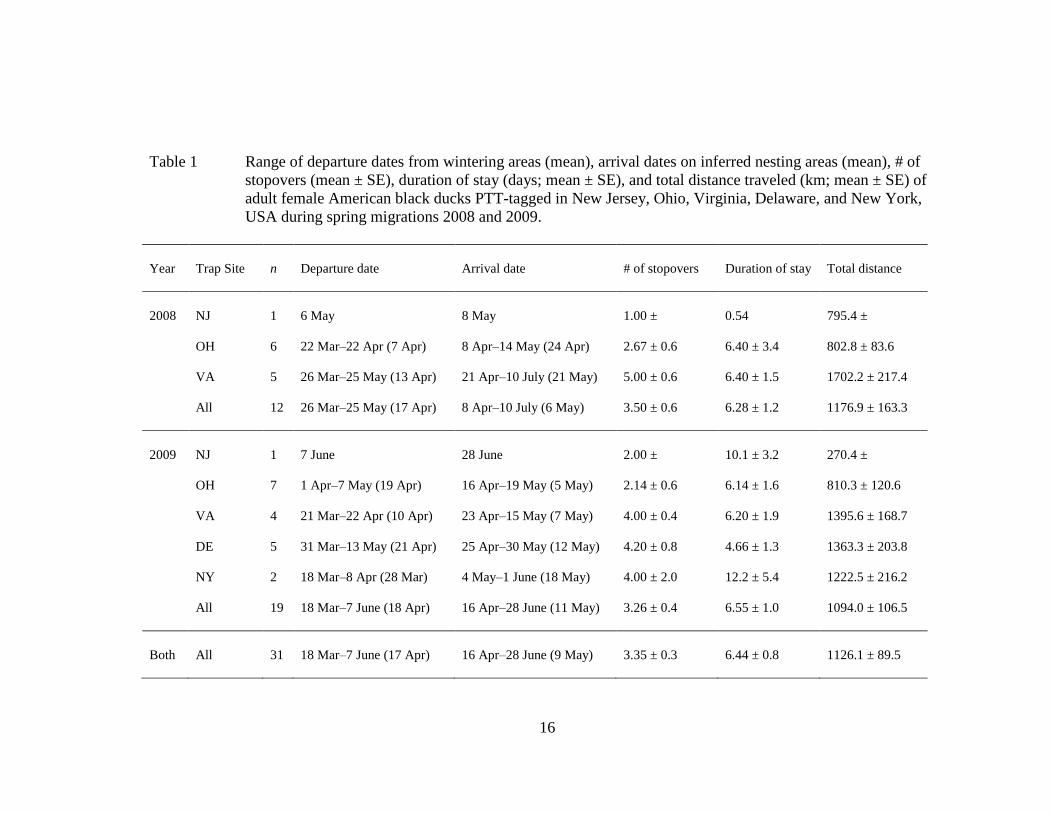
Table 1 Range of departure dates from wintering areas (mean), arrival dates on inferred nesting areas (mean), # of
stopovers (mean ± SE), duration of stay (days; mean ± SE), and total distance traveled (km; mean ± SE) of
adult female American black ducks PTT-tagged in New Jersey, Ohio, Virginia, Delaware, and New York,
USA during spring migrations 2008 and 2009.
Year Trap Site n Departure date Arrival date # of stopovers Duration of stay Total distance
2008 NJ 1 6 May 8 May 1.00 ± 0.54 795.4 ±
OH 6 22 Mar–22 Apr (7 Apr) 8 Apr–14 May (24 Apr) 2.67 ± 0.6 6.40 ± 3.4 802.8 ± 83.6
VA 5 26 Mar–25 May (13 Apr) 21 Apr–10 July (21 May) 5.00 ± 0.6 6.40 ± 1.5 1702.2 ± 217.4
All 12 26 Mar–25 May (17 Apr) 8 Apr–10 July (6 May) 3.50 ± 0.6 6.28 ± 1.2 1176.9 ± 163.3
2009 NJ 1 7 June 28 June 2.00 ± 10.1 ± 3.2 270.4 ±
OH 7 1 Apr–7 May (19 Apr) 16 Apr–19 May (5 May) 2.14 ± 0.6 6.14 ± 1.6 810.3 ± 120.6
VA 4 21 Mar–22 Apr (10 Apr) 23 Apr–15 May (7 May) 4.00 ± 0.4 6.20 ± 1.9 1395.6 ± 168.7
DE 5 31 Mar–13 May (21 Apr) 25 Apr–30 May (12 May) 4.20 ± 0.8 4.66 ± 1.3 1363.3 ± 203.8
NY 2 18 Mar–8 Apr (28 Mar) 4 May–1 June (18 May) 4.00 ± 2.0 12.2 ± 5.4 1222.5 ± 216.2
All 19 18 Mar–7 June (18 Apr) 16 Apr–28 June (11 May) 3.26 ± 0.4 6.55 ± 1.0 1094.0 ± 106.5
Both All 31 18 Mar–7 June (17 Apr) 16 Apr–28 June (9 May) 3.35 ± 0.3 6.44 ± 0.8 1126.1 ± 89.5
17
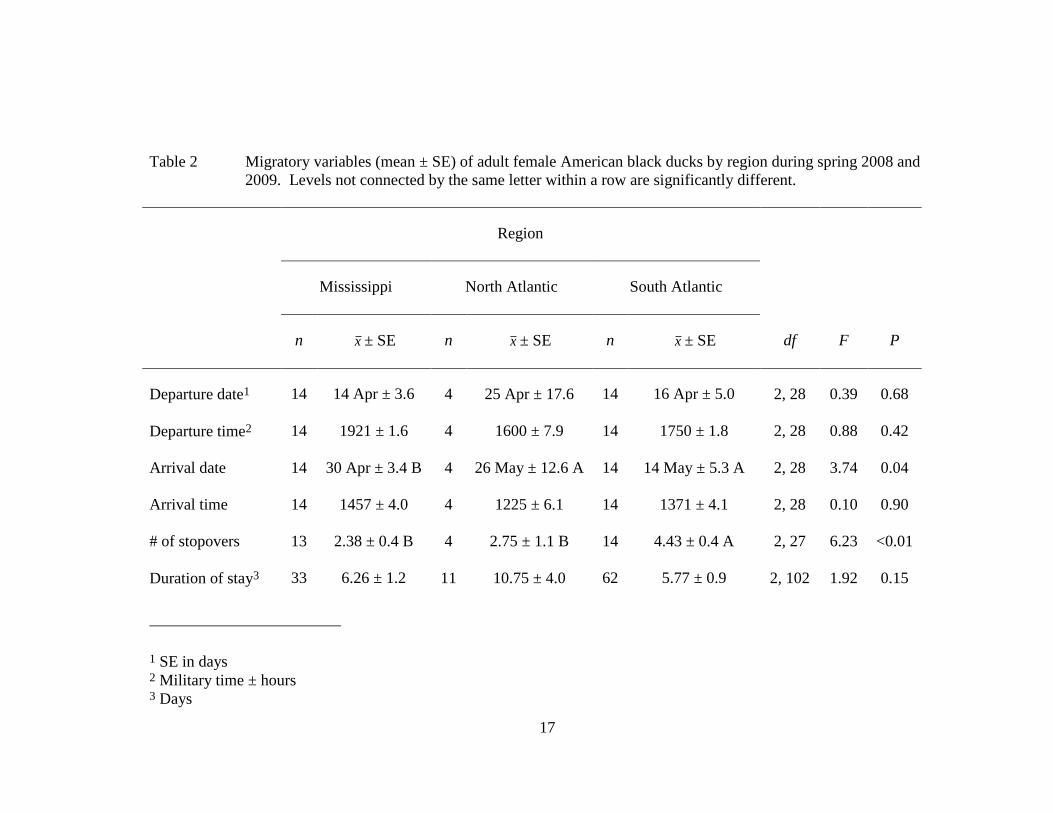
Table 2 Migratory variables (mean ± SE) of adult female American black ducks by region during spring 2008 and
2009. Levels not connected by the same letter within a row are significantly different.
Region
Mississippi North Atlantic South Atlantic
n x ± SE n x ± SE n x ± SE df F P
Departure date1 14 14 Apr ± 3.6 4 25 Apr ± 17.6 14 16 Apr ± 5.0 2, 28 0.39 0.68
Departure time2 14 1921 ± 1.6 4 1600 ± 7.9 14 1750 ± 1.8 2, 28 0.88 0.42
Arrival date
14 30 Apr ± 3.4 B 4 26 May ± 12.6 A 14 14 May ± 5.3 A 2, 28 3.74 0.04
Arrival time
14 1457 ± 4.0 4 1225 ± 6.1 14 1371 ± 4.1 2, 28 0.10 0.90
# of stopovers 13 2.38 ± 0.4 B 4 2.75 ± 1.1 B 14 4.43 ± 0.4 A 2, 27 6.23 <0.01
Duration of stay3 33 6.26 ± 1.2 11 10.75 ± 4.0 62 5.77 ± 0.9 2, 102 1.92 0.15
1 SE in days 2 Military time ± hours 3 Days
18
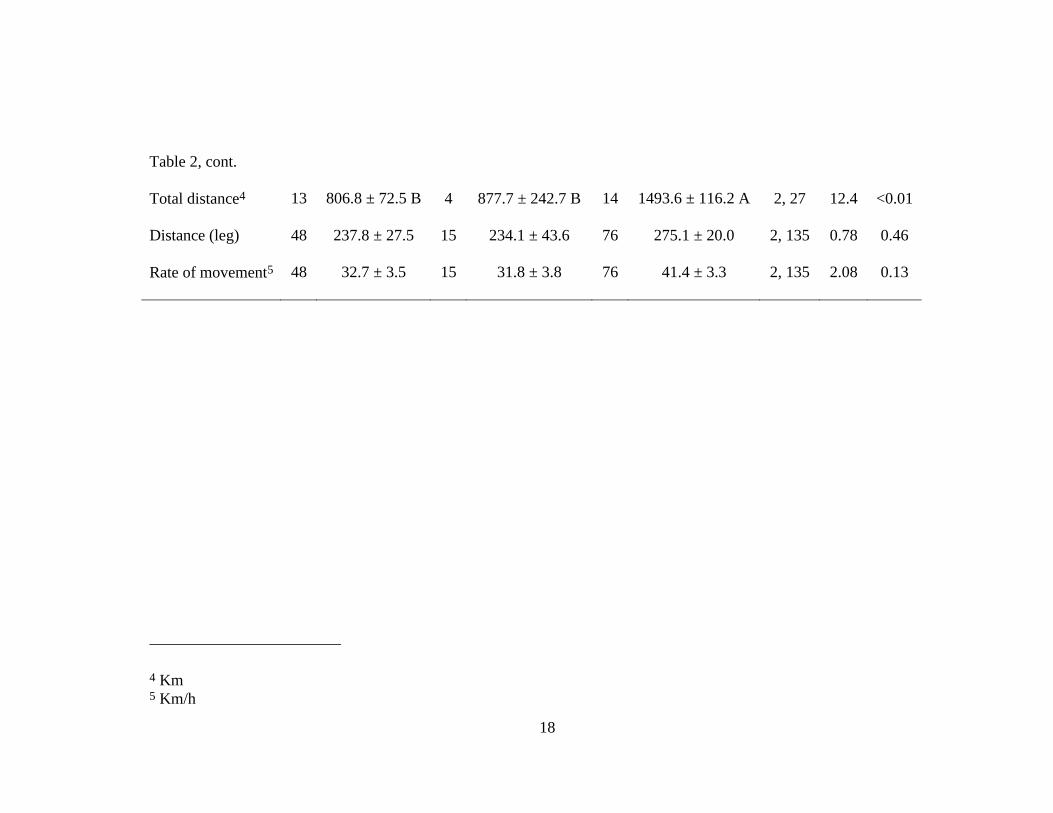
Table 2, cont.
Total distance4 13 806.8 ± 72.5 B 4 877.7 ± 242.7 B 14 1493.6 ± 116.2 A 2, 27 12.4 <0.01
Distance (leg)
48 237.8 ± 27.5 15 234.1 ± 43.6 76 275.1 ± 20.0 2, 135 0.78 0.46
Rate of movement5 48 32.7 ± 3.5 15 31.8 ± 3.8 76 41.4 ± 3.3 2, 135 2.08 0.13
4 Km 5 Km/h

19
Table 3 Migratory variables (mean ± SE) of adult female American black ducks by latitude during spring 2008 and
2009. Levels not connected by the same letter within a row are significantly different.
Latitude
North South
n x ± SE n x ± SE df F P
Departure date1 16 12 Apr ± 3.6 16 21 Apr ± 5.5 1, 29 1.75 0.20
Departure time2 16 1806.3 ± 2.3 16 1806.3 ± 1.7 1, 29 0.00 1.00
Arrival date
16 2 May ± 3.5 B 16 17 May ± 5.4 A 1, 29 4.60 0.04
Arrival time
16 1444.8 ± 3.8 16 1337.5 ± 3.6 1, 29 0.11 0.74
# of stopovers 15 2.6 ± 0.4 B 16 4.1 ± 0.4 A 1, 28 5.85 0.02
Duration of stay3 41 7.41 ± 1.4 65 5.82 ± 0.9 1, 103 1.02 0.32
1 SE in days 2 Military hours ± hours 3 Days

20
Table 3, cont.
Total distance4 15 862.3 ± 76.0 B 16 1373.5 ± 132.5 A 1, 28 10.7 <0.01
Distance (leg)
58 239.0 ± 24.5 81 271.3 ± 19.3 1, 136 1.09 0.30
Rate of movement5 58 31.7 ± 3.0 B 81 41.5 ± 3.1 A 1, 136 4.99 0.03
4 Km 5 Km/h
21
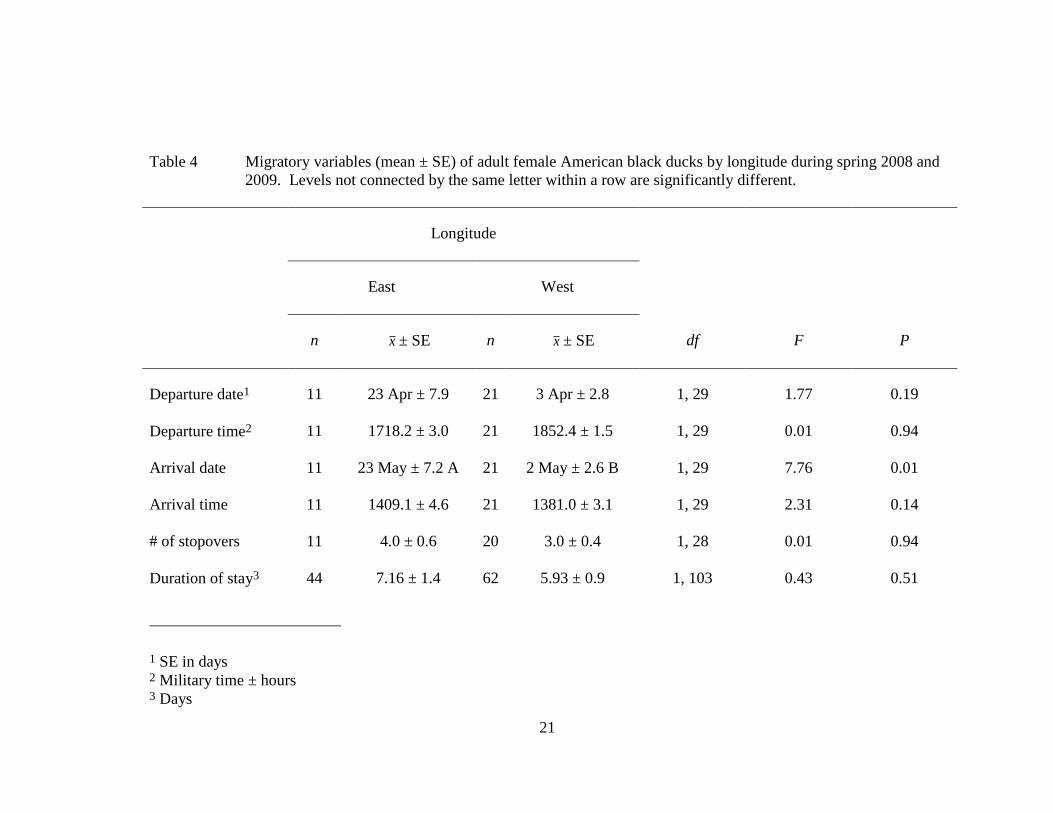
Table 4 Migratory variables (mean ± SE) of adult female American black ducks by longitude during spring 2008 and
2009. Levels not connected by the same letter within a row are significantly different.
Longitude
East West
n x ± SE n x ± SE df F P
Departure date1 11 23 Apr ± 7.9 21 3 Apr ± 2.8 1, 29 1.77 0.19
Departure time2 11 1718.2 ± 3.0 21 1852.4 ± 1.5 1, 29 0.01 0.94
Arrival date
11 23 May ± 7.2 A 21 2 May ± 2.6 B 1, 29 7.76 0.01
Arrival time
11 1409.1 ± 4.6 21 1381.0 ± 3.1 1, 29 2.31 0.14
# of stopovers 11 4.0 ± 0.6 20 3.0 ± 0.4 1, 28 0.01 0.94
Duration of stay3 44 7.16 ± 1.4 62 5.93 ± 0.9 1, 103 0.43 0.51
1 SE in days 2 Military time ± hours 3 Days

22
Table 4, cont.
Total distance4 11 1284.4 ± 165.0 A 20 1039.1 ± 102.9 B 1, 28 3.68 0.07
Distance (leg)
55 256.9 ± 22.5 84 258.4 ± 20.5 1, 136 <0.01 0.96
Rate of movement5 55 39.7 ± 4.0 84 35.9 ± 2.6 1, 136 0.98 0.32
4 Km 5 Km/h
23
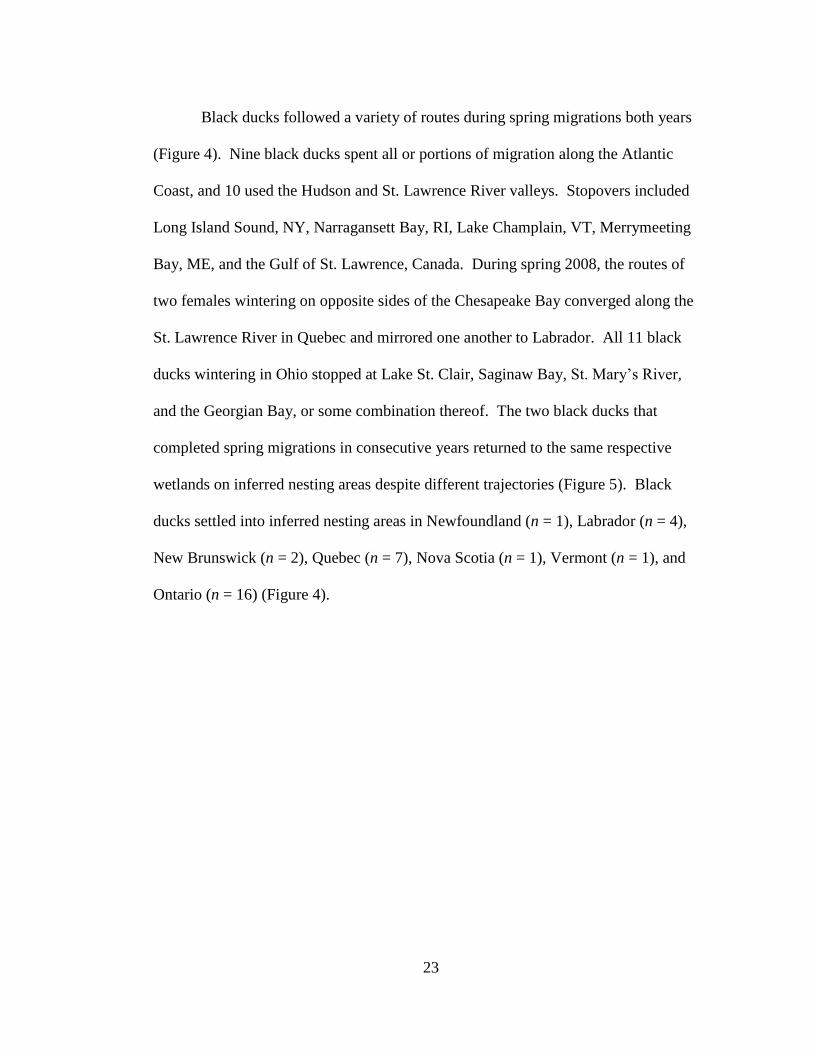
Black ducks followed a variety of routes during spring migrations both years
(Figure 4). Nine black ducks spent all or portions of migration along the Atlantic
Coast, and 10 used the Hudson and St. Lawrence River valleys. Stopovers included
Long Island Sound, NY, Narragansett Bay, RI, Lake Champlain, VT, Merrymeeting
Bay, ME, and the Gulf of St. Lawrence, Canada. During spring 2008, the routes of
two females wintering on opposite sides of the Chesapeake Bay converged along the
St. Lawrence River in Quebec and mirrored one another to Labrador. All 11 black
ducks wintering in Ohio stopped at Lake St. Clair, Saginaw Bay, St. Mary’s River,
and the Georgian Bay, or some combination thereof. The two black ducks that
completed spring migrations in consecutive years returned to the same respective
wetlands on inferred nesting areas despite different trajectories (Figure 5). Black
ducks settled into inferred nesting areas in Newfoundland (n = 1), Labrador (n = 4),
New Brunswick (n = 2), Quebec (n = 7), Nova Scotia (n = 1), Vermont (n = 1), and
Ontario (n = 16) (Figure 4).
24
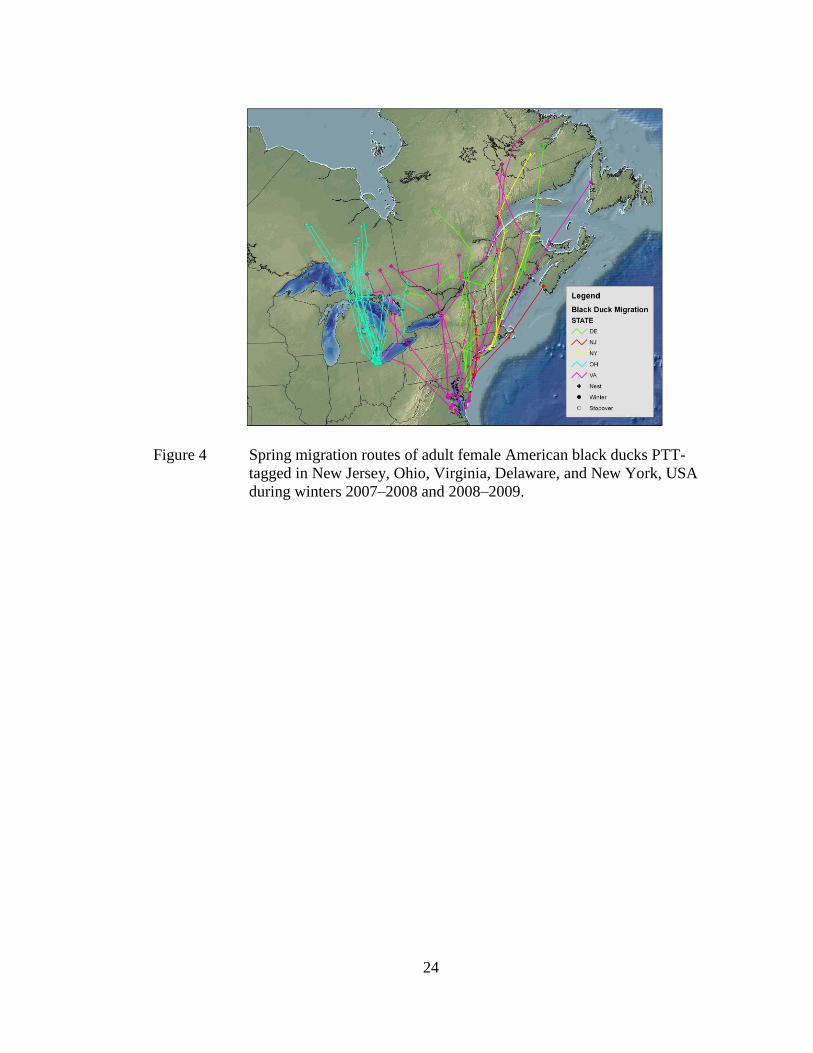
Figure 4 Spring migration routes of adult female American black ducks PTT-
tagged in New Jersey, Ohio, Virginia, Delaware, and New York, USA
during winters 2007–2008 and 2008–2009.
25
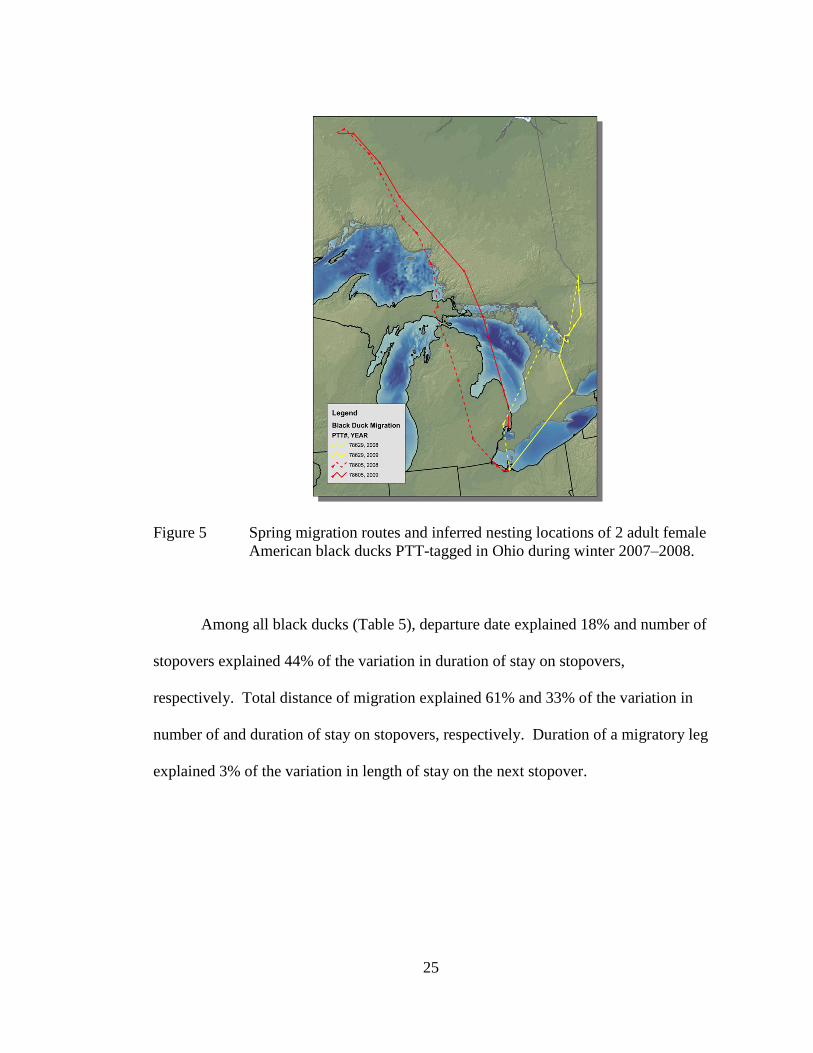
Figure 5 Spring migration routes and inferred nesting locations of 2 adult female
American black ducks PTT-tagged in Ohio during winter 2007–2008.
Among all black ducks (Table 5), departure date explained 18% and number of
stopovers explained 44% of the variation in duration of stay on stopovers,
respectively. Total distance of migration explained 61% and 33% of the variation in
number of and duration of stay on stopovers, respectively. Duration of a migratory leg
explained 3% of the variation in length of stay on the next stopover.

26
Table 5 Relationships between migratory variables of adult female American black ducks in eastern North America
during spring 2008 and 2009.
Independent Variable Dependent Variable df F P R2 β
Departure date
Departure date
Departure date
# of stopovers
Duration of stay on stopovers (hrs)
Distance of migration (total; km)
1, 29
1, 29
1, 29
2.21
6.15
1.30
0.15
0.02
0.26
0.07
0.18
0.04
-0.03
-8.50
-5.44
# of stopovers Duration of stay on stopovers (hrs) 1, 29 23.2 <0.01 0.44 142.7
Distance of migration (total; km)
Distance of migration (total; km)
# of stopovers
Duration of stay on stopovers (hrs)
1, 29
1, 29
45.6
14.4
<0.01
<0.01
0.61
0.33
0.003
0.45
Distance of migration (leg; km)
Duration of migration (leg; hrs)
Duration of stay on next stopover (hrs)
Duration of stay on next stopover (hrs)
1, 104
1, 104
0.02
2.87
0.90
0.09
<0.01
0.03
-0.01
5.06
Duration of stay on stopover (hrs)
Duration of stay on stopovers (hrs)
Distance of next migration (leg; km)
Duration of next migration (leg; hrs)
1, 104
1, 104
0.63
0.04
0.43
0.84
<0.01
<0.01
0.06
-0.001
27
A total of 13 PTTs (Ohio, n = 6; Virginia, n = 3; Delaware, n = 2; New York, n
= 2) provided at least partial data during autumn migrations in either 2008 or 2009.
Of those, four ceased transmitting, four were lost due to hunter harvest, and five
provided a full data set (Ohio, n = 2; Delaware, n = 2; New York, n = 1). Black ducks
departed inferred nesting or molting areas October 5–December 1 ( x = 24 October),
averaged 2.0 stopovers (SE = 0.3 stopovers; range 1–4 stopovers) and 12.6 days at
stopovers (SE = 3.5 d; range 0.25–41 d), migrated 993 km (SE = 202.9 km; range
277–1,485 km), and arrived at wintering areas November 18–December 18 ( x =
December 1) (Table 6). Only eight black ducks returned to wintering areas, of which
four returned to the same location they were captured the previous winter (Prime Hook
NWR, n = 2; Ottawa NWR, n = 1; Castalia, OH, n = 1). With few exceptions, black
ducks that completed either full or partial autumn migrations followed different routes
than their respective spring trajectories.

28
Table 6 Range of departure dates from inferred nesting areas (mean), arrival dates at wintering areas (mean), # of
stopovers (mean ± SE), duration of stay on stopovers (d; mean ± SE), and total distance traveled (km; mean
± SE) of adult female American black ducks PTT-tagged in New Jersey, Ohio, Virginia, Delaware, and New
York, USA during autumn migrations 2008 and 2009.
Inferred nesting area n Departure date Arrival date # of stopovers Duration of stay Total distance
Ontario 7 5 Oct – 3 Nov (24 Oct) 30 Nov – 11 Dec (5 Dec) 2.0 ± 0.0 13.1 ± 5.3 663.0 ± 386.0
Quebec 3 14 Oct – 4 Nov (26 Oct) 20 Nov – 18 Dec (4 Dec) 3.0 ± 1.0 9.24 ± 4.8 1200.9 ± 283.9
Labrador 2 5 Oct 18 Nov 1.0 ± 27.1 ± 14.0 1237.9 ±
New Brunswick 1 1 Dec 0.5 ±

29
Chapter 5
DISCUSSION
Black ducks in this study used well-known spring migration routes (Addy
1953; Bellrose 1980) and stopovers (Bookhout et al. 1989; Jorde et al. 1989; Belanger
and Lehoux 1994). Specifically, Atlantic Flyway black ducks followed the Atlantic
Coast and the Hudson and St. Lawrence River Valleys, and stopped at Long Island
Sound, NY, Narragansett Bay, RI, Lake Champlain, VT, Merrymeeting Bay, ME, and
the Gulf of St. Lawrence, Canada. In the Mississippi Flyway, black duck migration
centered on the Great Lakes, notably Saginaw Bay, MI, Georgian Bay, ON, and the
international Lake St. Clair and St. Mary’s River, similar to descriptions by Bellrose
(1980) and Jorde et al. (1989).
Our PTT-derived data corroborate band recoveries used to detect strong
associations between black ducks wintering in the Mississippi and South Atlantic
Flyways to breeding areas in western Quebec and Ontario (Zimpfer and Conroy 2006),
despite changes in land use and other environmental variables unfavorable to black
ducks in the latter (Rogers and Patterson 1984). All 14 Ohio black ducks stayed in the
Mississippi Flyway during spring migrations. Ohio black ducks were joined by four
more from the South Atlantic Flyway: two birds from western Virginia migrated
directly into the Great Lakes region before advancing into Ontario, and one bird each

30
from Delaware and western Virginia settled in Ontario after spending most of their
migrations in the Atlantic Flyway. Contrary to Addy (1953), western Virginia black
ducks displayed no apparent aversion to crossing the Chesapeake Bay; three of seven
crossed it at the onset of spring migrations and progressed into the eastern breeding
range. Excepting the single Delaware bird that settled in Ontario, all six black ducks
wintering on the Delmarva Peninsula proceeded into the eastern breeding range,
however.
Waterfowl migration may span several months each year, though migration
chronology varies by species (Arzel et al. 2006), season (Wege and Raveling 1983;
Petrie and Wilcox 2003), year (Wege and Raveling 1983; Murphy-Klassen et al.
2005), origin (Haukos et al. 2006), and destination (Miller et al. 2005a). Among black
ducks, spring migration is gradual, beginning in February and continuing through
April (Bellrose 1980; Arzel et al. 2006). We failed to detect a difference in the onset
of migration, as black ducks from different regions, latitudes, and longitudes departed
wintering areas at approximately the same time irrespective of year. Our data suggests
the severe weather experienced during winter 2007–2008 had no discernible effect on
departure date among black ducks when compared to the milder winter 2008–2009.
South Atlantic black ducks migrated farther, took more stopovers, spent a
greater amount of time on stopovers, and despite travelling faster, still arrived later at
inferred nesting areas. Their behavior is consistent with the increased energetic
demand of longer migrations (Arzel et al. 2006; Newton 2006) and has the potential to
adversely affect reproductive success (Heitmeyer and Fredrickson 1981; Kaminski and
31
Gluesing 1987; Raveling and Heitmeyer 1989; Devries et al. 2008). Hens in better
body condition upon reaching the breeding grounds have a greater propensity to breed
(Alisauskas and Ankney 1992), earlier onset of egg-laying (Dubovsky and Kaminski
1994), increased clutch size (Krapu 1981), and are better able re-nest if a nest is
destroyed (Arnold et al. 2002). Given that departure date was a non-factor in all
group-wise comparisons, the tardiness in arriving at inferred nesting areas among
South Atlantic Flyway black ducks was likely a result of the positive relationship
between total distance of migration and both number of and duration of stay on
stopovers. Regardless, Rohwer (1992) summarized an enormous volume of work
when he asserted that nesting chronology affects clutch size, recruitment, and survival,
and black ducks from their southern wintering and western breeding ranges have
experienced disproportionate declines (Rogers and Patterson 1984; Petrie 1998;
Zimpfer and Conroy 2006). While we do not have any direct evidence linking delayed
arrival at inferred nesting areas with population declines among South Atlantic Flyway
black ducks, the potential for causality warrants further consideration.
When developing its habitat goals, the UMRGLRJV assumed black ducks
settle in the region 45 d during spring migration, 90 d over winter, and 15 d during
autumn migration, for a total estimate of 150 d (Soulliere et al. 2007). In this study,
Ohio black ducks spent only 7.22 d (SE = 2.0 d; range 0.08–23.2 d) in the JV region
during spring migration, but multi-year data from two Ohio birds indicated they stay
approximately 144 d over winter. Although fall data was limited, if we define
duration of stay in the JV region as half the total duration of stay on fall stopovers

32
among black ducks that departed inferred nesting or molting areas in Ontario (Table
6), we derive a total estimate of 164 d spent in the JV region.
The UMRGLRJV established its black duck population goal as a product of
the NAWMP goal and the proportion of black ducks harvested in the JV region. The
JV population goal was multiplied by estimated duration of stay to arrive at duck use
days, which were then related to the daily energetic requirement of black ducks, total
energy required to achieve the JV population goal, and total energy available on the
landscape to arrive at the amount of habitat required to meet the JV population goal.
Soulliere et al. (2007) asserted black ducks almost exclusively use healthy, coastal
marshes and other large marsh and open water complexes >10 ha during all life cycle
stages in the JV region. Therefore, it is possible the UMRGLRJV underestimated the
annual habitat requirements for black ducks in the region by 5,036 ha, or nearly 10%,
during the 2 years of our study.
Transmitter weight, limited sample size (i.e., n < 30), and attachment
methodologies have the potential to bias results in satellite tracking studies of
migratory animals (Webster et al. 2002; Miller et al. 2005a; Lindbergh and Walker
2007; Barron et al. 2010). We affixed PTTs to 68 black ducks at wintering areas that
accounted for 67% of all black ducks counted during the 2008 midwinter waterfowl
survey (USFWS 2012). In the future, samples from New England, the southern
Mississippi Flyway, or elsewhere black ducks are concentrated during winter are
advised. Although our geographic distribution of marked black ducks did not equally
represent all wintering areas, we attempted to distribute our effort between latitudes
33
and longitudes as best as possible given cost and logistical considerations. We
therefore restrict inference to our sample of marked black ducks during the 2 years we
tracked them. However, we also compare our findings to available observational and
banding data on black duck migration chronology, suggest how they might inform
conservation and management of black ducks and their habitats, and provide
suggestions for future research to increase the temporal and spatial scope of
knowledge regarding black duck ecology.
To develop habitat conservation goals based on energetic carrying capacity
models, planners must estimate duration of stay at stopovers by migrating waterfowl.
Our data suggests the UMRGLRJV overestimated the habitat needs of black ducks in
the region during spring 2008 and 2009, and may have underestimated the total habitat
required during all seasons during the 2 years of our study. We suggest the
UMRGLRJV and others consider using satellite telemetry data with waterfowl counts
(Petrie et al. 2011) and food availability sampling (Brasher et al. 2007, Straub et al.
2012) when refining habitat goals used in waterfowl management strategies.
Additionally, black ducks in our study used previously described migration corridors
and stopovers, supporting the need for their continued conservation and management.
Because black ducks acquire resources at stopovers during spring migration, an
increased emphasis should be placed on protection and active management of key
wetland types along known routes with the aim of increasing the likelihood of
reproduction and survival while simultaneously helping achieve the NAWMP
population goal for black ducks.

34
REFERENCES
Addy CE. 1953. Fall migration of the black duck. United States Department of the
Interior, Fish and Wildlife Service. Special Scientific Report: Wildlife No. 19.
Afton AD. 2008. Chronology and rates of migratory movements, migration corridors,
and habitats used throughout the annual life cycle by female lesser scaup radio-
marked on Pool 19 of the Mississippi River. Progress Report submitted to the
Upper Mississippi River and Great Lakes Region Joint Venture, 10 November
2008. Available: http://www.ppjv.org/PPJV_presntations/Pool%2019%20
Progress%20Report%2011-10-2008.pdf (March 2009).
Alisauskas RT, Ankney CD. 1992. The cost of egg laying and its relationship to
nutrient reserves in waterfowl. Pages 30–61 in Batt BDJ, Afton AD, Anderson
MG, Ankney CD, Johnson DH, Kadlec JA, Krapu GL, editors. Ecology and
management of breeding waterfowl. Minneapolis, Minnesota: University of
Minnesota Press.
Argos. 2011. Argos user’s manual. Service Argos, Inc., Landover, Maryland.
Available: http://www.argos-system.org/files/pmedia/public/r363_9_argos_
manual_en.pdf. (March 2009).
Arnold TW, Howerter DW, Devries JH, Joynt BL, Emery RB, Anderson MG. 2002.
Continuous laying and clutch-size limitation in mallards. Auk 119:261–266.
35
Arzel C, Elmberg J, Guillemain M. 2006. Ecology of spring-migrating Anatidae: a
review. Journal of Ornithology 147:167–184.
Ashley EP, North NR, Petrie SA, Bailey RC. 2006. Age determination of American
black ducks in winter and spring. Wildlife Society Bulletin 34:1401–1410.
Barron DG, Brawn JD, Weatherhead PJ. 2010. Meta-analysis of transmitter effects on
avian behavior and ecology. Methods in Ecology and Evolution 1:180–187.
Belanger L, Lehoux D. 1994. Use of a tidal saltmarsh and coastal impoundments by
sympatric breeding and staging American black ducks, Anas rubripes, and
mallards, A. platyrynchos. Canadian Field Naturalist 108:311–317.
Bellrose FC. 1968. Waterfowl migration corridors east of the Rocky Mountains in the
United States. Illinois Natural History Survey Biological Notes 61.
Bellrose FC. 1980. Ducks, Geese, and Swans of North America. 3rd edition.
Mechanicsburg, Pennsylvania: Stackpole.
[BDJV] Black Duck Joint Venture. 2008. Black Duck Joint Venture Strategic Plan
2008–2013. U.S. Fish and Wildlife Service, Hadley, Massachusetts.
Available: http://www.blackduckjv.org/docs/BDJV%20Strategic%20Plan%20
2008_2013.pdf (December 2012).
Bookhout TA, Bednarick KE, Kroll RW. 1989. The Great Lakes marshes. Pages 131–
156 in Smith LM, Pederson RL, Kaminski RM, editors. Habitat management
for migrating and wintering waterfowl in North America. Lubbock, Texas:
Texas Tech University Press.
36
Bowman TD, Brown PW. 1992. Site fidelity of male black ducks to a molting area in
Labrador. Journal of Field Ornithology 63:32–34.
Brasher MG, Steckel JD, Gates RJ. 2007. Energetic carrying capacity of actively and
passively managed wetlands for migration ducks in Ohio. Journal of Wildlife
Management 71:2532–2541.
Britten MW, Kennedy PL, Ambrose S. 1999. Performance and accuracy evaluation of
small satellite transmitters. Journal of Wildlife Management 63:1349–1358.
Chaulk KG, Turner B. 2007. The timing of waterfowl arrival and dispersion during
spring migration in Labrador. Northeastern Naturalist 14:375–386.
Conroy MJ, Miller MW, Hines JE. 2002. Identification and synthetic modeling of
factors affecting American black duck populations. Wildlife Monographs
150:1–64.
Coulter MW. 1955. Spring food habits of surface-feeding ducks in Maine. Journal of
Wildlife Management 19:263–267.
Cox RR Jr., Afton AD. 1998. Effects of capture and handling on survival of female
northern pintails. Journal of Field Ornithology 69:276–287.
Cramer DM, Castelli PM, Yerkes T, Williams CK. 2012. Food resource availability
for American black ducks wintering in southern New Jersey. Journal of
Wildlife Management 76:214–219.
Devries JH, Brook RW, Howerter DW, Anderson MG. 2008. Effects of spring body
condition and age on reproduction in mallards (Anas platyrhynchos). Auk
125:618–628.
37
Dubovsky JA, Kaminski RM. 1994. Potential reproductive consequences of winter-
diet restriction in mallards. Journal of Wildlife Management 58:780–786.
Ely CR, Douglas DC, Fowler AC, Babcock CA, Derksen DV, Takekawa JY. 1997.
Migration behavior of tundra swans from the Yukon-Kuskokwim Delta,
Alaska. Wilson Bulletin 109:679–692.
Gaunt AS, Oring LW, Able KP, Anderson DW, Baptista LF, Barlow JC, Wingfield
JC, editors. 2010. Guidelines to the use of wild birds in research. The
Ornithological Council, Washington, D.C. Available:
http://www.nmnh.si.edu/BIRDNET/documents/guidlines/Guidelines_August
2010.pdf (December 2012).
Haukos DA, Miller MR, Orthmeyer DL, Takekawa JY, Fleskes JP, Casazza ML,
Perry WM, Moon JA. 2006. Spring migration of northern pintails from Texas
and New Mexico, USA. Waterbirds 29:127–136.
Hays GC, Akesson S, Godley BJ, Luschi P, Santidrian P. 2001. The implications of
location accuracy for the interpretation of satellite-tracking data. Animal
Behaviour 61:1034–1040.
Heitmeyer ME, Fredrickson LH. 1981. Do wetland conditions in the Mississippi Delta
hardwoods influence mallard recruitment? Transactions of the 46th
North
American Wildlife and Natural Resources Conference 46:44–57.
Hindman LJ, Stotts VD. 1989. Chesapeake Bay and North Carolina Sounds. Pages
27–55 in Smith LM, Pederson RL, Kaminski RM, editors. Habitat
38
management for migrating and wintering waterfowl in North America.
Lubbock, Texas: Texas Tech University Press.
Jorde DG, Longcore JR, Brown PW. 1989. Tidal and non-tidal wetlands of the
northern Atlantic states. Pages 1–26 in Smith LM, Pederson RL, Kaminski
RM, editors. Habitat management for migrating and wintering waterfowl in
North America. Lubbock, Texas: Texas Tech University Press.
Kaminski RM, Gluesing EA. 1987. Density and habitat related recruitment in
mallards. Journal of Wildlife Management 51:141–148.
Krapu GL. 1981. The role of nutrient reserves in mallard reproduction. Auk 98:29–38.
Krementz DG, Asante K, Naylor LW. 2011. Spring migration of mallards from
Arkansas as determined by satellite telemetry. Journal of Fish and Wildlife
Management 2:156–168.
Krementz DG, Asante K, Naylor LW. 2012. Autumn migration of Mississippi Flyway
mallards as determined by satellite telemetry. Journal of Fish and Wildlife
Management 3:238–251.
Lindberg MS, Walker J. 2007. Satellite telemetry in avian research and management:
sample size considerations. Journal of Wildlife Management 71:1002–1009.
Longcore JR, McAuley DG, Hepp GR, Rhymer JM. 2000. American black duck (Anas
rubripes) in Poole A, Gill F, Editors. The Birds of North America Online.
Cornell Lab of Ornithology. Available: http://bna.birds.cornell.edu/bna/
species/481 (October 2008).
39
Maisonneuve C, Belanger L, Bordage D, Jobin B, Grenier M, Beaulieu J, Gabor S,
Filion B. 2006. American black duck and mallard breeding distribution and
habitat relationships along a forest-agriculture gradient in southern Quebec.
Journal of Wildlife Management 70:450–459.
Malecki RA, Batt BDJ, Sheaffer SE. 2001. Spatial and temporal distribution of
Atlantic Population Canada geese. Journal of Wildlife Management 65:242–
247.
Malecki R, Sheaffer S, Howell D, Strange T. 2006. Northern pintails in eastern North
America: their seasonal distribution, movement patterns, and habitat
affiliations. Final Report submitted to the Atlantic Flyway Council 31 July
2006. Available:
http://www.ncwildlife.org/Portals/0/Hunting/Documents/northern_pintail_final
_report.pdf (March 2009).
McAuley DG, Clugston DA, Longcore JR. 2004. Dynamic use of wetlands by black
ducks and mallards: evidence against competitive exclusion. Wildlife Society
Bulletin 32:465–473.
Merendino MT, Ankney CD. 1994. Habitat use by mallards and American black ducks
breeding in Central Ontario. Condor 96:411–421.
Miller MR, Takekawa JY, Fleskes JP, Orthmeyer DL, Casazza ML, Perry WM.
2005a. Spring migration of northern pintails from California’s Central Valley
wintering area tracked with satellite telemetry: routes, timing, and destinations.
Canadian Journal of Zoology 83:1314–1332.
40
Miller MR, Takekawa JY, Fleskes JP, Orthmeyer DL, Casazza ML, Haukos DA,
Perry WM. 2005b. Flight speeds of northern pintails during migration
determined using satellite telemetry. Wilson Bulletin 117:364–374.
Morton JM, Fowler AC, Kirkpatrick RL. 1989. Time and energy budgets of American
black ducks in winter. Journal of Wildlife Management 53:401–410.
Murphy-Klassen HM, Underwood TJ, Sealy SG, Czyrnyj AA. 2005. Long-term trends
in spring arrival dates of migrant birds at Delta Marsh, Manitoba, in relation to
climate change. Auk 122:1130–1148.
[NOAA] National Oceanic and Atmospheric Administration. 2013. National Climatic
Data Center Climate at a Glance. Available: http://www.ncdc.noaa.gov/cag/
(March 2013).
Newton I. 2006. Can conditions experienced during migration limit the population
levels of birds? Journal of Ornithology 147:146–166.
[NAWMP] North American Waterfowl Management Plan. 1986. North American
waterfowl management plan: a strategy for cooperation. Available:
http://www.fws.gov/birdhabitat/NAWMP/files/NAWMP.pdf (March 2009).
Parker GR. 1991. Survival of juvenile American black ducks on a managed wetland in
New Brunswick. Journal of Wildlife Management 55:466–470.
Petrie MJ. 1998. The role of interspecific competition in the decline of the black duck.
Doctoral dissertation. Columbia: University of Missouri.
Petrie SA, Wilcox KL. 2003. Migration chronology of Eastern Population tundra
swans. Canadian Journal of Zoology 81:861–870.
41
Petrie MJ, Brasher MG, Soulliere GJ, Tirpak JM, Pool DB, Reker RR. 2011.
Guidelines for establishing joint venture waterfowl population abundance
objectives. North American Waterfowl Management Plan Science Support
Team Technical Report 3–10–2011. Available:
http://www.fws.gov/birdhabitat/NAWMP/NSST/files/GuidelinesforEstablishin
gJVPopulationObjectives.pdf (December 2012).
Plattner DM, Eichholz MW, Yerkes T. 2010. Food resources for wintering and spring
staging black ducks. Journal of Wildlife Management 74:1554–1558.
Raveling DG, Heitmeyer ME. 1989. Relationships of population size and recruitment
of pintails to habitat conditions and harvest. Journal of Wildlife Management
53:1088–1103.
Reed A. 1975. Reproductive output of black ducks in the St. Lawrence estuary.
Journal of Wildlife Management 39:243–255.
Rohwer FC. 1992. The evolution of reproductive patters in waterfowl. Pages 486–539
in Batt BDJ, Afton AD, Anderson MG, Ankney CD, Johnson DH, Kadlec JA,
Krapu GL, editors. Ecology and management of breeding waterfowl.
Minneapolis, Minnesota: University of Minnesota Press.
Rogers JP, Patterson JH. 1984. The black duck population and its management.
Transactions of the North American Wildlife and Natural Resources
Conference 49:527–534.
42
Rusch DH, Ankney CD, Boyd H, Longcore JR, Montalbano F III, Ringelman JK,
Stotts VD. 1989. Population ecology and harvest of the American black duck:
a review. Wildlife Society Bulletin 17:379–406.
Serie JR. 2002. The American black duck: a species of international concern. Pages 2–
7 in Perry MC, editor. Black ducks and their Chesapeake Bay habitats:
proceedings of a symposium. U.S. Geological Survey, Reston, Virginia.
Available: http://www.pwrc.usgs.gov/prodabs/perry/6039_perry_searchable
.pdf (March 2009).
Seymour NR. 1991. Philopatry in male and female American black ducks. Condor
93:189–191.
Sokal RR, Rohlf FJ. 1998. Biometry: the principles and practices of statistics in
biological research. 3rd edition. New York, New York: W.H. Freeman and
Company.
Soulliere GJ, Potter BA, Coluccy JM, Gatti RC, Roy CL, Luukkonen DR, Brown PW,
Eichholz MW. 2007. Upper Mississippi River and Great Lakes Region Joint
Venture Waterfowl Habitat Conservation Strategy. Fort Snelling, Minnesota:
U.S. Fish and Wildlife Service. Available: http://www.uppermissgreatlakesjv
.org/docs/UMRGLR_JV_WaterfowlHCS.pdf (March June 2009).
Straub JN, Gates RJ, Schultheis RD, Yerkes T, Coluccy JM, Stafford JD. 2012.
Wetland food resources for spring-migrating ducks in the Upper Mississippi
River and Great Lakes Region. Journal of Wildlife Management 76:768–777.
43
Tacha TC, Warde WD, Burnham EP. 1982. Use and interpretation of statistics in
wildlife journals. Wildlife Society Bulletin 10:355–362.
[USFWS] U. S. Fish and Wildlife Service. 2012. Migratory Bird Data Center. Mid-
Winter Waterfowl Survey. Available: http://mbdcapps.fws.gov/ (June 2012).
Webster MS, Marra PP, Haig SM, Bensch S, Holmes RT. 2002. Links between
worlds: unraveling migratory connectivity. Trends in Ecology and Evolution
17:76–83.
Wege ML, Raveling DG. 1983. Factors influencing the timing, distance, and path of
migrations of Canada geese. Wilson Bulletin 95:209–221.
Zimpfer NL, Conroy MJ. 2006. Modeling movement and fidelity of American black
ducks. Journal of Wildlife Management 70:1770–1777.