MidLincoln Research Real Estate Weekly · Weekly Overview Sep 16, 2015 MidLincoln Research Real...
10
Weekly Overview Sep 16, 2015 MidLincoln Research Real Estate Weekly Emerging Markets Sector Reports MidLincoln Real Estate Global Index basketname weekch monthch ytdch yearch ML Global Real Estate 2.42 9.38 10.70 Select Equity Indexes Yields name weekch monthch ytdch yearch Russian Trading System Cash Index 4.15 3.18 2.70 32.62 S&P 500 Index 1.66 6.62 5.14 1.00 Hong Kong Hang Seng Index 4.41 9.54 8.92 12.71 Ibovespa Brasil Sao Paulo Stock Exchange Index 1.69 0.48 5.45 16.23 S&P BSE SENSEX Index 3.63 7.03 5.99 0.25 Deutsche Boerse AG German Stock Index DAX 0.23 7.77 Select Bond Yields (Eurobonds) Ncountry Avg Sovereign Yield Avg Corporate Yield Venezuela 32.53 36.09 Ecuador 15.86 Ukraine 13.79 Zambia 11.30 Iraq 10.91 Ghana 10.47 Angola 9.54 Gabon 9.04 Mongolia 8.85 El Salvador 8.27 Argentina 7.97 9.05 C?te dIvoire 7.82 Kenya 7.67 Costa Rica 7.08 Pakistan 6.90 Jamaica 6.54 10.30 Kazakhstan 6.44 6.77 Brazil 6.34 8.77 Russia 6.22 6.84 Paraguay 6.17 Lebanon 6.16 Dominican Republic 6.10 Azerbaijan 5.96 Sri Lanka 5.94 5.79 Table of Contents: Real Estate Yields and News Real Estate Funds Fundflow Logistic Real Estate Yields Some facts about Moscow Warehouses Retail Real Estate Yields Some facts about Moscow Retail Office Real Estate Yields Chart of office yeilds Residential Real Estate Yields MidLincoln Global Real Estate Index Composition and Stats Top 10 Real Estate Picks with highest score Top 10 Real Estate Picks with lowest score Real Estate Flows, Yields and News Unusual Way to Earn High Yields in Real Estate A Novel Way to Earn High Yields in Real Estate Norfolk Mansion Heads For Auction After Failing to Sell Could Real Estate Actually Be a Haven For Jittery Stock Investors? Higher yields will bring property investors to Dubai: Deyaar CEO Real estate values rise as prime yields sharpen Top Yield REITs Post 18.20% Higher Return By 5 Highest Yield ... In a correction, real estate prices will not fall in all cities: Saurabh ... 3 REITs With Yields up to 8.9% to Buy Today Weekly Fund flow into Real Estate focused funds and REITS showed (Previous Week)329.3 USD mn of outflow. Top 10 Real Estate Focused Funds or REITS by Inflows Fund Name fund flow mn$ Total Assets mn$ NUVEEN REAL ESTATE INCOME FUND (JRS) 19.7 308.9 PRINCIPAL REAL ESTATE INCOME FUND (PGZ) 17.7 134.2 FIRST STATE INVESTMENTS ICVC GLOBAL PROPERTY SECURITIES A ACC EUR (FSGPSAE) 16.7 264.4 DELTA LLOYD L GLOBAL PROPERTY FUND IC (DELGPIC) 13.4 457.9 DELTA LLOYD L GLOBAL PROPERTY FUND B Top 10 Real Estate Focused Funds or REITS by Outflow Fund Name fund flow mn$ Total Assets mn$ PRUDENTIAL GLOBAL REAL ESTATE FUND C (PURCX) 119.4 3391.0 VIRTUS REAL ESTATE SECURITIES C (PHRCX) 59.3 1297.0 NUVEEN REAL ESTATE SECURITIES FUND C (FRLCX) 32.8 4487.0 ING GLOBAL REAL ESTATE FUND/UNITED STATES B (IGBAX) 29.2 4096.0 BNP PARIBAS INVESTMENT PARTNERS REAL ESTATE SECURITIES EUROPE N (PAREEPN) 24.7 641.0
Transcript of MidLincoln Research Real Estate Weekly · Weekly Overview Sep 16, 2015 MidLincoln Research Real...

WeeklyOverview
Sep 16, 2015
MidLincoln ResearchReal Estate WeeklyEmerging Markets Sector Reports
MidLincoln Real EstateGlobal Index
basketname weekch monthch ytdch yearchML GlobalReal Estate 2.42 9.38 10.70
Select Equity Indexes Yields
name weekch monthch ytdch yearchRussianTradingSystem CashIndex
4.15 3.18 2.70 32.62
S&P 500Index 1.66 6.62 5.14 1.00
Hong KongHang SengIndex
4.41 9.54 8.92 12.71
IbovespaBrasil SaoPaulo StockExchangeIndex
1.69 0.48 5.45 16.23
S&P BSESENSEXIndex
3.63 7.03 5.99 0.25
DeutscheBoerse AGGermanStock IndexDAX
0.23 7.77
Select Bond Yields(Eurobonds)
Ncountry Avg SovereignYield
Avg CorporateYield
Venezuela 32.53 36.09Ecuador 15.86Ukraine 13.79Zambia 11.30Iraq 10.91Ghana 10.47Angola 9.54Gabon 9.04Mongolia 8.85El Salvador 8.27Argentina 7.97 9.05C?te dIvoire 7.82Kenya 7.67Costa Rica 7.08Pakistan 6.90Jamaica 6.54 10.30Kazakhstan 6.44 6.77Brazil 6.34 8.77Russia 6.22 6.84Paraguay 6.17Lebanon 6.16DominicanRepublic
6.10
Azerbaijan 5.96Sri Lanka 5.94 5.79
Table of Contents:
Real Estate Yields and News
Real Estate Funds Fundflow
Logistic Real Estate Yields
Some facts about Moscow Warehouses
Retail Real Estate Yields
Some facts about Moscow Retail
Office Real Estate Yields
Chart of office yeilds
Residential Real Estate Yields
MidLincoln Global Real Estate Index Composition and Stats
Top 10 Real Estate Picks with highest scoreTop 10 Real Estate Picks with lowest score
Real Estate Flows, Yields and News
Unusual Way to Earn High Yields in Real EstateA Novel Way to Earn High Yields in Real EstateNorfolk Mansion Heads For Auction After Failing to SellCould Real Estate Actually Be a Haven For Jittery Stock Investors?Higher yields will bring property investors to Dubai: Deyaar CEOReal estate values rise as prime yields sharpenTop Yield REITs Post 18.20% Higher Return By 5 Highest Yield ...In a correction, real estate prices will not fall in all cities: Saurabh ...3 REITs With Yields up to 8.9% to Buy Today
Weekly Fund flow into Real Estate focused funds and REITS showed (Previous Week)329.3 USD mn of outflow.
Top 10 Real Estate Focused Funds or REITS byInflows
Fund Namefundflowmn$
TotalAssetsmn$
NUVEEN REAL ESTATE INCOME FUND (JRS) 19.7 308.9PRINCIPAL REAL ESTATE INCOME FUND (PGZ) 17.7 134.2FIRST STATE INVESTMENTS ICVC GLOBALPROPERTY SECURITIES A ACC EUR (FSGPSAE) 16.7 264.4
DELTA LLOYD L GLOBAL PROPERTY FUND IC(DELGPIC) 13.4 457.9
DELTA LLOYD L GLOBAL PROPERTY FUND B
Top 10 Real Estate Focused Funds or REITS byOutflow
Fund Namefundflowmn$
TotalAssetsmn$
PRUDENTIAL GLOBAL REAL ESTATE FUND C(PURCX) 119.4 3391.0
VIRTUS REAL ESTATE SECURITIES C (PHRCX) 59.3 1297.0NUVEEN REAL ESTATE SECURITIES FUND C(FRLCX) 32.8 4487.0
ING GLOBAL REAL ESTATE FUND/UNITED STATES B (IGBAX) 29.2 4096.0
BNP PARIBAS INVESTMENT PARTNERS REALESTATE SECURITIES EUROPE N (PAREEPN) 24.7 641.0
South Africa 5.58 7.06Egypt 5.55Vietnam 5.41Indonesia 5.34 6.14Turkey 5.25 5.11Uruguay 4.97Colombia 4.88 9.64Peru 4.82 4.36Malaysia 4.82 3.41Croatia 4.78Mexico 4.53 5.69Serbia 4.44Morocco 4.19 5.43Romania 4.13Panama 3.94Hungary 3.71
Chile 3.65 4.41China 3.56 4.98Philippines 3.32 3.47Lithuania 2.93Poland 2.90Latvia 2.61Slovak Republic 2.59Thailand 3.96Singapore 3.80Qatar 2.91Korea 2.49Israel 4.81India 4.47Hong Kong 3.64United ArabEmirates
3.07
Top 10 Winners In MidLincoln GlobalReal Estate Index Between 20150915and 20150908Name Weekch CountryUEM Sunrise Bhd(UEMS:MK)
27.84 Malaysia
Ruentex Development CoLtd (9945:TT)
12.64 Taiwan
Daelim Industrial Co Ltd(000210:KS) 9.36
Korea,Republic of(South)
PIK Group PJSC(PIKK:RM)
8.61 RussianFederation
BR Malls Participacoes SA(BRML3:BZ)
6.93 Brazil
SM Prime Holdings Inc(SMPH:PM)
5.96 Philippines
Growthpoint Properties Ltd(GRT:SJ)
5.95 SouthAfrica
Sumitomo Realty &Development Co Ltd(8830:JP)
5.83 Japan
Ayala Land Inc (ALI:PM) 5.49 PhilippinesMitsui Fudosan Co Ltd(8801:JP)
4.66 Japan
Top 10 Losers In Global Real EstateIndex Between 20150915 and 20150908Name Weekch Country
Etalon Group Ltd(ETLN:LI) 7.18
Guernsey,ChannelIslands
Evergrande Real EstateGroup Ltd (3333:HK) 5.40 China
Bumi Serpong Damai TbkPT (BSDE:IJ)
5.07 Indonesia
Crown Castle InternationalCorp (CCI:US)
4.86 United States
SOHO China Ltd(410:HK)
4.77 China
LSR Group PJSC(LSRG:LI)
4.00 RussianFederation
China Resources Land Ltd(1109:HK)
2.92 Hong Kong(SAR)
Klepierre (LI:FP) 2.14 France
Raven Russia Ltd(RUS:LN) 2.13
Guernsey,ChannelIslands
CAPITALISATION (DELGPBC) 13.4 457.9
DFA REAL ESTATE SECURITIES PORTFOLIO INSTITUTIONAL (DFREX) 10.0 5973.0
DWS RREEF GLOBAL REAL ESTATE SECURITIESFUND INSTITUTIONAL (RRGIX) 9.5 1285.0
LMP REAL ESTATE INCOME FUND INC (RIT) 9.3 142.4DFA INTERNATIONAL REAL ESTATE SECURITIESPORTFOLIO INSTITUTIONAL (DFITX) 6.8 3234.0
ING L INVEST GLOBAL REAL ESTATE (XUMS) 6.3 285.5
UBS CH INSTITUTIONAL FUND 3 REAL ESTATESECURITIES ASIA PACIFIC PASSIVE FUND IX(UBS3REX)
16.8 142.6
MANAGERS REAL ESTATE SECURITIES FUND(MRESX) 13.0 313.3
FORTIS MIX UMBRELLA FUND NV HIGH INCOMEPROPERTY FUND CLASSIC (AAHIP) 11.1 153.5
COLUMBIA FUNDS SERIES TRUST I COLUMBIAREAL ESTATE EQUITY FUND I (CREIX) 10.8 486.3
COLUMBIA FUNDS SERIES TRUST I COLUMBIAREAL ESTATE EQUITY FUND C (CRECX) 10.5 486.3
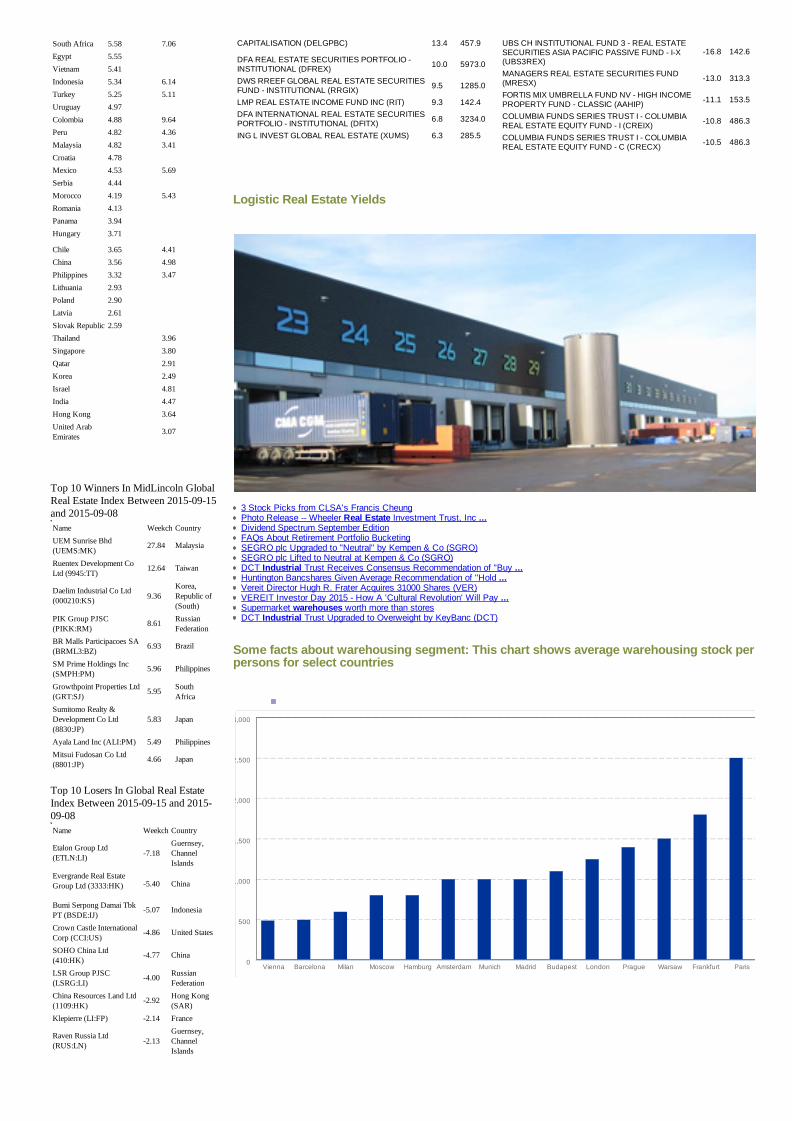
Logistic Real Estate Yields
3 Stock Picks from CLSA's Francis CheungPhoto Release Wheeler Real Estate Investment Trust, Inc ...Dividend Spectrum September EditionFAQs About Retirement Portfolio BucketingSEGRO plc Upgraded to "Neutral" by Kempen & Co (SGRO)SEGRO plc Lifted to Neutral at Kempen & Co (SGRO)DCT Industrial Trust Receives Consensus Recommendation of "Buy ...Huntington Bancshares Given Average Recommendation of "Hold ...Vereit Director Hugh R. Frater Acquires 31000 Shares (VER)VEREIT Investor Day 2015 How A 'Cultural Revolution' Will Pay ...Supermarket warehouses worth more than storesDCT Industrial Trust Upgraded to Overweight by KeyBanc (DCT)
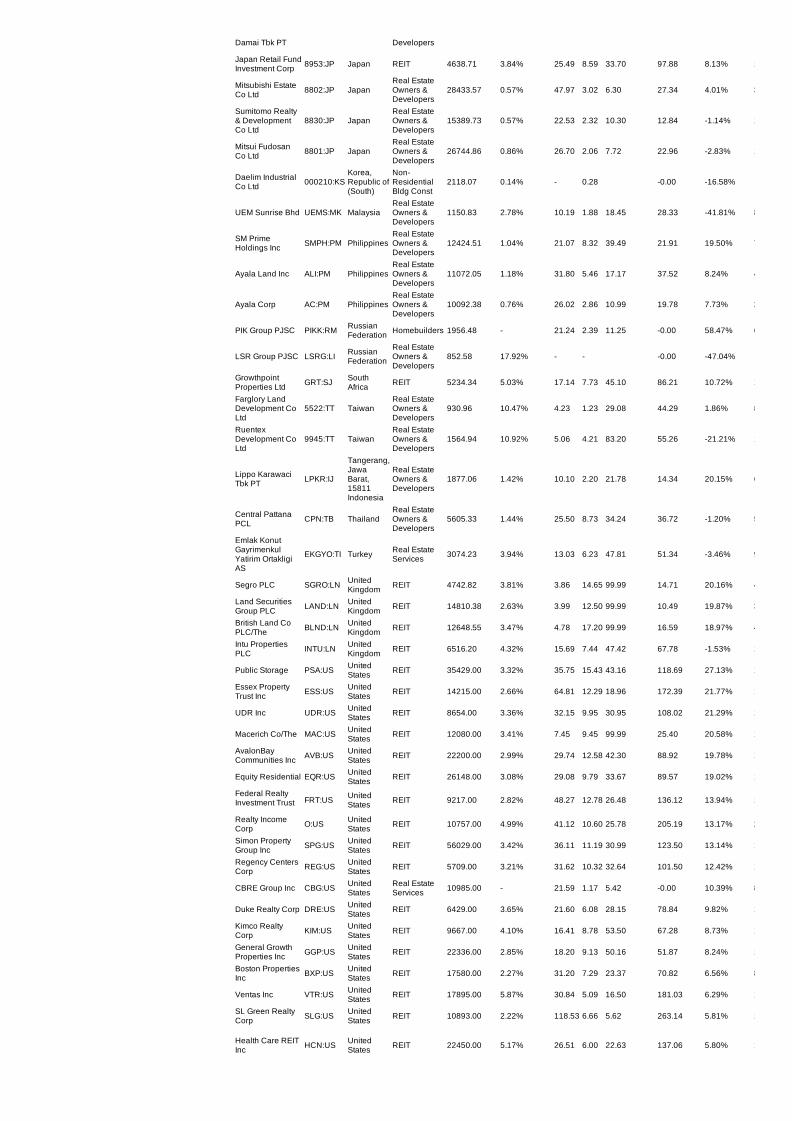
Some facts about warehousing segment: This chart shows average warehousing stock per 1000persons for select countries
Vienna Barcelona Milan Moscow Hamburg Amsterdam Munich Madrid Budapest London Prague Warsaw Frankfurt Paris0
500
1,000
1,500
2,000
2,500
3,000

Land Securities Group PLC(LAND:LN)
2.06 UnitedKingdom
Winners and Losers by Country MLGlobal Real Estate Index Between20150915 and 20150908Name Weekch CountryScentre Group (SCG:AU) 2.62Mirvac Group (MGR:AU) 1.08 AustraliaGoodman Group(GMG:AU)
0.32 Australia
Dexus Property Group(DXS:AU)
0.17 Australia
Stockland (SGP:AU) 1.28 AustraliaWestfield Corp (WFD:AU) 2.88 AustraliaGPT Group/The(GPT:AU)
3.10 Australia
IMMOFINANZ AG(IIA:AV)
0.15 Austria
BR Properties SA(BRPR3:BZ)
2.79 Brazil
MultiplanEmpreendimentosImobiliarios SA(MULT3:BZ)
4.60 Brazil
BR Malls Participacoes SA(BRML3:BZ)
6.93 Brazil
Evergrande Real EstateGroup Ltd (3333:HK)
5.40 China
SOHO China Ltd(410:HK)
4.77 China
Agile Property HoldingsLtd (3383:HK)
0.78 China
Shui On Land Ltd(272:HK)
0.01 China
Guangzhou R&FProperties Co Ltd(2777:HK)
0.56 China
Country Garden HoldingsCo Ltd (2007:HK)
0.75 China
Longfor Properties Co Ltd(960:HK)
1.29 China
SinoOcean Land HoldingsLtd (3377:HK)
4.27 China
Klepierre (LI:FP) 2.14 France
Etalon Group Ltd(ETLN:LI) 7.18
Guernsey,ChannelIslands
Raven Russia Ltd(RUS:LN) 2.13
Guernsey,ChannelIslands
Greentown China HoldingsLtd (3900:HK)
1.42 HangzhouChina
China Resources Land Ltd(1109:HK)
2.92 Hong Kong(SAR)
Poly Property Group CoLtd (119:HK)
1.86 Hong Kong(SAR)
Link REIT (823:HK) 0.94 Hong Kong(SAR)
Shanghai IndustrialHoldings Ltd (363:HK)
0.54 Hong Kong(SAR)
China Overseas Land &Investment Ltd (688:HK)
0.23 Hong Kong(SAR)
New World DevelopmentCo Ltd (17:HK)
0.40 Hong Kong(SAR)
China Overseas GrandOceans Group Ltd(81:HK)
0.85Hong Kong(SAR)
Yuexiu Property Co Ltd(123:HK)
2.51 Hong Kong(SAR)
China Jinmao HoldingsGroup Ltd (817:HK)
2.76 Hong Kong(SAR)
Shimao Property HoldingsLtd (813:HK)
4.29 Hong Kong(SAR)
Unitech Ltd (UT:IN) 2.36 IndiaDLF Ltd (DLFU:IN) 3.00 IndiaBumi Serpong Damai TbkPT (BSDE:IJ)
5.07 Indonesia
Mitsubishi Estate Co Ltd(8802:JP)
2.48 Japan
Japan Retail FundInvestment Corp (8953:JP)
3.58 Japan
Mitsui Fudosan Co Ltd(8801:JP)
4.66 Japan
Sumitomo Realty &Development Co Ltd(8830:JP)
5.83 Japan
Daelim Industrial Co Ltd Korea,
Some facts about Moscow Warehouses:
German Food Retailer Leases Giant Plot in Moscow RegionSales of Warehouse Property in Russia Boom as Prices DropThe Couture ClubRussian Trade Ministry Seeks to Ban Dollar LeasesMoscow Warehouse Rental Rates Fall to 5Year LowThe Morning Risk Report: Iran Sanctions to Get More ComplexGerman Food Retailer Leases Giant Plot in Moscow RegionSales of Warehouse Property in Russia Boom as Prices DropBlackstone's Logicor said in exclusivity on €550m Immofinanz logisticsThe Morning Risk Report: Court Ruling Lets FTC Flex Cybersecurity ...
Current yields are soft compared to their historical averages for Moscow assets (Warehouse Yields)
Retail Real Estate Yields
2006 2007 2008 2009 2010 2011 2012 2013 2014 20159.00
10.00
11.00
12.00
13.00
14.00
15.00

(000210:KS) 9.36 Republic of(South)
UEM Sunrise Bhd(UEMS:MK)
27.84 Malaysia
Ayala Corp (AC:PM) 3.92 PhilippinesAyala Land Inc (ALI:PM) 5.49 PhilippinesSM Prime Holdings Inc(SMPH:PM)
5.96 Philippines
LSR Group PJSC(LSRG:LI)
4.00 RussianFederation
PIK Group PJSC(PIKK:RM)
8.61 RussianFederation
Growthpoint Properties Ltd(GRT:SJ)
5.95 South Africa
Farglory LandDevelopment Co Ltd(5522:TT)
4.27 Taiwan
Ruentex Development CoLtd (9945:TT)
12.64 Taiwan
Lippo Karawaci Tbk PT(LPKR:IJ)
3.06
Tangerang,Jawa Barat,15811Indonesia
Central Pattana PCL(CPN:TB)
2.01 Thailand
Emlak Konut GayrimenkulYatirim Ortakligi AS(EKGYO:TI)
1.18 Turkey
Land Securities GroupPLC (LAND:LN)
2.06 UnitedKingdom
Segro PLC (SGRO:LN) 1.08 UnitedKingdom
Intu Properties PLC(INTU:LN)
0.98 UnitedKingdom
British Land Co PLC/The(BLND:LN)
0.96 UnitedKingdom
Crown Castle InternationalCorp (CCI:US)
4.86 United States
Host Hotels & Resorts Inc(HST:US)
1.76 United States
Weyerhaeuser Co(WY:US)
1.01 United States
VEREIT Inc (VER:US) 0.99 United StatesPlum Creek Timber Co Inc(PCL:US)
0.72 United States
American Tower Corp(AMT:US)
0.56 United States
Digital Realty Trust Inc(DLR:US)
0.51 United States
Public Storage (PSA:US) 0.02 United StatesVentas Inc (VTR:US) 0.39 United StatesLiberty Property Trust(LPT:US)
1.05 United States
CBRE Group Inc(CBG:US)
1.07 United States
Prologis Inc (PLD:US) 1.26 United StatesHCP Inc (HCP:US) 1.29 United StatesIron Mountain Inc(IRM:US)
1.51 United States
Macerich Co/The(MAC:US)
1.61 United States
General Growth PropertiesInc (GGP:US)
1.78 United States
Health Care REIT Inc(HCN:US)
1.95 United States
Regency Centers Corp(REG:US)
1.98 United States
Simon Property Group Inc(SPG:US)
1.99 United States
Equity Residential(EQR:US)
2.26 United States
Essex Property Trust Inc(ESS:US)
2.33 United States
Boston Properties Inc(BXP:US)
2.47 United States
AvalonBay CommunitiesInc (AVB:US)
2.62 United States
Duke Realty Corp(DRE:US)
2.77 United States
Kimco Realty Corp(KIM:US)
2.78 United States
Federal Realty InvestmentTrust (FRT:US)
2.85 United States
Realty Income Corp(O:US)
3.36 United States
SL Green Realty Corp(SLG:US)
3.39 United States
Vornado Realty Trust(VNO:US)
3.68 United States
National Retail Properties Series D Cumulative Redeemable ...Market Wrap: Yields tighten as investors fight over retail assetsBlackRock sees new opportunity in China real estateSmall Cap Buyers Have Big Appetite for Real EstateHow can the Chinese get cracking in the US commercial market ...Fundrise Goes Global: Australia, UK, Canada Now May InvestExShaw's redo sates public's need for more closetsSupermarket warehouses worth more than storesUS stocks lower in midday trade as global markets fallWP Glimcher Inc Declares $0.25 Quarterly Dividend (WPG)
Retail stock per 1000 persons
Some Facts about Moscow Retail
Economic Crisis Empties Moscow Central StreetsRussian Trade Ministry Seeks to Ban Dollar LeasesCorporate CornerEuroshop to Become First Foreign FixedPrice Chain in RussiaRussia's Anatoly Motylyov: Rise, fall, repeat
London Barcelona Rome Hamburg Berlin Moscow Madrid Amsterdam Milan Helsinki Prague Paris Stockholm Warsaw0
100
200
300
400
500
600
700
800

UDR Inc (UDR:US) 3.89 United States Source: Midlincoln Research
Current yields are soft compared to their historical averages for Moscow assets (Retail Yields)
Some facts about Russian Retail: Modern food retail penetration in Russia remains far lowerthan its European and Asian counterparts
Some facts about Russian consumers: while its net ajusted disposable income per houshold inthe same group is above average
2006 2007 2008 2009 2010 2011 2012 2013 2014 20157.00
8.00
9.00
10.00
11.00
12.00
13.00
Vienna Barcelona Milan Moscow Hamburg Amsterdam Munich Madrid Budapest London0
250
500
750
1,000
1,250
1,500

Office Real Estate Yields
Is Dream Office Real Estate Investment Trust's 10.4% Yield Safe?Small Cap Buyers Have Big Appetite for Real EstateHow can the Chinese get cracking in the US commercial market ...Catella Corporate Finance: Catella: Office Transactions in Europe ...West Valley walls are going up and roofs going onGecina Sells the "L'Angle" Building to AG2R LA MONDIALE for ...Seniors Housing Pricing: Bubble Or Not?Dividend Spectrum September Edition
Global Ofice Yields
Source: MidLincoln Research
Residential Real Estate Yields
Unusual Way to Earn High Yields in Real EstateHow can the Chinese get cracking in the US commercial market ...A Novel Way to Earn High Yields in Real EstateApollo Residential Mortgage, Inc. to Present at JMP Securities ...Dividend Spectrum September EditionAnnaly Capital Management, Inc. Announces the $592 Million ...Swimming In A Sea Of Junk (Bonds): Emerging Asia's New Asset ...Top Yield REITs Post 18.20% Higher Return By 5 Highest Yield ...
Index News
Fund Managers Assess the Global Real Estate Investment MarketHibernia Reit admitted to leading realestate indexEuropean listed real estate sees strong equity inflows as global ...State Street Global Advisors Introduces Two New Currency Hedged ...Stocks crash to push more China cash into global real estateDublin moves up global real estate investment rankingsGlobal Expansion of REIT Brand Centered on Variety and Familiarity
Vienna Barcelona Milan Moscow Hamburg Amsterdam Munich Madrid Budapest London0
250
500
750
1,000
1,250
1,500

Some key metrics and valuationsvalue stock Country Industry MCapUSDmn DividendYield PE PS NetMarginPct PayoutRatio 52wkchange ScoreScentre Group SCG:AU REIT 14416.66 2.76% 10.39 6.93 66.70 28.68 21.08% 120.21Westfield Corp WFD:AU Australia REIT 14475.24 12.64 12.87 99.99 0.00 36.99% 140.32GPT Group/The GPT:AU Australia REIT 5693.36 4.89% 9.32 11.18 99.99 45.57 20.14% 190.50Dexus PropertyGroup DXS:AU Australia REIT 5056.08 5.63% 10.70 7.71 72.06 60.24 13.63% 149.37
Goodman Group GMG:AU AustraliaReal EstateServices 7081.52 3.96% 8.09 8.25 99.99 32.04 12.24% 152.31
Mirvac Group MGR:AU AustraliaReal EstateOwners &Developers
4428.81 5.61% 10.14 3.74 36.88 56.89 3.59% 101.36
Stockland SGP:AU Australia REIT 6386.37 6.38% 9.76 4.17 42.73 62.27 1.77% 107.61
IMMOFINANZ AG IIA:AV AustriaReal EstateOwners &Developers
2518.64 3.95 0.00 9.87%
MultiplanEmpreendimentosImobiliarios SA
MULT3:BZ BrazilReal EstateOwners &Developers
2102.95 0.25% 22.47 7.52 33.47 5.62 15.16% 15.60
BR Properties SA BRPR3:BZ BrazilReal EstateOwners &Developers
850.81 2.00% 37.70 4.62 12.25 75.40 16.84% 47.26
BR MallsParticipacoes SA BRML3:BZ Brazil
Real EstateOwners &Developers
1509.24 1.82% 17.36 4.30 24.77 31.60 37.93% 15.22
Evergrande RealEstate Group Ltd 3333:HK China
Real EstateOwners &Developers
8893.30 11.31% 3.89 0.46 11.83 44.00 69.31% 135.39
LongforProperties Co Ltd 960:HK China
Real EstateOwners &Developers
7277.71 3.67% 5.31 0.84 15.82 19.49 4.26% 48.40
SinoOcean LandHoldings Ltd 3377:HK China
Real EstateOwners &Developers
4109.11 5.66% 5.83 0.71 12.18 33.00 0.37% 53.12
Shui On Land Ltd 272:HK ChinaReal EstateOwners &Developers
1802.04 3.56% 7.99 1.63 20.40 28.44 8.13% 46.87
Country GardenHoldings Co Ltd 2007:HK China
Real EstateOwners &Developers
7956.67 2.89% 4.73 0.49 10.36 13.67 10.03% 23.41
Guangzhou R&FProperties Co Ltd 2777:HK China
Real EstateOwners &Developers
3001.90 5.06% 4.89 0.50 10.22 24.74 15.44% 28.78
Agile PropertyHoldings Ltd 3383:HK China
Real EstateOwners &Developers
1955.97 6.46% 4.09 0.31 7.58 26.42 32.94% 11.12
SOHO China Ltd 410:HK ChinaReal EstateOwners &Developers
2026.17 5.37% 8.47 7.40 87.37 45.48 48.72% 89.81
Klepierre LI:FP France REIT 13641.29 3.59% 9.14 0.00 17.01%
Raven Russia Ltd RUS:LNGuernsey,ChannelIslands
Real EstateOwners &Developers
460.32 1.87 0.00 37.27%
Etalon Group Ltd ETLN:LIGuernsey,ChannelIslands
Real EstateOwners &Developers
467.41 7.27% 3.67 0.61 16.62 26.68 52.08% 1.70
Greentown ChinaHoldings Ltd 3900:HK Hangzhou
China
Real EstateOwners &Developers
1654.43 5.33 0.35 6.57 0.00 28.55% 13.17
China OverseasLand &Investment Ltd
688:HK Hong Kong(SAR)
Real EstateOwners &Developers
29772.26 2.35% 6.34 1.45 22.87 14.90 11.67% 57.25
China ResourcesLand Ltd 1109:HK Hong Kong
(SAR)
Real EstateOwners &Developers
16812.94 2.64% 7.10 1.17 16.48 18.74 8.84% 51.11
Link REIT 823:HK Hong Kong(SAR) REIT 12230.16 4.35% 3.55 12.51 99.99 15.44 3.33% 375.10
China JinmaoHoldings GroupLtd
817:HK Hong Kong(SAR)
Real EstateOwners &Developers
2616.10 6.05% 5.49 0.75 13.66 33.21 4.01% 51.52
Yuexiu PropertyCo Ltd 123:HK Hong Kong
(SAR)
Real EstateOwners &Developers
2000.23 4.48% 6.28 0.78 12.42 28.13 15.01% 33.41
New WorldDevelopment CoLtd
17:HK Hong Kong(SAR)
Real EstateOwners &Developers
9066.59 5.38% 5.87 1.14 19.42 31.58 17.77% 41.51
ShanghaiIndustrialHoldings Ltd
363:HK Hong Kong(SAR)
Real EstateOwners &Developers
2567.45 4.42% 7.96 1.03 12.94 35.18 21.58% 32.73
Shimao PropertyHoldings Ltd 813:HK Hong Kong
(SAR)
Real EstateOwners &Developers
5116.97 7.89% 4.34 0.53 12.21 34.24 26.36% 29.90
Poly PropertyGroup Co Ltd 119:HK Hong Kong
(SAR)
Real EstateOwners &Developers
1020.50 3.52% 0.32 0.00 32.45%
China OverseasGrand OceansGroup Ltd
81:HKHong Kong(SAR)
Real EstateOwners &Developers
727.35 0.40% 7.16 0.42 5.87 2.86 49.06% 33.34
DLF Ltd DLFU:IN IndiaReal EstateOwners &Developers
3315.30 1.62% 40.79 2.89 7.09 66.08 25.51% 21.01
Unitech Ltd UT:IN IndiaReal EstateOwners &Developers
234.05 1.80 0.45 25.00 0.00 73.90% 36.55
Bumi Serpong BSDE:IJ IndonesiaReal EstateOwners & 1891.87 1.06% 9.80 4.02 41.02 10.39 5.85% 49.90
Damai Tbk PT Developers
Japan Retail FundInvestment Corp 8953:JP Japan REIT 4638.71 3.84% 25.49 8.59 33.70 97.88 8.13% 128.37
Mitsubishi EstateCo Ltd 8802:JP Japan
Real EstateOwners &Developers
28433.57 0.57% 47.97 3.02 6.30 27.34 4.01% 3.82
Sumitomo Realty& DevelopmentCo Ltd
8830:JP JapanReal EstateOwners &Developers
15389.73 0.57% 22.53 2.32 10.30 12.84 1.14% 13.62
Mitsui FudosanCo Ltd 8801:JP Japan
Real EstateOwners &Developers
26744.86 0.86% 26.70 2.06 7.72 22.96 2.83% 15.29
Daelim IndustrialCo Ltd 000210:KS
Korea,Republic of(South)
NonResidentialBldg Const
2118.07 0.14% 0.28 0.00 16.58%
UEM Sunrise Bhd UEMS:MK MalaysiaReal EstateOwners &Developers
1150.83 2.78% 10.19 1.88 18.45 28.33 41.81% 8.92
SM PrimeHoldings Inc SMPH:PM Philippines
Real EstateOwners &Developers
12424.51 1.04% 21.07 8.32 39.49 21.91 19.50% 73.98
Ayala Land Inc ALI:PM PhilippinesReal EstateOwners &Developers
11072.05 1.18% 31.80 5.46 17.17 37.52 8.24% 45.28
Ayala Corp AC:PM PhilippinesReal EstateOwners &Developers
10092.38 0.76% 26.02 2.86 10.99 19.78 7.73% 26.62
PIK Group PJSC PIKK:RM RussianFederation Homebuilders 1956.48 21.24 2.39 11.25 0.00 58.47% 62.63
LSR Group PJSC LSRG:LI RussianFederation
Real EstateOwners &Developers
852.58 17.92% 0.00 47.04%
GrowthpointProperties Ltd GRT:SJ South
Africa REIT 5234.34 5.03% 17.14 7.73 45.10 86.21 10.72% 139.04
Farglory LandDevelopment CoLtd
5522:TT TaiwanReal EstateOwners &Developers
930.96 10.47% 4.23 1.23 29.08 44.29 1.86% 85.14
RuentexDevelopment CoLtd
9945:TT TaiwanReal EstateOwners &Developers
1564.94 10.92% 5.06 4.21 83.20 55.26 21.21% 126.33
Lippo KarawaciTbk PT LPKR:IJ
Tangerang,JawaBarat,15811Indonesia
Real EstateOwners &Developers
1877.06 1.42% 10.10 2.20 21.78 14.34 20.15% 60.32
Central PattanaPCL CPN:TB Thailand
Real EstateOwners &Developers
5605.33 1.44% 25.50 8.73 34.24 36.72 1.20% 58.40
Emlak KonutGayrimenkulYatirim OrtakligiAS
EKGYO:TI Turkey Real EstateServices 3074.23 3.94% 13.03 6.23 47.81 51.34 3.46% 96.81
Segro PLC SGRO:LN UnitedKingdom REIT 4742.82 3.81% 3.86 14.65 99.99 14.71 20.16% 424.69
Land SecuritiesGroup PLC LAND:LN United
Kingdom REIT 14810.38 2.63% 3.99 12.50 99.99 10.49 19.87% 353.80
British Land CoPLC/The BLND:LN United
Kingdom REIT 12648.55 3.47% 4.78 17.20 99.99 16.59 18.97% 404.76
Intu PropertiesPLC INTU:LN United
Kingdom REIT 6516.20 4.32% 15.69 7.44 47.42 67.78 1.53% 112.13
Public Storage PSA:US UnitedStates REIT 35429.00 3.32% 35.75 15.43 43.16 118.69 27.13% 167.38
Essex PropertyTrust Inc ESS:US United
States REIT 14215.00 2.66% 64.81 12.29 18.96 172.39 21.77% 162.46
UDR Inc UDR:US UnitedStates REIT 8654.00 3.36% 32.15 9.95 30.95 108.02 21.29% 142.26
Macerich Co/The MAC:US UnitedStates REIT 12080.00 3.41% 7.45 9.45 99.99 25.40 20.58% 179.53
AvalonBayCommunities Inc AVB:US United
States REIT 22200.00 2.99% 29.74 12.58 42.30 88.92 19.78% 135.41
Equity Residential EQR:US UnitedStates REIT 26148.00 3.08% 29.08 9.79 33.67 89.57 19.02% 127.32
Federal RealtyInvestment Trust FRT:US United
States REIT 9217.00 2.82% 48.27 12.78 26.48 136.12 13.94% 142.41
Realty IncomeCorp O:US United
States REIT 10757.00 4.99% 41.12 10.60 25.78 205.19 13.17% 217.16
Simon PropertyGroup Inc SPG:US United
States REIT 56029.00 3.42% 36.11 11.19 30.99 123.50 13.14% 145.66
Regency CentersCorp REG:US United
States REIT 5709.00 3.21% 31.62 10.32 32.64 101.50 12.42% 129.08
CBRE Group Inc CBG:US UnitedStates
Real EstateServices 10985.00 21.59 1.17 5.42 0.00 10.39% 8.37
Duke Realty Corp DRE:US UnitedStates REIT 6429.00 3.65% 21.60 6.08 28.15 78.84 9.82% 109.35
Kimco RealtyCorp KIM:US United
States REIT 9667.00 4.10% 16.41 8.78 53.50 67.28 8.73% 127.25
General GrowthProperties Inc GGP:US United
States REIT 22336.00 2.85% 18.20 9.13 50.16 51.87 8.24% 106.22
Boston PropertiesInc BXP:US United
States REIT 17580.00 2.27% 31.20 7.29 23.37 70.82 6.56% 83.70
Ventas Inc VTR:US UnitedStates REIT 17895.00 5.87% 30.84 5.09 16.50 181.03 6.29% 187.13
SL Green RealtyCorp SLG:US United
States REIT 10893.00 2.22% 118.53 6.66 5.62 263.14 5.81% 170.18
Health Care REITInc HCN:US United
States REIT 22450.00 5.17% 26.51 6.00 22.63 137.06 5.80% 153.13

Digital RealtyTrust Inc
DLR:US UnitedStates
REIT 8558.00 5.40% 24.05 5.25 21.83 129.87 5.24% 147.04
Crown CastleInternational Corp CCI:US United
States REIT 25930.00 4.22% 49.27 6.92 14.05 207.92 2.72% 189.56
Plum CreekTimber Co Inc PCL:US United
States REIT 6535.00 4.67% 35.35 4.57 12.93 165.08 2.44% 159.25
Prologis Inc PLD:US UnitedStates REIT 19778.00 4.24% 17.47 10.48 59.99 74.07 1.32% 132.06
Vornado RealtyTrust VNO:US United
States REIT 16927.00 2.81% 45.39 6.64 14.63 127.55 0.34% 110.59
Iron Mountain Inc IRM:US UnitedStates REIT 6080.00 6.57% 44.48 1.94 4.36 292.23 1.92% 264.34
HCP Inc HCP:US UnitedStates REIT 17120.00 6.11% 19.04 7.17 37.66 116.33 2.37% 146.73
American TowerCorp AMT:US United
States REIT 37905.00 2.05% 48.15 8.45 17.55 98.71 3.66% 78.59
Liberty PropertyTrust LPT:US United
States REIT 4692.00 6.07% 23.36 5.71 24.44 141.80 7.51% 149.51
Weyerhaeuser Co WY:US UnitedStates REIT 14073.00 4.53% 26.11 2.05 7.85 118.28 11.23% 102.94
Host Hotels &Resorts Inc HST:US United
States REIT 12904.00 4.65% 18.66 2.43 13.02 86.77 18.32% 76.96
VEREIT Inc VER:US UnitedStates REIT 7294.00 6.82% 4.33 0.00 34.26%
Top 10 Real Estate Picks With Highest Score
value stock Country Industry MCapUSDmn DividendYield PE PS NetMarginPct PayoutRatio 52wkchange Score
Segro PLC SGRO:LN UnitedKingdom REIT 4742.82 3.81% 3.86 14.65 99.99 14.71 20.16% 424.69
British Land CoPLC/The BLND:LN United
Kingdom REIT 12648.55 3.47% 4.78 17.20 99.99 16.59 18.97% 404.76
Link REIT 823:HK Hong Kong(SAR) REIT 12230.16 4.35% 3.55 12.51 99.99 15.44 3.33% 375.10
Land Securities GroupPLC LAND:LN United
Kingdom REIT 14810.38 2.63% 3.99 12.50 99.99 10.49 19.87% 353.80
Iron Mountain Inc IRM:US United States REIT 6080.00 6.57% 44.48 1.94 4.36 292.23 1.92% 264.34Realty Income Corp O:US United States REIT 10757.00 4.99% 41.12 10.60 25.78 205.19 13.17% 217.16GPT Group/The GPT:AU Australia REIT 5693.36 4.89% 9.32 11.18 99.99 45.57 20.14% 190.50Crown CastleInternational Corp CCI:US United States REIT 25930.00 4.22% 49.27 6.92 14.05 207.92 2.72% 189.56
Ventas Inc VTR:US United States REIT 17895.00 5.87% 30.84 5.09 16.50 181.03 6.29% 187.13Macerich Co/The MAC:US United States REIT 12080.00 3.41% 7.45 9.45 99.99 25.40 20.58% 179.53
Top 10 Real Estate Picks With Lowest Score
value stock Country Industry MCapUSDmn DividendYield PE PS NetMarginPct PayoutRatio 52wkchange
Unitech Ltd UT:IN IndiaReal EstateOwners &Developers
234.05 1.80 0.45 25.00 0.00 73.90%
China OverseasGrand OceansGroup Ltd
81:HK Hong Kong(SAR)
Real EstateOwners &Developers
727.35 0.40% 7.16 0.42 5.87 2.86 49.06%
Greentown ChinaHoldings Ltd 3900:HK
HangzhouChina
Real EstateOwners &Developers
1654.43 5.33 0.35 6.57 0.00 28.55%
Etalon Group Ltd ETLN:LIGuernsey,ChannelIslands
Real EstateOwners &Developers
467.41 7.27% 3.67 0.61 16.62 26.68 52.08%
Mitsubishi EstateCo Ltd 8802:JP Japan
Real EstateOwners &Developers
28433.57 0.57% 47.97 3.02 6.30 27.34 4.01%
CBRE Group Inc CBG:US United States Real EstateServices 10985.00 21.59 1.17 5.42 0.00 10.39%
UEM Sunrise Bhd UEMS:MK MalaysiaReal EstateOwners &Developers
1150.83 2.78% 10.19 1.88 18.45 28.33 41.81%
Agile PropertyHoldings Ltd 3383:HK China
Real EstateOwners &Developers
1955.97 6.46% 4.09 0.31 7.58 26.42 32.94%
Sumitomo Realty& DevelopmentCo Ltd
8830:JP JapanReal EstateOwners &Developers
15389.73 0.57% 22.53 2.32 10.30 12.84 1.14%
BR MallsParticipacoes SA BRML3:BZ Brazil
Real EstateOwners &Developers
1509.24 1.82% 17.36 4.30 24.77 31.60 37.93%
Global Real Estate Index

Source: Midlincoln
Global Real Estate Index vs. S&P 500
Source: Midlincoln
This is a Beta Version
Ovanes [email protected]
Sep 16, 2015∙ Midlincoln Research ∙ midlincoln.com
20140917
20141104
20141212
20150205
20150325
20150519
20150630
20150812
110,000.00
120,000.00
130,000.00
140,000.00
150,000.00
160,000.00
20140917
20141104
20141215
20150206
20150326
20150520
20150701
20150813
87.50
90.00
92.50
95.00
97.50
100.00
102.50
105.00
107.50