Middle alternatives revisited: How the neither/nor ... · Middle alternatives revisited: How the...
28
Middle alternatives revisited: How the neither/nor response acts as a way of saying ‘I don’t know’ INTRODUCTION Attitudes have been defined as evaluations along a latent psychological dimension of preference about a particular object (Eagly and Chaiken, 1993). From this perspective, the attitude is best conceptualised as a bipolar construct ranging from extremely negative through to extremely positive preferences, with a neutral midpoint along the continuum. This basic assumption about the underlying structure of attitudes underpins the methods typically used to measure and analyse them in survey research. Most survey attitude measures typically attempt to assess both the direction of the evaluation and its intensity, using response scales that capture these two dimensions simultaneously (Alwin, 1992). Probably the most widely-used of this type of attitude measure is the bipolar response scale, in which respondents are asked to rate the extent to which they agree or disagree with a statement intended to capture positive or negative aspects of the attitude object (Likert 1932). If implemented as their originator intended, Likert items should be administered as multi-item batteries relating to the topic, object, or issue of interest. However, resource constraints often mean that, in practice, only a small number of items can be used to assess an attitude domain and it is not at all uncommon to find social surveys and opinion polls using just a single item to gauge opinion on important areas of political controversy. This practice has heightened the need to better understand the cognitive strategies that people use to answer these types of survey questions to inform best-practice in their design. Central to the construction of bipolar response scales is the choice of whether to use an even or an odd number of response alternatives. If an odd number of alternatives is selected, it must be assumed that the mid-point of the response scale represents views which are genuinely neutral; that is to say, these must be substantive opinions that fall (approximately) at the mid-point of the underlying preference dimension. On the other hand, if an even number of response alternatives is chosen, the possibility of measuring neutral opinions which do exist in the population is excluded by design. This poses some difficult trade-offs for question designers and it is to this choice that we seek to contribute some clarity and guidance in this article. Of 1
Transcript of Middle alternatives revisited: How the neither/nor ... · Middle alternatives revisited: How the...

Middle alternatives revisited: How the neither/nor response acts as a way of saying ‘I don’t know’
INTRODUCTION
Attitudes have been defined as evaluations along a latent psychological dimension of preference about a
particular object (Eagly and Chaiken, 1993). From this perspective, the attitude is best conceptualised as a
bipolar construct ranging from extremely negative through to extremely positive preferences, with a neutral
midpoint along the continuum. This basic assumption about the underlying structure of attitudes underpins the
methods typically used to measure and analyse them in survey research. Most survey attitude measures
typically attempt to assess both the direction of the evaluation and its intensity, using response scales that
capture these two dimensions simultaneously (Alwin, 1992). Probably the most widely-used of this type of
attitude measure is the bipolar response scale, in which respondents are asked to rate the extent to which they
agree or disagree with a statement intended to capture positive or negative aspects of the attitude object
(Likert 1932). If implemented as their originator intended, Likert items should be administered as multi-item
batteries relating to the topic, object, or issue of interest. However, resource constraints often mean that, in
practice, only a small number of items can be used to assess an attitude domain and it is not at all uncommon
to find social surveys and opinion polls using just a single item to gauge opinion on important areas of political
controversy. This practice has heightened the need to better understand the cognitive strategies that people
use to answer these types of survey questions to inform best-practice in their design.
Central to the construction of bipolar response scales is the choice of whether to use an even or an odd
number of response alternatives. If an odd number of alternatives is selected, it must be assumed that the
mid-point of the response scale represents views which are genuinely neutral; that is to say, these must be
substantive opinions that fall (approximately) at the mid-point of the underlying preference dimension. On the
other hand, if an even number of response alternatives is chosen, the possibility of measuring neutral opinions
which do exist in the population is excluded by design. This poses some difficult trade-offs for question
designers and it is to this choice that we seek to contribute some clarity and guidance in this article. Of
1

course, the question of how many response alternatives to include on a rating scale is one that has troubled
researchers for many years and has received considerable attention in the literature on questionnaire design
and measurement error (see Krosnick and Presser, forthcoming; Krosnick, Judd and Wittenbrink, 2005 Alwin,
2007). Yet a lack of consensus persists, and practice in questionnaire design continues to vary widely.
The first obvious problem that arises if a middle response alternative is provided is that it is possible for
respondents who are fatigued, or poorly motivated to complete the survey to select the middle alternative
when they could, if pushed, give a directional response. Krosnick has termed this type of responding - in which
respondents who ‘lean’ in a particular direction on an issue but choose the midpoint to minimize cognitive
costs - ‘satisficing’ (Krosnick 1991). The possibility of satisficing amongst midpoint responders, however, must
be pitted against the fact that neutrality is often an entirely reasonable position to take on many issues, so
excluding a middle alternative by providing an even number of answer categories, may force genuinely neutral
respondents to choose from among the directional answer categories (O’Muircheartaigh, Krosnick and Helic
2000). We refer to this as ‘forced directional’ responding and it is the difficulty of minimizing satisficing without
simultaneously promoting ‘forced directional’ responses that makes the question of whether or not to include a
middle response alternative so difficult to come to a satisfactory conclusion about.
Yet, there exists a third potential source of error that must be considered when deciding whether to offer a
middle alternative, which has received considerably less attention in the existing literature. This is the
possibility that respondents who do not hold an opinion on the issue at all will select the middle-alternative
rather than explicitly admitting their ignorance by selecting or volunteering ‘don’t know’. This type of socially
desirable responding, which we refer to as a ‘hidden don’t know’ response, if evident at non-trivial levels, is
likely to be particularly problematic for valid inference because it will lead to both over-estimates of the degree
of opinionation in the population and violation of the ordinality assumption that researchers typically invoke
when analysing bipolar response scales. A primary motivation of this paper is to argue that, for many
response scales that employ a ‘neither/nor’ alternative as the midpoint, it is the ‘hidden don’t know’ that is the
2

primary threat to validity. Additionally, we seek to show that, counter to the satisficing perspective, it is those
who are most interested in the topic area who are more likely to select the midpoint of an item when their true
opinion cannot be described as neutral. This is because the decision to select the mid-point rather than admit
ignorance is reflective of a social desirability bias and, as such, is to be found most often amongst individuals
who believe they should have an opinion on matters of public interest. The remainder of the paper is
structured as follows. First, we review the existing literature on middle response alternatives, before describing
our hypotheses, research design and data. We then present the results of our statistical analyses before
considering the implications of our findings for our understanding of the cognitive basis of mid-point responses
and the optimal design of bipolar attitude items.
WHY DO PEOPLE SELECT MIDDLE ALTERNATIVES?
Early studies by Rugg and Cantril (1944), Schuman and Presser (1981), Kalton, Roberts and Holt (1980) and
Bishop (1987) used split-ballot designs to evaluate the effects of offering versus omitting a middle response
option for questions in which respondents must decide between competing policy proposals, and the midpoint
provides an ‘in-between’ alternative to the two competing end-point options. For example, Schuman and
Presser (1981; see also Presser and Schuman, 1980) looked at middle alternatives which asked people if they
were ‘middle of the road’ politically (rather than left or right), if they thought marijuana laws in the future should
be kept ‘the same as now’ (rather than made more strict or less strict), and if the current level of US foreign aid
was ‘the right amount’ (rather than too much or too little). The principal finding of these early experiments is
broadly consistent and largely unsurprising. Offering a midpoint increases the proportion of respondents
reporting opinions in the middle category (i.e. endorsing the ‘status quo’ position), compared to when this
alternative is not explicitly offered and interviewers are instructed to record volunteered midpoint responses.
In other words, when the midpoint is offered, respondents are more likely to report ‘neutral’ attitudes than
when it is omitted.
3

Schuman and Presser found little evidence that omitting the midpoint affected either the distribution of
responses across the directional categories, or correlations between their outcomes and other variables in the
dataset. This suggested that the increase in neutral responses is drawn with approximately equal probability
from across the remaining substantive answer categories. Ayidiya and McClendon (1990) obtained similar
findings in a replication of Schuman and Presser’s experiments using a mail, self-completion design.
However, Kalton, Roberts and Holt (1980) and Bishop (1987), found in their studies, that offering respondents
a middle alternative did affect the distribution of responses across the remaining categories, and altered
correlations between the variables of interest and a range of background characteristics, though not in a
substantial way, nor in a consistent direction. While clearly demonstrating that the decision over whether or not
to include a middle response alternative significantly affects the distribution of the data obtained, these split-
ballot studies tell us rather little about the mechanisms that cause midpoint responding and, as a
consequence, which of the two formats should be preferred by question designers. This is because the
differences in marginal frequencies across offered and omitted conditions are equally well accounted for by a)
truly neutral respondents being forced to select a substantive response in the omitted condition (‘forced
directional’ response), b) respondents with a true substantive position selecting the midpoint in the offered
condition (‘satisficing’ response), or c) some combination of a) and b).
An additional limitation of these split-ballot studies for guiding best practice today is that they employ what we
refer to as ‘substantive’ midpoints. That is to say, the midpoint refers to an actual position on the issue in
question, such as ‘keep things about the same’, rather than the ‘neither/nor’ construction that is so ubiquitous
in contemporary survey research. And it is far from obvious that the lessons learned from questions with
substantive midpoints should generalize in any straightforward way to the more common ‘neither/nor’ format.
For, although there is a degree of ambiguity about what ‘keep things about the same’ might mean in exact
policy terms, it is certainly not a response that can be interpreted as semantically equivalent to having no
opinion on the issue. The ‘neither/nor’ label that is now applied to the vast majority of middle response
alternatives in current survey practice is, on the other hand, logically consistent with both opinion neutrality and
4

having no opinion on the issue in question. For instance, if I do not have an opinion on the job performance of
the Prime Minister, it is undoubtedly true to say that I neither agree nor disagree with the statement ‘the Prime
Minister is doing a good job’. ‘I neither agree, nor disagree’ with the statement would also, of course, be an
accurate response if my true opinion were that the Prime Minister is doing neither a good job, nor a bad job but
is performing somewhere in between these two descriptors. And herein lies a major potential flaw in the design
of the ‘neither/nor’ mid-point. While analysts almost universally treat responses to these types of question as
having ordinal (and sometimes interval) properties, it is likely that, for many items, the neither/nor midpoint
actually represents a mix of both neutral and no opinion responses, in proportions that are unknown. The
negative consequences for valid inference, if this is the case, are obvious.
And, indeed, there is some evidence from existing research to support the hypothesis that midpoint
responding may be used as a socially acceptable way of saying ‘I don’t know’. Split-ballot studies have found
midpoint responding to be associated with the tendency to select or volunteer a ‘don’t know’ response; when a
midpoint was offered, the proportion of respondents reporting ‘don’t know’ decreased, and vice versa (Rugg
and Cantrill, 1944; Presser and Schuman, 1980; Kalton et al., 1980). This pattern suggests that substantive
midpoints are likely to attract people whose opinions are relatively uncrystallised, or people “who having no
opinion on the issue, find it easier to choose a seemingly non-committal position than to say ‘don’t know’”
(Schuman and Presser, 1981; p.71). While the magnitude of this effect has generally been found to be small
(cf. a non-significant 2% difference, on average, between offered and omitted conditions in Schuman and
Presser’s study), it seems reasonable to assume that, for the reasons outlined above, the difference will be
substantially greater when the label provided for the midpoint is logically consistent with having no opinion, as
is the case with the ‘neither/nor’ formulation.
Other empirical approaches to establishing the optimal number of scale points for attitude rating scales have
focused on the estimation of reliability and validity coefficients for response scales of different lengths (Alwin,
2007; O’ Muircheartaigh et al 2000; see Krosnick and Presser, in press, for a review). Most prominently, Alwin
5

(2002; 2007) has shown that, compared to two-point scales, three-point scales have significantly poorer
reliability (see also Andrews, 1984), a pattern which he attributes to the uncertainty induced by the introduction
of a potentially ambiguous midpoint. However, the five-point scales he analysed yielded similar reliability to
four-point scales, while 7-point scales had the lowest reliability of all. Because this approach is based on the
analysis of large item pools and empirical estimation of reliability and validity, it is a powerful method of
determining the most appropriate number of response alternatives when considered in the aggregate.
However, by the same token, because the emphasis is on the analysis of covariances as the means of
determining the most appropriate response format, little is learned directly about the psychological
mechanisms which lead individual respondents to choose the mid-point.
We have argued, then, that the split-ballot design is of limited value for understanding the psychological
mechanisms which lead to the observed differences in marginal frequencies across experimental conditions. A
more direct approach to addressing this question has been developed and applied in a recent study by
Malhotra et al. (2009). They seek to identify the optimal number of response alternatives for a range of attitude
items by examining changes in validity coefficients following the administration of ‘branching’ follow-up
questions to an initial response provided on a three point scale. Branching questions involve two steps:
respondents are first asked to report the direction of their attitude (e.g. favour, oppose, neither favour nor
oppose) and in a follow-up question, they are then asked to report the extremity of their response, or if they
lean one way or the other for those who initially selected the middle alternative. Malhotra et al found that
validity was highest when branching questions were used to obtain seven-point scales and where respondents
selecting an endpoint at the first step were subsequently branched into three response options. Branching the
midpoint into directional alternatives was found to yield no significant gains in criterion validity. Additionally,
when midpoint respondents, who subsequently said they were leaning in a particular direction in follow-up
questions, were pooled with initial end-point respondents who selected the least extreme follow-up response,
validity was compromised, leading the authors to conclude that “respondents who placed themselves at the
midpoint belonged there” (Malhotra et al., 2009; p.318). This conclusion, however, only considers the
6

possibility that initial midpoint responders are satisficing. It does not rule out the possibility that those who
initially select the neither/nor alternative are doing so as a way of saying ‘don’t know’. Given the existing
evidence to suggest that substantive midpoints may attract don’t knows and the prima facie plausibility that
this tendency will be greater for ‘neither/nor’ midpoints, our first hypothesis becomes:
H1: The percentage of respondents who select a ‘neither/nor’ alternative but indicate that this denotes a ‘don’t
know’ response in a subsequent branching question will be greater than zero.
Because we have no a priori expectation from the existing literature about the likely proportion of hidden don’t
knows for each question, hypothesis H1 is specified as a test of the simple null hypothesis that the true value
is zero in the population.
Our theoretical model specifies that respondents who have no opinion on an issue will often choose the
‘neither/nor’ alternative rather than select or volunteer a ‘don’t know’ is essentially a matter of self-
presentation; one can select what looks like a substantive position and avoid a public admission of ignorance,
while still selecting a response which is logically consistent with one's actual position on the issue. As we do
not directly observe the extent to which respondents answer questions in a socially desirable manner, we must
test this hypothesis indirectly, as a function of another variable which we assume to be a proximal cause of
socially desirable responding. Because holding an opinion on issues of public debate is likely to be most
socially desirable amongst those who are (or claim to be) interested and engaged in the topic area, our second
hypothesis is:
H2: For those with no opinion on an issue, selecting the ‘neither/nor’ alternative rather than volunteering a
‘don’t know’ response at the outset will be most prevalent among those who report more interest in the
substantive area to which the question relates.
7
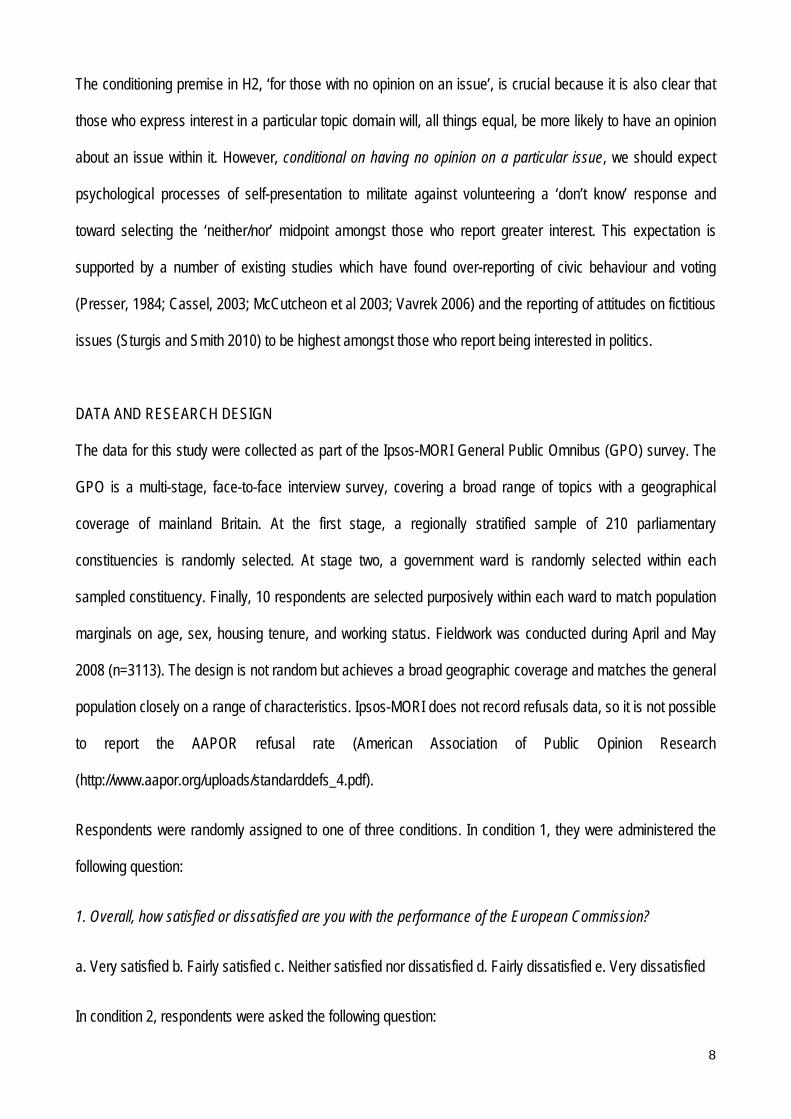
The conditioning premise in H2, ‘for those with no opinion on an issue’, is crucial because it is also clear that
those who express interest in a particular topic domain will, all things equal, be more likely to have an opinion
about an issue within it. However, conditional on having no opinion on a particular issue, we should expect
psychological processes of self-presentation to militate against volunteering a ‘don’t know’ response and
toward selecting the ‘neither/nor’ midpoint amongst those who report greater interest. This expectation is
supported by a number of existing studies which have found over-reporting of civic behaviour and voting
(Presser, 1984; Cassel, 2003; McCutcheon et al 2003; Vavrek 2006) and the reporting of attitudes on fictitious
issues (Sturgis and Smith 2010) to be highest amongst those who report being interested in politics.
DATA AND RESEARCH DESIGN
The data for this study were collected as part of the Ipsos-MORI General Public Omnibus (GPO) survey. The
GPO is a multi-stage, face-to-face interview survey, covering a broad range of topics with a geographical
coverage of mainland Britain. At the first stage, a regionally stratified sample of 210 parliamentary
constituencies is randomly selected. At stage two, a government ward is randomly selected within each
sampled constituency. Finally, 10 respondents are selected purposively within each ward to match population
marginals on age, sex, housing tenure, and working status. Fieldwork was conducted during April and May
2008 (n=3113). The design is not random but achieves a broad geographic coverage and matches the general
population closely on a range of characteristics. Ipsos-MORI does not record refusals data, so it is not possible
to report the AAPOR refusal rate (American Association of Public Opinion Research
(http://www.aapor.org/uploads/standarddefs_4.pdf).
Respondents were randomly assigned to one of three conditions. In condition 1, they were administered the
following question:
1. Overall, how satisfied or dissatisfied are you with the performance of the European Commission?
a. Very satisfied b. Fairly satisfied c. Neither satisfied nor dissatisfied d. Fairly dissatisfied e. Very dissatisfied
In condition 2, respondents were asked the following question:
8
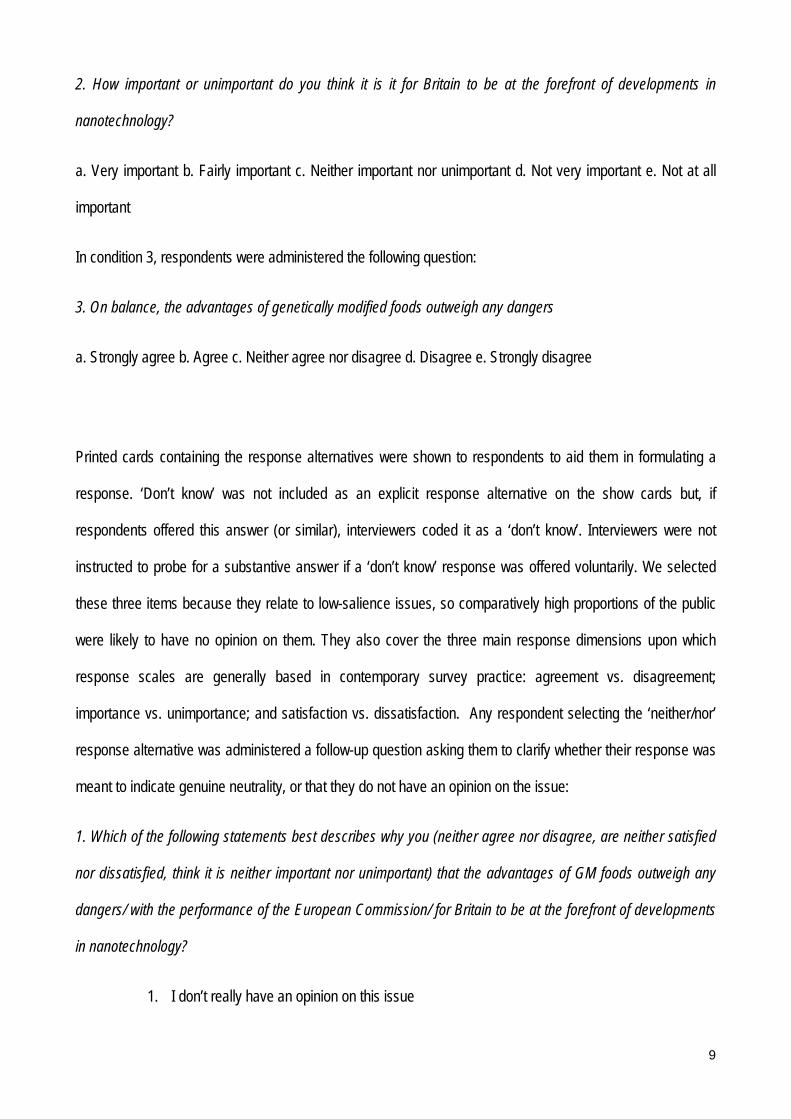
2. How important or unimportant do you think it is it for Britain to be at the forefront of developments in
nanotechnology?
a. Very important b. Fairly important c. Neither important nor unimportant d. Not very important e. Not at all
important
In condition 3, respondents were administered the following question:
3. On balance, the advantages of genetically modified foods outweigh any dangers
a. Strongly agree b. Agree c. Neither agree nor disagree d. Disagree e. Strongly disagree
Printed cards containing the response alternatives were shown to respondents to aid them in formulating a
response. ‘Don’t know’ was not included as an explicit response alternative on the show cards but, if
respondents offered this answer (or similar), interviewers coded it as a ‘don’t know’. Interviewers were not
instructed to probe for a substantive answer if a ‘don’t know’ response was offered voluntarily. We selected
these three items because they relate to low-salience issues, so comparatively high proportions of the public
were likely to have no opinion on them. They also cover the three main response dimensions upon which
response scales are generally based in contemporary survey practice: agreement vs. disagreement;
importance vs. unimportance; and satisfaction vs. dissatisfaction. Any respondent selecting the ‘neither/nor’
response alternative was administered a follow-up question asking them to clarify whether their response was
meant to indicate genuine neutrality, or that they do not have an opinion on the issue:
1. Which of the following statements best describes why you (neither agree nor disagree, are neither satisfied
nor dissatisfied, think it is neither important nor unimportant) that the advantages of GM foods outweigh any
dangers/ with the performance of the European Commission/ for Britain to be at the forefront of developments
in nanotechnology?
1. I don’t really have an opinion on this issue
9
2. I have an opinion which is right in the middle on this issue
3. Neither of the above
Respondents selecting option 3 ‘neither of the above’ were asked to state, in their own words, what led them
to select the neither/nor alternative and their verbatim responses were recorded by the interviewer. These
were then coded by Ipsos-MORI’s team of trained coders to a frame of discrete codes. In addition to a range
of standard demographic questions, respondents were also asked to state their level of interest in politics (for
those in condition 1) or in science (for those in conditions 2 and 3). The order in which the interest questions
were administered relative to the three issue items was also randomized across groups (with half the
respondents in each receiving the interest question first and half receiving it second). Analysis showed there to
be no order effect on any of the three items, so the order conditions were combined.
RESULTS
Table 1 shows the raw marginal frequencies for each of the three questions. The important thing to note about
table 1 is the high proportion of both ‘don’t know’ responses and middle alternatives, with only 41-58% of
respondents providing substantive responses across the three items1. These, then, are clearly quite low-
salience issues for the British public at this point in time, even though they may be of considerable interest to
academic scholars and policy makers.
TABLE 1 HERE
What proportion of the middle alternatives on these questions represent genuinely neutral positions on the
underlying preference dimension? Figure 1(a) shows the breakdown of responses to the follow-up question
who initially selected the midpoint. The results are striking; on all three administered to all respondents
1 When the GM item was administered as part of the 2003 British Social Attitude Survey the response distribution was: 14% agree,
37% neither/nor, 33% disagree, and 16% don’t know.
10

questions, the clear majority of midpoint responses actually turn out to indicate that the respondent has no
opinion on the issue. Only 16%, 13%, and 25% of initial midpoints on the three items, respectively, are
maintained to be truly ‘neutral’ when respondents are asked directly what their response was intended to
indicate. And these figures include in the base all those respondents who selected ‘neither of the above’ to the
initial follow-up probe.
When asked to say in their own words why they chose the ‘neither/nor’ alternative, if not for either of these two
reasons, the majority gave responses which indicated that they did not, in fact, have an opinion on the issue.
For instance, on the GM item, 74% of these respondents provided verbatim answers which were assigned the
following codes:
I don’t have sufficient information (13 respondents)
I have no interest (1 respondent)
What they do is irrelevant to me/does not affect my life (3)
I don’t know (25)
While only 11% provided verbatim responses which indicated that they held neutral attitudes:
A balance between some good and some bad/depends on the issue (3)
Does not have Britain’s interests at heart (3)
FIGURE 1 HERE
The remaining verbatim responses, which did not provide sufficient information to be coded as either ‘no
11

opinion’ or ‘neutral’, were allocated the code ‘indeterminate’.2 Figure 1(b) shows the final distribution of
midpoint responses after reallocation of these second follow-up respondents; between three quarters and
nine-tenths of initial ‘neither/nor’ responses now turn out to conceal nonattitudes, while only around one or two
in ten are genuinely neutral opinions, strongly supporting hypothesis H1. Figure 1 clearly shows that the raw
distributions in table 1 substantially over-estimate the degree of opinion neutrality in the population and, as a
corollary, under-estimate by a commensurate amount the true extent of nonattitudes on all three issues.
In addition to univariate estimates, it is also important to consider the implications of these findings for more
explanatory multivariate analyses, in which bipolar response scales are often deployed, and which treat
‘neither/nor’ responses as the midpoint of an ordinal scale. Table 2 presents the coefficients and standard
errors from ordinal logit models predicting attitude toward the EC, before and after reallocation of ‘hidden don’t
knows’3. There are a number of differences in the magnitude and significance of the coefficients across the
two models that would lead to quite different substantive interpretations about the precursors of attitudes
toward the European Commission. Most notably, men and those more interested in politics are significantly
more positive about the EC in Model 1 but not in Model 2. Partly, this is due to the fact that the standard errors
are somewhat larger in Model 2, as a result of the increased number of don’t know responses that are dropped
from the analysis in this model. However, the difference in sample size does not appear to be the only factor
underpinning the differences, as there are also some sizeable discrepancies in the magnitude of coefficient
point estimates between the two models. Whatever the reasons for the differences, however, it remains clear
that standard analytical practices would yield rather different substantive interpretations depending on how the
‘neither/nor’ midpoint is coded.
2 The full distribution of verbatim codes for all three items is provided in the appendix.
3 Various model specifications could be used for this demonstration, including ordinary least squares and multinomial logit. We have
chosen ordered logit because this seems most suitable, given the distribution of the outcome. However, the basic point that there are
substantial differences between the coefficients before and after reallocation of hidden don’t knows is consistent across all three link
functions. These are available from the corresponding author upon request.
12

TABLE 2 HERE
Thus far we have shown that the vast majority of ‘neither/nor’ responses on all three items appear, on closer
examination, to be reflective of holding no opinion, rather than of opinion neutrality. We argued earlier that this
phenomenon should be anticipated, on the grounds that many individuals may regard the admission of
ignorance on matters of public policy as socially embarrassing and, hence, will select the ‘neither/nor’
alternative as a face-saving way of saying ‘don’t know’. To test the proposed social desirability mechanism as
specified in hypothesis H2, table 3 presents the distribution of interest in politics (for the EC item) and science
(for the nanotechnology and GM items) 4 for initial and hidden don’t know responses respectively.
TABLE 3 HERE
For all three items, the proportion of ‘fairly’ and ‘very’ interested respondents is higher and the proportion of
‘not at all’ and ‘not very’ interested respondents is lower for the ‘hidden don’t know’ than it is for the ‘initial’
don’t know’ category, although for the nanotechnology item, the difference is marginally non-significant at the
95% level of confidence. Counter to what a survey-satisficing explanation of midpoint responding would
predict, then, hidden don’t know responses are more prevalent amongst those who claim to be more
interested in the topic domain, confirming hypothesis H2.
A reasonable objection to the conclusion that more interested respondents select the ‘neither/nor’ midpoint in
substantial numbers as a face-saving way of saying ‘don’t know’, is that we did not explicitly offer ‘don’t know’
as a response alternative. If respondents volunteered a ‘don’t know’ answer, interviewers were able and,
owever, it is possible that what we are seeing is respondents, not so much indeed, instructed to record it. H
4 How interested would you say you are in politics/science? 1. Very interested 2. Fairly interested 3. Neither interested nor
uninterested 4. Not very interested 5. Not at all interested.
13

avoiding saying don’t know, as selecting the offered alternative which comes closest to their true position. This
explanation would also fit plausibly with the associations we have observed between ‘hidden don’t-know’
responding and interest in politics/science, on the grounds that respondents with greater interest in the topic
might be more likely to stick to the interview protocol (i.e. select one of the response alternatives offered on the
show card). To test this alternative account, we re-administered the EC and GM questions to a fresh sample of
the Ipsos-MORI general population omnibus5 but this time, a random half of respondents were offered an
explicit ‘don’t know’ alternative on the show card, while the other half were not. Marginal distributions before
and after reallocation of ‘hidden don’t knows’ across conditions are shown for the EC item in table 4 and, for
the GM item, in table 5.
TABLE 4 HERE
Table 4 shows that, for the EC item, although offering an explicit ‘don’t know’ does increase the ‘don’t know’
rate by 7%, it has no effect on the rate of ‘neither/nor’ responding, either before or after reallocation of ‘hidden
don’t knows’. In fact, the increase in the ‘don’t know’ rate in the offered condition comes entirely from across
the substantive categories in the omitted condition. This suggests that, rather than reducing the rate of ‘hidden
don’t knows’, offering an explicit ‘don’t know’ might increase the rate of satisficing, by drawing respondents
who are able to provide a substantive answer toward the cognitively easier ‘don’t know’ alternative. As we
argued earlier, of course, it is also possible that respondents with no opinion who select the ‘don’t know’ in the
offered condition, are (in counter-factual terms) randomly selecting substantive responses in the omitted
condition (Converse, 1964). Either way, we can be confident that, for this item, explicitly offering a ‘don’t know’
alternative does not reduce the rate of ‘hidden don’t knows’. For the GM item (table 5), the same is true – the
inclusion of an explicit don’t know option has no effect on the rate of ‘neither/nor’ responding, either before or
after reallocation of ‘hidden don’t knows’, although for this item, there is no evidence to suggest that it
ndom responding relative to the omitted condition. increases satisficing or reduces ra
5 Data were collected during October 2008 (n=2084).
14

TABLE 5 HERE
DISCUSSION
The bipolar response scale with five or seven answer categories and a ‘neither/nor’ midpoint, though by no
means the only method used for measuring attitudes, remains one of the most widely used tool for measuring
social and political attitudes across the social sciences. Prominent surveys which have implemented this
question format in recent years include, but are not limited to: the British Social Attitudes Survey; the British
Household Panel Survey; the British Crime Survey; the British Election Study; the American National Election
Studies; the General Social Survey; and major mulit-nation studies including the European Social Survey; the
World Values Survey; and the International Social Survey Programme. Yet despite their ubiquity in current
survey practice, there has long been a lack of understanding about the psychological mechanisms
respondents employ in answering them. As a consequence, it has not been clear exactly how these items
should be designed and implemented to minimize random and systematic errors of measurement. The reason
that this lacuna has persisted for so long in the survey methodological literature is, we have argued, that the
split-ballot research designs that have traditionally been implemented to delineate the various competing
sources of error do not provide sufficient leverage on the key question of why people select mid-points.
There are at least three ways in which respondents might select a response category on a bipolar response
scale in a manner that does not reflect their true psychological state. First, ‘satisficers’ hold an opinion but
select the midpoint to avoid the cognitive costs of selecting the most appropriate directional alternative.
Second, respondents who hold genuinely neutral opinions but are not offered a midpoint are forced to select
from among the available directional categories – ‘forced directional’ responses. And third, respondents who
do not have an opinion on the issue at all but select the midpoint, or from among the directional categories, as
a way of saying ‘don’t know’ without appearing to admit ignorance to the interviewer. The split ballot design, in
which respondents are randomly assigned to receive items omitting or offering a midpoint, is not well-suited to
15
identifying the relative contributions made by each of these competing mechanisms, at least insofar as the
design has been implemented to date.
A recent methodological innovation implemented by Malhotra et al (2009) has advanced our understanding of
how to optimize the design of bipolar response scales considerably. Instead of the standard split-ballot
approach, Malhotra et al use ‘branching’ questions to take respondents from an initial broad answer category
to a more refined directional response, or to maintain their initial position. They then compare validity
coefficients from the initial to the branched versions of the questions to determine the optimal number of
response categories for the item in question. Using this approach across a pool of 8 target attitude measures,
they found that validity coefficients were not improved by branching respondents who initially selected the
midpoint to the directional responses on either side. From this they concluded that respondents who select the
midpoint “belong there”. As we noted earlier, however, this conclusion does not consider the possibility that the
initial ‘neither/nor’ midpoint might also act as a way of saying ‘don’t know’.
In this study, we have applied a variant of Malhotra et al’s branching method to test this hypothesis directly.
We have found that, for the three items considered, the vast majority of respondents who initially selected the
‘neither/nor’ alternative on a five-point item selected the ‘I don’t have an opinion on this issue’ option when
subsequently asked why they had chosen the midpoint. Only a small minority selected the alternative option,
denoting true opinion neutrality, ‘I have an opinion which is right in the middle on this issue’. Unsurprisingly,
reallocating the ‘hidden don’t know’ responses from the midpoint to the ‘don’t know’ category substantially
altered marginal and multivariate distributions for all three items. Our contention is that the response
distributions of these variables prior to branching the mid-points are less reflective of the underlying preference
distribution than is the case after the ‘hidden don’t knows’ have been allocated away from the mid-point.
However, because we do not have criterion variables in our data set by which the validity of these survey
responses can be evaluated empirically, we can speak of bias in the un-branched data only by assumption –
these distributions are biased because they contain responses which, upon closer investigation, are revealed
16

not to be located at the mid-point of an ordinal scale. While we believe this assumption to be both
parsimonious and plausible, additional work could usefully be undertaken to assess the impact of the
branching procedure applied to mid-points on criterion validity coefficients.
A novel contribution of this article is our demonstration that the motivation to employ a ‘face-saving don’t know’
response strategy appears to derive from a desire to avoid social embarrassment among respondents who
feel that they should have an opinion on issues of public importance. Thus, and counter to what the satisficing
framework would predict, the ‘face-saving don’t know’ is found most frequently amongst those who express
greater interest in the topic area.
An important limitation to the generality of our conclusions is the fact that we have focused on a small number
of low-salience issues. Selecting low-salience issues was a deliberate strategy we pursued in order to obtain
sufficient numbers of respondents with no opinion on each issue. On issues with which the public are more
familiar, the proportion of true don’t knows and, therefore, of ‘hidden don’t knows’ in the population would very
likely be smaller and the threat to valid inference concomitantly lower. To adopt Converse’s terminology with
regard to his ‘black-and-white’ model of public opinion, these items should, therefore, be considered as
“limiting cases”, which act as a proof of concept rather than being typical or representative of bipolar response
scales in general (Converse 1964; 2000). An important avenue of future research will be to determine the
extent to which our findings generalize to a broader range of issues that are higher in the public
consciousness.
Be that as it may, it is not at all uncommon for the public to be surveyed about matters of which they are only
dimly aware. Indeed, one of the few things that we know with some certainty about public opinion, after
decades of empirical research, is that the majority of the public are poorly informed about and little interested
in politics and science (Delli Carpini and Keeter, 1996; Miller, 2001; Allum et al, 2008). Our research is,
therefore, of direct relevance to the many surveys which seek to elicit public preferences on more peripheral
17

areas of public policy and debate.
What, then, do our findings imply for the design of bipolar response scales? First, that it is important to include
a midpoint, because a substantial minority of people do appear to hold attitudinal positions which are
genuinely neutral, in the sense of being located at the mid-point of a continuous underlying preference
dimension. Omitting a middle alternative would result in such individuals being forced to select a response
alternative that does not reflect their true attitudinal position and, as a result, reduce item reliability and validity
by forcing respondents with genuinely neutral positions to select from amongst the available directional
alternatives.
However, while a mid-point should be included, whether it is most appropriately labelled ‘neither/nor’ is highly
questionable. Because neither agreeing, nor disagreeing with a statement is logically consistent with both
opinion neutrality and having no opinion, this label incorporates an inherent ambiguity that can only be
resolved by the administration of follow-up probes. These are time-consuming to administer and, therefore,
costly. Nonetheless, our results show that the additional cost of administering branching questions from the
midpoint into a ‘don’t know’ category is likely to be effective in meeting the key objective of any survey - valid
inference. The intuitively appealing recourse of including an explicit ‘don’t know’ alternative does not appear to
solve the problem, for while this did serve to increase the frequency of ‘don’t know’ responses, it had no
discernable effect on the rate of ‘hidden don’t knows’. Another possible resolution of the problem we have
identified here may lie in using a label for the midpoint which is more consistent with the way in which question
designers would like respondents to interpret it. We recommend this as a particularly fruitful avenue for future
research.
REFERENCES
Allum, N., Sturgis, P., Brunton-Smith, I., & Tabourazi, D. (2008). Science knowledge and attitudes across cultures: a meta-analysis. Public Understanding of Science, 17(1), 35-54.
Alwin, Duane. and Krosnick, Jon. A. 1991. The reliability of survey attitude measurement: The influence of question and respondent attributes. Sociological Methods and Research 20:139-181.
18

Alwin, Duane F. 1992. “Information Transmission in the Survey Interview: Number of Response Categories and the Reliability of Attitude Measurement.” Sociological Methodology, 22: 83-118.
Alwin, Duane. 2007. Margins of error. A study of reliability in survey measurements. Hoboken, NJ: John Wiley & Sons, Inc.
Andews, Frank. M. 1984. “Construct validity and error components of survey measures: A structural modeling approach.” Public Opinion Quarterly, 46: 409-42.
Ayidiya, Stephen A. and McKee J. McClendon. 1990. “Response Effects in Mail Surveys.” Public Opinion Quarterly, 54: 229-247.
Bishop, George F. 1987. “Experiments with the Middle Response Alternative in Survey Questions.” Public Opinion Quarterly, 51: 220-232.
Cassel, C. (2003) ‘Over-Reporting and Electoral Participation Research’, American Politics Research, 31 (1), 81–92.
Converse, Philip. 1964. “The Nature of Belief Systems in Mass Publics.” In Ideology and Discontent, ed. David Apter, pp. 206-61. New York: Free Press.
Converse, Philip. 2000. “Assess the Capacity of Mass Electorates.” Annual Review of Political Science, 3: 331-53.
Delli Carpini, Michael, and Scott Keeter. 1996. What Americans Know about Politics and Why it Matters. New Haven, CT: Yale University Press.
Eagly, Alice, H., and Shelly Chaiken. 1993. The psychology of attitudes. London: Harcourt Brace Jovanovich College Publishers.
Kalton, Graham, Julie Roberts, and Tim Holt. 1980. “The Effects of Offering a Middle Response Opinion with Opinion Questions.” The Statistician, 29: 65-78.
Krosnick, Jon A. 1991. “Response Strategies for Coping with the Demands of Attitude Measures in Surveys.” Applied Cognitive Psychology, 5: 214-236.
Krosnick, Jon A., and Leandre R. Fabrigar. 1997. “Designing Rating Scales for Effective Measurement in Surveys.” In Survey Measurement and Process Quality, eds. Lars Lyberg, Paul Biemer, Martin Collins, Edith de Leeuw, Cathryn Dippo, Norbert Schwarz, and Dennis Trewin, pp. 141-164. New York: John Wiley.
Krosnick, Jon A., Charles M. Judd, and Bernd Wittenbrink. 2005. “The Measurement of Attitudes.” In The Handbook of Attitudes, eds. Dolores Albarracin, Blair T. Johnson, and Mark P. Zanna, pp. 21-76. Mahwah, NJ: Lawrence Erlbaum Associates.
Krosnick, Jon. A., & Presser, Stanley. (in press). Questionnaire design. In J. D. Wright & P. V. Marsden (Eds.), Handbook of Survey Research (Second Edition). West Yorkshire, England: Emerald Group.
Likert, Rensis. 1932. “A Technique for the Measurement of Attitudes.” Archives of Psychology, 140: 1-55.
Malhotra, Neil., Jon A. Krosnick, and Randall K. Thomas. 2009. “Optimal Design of Branching Questions to Measure Bipolar Constructs.” Public Opinion Quarterly, 73: 304-324.
McCutcheon, A. L., Belli, R. F. and Tian, Y. (2003) ‘Social Desirability and Faulty Memory in Vote Over-Reporting: A Cross-National Comparison of the American and British Electorates’. Annual meeting of the American Association for Public Opinion Research, Sheraton Music City, Nashville.
Miller, S. (2001). Public understanding of science at the crossroads. Public Understanding of Science, 10, 115-
19

20
120.
O’Muircheartaigh, Colm., Jon A. Krosnick, and Armin Helic. 2000. “Middle Alternatives, Acquiescence and the Quality of Questionnaire Data.” The Harris School Working Paper Series: 01.03.
Presser, S. (1984) ‘Is Inaccuracy on Factual Survey Items Item Specific or Respondent Specific’, Public Opinion Quarterly, 48(1), 344–55.
Presser, Stanley, and Howard Schuman. 1980. “The Measurement of a Middle Position in Attitude Surveys.” Public Opinion Quarterly, 44: 70-85.
Rugg, Donald, and Hadley Cantril. 1944. “The Wording of Questions”. In Gauging Public Opinion, ed. Hadley
Cantril, pp. 23-50. Princeton: Princeton University Press.
Schuman, Howard, and Stanley Presser. 1981. Questions and Answers in Attitude Surveys. New York:
Academic Press.
Sturgis, P. and Smith, P. (2010) Fictitious Issues Revisited: political knowledge, interest, and the generation of
nonattitudes. Political Studies, 58(1), 66-84.
Vavreck, L. (2006) ‘Dangers of Self-Reports of Political Behavior’, Annual meeting of the American Political
Science Association, Philadelphia.

TABLES AND FIGURES
Table 1 Marginal Frequencies for the three items
European Commission
Very satisfied Fairly satisfied Neither/Nor Fairly dissatisfied
Very dissatisfied
Don’t know Total
11 (1.1%) 130(12.6%) 312 (30.3%) 142 (13.8%) 140(13.6%) 294(28.6%) 1029 Nanotechnology Very important Fairly
important Neither/Nor Not very
important Not at all important
Don’t know
30(2.8%) 184(17.5%) 289(27.4%) 234(22.3%) 123(11.7%) 192(18.2%) 1031 Gene Modification Strongly agree Agree Neither/Nor Disagree Strongly
disagree Don’t know
240(23.3%) 272(26.4%) 125(12.1%) 56(5.4%) 26(2.5%) 312(30.3%) 1053
21

Figure 1 Distribution of initial midpoint responses after:
(a) the follow-up probe (b) the follow-up probe and redistribution of ‘neither of the above’ responses
pg
79%84%
69%
18%
13%
26%
3% 3%5%
0%
10%
20%
30%
40%
50%
60%
70%
80%
90%
EC Nano GM
Question
65% 66%
53%
16%13%
25%
18%22% 21%
0%
10%
20%
30%
40%
50%
60%
70%
80%
90%
100%
EC Nano GM
Question
resp
onse
s to
follo
w-u
p qu
estio
n to
mid
poin
t res
pond
ents
(%
)
hidden don't knowneutral attitudeindeterminate
22
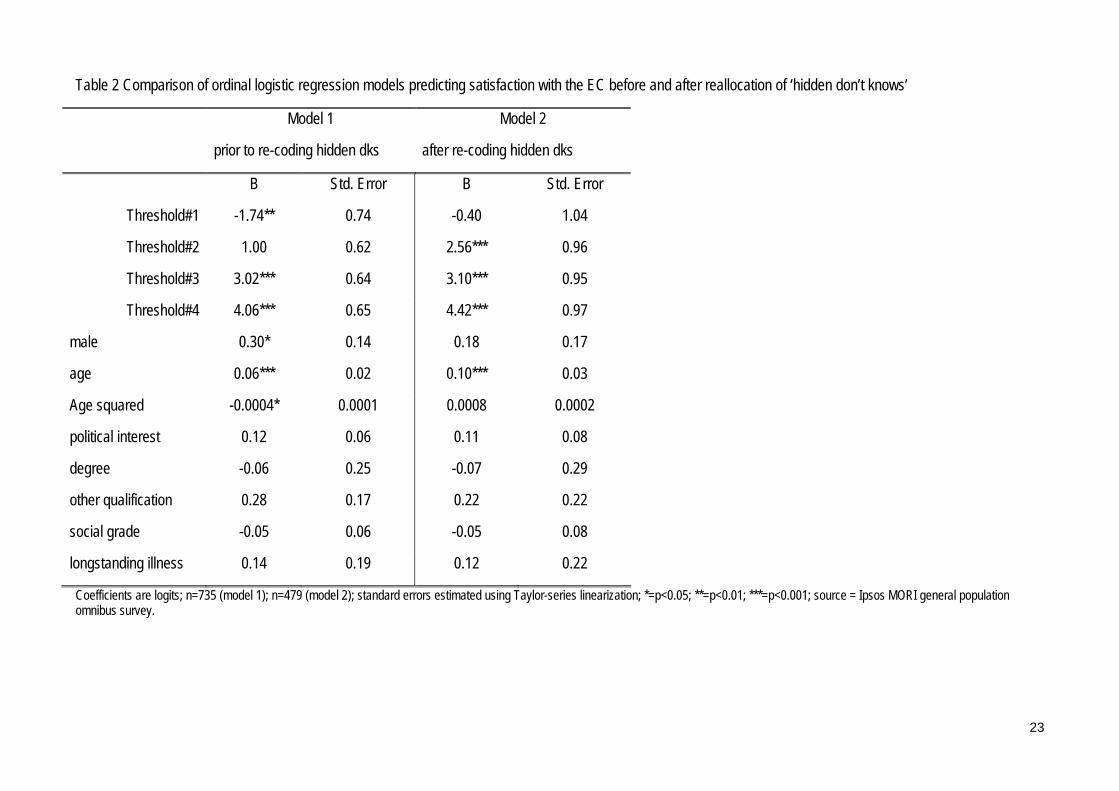
Table 2 Comparison of ordinal logistic regression models predicting satisfaction with the EC before and after reallocation of ‘hidden don’t knows’
Model 1
prior to re-coding hidden dks
Model 2
after re-coding hidden dks
B Std. Error B Std. Error
Threshold#1 -1.74** 0.74 -0.40 1.04
Threshold#2 1.00 0.62 2.56*** 0.96
Threshold#3 3.02*** 0.64 3.10*** 0.95
Threshold#4 4.06*** 0.65 4.42*** 0.97
male 0.30* 0.14 0.18 0.17
age 0.06*** 0.02 0.10*** 0.03
Age squared -0.0004* 0.0001 0.0008 0.0002
political interest 0.12 0.06 0.11 0.08
degree -0.06 0.25 -0.07 0.29
other qualification 0.28 0.17 0.22 0.22
social grade -0.05 0.06 -0.05 0.08
longstanding illness 0.14 0.19 0.12 0.22
Coefficients are logits; n=735 (model 1); n=479 (model 2); standard errors estimated using Taylor-series linearization; *=p<0.05; **=p<0.01; ***=p<0.001; source = Ipsos MORI general population omnibus survey.
23

Table 3 Distributions of political/scientific interest across ‘initial’ and ‘hidden don’t know’ response categories
not at all
interested not very
interested neither/nor fairly
interested very
interested total Chi Square test of
independence
E.C.
Initial don't know 85 (28.9%) 90 (30.6%) 32 (10.9%) 77 (26.2%) 10 (3.4%) 294
hidden don't know 47 (19.1%) 57 (23.2%) 30 (12.2%) 95 (38.6%) 17 (6.9%) 246 18(df=4), p=0.001
G.M.
Initial don't know 64 (34.8% 48 (26.1%) 28 (15.2%) 38 (20.7%) 6 (3.3%) 184
hidden don't know 31 (14.5%) 57 (26.6%) 48 (22.4%) 61 (28.5%) 17 (7.9%) 214 26(df=4), p<0.001
Nanotechnology
Initial don't know 82 (26.5%) 95 (30.7%) 34 (11%) 78 (25.2%) 20 (6.5%) 309
hidden don't know 19 (17.6%) 29 (26.9%) 19 (17.6%) 36 (33.3%) 5 (4.6%) 108 8.2(df=4), p=0.086
24

Table 4 Marginal Distribution for satisfaction with EC for items with and without explicit ‘don’t knows’
Question version
Very/fairly satisfied
Neither/nor Fairly/very dissatisfied
DK Total
Before reallocating middle alterantives
No explicit DK 76 (13.6%) 138 (24.7%) 211(37.7%) 134 (24%) 559
Explicit DK 46 (9.4%) 117 (23.9%) 174 (35.5%) 153 (31.2%) 490
After reallocating middle alterntives
No explicit DK 76 (13.6%) 28 (5%) 211(37.7%) 244 (43.6%) 559
Explicit DK 46 (9.4%) 30 (6%) 174 (35.5%) 240 (49.2%) 490
Table 5 Distribution for benefits and dangers of GM item for items with and without explicit ‘don’t knows’ Question version
Strongly agree/agree
Neither/nor Disagree/strongly disagree
DK Total
Before reallocating middle alterantives
No explicit DK 99 (19.6%) 139 (27.6%) 156 (31%) 110 (21.8%) 504
Explicit DK 110 (20.7%) 133 (25%) 170 (32%) 118 (22.2%) 531
After reallocating middle alterntives
No explicit DK 99 (19.6%) 39 (7.7%) 156 (31%) 210 (41.7%) 504
Explicit DK 110 (20.7%) 41 (7.7%) 170 (32%) 118 (39.5%) 531
25

26

Appendix
Of the 312 selecting neither/nor on the EC item, 57 chose ‘neither of the above’ on follow-up. Of these, 42 were coded to ‘don’t know’, 6 were kept as ‘neither/nor’ and
9 were coded as ‘cannot tell’/ ‘indeterminate’.
Code Frequency Coded to
Don’t have sufficient info 13 Don’t know
No interest 1 Don’t know
What they do is irrelevant to me/does not impact my life
3 Don’t know
Balance between some good and some bad/depends on the issue
3 Neither/nor
Does not have Britain’s interests at heart
3 Neither/nor
Don’t know 25 Don’t know
No reason stated 9 cannot tell/ indeterminate
Of the 125 selecting neither/nor on nanotechnology item, 27 chose ‘neither of the above’ on follow-up. Of these, 23 were coded to ‘don’t know’, 0 were kept as ‘neither/nor’ and 4 were coded as ‘cannot tell’/ ‘indeterminate.
Code Frequency Coded to
Don’t have sufficient info 2 Don’t know
No interest 2 Don’t know
Don’t know 19 Don’t know
27

28
No reason stated 4 cannot tell/ indeterminate
Of the 289 selecting neither/nor on GM item, 62 chose ‘neither of the above’ on follow-up. Of these, 45 were coded to ‘don’t know’, 2 were kept as ‘neither/nor’ and 15 were coded as ‘cannot tell’/ ‘indeterminate.
Code Frequency Coded to
Too soon to tell/not enough testing done
2 Neither/nor
Don’t know 45 Don’t know
No reason stated 15 cannot tell/ indeterminate