MID YEAR BUDGET REVIEW 2003-04
28
MID YEAR BUDGET REVIEW 2003-04 Presented by the Honourable Kevin Foley MP Deputy Premier and Treasurer of South Australia
Transcript of MID YEAR BUDGET REVIEW 2003-04

MID YEAR BUDGET REVIEW
2003-04
Presented by the
Honourable Kevin Foley MP
Deputy Premier and Treasurer of South Australia

CONTENTS
1. 2003-04 BUDGET POSITION AND FISCAL OUTLOOK......................................... 1
2. ECONOMIC OUTLOOK ............................................................................................. 11
3. UNIFORM PRESENTATION FRAMEWORK......................................................... 13
4. GENERAL GOVERNMENT TIME SERIES ............................................................ 24

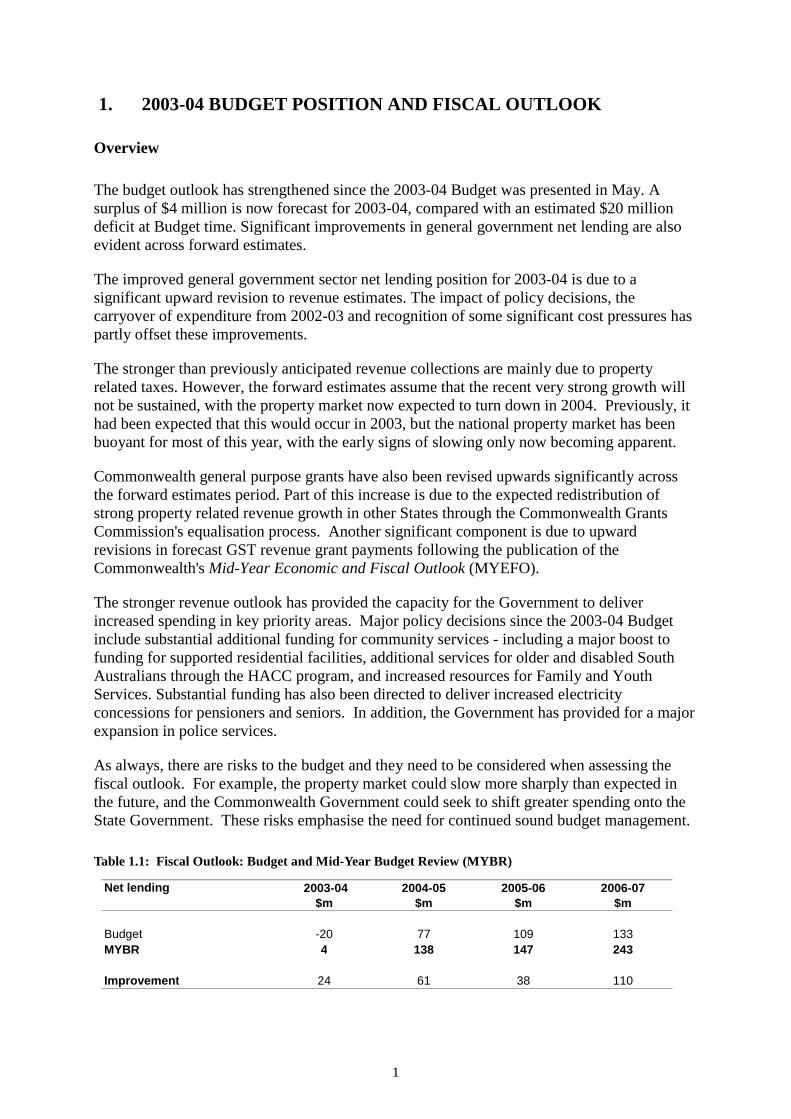
1. 2003-04 BUDGET POSITION AND FISCAL OUTLOOK
Overview
The budget outlook has strengthened since the 2003-04 Budget was presented in May. A surplus of $4 million is now forecast for 2003-04, compared with an estimated $20 million deficit at Budget time. Significant improvements in general government net lending are also evident across forward estimates.
The improved general government sector net lending position for 2003-04 is due to a significant upward revision to revenue estimates. The impact of policy decisions, the carryover of expenditure from 2002-03 and recognition of some significant cost pressures has partly offset these improvements.
The stronger than previously anticipated revenue collections are mainly due to property related taxes. However, the forward estimates assume that the recent very strong growth will not be sustained, with the property market now expected to turn down in 2004. Previously, it had been expected that this would occur in 2003, but the national property market has been buoyant for most of this year, with the early signs of slowing only now becoming apparent.
Commonwealth general purpose grants have also been revised upwards significantly across the forward estimates period. Part of this increase is due to the expected redistribution of strong property related revenue growth in other States through the Commonwealth Grants Commission's equalisation process. Another significant component is due to upward revisions in forecast GST revenue grant payments following the publication of the Commonwealth's Mid-Year Economic and Fiscal Outlook (MYEFO).
The stronger revenue outlook has provided the capacity for the Government to deliver increased spending in key priority areas. Major policy decisions since the 2003-04 Budget include substantial additional funding for community services - including a major boost to funding for supported residential facilities, additional services for older and disabled South Australians through the HACC program, and increased resources for Family and Youth Services. Substantial funding has also been directed to deliver increased electricity concessions for pensioners and seniors. In addition, the Government has provided for a major expansion in police services.
As always, there are risks to the budget and they need to be considered when assessing the fiscal outlook. For example, the property market could slow more sharply than expected in the future, and the Commonwealth Government could seek to shift greater spending onto the State Government. These risks emphasise the need for continued sound budget management.
Table 1.1: Fiscal Outlook: Budget and Mid-Year Budget Review (MYBR)
Net lending 2003-04 2004-05 2005-06 2006-07 $m $m $m $m
Budget -20 77 109 133MYBR 4 138 147 243
Improvement 24 61 38 110
1

Table 1.2 provides a summary of the key general government sector budget aggregates for 2003-04 and the forward years. Detailed financial statements presented in accordance with the Uniform Presentation Framework Agreement are provided in Chapter 3.
Table 1.2: General Government Sector Aggregates
(a) The 2003-04 Budget revenue and expenses estimates in the MYBR are based on Table A.1 Appendix A of the 2003-04 Budget Statement
Table 1.3 provides a summary reconciliation between the estimates published in the 2003-04 Budget and those presented in the MYBR. It is important to note that operating expenses have increased by around $200 million per annum since the 2003-04 Budget. This has, on this occasion, been more than offset by revenue increases. The Government believes it would be very unwise to assume that revenue will continue to be so favourable over the longer term. Further details on major parameter and other variations are provided in Table 1.4, while Table 1.5 at the end of this section lists all policy decisions since the Budget.
Table 1.3: Reconciliation Statement – General Government Net Lending (a)
(a)Individual items in the table are expressed in terms of variations that impact on the budget balance (accrual net lending).
2003-04 2004-05 2005-06 2006-07$m $m $m $m
Estimate at 2003-04 Budget -20 77 109 133
Policy measuresRevenue - other 0 -1 -1 -1Operating expenses -66 -54 -67 -62Net capital investment expenditure 3 -14 -16 4
Net effect of policy measures -63 -70 -84 -60
Parameter and other variationsRevenue - taxation 191 129 108 115Revenue - other 51 152 172 210Operating expenses -147 -142 -158 -151Net capital investment expenditure -8 -8 – -4
Net effect of parameter and other variations 87 131 122 170
Estimate at 2003-04 Mid Year Budget Review 4 138 147 243
2003-04 2003-04 2004-05 2005-06 2006-07Budget(a) Estimated Estimate Estimate Estimate
Result$m $m $m $m $m
Revenue 9 161 9 403 9 627 9 858 10 169Expenses 9 103 9 316 9 435 9 685 9 771Gross fixed capital formation 486 486 465 452 583Depreciation 410 405 411 426 428
Change in inventories 2 2 – – –Accrual net lending - 20 4 138 147 243Memorandum items:
Cash surplus 83 116 211 286 365Net Debt 719 577 385 116 - 213Unfunded Superannuation 4 611 5 980 6 091 6 196 6 296
2

Table 1.4: Major revenue and expense variations (parameter and other) since 2003-04 Budget
Operating revenue
Taxation receipts
Since the 2003-04 Budget, there have been significant upward revisions to forecast taxation revenue mainly reflecting continuing strength in the property market.
The 2003-04 Budget assumed that sustained buoyancy in the property market over a four year period commencing in 1999-2000 would abate. Provision was made for a downturn in activity commencing in 2003-04. However, continued strength in activity levels, and further growth in property prices since March 2003, have resulted in taxation revenue collections exceeding forecasts in the opening months of 2003-04.
A downturn in the property market is still anticipated in 2003-04 but is now not expected to occur until later in the financial year. The uplift in property prices is expected to deliver ongoing revenue gains over the forward estimate period, compared to the outlook at Budget time.
Growth in property prices has also caused an upward revision to projected land tax collections. The impact of the property value increases experienced to date will not be fully reflected in land tax assessments until 2004-05. As a result, upward revisions since the 2003-04 Budget to forecast land tax revenue step up again in 2004-05 before settling at that higher level. This is also the case for revenue forecasts for the fixed property component of the Emergency Services Levy.
2003-04 2004-05 2005-06 2006-07$m $m $m $m
Revenue-TaxationPayroll tax 16 15 16 17Property related taxes 159 98 71 76Insurance taxes 2 7 7 8Gambling tax 6 3 7 8Motor vehicle taxes 8 6 6 6
Total taxation revenue 191 129 108 115
Revenue-OtherGeneral purpose grants 15 92 93 144Competition grants -8 -2 4 4Specific purpose grants 6 31 47 38Royalties -5 -4 -5 -6Agency revenue 34 35 33 31PNFC distributions-SA Water 9 -1 -1 -1
Total other revenue 51 152 172 210
Operating ExpensesSuperannuation-nominal interest expense -14 -14 -14 -12Superannuation-increased defined benefits contributions
-7 -7 -7 -7
Carryovers from 2002-03 -54 – – –Provision for major DHS cost pressures -49 -53 -54 -54DHS accrual correction 2 -26 -27 -27Other variations -25 -42 -56 -51
Total expenses -147 -142 -158 -151
3

Payroll tax receipts have been revised up over the forward estimates period reflecting underlying strength in the South Australian economy which has lifted the payroll tax base.
Forecast stamp duty on insurance premiums has been revised up reflecting a slightly stronger outcome in 2002-03 than anticipated at the time of the 2003-04 Budget. Growth in premiums has also been revised up in 2004-05 consistent with industry forecasts.
Upward revisions to forecast stamp duty on motor vehicle registrations and transfers reflect recent strong growth in new motor vehicle sales. Provision has been made for some flattening in growth from 2004-05 resulting in smaller increases against budget in 2004-05 and beyond.
Gaming machine tax estimates have been revised up reflecting stronger than budgeted expenditure on gaming in the opening months of 2003-04. This flows through as a base effect to subsequent years.
Commonwealth grants
Since the 2003-04 Budget, Commonwealth general purpose grants (excluding Competition grants) have been revised up significantly across the forward estimate period reflecting:
• revised Commonwealth estimates of GST revenues released in the Commonwealth’s Mid-Year Economic and Fiscal Outlook (MYEFO). These revised estimates show that South Australia is now projected to receive grants in excess of the Guaranteed Minimum Amount as from 2003-04;
• a reduction in the provision made for revenue losses arising from the Commonwealth Grants Commission’s 2004 Methodology Review, based on revised preliminary results; and
• upward revisions to revenue gains from the Commission’s annual relativity updates. This mainly reflects the redistribution of stronger than previously expected revenue growth in other states.
The revisions since Budget also incorporate the effect of revised parameters (eg population growth rates) impacting on State shares of GST revenues.
Competition grants have been revised down, reflecting that South Australia will be penalised to a larger extent than expected, at least in the short term, following the National Competition Council’s assessment of the State’s progress in meeting National Competition Policy obligations.
Specific purpose grants have been revised up across the forward estimates period following the finalisation of the latest 5 year Australian Health Care Agreements (AHCA) in August 2003. Conservative estimates for Commonwealth AHCA revenue were incorporated in the 2003-04 Budget pending finalisation of the agreements. All of the AHCA funding will be allocated to address major health cost pressures. Provision for this expenditure is fully factored into the MYBR estimates. The change in Commonwealth SPP grants also includes the impact of slippage in capital grants for schools that were previously expected to be received in 2002-03 and a number of minor variations to estimated receipts in 2003-04.
4

Sales of goods and services
Revenue from sales of goods and services has been revised up across the forward estimates period. These revisions are spread across a number of agencies and include the impact of the revised property market outlook on property-related fees and charges.
Other State revenues
Royalty revenue has been revised down in 2003-04, largely as a result of a recently announced reduction in copper production by Western Mining Corporation. Negative revenue impacts from the appreciation of the Australian dollar are partly offset by higher commodity prices for petroleum liquids and base metals.
Downward revisions to royalty revenue over the remainder of the forward estimates period are mainly due to revised $A/$US exchange rate assumptions.
PNFC Distributions
The 2003-04 Mid Year Review includes a special SA Water dividend of $10 million in 2003-04. This dividend is accrued in 2003-04 but paid in 2004-05. Riverland Water is to provide water quality enhancements at its Riverland filtration plants as compensation for certain economic development obligations that have not been met by Riverland Water. The benefits will be recognised by SA Water as net income, providing the capacity for increased dividends in 2003-04. SA Water distributions have also been slightly revised to account for the expected impact of water restrictions.
Operating Expenses
Since the 2003-04 Budget, Cabinet decisions have resulted in upward revisions to expenses across the forward estimates. Significant policy decisions include:
• the provision of enhanced electricity concessions for pensioners and seniors who hold a Commonwealth Seniors Health Card, at a cost of $20 million in 2003-04;
• a $10 million annual support package to assist supported residential facilities in providing accommodation to people with disabilities and other special needs;
• additional funding of $19 million in 2003-04 to finalise the new enterprise agreement for salaried medical officers employed in public hospitals;
• a major expansion in resources for the SA Police to be phased in from 2003-04, with an ongoing cost when fully implemented of almost $20 million per annum from 2006-07;
• an expansion of the number of child protection workers employed by Family and Youth Services at a full year cost of $3.6 million; and
• additional funding support of $1.9 million per annum for Home and Community Care (HACC) services.
A full list of policy decisions since the 2003-04 Budget is provided in Table 1.5 at the end of this section.
5

Further increases in estimated expenses in 2003-04 and the forward years arise from expenses carried over from 2002-03 into 2003-04 and later years.
The Government has made provision for a number of cost pressures that are considered to be unavoidable. The most significant variations relate to the Department of Human Services.
Firstly, the MYBR incorporates a correction of an understatement of expenses of $26 million per annum from 2004-05 onwards by the Department of Human Services. These items relate to payables for the supply of goods and services (and accounts payable), employee entitlements and provisions, and certain other items. These errors first occurred in 2000 when the 2004-05 forward estimates were originally created and have been perpetuated in establishing succeeding years’ forward estimates.
In addition, the Department of Human Services has reported a significant gap in its funding requirements across a range of functions. This includes a gap between the budget allocation for Family and Youth Services (FAYS) and the actual costs of operating current services. This gap has been identified in preliminary analysis undertaken as part of an audit of FAYS established by the Minister for Social Justice in June 2003. There are also significant cost pressures in the public hospital system.
The precise magnitude of the funding gaps have not yet been determined and will require further analysis before the 2004-05 Budget. In the meantime, provision has been made for a significant increase in funding of around $50 million per annum to sustain services.
The Government is concerned about the quality of financial management practices in the Department of Human Services (DHS). It appears that for some years DHS has shifted funding across different programs to meet budget targets without transparently reporting those transfers. In order to ensure that future funding decisions are based on sound information, a thorough review of DHS funding needs and financial management systems will be conducted. This task is not anticipated to be completed until at least the 2004-05 Budget. However, the Government is committed to ensuring that DHS receives the funding it needs to deliver hospital and community services and will provide necessary funding supplementation in the interim.
Superannuation expense variations
Superannuation expenses have been revised upwards since the 2003-04 Budget in anticipation of a new Australian Accounting Standard for employee benefits. This standard is currently in draft form but is anticipated to be implemented within the next 18 months. It requires superannuation liabilities to be valued using the national government bond rate (or similar rate).
The most substantial impact is on the value of the Government's superannuation liability (see discussion of balance sheet indicators below). However, there is a consequent impact on annual expenses. In addition, the assumed long-term earnings rate on superannuation assets has been revised downwards, increasing the superannuation payments that agencies must make to fund to their superannuation obligations.
Previously the net present value (NPV) of future superannuation liabilities was calculated using the expected earnings rate of 7.5 per cent per annum. Under the proposed new
6

accounting standard the NPV must be calculated using an estimate of the risk-free rate. For the South Australian government this is currently around 6.0 per cent per annum.
Using the lower discount rate produces a higher NPV estimate of unfunded liabilities. The impact on the budget in accrual terms is the imputed interest on this NPV and will result in an increase in expense of around $16.5 million per annum. Other minor variations have partially offset this impact resulting in a net increase in the nominal superannuation interest expense since the budget of $14 million in 2003-04.
Forecast new service employee superannuation expenses have risen by around $7 million per annum. This increase is required because the long-term earnings rate assumption has been reduced from 7.5% per annum (5.0% real plus 2.5% inflation), to 7%. This means government agencies must make higher payments to fund their employees’ superannuation. The long-term earnings rate assumption now aligns with Funds SA’s target rate of return for its defined benefit asset portfolio.
Balance sheet indicators
Unfunded superannuation
The estimates of unfunded superannuation liability levels have increased since the 2003-04 Budget, primarily reflecting the adoption of a revised long-term discount rate assumption. As noted above, this change has been made in anticipation of a new accounting standard for employee benefits. The expected new standard, which is based on the corresponding international Accounting Standard (IAS 19), requires superannuation liabilities to be valued using the national government bond rate (or similar rate).
A discount rate of 6.0% has therefore been adopted in the MYBR to value the unfunded superannuation liability – previously 7.5% was used.
In addition, the assumed earnings rate on superannuation assets has been revised to 7.0% per annum from 7.5% per annum. As noted earlier this will ensure consistency with Funds SA’s target rate of return.
The adoption of the 6.0% discount rate has increased the estimated unfunded superannuation liability by around $1.4 billion.
Other movements in the superannuation liability include:
• a $53 million increase in the liability reflecting changes to actuarial assumptions for the Police Superannuation Scheme following the most recent triennial review of the scheme; and
• a reduction in the unfunded superannuation liability of around $100 million as a result of the final earnings rate by Funds SA for 2002-03 being negative 0.6% compared with the negative 3.7% return projection used at budget time.
The Government remains committed to ensuring that all superannuation liabilities are fully funded by 2034. To ensure the target is met, the Government has increased scheduled cash payments for future years.
7

Net debt
General government net debt is forecast to further improve in 2003-04 and across the forward estimates. Net debt is forecast to fall by $879 million from $666 million at June 2003 to a net financial asset position of $213 million at June 2007.
The improvement in net debt primarily reflects improvements in the general government cash surpluses. The forecast cash surpluses in 2003-04 and across the forward years gives rise to an improvement in the Government’s balance sheet. However, this improvement is not sufficient to outweigh the impact of the very large increase in estimated superannuation liabilities.
The public non-financial corporations’ component of the non-financial public sector net debt of $2 129 million at June 2004 is expected to be $57 million lower than forecast in the 2003-04 Budget.
With the improvement in general government sector and public non-financial corporations net debt, non-financial public sector net debt at June 2004 is expected to fall by $198 million from the estimate at the 2003-04 Budget to $2 707 million.
Risks
Key risks that were identified in the 2003-04 Budget included future growth in wages being above budget provisions; demand pressures in the Health portfolio; the impact on gaming machine revenue from the implementation of smoking bans in clubs and hotels; and the impact of the Commonwealth Grants Commission 5 yearly methodology review.
In relation to future growth in wages, an extra 0.5 per cent growth above current budget provisions would result in additional wages expense of around $50 million per annum by 2006-07. A number of major public sector agreements are expected to be determined in 2004.
Since the 2003-04 Budget, the Government has announced that the full smoking ban will apply in gaming venues from 31 October 2007. This will have an estimated $41 million negative impact on gaming revenue in 2007-08, and a full year impact of $70 million per annum thereafter.
In addition, it appears that the Commonwealth Grants Commission's methodology review will result in a smaller reduction in South Australia's revenue share than previously anticipated; however, the final outcome will not be known until March 2004.
Finally taxation revenues remain at risk due to uncertainty about the property market outlook in the short term. The strength in the property market over a sustained period has exceeded the expectations of most market commentators. The unusual dimensions of the cyclical uplift cast additional uncertainty over future market adjustments in terms of severity and timing. Uncertainty about the state of the property market and its response to interest rate changes by the Reserve Bank remains a risk to Budget formulation given the potential for market sentiment to change suddenly.
8

Table 1.5: Policy measures since 2003-04 Budget
Portfolio 2003-04 2004-05 2005-06 2006-07$m $m $m $m
Premier and CabinetFinal termination payment for former chief executive of Department of the Premier and Cabinet
-0.9 – – –
Installation of solar panels at Parliament House -0.2 – – –-1.1 0.0 0.0 0.0
Business, Investment and TradeSafety Improvements - Adelaide Street Circuit -1.0 – – –
-1.0 0.0 0.0 0.0Treasury and FinanceProvision of allowances for members of the Independent Gambling Authority
-0.1 -0.1 -0.1 -0.1
Additional staff resources for the House of Assembly Whips -0.1 -0.1 -0.1 -0.1-0.2 -0.2 -0.2 -0.2
JusticeAdditional resourcing to support the "Bodies-in-the-Barrels" Murders Case
-4.6 -1.1 – –
Contribution to the National Aerial Firefighting Strategy -0.5 -0.5 -0.5 -0.5Additional resourcing to support the Commonwealth gun buy back program
-0.4 – – –
Extension of a temporary magistrate appointment -0.1 – – –Expansion of CFS Safety Awareness Programs -0.1 – – –Additional resourcing for country police and courts facilities -0.2 0.9 -0.8 -0.9Additional resourcing for SA Police -1.5 -9.0 -16.8 -18.8Additional resourcing for Director of Public Prosecutions -0.5 -0.5 -0.5 -0.5
-7.9 -10.2 -18.6 -20.7Primary Industries and ResourcesEnergy Efficiency Program for low-income households -1.0 -1.0 – –SA Water Drought Strategy - rebate scheme -2.2 – – –Restructure of the commercial river fishery - ex-gratia payments -2.7 – – –National Livestock Identification Programs in South Australia: revised assistance package
2.2 1.4 1.5 -1.2
-3.7 0.4 1.5 -1.2Administrative and Information ServicesResources to implement minimum standards code of practice within public call centres
-0.1 -0.1 -0.1 -0.1
Placement of an executive returning from the asset sales team – -0.2 -0.2 -0.2-0.1 -0.3 -0.3 -0.3
Human ServicesPublic Sector Visiting Medical Specialists - enterprise agreement -2.9 -1.1 -1.5 -1.5Additional Home and Community Care (HACC) resourcing -1.9 -1.9 -1.9 -1.9Public Sector Salaried Medical Officers - enterprise agreement -19.3 -7.0 -4.7 -4.7Additional resourcing for Family and Youth Services -2.1 -3.6 -3.6 -3.6Response to critical issues in Supported Residential Facilities -9.9 -10.2 -10.5 -10.8Enhanced electricity concessions for pensioners and seniors -19.5 -12.6 -12.9 -13.3Resourcing to support increased pensioner remissions associated with increased water rates
– -0.7 -0.7 -0.7
Kapunda Hospital and Homes Development: revised budget funding -1.0 -0.5 – –Women's and Children's Hospital Emergency Department Redevelopment: revised budget funding
1.0 -1.9 -0.6 –
-55.6 -39.5 -36.4 -36.5
9

Portfolio 2003-04 2004-05 2005-06 2006-07$m $m $m $m
Education and Children's ServicesIndexation supplementation for the material services charge at government schools
-0.2 -0.3 -0.3 -0.3
Reopen Swallowcliffe Village Children's centre:revised timing -0.3 0.1 0.2 –Additional funding to support the 2004 Global Budget for Schools -1.0 -2.0 -2.0 -2.0
-1.5 -2.2 -2.1 -2.3Environment and Conservation and the River MurrayRiver Murray Environmental Flows Fund: revised timing -0.6 -3.4 4.0 –Additional support for the Botanic Wine and Rose Development -0.2 – – –Reversal of savings initiative - "Reducing the level of assessments including hydrogeological assessments"
-0.3 -0.3 -0.3 -0.3
Payroll tax subsidies provided to Catchment Water Boards -0.2 – – –-1.3 -3.7 3.7 -0.3
Transport and Urban PlanningAdditional public transport safety and security initiatives -1.6 – – –Port River Expressway: revised costings 5.0 -0.5 -15.0 -0.4Adelaide Light Rail Project: conversion from lease to direct ownership -3.2 -6.4 -15.8 3.1Procurement of new plant fleet: revised timing 5.7 -5.7 – –Investment in energy efficient measures at Transport SA's Walkerville site
-0.8 0.2 0.4 0.2
5.1 -12.4 -30.8 2.7TourismAssistance for public liability insurance for the heritage rail and tram -0.1 – – –sector
-0.1 0.0 0.0 0.0OtherSale of land for the Port Waterfront Redevelopment 1.9 0.1 0.1 0.1Sale of ex Ports Corporation land 2.5 – – –Reduction in SA Water contribution due to water conservation measures
-1.4 -1.4 -1.4 -1.4
Sale of former railway land at Mile End 1.0 – – –4.0 -1.3 -1.3 -1.3
TOTAL -63.4 -69.4 -84.5 -60.1
10
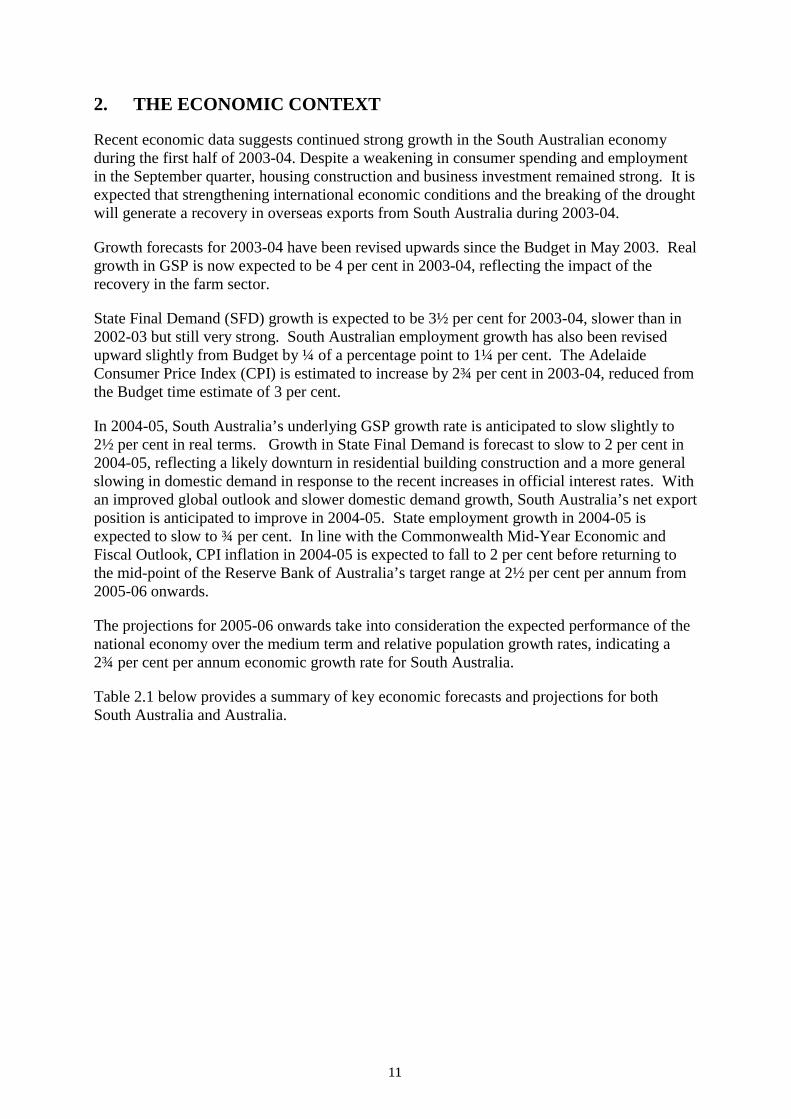
2. THE ECONOMIC CONTEXT
Recent economic data suggests continued strong growth in the South Australian economy during the first half of 2003-04. Despite a weakening in consumer spending and employment in the September quarter, housing construction and business investment remained strong. It is expected that strengthening international economic conditions and the breaking of the drought will generate a recovery in overseas exports from South Australia during 2003-04.
Growth forecasts for 2003-04 have been revised upwards since the Budget in May 2003. Real growth in GSP is now expected to be 4 per cent in 2003-04, reflecting the impact of the recovery in the farm sector.
State Final Demand (SFD) growth is expected to be 3½ per cent for 2003-04, slower than in 2002-03 but still very strong. South Australian employment growth has also been revised upward slightly from Budget by ¼ of a percentage point to 1¼ per cent. The Adelaide Consumer Price Index (CPI) is estimated to increase by 2¾ per cent in 2003-04, reduced from the Budget time estimate of 3 per cent.
In 2004-05, South Australia’s underlying GSP growth rate is anticipated to slow slightly to 2½ per cent in real terms. Growth in State Final Demand is forecast to slow to 2 per cent in 2004-05, reflecting a likely downturn in residential building construction and a more general slowing in domestic demand in response to the recent increases in official interest rates. With an improved global outlook and slower domestic demand growth, South Australia’s net export position is anticipated to improve in 2004-05. State employment growth in 2004-05 is expected to slow to ¾ per cent. In line with the Commonwealth Mid-Year Economic and Fiscal Outlook, CPI inflation in 2004-05 is expected to fall to 2 per cent before returning to the mid-point of the Reserve Bank of Australia’s target range at 2½ per cent per annum from 2005-06 onwards.
The projections for 2005-06 onwards take into consideration the expected performance of the national economy over the medium term and relative population growth rates, indicating a 2¾ per cent per annum economic growth rate for South Australia.
Table 2.1 below provides a summary of key economic forecasts and projections for both South Australia and Australia.
11

Table 2.1: Key Economic Assumptions – Australia and South Australia Real Growth Rates (% per annum)
2002-03 2003-04 2003-04 2004-05 2005-06 2006-07
Actual Budget Forecast
RevisedForecast
Forecast Projection Projection
Australia
GDP 2.8 3¼ 3¾ 3½ 3½ 3½
Domestic Final Demand 6.3 3 4½ n.a. n.a. n.a.
Employment 2.5 1¾ 1½ 1¾ 1½ 1½
CPI 3.1 2¾ 2¼ 2 2½ 2½
South Australia
GSP 0.1 2½ 4 2½ 2¾ 2¾
State Final Demand 7.9 2 3½ 2 2¾ 2¾
Employment 2.9 1 1¼ ¾ 1 1
CPI 4.0 3 2¾ 2 2½ 2½ Sources: Australian Bureau of Statistics, Commonwealth Mid Year Economic and Fiscal Outlook 2003-04, South Australian Department of Treasury and Finance.
12

APPENDIX A
3. UNIFORM PRESENTATION FRAMEWORK TABLES
Table A.1 General Government Sector Operating Statement__________________________________________________________________________________________________________________________________________________________________________________________________________
2003-04Budget
$m
2003-04Estimated
Result$m
2004-05Estimate
$m
2005-06Estimate
$m
2006-07Estimate
$m
GFS revenue (a)Taxation revenue 2 463 2 653 2 687 2 716 2 828Current grants and subsidies 4 729 4 749 4 938 5 172 5 384Capital grants 166 168 153 138 145Sales of goods and services 952 977 1 004 1 031 1 040Interest income 123 123 130 142 160Other 729 733 714 659 612
Total revenue 9 161 9 403 9 627 9 858 10 169lessGFS expenses (b)Gross operating expenses Employee expenses 4 087 4 176 4 229 4 374 4 469 Depreciation 410 405 411 426 428 Other operating expenses 2 481 2 570 2 547 2 546 2 556Nominal superannuation interest expense 337 351 359 365 372Other interest expenses 249 251 257 265 269Other property expenses (c) — — — — — Current transfers (c) 1 516 1 541 1 617 1 700 1 669Capital transfers (c) 23 23 15 8 9
Total expenses 9 103 9 316 9 435 9 685 9 771equals
GFS net operating balance 58 87 191 173 397lessNet acquisition of non-financial assetsPurchases of non-financial assets 535 541 500 476 600less Sales of non-financial assets 49 55 36 23 18less Depreciation 410 405 411 426 428plus Change in inventories 2 2 — — — plus Other movements in non-financial assets — — — — —
equals Total net acquisition of non-financial assets 78 83 53 26 154equalsGFS net lending / borrowing (d) -20 4 138 147 243
(a) GFS revenue is not equal to AAS31 revenue. GFS revenue includes all (mutually agreed) transactions that increase net worth. Revaluations are not considered mutually agreed transactions, and so are excluded from GFS revenue.(b) GFS expenses are not equal to AAS31 expenses. AAS31 expenses include all transactions that decrease net worth, whereas GFS expenses exclude revaluations and other transactions not mutually agreed.(c) These line items are disaggregated further in ABS GFS reporting.(d) GFS net lending also equals net transactions in financial assets less net transactions in liabilities.
13

Table A.2 Public Non-financial Corporations (Public Trading Enterprises) SectorOperating Statement__________________________________________________________________________________________________________________________________________________________________________________________________________
2003-04Budget
$m
2003-04Estimated
Result$m
GFS revenue (a)Taxation revenue — — Current grants and subsidies 475 469Capital grants — 17Sales of goods and services 1 307 1 306Interest income 16 16Other 87 70
Total revenue 1 884 1 878lessGFS expenses (b)Gross operating expenses Employee expenses 210 209 Depreciation 204 203 Other operating expenses 1 011 1 015Nominal superannuation interest expense — — Other interest expenses 142 130Other property expenses (c) 346 356Current transfers (c) 13 13Capital transfers (c) 6 5
Total expenses 1 931 1 930equalsGFS net operating balance -47 -52
lessNet acquisition of non-financial assetsPurchases of non-financial assets 374 367less Sales of non-financial assets 111 108less Depreciation 204 203plus Change in inventories — — plus Other movements in non-financial assets — —
equals Total net acquisition of non-financial assets 59 57equals
GFS net lending / borrowing (d) -106 -109
(a) GFS revenue is not equal to AAS31 revenue. GFS revenue includes all (mutually agreed) transactions that increase net worth. Revaluations are not considered mutually agreed transactions, and so are excluded from GFS revenue.(b) GFS expenses are not equal to AAS31 expenses. AAS31 expenses include all transactions that decrease net worth, whereas GFS expenses exclude revaluations and other transactions not mutually agreed.(c) These line items are disaggregated further in ABS GFS reporting.(d) GFS net lending also equals net transactions in financial assets less net transactions in liabilities.
14

Table A.3 Non-financial Public Sector Operating Statement__________________________________________________________________________________________________________________________________________________________________________________________________________
2003-04Budget
$m
2003-04Estimated
Result$m
GFS revenue (a)Taxation revenue 2 287 2 480Current grants and subsidies 4 729 4 750Capital grants 166 185Sales of goods and services 2 108 2 134Interest income 89 87Other 465 445
Total revenue 9 845 10 082lessGFS expenses (b)Gross operating expenses Employee expenses 4 243 4 336 Depreciation 614 608 Other operating expenses 3 212 3 305Nominal superannuation interest expense 337 351Other interest expenses 342 330Other property expenses (c) 5 6Current transfers (c) 1 053 1 085Capital transfers (c) 29 28
Total expenses 9 834 10 048equalsGFS net operating balance 11 34
lessNet acquisition of non-financial assetsPurchases of non-financial assets 909 904less Sales of non-financial assets 160 159less Depreciation 614 608plus Change in inventories 2 2plus Other movements in non-financial assets — —
equals Total net acquisition of non-financial assets 137 140equalsGFS net lending / borrowing (d) -126 -105
(a) GFS revenue is not equal to AAS31 revenue. GFS revenue includes all (mutually agreed) transactions that increase net worth. Revaluations are not considered mutually agreed transactions, and so are excluded from GFS revenue.(b) GFS expenses are not equal to AAS31 expenses. AAS31 expenses include all transactions that decrease net worth, whereas GFS expenses exclude revaluations and other transactions not mutually agreed.(c) These line items are disaggregated further in ABS GFS reporting.(d) GFS net lending also equals net transactions in financial assets less net transactions in liabilities.
15

Table A.4 General Government Sector Balance Sheet__________________________________________________________________________________________________________________________________________________________________________________________________________
2003-04Budget
$m
2003-04Estimated
Result$m
2004-05Estimate
$m
2005-06Estimate
$m
2006-07Estimate
$m
AssetsFinancial assets Cash and deposits 2 199 2 139 2 280 2 432 2 758 Advances paid 1 133 1 127 1 094 1 053 1 020 Investments, loans and placements 178 177 196 214 231 Other non-equity assets 301 253 255 257 268 Equity 10 227 10 510 10 626 10 850 11 099
Total financial assets 14 039 14 205 14 450 14 806 15 376Non-financial assets Land and fixed assets 11 142 11 755 11 804 11 870 12 060 Other non-financial assets 123 86 87 91 91
Total non-financial assets 11 265 11 841 11 891 11 960 12 151
Total assets 25 303 26 046 26 342 26 766 27 527
LiabilitiesDeposits held 386 332 377 398 444Advances received 764 752 747 740 726Borrowing 3 080 2 936 2 832 2 677 2 627Unfunded superannuation liability (a) 4 611 5 980 6 091 6 196 6 296Other employee entitlements and provisions 1 223 1 399 1 379 1 411 1 437Other non-equity liabilities 912 727 718 735 746
Total liabilities 10 976 12 126 12 144 12 157 12 275
Net worth 14 328 13 921 14 198 14 609 15 252
Net financial worth (b) 3 063 2 080 2 306 2 649 3 101Net debt (c) 719 577 385 116 -213
(a) Previous financial releases were published as 'Superannuation liability' and included accrued superannuation contributions which have now been re-classified as 'Other employee entitlements and provisions'.(b) Net financial worth equals total financial assets minus total liabilities.(c) Net debt equals the sum of deposits held, advances received and borrowing, minus the sum of cash and deposits, advances paid, and investments, loans and placements.
16

Table A.5 Public Non-financial Corporations (Public Trading Enterprises) SectorBalance Sheet__________________________________________________________________________________________________________________________________________________________________________________________________________
2003-04Budget
$m
2003-04Estimated
Result$m
AssetsFinancial assets Cash and deposits 184 205 Advances paid 32 19 Investments, loans and placements 16 12 Other non-equity assets 173 183 Equity 33 21
Total financial assets 438 441Non-financial assets Land and fixed assets 12 198 12 515 Other non-financial assets 40 44
Total non-financial assets 12 238 12 560
Total assets 12 676 13 001
LiabilitiesDeposits held 9 9Advances received 956 957Borrowing 1 454 1 401Unfunded superannuation liability (a) 2 — Other employee entitlements and provisions 70 67Other non-equity liabilities 351 368
Total liabilities 2 842 2 801
Net worth 9 834 10 199
Net financial worth (b) -2 404 -2 361Net debt (c) 2 186 2 129
(a) Previous financial releases were published as 'Superannuation liability' and included accrued superannuation contributions which have now been re-classified as 'Other employee entitlements and provisions'.(b) Net financial worth equals total financial assets minus total liabilities.(c) Net debt equals the sum of deposits held, advances received and borrowing, minus the sum of cash and deposits, advances paid, and investments, loans and placements.
17
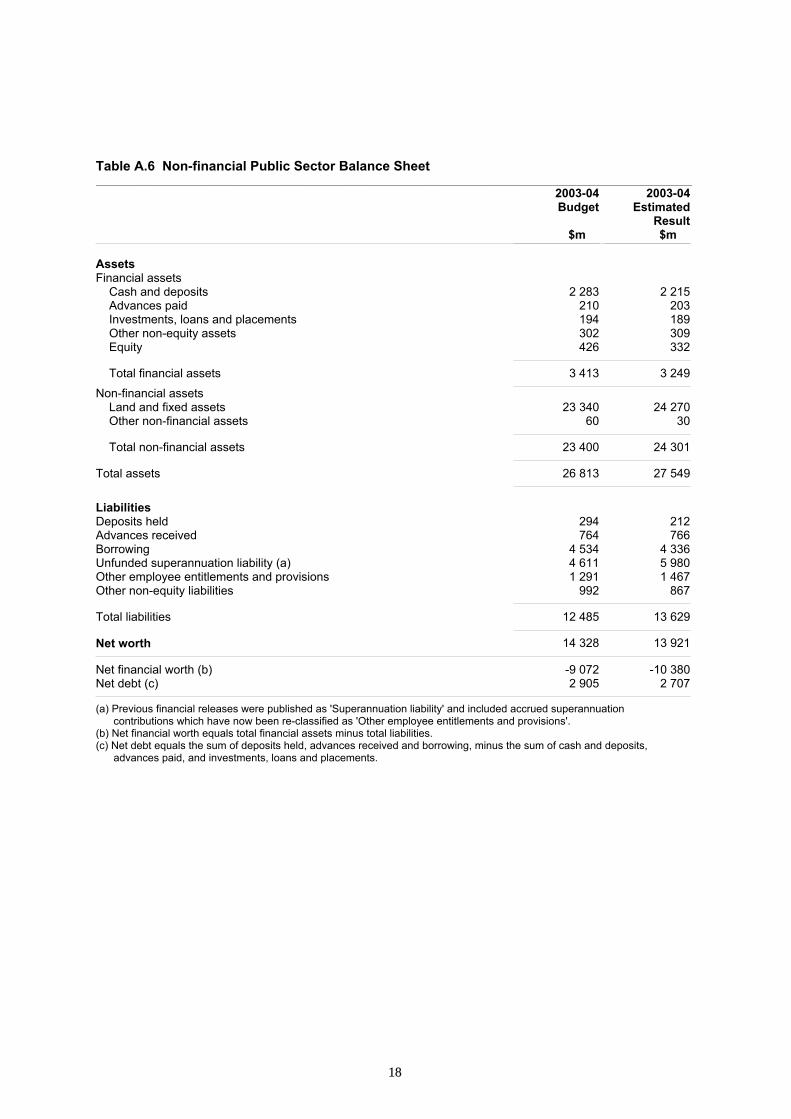
Table A.6 Non-financial Public Sector Balance Sheet__________________________________________________________________________________________________________________________________________________________________________________________________________
2003-04Budget
$m
2003-04Estimated
Result$m
AssetsFinancial assets Cash and deposits 2 283 2 215 Advances paid 210 203 Investments, loans and placements 194 189 Other non-equity assets 302 309 Equity 426 332
Total financial assets 3 413 3 249Non-financial assets Land and fixed assets 23 340 24 270 Other non-financial assets 60 30
Total non-financial assets 23 400 24 301
Total assets 26 813 27 549
LiabilitiesDeposits held 294 212Advances received 764 766Borrowing 4 534 4 336Unfunded superannuation liability (a) 4 611 5 980Other employee entitlements and provisions 1 291 1 467Other non-equity liabilities 992 867
Total liabilities 12 485 13 629
Net worth 14 328 13 921
Net financial worth (b) -9 072 -10 380Net debt (c) 2 905 2 707
(a) Previous financial releases were published as 'Superannuation liability' and included accrued superannuation contributions which have now been re-classified as 'Other employee entitlements and provisions'.(b) Net financial worth equals total financial assets minus total liabilities.(c) Net debt equals the sum of deposits held, advances received and borrowing, minus the sum of cash and deposits, advances paid, and investments, loans and placements.
18

Table A.7 General Government Sector Cash Flow Statement__________________________________________________________________________________________________________________________________________________________________________________________________________
2003-04Budget
$m
2003-04Estimated
Result$m
2004-05Estimate
$m
2005-06Estimate
$m
2006-07Estimate
$m
Cash receipts from operating activitiesTaxes received 2 463 2 655 2 689 2 718 2 829Receipts from sales of goods and services 965 994 1 015 1 041 1 048Grants/subsidies received 4 839 4 881 5 066 5 308 5 527Other receipts 821 818 825 775 745
Total receipts 9 089 9 348 9 596 9 841 10 148
Cash payments for operating activitiesPayment for goods and services -6 893 -7 080 -7 222 -7 350 -7 480Grants and subsidies paid -1 366 -1 395 -1 419 -1 463 -1 429Interest paid -239 -248 -255 -262 -266Other payments -25 -26 -28 -30 -29
Total payments -8 522 -8 749 -8 923 -9 105 -9 204
Net cash flows from operating activities 566 599 673 736 944
Net cash flows from investmentsin non-financial assetsSales of non-financial assets 49 55 36 23 18Purchases of non-financial assets (a) -532 -538 -498 -474 -598
Net cash flows from investments -484 -483 -462 -450 -580in non-financial assets
Net cash flows from investments in financialassets for policy purposes (b) 24 23 37 48 13
Net cash flows from investments in financialassets for liquidity purposes -8 -8 -15 -12 -10
Net cash flows from financing activitiesAdvances received (net) -13 -13 -13 -13 -13Borrowing (net) 26 -32 -127 -183 -77Deposits received (net) -60 -32 45 21 45Dividends paid — — — — — Other financing (net) -9 -9 — — —
Net cash flows from financing activities -57 -87 -96 -175 -45
Net increase / decrease in cash held 42 43 137 147 322
Net cash from operating activitiesand investments in non-financial assets 83 116 211 286 365Distributions paid — — — — — Finance leases and similar arrangements (c) — — — — — Surplus / deficit 83 116 211 286 365
(a) The ABS disaggregates this item into new and secondhand non-financial assets.(b) Includes equity acquisitions, disposals and privatisations (net).(c) Finance leases are shown as a negative as they are deducted in compiling the surplus/deficit.
19

Table A.8 Public Non-financial Corporations (Public Trading Enterprises) SectorCash Flow Statement__________________________________________________________________________________________________________________________________________________________________________________________________________
2003-04Budget
$m
2003-04Estimated
Result$m
Cash receipts from operating activitiesTaxes received — — Receipts from sales of goods and services 1 329 1 326Grants/subsidies received 475 469Other receipts 49 49
Total receipts 1 853 1 845
Cash payments for operating activitiesPayment for goods and services -1 028 -1 026Grants and subsidies paid -28 -28Interest paid -146 -136Other payments -186 -187
Total payments -1 388 -1 377
Net cash flows from operating activities 465 468
Net cash flows from investmentsin non-financial assetsSales of non-financial assets 111 108Purchases of non-financial assets (a) -356 -350
Net cash flows from investments in non-financial assets -245 -242
Net cash flows from investments in financialassets for policy purposes (b) 1 -3
Net cash flows from investments in financialassets for liquidity purposes -4 -3
Net cash flows from financing activitiesAdvances received (net) -32 -32Borrowing (net) 84 77Deposits received (net) — — Dividends paid -332 -331Other financing (net) — —
Net cash flows from financing activities -279 -287
Net increase / decrease in cash held -63 -68
Net cash from operating activities and investmentsin non-financial assets 220 225Distributions paid 332 331Finance leases and similar arrangements (c) — — Surplus / deficit -112 -106
(a) The ABS disaggregates this item into new and secondhand non-financial assets.(b) Includes equity acquisitions, disposals and privatisations (net).(c) Finance leases are shown as a negative as they are deducted in compiling the surplus/deficit.
20

Table A.9 Non-financial Public Sector Cash Flow Statement __________________________________________________________________________________________________________________________________________________________________________________________________________
2003-04Budget
$m
2003-04Estimated
Result$m
Cash receipts from operating activitiesTaxes received 2 287 2 480Receipts from sales of goods and services 2 147 2 173Grants/subsidies received 4 841 4 882Other receipts 478 477
Total receipts 9 753 10 013
Cash payments for operating activitiesPayment for goods and services -7 691 -7 965Grants and subsidies paid -920 -955Interest paid -336 -333Other payments -106 -26
Total payments -9 053 -9 278
Net cash flows from operating activities 700 735
Net cash flows from investmentsin non-financial assetsSales of non-financial assets 160 159Purchases of non-financial assets (a) -889 -884
Net cash flows from investments in non-financial assets -729 -725
Net cash flows from investments in financialassets for policy purposes (b) -7 -13
Net cash flows from investments in financialassets for liquidity purposes -12 -11
Net cash flows from financing activitiesAdvances received (net) -13 -13Borrowing (net) 111 44Deposits received (net) — — Dividends paid — — Other financing (net) -9 -9
Net cash flows from financing activities 88 22
Net increase / decrease in cash held 39 8
Net cash from operating activities and investmentsin non-financial assets -29 10Distributions paid — — Finance leases and similar arrangements (c) — — Surplus / deficit -29 10
(a) The ABS disaggregates this item into new and secondhand non-financial assets.(b) Includes equity acquisitions, disposals and privatisations (net).(c) Finance leases are shown as a negative as they are deducted in compiling the surplus/deficit.
21

Table A.10 General Government Sector Taxes__________________________________________________________________________________________________________________________________________________________________________________________________________
2003-04Budget
$m
2003-04Estimated
Result$m
Taxes on employers' payroll and labour force 678 694
Taxes on propertyLand taxes 187 202Stamp duties on financial and capital transactions 424 567Financial institutions' transaction taxes 60 60Other (a) 113 114
Total 784 942Taxes on the provision of goods and servicesExcises and levies 5 5Taxes on gambling 372 377Taxes on insurance 271 272
Total 647 655Taxes on use of goods and performance of activitiesMotor vehicle taxes 354 362Other — —
Total 354 362
Total GFS taxation revenue 2 463 2 653
(a) Excludes taxes paid by general government units.
22

Table A.11: Reconciliation of general government net worth
2003-04 2003-04 2004-05 2005-06 2006-07Budget Estimated
ResultEstimate Estimate Estimate
$m $m $m $m $m
Net worth at beginning of year 14 288 15 288 13 921 14 198 14 609
Change in net worth from operating transactions:Net Operating Balance 58 87 191 173 397
Change in net worth from other economic flows:Movement in retained earnings of PFCs 13 13 8 98 127Revaluations of investments in PNFCs 17 11 110 128 122Revaluation of superannuation liability 5 -1 418 5 6 7Other revaluation adjustments -54 -60 -36 6 -12
SubtotalTotal other economic flows - 18 -1 453 86 238 245
Net worth at year end 14 328 13 921 14 198 14 609 15 252
23

4. GENERAL GOVERNMENT TIME SERIES
1998-99 1999-2000 2000-01 2001-02 2002-03Outcome Outcome Outcome Outcome Outcome
$m $m $m $m $m
GFS RevenueTaxation revenue 2 433 2 748 2 197 2 193 2 431Current grants and subsidies 2 875 3 098 3 992 4 485 4 638Sales of goods and services 733 696 982 902 997Interest income 143 215 169 131 146Other 1 034 888 768 827 925
Total revenue 7 218 7 644 8 108 8 538 9 346lessGFS Expenses
Gross operating expenses 5 296 5 694 6 216 6 489 6 524Nominal superannuation interest expense 277 274 248 244 299Other interest expenses 643 601 353 272 297Other property expenses — — — — —Current transfers 1 213 1 345 1 545 1 663 1 724Capital transfers 76 59 43 44 54
Total expenses 7 505 7 974 8 406 8 713 8 898equalsGFS Net operating balance -287 -330 -297 -174 448lessNet acquisition of non-financial assets
Gross fixed capital formation 364 478 427 337 433less Depreciation 323 337 322 390 401plus Change in inventories -2 — -3 3 —
plus Other movements in non-financial assets-21 — — — —
equals Total net acquisition of non-financial assets
19 140 102 -50 34
equalsGFS net lending/borrowing -306 -471 -399 -124 414
24