MID-TERM FOLLOW-UP ASSESSMENT OF A DISAGGREGATE LAND USE MODEL Stewart Berry, Srinivasan Sundarum, &...
36
MID-TERM FOLLOW-UP ASSESSMENT OF A DISAGGREGATE LAND USE MODEL Stewart Berry, Srinivasan Sundarum, & Howard Slavin Caliper Corporation 2011
-
Upload
shannon-frederick-may -
Category
Documents
-
view
214 -
download
0
Transcript of MID-TERM FOLLOW-UP ASSESSMENT OF A DISAGGREGATE LAND USE MODEL Stewart Berry, Srinivasan Sundarum, &...

MID-TERM FOLLOW-UP ASSESSMENT OF A DISAGGREGATE LAND USE MODEL
Stewart Berry, Srinivasan Sundarum, &Howard Slavin
Caliper Corporation2011

Introduction
• In 2006 we developed a
microsimulation model that forecast demographics and land use for Clark County, NV.
• The model and a short-term assessment were presented at previous TRB Planning Applications Conferences
• We now evaluate its predictions several years later to see if they are obsolete or delayed

STEP3 Model Characteristics
• Microsimulation• Landuse models• Choice models• GIS implementation• Cell based zones• Population aging
Model Basics
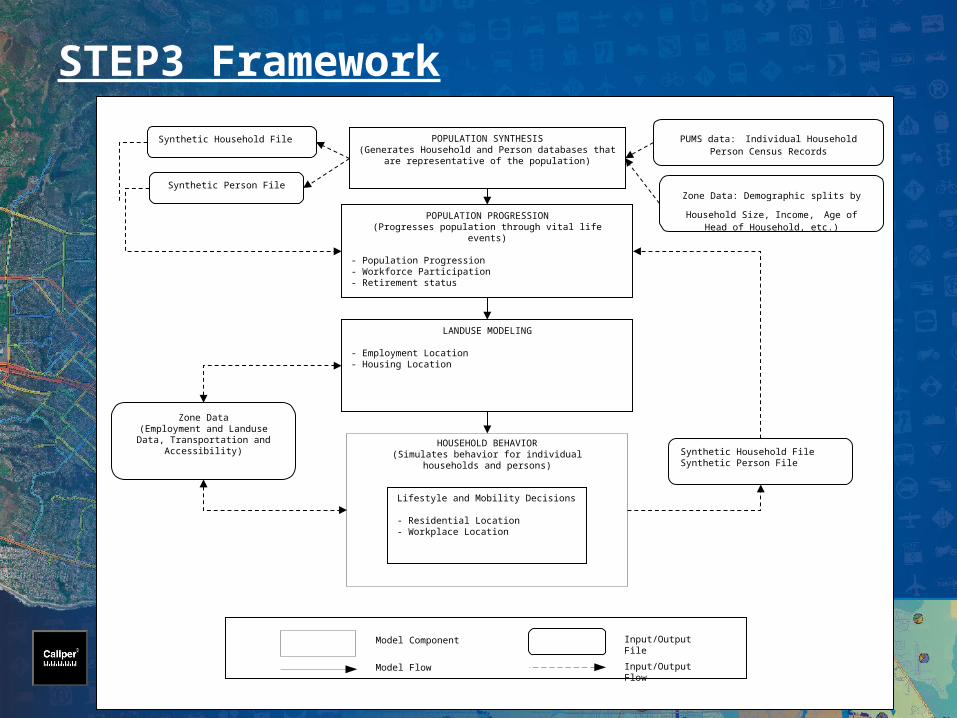
STEP3 Framework
HOUSEHOLD BEHAVIOR(Simulates behavior for individual households and
persons)
Zone Data(Employment and Landuse
Data, Transportation and Accessibility)
POPULATION SYNTHESIS(Generates Household and Person databases that are
representative of the population)
POPULATION PROGRESSION(Progresses population through vital life events)
- Population Progression- Workforce Participation- Retirement status
Model Component
Model Flow
Input/Output File
Input/Output Flow
LANDUSE MODELING
- Employment Location- Housing Location
Zone Data: Demographic splits by Household
Size, Income, Age of Head of Household, etc.)
PUMS data: Individual Household Person Census Records
Synthetic Person File
Synthetic Household File
Lifestyle and Mobility Decisions
- Residential Location- Workplace Location
Synthetic Household FileSynthetic Person File

Output
• Four STEP3 scenarios – High growth with extensive urban
dispersion – High growth with constrained urban
dispersion – Lower growth with extensive urban
dispersion – Lower growth with constrained dispersion

Population Progression

Aging, Mortality and Births
• Age by 1 year• Education of children is increased• Income and wages increase• Death rates are applied• Birth rates are applied

Household Formation
• Leave home at age 22
– Vehicles, employment & income are calculated
• Divorce– Income & vehicles are split; children are
assigned using custody probability
• Marriage– Single men are identified & potential
brides are searched for based on age
Migration
• Regional in- and out- migration is
modeled using rates from IRS tax returns
• Intra-county migration is modeled using rates from the 2000 Census

Labor Force
• Worker
– Determined by gender, age, race, marital status & children by age
• Retired– If aged 65+, retirement status is
determined by gender, age & household structure
• Unemployed– Determined using published Clark County
rates

Land Use Modeling
External Inputs
• The user can add residential and
employment buildings:– Construction year– The number of owner/renter units– The number of jobs in 7 sectors:
• Hotel• Office• Industrial• Regional Retail• Community Retail• Neighborhood Retail• Other Non-Retail

Post-2000 Development Layer
Undevelopable Land
• Undevelopable land restricts growth:
– Military installations– Airports– Water bodies– Parks– Steep gradient – Constrained lands
Residential Cell Growth
• The user can increase or decrease
settlement sprawl and density• A cell can be developed when it:
– Has developable land– Has 2 neighboring cells with 919 people in
each– Is not a group quarters cell

Cell Characteristics Influencing Urban Growth

Employment Seeds
• Non-retail employment grows using:
– Future landuse layer– Fixed growth
• Retail employment grows using: – “Hot-spots” that identify areas where
there is high population but little retail

Locational Choices

Hotel Workers
• Choose work zone first• Employment preferences:
– CBD – Strip– High employment zones
• Residence preferences:– Income– Owner or renter status– Travel time to work– Number of units available

Non-Hotel Workers
• Choose residence zone first• Residence preferences:
– Income– Owner or renter status– Average travel time to work– Number of units available
• Employment preferences:– CBD – Strip– Closeness to home zone– Vehicle & transit travel times & costs
Demographics, Projections and Estimates
Population Forecasting Problems
• Likelihood of low and high variants? • Vital statistics as linear trends• Even stochastic models handling
cyclical behavior cannot predict abrupt changes
• Predictions at the micro-scale can deviate wildly from reality
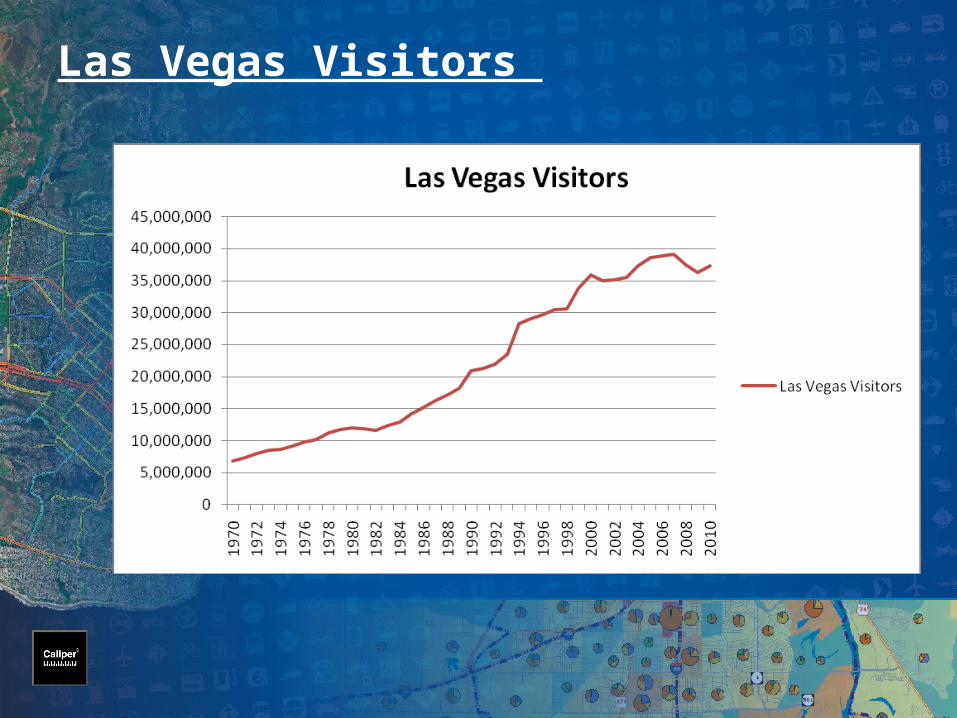
Las Vegas Visitors
Las Vegas Valley
• Visitors below peak levels• Population growth slow• Unemployment up• Immigration decrease

Assessment

STEP3 Results
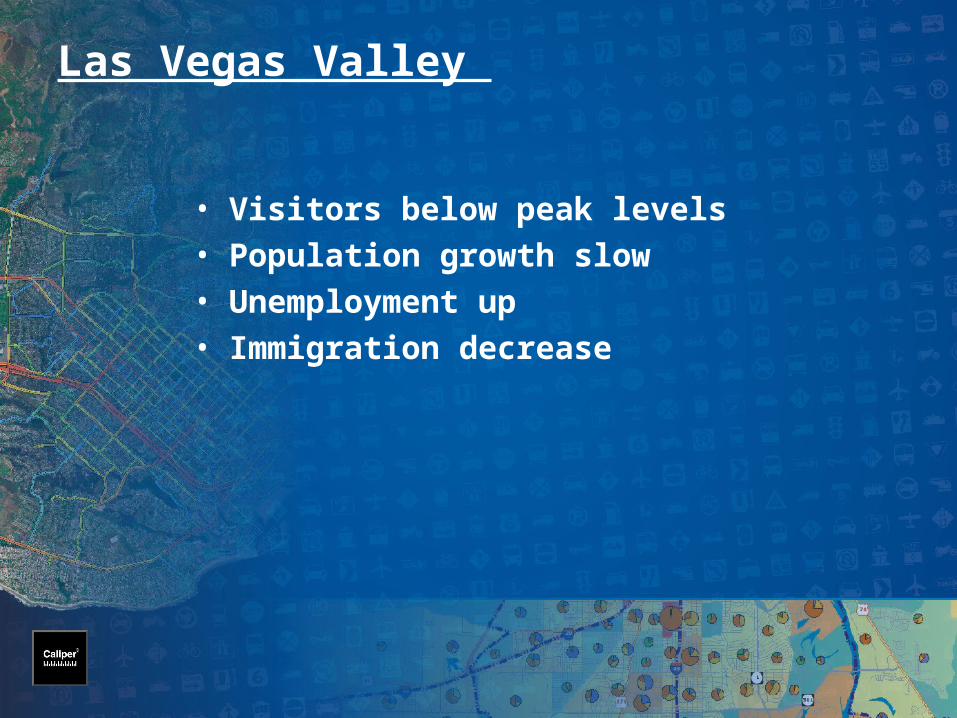
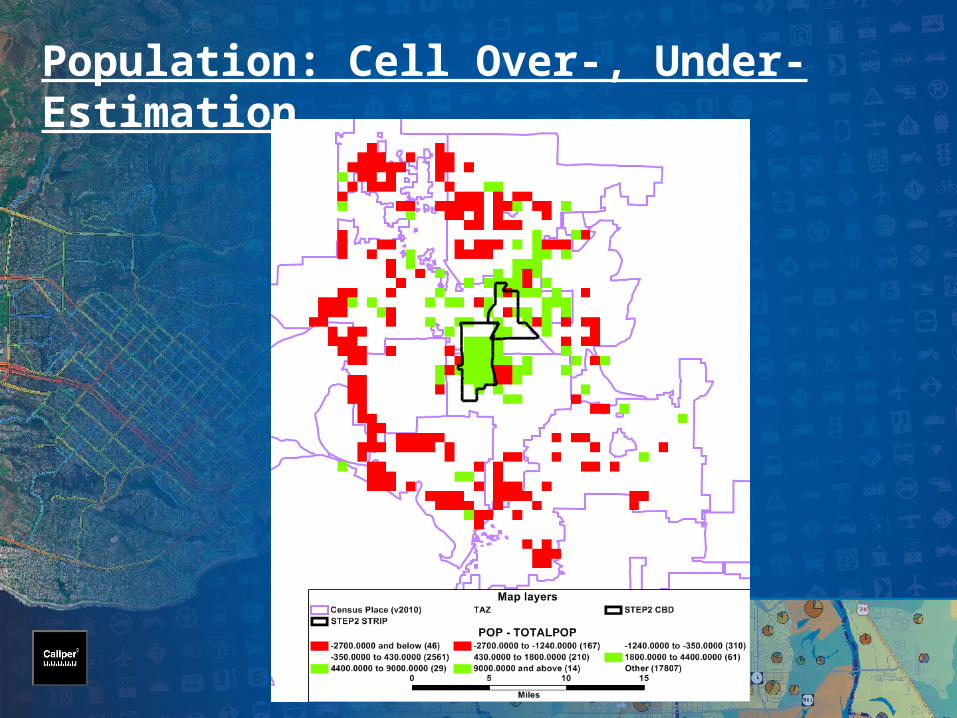
• Population overestimates at the
county level• Significant Place-scale variations • Effects of the down-turn missed• Forecasted year-on-year increases
will further deviate from reality• Unrealized & unanticipated
construction projects lead to distortions of employment and residence locations

Fortunately, we didn’t model real estate prices or developer behavior


Deviations From Projected Number of Residential Units
Population: Cell Over-, Under- Estimation
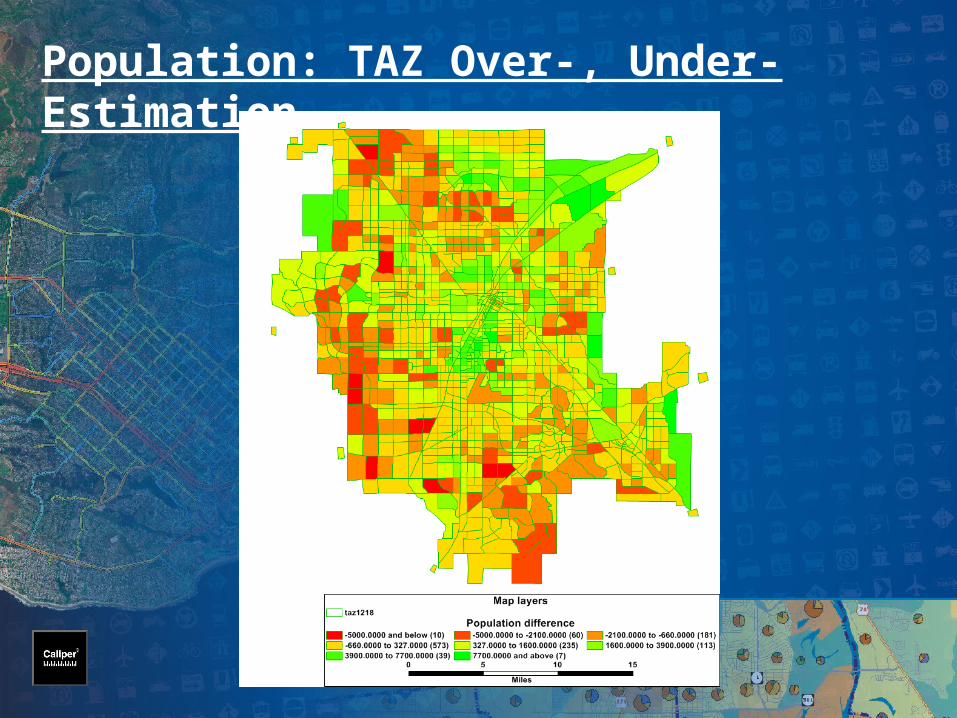
Population: TAZ Over-, Under- Estimation
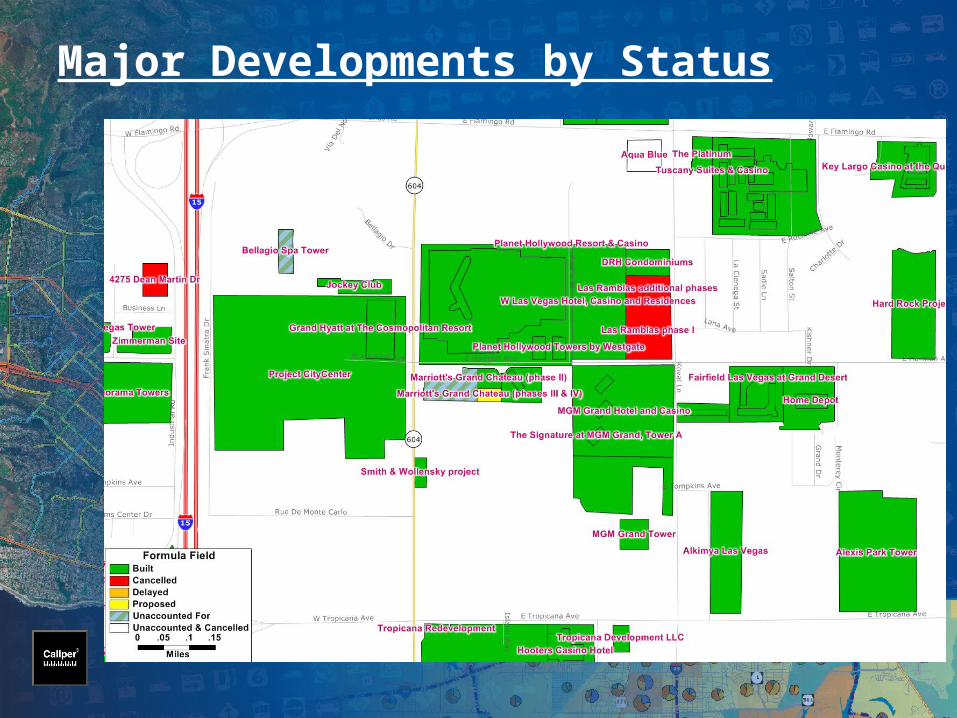
Major Developments by Status

Spatially-Flawed Relationships
• Overestimated the attractiveness of
the strip and CBD for work and residential proximity
• Suburban growth furthest from jobs and in the least affordable areas
• Spatial diversification of the gaming industry confounds local scale predictions
• Exogenous data unreliable– 7,474 housing units to be built (via major
projects) in Paradise by 2010, but which were either cancelled or delayed beyond 2010
Model Results Delayed or Obsolete?
• Employment, population growth, & visitor numbers are recovering
• Housing & employment below peak levels• Key model trend was immigration:
– dramatic decrease in US movers– below levels of international immigration– growth driven by natural increase
• Las Vegas is diversifying while providing urban services & infrastructure
• Unlikely that a resurgent economy would realign reality with model projections
Conclusion
• STEP3 failed to produce reasonable place-level forecasts
• The models were thwarted by the economy.
• The evidence suggests that it is very difficult to create long-range projections at the local level, and near-impossible on a micro-scale
• Perhaps such tools are better employed over shorter time periods