MID TERM ASSESSMENT PERFORMANCE REPORT - … · a) The actual revenue is R1, 790 billion (109%)...
61
Transcript of MID TERM ASSESSMENT PERFORMANCE REPORT - … · a) The actual revenue is R1, 790 billion (109%)...
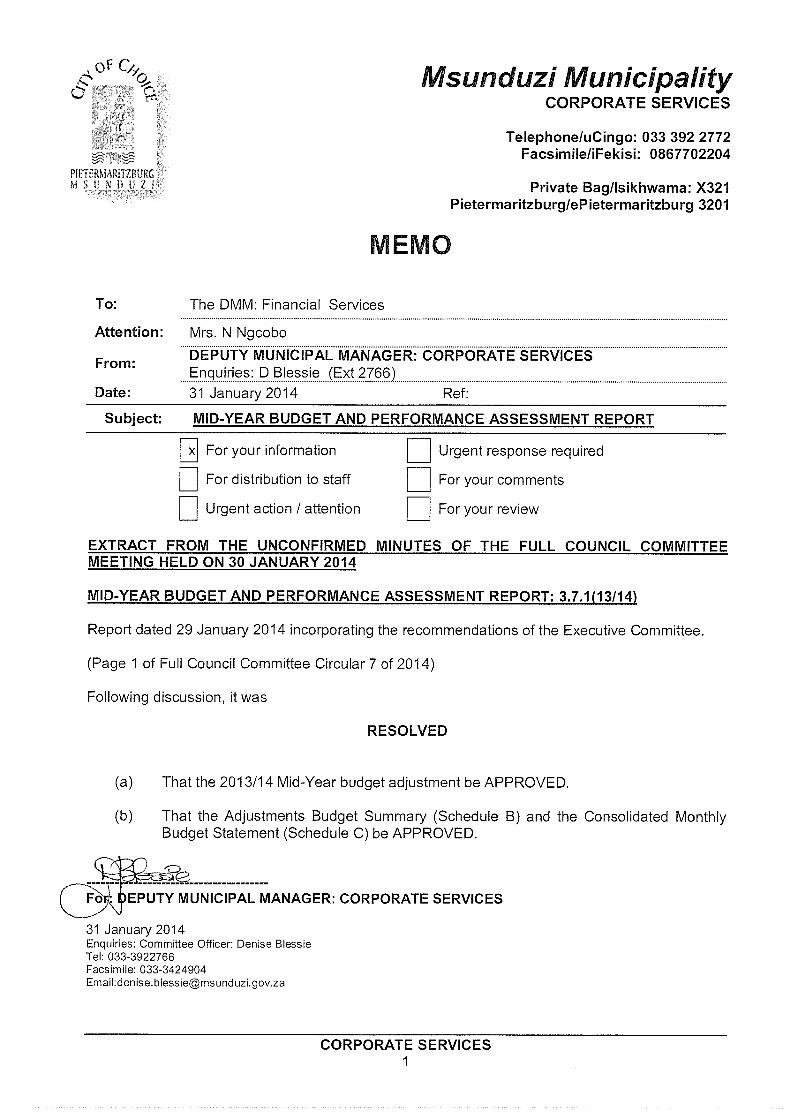
MSUNDUZI MUNICIPALITY 2013-2014 MID-TERM BUDGET AND PERFORMANCE ASSESSMENT REPORT
AS PER SECTION 72 OF MFMA
2013/2014 MFMA S72 MID-YEAR BUDGET AND PEFORMANCE ASSESMENT REPORT 1
MSUNDUZI MUNICIPALITY
2013/2014 MID-TERM BUDGET AND PERFORMANCE ASSESSMENT REPORT
Table of Contents
1. INTRODUCTION ................................................................................................................................ 2
2. 2013/2014 FINANCIAL YEAR OVERVIEW ............................................................................................. 2
3. 2012/2013 BUDGET GUIDELINES, ASSUMPTIONS AND PRIORITIES ..................................................... 3
4. OUTLINE OF THE MID-YEAR BUDGET AND FINANCIAL PERFORMANCE .............................................. 3
5. ADJUSTMENT BUDGET GUIDELINES, ASSUMPTIONS AND PRIORITIES ............................................... 8
6. RECOMMENDATION TO IMPROVE PERFORMANCE IN THE LAST HALF OF THE BUDGET FINANCIAL YEAR:……………………………………………………………………………………………………………………...10
7. RATINGS ON MID-TERM PERFORMANCE ASSESSMENT ..................................................................... 9
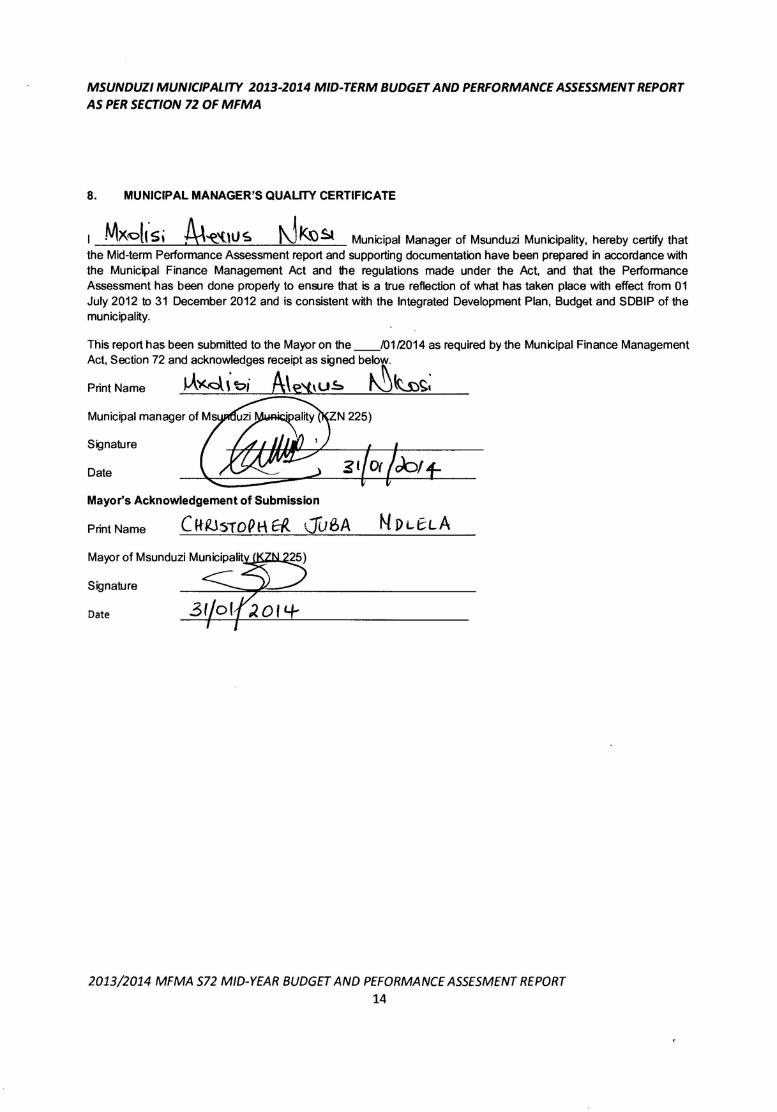
8. MUNICIPAL MANAGER’S QUALITY CERTIFICATE…………………………………………………………………14

MSUNDUZI MUNICIPALITY 2013-2014 MID-TERM BUDGET AND PERFORMANCE ASSESSMENT REPORT
AS PER SECTION 72 OF MFMA
2013/2014 MFMA S72 MID-YEAR BUDGET AND PEFORMANCE ASSESMENT REPORT 2
1. INTRODUCTION As instructed by the Local Government: Municipal Finance Management Act No.56 of 2009, Chapter 8 on roles of municipal officials, section 72, states that the Accounting Officer must assess the half yearly performance of the municipality and this is required to be done by the 25th of January every year to be submitted to the Mayor, National and Provincial Treasuries.
2. 2013/2014 FINANCIAL YEAR OVERVIEW
The implementation of the Msunduzi Municipality Service Delivery and Budget Implementation Plan on the revised IDP is the main guiding document during the first six months of the budget year. The municipal strategic objectives and priorities were translated into programmes and projects which gave the basis of configuration of the mid-term budget.
a. The draft MTREF (Medium-Term Revenue and Expenditure Framework) for 2013/2014 –
2014/2015 was tabled and adopted by the municipal Council during month of April 2013;
2.1. Public participation and stakeholder consultative processes were undertaken during the month of March and again in December 2013 reporting the performance of the Municipality.
2.2. The final budget was approved on 31th of May 2013 with amendments taking into account the inputs and
comments received during the public participation and consultative process;
2.3. The implementation on the 2013/2014 budget for the first half of the financial year has been affected by a number of the challenges in terms tariffs adjustments and reinstatement of revenue figures due estimations , but despite that the following has been achieved;
2.3.1. Revenue enhancement strategy;
a) More than 95% collection of municipal amounts billed; b) Implementation of amnesty debt collection strategy; c) Intervention by Provincial treasury to expedite collection of government debt; d) Consolidation of accounts to eliminate billing duplication and streamline collection; e) Updating the name changes to reduce the rate of returning males ; f) Reducing estimations by correcting structural faults on meters; g) Aggressive implementation of disconnections; h) Actively monitoring of illegal connections.
2.3.2. Implementations of certain capital projects funded from internal funding process have been
prioritized, including the new electricity connections to houses.
2.3.3. The Msunduzi Municipality has set itself a target of implementing 80 programs for 2013/2014 which are aligned to the IDP’s Reviewed Priorities. This includes the following projects:
1. Electrification - R123 million 2. Public Transport Infrastructure - R100.8 million 3. Replacement of Fleet - R31.7 million 4. Reduction of Non- Revenue Water - R15 million 5. Copesville Reservoir - R10 million 6. Rehabilitation of Sanitation Infrastructure - R10 million
7. Network Refurbishment - R10 million
MSUNDUZI MUNICIPALITY 2013-2014 MID-TERM BUDGET AND PERFORMANCE ASSESSMENT REPORT
AS PER SECTION 72 OF MFMA
2013/2014 MFMA S72 MID-YEAR BUDGET AND PEFORMANCE ASSESMENT REPORT 3
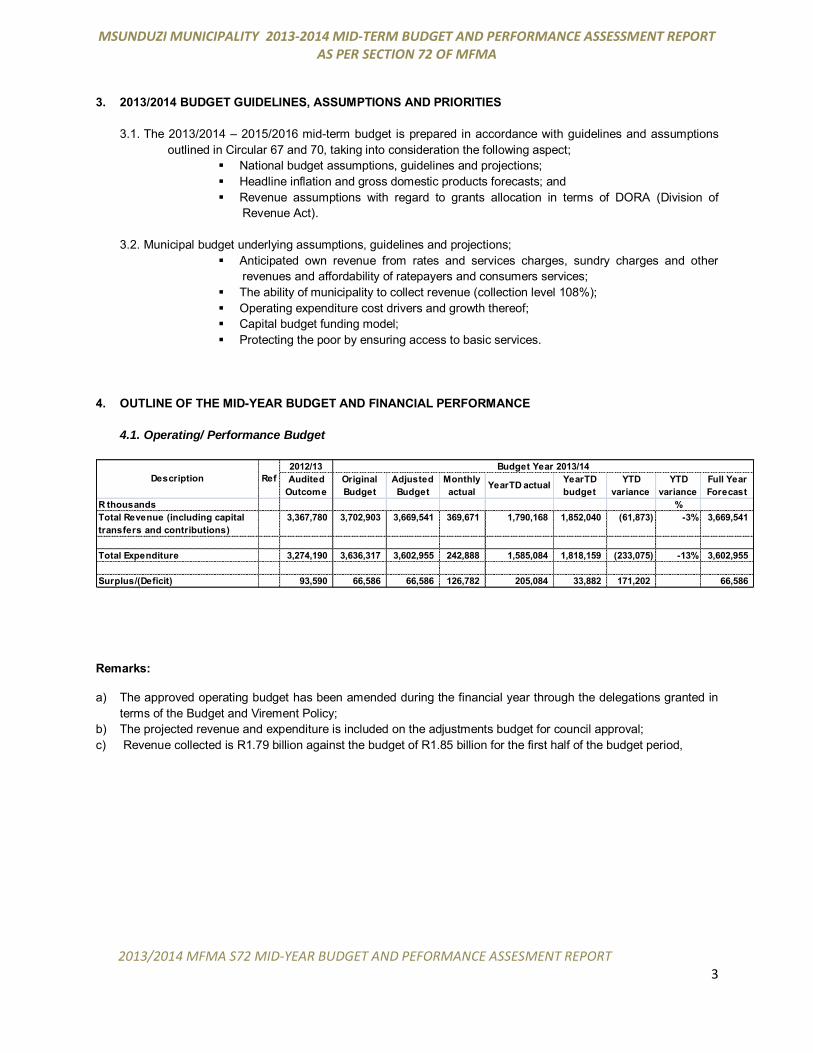
3. 2013/2014 BUDGET GUIDELINES, ASSUMPTIONS AND PRIORITIES
3.1. The 2013/2014 – 2015/2016 mid-term budget is prepared in accordance with guidelines and assumptions outlined in Circular 67 and 70, taking into consideration the following aspect;
National budget assumptions, guidelines and projections; Headline inflation and gross domestic products forecasts; and Revenue assumptions with regard to grants allocation in terms of DORA (Division of
Revenue Act).
3.2. Municipal budget underlying assumptions, guidelines and projections; Anticipated own revenue from rates and services charges, sundry charges and other
revenues and affordability of ratepayers and consumers services; The ability of municipality to collect revenue (collection level 108%); Operating expenditure cost drivers and growth thereof; Capital budget funding model; Protecting the poor by ensuring access to basic services.
4. OUTLINE OF THE MID-YEAR BUDGET AND FINANCIAL PERFORMANCE
4.1. Operating/ Performance Budget
2012/13Audited
OutcomeOriginal Budget
Adjusted Budget
Monthly actual
YearTD actual YearTD budget
YTD variance
YTD variance
Full Year Forecast
R thousands %Total Revenue (including capital transfers and contributions)
3,367,780 3,702,903 3,669,541 369,671 1,790,168 1,852,040 (61,873) -3% 3,669,541
Total Expenditure 3,274,190 3,636,317 3,602,955 242,888 1,585,084 1,818,159 (233,075) -13% 3,602,955
Surplus/(Deficit) 93,590 66,586 66,586 126,782 205,084 33,882 171,202 66,586
Description RefBudget Year 2013/14
Remarks:
a) The approved operating budget has been amended during the financial year through the delegations granted in terms of the Budget and Virement Policy;
b) The projected revenue and expenditure is included on the adjustments budget for council approval; c) Revenue collected is R1.79 billion against the budget of R1.85 billion for the first half of the budget period,
MSUNDUZI MUNICIPALITY 2013-2014 MID-TERM BUDGET AND PERFORMANCE ASSESSMENT REPORT
AS PER SECTION 72 OF MFMA
2013/2014 MFMA S72 MID-YEAR BUDGET AND PEFORMANCE ASSESMENT REPORT 4
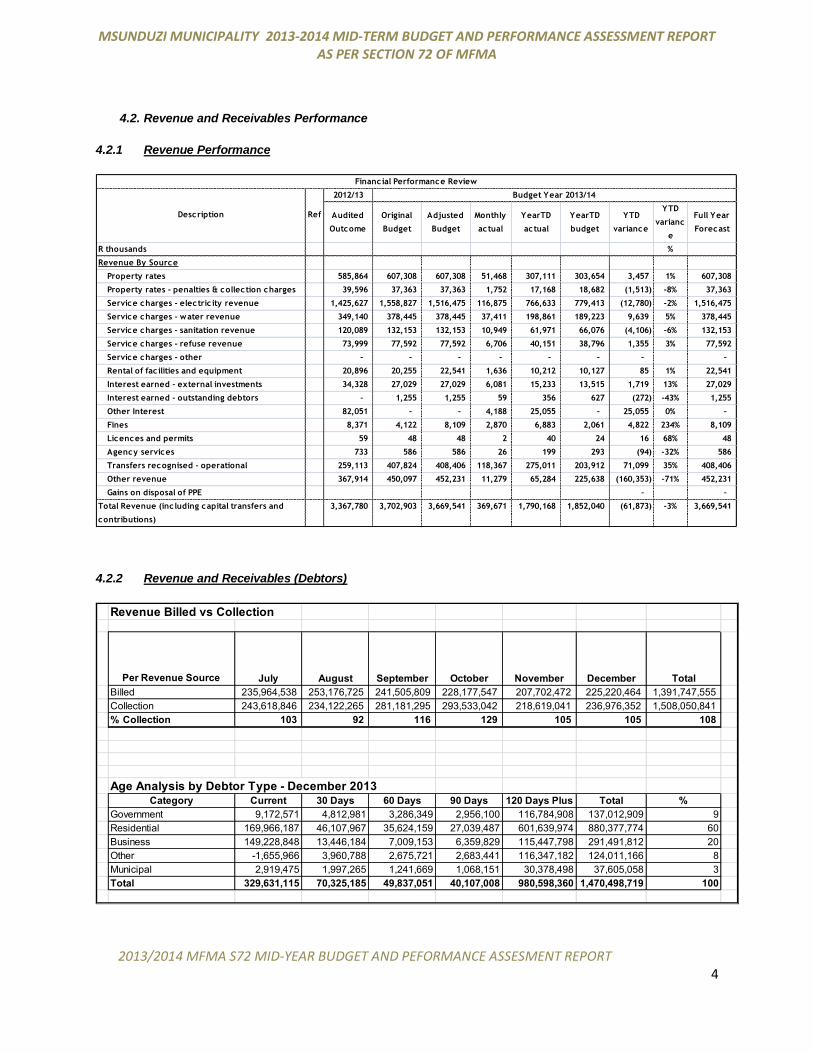
4.2. Revenue and Receivables Performance
4.2.1 Revenue Performance
2012/13
Audited
Outcome
Original
Budget
Adjusted
Budget
Monthly
actual
YearTD
actual
YearTD
budget
YTD
variance
YTD
varianc
e
Full Year
Forecast
R thousands %
Revenue By Source
Property rates 585,864 607,308 607,308 51,468 307,111 303,654 3,457 1% 607,308
Property rates - penalties & collection charges 39,596 37,363 37,363 1,752 17,168 18,682 (1,513) -8% 37,363
Service charges - electric ity revenue 1,425,627 1,558,827 1,516,475 116,875 766,633 779,413 (12,780) -2% 1,516,475
Service charges - water revenue 349,140 378,445 378,445 37,411 198,861 189,223 9,639 5% 378,445
Service charges - sanitation revenue 120,089 132,153 132,153 10,949 61,971 66,076 (4,106) -6% 132,153
Service charges - refuse revenue 73,999 77,592 77,592 6,706 40,151 38,796 1,355 3% 77,592
Service charges - other – – – – – – – –
Rental of fac ilities and equipment 20,896 20,255 22,541 1,636 10,212 10,127 85 1% 22,541
Interest earned - external investments 34,328 27,029 27,029 6,081 15,233 13,515 1,719 13% 27,029
Interest earned - outstanding debtors – 1,255 1,255 59 356 627 (272) -43% 1,255
Other Interest 82,051 – – 4,188 25,055 – 25,055 0% –
Fines 8,371 4,122 8,109 2,870 6,883 2,061 4,822 234% 8,109
Licences and permits 59 48 48 2 40 24 16 68% 48
Agency services 733 586 586 26 199 293 (94) -32% 586
Transfers recognised - operational 259,113 407,824 408,406 118,367 275,011 203,912 71,099 35% 408,406
Other revenue 367,914 450,097 452,231 11,279 65,284 225,638 (160,353) -71% 452,231
Gains on disposal of PPE – –
Total Revenue (inc luding capital transfers and
contributions)
3,367,780 3,702,903 3,669,541 369,671 1,790,168 1,852,040 (61,873) -3% 3,669,541
Description Ref
Budget Year 2013/14
Financial Performance Review
4.2.2 Revenue and Receivables (Debtors)
Revenue Billed vs Collection
Per Revenue Source July August September October November December Total Billed 235,964,538 253,176,725 241,505,809 228,177,547 207,702,472 225,220,464 1,391,747,555 Collection 243,618,846 234,122,265 281,181,295 293,533,042 218,619,041 236,976,352 1,508,050,841 % Collection 103 92 116 129 105 105 108
Age Analysis by Debtor Type - December 2013Category Current 30 Days 60 Days 90 Days 120 Days Plus Total %
Government 9,172,571 4,812,981 3,286,349 2,956,100 116,784,908 137,012,909 9Residential 169,966,187 46,107,967 35,624,159 27,039,487 601,639,974 880,377,774 60Business 149,228,848 13,446,184 7,009,153 6,359,829 115,447,798 291,491,812 20Other -1,655,966 3,960,788 2,675,721 2,683,441 116,347,182 124,011,166 8Municipal 2,919,475 1,997,265 1,241,669 1,068,151 30,378,498 37,605,058 3Total 329,631,115 70,325,185 49,837,051 40,107,008 980,598,360 1,470,498,719 100
MSUNDUZI MUNICIPALITY 2013-2014 MID-TERM BUDGET AND PERFORMANCE ASSESSMENT REPORT
AS PER SECTION 72 OF MFMA
2013/2014 MFMA S72 MID-YEAR BUDGET AND PEFORMANCE ASSESMENT REPORT 5
Remarks:
a) The actual revenue is R1, 790 billion (109%) compared to the budgeted revenue of R 1,852 billion for the budget release for six month which is a reflection that the municipality has not achieved its revenue performance target. This was due to latest adjustments done due to Nersa tariffs changes.
b) The municipal debtors have increased from R1, 469 to R1, 470 billion that is from July until 31 December 2013. This increase is dominated by residential debtors of 60% compared to other debtor type.
c) The overall collection level is standing at 108%and this reflects a significant improvement as compared to July 2013.
The debtor’s age analysis reflects R 1,470 billion as outstanding debt at 31 December 2013. The R981 million is more than 120 days old which raises concerns on the rate of which the Municipality is collecting. d) The municipality has implemented quite a number of debt collections strategies during the financial year; this can
be observed with the decrease of the debtor’s book and increase in collection during the 6 months under review. e) It should be noted that the increase in collection and decrease in the debtors book is not yet static, project of
comprehensive data cleansing is still eminent to maintain accurate billing.
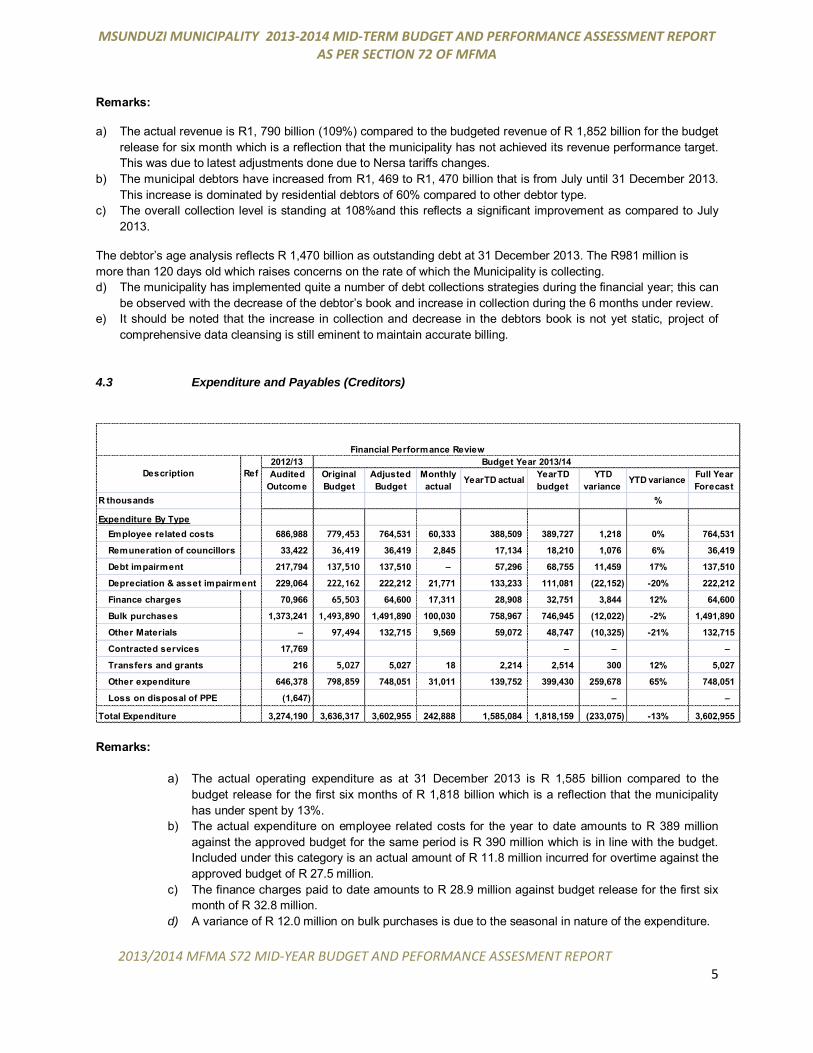
4.3 Expenditure and Payables (Creditors)
2012/13Audited
OutcomeOriginal Budget
Adjusted Budget
Monthly actual
YearTD actual YearTD budget
YTD variance
YTD variance Full Year Forecast
R thousands %
Expenditure By TypeEmployee related costs 686,988 779,453 764,531 60,333 388,509 389,727 1,218 0% 764,531
Remuneration of councillors 33,422 36,419 36,419 2,845 17,134 18,210 1,076 6% 36,419
Debt impairment 217,794 137,510 137,510 – 57,296 68,755 11,459 17% 137,510
Depreciation & asset impairment 229,064 222,162 222,212 21,771 133,233 111,081 (22,152) -20% 222,212
Finance charges 70,966 65,503 64,600 17,311 28,908 32,751 3,844 12% 64,600
Bulk purchases 1,373,241 1,493,890 1,491,890 100,030 758,967 746,945 (12,022) -2% 1,491,890
Other Materials – 97,494 132,715 9,569 59,072 48,747 (10,325) -21% 132,715
Contracted services 17,769 – – –
Transfers and grants 216 5,027 5,027 18 2,214 2,514 300 12% 5,027
Other expenditure 646,378 798,859 748,051 31,011 139,752 399,430 259,678 65% 748,051
Loss on disposal of PPE (1,647) – –
Total Expenditure 3,274,190 3,636,317 3,602,955 242,888 1,585,084 1,818,159 (233,075) -13% 3,602,955
Description RefBudget Year 2013/14
Financial Performance Review
Remarks:
a) The actual operating expenditure as at 31 December 2013 is R 1,585 billion compared to the budget release for the first six months of R 1,818 billion which is a reflection that the municipality has under spent by 13%.
b) The actual expenditure on employee related costs for the year to date amounts to R 389 million against the approved budget for the same period is R 390 million which is in line with the budget. Included under this category is an actual amount of R 11.8 million incurred for overtime against the approved budget of R 27.5 million.
c) The finance charges paid to date amounts to R 28.9 million against budget release for the first six month of R 32.8 million.
d) A variance of R 12.0 million on bulk purchases is due to the seasonal in nature of the expenditure.
MSUNDUZI MUNICIPALITY 2013-2014 MID-TERM BUDGET AND PERFORMANCE ASSESSMENT REPORT
AS PER SECTION 72 OF MFMA
2013/2014 MFMA S72 MID-YEAR BUDGET AND PEFORMANCE ASSESMENT REPORT 6
e) Other expenditure - The majority of items are not a straight line expenditure some are paid where it is needed e.g. printing and stationery, mayoral projects, external services etc. Certain expenditure items are based on a contractual or seasonal commitment e.g. maintenance agreements, parks department items etc.
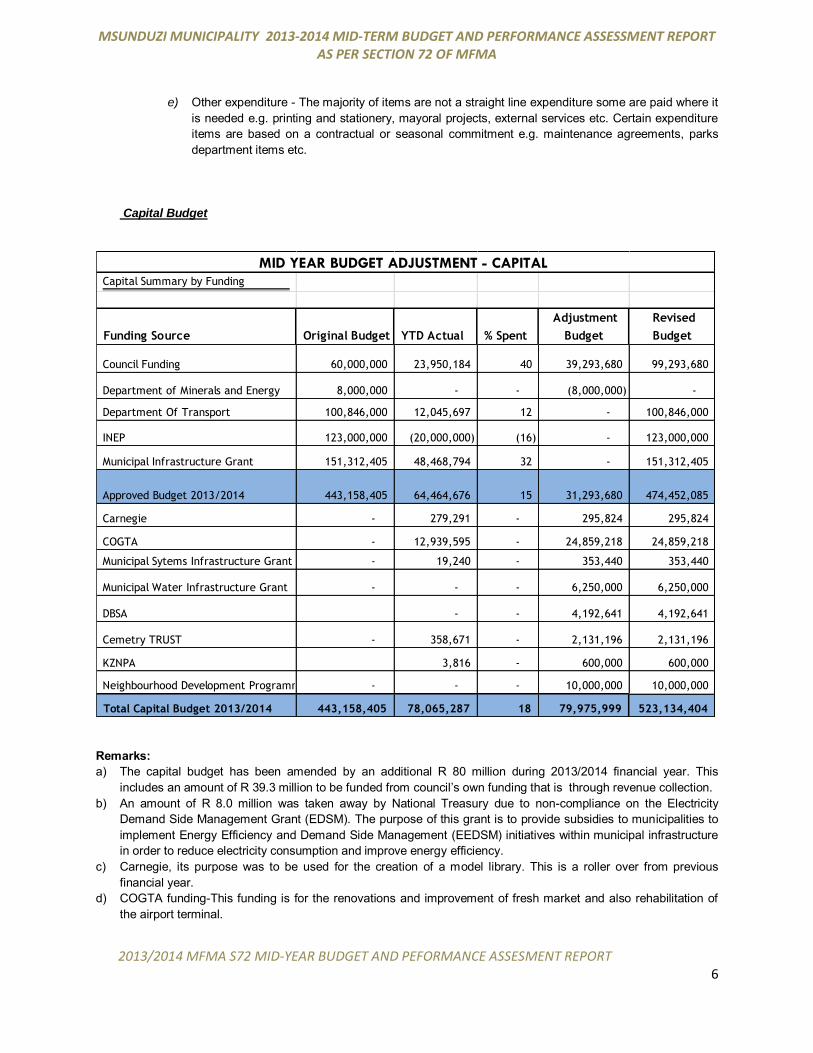
Capital Budget
Capital Summary by Funding
Funding Source Original Budget YTD Actual % Spent
Adjustment
Budget
Revised
Budget
Council Funding 60,000,000 23,950,184 40 39,293,680 99,293,680
Department of Minerals and Energy 8,000,000 - - (8,000,000) -
Department Of Transport 100,846,000 12,045,697 12 - 100,846,000
INEP 123,000,000 (20,000,000) (16) - 123,000,000
Municipal Infrastructure Grant 151,312,405 48,468,794 32 - 151,312,405
Approved Budget 2013/2014 443,158,405 64,464,676 15 31,293,680 474,452,085
Carnegie - 279,291 - 295,824 295,824
COGTA - 12,939,595 - 24,859,218 24,859,218
Municipal Sytems Infrastructure Grant - 19,240 - 353,440 353,440
Municipal Water Infrastructure Grant - - - 6,250,000 6,250,000
DBSA - - 4,192,641 4,192,641
Cemetry TRUST - 358,671 - 2,131,196 2,131,196
KZNPA 3,816 - 600,000 600,000
Neighbourhood Development Programme Grant - - - 10,000,000 10,000,000
Total Capital Budget 2013/2014 443,158,405 78,065,287 18 79,975,999 523,134,404
MID YEAR BUDGET ADJUSTMENT - CAPITAL
Remarks: a) The capital budget has been amended by an additional R 80 million during 2013/2014 financial year. This
includes an amount of R 39.3 million to be funded from council’s own funding that is through revenue collection. b) An amount of R 8.0 million was taken away by National Treasury due to non-compliance on the Electricity
Demand Side Management Grant (EDSM). The purpose of this grant is to provide subsidies to municipalities to implement Energy Efficiency and Demand Side Management (EEDSM) initiatives within municipal infrastructure in order to reduce electricity consumption and improve energy efficiency.
c) Carnegie, its purpose was to be used for the creation of a model library. This is a roller over from previous financial year.
d) COGTA funding-This funding is for the renovations and improvement of fresh market and also rehabilitation of the airport terminal.
MSUNDUZI MUNICIPALITY 2013-2014 MID-TERM BUDGET AND PERFORMANCE ASSESSMENT REPORT
AS PER SECTION 72 OF MFMA
2013/2014 MFMA S72 MID-YEAR BUDGET AND PEFORMANCE ASSESMENT REPORT 7
e) Municipal Systems Infrastructure Grant. Its purpose is to assist municipalities to perform their functions and stabilize institutional and governance systems as required in the Municipal Systems Act (MSA) and related legislation.
f) Municipal Water Infrastructure Grant. This grant is used to facilitate the planning, acceleration and implementation of various projects that will ensure water supply to communities identified as not receiving a basic water supply service.
g) DBSA Funding-The municipality took a loan from DBSA to fund various projects including purchasing of transformers at the amount of R 26 million and there was a balance of R 4.1 million and now Electricity department is utilizing this funding for electricity project.
h) Cemetery Trust-This trust was created some years back to fund some cemetery activities. i) KZNPA/Provincial Grant-This grant will be used for the maintenance of libraries j) Neighborhood Development Partnership Grant. An amount of R 10 million was allocated to Msunduzi
Municipality by National Treasury and the purpose for this grant is to support and facilitate the planning and development of neighborhood development programmes and projects that provide catalytic infrastructure to leverage third party public and private sector development towards improving the quality of life of residents in targeted under-served neighborhoods (generally townships).
k) The overall actual performance of the capital expenditure is R 78.1 million, reflecting an under spending of R 365.1 million which equates to 82%.
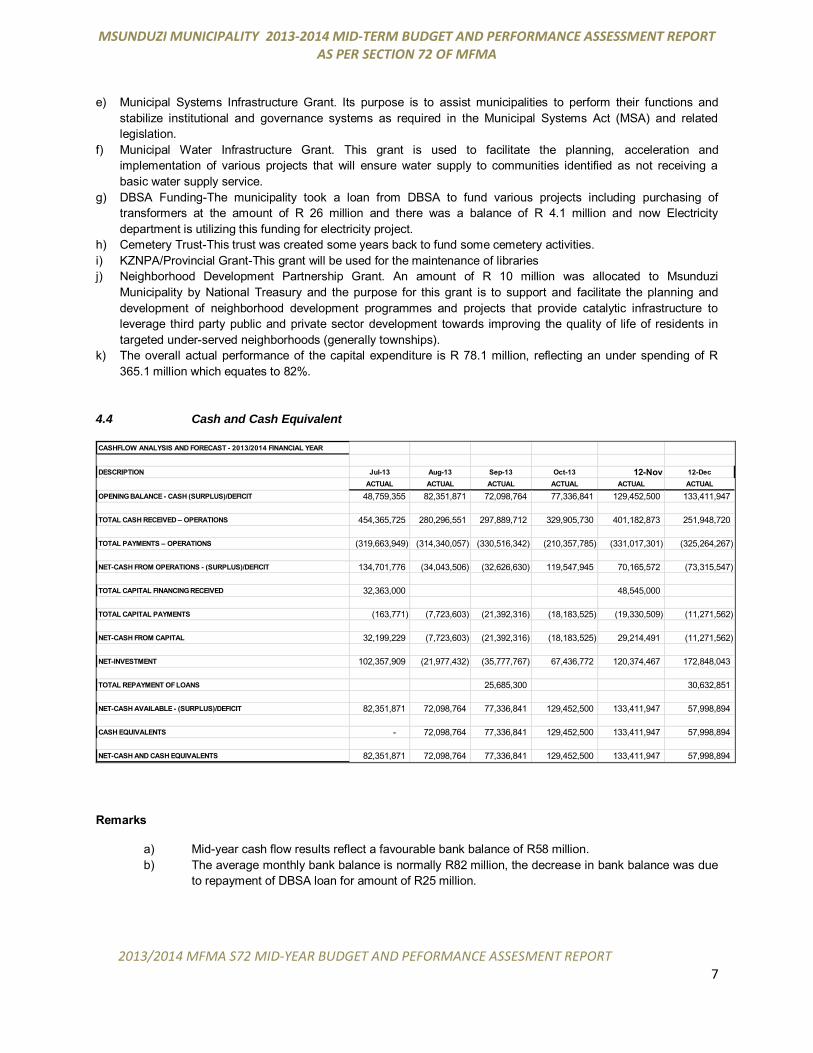
4.4 Cash and Cash Equivalent
CASHFLOW ANALYSIS AND FORECAST - 2013/2014 FINANCIAL YEAR
DESCRIPTION Jul-13 Aug-13 Sep-13 Oct-13 12-Nov 12-DecACTUAL ACTUAL ACTUAL ACTUAL ACTUAL ACTUAL
OPENING BALANCE - CASH (SURPLUS)/DEFICIT 48,759,355 82,351,871 72,098,764 77,336,841 129,452,500 133,411,947
TOTAL CASH RECEIVED – OPERATIONS 454,365,725 280,296,551 297,889,712 329,905,730 401,182,873 251,948,720
TOTAL PAYMENTS – OPERATIONS (319,663,949) (314,340,057) (330,516,342) (210,357,785) (331,017,301) (325,264,267)
NET-CASH FROM OPERATIONS - (SURPLUS)/DEFICIT 134,701,776 (34,043,506) (32,626,630) 119,547,945 70,165,572 (73,315,547)
TOTAL CAPITAL FINANCING RECEIVED 32,363,000 48,545,000
TOTAL CAPITAL PAYMENTS (163,771) (7,723,603) (21,392,316) (18,183,525) (19,330,509) (11,271,562)
NET-CASH FROM CAPITAL 32,199,229 (7,723,603) (21,392,316) (18,183,525) 29,214,491 (11,271,562)
NET-INVESTMENT 102,357,909 (21,977,432) (35,777,767) 67,436,772 120,374,467 172,848,043
TOTAL REPAYMENT OF LOANS 25,685,300 30,632,851
NET-CASH AVAILABLE - (SURPLUS)/DEFICIT 82,351,871 72,098,764 77,336,841 129,452,500 133,411,947 57,998,894
CASH EQUIVALENTS - 72,098,764 77,336,841 129,452,500 133,411,947 57,998,894
NET-CASH AND CASH EQUIVALENTS 82,351,871 72,098,764 77,336,841 129,452,500 133,411,947 57,998,894
Remarks
a) Mid-year cash flow results reflect a favourable bank balance of R58 million. b) The average monthly bank balance is normally R82 million, the decrease in bank balance was due
to repayment of DBSA loan for amount of R25 million.
MSUNDUZI MUNICIPALITY 2013-2014 MID-TERM BUDGET AND PERFORMANCE ASSESSMENT REPORT
AS PER SECTION 72 OF MFMA
2013/2014 MFMA S72 MID-YEAR BUDGET AND PEFORMANCE ASSESMENT REPORT 8
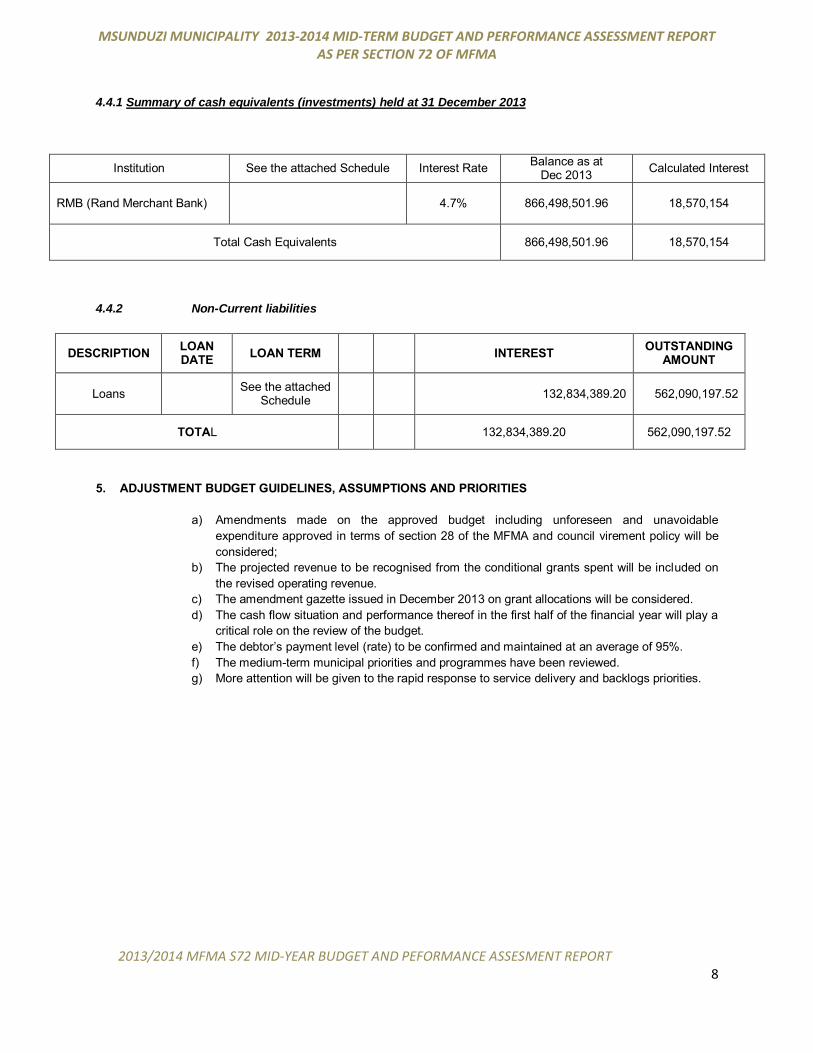
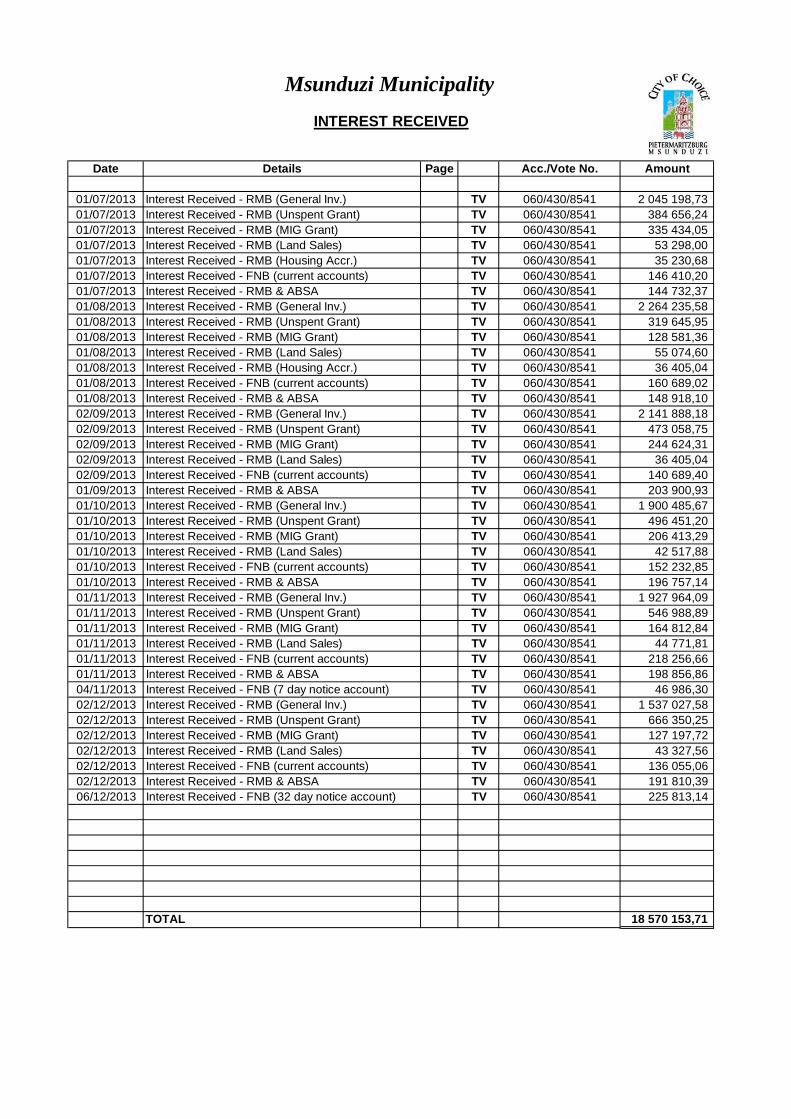
4.4.1 Summary of cash equivalents (investments) held at 31 December 2013
Institution See the attached Schedule Interest Rate Balance as at Dec 2013 Calculated Interest
RMB (Rand Merchant Bank)
4.7%
866,498,501.96
18,570,154
Total Cash Equivalents 866,498,501.96 18,570,154
4.4.2 Non-Current liabilities
DESCRIPTION LOAN DATE LOAN TERM INTEREST OUTSTANDING
AMOUNT
Loans See the attached
Schedule
132,834,389.20
562,090,197.52
TOTAL 132,834,389.20 562,090,197.52
5. ADJUSTMENT BUDGET GUIDELINES, ASSUMPTIONS AND PRIORITIES
a) Amendments made on the approved budget including unforeseen and unavoidable expenditure approved in terms of section 28 of the MFMA and council virement policy will be considered;
b) The projected revenue to be recognised from the conditional grants spent will be included on the revised operating revenue.
c) The amendment gazette issued in December 2013 on grant allocations will be considered. d) The cash flow situation and performance thereof in the first half of the financial year will play a
critical role on the review of the budget. e) The debtor’s payment level (rate) to be confirmed and maintained at an average of 95%. f) The medium-term municipal priorities and programmes have been reviewed. g) More attention will be given to the rapid response to service delivery and backlogs priorities.
MSUNDUZI MUNICIPALITY 2013-2014 MID-TERM BUDGET AND PERFORMANCE ASSESSMENT REPORT
AS PER SECTION 72 OF MFMA
2013/2014 MFMA S72 MID-YEAR BUDGET AND PEFORMANCE ASSESMENT REPORT 9
ANNEXURE
Annexure “2.1” – Mid Term Performance 2013/14 SDBIP Review Report
Annexure “2.2” – Proposed Adjusted Budget
6. RECOMMENDATION TO IMPROVE PERFORMANCE IN THE LAST HALF OF THE BUDGET FINANCIAL YEAR:
a) The council needs to review the capital budget with the turnaround strategy to ensure that approved projects
are implemented with speed and to ensure that all projects are completed or towards completion by end of the year 30 June 2014.
b) This can also be achieved through ensuring that SCM section and its bid committee sits as planned. c) The Municipality through its debt collection process will have to ensure that strict collection processes are
implemented. d) The project of data cleansing to be implemented as approved will also ensure that unrecoverable debt due
to non-existence will be written off to reflect the realistic debtor balance at the year-end 30 June 2014 with the correct debtors impairment and provision.
e) The provision for impairment of debtors has been budgeted for on the final budget approved by council on 24 April 2013. The provision is in line with the projected average payment rate of 95% on current accounts for the 2013/2014 financial year.
f) A revenue enhancement strategy is currently being implemented ensure stringent measures are in place for collection of municipal accounts.
g) That the Council adopts the revised budget as per Annexure C attached to this report.
7. RATINGS ON MID-TERM PERFORMANCE ASSESSMENT
7.1. The performance of the 2013/2014 approved budget as implemented through the SDBIP monitoring is as follows, Total Revenue 48% Total Expenditure 44% Capital Budget 18% This is therefore means that, the performance of the municipality as per half yearly assessment has been done by the Accounting Officer on 22 January 2014 which is six months of the financial year.
7.2. Performance on the approved Service Delivery and Budget Implementation Plan (SDBIP) 2013/ 2014 against predetermined targets and indicators is reflected as follows:
7.3. The following is adapted from the reporting on the 2nd Quarter Service Delivery & Budget Implementation Plan (SDBIP) and Operational Plan (OP) 2013/2014 in respect of performance of Key Performance Indicators.
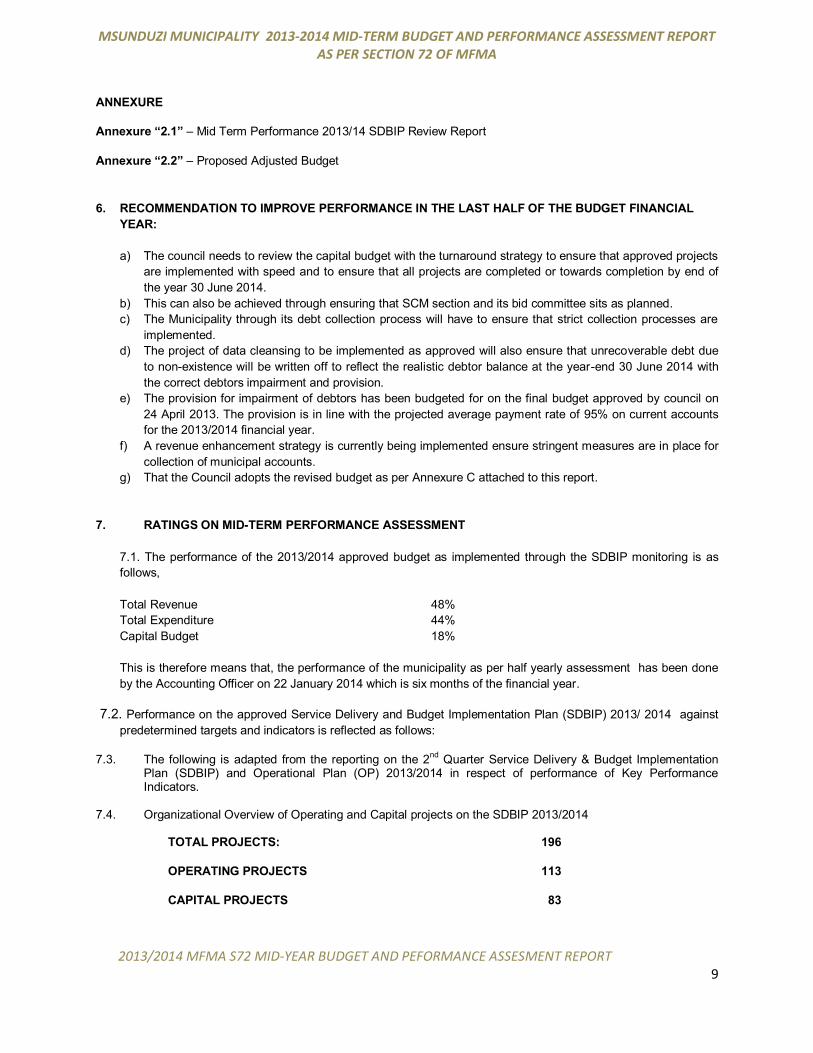
7.4. Organizational Overview of Operating and Capital projects on the SDBIP 2013/2014
TOTAL PROJECTS: 196
OPERATING PROJECTS 113
CAPITAL PROJECTS 83
MSUNDUZI MUNICIPALITY 2013-2014 MID-TERM BUDGET AND PERFORMANCE ASSESSMENT REPORT
AS PER SECTION 72 OF MFMA
2013/2014 MFMA S72 MID-YEAR BUDGET AND PEFORMANCE ASSESMENT REPORT 10
GRAPHICAL REPRESENTATION OF PERFORMANCE: OPERATING PROJECTS
A total of 113 Operating Projects were reported on the SDBIP for the 2nd Quarter (OCTOBER - DECEMBER 2013) 2013/2014 financial year
18.75% of the projects were reported as having Nil Achievements for the 2nd Quarter (OCTOBER - DECEMBER 2013) - 2013/2014 financial year
17.85% of the projects were reported as having been partially met for the 2nd Quarter (OCTOBER - DECEMBER 2013) - 2013/2014 financial year
46.42% of the projects were reported as having been met for the 2nd Quarter (OCTOBER - DECEMBER 2013) - 2013/2014 financial year
5.35% of the projects were reported as having exceeded the target for the 2nd Quarter (OCTOBER - DECEMBER 2013) - 2013/2014 financial year
1.78% of the projects were reported as having exceeded the target by 100% for the 2nd Quarter (OCTOBER - DECEMBER 2013) - 2013/2014 financial year
9.82% of the projects were reported as not applicable due to not having any targets set for the 2nd Quarter (OCTOBER - DECEMBER 2013) - 2013/2014 financial year
MSUNDUZI MUNICIPALITY 2013-2014 MID-TERM BUDGET AND PERFORMANCE ASSESSMENT REPORT
AS PER SECTION 72 OF MFMA
2013/2014 MFMA S72 MID-YEAR BUDGET AND PEFORMANCE ASSESMENT REPORT 11
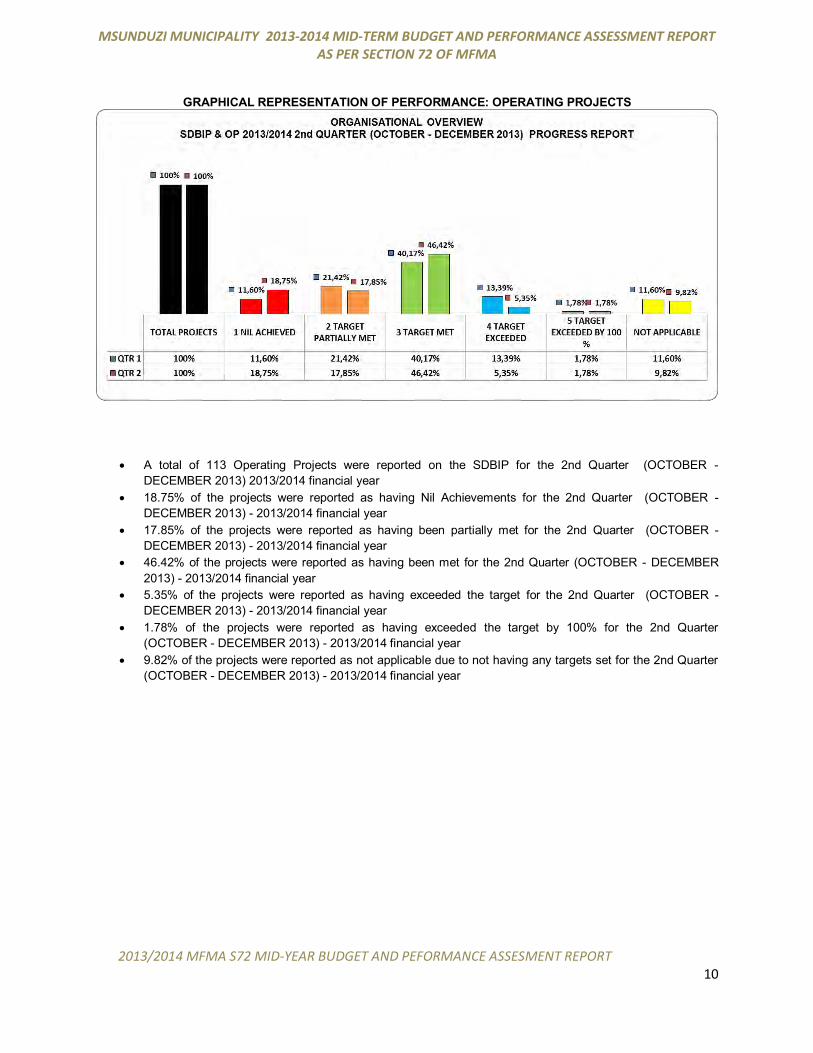
GRAPHICAL REPRESENTATION OF PERFORMANCE: CAPITAL PROJECTS
A total of 83 Capital Projects were reported on the SDBIP for the 2nd Quarter (OCTOBER - DECEMBER 2013)- 2013/2014 financial year
24.09% of the projects were reported as having Nil Achievements for the 2nd Quarter (OCTOBER - DECEMBER 2013) - 2013/2014 financial year
18.07% of the projects were reported as having been partially met for for the 2nd Quarter (OCTOBER - DECEMBER 2013) - 2013/2014 financial year
31.32% of the projects were reported as having been met for the 2nd Quarter (OCTOBER - DECEMBER 2013) - 2013/2014 financial year
15.66% of the projects were reported as having exceeded the target for the 2nd Quarter (OCTOBER - DECEMBER 2013) - 2013/2014 financial year
1% of the projects were reported as having exceeded the target by 100% for the 2nd Quarter (OCTOBER - DECEMBER 2013)- 2013/2014 financial year
9.36% of the projects were reported as not applicable due to not having any targets set for the 2nd Quarter (OCTOBER - DECEMBER 2013) - 2013/2014 financial year
MSUNDUZI MUNICIPALITY 2013-2014 MID-TERM BUDGET AND PERFORMANCE ASSESSMENT REPORT
AS PER SECTION 72 OF MFMA
2013/2014 MFMA S72 MID-YEAR BUDGET AND PEFORMANCE ASSESMENT REPORT 12
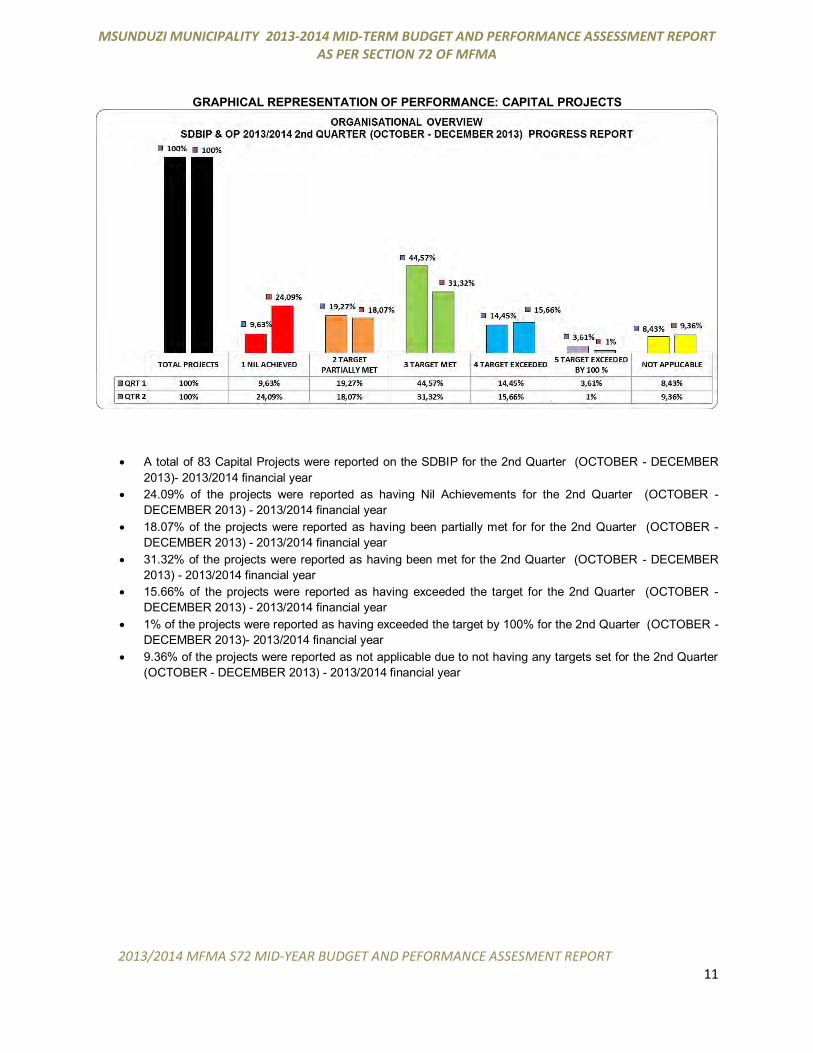
7.5. Organizational Overview of Operating projects on the Operational Plan 2013/2014
GRAPHICAL REPRESENTATION OF PERFORMANCE: OPERATING PROJECTS
A total of 111 Projects were reported on the Operational Plan for the 2nd Quarter (OCTOBER - DECEMBER 2013)- 2013/2014 financial year
4% of the projects were reported as having Nil Achievements for the 2nd Quarter (OCTOBER - DECEMBER 2013)- 2013/2014 financial year
12% of the projects were reported as having been partially met for the 2nd Quarter (OCTOBER - DECEMBER 2013) - 2013/2014 financial year
32% of the projects were reported as having been met for the 2nd Quarter (OCTOBER - DECEMBER 2013)- 2013/2014 financial year
0% of the projects were reported as having exceeded the target for the 2nd Quarter (OCTOBER - DECEMBER 2013)- 2013/2014 financial year
0% of the projects were reported as having exceeded the target by 100% for the 2nd Quarter (OCTOBER - DECEMBER 2013)- 2013/2014 financial year
52% of the projects were reported as not applicable due to not having any targets set for the 2nd Quarter (OCTOBER - DECEMBER 2013)- 2013/2014 financial year.
7.6. The above graph indicates an improvement is as far as performance against predetermined targets and indicators as compared to the same time last year. This may largely be attributed to the institutionalization of both organizational and individual performance management within the organization.
TOTAL PROJECTS: 111
OPERATING PROJECTS 111
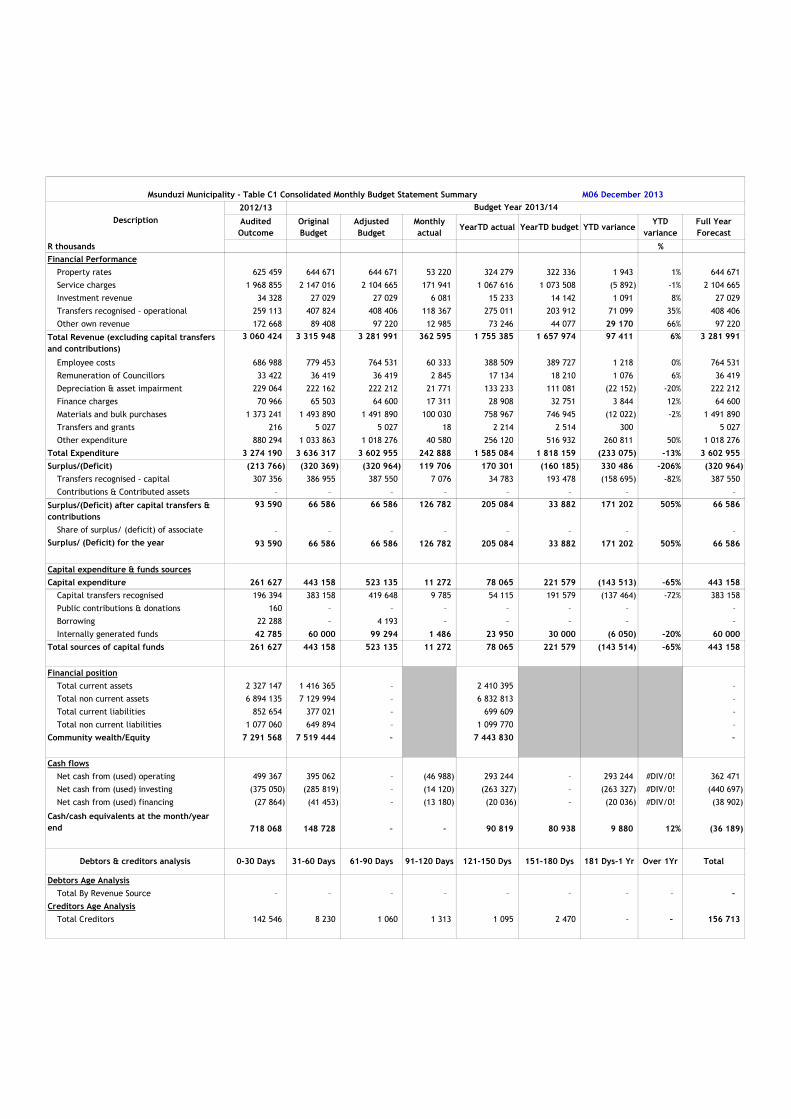
M06 December 20132012/13
Audited Outcome
Original Budget
Adjusted Budget
Monthly actual
YearTD actual YearTD budget YTD varianceYTD
varianceFull Year Forecast
R thousands %Financial Performance
Property rates 625 459 644 671 644 671 53 220 324 279 322 336 1 943 1% 644 671 Service charges 1 968 855 2 147 016 2 104 665 171 941 1 067 616 1 073 508 (5 892) -1% 2 104 665 Investment revenue 34 328 27 029 27 029 6 081 15 233 14 142 1 091 8% 27 029 Transfers recognised - operational 259 113 407 824 408 406 118 367 275 011 203 912 71 099 35% 408 406 Other own revenue 172 668 89 408 97 220 12 985 73 246 44 077 29 170 66% 97 220
Total Revenue (excluding capital transfers and contributions)
3 060 424 3 315 948 3 281 991 362 595 1 755 385 1 657 974 97 411 6% 3 281 991
Employee costs 686 988 779 453 764 531 60 333 388 509 389 727 1 218 0% 764 531 Remuneration of Councillors 33 422 36 419 36 419 2 845 17 134 18 210 1 076 6% 36 419 Depreciation & asset impairment 229 064 222 162 222 212 21 771 133 233 111 081 (22 152) -20% 222 212 Finance charges 70 966 65 503 64 600 17 311 28 908 32 751 3 844 12% 64 600 Materials and bulk purchases 1 373 241 1 493 890 1 491 890 100 030 758 967 746 945 (12 022) -2% 1 491 890 Transfers and grants 216 5 027 5 027 18 2 214 2 514 300 5 027 Other expenditure 880 294 1 033 863 1 018 276 40 580 256 120 516 932 260 811 50% 1 018 276
Total Expenditure 3 274 190 3 636 317 3 602 955 242 888 1 585 084 1 818 159 (233 075) -13% 3 602 955 Surplus/(Deficit) (213 766) (320 369) (320 964) 119 706 170 301 (160 185) 330 486 -206% (320 964)
Transfers recognised - capital 307 356 386 955 387 550 7 076 34 783 193 478 (158 695) -82% 387 550 Contributions & Contributed assets – – – – – – – –
Surplus/(Deficit) after capital transfers & contributions
93 590 66 586 66 586 126 782 205 084 33 882 171 202 505% 66 586
Share of surplus/ (deficit) of associate – – – – – – – – Surplus/ (Deficit) for the year 93 590 66 586 66 586 126 782 205 084 33 882 171 202 505% 66 586
Capital expenditure & funds sourcesCapital expenditure 261 627 443 158 523 135 11 272 78 065 221 579 (143 513) -65% 443 158
Capital transfers recognised 196 394 383 158 419 648 9 785 54 115 191 579 (137 464) -72% 383 158 Public contributions & donations 160 – – – – – – – Borrowing 22 288 – 4 193 – – – – – Internally generated funds 42 785 60 000 99 294 1 486 23 950 30 000 (6 050) -20% 60 000
Total sources of capital funds 261 627 443 158 523 135 11 272 78 065 221 579 (143 514) -65% 443 158
Financial positionTotal current assets 2 327 147 1 416 365 – 2 410 395 – Total non current assets 6 894 135 7 129 994 – 6 832 813 – Total current liabilities 852 654 377 021 – 699 609 – Total non current liabilities 1 077 060 649 894 – 1 099 770 –
Community wealth/Equity 7 291 568 7 519 444 – 7 443 830 –
Cash flowsNet cash from (used) operating 499 367 395 062 – (46 988) 293 244 – 293 244 #DIV/0! 362 471 Net cash from (used) investing (375 050) (285 819) – (14 120) (263 327) – (263 327) #DIV/0! (440 697) Net cash from (used) financing (27 864) (41 453) – (13 180) (20 036) – (20 036) #DIV/0! (38 902)
Cash/cash equivalents at the month/year end 718 068 148 728 – – 90 819 80 938 9 880 12% (36 189)
Debtors & creditors analysis 0-30 Days 31-60 Days 61-90 Days 91-120 Days 121-150 Dys 151-180 Dys 181 Dys-1 Yr Over 1Yr Total
Debtors Age AnalysisTotal By Revenue Source – – – – – – – – –
Creditors Age AnalysisTotal Creditors 142 546 8 230 1 060 1 313 1 095 2 470 – – 156 713
Msunduzi Municipality - Table C1 Consolidated Monthly Budget Statement Summary
DescriptionBudget Year 2013/14
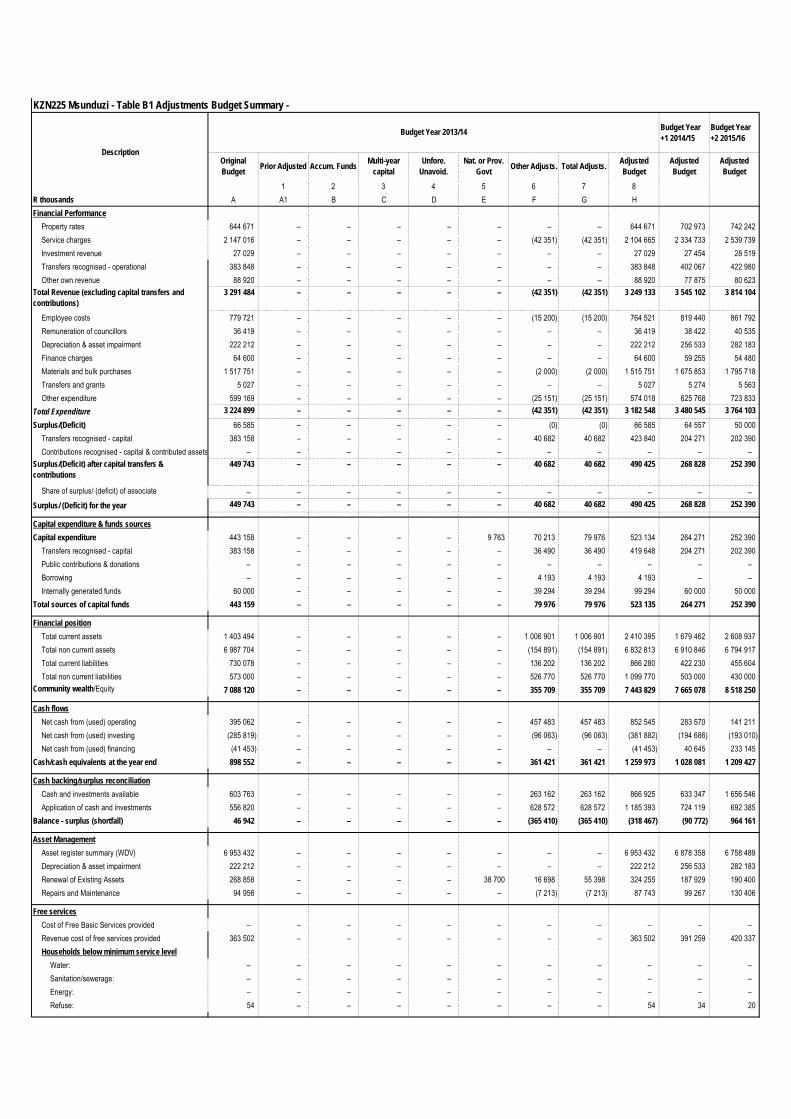
KZN225 Msunduzi - Table B1 Adjustments Budget Summary -
Budget Year +1 2014/15
Budget Year +2 2015/16
Original Budget Prior Adjusted Accum. Funds Multi-year
capitalUnfore.
Unavoid.Nat. or Prov.
Govt Other Adjusts. Total Adjusts. Adjusted Budget
Adjusted Budget
Adjusted Budget
1 2 3 4 5 6 7 8R thousands A A1 B C D E F G HFinancial Performance
Property rates 644 671 – – – – – – – 644 671 702 973 742 242 Service charges 2 147 016 – – – – – (42 351) (42 351) 2 104 665 2 334 733 2 539 739 Investment revenue 27 029 – – – – – – – 27 029 27 454 28 519 Transfers recognised - operational 383 848 – – – – – – – 383 848 402 067 422 980 Other own revenue 88 920 – – – – – – – 88 920 77 875 80 623
Total Revenue (excluding capital transfers and contributions)
3 291 484 – – – – – (42 351) (42 351) 3 249 133 3 545 102 3 814 104
Employee costs 779 721 – – – – – (15 200) (15 200) 764 521 819 440 861 792 Remuneration of councillors 36 419 – – – – – – – 36 419 38 422 40 535 Depreciation & asset impairment 222 212 – – – – – – – 222 212 256 533 282 183 Finance charges 64 600 – – – – – – – 64 600 59 255 54 480 Materials and bulk purchases 1 517 751 – – – – – (2 000) (2 000) 1 515 751 1 675 853 1 795 718 Transfers and grants 5 027 – – – – – – – 5 027 5 274 5 563 Other expenditure 599 169 – – – – – (25 151) (25 151) 574 018 625 768 723 833
Total Expenditure 3 224 899 – – – – – (42 351) (42 351) 3 182 548 3 480 545 3 764 103 Surplus/(Deficit) 66 585 – – – – – (0) (0) 66 585 64 557 50 000
Transfers recognised - capital 383 158 – – – – – 40 682 40 682 423 840 204 271 202 390 Contributions recognised - capital & contributed assets – – – – – – – – – – –
Surplus/(Deficit) after capital transfers & contributions
449 743 – – – – – 40 682 40 682 490 425 268 828 252 390
Share of surplus/ (deficit) of associate – – – – – – – – – – – Surplus/ (Deficit) for the year 449 743 – – – – – 40 682 40 682 490 425 268 828 252 390
Capital expenditure & funds sourcesCapital expenditure 443 158 – – – – 9 763 70 213 79 976 523 134 264 271 252 390
Transfers recognised - capital 383 158 – – – – – 36 490 36 490 419 648 204 271 202 390 Public contributions & donations – – – – – – – – – – – Borrowing – – – – – – 4 193 4 193 4 193 – – Internally generated funds 60 000 – – – – – 39 294 39 294 99 294 60 000 50 000
Total sources of capital funds 443 159 – – – – – 79 976 79 976 523 135 264 271 252 390
Financial positionTotal current assets 1 403 494 – – – – – 1 006 901 1 006 901 2 410 395 1 679 462 2 608 937 Total non current assets 6 987 704 – – – – – (154 891) (154 891) 6 832 813 6 910 846 6 794 917 Total current liabilities 730 078 – – – – – 136 202 136 202 866 280 422 230 455 604 Total non current liabilities 573 000 – – – – – 526 770 526 770 1 099 770 503 000 430 000
Community wealth/Equity 7 088 120 – – – – – 355 709 355 709 7 443 829 7 665 078 8 518 250
Cash flowsNet cash from (used) operating 395 062 – – – – – 457 483 457 483 852 545 283 570 141 211 Net cash from (used) investing (285 819) – – – – – (96 063) (96 063) (381 882) (194 686) (193 010) Net cash from (used) financing (41 453) – – – – – – – (41 453) 40 645 233 145
Cash/cash equivalents at the year end 898 552 – – – – – 361 421 361 421 1 259 973 1 028 081 1 209 427
Cash backing/surplus reconciliationCash and investments available 603 763 – – – – – 263 162 263 162 866 925 633 347 1 656 546 Application of cash and investments 556 820 – – – – – 628 572 628 572 1 185 393 724 119 692 385
Balance - surplus (shortfall) 46 942 – – – – – (365 410) (365 410) (318 467) (90 772) 964 161
Asset ManagementAsset register summary (WDV) 6 953 432 – – – – – – – 6 953 432 6 878 358 6 758 489 Depreciation & asset impairment 222 212 – – – – – – – 222 212 256 533 282 183 Renewal of Existing Assets 268 858 – – – – 38 700 16 698 55 398 324 255 187 929 190 400 Repairs and Maintenance 94 956 – – – – – (7 213) (7 213) 87 743 99 267 130 406
Free servicesCost of Free Basic Services provided – – – – – – – – – – – Revenue cost of free services provided 363 502 – – – – – – – 363 502 391 259 420 337 Households below minimum service level
Water: – – – – – – – – – – – Sanitation/sewerage: – – – – – – – – – – – Energy: – – – – – – – – – – – Refuse: 54 – – – – – – – 54 34 20
Budget Year 2013/14
Description
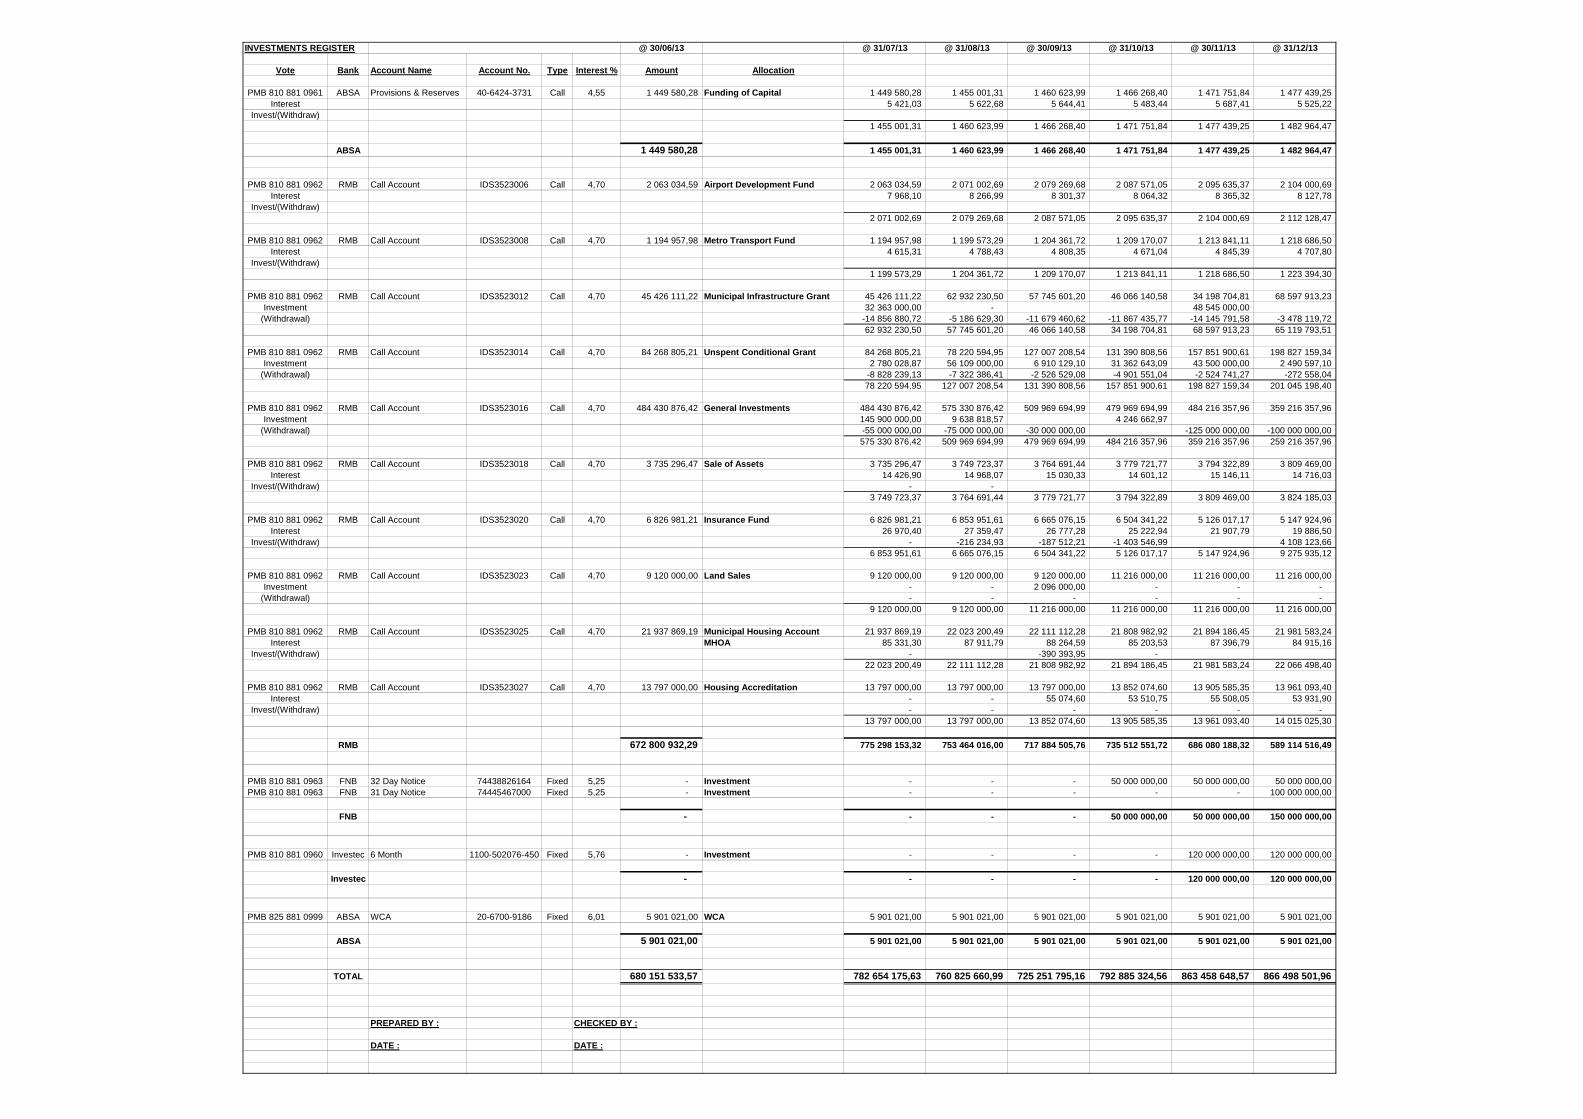
INVESTMENTS REGISTER @ 30/06/13 @ 31/07/13 @ 31/08/13 @ 30/09/13 @ 31/10/13 @ 30/11/13 @ 31/12/13
Vote Bank Account Name Account No. Type Interest % Amount Allocation
PMB 810 881 0961 ABSA Provisions & Reserves 40-6424-3731 Call 4,55 1 449 580,28 Funding of Capital 1 449 580,28 1 455 001,31 1 460 623,99 1 466 268,40 1 471 751,84 1 477 439,25 Interest 5 421,03 5 622,68 5 644,41 5 483,44 5 687,41 5 525,22
Invest/(Withdraw)1 455 001,31 1 460 623,99 1 466 268,40 1 471 751,84 1 477 439,25 1 482 964,47
ABSA 1 449 580,28 1 455 001,31 1 460 623,99 1 466 268,40 1 471 751,84 1 477 439,25 1 482 964,47
PMB 810 881 0962 RMB Call Account IDS3523006 Call 4,70 2 063 034,59 Airport Development Fund 2 063 034,59 2 071 002,69 2 079 269,68 2 087 571,05 2 095 635,37 2 104 000,69 Interest 7 968,10 8 266,99 8 301,37 8 064,32 8 365,32 8 127,78
Invest/(Withdraw)2 071 002,69 2 079 269,68 2 087 571,05 2 095 635,37 2 104 000,69 2 112 128,47
PMB 810 881 0962 RMB Call Account IDS3523008 Call 4,70 1 194 957,98 Metro Transport Fund 1 194 957,98 1 199 573,29 1 204 361,72 1 209 170,07 1 213 841,11 1 218 686,50 Interest 4 615,31 4 788,43 4 808,35 4 671,04 4 845,39 4 707,80
Invest/(Withdraw)1 199 573,29 1 204 361,72 1 209 170,07 1 213 841,11 1 218 686,50 1 223 394,30
PMB 810 881 0962 RMB Call Account IDS3523012 Call 4,70 45 426 111,22 Municipal Infrastructure Grant 45 426 111,22 62 932 230,50 57 745 601,20 46 066 140,58 34 198 704,81 68 597 913,23 Investment 32 363 000,00 - 48 545 000,00
(Withdrawal) -14 856 880,72 -5 186 629,30 -11 679 460,62 -11 867 435,77 -14 145 791,58 -3 478 119,72 62 932 230,50 57 745 601,20 46 066 140,58 34 198 704,81 68 597 913,23 65 119 793,51
PMB 810 881 0962 RMB Call Account IDS3523014 Call 4,70 84 268 805,21 Unspent Conditional Grant 84 268 805,21 78 220 594,95 127 007 208,54 131 390 808,56 157 851 900,61 198 827 159,34 Investment 2 780 028,87 56 109 000,00 6 910 129,10 31 362 643,09 43 500 000,00 2 490 597,10
(Withdrawal) -8 828 239,13 -7 322 386,41 -2 526 529,08 -4 901 551,04 -2 524 741,27 -272 558,04 78 220 594,95 127 007 208,54 131 390 808,56 157 851 900,61 198 827 159,34 201 045 198,40
PMB 810 881 0962 RMB Call Account IDS3523016 Call 4,70 484 430 876,42 General Investments 484 430 876,42 575 330 876,42 509 969 694,99 479 969 694,99 484 216 357,96 359 216 357,96 Investment 145 900 000,00 9 638 818,57 4 246 662,97
(Withdrawal) -55 000 000,00 -75 000 000,00 -30 000 000,00 -125 000 000,00 -100 000 000,00 575 330 876,42 509 969 694,99 479 969 694,99 484 216 357,96 359 216 357,96 259 216 357,96
PMB 810 881 0962 RMB Call Account IDS3523018 Call 4,70 3 735 296,47 Sale of Assets 3 735 296,47 3 749 723,37 3 764 691,44 3 779 721,77 3 794 322,89 3 809 469,00 Interest 14 426,90 14 968,07 15 030,33 14 601,12 15 146,11 14 716,03
Invest/(Withdraw) - - 3 749 723,37 3 764 691,44 3 779 721,77 3 794 322,89 3 809 469,00 3 824 185,03
PMB 810 881 0962 RMB Call Account IDS3523020 Call 4,70 6 826 981,21 Insurance Fund 6 826 981,21 6 853 951,61 6 665 076,15 6 504 341,22 5 126 017,17 5 147 924,96 Interest 26 970,40 27 359,47 26 777,28 25 222,94 21 907,79 19 886,50
Invest/(Withdraw) - -216 234,93 -187 512,21 -1 403 546,99 4 108 123,66 6 853 951,61 6 665 076,15 6 504 341,22 5 126 017,17 5 147 924,96 9 275 935,12
PMB 810 881 0962 RMB Call Account IDS3523023 Call 4,70 9 120 000,00 Land Sales 9 120 000,00 9 120 000,00 9 120 000,00 11 216 000,00 11 216 000,00 11 216 000,00 Investment - - 2 096 000,00 - - -
(Withdrawal) - - - - - - 9 120 000,00 9 120 000,00 11 216 000,00 11 216 000,00 11 216 000,00 11 216 000,00
PMB 810 881 0962 RMB Call Account IDS3523025 Call 4,70 21 937 869,19 Municipal Housing Account 21 937 869,19 22 023 200,49 22 111 112,28 21 808 982,92 21 894 186,45 21 981 583,24 Interest MHOA 85 331,30 87 911,79 88 264,59 85 203,53 87 396,79 84 915,16
Invest/(Withdraw) - -390 393,95 - 22 023 200,49 22 111 112,28 21 808 982,92 21 894 186,45 21 981 583,24 22 066 498,40
PMB 810 881 0962 RMB Call Account IDS3523027 Call 4,70 13 797 000,00 Housing Accreditation 13 797 000,00 13 797 000,00 13 797 000,00 13 852 074,60 13 905 585,35 13 961 093,40 Interest - - 55 074,60 53 510,75 55 508,05 53 931,90
Invest/(Withdraw) - - - - - - 13 797 000,00 13 797 000,00 13 852 074,60 13 905 585,35 13 961 093,40 14 015 025,30
RMB 672 800 932,29 775 298 153,32 753 464 016,00 717 884 505,76 735 512 551,72 686 080 188,32 589 114 516,49
PMB 810 881 0963 FNB 32 Day Notice 74438826164 Fixed 5,25 - Investment - - - 50 000 000,00 50 000 000,00 50 000 000,00 PMB 810 881 0963 FNB 31 Day Notice 74445467000 Fixed 5,25 - Investment - - - - - 100 000 000,00
FNB - - - - 50 000 000,00 50 000 000,00 150 000 000,00
PMB 810 881 0960 Investec 6 Month 1100-502076-450 Fixed 5,76 - Investment - - - - 120 000 000,00 120 000 000,00
Investec - - - - - 120 000 000,00 120 000 000,00
PMB 825 881 0999 ABSA WCA 20-6700-9186 Fixed 6,01 5 901 021,00 WCA 5 901 021,00 5 901 021,00 5 901 021,00 5 901 021,00 5 901 021,00 5 901 021,00
ABSA 5 901 021,00 5 901 021,00 5 901 021,00 5 901 021,00 5 901 021,00 5 901 021,00 5 901 021,00
TOTAL 680 151 533,57 782 654 175,63 760 825 660,99 725 251 795,16 792 885 324,56 863 458 648,57 866 498 501,96
PREPARED BY : CHECKED BY :
DATE : DATE :
Date Details Page Acc./Vote No. Amount
01/07/2013 Interest Received - RMB (General Inv.) TV 060/430/8541 2 045 198,73 01/07/2013 Interest Received - RMB (Unspent Grant) TV 060/430/8541 384 656,24 01/07/2013 Interest Received - RMB (MIG Grant) TV 060/430/8541 335 434,05 01/07/2013 Interest Received - RMB (Land Sales) TV 060/430/8541 53 298,00 01/07/2013 Interest Received - RMB (Housing Accr.) TV 060/430/8541 35 230,68 01/07/2013 Interest Received - FNB (current accounts) TV 060/430/8541 146 410,20 01/07/2013 Interest Received - RMB & ABSA TV 060/430/8541 144 732,37 01/08/2013 Interest Received - RMB (General Inv.) TV 060/430/8541 2 264 235,58 01/08/2013 Interest Received - RMB (Unspent Grant) TV 060/430/8541 319 645,95 01/08/2013 Interest Received - RMB (MIG Grant) TV 060/430/8541 128 581,36 01/08/2013 Interest Received - RMB (Land Sales) TV 060/430/8541 55 074,60 01/08/2013 Interest Received - RMB (Housing Accr.) TV 060/430/8541 36 405,04 01/08/2013 Interest Received - FNB (current accounts) TV 060/430/8541 160 689,02 01/08/2013 Interest Received - RMB & ABSA TV 060/430/8541 148 918,10 02/09/2013 Interest Received - RMB (General Inv.) TV 060/430/8541 2 141 888,18 02/09/2013 Interest Received - RMB (Unspent Grant) TV 060/430/8541 473 058,75 02/09/2013 Interest Received - RMB (MIG Grant) TV 060/430/8541 244 624,31 02/09/2013 Interest Received - RMB (Land Sales) TV 060/430/8541 36 405,04 02/09/2013 Interest Received - FNB (current accounts) TV 060/430/8541 140 689,40 01/09/2013 Interest Received - RMB & ABSA TV 060/430/8541 203 900,93 01/10/2013 Interest Received - RMB (General Inv.) TV 060/430/8541 1 900 485,67 01/10/2013 Interest Received - RMB (Unspent Grant) TV 060/430/8541 496 451,20 01/10/2013 Interest Received - RMB (MIG Grant) TV 060/430/8541 206 413,29 01/10/2013 Interest Received - RMB (Land Sales) TV 060/430/8541 42 517,88 01/10/2013 Interest Received - FNB (current accounts) TV 060/430/8541 152 232,85 01/10/2013 Interest Received - RMB & ABSA TV 060/430/8541 196 757,14 01/11/2013 Interest Received - RMB (General Inv.) TV 060/430/8541 1 927 964,09 01/11/2013 Interest Received - RMB (Unspent Grant) TV 060/430/8541 546 988,89 01/11/2013 Interest Received - RMB (MIG Grant) TV 060/430/8541 164 812,84 01/11/2013 Interest Received - RMB (Land Sales) TV 060/430/8541 44 771,81 01/11/2013 Interest Received - FNB (current accounts) TV 060/430/8541 218 256,66 01/11/2013 Interest Received - RMB & ABSA TV 060/430/8541 198 856,86 04/11/2013 Interest Received - FNB (7 day notice account) TV 060/430/8541 46 986,30 02/12/2013 Interest Received - RMB (General Inv.) TV 060/430/8541 1 537 027,58 02/12/2013 Interest Received - RMB (Unspent Grant) TV 060/430/8541 666 350,25 02/12/2013 Interest Received - RMB (MIG Grant) TV 060/430/8541 127 197,72 02/12/2013 Interest Received - RMB (Land Sales) TV 060/430/8541 43 327,56 02/12/2013 Interest Received - FNB (current accounts) TV 060/430/8541 136 055,06 02/12/2013 Interest Received - RMB & ABSA TV 060/430/8541 191 810,39 06/12/2013 Interest Received - FNB (32 day notice account) TV 060/430/8541 225 813,14
TOTAL 18 570 153,71
Msunduzi MunicipalityINTEREST RECEIVED
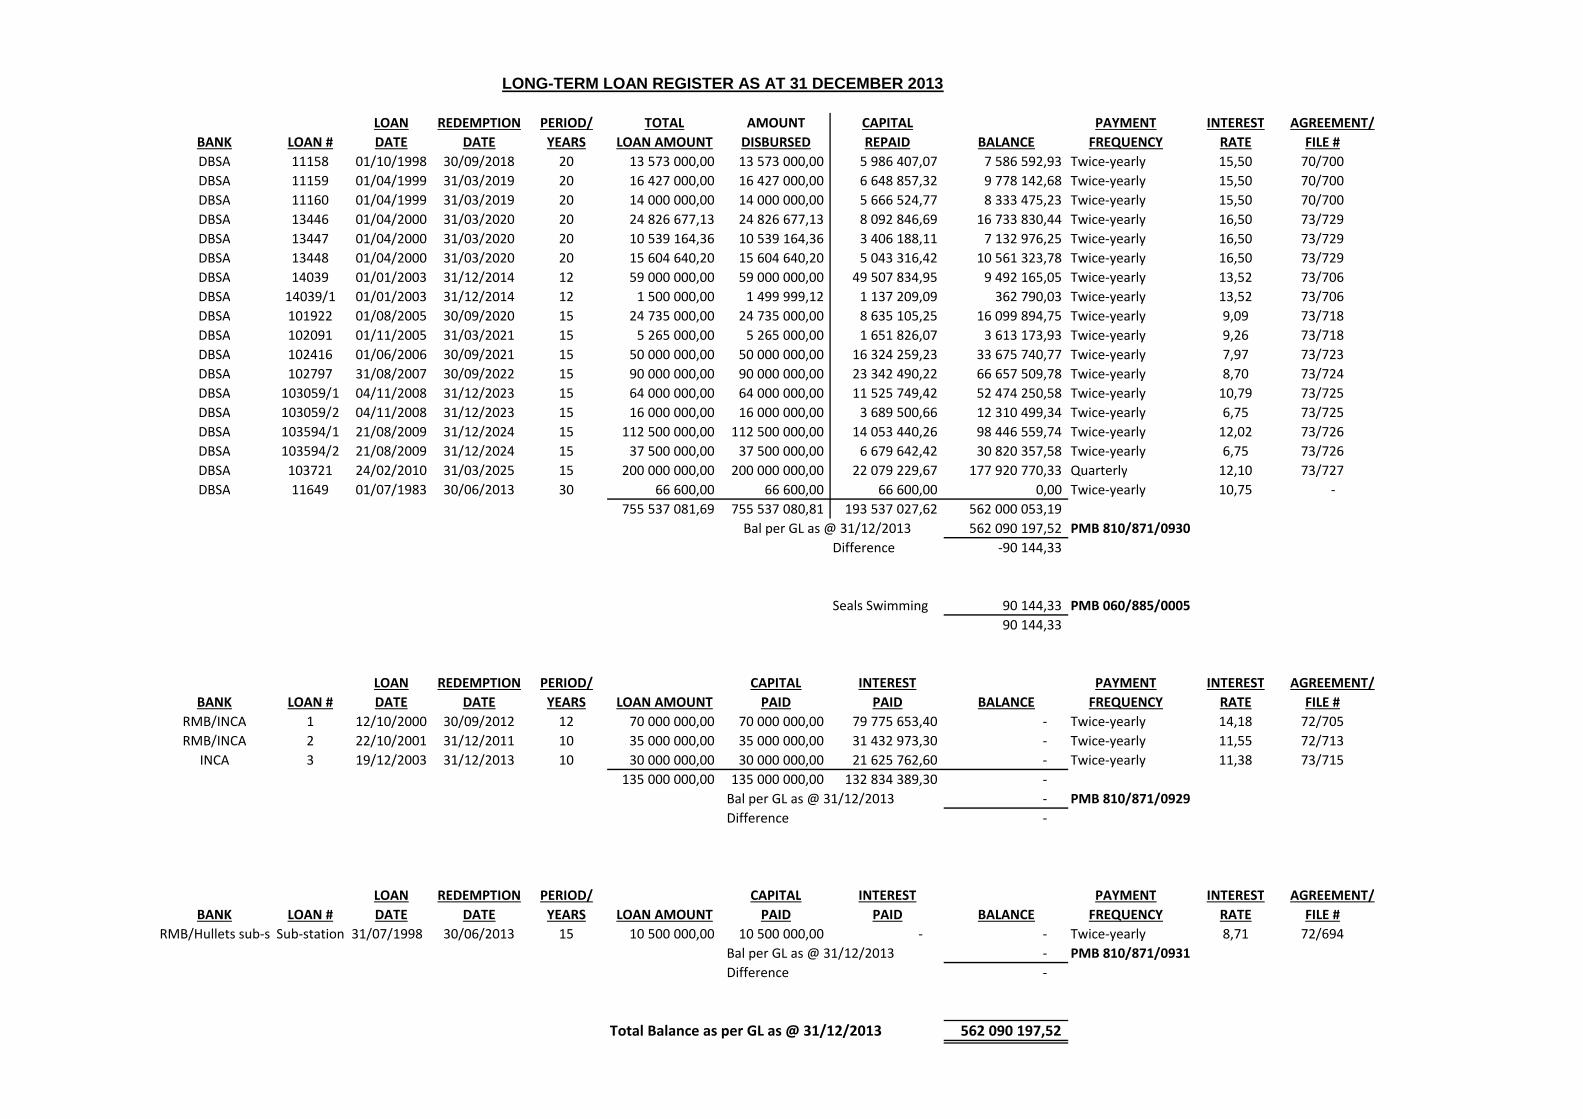
LOAN REDEMPTION PERIOD/ TOTAL AMOUNT CAPITAL PAYMENT INTEREST AGREEMENT/BANK LOAN # DATE DATE YEARS LOAN AMOUNT DISBURSED REPAID BALANCE FREQUENCY RATE FILE #DBSA 11158 01/10/1998 30/09/2018 20 13 573 000,00 13 573 000,00 5 986 407,07 7 586 592,93 Twice-yearly 15,50 70/700DBSA 11159 01/04/1999 31/03/2019 20 16 427 000,00 16 427 000,00 6 648 857,32 9 778 142,68 Twice-yearly 15,50 70/700DBSA 11160 01/04/1999 31/03/2019 20 14 000 000,00 14 000 000,00 5 666 524,77 8 333 475,23 Twice-yearly 15,50 70/700DBSA 13446 01/04/2000 31/03/2020 20 24 826 677,13 24 826 677,13 8 092 846,69 16 733 830,44 Twice-yearly 16,50 73/729DBSA 13447 01/04/2000 31/03/2020 20 10 539 164,36 10 539 164,36 3 406 188,11 7 132 976,25 Twice-yearly 16,50 73/729DBSA 13448 01/04/2000 31/03/2020 20 15 604 640,20 15 604 640,20 5 043 316,42 10 561 323,78 Twice-yearly 16,50 73/729DBSA 14039 01/01/2003 31/12/2014 12 59 000 000,00 59 000 000,00 49 507 834,95 9 492 165,05 Twice-yearly 13,52 73/706DBSA 14039/1 01/01/2003 31/12/2014 12 1 500 000,00 1 499 999,12 1 137 209,09 362 790,03 Twice-yearly 13,52 73/706DBSA 101922 01/08/2005 30/09/2020 15 24 735 000,00 24 735 000,00 8 635 105,25 16 099 894,75 Twice-yearly 9,09 73/718DBSA 102091 01/11/2005 31/03/2021 15 5 265 000,00 5 265 000,00 1 651 826,07 3 613 173,93 Twice-yearly 9,26 73/718DBSA 102416 01/06/2006 30/09/2021 15 50 000 000,00 50 000 000,00 16 324 259,23 33 675 740,77 Twice-yearly 7,97 73/723DBSA 102797 31/08/2007 30/09/2022 15 90 000 000,00 90 000 000,00 23 342 490,22 66 657 509,78 Twice-yearly 8,70 73/724DBSA 103059/1 04/11/2008 31/12/2023 15 64 000 000,00 64 000 000,00 11 525 749,42 52 474 250,58 Twice-yearly 10,79 73/725DBSA 103059/2 04/11/2008 31/12/2023 15 16 000 000,00 16 000 000,00 3 689 500,66 12 310 499,34 Twice-yearly 6,75 73/725DBSA 103594/1 21/08/2009 31/12/2024 15 112 500 000,00 112 500 000,00 14 053 440,26 98 446 559,74 Twice-yearly 12,02 73/726DBSA 103594/2 21/08/2009 31/12/2024 15 37 500 000,00 37 500 000,00 6 679 642,42 30 820 357,58 Twice-yearly 6,75 73/726DBSA 103721 24/02/2010 31/03/2025 15 200 000 000,00 200 000 000,00 22 079 229,67 177 920 770,33 Quarterly 12,10 73/727DBSA 11649 01/07/1983 30/06/2013 30 66 600,00 66 600,00 66 600,00 0,00 Twice-yearly 10,75 -
755 537 081,69 755 537 080,81 193 537 027,62 562 000 053,19 Bal per GL as @ 31/12/2013 562 090 197,52 PMB 810/871/0930
Difference -90 144,33
Seals Swimming 90 144,33 PMB 060/885/000590 144,33
LOAN REDEMPTION PERIOD/ CAPITAL INTEREST PAYMENT INTEREST AGREEMENT/BANK LOAN # DATE DATE YEARS LOAN AMOUNT PAID PAID BALANCE FREQUENCY RATE FILE #
RMB/INCA 1 12/10/2000 30/09/2012 12 70 000 000,00 70 000 000,00 79 775 653,40 - Twice-yearly 14,18 72/705RMB/INCA 2 22/10/2001 31/12/2011 10 35 000 000,00 35 000 000,00 31 432 973,30 - Twice-yearly 11,55 72/713
INCA 3 19/12/2003 31/12/2013 10 30 000 000,00 30 000 000,00 21 625 762,60 - Twice-yearly 11,38 73/715135 000 000,00 135 000 000,00 132 834 389,30 -
Bal per GL as @ 31/12/2013 - PMB 810/871/0929Difference -
LOAN REDEMPTION PERIOD/ CAPITAL INTEREST PAYMENT INTEREST AGREEMENT/BANK LOAN # DATE DATE YEARS LOAN AMOUNT PAID PAID BALANCE FREQUENCY RATE FILE #
RMB/Hullets sub-stationSub-station 31/07/1998 30/06/2013 15 10 500 000,00 10 500 000,00 - - Twice-yearly 8,71 72/694Bal per GL as @ 31/12/2013 - PMB 810/871/0931Difference -
Total Balance as per GL as @ 31/12/2013 562 090 197,52
LONG-TERM LOAN REGISTER AS AT 31 DECEMBER 2013
KZN225 Msunduzi
Contact details:
Technical enquiries to the MFMA Helpline at:[email protected]
Data submission enquiries:Elsabé Rossouw National Treasury Tel: (012) 315-5534 Electronic documents: [email protected] on formats: [email protected]
Version 2.4
Click for Instructions!
2020
Name Votes & Sub-Votes
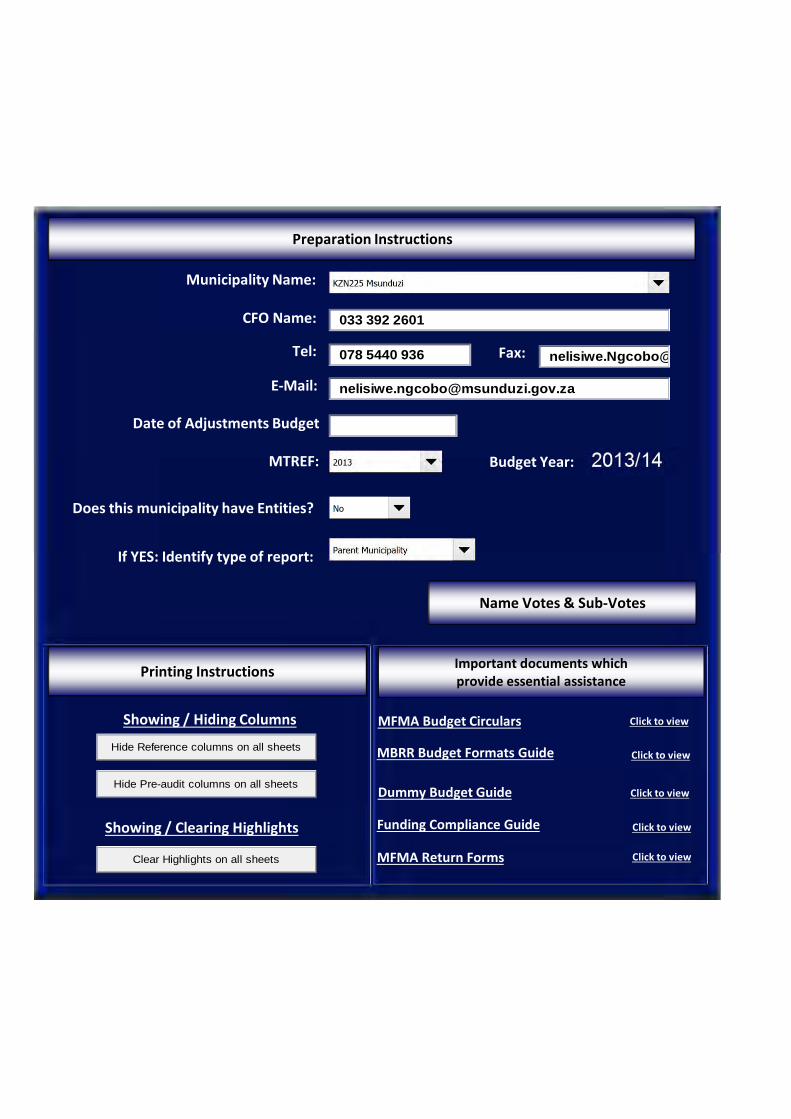
Preparation Instructions
Municipality Name:
MTREF: Budget Year:
Does this municipality have Entities?
If YES: Identify type of report:
CFO Name:
Tel:
E-Mail:
Fax:
Showing / Hiding Columns
Showing / Clearing Highlights
Date of Adjustments Budget
Printing Instructions Important documents which provide essential assistance
MFMA Budget Circulars
MBRR Budget Formats Guide
Dummy Budget Guide
Funding Compliance Guide
MFMA Return Forms
Click to view
Click to view
Click to view
Click to view
Click to view
033 392 2601
078 5440 936
nelisiwe.Ngcobo@
Hide Reference columns on all sheets
Hide Pre-audit columns on all sheets
Clear Highlights on all sheets
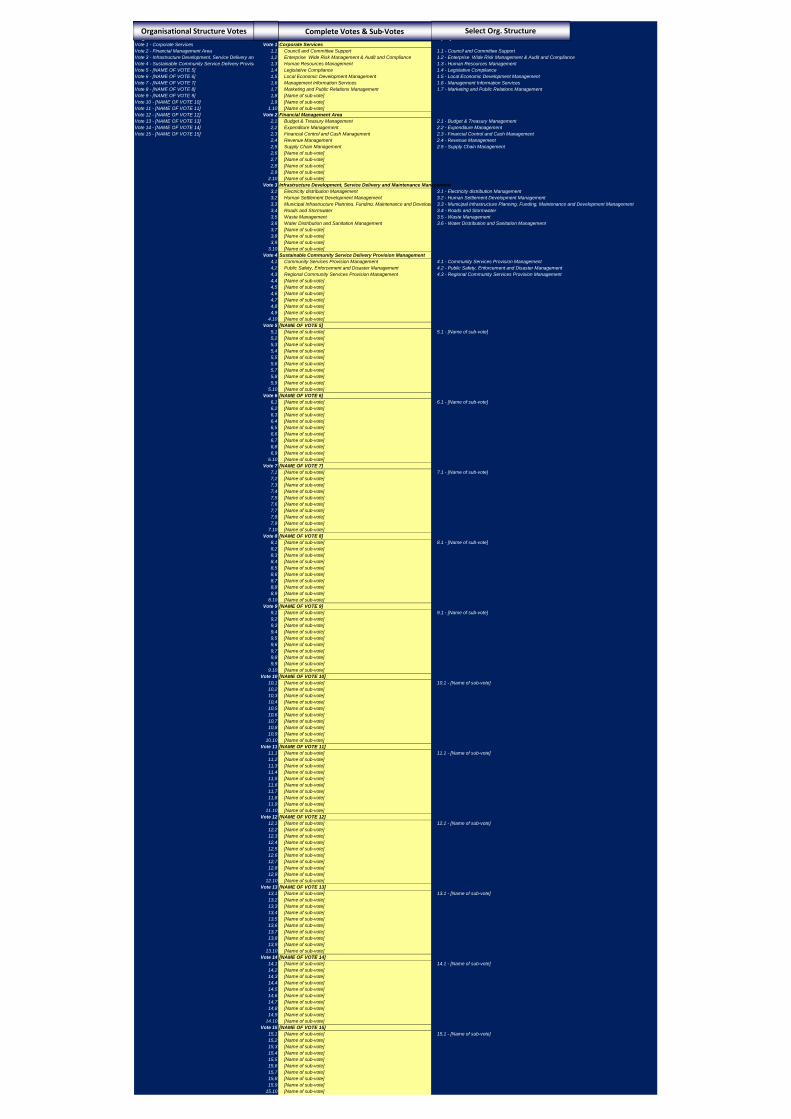
Organisational Structure Votes Organisational Structure Sub-Votes Display Sub-VotesVote 1 - Corporate Services Vote 1 Corporate Services Vote 2 - Financial Management Area 1,1 Council and Committee Support 1.1 - Council and Committee SupportVote 3 - Infrastructure Development, Service Delivery and Maintenance Management1,2 Enterprise Wide Risk Management & Audit and Compliance 1.2 - Enterprise Wide Risk Management & Audit and ComplianceVote 4 - Sustainable Community Service Delivery Provision Management1,3 Human Resources Management 1.3 - Human Resources ManagementVote 5 - [NAME OF VOTE 5] 1,4 Legislative Compliance 1.4 - Legislative ComplianceVote 6 - [NAME OF VOTE 6] 1,5 Local Economic Development Management 1.5 - Local Economic Development ManagementVote 7 - [NAME OF VOTE 7] 1,6 Management Information Services 1.6 - Management Information ServicesVote 8 - [NAME OF VOTE 8] 1,7 Marketing and Public Relations Management 1.7 - Marketing and Public Relations ManagementVote 9 - [NAME OF VOTE 9] 1,8 [Name of sub-vote]Vote 10 - [NAME OF VOTE 10] 1,9 [Name of sub-vote]Vote 11 - [NAME OF VOTE 11] 1.10 [Name of sub-vote]Vote 12 - [NAME OF VOTE 12] Vote 2 Financial Management AreaVote 13 - [NAME OF VOTE 13] 2,1 Budget & Treasury Management 2.1 - Budget & Treasury ManagementVote 14 - [NAME OF VOTE 14] 2,2 Expenditure Management 2.2 - Expenditure ManagementVote 15 - [NAME OF VOTE 15] 2,3 Financial Control and Cash Management 2.3 - Financial Control and Cash Management
2,4 Revenue Management 2.4 - Revenue Management2,5 Supply Chain Management 2.5 - Supply Chain Management2,6 [Name of sub-vote]2,7 [Name of sub-vote]2,8 [Name of sub-vote]2,9 [Name of sub-vote]
2.10 [Name of sub-vote]Vote 3 Infrastructure Development, Service Delivery and Maintenance Management
3,1 Electricity distribution Management 3.1 - Electricity distribution Management3,2 Human Settlement Development Management 3.2 - Human Settlement Development Management3,3 Municipal Infrastructure Planning, Funding, Maintenance and Development Management3.3 - Municipal Infrastructure Planning, Funding, Maintenance and Development Management3,4 Roads and Stormwater 3.4 - Roads and Stormwater3,5 Waste Management 3.5 - Waste Management3,6 Water Distribution and Sanitation Management 3.6 - Water Distribution and Sanitation Management3,7 [Name of sub-vote]3,8 [Name of sub-vote]3,9 [Name of sub-vote]
3.10 [Name of sub-vote]Vote 4 Sustainable Community Service Delivery Provision Management
4,1 Community Services Provision Management 4.1 - Community Services Provision Management4,2 Public Safety, Enforcement and Disaster Management 4.2 - Public Safety, Enforcement and Disaster Management4,3 Regional Community Services Provision Management 4.3 - Regional Community Services Provision Management4,4 [Name of sub-vote]4,5 [Name of sub-vote]4,6 [Name of sub-vote]4,7 [Name of sub-vote]4,8 [Name of sub-vote]4,9 [Name of sub-vote]
4.10 [Name of sub-vote]Vote 5 [NAME OF VOTE 5]
5,1 [Name of sub-vote] 5.1 - [Name of sub-vote]5,2 [Name of sub-vote]5,3 [Name of sub-vote]5,4 [Name of sub-vote]5,5 [Name of sub-vote]5,6 [Name of sub-vote]5,7 [Name of sub-vote]5,8 [Name of sub-vote]5,9 [Name of sub-vote]
5.10 [Name of sub-vote]Vote 6 [NAME OF VOTE 6]
6,1 [Name of sub-vote] 6.1 - [Name of sub-vote]6,2 [Name of sub-vote]6,3 [Name of sub-vote]6,4 [Name of sub-vote]6,5 [Name of sub-vote]6,6 [Name of sub-vote]6,7 [Name of sub-vote]6,8 [Name of sub-vote]6,9 [Name of sub-vote]
6.10 [Name of sub-vote]Vote 7 [NAME OF VOTE 7]
7,1 [Name of sub-vote] 7.1 - [Name of sub-vote]7,2 [Name of sub-vote]7,3 [Name of sub-vote]7,4 [Name of sub-vote]7,5 [Name of sub-vote]7,6 [Name of sub-vote]7,7 [Name of sub-vote]7,8 [Name of sub-vote]7,9 [Name of sub-vote]
7.10 [Name of sub-vote]Vote 8 [NAME OF VOTE 8]
8,1 [Name of sub-vote] 8.1 - [Name of sub-vote]8,2 [Name of sub-vote]8,3 [Name of sub-vote]8,4 [Name of sub-vote]8,5 [Name of sub-vote]8,6 [Name of sub-vote]8,7 [Name of sub-vote]8,8 [Name of sub-vote]8,9 [Name of sub-vote]
8.10 [Name of sub-vote]Vote 9 [NAME OF VOTE 9]
9,1 [Name of sub-vote] 9.1 - [Name of sub-vote]9,2 [Name of sub-vote]9,3 [Name of sub-vote]9,4 [Name of sub-vote]9,5 [Name of sub-vote]9,6 [Name of sub-vote]9,7 [Name of sub-vote]9,8 [Name of sub-vote]9,9 [Name of sub-vote]
9.10 [Name of sub-vote]Vote 10 [NAME OF VOTE 10]
10,1 [Name of sub-vote] 10.1 - [Name of sub-vote]10,2 [Name of sub-vote]10,3 [Name of sub-vote]10,4 [Name of sub-vote]10,5 [Name of sub-vote]10,6 [Name of sub-vote]10,7 [Name of sub-vote]10,8 [Name of sub-vote]10,9 [Name of sub-vote]
10.10 [Name of sub-vote]Vote 11 [NAME OF VOTE 11]
11,1 [Name of sub-vote] 11.1 - [Name of sub-vote]11,2 [Name of sub-vote]11,3 [Name of sub-vote]11,4 [Name of sub-vote]11,5 [Name of sub-vote]11,6 [Name of sub-vote]11,7 [Name of sub-vote]11,8 [Name of sub-vote]11,9 [Name of sub-vote]
11.10 [Name of sub-vote]Vote 12 [NAME OF VOTE 12]
12,1 [Name of sub-vote] 12.1 - [Name of sub-vote]12,2 [Name of sub-vote]12,3 [Name of sub-vote]12,4 [Name of sub-vote]12,5 [Name of sub-vote]12,6 [Name of sub-vote]12,7 [Name of sub-vote]12,8 [Name of sub-vote]12,9 [Name of sub-vote]
12.10 [Name of sub-vote]Vote 13 [NAME OF VOTE 13]
13,1 [Name of sub-vote] 13.1 - [Name of sub-vote]13,2 [Name of sub-vote]13,3 [Name of sub-vote]13,4 [Name of sub-vote]13,5 [Name of sub-vote]13,6 [Name of sub-vote]13,7 [Name of sub-vote]13,8 [Name of sub-vote]13,9 [Name of sub-vote]
13.10 [Name of sub-vote]Vote 14 [NAME OF VOTE 14]
14,1 [Name of sub-vote] 14.1 - [Name of sub-vote]14,2 [Name of sub-vote]14,3 [Name of sub-vote]14,4 [Name of sub-vote]14,5 [Name of sub-vote]14,6 [Name of sub-vote]14,7 [Name of sub-vote]14,8 [Name of sub-vote]14,9 [Name of sub-vote]
14.10 [Name of sub-vote]Vote 15 [NAME OF VOTE 15]
15,1 [Name of sub-vote] 15.1 - [Name of sub-vote]15,2 [Name of sub-vote]15,3 [Name of sub-vote]15,4 [Name of sub-vote]15,5 [Name of sub-vote]15,6 [Name of sub-vote]15,7 [Name of sub-vote]15,8 [Name of sub-vote]15,9 [Name of sub-vote]
15.10 [Name of sub-vote]
Complete Votes & Sub-VotesOrganisational Structure Votes Select Org. Structure
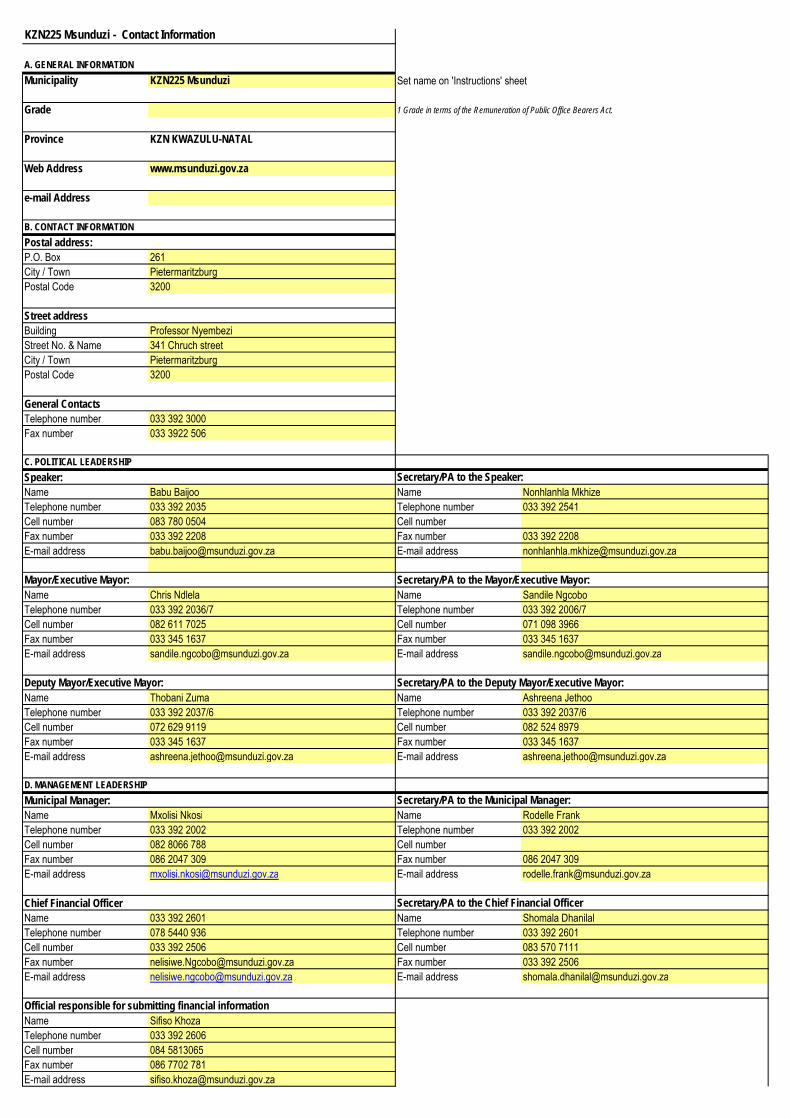
KZN225 Msunduzi - Contact Information
A. GENERAL INFORMATIONMunicipality KZN225 Msunduzi Set name on 'Instructions' sheet
Grade 1 Grade in terms of the Remuneration of Public Office Bearers Act.
Province KZN KWAZULU-NATAL
Web Address www.msunduzi.gov.za
e-mail Address
Postal address:P.O. Box 261City / Town PietermaritzburgPostal Code 3200
Street addressBuilding Professor NyembeziStreet No. & Name 341 Chruch streetCity / Town PietermaritzburgPostal Code 3200
General ContactsTelephone number 033 392 3000Fax number 033 3922 506
Speaker:Name Babu Baijoo Name Nonhlanhla MkhizeTelephone number 033 392 2035 Telephone number 033 392 2541Cell number 083 780 0504 Cell numberFax number 033 392 2208 Fax number 033 392 2208E-mail address [email protected] E-mail address [email protected]
Name Chris Ndlela Name Sandile NgcoboTelephone number 033 392 2036/7 Telephone number 033 392 2006/7Cell number 082 611 7025 Cell number 071 098 3966Fax number 033 345 1637 Fax number 033 345 1637E-mail address [email protected] E-mail address [email protected]
Name Thobani Zuma Name Ashreena JethooTelephone number 033 392 2037/6 Telephone number 033 392 2037/6Cell number 072 629 9119 Cell number 082 524 8979Fax number 033 345 1637 Fax number 033 345 1637E-mail address [email protected] E-mail address [email protected]
Municipal Manager:Name Mxolisi Nkosi Name Rodelle FrankTelephone number 033 392 2002 Telephone number 033 392 2002Cell number 082 8066 788 Cell numberFax number 086 2047 309 Fax number 086 2047 309E-mail address [email protected] E-mail address [email protected]
Chief Financial OfficerName 033 392 2601 Name Shomala DhanilalTelephone number 078 5440 936 Telephone number 033 392 2601Cell number 033 392 2506 Cell number 083 570 7111Fax number [email protected] Fax number 033 392 2506E-mail address [email protected] E-mail address [email protected]
Name Sifiso KhozaTelephone number 033 392 2606Cell number 084 5813065Fax number 086 7702 781E-mail address [email protected]
Secretary/PA to the Municipal Manager:
Secretary/PA to the Chief Financial Officer
Official responsible for submitting financial information
D. MANAGEMENT LEADERSHIP
B. CONTACT INFORMATION
C. POLITICAL LEADERSHIPSecretary/PA to the Speaker:
Mayor/Executive Mayor: Secretary/PA to the Mayor/Executive Mayor:
Deputy Mayor/Executive Mayor: Secretary/PA to the Deputy Mayor/Executive Mayor:
KZN225 Msunduzi - Table B1 Adjustments Budget Summary -
Budget Year +1 2014/15
Budget Year +2 2015/16
Original Budget Prior Adjusted Accum. Funds Multi-year
capitalUnfore.
Unavoid.Nat. or Prov.
Govt Other Adjusts. Total Adjusts. Adjusted Budget
Adjusted Budget
Adjusted Budget
1 2 3 4 5 6 7 8R thousands A A1 B C D E F G HFinancial Performance
Property rates 644 671 – – – – – – – 644 671 702 973 742 242 Service charges 2 147 016 – – – – – (42 351) (42 351) 2 104 665 2 334 733 2 539 739 Investment revenue 27 029 – – – – – – – 27 029 27 454 28 519 Transfers recognised - operational 383 848 – – – – – – – 383 848 402 067 422 980 Other own revenue 88 920 – – – – – – – 88 920 77 875 80 623
Total Revenue (excluding capital transfers and contributions)
3 291 484 – – – – – (42 351) (42 351) 3 249 133 3 545 102 3 814 104
Employee costs 779 721 – – – – – (15 200) (15 200) 764 521 819 440 861 792 Remuneration of councillors 36 419 – – – – – – – 36 419 38 422 40 535 Depreciation & asset impairment 222 212 – – – – – – – 222 212 256 533 282 183 Finance charges 64 600 – – – – – – – 64 600 59 255 54 480 Materials and bulk purchases 1 517 751 – – – – – (2 000) (2 000) 1 515 751 1 675 853 1 795 718 Transfers and grants 5 027 – – – – – – – 5 027 5 274 5 563 Other expenditure 599 169 – – – – – (25 151) (25 151) 574 018 625 768 723 833
Total Expenditure 3 224 899 – – – – – (42 351) (42 351) 3 182 548 3 480 545 3 764 103
Surplus/(Deficit) 66 585 – – – – – (0) (0) 66 585 64 557 50 000 Transfers recognised - capital 383 158 – – – – – 40 682 40 682 423 840 204 271 202 390 Contributions recognised - capital & contributed assets – – – – – – – – – – –
Surplus/(Deficit) after capital transfers & contributions
449 743 – – – – – 40 682 40 682 490 425 268 828 252 390
Share of surplus/ (deficit) of associate – – – – – – – – – – – Surplus/ (Deficit) for the year 449 743 – – – – – 40 682 40 682 490 425 268 828 252 390
Capital expenditure & funds sourcesCapital expenditure 443 158 – – – – 9 763 70 213 79 976 523 134 264 271 252 390
Transfers recognised - capital 383 158 – – – – – 36 490 36 490 419 648 204 271 202 390 Public contributions & donations – – – – – – – – – – – Borrowing – – – – – – 4 193 4 193 4 193 – – Internally generated funds 60 000 – – – – – 39 294 39 294 99 294 60 000 50 000
Total sources of capital funds 443 159 – – – – – 79 976 79 976 523 135 264 271 252 390
Financial positionTotal current assets 1 403 494 – – – – – 1 006 901 1 006 901 2 410 395 1 679 462 2 608 937 Total non current assets 6 987 704 – – – – – (154 891) (154 891) 6 832 813 6 910 846 6 794 917 Total current liabilities 730 078 – – – – – 136 202 136 202 866 280 422 230 455 604 Total non current liabilities 573 000 – – – – – 526 770 526 770 1 099 770 503 000 430 000
Community wealth/Equity 7 088 120 – – – – – 355 709 355 709 7 443 829 7 665 078 8 518 250
Cash flowsNet cash from (used) operating 395 062 – – – – – 457 483 457 483 852 545 283 570 141 211 Net cash from (used) investing (285 819) – – – – – (96 063) (96 063) (381 882) (194 686) (193 010) Net cash from (used) financing (41 453) – – – – – – – (41 453) 40 645 233 145
Cash/cash equivalents at the year end 898 552 – – – – – 361 421 361 421 1 259 973 1 028 081 1 209 427
Cash backing/surplus reconciliationCash and investments available 603 763 – – – – – 263 162 263 162 866 925 633 347 1 656 546 Application of cash and investments 556 820 – – – – – 628 572 628 572 1 185 393 724 119 692 385
Balance - surplus (shortfall) 46 942 – – – – – (365 410) (365 410) (318 467) (90 772) 964 161
Asset ManagementAsset register summary (WDV) 6 953 432 – – – – – – – 6 953 432 6 878 358 6 758 489 Depreciation & asset impairment 222 212 – – – – – – – 222 212 256 533 282 183 Renewal of Existing Assets 268 858 – – – – 38 700 16 698 55 398 324 255 187 929 190 400 Repairs and Maintenance 94 956 – – – – – (7 213) (7 213) 87 743 99 267 130 406
Free servicesCost of Free Basic Services provided – – – – – – – – – – – Revenue cost of free services provided 363 502 – – – – – – – 363 502 391 259 420 337 Households below minimum service level
Water: – – – – – – – – – – – Sanitation/sewerage: – – – – – – – – – – – Energy: – – – – – – – – – – – Refuse: 54 – – – – – – – 54 34 20
Budget Year 2013/14
Description
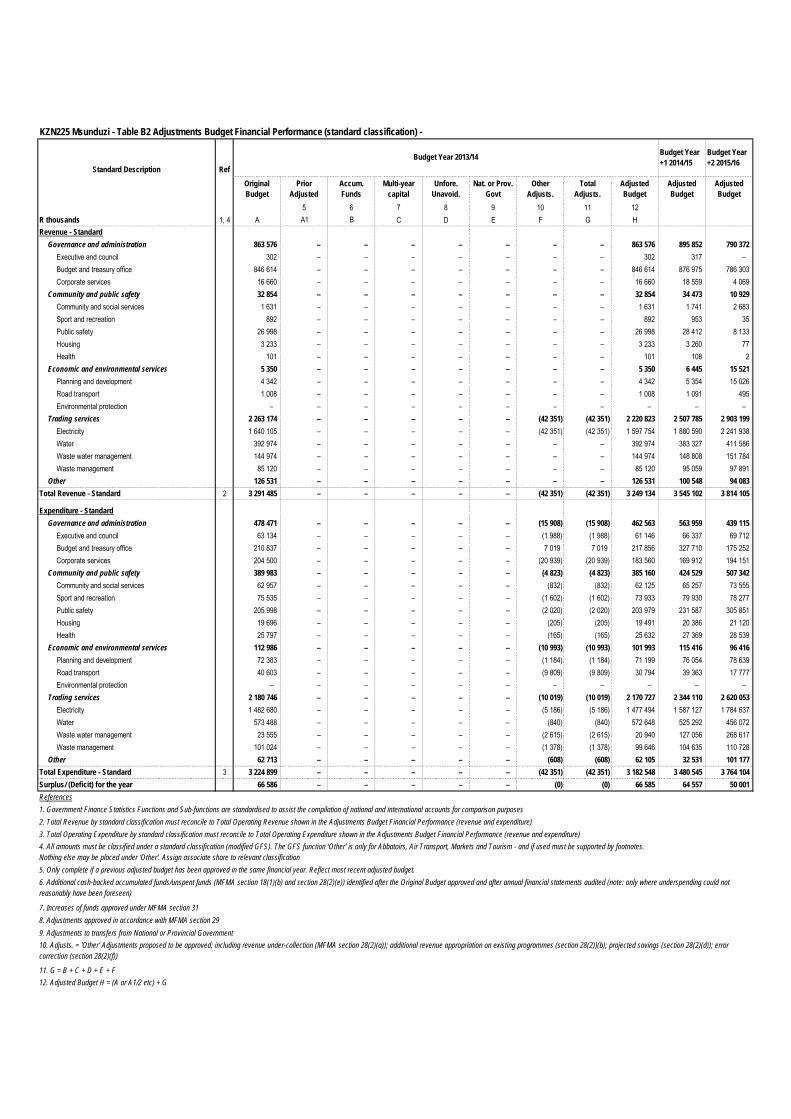
KZN225 Msunduzi - Table B2 Adjustments Budget Financial Performance (standard classification) -
Budget Year +1 2014/15
Budget Year +2 2015/16
Original Budget
Prior Adjusted
Accum. Funds
Multi-year capital
Unfore. Unavoid.
Nat. or Prov. Govt
Other Adjusts.
Total Adjusts.
Adjusted Budget
Adjusted Budget
Adjusted Budget
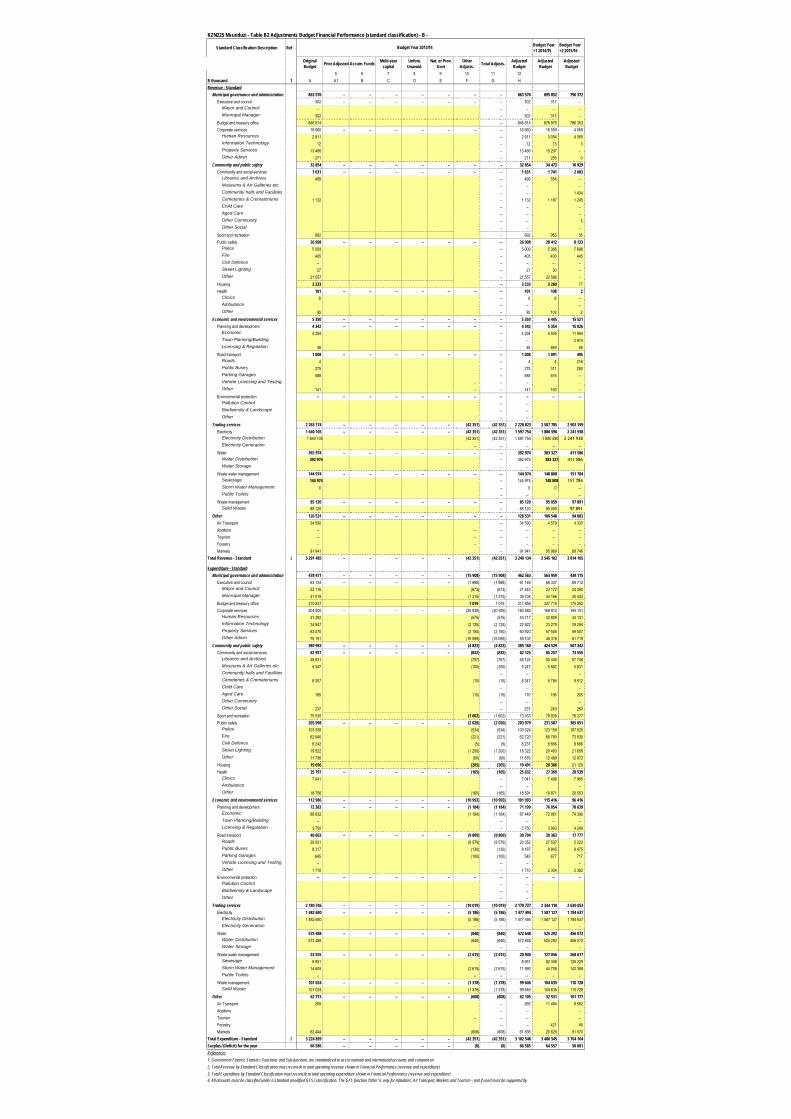
5 6 7 8 9 10 11 12R thousands 1, 4 A A1 B C D E F G HRevenue - Standard
Governance and administration 863 576 – – – – – – – 863 576 895 852 790 372 Executive and council 302 – – – – – – – 302 317 – Budget and treasury office 846 614 – – – – – – – 846 614 876 975 786 303 Corporate services 16 660 – – – – – – – 16 660 18 559 4 069
Community and public safety 32 854 – – – – – – – 32 854 34 473 10 929 Community and social services 1 631 – – – – – – – 1 631 1 741 2 683 Sport and recreation 892 – – – – – – – 892 953 35 Public safety 26 998 – – – – – – – 26 998 28 412 8 133 Housing 3 233 – – – – – – – 3 233 3 260 77 Health 101 – – – – – – – 101 108 2
Economic and environmental services 5 350 – – – – – – – 5 350 6 445 15 521 Planning and development 4 342 – – – – – – – 4 342 5 354 15 026 Road transport 1 008 – – – – – – – 1 008 1 091 495 Environmental protection – – – – – – – – – – –
Trading services 2 263 174 – – – – – (42 351) (42 351) 2 220 823 2 507 785 2 903 199 Electricity 1 640 105 – – – – – (42 351) (42 351) 1 597 754 1 880 590 2 241 938 Water 392 974 – – – – – – – 392 974 383 327 411 586 Waste water management 144 974 – – – – – – – 144 974 148 808 151 784 Waste management 85 120 – – – – – – – 85 120 95 059 97 891
Other 126 531 – – – – – – – 126 531 100 548 94 083 Total Revenue - Standard 2 3 291 485 – – – – – (42 351) (42 351) 3 249 134 3 545 102 3 814 105
Expenditure - StandardGovernance and administration 478 471 – – – – – (15 908) (15 908) 462 563 563 959 439 115
Executive and council 63 134 – – – – – (1 988) (1 988) 61 146 66 337 69 712 Budget and treasury office 210 837 – – – – – 7 019 7 019 217 856 327 710 175 252 Corporate services 204 500 – – – – – (20 939) (20 939) 183 560 169 912 194 151
Community and public safety 389 983 – – – – – (4 823) (4 823) 385 160 424 529 507 342 Community and social services 62 957 – – – – – (832) (832) 62 125 65 257 73 555 Sport and recreation 75 535 – – – – – (1 602) (1 602) 73 933 79 930 78 277 Public safety 205 998 – – – – – (2 020) (2 020) 203 979 231 587 305 851 Housing 19 696 – – – – – (205) (205) 19 491 20 386 21 120 Health 25 797 – – – – – (165) (165) 25 632 27 369 28 539
Economic and environmental services 112 986 – – – – – (10 993) (10 993) 101 993 115 416 96 416 Planning and development 72 383 – – – – – (1 184) (1 184) 71 199 76 054 78 639 Road transport 40 603 – – – – – (9 809) (9 809) 30 794 39 363 17 777 Environmental protection – – – – – – – – – – –
Trading services 2 180 746 – – – – – (10 019) (10 019) 2 170 727 2 344 110 2 620 053 Electricity 1 482 680 – – – – – (5 186) (5 186) 1 477 494 1 587 127 1 784 637 Water 573 488 – – – – – (840) (840) 572 648 525 292 456 072 Waste water management 23 555 – – – – – (2 615) (2 615) 20 940 127 056 268 617 Waste management 101 024 – – – – – (1 378) (1 378) 99 646 104 635 110 728
Other 62 713 – – – – – (608) (608) 62 105 32 531 101 177 Total Expenditure - Standard 3 3 224 899 – – – – – (42 351) (42 351) 3 182 548 3 480 545 3 764 104 Surplus/ (Deficit) for the year 66 586 – – – – – (0) (0) 66 585 64 557 50 001 References1. Government Finance Statistics Functions and Sub-functions are standardised to assist the compilation of national and international accounts for comparison purposes2. Total Revenue by standard classification must reconcile to Total Operating Revenue shown in the Adjustments Budget Financial Performance (revenue and expenditure)
9. Adjustments to transfers from National or Provincial Government
11. G = B + C + D + E + F
3. Total Operating Expenditure by standard classification must reconcile to Total Operating Expenditure shown in the Adjustments Budget Financial Performance (revenue and expenditure)
Budget Year 2013/14
4. All amounts must be classified under a standard classification (modified GFS). The GFS function 'Other' is only for Abbatoirs, Air Transport, Markets and Tourism - and if used must be supported by footnotes. Nothing else may be placed under 'Other'. Assign associate share to relevant classification
12. Adjusted Budget H = (A or A1/2 etc) + G
7. Increases of funds approved under MFMA section 318. Adjustments approved in accordance with MFMA section 29
10. Adjusts. = 'Other' Adjustments proposed to be approved; including revenue under-collection (MFMA section 28(2)(a)); additional revenue appropriation on existing programmes (section 28(2))(b); projected savings (section 28(2)(d)); error correction (section 28(2)(f))
Standard Description Ref
5. Only complete if a previous adjusted budget has been approved in the same financial year. Reflect most recent adjusted budget.6. Additional cash-backed accumulated funds/unspent funds (MFMA section 18(1)(b) and section 28(2)(e)) identified after the Original Budget approved and after annual financial statements audited (note: only where underspending could not reasonably have been foreseen)
KZN225 Msunduzi - Table B2 Adjustments Budget Financial Performance (standard classification) - B -
Standard Classification Description Ref Budget Year +1 2014/15
Budget Year +2 2015/16
Original Budget Prior Adjusted Accum. Funds Multi-year
capitalUnfore.
Unavoid.Nat. or Prov.
GovtOther
Adjusts. Total Adjusts. Adjusted Budget
Adjusted Budget
Adjusted Budget
5 6 7 8 9 10 11 12R thousand 1 A A1 B C D E F G HRevenue - Standard
Municipal governance and administration 863 576 – – – – – – – 863 576 895 852 790 372 Executive and council 302 – – – – – – – 302 317 –
Mayor and Council – – – – – Municipal Manager 302 – 302 317 –
Budget and treasury office 846 614 – 846 614 876 975 786 303 Corporate services 16 660 – – – – – – – 16 660 18 559 4 069
Human Resources 2 911 – 2 911 3 054 4 065 Information Technology 12 – 12 13 3 Property Services 13 466 – 13 466 15 207 – Other Admin 271 – 271 285 0
Community and public safety 32 854 – – – – – – – 32 854 34 473 10 929 Community and social services 1 631 – – – – – – – 1 631 1 741 2 683
Libraries and Archives 499 – 499 554 – Museums & Art Galleries etc – – – Community halls and Facilities – – 1 434 Cemeteries & Crematoriums 1 132 – 1 132 1 187 1 245 Child Care – – – Aged Care – – – Other Community – – 5 Other Social – – –
Sport and recreation 892 – 892 953 35 Public safety 26 998 – – – – – – – 26 998 28 412 8 133
Police 5 009 – 5 009 5 366 7 688 Fire 405 – 405 430 445 Civil Defence – – – – – Street Lighting 27 – 27 30 – Other 21 557 – 21 557 22 586 –
Housing 3 233 – 3 233 3 260 77 Health 101 – – – – – – – 101 108 2
Clinics 6 – 6 6 – Ambulance – – – Other 95 – 95 102 2
Economic and environmental services 5 350 – – – – – – – 5 350 6 445 15 521 Planning and development 4 342 – – – – – – – 4 342 5 354 15 026
Economic Development/Planning
4 294 – 4 294 4 505 11 994 Town Planning/Building enforcement
– – 2 974 Licensing & Regulation 48 – 48 849 58
Road transport 1 008 – – – – – – – 1 008 1 091 495 Roads 4 – 4 4 216 Public Buses 275 – 275 311 280 Parking Garages 588 – 588 616 – Vehicle Licensing and Testing – – – – Other 141 – – 141 160 –
Environmental protection – – – – – – – – – – – Pollution Control – – Biodiversity & Landscape – – Other – –
Trading services 2 263 174 – – – – – (42 351) (42 351) 2 220 823 2 507 785 2 903 199 Electricity 1 640 105 – – – – – (42 351) (42 351) 1 597 754 1 880 590 2 241 938
Electricity Distribution 1 640 105 (42 351) (42 351) 1 597 754 1 880 590 2 241 938 Electricity Generation – – – – –
Water 392 974 – – – – – – – 392 974 383 327 411 586 Water Distribution 392 974 – 392 974 383 327 411 586 Water Storage – –
Waste water management 144 974 – – – – – – – 144 974 148 808 151 784 Sewerage 144 974 – 144 974 148 808 151 784 Storm Water Management 0 – 0 0 – Public Toilets – – –
Waste management 85 120 – – – – – – – 85 120 95 059 97 891 Solid Waste 85 120 – 85 120 95 059 97 891
Other 126 531 – – – – – – – 126 531 100 548 94 083 Air Transport 34 590 – 34 590 4 579 4 337 Abattoirs – – – – – – Tourism – – – – – – Forestry – – – – – – Markets 91 941 – 91 941 95 969 89 746
Total Revenue - Standard 2 3 291 485 – – – – – (42 351) (42 351) 3 249 134 3 545 102 3 814 105
Expenditure - StandardMunicipal governance and administration 478 471 – – – – – (15 908) (15 908) 462 563 563 959 439 115
Executive and council 63 134 – – – – – (1 988) (1 988) 61 146 66 337 69 712 Mayor and Council 22 116 (673) (673) 21 443 23 172 24 280 Municipal Manager 41 019 (1 315) (1 315) 39 704 43 166 45 432
Budget and treasury office 210 837 7 019 7 019 217 856 327 710 175 252 Corporate services 204 500 – – – – – (20 939) (20 939) 183 560 169 912 194 151
Human Resources 41 292 (575) (575) 40 717 42 809 44 131 Information Technology 24 947 (2 125) (2 125) 22 822 23 279 29 294 Property Services 63 070 (2 150) (2 150) 60 920 57 505 59 007 Other Admin 75 191 (16 089) (16 089) 59 102 46 318 61 719
Community and public safety 389 983 – – – – – (4 823) (4 823) 385 160 424 529 507 342 Community and social services 62 957 – – – – – (832) (832) 62 125 65 257 73 555
Libraries and Archives 48 831 (707) (707) 48 124 50 446 57 746 Museums & Art Galleries etc 5 347 (100) (100) 5 247 5 582 5 831 Community halls and Facilities – – – Cemeteries & Crematoriums 8 357 (10) (10) 8 347 8 784 9 512 Child Care – – – Aged Care 185 (15) (15) 170 196 205 Other Community – – – Other Social 237 – 237 249 260
Sport and recreation 75 535 (1 602) (1 602) 73 933 79 930 78 277 Public safety 205 998 – – – – – (2 020) (2 020) 203 979 231 587 305 851
Police 103 558 (534) (534) 103 024 123 159 187 625 Fire 62 940 (221) (221) 62 720 66 780 73 930 Civil Defence 8 242 (5) (5) 8 237 8 666 9 666 Street Lighting 19 522 (1 200) (1 200) 18 322 20 493 21 658 Other 11 736 (60) (60) 11 676 12 489 12 972
Housing 19 696 (205) (205) 19 491 20 386 21 120 Health 25 797 – – – – – (165) (165) 25 632 27 369 28 539
Clinics 7 041 – 7 041 7 498 7 985 Ambulance – – – Other 18 756 (165) (165) 18 591 19 871 20 553
Economic and environmental services 112 986 – – – – – (10 993) (10 993) 101 993 115 416 96 416 Planning and development 72 383 – – – – – (1 184) (1 184) 71 199 76 054 78 639
Economic Development/Planning
68 632 (1 184) (1 184) 67 449 72 061 74 390 Town Planning/Building enforcement
– – – – – Licensing & Regulation 3 750 – 3 750 3 993 4 249
Road transport 40 603 – – – – – (9 809) (9 809) 30 794 39 363 17 777 Roads 29 931 (9 579) (9 579) 20 352 27 537 5 223 Public Buses 8 317 (130) (130) 8 187 8 845 9 475 Parking Garages 645 (100) (100) 545 677 717 Vehicle Licensing and Testing – – – – Other 1 710 – 1 710 2 304 2 362
Environmental protection – – – – – – – – – – – Pollution Control – – Biodiversity & Landscape – – Other – –
Trading services 2 180 746 – – – – – (10 019) (10 019) 2 170 727 2 344 110 2 620 053 Electricity 1 482 680 – – – – – (5 186) (5 186) 1 477 494 1 587 127 1 784 637
Electricity Distribution 1 482 680 (5 186) (5 186) 1 477 494 1 587 127 1 784 637 Electricity Generation – – – –
Water 573 488 – – – – – (840) (840) 572 648 525 292 456 072 Water Distribution 573 488 (840) (840) 572 648 525 292 456 072 Water Storage – – –
Waste water management 23 555 – – – – – (2 615) (2 615) 20 940 127 056 268 617 Sewerage 8 951 – 8 951 82 348 126 229 Storm Water Management 14 605 (2 615) (2 615) 11 990 44 708 142 388 Public Toilets – – – – – –
Waste management 101 024 – – – – – (1 378) (1 378) 99 646 104 635 110 728 Solid Waste 101 024 (1 378) (1 378) 99 646 104 635 110 728
Other 62 713 – – – – – (608) (608) 62 105 32 531 101 177 Air Transport 269 – 269 11 484 9 562 Abattoirs – – – Tourism – – – – Forestry – – 421 46 Markets 62 444 (608) (608) 61 836 20 626 91 570
Total Expenditure - Standard 3 3 224 899 – – – – – (42 351) (42 351) 3 182 548 3 480 545 3 764 104 Surplus/ (Deficit) for the year 66 586 – – – – – (0) (0) 66 585 64 557 50 001 References1. Government Finance Statistics Functions and Sub-functions are standardised to assist national and international accounts and comparison2. Total Revenue by Standard Classification must reconcile to total operating revenue shown in Financial Performance (revenue and expenditure)3. Total Expenditure by Standard Classification must reconcile to total operating expenditure shown in Financial Performance (revenue and expenditure)4. All amounts must be classified under a Standard (modified GFS) classification. The GFS function 'Other' is only for Abbatoirs, Air Transport, Markets and Tourism - and if used must be supported by footnotes. Nothing else may be placed under 'Other'. Assign associate share to relevant classification
Budget Year 2013/14
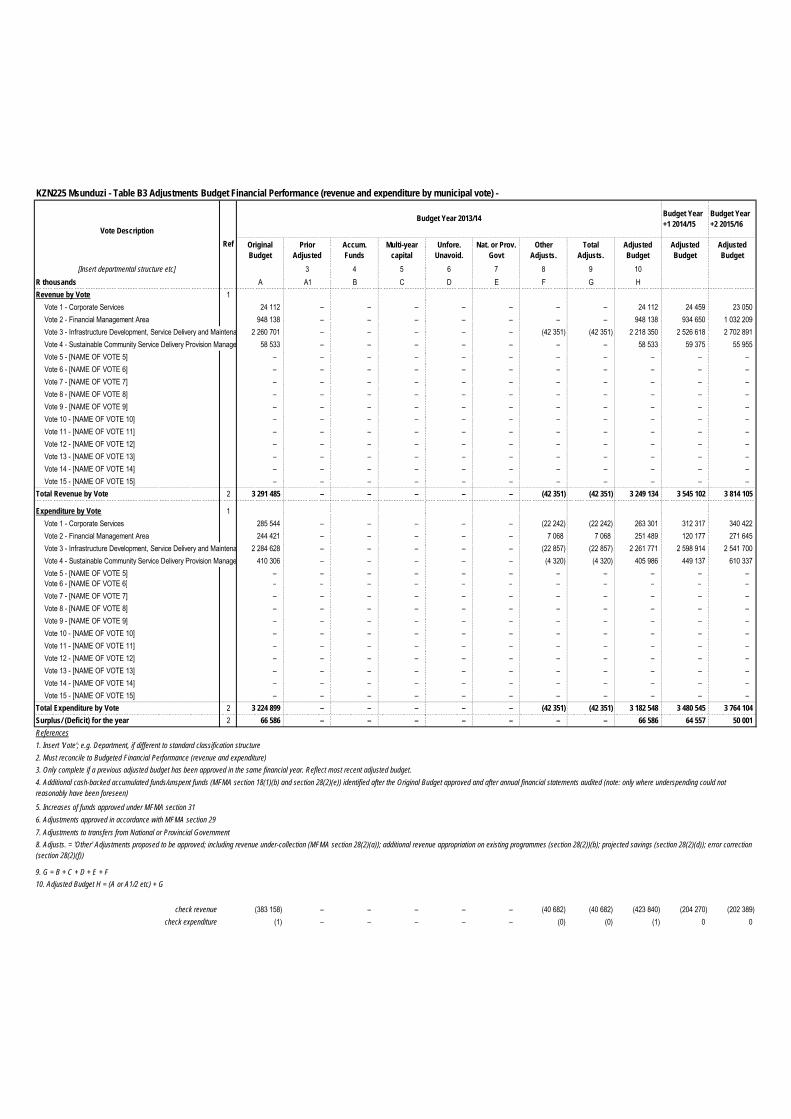
KZN225 Msunduzi - Table B3 Adjustments Budget Financial Performance (revenue and expenditure by municipal vote) -
Budget Year +1 2014/15
Budget Year +2 2015/16
Original Budget
Prior Adjusted
Accum. Funds
Multi-year capital
Unfore. Unavoid.
Nat. or Prov. Govt
Other Adjusts.
Total Adjusts.
Adjusted Budget
Adjusted Budget
Adjusted Budget
[Insert departmental structure etc] 3 4 5 6 7 8 9 10R thousands A A1 B C D E F G HRevenue by Vote 1
Vote 1 - Corporate Services 24 112 – – – – – – – 24 112 24 459 23 050 Vote 2 - Financial Management Area 948 138 – – – – – – – 948 138 934 650 1 032 209 Vote 3 - Infrastructure Development, Service Delivery and Maintenance Management2 260 701 – – – – – (42 351) (42 351) 2 218 350 2 526 618 2 702 891 Vote 4 - Sustainable Community Service Delivery Provision Management 58 533 – – – – – – – 58 533 59 375 55 955 Vote 5 - [NAME OF VOTE 5] – – – – – – – – – – – Vote 6 - [NAME OF VOTE 6] – – – – – – – – – – – Vote 7 - [NAME OF VOTE 7] – – – – – – – – – – – Vote 8 - [NAME OF VOTE 8] – – – – – – – – – – – Vote 9 - [NAME OF VOTE 9] – – – – – – – – – – – Vote 10 - [NAME OF VOTE 10] – – – – – – – – – – – Vote 11 - [NAME OF VOTE 11] – – – – – – – – – – – Vote 12 - [NAME OF VOTE 12] – – – – – – – – – – – Vote 13 - [NAME OF VOTE 13] – – – – – – – – – – – Vote 14 - [NAME OF VOTE 14] – – – – – – – – – – – Vote 15 - [NAME OF VOTE 15] – – – – – – – – – – –
Total Revenue by Vote 2 3 291 485 – – – – – (42 351) (42 351) 3 249 134 3 545 102 3 814 105
Expenditure by Vote 1Vote 1 - Corporate Services 285 544 – – – – – (22 242) (22 242) 263 301 312 317 340 422 Vote 2 - Financial Management Area 244 421 – – – – – 7 068 7 068 251 489 120 177 271 645 Vote 3 - Infrastructure Development, Service Delivery and Maintenance Management2 284 628 – – – – – (22 857) (22 857) 2 261 771 2 598 914 2 541 700 Vote 4 - Sustainable Community Service Delivery Provision Management 410 306 – – – – – (4 320) (4 320) 405 986 449 137 610 337 Vote 5 - [NAME OF VOTE 5] – – – – – – – – – – – Vote 6 - [NAME OF VOTE 6] – – – – – – – – – – – Vote 7 - [NAME OF VOTE 7] – – – – – – – – – – – Vote 8 - [NAME OF VOTE 8] – – – – – – – – – – – Vote 9 - [NAME OF VOTE 9] – – – – – – – – – – – Vote 10 - [NAME OF VOTE 10] – – – – – – – – – – – Vote 11 - [NAME OF VOTE 11] – – – – – – – – – – – Vote 12 - [NAME OF VOTE 12] – – – – – – – – – – – Vote 13 - [NAME OF VOTE 13] – – – – – – – – – – – Vote 14 - [NAME OF VOTE 14] – – – – – – – – – – – Vote 15 - [NAME OF VOTE 15] – – – – – – – – – – –
Total Expenditure by Vote 2 3 224 899 – – – – – (42 351) (42 351) 3 182 548 3 480 545 3 764 104 Surplus/ (Deficit) for the year 2 66 586 – – – – – – – 66 586 64 557 50 001 References1. Insert 'Vote'; e.g. Department, if different to standard classification structure2. Must reconcile to Budgeted Financial Performance (revenue and expenditure)
7. Adjustments to transfers from National or Provincial Government
9. G = B + C + D + E + F
check revenue (383 158) – – – – – (40 682) (40 682) (423 840) (204 270) (202 389) check expenditure (1) – – – – – (0) (0) (1) 0 0
10. Adjusted Budget H = (A or A1/2 etc) + G
6. Adjustments approved in accordance with MFMA section 29
8. Adjusts. = 'Other' Adjustments proposed to be approved; including revenue under-collection (MFMA section 28(2)(a)); additional revenue appropriation on existing programmes (section 28(2))(b); projected savings (section 28(2)(d)); error correction (section 28(2)(f))
Vote DescriptionRef
Budget Year 2013/14
3. Only complete if a previous adjusted budget has been approved in the same financial year. Reflect most recent adjusted budget.4. Additional cash-backed accumulated funds/unspent funds (MFMA section 18(1)(b) and section 28(2)(e)) identified after the Original Budget approved and after annual financial statements audited (note: only where underspending could not reasonably have been foreseen)
5. Increases of funds approved under MFMA section 31
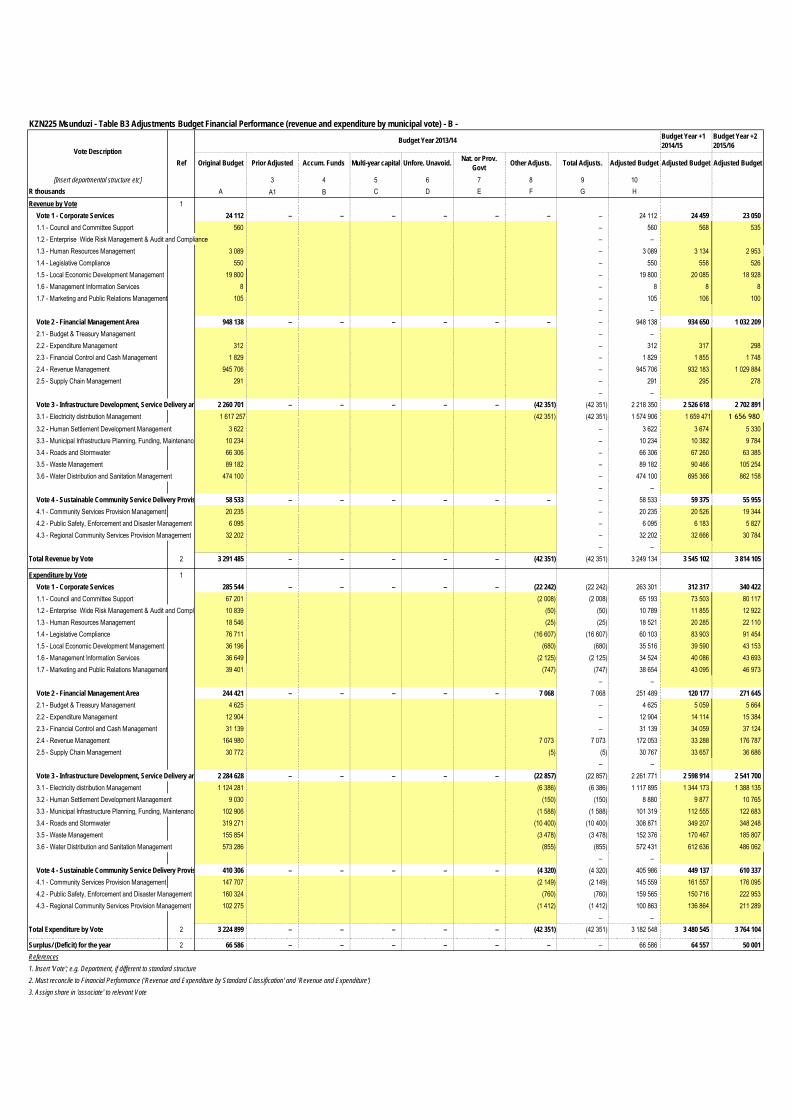
KZN225 Msunduzi - Table B3 Adjustments Budget Financial Performance (revenue and expenditure by municipal vote) - B - Budget Year +1 2014/15
Budget Year +2 2015/16
Original Budget Prior Adjusted Accum. Funds Multi-year capital Unfore. Unavoid. Nat. or Prov. Govt Other Adjusts. Total Adjusts. Adjusted Budget Adjusted Budget Adjusted Budget
[Insert departmental structure etc] 3 4 5 6 7 8 9 10R thousands A A1 B C D E F G HRevenue by Vote 1
Vote 1 - Corporate Services 24 112 – – – – – – – 24 112 24 459 23 050 1.1 - Council and Committee Support 560 – 560 568 535 1.2 - Enterprise Wide Risk Management & Audit and Compliance – – 1.3 - Human Resources Management 3 089 – 3 089 3 134 2 953 1.4 - Legislative Compliance 550 – 550 558 526 1.5 - Local Economic Development Management 19 800 – 19 800 20 085 18 928 1.6 - Management Information Services 8 – 8 8 8 1.7 - Marketing and Public Relations Management 105 – 105 106 100
– – Vote 2 - Financial Management Area 948 138 – – – – – – – 948 138 934 650 1 032 209 2.1 - Budget & Treasury Management – – 2.2 - Expenditure Management 312 – 312 317 298 2.3 - Financial Control and Cash Management 1 829 – 1 829 1 855 1 748 2.4 - Revenue Management 945 706 – 945 706 932 183 1 029 884 2.5 - Supply Chain Management 291 – 291 295 278
– – Vote 3 - Infrastructure Development, Service Delivery and Maintenance Management2 260 701 – – – – – (42 351) (42 351) 2 218 350 2 526 618 2 702 891 3.1 - Electricity distribution Management 1 617 257 (42 351) (42 351) 1 574 906 1 659 471 1 656 980
3.2 - Human Settlement Development Management 3 622 – 3 622 3 674 5 330 3.3 - Municipal Infrastructure Planning, Funding, Maintenance and Development Management10 234 – 10 234 10 382 9 784 3.4 - Roads and Stormwater 66 306 – 66 306 67 260 63 385 3.5 - Waste Management 89 182 – 89 182 90 466 105 254 3.6 - Water Distribution and Sanitation Management 474 100 – 474 100 695 366 862 158
– – Vote 4 - Sustainable Community Service Delivery Provision Management58 533 – – – – – – – 58 533 59 375 55 955 4.1 - Community Services Provision Management 20 235 – 20 235 20 526 19 344 4.2 - Public Safety, Enforcement and Disaster Management 6 095 – 6 095 6 183 5 827 4.3 - Regional Community Services Provision Management 32 202 – 32 202 32 666 30 784
– – Total Revenue by Vote 2 3 291 485 – – – – – (42 351) (42 351) 3 249 134 3 545 102 3 814 105
Expenditure by Vote 1Vote 1 - Corporate Services 285 544 – – – – – (22 242) (22 242) 263 301 312 317 340 422 1.1 - Council and Committee Support 67 201 (2 008) (2 008) 65 193 73 503 80 117 1.2 - Enterprise Wide Risk Management & Audit and Compliance 10 839 (50) (50) 10 789 11 855 12 922 1.3 - Human Resources Management 18 546 (25) (25) 18 521 20 285 22 110 1.4 - Legislative Compliance 76 711 (16 607) (16 607) 60 103 83 903 91 454 1.5 - Local Economic Development Management 36 196 (680) (680) 35 516 39 590 43 153 1.6 - Management Information Services 36 649 (2 125) (2 125) 34 524 40 086 43 693 1.7 - Marketing and Public Relations Management 39 401 (747) (747) 38 654 43 095 46 973
– – Vote 2 - Financial Management Area 244 421 – – – – – 7 068 7 068 251 489 120 177 271 645 2.1 - Budget & Treasury Management 4 625 – 4 625 5 059 5 664 2.2 - Expenditure Management 12 904 – 12 904 14 114 15 384 2.3 - Financial Control and Cash Management 31 139 – 31 139 34 059 37 124 2.4 - Revenue Management 164 980 7 073 7 073 172 053 33 288 176 787 2.5 - Supply Chain Management 30 772 (5) (5) 30 767 33 657 36 686
– – Vote 3 - Infrastructure Development, Service Delivery and Maintenance Management2 284 628 – – – – – (22 857) (22 857) 2 261 771 2 598 914 2 541 700 3.1 - Electricity distribution Management 1 124 281 (6 386) (6 386) 1 117 895 1 344 173 1 388 135 3.2 - Human Settlement Development Management 9 030 (150) (150) 8 880 9 877 10 765 3.3 - Municipal Infrastructure Planning, Funding, Maintenance and Development Management102 906 (1 588) (1 588) 101 319 112 555 122 683 3.4 - Roads and Stormwater 319 271 (10 400) (10 400) 308 871 349 207 348 248 3.5 - Waste Management 155 854 (3 478) (3 478) 152 376 170 467 185 807 3.6 - Water Distribution and Sanitation Management 573 286 (855) (855) 572 431 612 636 486 062
– – Vote 4 - Sustainable Community Service Delivery Provision Management410 306 – – – – – (4 320) (4 320) 405 986 449 137 610 337 4.1 - Community Services Provision Management 147 707 (2 149) (2 149) 145 559 161 557 176 095 4.2 - Public Safety, Enforcement and Disaster Management 160 324 (760) (760) 159 565 150 716 222 953 4.3 - Regional Community Services Provision Management 102 275 (1 412) (1 412) 100 863 136 864 211 289
– – Total Expenditure by Vote 2 3 224 899 – – – – – (42 351) (42 351) 3 182 548 3 480 545 3 764 104
Surplus/ (Deficit) for the year 2 66 586 – – – – – – – 66 586 64 557 50 001 References1. Insert 'Vote'; e.g. Department, if different to standard structure2. Must reconcile to Financial Performance ('Revenue and Expenditure by Standard Classification' and 'Revenue and Expenditure')3. Assign share in 'associate' to relevant Vote
Vote DescriptionRef
Budget Year 2013/14
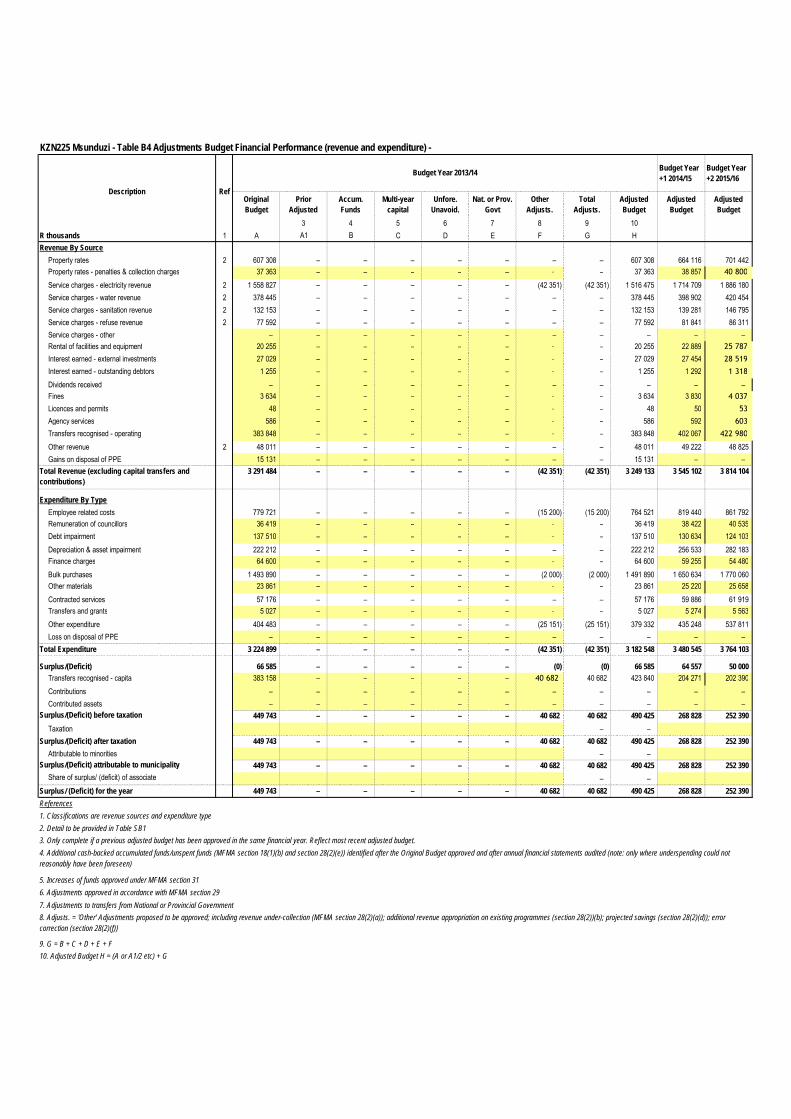
KZN225 Msunduzi - Table B4 Adjustments Budget Financial Performance (revenue and expenditure) -
Budget Year +1 2014/15
Budget Year +2 2015/16
Original Budget
Prior Adjusted
Accum. Funds
Multi-year capital
Unfore. Unavoid.
Nat. or Prov. Govt
Other Adjusts.
Total Adjusts.
Adjusted Budget
Adjusted Budget
Adjusted Budget
3 4 5 6 7 8 9 10R thousands 1 A A1 B C D E F G HRevenue By Source
Property rates 2 607 308 – – – – – – – 607 308 664 116 701 442 Property rates - penalties & collection charges 37 363 – – – – – – – 37 363 38 857 40 800
Service charges - electricity revenue 2 1 558 827 – – – – – (42 351) (42 351) 1 516 475 1 714 709 1 886 180 Service charges - water revenue 2 378 445 – – – – – – – 378 445 398 902 420 454 Service charges - sanitation revenue 2 132 153 – – – – – – – 132 153 139 281 146 795 Service charges - refuse revenue 2 77 592 – – – – – – – 77 592 81 841 86 311 Service charges - other – – – – – – – – – – – Rental of facilities and equipment 20 255 – – – – – – – 20 255 22 889 25 787
Interest earned - external investments 27 029 – – – – – – – 27 029 27 454 28 519
Interest earned - outstanding debtors 1 255 – – – – – – – 1 255 1 292 1 318
Dividends received – – – – – – – – – – – Fines 3 634 – – – – – – – 3 634 3 830 4 037
Licences and permits 48 – – – – – – – 48 50 53
Agency services 586 – – – – – – – 586 592 603
Transfers recognised - operating 383 848 – – – – – – – 383 848 402 067 422 980
Other revenue 2 48 011 – – – – – – – 48 011 49 222 48 825 Gains on disposal of PPE 15 131 – – – – – – – 15 131 – –
Total Revenue (excluding capital transfers and contributions)
3 291 484 – – – – – (42 351) (42 351) 3 249 133 3 545 102 3 814 104
Expenditure By TypeEmployee related costs 779 721 – – – – – (15 200) (15 200) 764 521 819 440 861 792 Remuneration of councillors 36 419 – – – – – – – 36 419 38 422 40 535 Debt impairment 137 510 – – – – – – – 137 510 130 634 124 103 Depreciation & asset impairment 222 212 – – – – – – – 222 212 256 533 282 183 Finance charges 64 600 – – – – – – – 64 600 59 255 54 480 Bulk purchases 1 493 890 – – – – – (2 000) (2 000) 1 491 890 1 650 634 1 770 060 Other materials 23 861 – – – – – – – 23 861 25 220 25 658 Contracted services 57 176 – – – – – – – 57 176 59 886 61 919 Transfers and grants 5 027 – – – – – – – 5 027 5 274 5 563 Other expenditure 404 483 – – – – – (25 151) (25 151) 379 332 435 248 537 811 Loss on disposal of PPE – – – – – – – – – – –
Total Expenditure 3 224 899 – – – – – (42 351) (42 351) 3 182 548 3 480 545 3 764 103
Surplus/(Deficit) 66 585 – – – – – (0) (0) 66 585 64 557 50 000 Transfers recognised - capital 383 158 – – – – – 40 682 40 682 423 840 204 271 202 390 Contributions – – – – – – – – – – – Contributed assets – – – – – – – – – – –
Surplus/(Deficit) before taxation 449 743 – – – – – 40 682 40 682 490 425 268 828 252 390 Taxation – –
Surplus/(Deficit) after taxation 449 743 – – – – – 40 682 40 682 490 425 268 828 252 390 Attributable to minorities – –
Surplus/(Deficit) attributable to municipality 449 743 – – – – – 40 682 40 682 490 425 268 828 252 390 Share of surplus/ (deficit) of associate – –
Surplus/ (Deficit) for the year 449 743 – – – – – 40 682 40 682 490 425 268 828 252 390 References1. Classifications are revenue sources and expenditure type2. Detail to be provided in Table SB1
7. Adjustments to transfers from National or Provincial Government
9. G = B + C + D + E + F
Budget Year 2013/14
Ref
10. Adjusted Budget H = (A or A1/2 etc) + G
3. Only complete if a previous adjusted budget has been approved in the same financial year. Reflect most recent adjusted budget.4. Additional cash-backed accumulated funds/unspent funds (MFMA section 18(1)(b) and section 28(2)(e)) identified after the Original Budget approved and after annual financial statements audited (note: only where underspending could not reasonably have been foreseen)
5. Increases of funds approved under MFMA section 316. Adjustments approved in accordance with MFMA section 29
8. Adjusts. = 'Other' Adjustments proposed to be approved; including revenue under-collection (MFMA section 28(2)(a)); additional revenue appropriation on existing programmes (section 28(2))(b); projected savings (section 28(2)(d)); error correction (section 28(2)(f))
Description
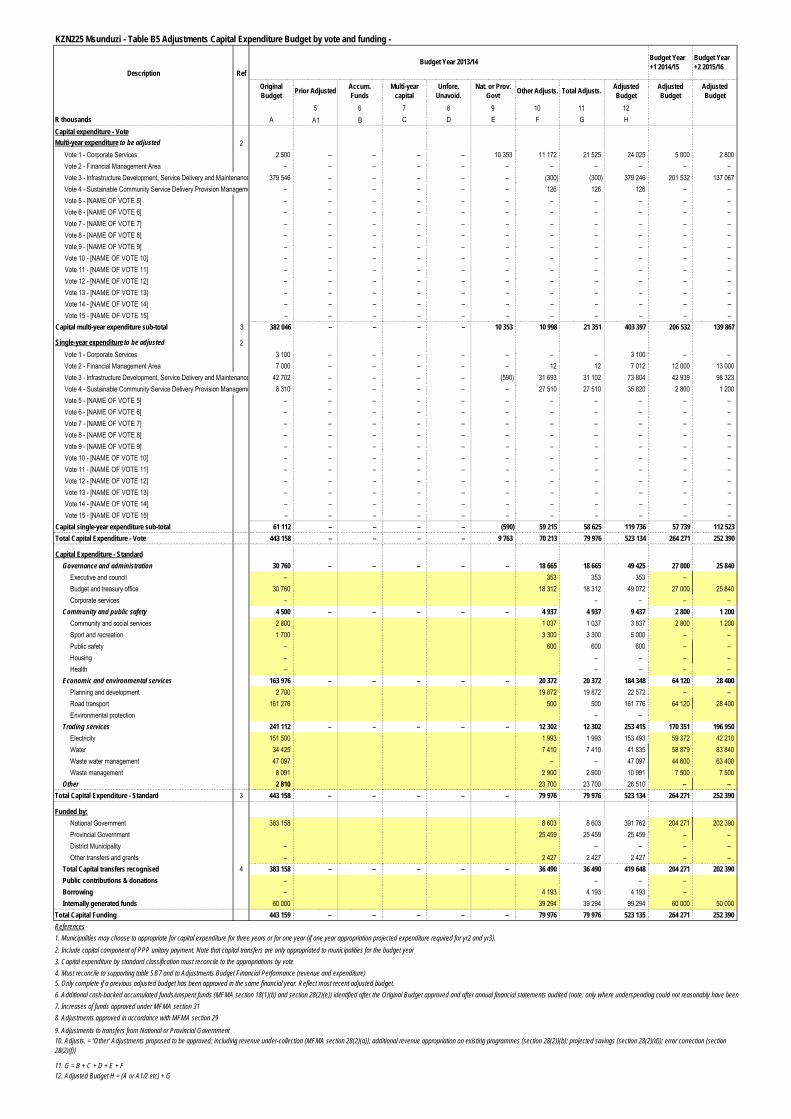
KZN225 Msunduzi - Table B5 Adjustments Capital Expenditure Budget by vote and funding -
Budget Year +1 2014/15
Budget Year +2 2015/16
Original Budget Prior Adjusted Accum.
FundsMulti-year
capitalUnfore.
Unavoid.Nat. or Prov.
Govt Other Adjusts. Total Adjusts. Adjusted Budget
Adjusted Budget
Adjusted Budget
5 6 7 8 9 10 11 12R thousands A A1 B C D E F G HCapital expenditure - VoteMulti-year expenditure to be adjusted 2
Vote 1 - Corporate Services 2 500 – – – – 10 353 11 172 21 525 24 025 5 000 2 800 Vote 2 - Financial Management Area – – – – – – – – – – – Vote 3 - Infrastructure Development, Service Delivery and Maintenance Management379 546 – – – – – (300) (300) 379 246 201 532 137 067 Vote 4 - Sustainable Community Service Delivery Provision Management – – – – – – 126 126 126 – – Vote 5 - [NAME OF VOTE 5] – – – – – – – – – – – Vote 6 - [NAME OF VOTE 6] – – – – – – – – – – – Vote 7 - [NAME OF VOTE 7] – – – – – – – – – – – Vote 8 - [NAME OF VOTE 8] – – – – – – – – – – – Vote 9 - [NAME OF VOTE 9] – – – – – – – – – – – Vote 10 - [NAME OF VOTE 10] – – – – – – – – – – – Vote 11 - [NAME OF VOTE 11] – – – – – – – – – – – Vote 12 - [NAME OF VOTE 12] – – – – – – – – – – – Vote 13 - [NAME OF VOTE 13] – – – – – – – – – – – Vote 14 - [NAME OF VOTE 14] – – – – – – – – – – – Vote 15 - [NAME OF VOTE 15] – – – – – – – – – – –
Capital multi-year expenditure sub-total 3 382 046 – – – – 10 353 10 998 21 351 403 397 206 532 139 867
Single-year expenditure to be adjusted 2Vote 1 - Corporate Services 3 100 – – – – – – – 3 100 – – Vote 2 - Financial Management Area 7 000 – – – – – 12 12 7 012 12 000 13 000 Vote 3 - Infrastructure Development, Service Delivery and Maintenance Management42 702 – – – – (590) 31 693 31 102 73 804 42 939 98 323 Vote 4 - Sustainable Community Service Delivery Provision Management 8 310 – – – – – 27 510 27 510 35 820 2 800 1 200 Vote 5 - [NAME OF VOTE 5] – – – – – – – – – – – Vote 6 - [NAME OF VOTE 6] – – – – – – – – – – – Vote 7 - [NAME OF VOTE 7] – – – – – – – – – – – Vote 8 - [NAME OF VOTE 8] – – – – – – – – – – – Vote 9 - [NAME OF VOTE 9] – – – – – – – – – – – Vote 10 - [NAME OF VOTE 10] – – – – – – – – – – – Vote 11 - [NAME OF VOTE 11] – – – – – – – – – – – Vote 12 - [NAME OF VOTE 12] – – – – – – – – – – – Vote 13 - [NAME OF VOTE 13] – – – – – – – – – – – Vote 14 - [NAME OF VOTE 14] – – – – – – – – – – – Vote 15 - [NAME OF VOTE 15] – – – – – – – – – – –
Capital single-year expenditure sub-total 61 112 – – – – (590) 59 215 58 625 119 736 57 739 112 523 Total Capital Expenditure - Vote 443 158 – – – – 9 763 70 213 79 976 523 134 264 271 252 390
Capital Expenditure - StandardGovernance and administration 30 760 – – – – – 18 665 18 665 49 425 27 000 25 840
Executive and council – 353 353 353 – Budget and treasury office 30 760 18 312 18 312 49 072 27 000 25 840 Corporate services – – – – –
Community and public safety 4 500 – – – – – 4 937 4 937 9 437 2 800 1 200 Community and social services 2 800 1 037 1 037 3 837 2 800 1 200 Sport and recreation 1 700 3 300 3 300 5 000 – – Public safety – 600 600 600 – – Housing – – – – – Health – – – – –
Economic and environmental services 163 976 – – – – – 20 372 20 372 184 348 64 120 28 400 Planning and development 2 700 19 872 19 872 22 572 – – Road transport 161 276 500 500 161 776 64 120 28 400 Environmental protection – –
Trading services 241 112 – – – – – 12 302 12 302 253 415 170 351 196 950 Electricity 151 500 1 993 1 993 153 493 59 372 42 210 Water 34 425 7 410 7 410 41 835 58 879 83 840 Waste water management 47 097 – – 47 097 44 600 63 400 Waste management 8 091 2 900 2 900 10 991 7 500 7 500
Other 2 810 23 700 23 700 26 510 – – Total Capital Expenditure - Standard 3 443 158 – – – – – 79 976 79 976 523 134 264 271 252 390
Funded by:National Government 383 158 8 603 8 603 391 762 204 271 202 390 Provincial Government 25 459 25 459 25 459 – – District Municipality – – – – – Other transfers and grants – 2 427 2 427 2 427 – –
Total Capital transfers recognised 4 383 158 – – – – – 36 490 36 490 419 648 204 271 202 390 Public contributions & donations – – – – Borrowing – 4 193 4 193 4 193 – Internally generated funds 60 000 39 294 39 294 99 294 60 000 50 000
Total Capital Funding 443 159 – – – – – 79 976 79 976 523 135 264 271 252 390 References1. Municipalities may choose to appropriate for capital expenditure for three years or for one year (if one year appropriation projected expenditure required for yr2 and yr3).
9. Adjustments to transfers from National or Provincial Government
11. G = B + C + D + E + F
10. Adjusts. = 'Other' Adjustments proposed to be approved; including revenue under-collection (MFMA section 28(2)(a)); additional revenue appropriation on existing programmes (section 28(2))(b); projected savings (section 28(2)(d)); error correction (section 28(2)(f))
12. Adjusted Budget H = (A or A1/2 etc) + G
Description Ref
2. Include capital component of PPP unitary payment. Note that capital transfers are only appropriated to municipalities for the budget year
Budget Year 2013/14
3. Capital expenditure by standard classification must reconcile to the appropriations by vote4. Must reconcile to supporting table SB7 and to Adjustments Budget Financial Performance (revenue and expenditure)5. Only complete if a previous adjusted budget has been approved in the same financial year. Reflect most recent adjusted budget.6. Additional cash-backed accumulated funds/unspent funds (MFMA section 18(1)(b) and section 28(2)(e)) identified after the Original Budget approved and after annual financial statements audited (note: only where underspending could not reasonably have been foreseen)7. Increases of funds approved under MFMA section 318. Adjustments approved in accordance with MFMA section 29
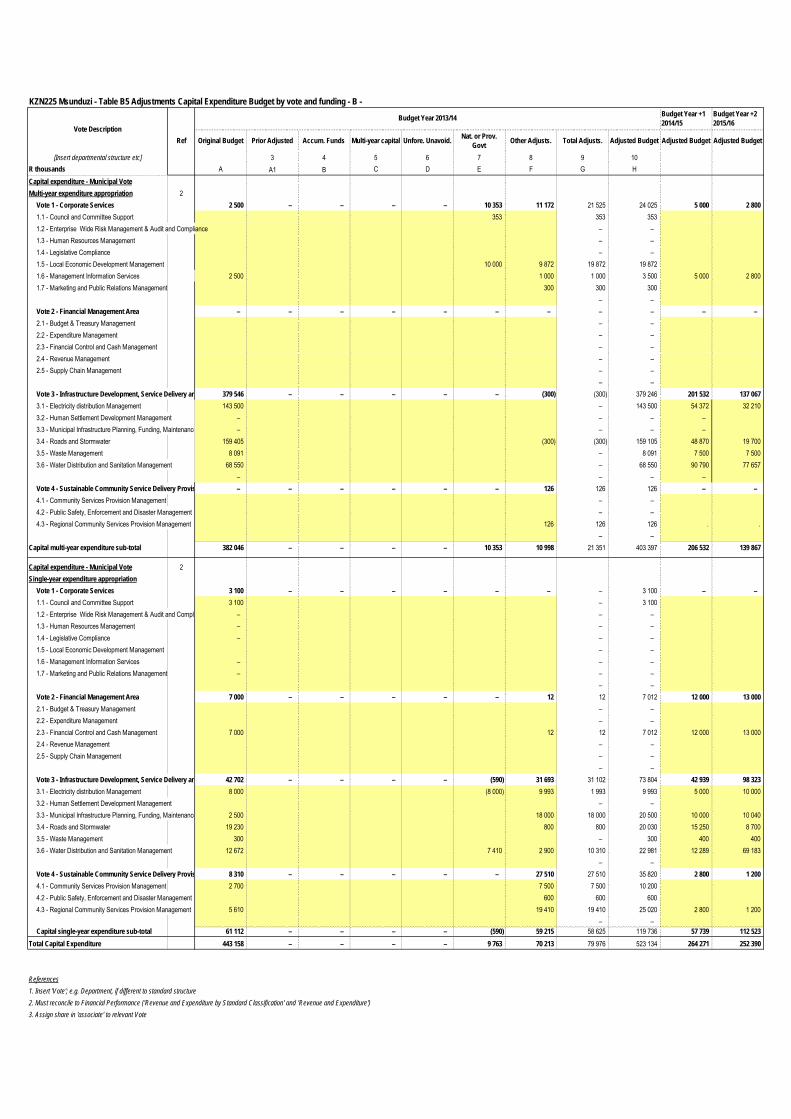
KZN225 Msunduzi - Table B5 Adjustments Capital Expenditure Budget by vote and funding - B - Budget Year +1 2014/15
Budget Year +2 2015/16
Original Budget Prior Adjusted Accum. Funds Multi-year capital Unfore. Unavoid. Nat. or Prov. Govt Other Adjusts. Total Adjusts. Adjusted Budget Adjusted Budget Adjusted Budget
[Insert departmental structure etc] 3 4 5 6 7 8 9 10R thousands A A1 B C D E F G HCapital expenditure - Municipal VoteMulti-year expenditure appropriation 2
Vote 1 - Corporate Services 2 500 – – – – 10 353 11 172 21 525 24 025 5 000 2 800 1.1 - Council and Committee Support 353 353 353 1.2 - Enterprise Wide Risk Management & Audit and Compliance – – 1.3 - Human Resources Management – – 1.4 - Legislative Compliance – – 1.5 - Local Economic Development Management 10 000 9 872 19 872 19 872 1.6 - Management Information Services 2 500 1 000 1 000 3 500 5 000 2 800 1.7 - Marketing and Public Relations Management 300 300 300
– – Vote 2 - Financial Management Area – – – – – – – – – – – 2.1 - Budget & Treasury Management – – 2.2 - Expenditure Management – – 2.3 - Financial Control and Cash Management – – 2.4 - Revenue Management – – 2.5 - Supply Chain Management – –
– – Vote 3 - Infrastructure Development, Service Delivery and Maintenance Management379 546 – – – – – (300) (300) 379 246 201 532 137 067 3.1 - Electricity distribution Management 143 500 – 143 500 54 372 32 210 3.2 - Human Settlement Development Management – – – – 3.3 - Municipal Infrastructure Planning, Funding, Maintenance and Development Management– – – – 3.4 - Roads and Stormwater 159 405 (300) (300) 159 105 48 870 19 700 3.5 - Waste Management 8 091 – 8 091 7 500 7 500 3.6 - Water Distribution and Sanitation Management 68 550 – 68 550 90 790 77 657
– – – – Vote 4 - Sustainable Community Service Delivery Provision Management– – – – – – 126 126 126 – – 4.1 - Community Services Provision Management – – 4.2 - Public Safety, Enforcement and Disaster Management – – 4.3 - Regional Community Services Provision Management 126 126 126 . .
– – Capital multi-year expenditure sub-total 382 046 – – – – 10 353 10 998 21 351 403 397 206 532 139 867
Capital expenditure - Municipal Vote 2Single-year expenditure appropriation
Vote 1 - Corporate Services 3 100 – – – – – – – 3 100 – – 1.1 - Council and Committee Support 3 100 – 3 100 1.2 - Enterprise Wide Risk Management & Audit and Compliance – – – 1.3 - Human Resources Management – – – 1.4 - Legislative Compliance – – – 1.5 - Local Economic Development Management – – 1.6 - Management Information Services – – – 1.7 - Marketing and Public Relations Management – – –
– – Vote 2 - Financial Management Area 7 000 – – – – – 12 12 7 012 12 000 13 000 2.1 - Budget & Treasury Management – – 2.2 - Expenditure Management – – 2.3 - Financial Control and Cash Management 7 000 12 12 7 012 12 000 13 000 2.4 - Revenue Management – – 2.5 - Supply Chain Management – –
– – Vote 3 - Infrastructure Development, Service Delivery and Maintenance Management42 702 – – – – (590) 31 693 31 102 73 804 42 939 98 323 3.1 - Electricity distribution Management 8 000 (8 000) 9 993 1 993 9 993 5 000 10 000 3.2 - Human Settlement Development Management – – 3.3 - Municipal Infrastructure Planning, Funding, Maintenance and Development Management2 500 18 000 18 000 20 500 10 000 10 040 3.4 - Roads and Stormwater 19 230 800 800 20 030 15 250 8 700 3.5 - Waste Management 300 – 300 400 400 3.6 - Water Distribution and Sanitation Management 12 672 7 410 2 900 10 310 22 981 12 289 69 183
– – Vote 4 - Sustainable Community Service Delivery Provision Management8 310 – – – – – 27 510 27 510 35 820 2 800 1 200 4.1 - Community Services Provision Management 2 700 7 500 7 500 10 200 4.2 - Public Safety, Enforcement and Disaster Management 600 600 600 4.3 - Regional Community Services Provision Management 5 610 19 410 19 410 25 020 2 800 1 200
– – Capital single-year expenditure sub-total 61 112 – – – – (590) 59 215 58 625 119 736 57 739 112 523
Total Capital Expenditure 443 158 – – – – 9 763 70 213 79 976 523 134 264 271 252 390
References1. Insert 'Vote'; e.g. Department, if different to standard structure2. Must reconcile to Financial Performance ('Revenue and Expenditure by Standard Classification' and 'Revenue and Expenditure')3. Assign share in 'associate' to relevant Vote
Vote DescriptionRef
Budget Year 2013/14
KZN225 Msunduzi - Table B6 Adjustments Budget Financial Position -
Budget Year +1 2014/15
Budget Year +2 2015/16
Original Budget Prior Adjusted Accum. Funds Multi-year
capitalUnfore.
Unavoid.Nat. or Prov.
Govt Other Adjusts. Total Adjusts. Adjusted Budget
Adjusted Budget
Adjusted Budget
3 4 5 6 7 8 9 10R thousands A A1 B C D E F G HASSETSCurrent assets
Cash 64 672 (61 251) (61 251) 3 421 67 841 1 062 840 Call investment deposits 1 539 022 – – – – – 324 437 324 437 863 459 565 434 593 706 Consumer debtors 1 690 704 – – – – – (7 994) (7 994) 682 710 937 055 811 384 Other debtors 7 354 117 158 117 158 124 512 7 104 21 393 Current portion of long-term receivables 45 175 (45 175) (45 175) – 42 691 42 101 Inventory 56 567 679 727 679 727 736 294 59 339 77 513
Total current assets 1 403 494 – – – – – 1 006 901 1 006 901 2 410 395 1 679 462 2 608 937
Non current assetsLong-term receivables 8 385 202 202 8 587 8 796 8 959 Investments 69 (23) (23) 46 73 Investment property 405 306 (405 306) (405 306) – 405 306 405 306 Investment in Associate – – Property, plant and equipment 1 6 568 313 – – – – – 255 866 255 866 6 824 180 6 493 239 6 373 370 Agricultural – – Biological 543 (543) (543) – 543 Intangible 5 088 (5 088) (5 088) – 2 890 7 282 Other non-current assets – –
Total non current assets 6 987 704 – – – – – (154 891) (154 891) 6 832 813 6 910 846 6 794 917 TOTAL ASSETS 8 391 198 – – – – – 852 010 852 010 9 243 208 8 590 308 9 403 853
LIABILITIESCurrent liabilities
Bank overdraft – – Borrowing 38 030 – – – – – (38 030) (38 030) – 36 129 34 323 Consumer deposits 73 941 9 561 9 561 83 502 77 564 94 523 Trade and other payables 618 107 – – – – – 160 956 160 956 779 064 308 538 326 176 Provisions 3 714 3 714 3 714 582
Total current liabilities 730 078 – – – – – 136 202 136 202 866 280 422 230 455 604
Non current liabilitiesBorrowing 1 573 000 – – – – – (8 965) (8 965) 564 035 503 000 430 000 Provisions 1 – – – – – – 535 734 535 734 535 734 – –
Total non current liabilities 573 000 – – – – – 526 770 526 770 1 099 770 503 000 430 000 TOTAL LIABILITIES 1 303 078 – – – – – 662 971 662 971 1 966 049 925 230 885 604
NET ASSETS 2 7 088 120 – – – – – 189 039 189 039 7 277 159 7 665 078 8 518 250
COMMUNITY WEALTH/EQUITYAccumulated Surplus/(Deficit) 7 032 040 – – – – – 374 580 374 580 7 406 620 7 606 249 8 465 036 Reserves 56 081 – – – – – (18 871) (18 871) 37 209 58 829 53 214
TOTAL COMMUNITY WEALTH/EQUITY 7 088 120 – – – – – 355 709 355 709 7 443 829 7 665 078 8 518 250 References1. Detail to be provided in Table SA32. Net assets must balance with Total Community Wealth/Equity
7. Adjustments to transfers from National or Provincial Government
9. G = B + C + D + E + F
Budget Year 2013/14
Description Ref
10. Adjusted Budget H = (A or A1/2 etc) + G
6. Adjustments approved in accordance with MFMA section 29
8. Adjusts. = 'Other' Adjustments proposed to be approved; including revenue under-collection (MFMA section 28(2)(a)); additional revenue appropriation on existing programmes (section 28(2))(b); projected savings (section 28(2)(d)); error correction (section 28(2)(f))
4. Additional cash-backed accumulated funds/unspent funds (MFMA section 18(1)(b) and section 28(2)(e)) identified after the Original Budget approved and after annual financial statements audited (note: only where underspending could not reasonably have been foreseen)
5. Increases of funds approved under MFMA section 31
3. Only complete if a previous adjusted budget has been approved in the same financial year. Reflect most recent adjusted budget.

KZN225 Msunduzi - Table B7 Adjustments Budget Cash Flows -
Budget Year +1 2014/15
Budget Year +2 2015/16
Original Budget
Prior Adjusted
Accum. Funds
Multi-year capital
Unfore. Unavoid.
Nat. or Prov. Govt
Other Adjusts.
Total Adjusts.
Adjusted Budget
Adjusted Budget
Adjusted Budget
3 4 5 6 7 8 9 10R thousands A A1 B C D E F G HCASH FLOW FROM OPERATING ACTIVITIESReceipts
Ratepayers and other 2 466 204 374 450 374 450 2 840 654 2 941 311 3 124 741 Government - operating 1 383 848 – – 383 848 424 310 395 917 Government - capital 1 383 158 40 682 40 682 423 840 194 271 192 390 Interest 27 029 – – 27 029 – – Dividends – – – – –
PaymentsSuppliers and employees (2 795 550) 42 351 42 351 (2 753 199) (3 211 793) (3 511 794) Finance charges (64 600) – – (64 600) (59 255) (54 480) Transfers and Grants 1 (5 027) – – (5 027) (5 274) (5 563)
NET CASH FROM/(USED) OPERATING ACTIVITIES 395 062 – – – – – 457 483 457 483 852 545 283 570 141 211
CASH FLOWS FROM INVESTING ACTIVITIESReceipts
Proceeds on disposal of PPE – – – – – Decrease (Increase) in non-current debtors – – – – (620) Decrease (increase) other non-current receivables (422) – (422) (411) – Decrease (increase) in non-current investments (3) – (3) (4) –
PaymentsCapital assets (285 394) (96 063) (96 063) (381 457) (194 271) (192 390)
NET CASH FROM/(USED) INVESTING ACTIVITIES (285 819) – – – – – (96 063) (96 063) (381 882) (194 686) (193 010)
CASH FLOWS FROM FINANCING ACTIVITIESReceipts
Short term loans – – – – (42 870) Borrowing long term/refinancing – – – – – Increase (decrease) in consumer deposits 3 722 – 3 722 3 623 5 350
PaymentsRepayment of borrowing (45 175) – (45 175) 37 022 270 665
NET CASH FROM/(USED) FINANCING ACTIVITIES (41 453) – – – – – – – (41 453) 40 645 233 145
NET INCREASE/ (DECREASE) IN CASH HELD 67 790 – – – – – 361 421 361 421 429 211 129 529 181 346 Cash/cash equivalents at the year begin: 2 830 762 – 830 762 898 552 1 028 081 Cash/cash equivalents at the year end: 2 898 552 – – – – – 361 421 1 259 973 1 028 081 1 209 427
References1. Local/District municipalities to include transfers from/to District/Local Municipalities2. Cash equivalents includes investments with maturities of 3 months or less
7. Adjustments to transfers from National or Provincial Government
9. G = B + C + D + E + F10. Adjusted Budget H = (A or A1/2 etc) + G
4. Additional cash-backed accumulated funds/unspent funds (MFMA section 18(1)(b) and section 28(2)(e)) identified after the Original Budget approved and after annual financial statements audited (note: only where underspending could not reasonably have been foreseen)
8. Adjusts. = 'Other' Adjustments proposed to be approved; including revenue under-collection (MFMA section 28(2)(a)); additional revenue appropriation on existing programmes (section 28(2))(b); projected savings (section 28(2)(d)); error correction (section 28(2)(f))
Description Ref
Budget Year 2013/14
3. Only complete if a previous adjusted budget has been approved in the same financial year. Reflect most recent adjusted budget.
5. Increases of funds approved under MFMA section 316. Adjustments approved in accordance with MFMA section 29
KZN225 Msunduzi - Table B8 Cash backed reserves/accumulated surplus reconciliation -
Budget Year +1 2014/15
Budget Year +2 2015/16
Original Budget
Prior Adjusted
Accum. Funds
Multi-year capital
Unfore. Unavoid.
Nat. or Prov. Govt
Other Adjusts.
Total Adjusts.
Adjusted Budget
Adjusted Budget
Adjusted Budget
3 4 5 6 7 8 9 10R thousands A A1 B C D E F G HCash and investments available
Cash/cash equivalents at the year end 1 898 552 – – – – – 361 421 361 421 1 259 973 1 028 081 1 209 427 Other current investments > 90 days (294 859) – – – – – (98 235) (98 235) (393 093) (394 806) 447 119 Non current assets - Investments 1 69 – – – – – (23) (23) 46 73 –
Cash and investments available: 603 763 – – – – – 263 162 263 162 866 925 633 347 1 656 546
Applications of cash and investmentsUnspent conditional transfers 97 764 – – – – – 220 251 220 251 318 015 – – Unspent borrowing 573 000 – 573 000 503 000 430 000 Statutory requirements – – Other working capital requirements 2 (171 267) – 465 644 465 644 294 377 221 119 262 385 Other provisions – – Long term investments committed – – – – – – – Reserves to be backed by cash/investments 57 323 – (57 323) (57 323) – – –
Total Application of cash and investments: 556 820 – – – – – 628 572 628 572 1 185 393 724 119 692 385 Surplus(shortfall) 46 942 – – – – – (365 410) (365 410) (318 467) (90 772) 964 161 References1. Must reconcile with the Adjustments Budget Cash Flow and Adjustements Budget Financial Position2. Council approval for policy required - include sufficient working capital (e.g. allowing for a % of current debtors > 90 days as uncollectable)
7. Adjustments to transfers from National or Provincial Government
9. G = B + C + D + E + F10. Adjusted Budget H = (A or A1/2 etc) + G
6. Adjustments approved in accordance with MFMA section 29 5. Increases of funds approved under MFMA section 31
RefDescription
4. Additional cash-backed accumulated funds/unspent funds (MFMA section 18(1)(b) and section 28(2)(e)) identified after the Original Budget approved and after annual financial statements audited (note: only where underspending could not reasonably have been foreseen)
Budget Year 2013/14
3. Only complete if a previous adjusted budget has been approved in the same financial year. Reflect most recent adjusted budget.
8. Adjusts. = 'Other' Adjustments proposed to be approved; including revenue under-collection (MFMA section 28(2)(a)); additional revenue appropriation on existing programmes (section 28(2))(b); projected savings (section 28(2)(d)); error correction (section 28(2)(f))
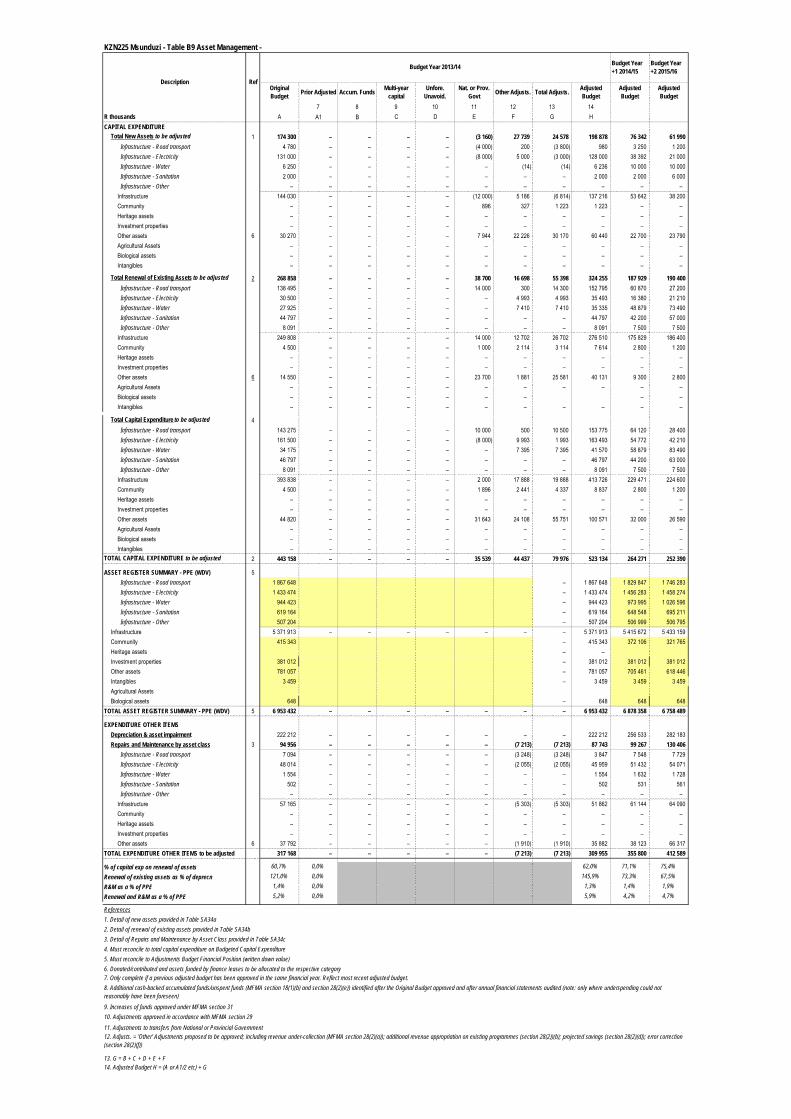
KZN225 Msunduzi - Table B9 Asset Management -
Budget Year +1 2014/15
Budget Year +2 2015/16
Original Budget Prior Adjusted Accum. Funds Multi-year
capitalUnfore.
Unavoid.Nat. or Prov.
Govt Other Adjusts. Total Adjusts. Adjusted Budget
Adjusted Budget
Adjusted Budget
7 8 9 10 11 12 13 14R thousands A A1 B C D E F G HCAPITAL EXPENDITURE
Total New Assets to be adjusted 1 174 300 – – – – (3 160) 27 739 24 578 198 878 76 342 61 990 Infrastructure - Road transport 4 780 – – – – (4 000) 200 (3 800) 980 3 250 1 200 Infrastructure - Electricity 131 000 – – – – (8 000) 5 000 (3 000) 128 000 38 392 21 000 Infrastructure - Water 6 250 – – – – – (14) (14) 6 236 10 000 10 000 Infrastructure - Sanitation 2 000 – – – – – – – 2 000 2 000 6 000 Infrastructure - Other – – – – – – – – – – – Infrastructure 144 030 – – – – (12 000) 5 186 (6 814) 137 216 53 642 38 200 Community – – – – – 896 327 1 223 1 223 – – Heritage assets – – – – – – – – – – – Investment properties – – – – – – – – – – – Other assets 6 30 270 – – – – 7 944 22 226 30 170 60 440 22 700 23 790 Agricultural Assets – – – – – – – – – – – Biological assets – – – – – – – – – – – Intangibles – – – – – – – – – – –
Total Renewal of Existing Assets to be adjusted 2 268 858 – – – – 38 700 16 698 55 398 324 255 187 929 190 400 Infrastructure - Road transport 138 495 – – – – 14 000 300 14 300 152 795 60 870 27 200 Infrastructure - Electricity 30 500 – – – – – 4 993 4 993 35 493 16 380 21 210 Infrastructure - Water 27 925 – – – – – 7 410 7 410 35 335 48 879 73 490 Infrastructure - Sanitation 44 797 – – – – – – – 44 797 42 200 57 000 Infrastructure - Other 8 091 – – – – – – – 8 091 7 500 7 500 Infrastructure 249 808 – – – – 14 000 12 702 26 702 276 510 175 829 186 400 Community 4 500 – – – – 1 000 2 114 3 114 7 614 2 800 1 200 Heritage assets – – – – – – – – – – – Investment properties – – – – – – – – – – – Other assets 6 14 550 – – – – 23 700 1 881 25 581 40 131 9 300 2 800 Agricultural Assets – – – – – – – – – – – Biological assets – – – – – – – – – Intangibles – – – – – – – – – – –
Total Capital Expenditure to be adjusted 4 Infrastructure - Road transport 143 275 – – – – 10 000 500 10 500 153 775 64 120 28 400 Infrastructure - Electricity 161 500 – – – – (8 000) 9 993 1 993 163 493 54 772 42 210 Infrastructure - Water 34 175 – – – – – 7 395 7 395 41 570 58 879 83 490 Infrastructure - Sanitation 46 797 – – – – – – – 46 797 44 200 63 000 Infrastructure - Other 8 091 – – – – – – – 8 091 7 500 7 500 Infrastructure 393 838 – – – – 2 000 17 888 19 888 413 726 229 471 224 600 Community 4 500 – – – – 1 896 2 441 4 337 8 837 2 800 1 200 Heritage assets – – – – – – – – – – – Investment properties – – – – – – – – – – – Other assets 44 820 – – – – 31 643 24 108 55 751 100 571 32 000 26 590 Agricultural Assets – – – – – – – – – – – Biological assets – – – – – – – – – – – Intangibles – – – – – – – – – – –
TOTAL CAPITAL EXPENDITURE to be adjusted 2 443 158 – – – – 35 539 44 437 79 976 523 134 264 271 252 390
ASSET REGISTER SUMMARY - PPE (WDV) 5 Infrastructure - Road transport 1 867 648 – 1 867 648 1 829 847 1 746 283 Infrastructure - Electricity 1 433 474 – 1 433 474 1 456 283 1 458 274 Infrastructure - Water 944 423 – 944 423 973 995 1 026 596 Infrastructure - Sanitation 619 164 – 619 164 648 548 695 211 Infrastructure - Other 507 204 – 507 204 506 999 506 795
Infrastructure 5 371 913 – – – – – – – 5 371 913 5 415 672 5 433 159 Community 415 343 – 415 343 372 106 321 765 Heritage assets – – Investment properties 381 012 – 381 012 381 012 381 012 Other assets 781 057 – 781 057 705 461 618 446 Intangibles 3 459 – 3 459 3 459 3 459 Agricultural AssetsBiological assets 648 – 648 648 648
TOTAL ASSET REGISTER SUMMARY - PPE (WDV) 5 6 953 432 – – – – – – – 6 953 432 6 878 358 6 758 489
EXPENDITURE OTHER ITEMSDepreciation & asset impairment 222 212 – – – – – – – 222 212 256 533 282 183 Repairs and Maintenance by asset class 3 94 956 – – – – – (7 213) (7 213) 87 743 99 267 130 406
Infrastructure - Road transport 7 094 – – – – – (3 248) (3 248) 3 847 7 548 7 729 Infrastructure - Electricity 48 014 – – – – – (2 055) (2 055) 45 959 51 432 54 071 Infrastructure - Water 1 554 – – – – – – – 1 554 1 632 1 728 Infrastructure - Sanitation 502 – – – – – – – 502 531 561 Infrastructure - Other – – – – – – – – – – – Infrastructure 57 165 – – – – – (5 303) (5 303) 51 862 61 144 64 090 Community – – – – – – – – – – – Heritage assets – – – – – – – – – – – Investment properties – – – – – – – – – – – Other assets 6 37 792 – – – – – (1 910) (1 910) 35 882 38 123 66 317
TOTAL EXPENDITURE OTHER ITEMS to be adjusted 317 168 – – – – – (7 213) (7 213) 309 955 355 800 412 589
% of capital exp on renewal of assets 60,7% 0,0% 62,0% 71,1% 75,4%
Renewal of existing assets as % of deprecn 121,0% 0,0% 145,9% 73,3% 67,5%
R&M as a % of PPE 1,4% 0,0% 1,3% 1,4% 1,9%
Renewal and R&M as a % of PPE 5,2% 0,0% 5,9% 4,2% 4,7%
References1. Detail of new assets provided in Table SA34a2. Detail of renewal of existing assets provided in Table SA34b3. Detail of Repairs and Maintenance by Asset Class provided in Table SA34c4. Must reconcile to total capital expenditure on Budgeted Capital Expenditure5. Must reconcile to Adjustments Budget Financial Position (written down value)6. Donated/contributed and assets funded by finance leases to be allocated to the respective category
11. Adjustments to transfers from National or Provincial Government
13. G = B + C + D + E + F14. Adjusted Budget H = (A or A1/2 etc) + G
8. Additional cash-backed accumulated funds/unspent funds (MFMA section 18(1)(b) and section 28(2)(e)) identified after the Original Budget approved and after annual financial statements audited (note: only where underspending could not reasonably have been foreseen)
12. Adjusts. = 'Other' Adjustments proposed to be approved; including revenue under-collection (MFMA section 28(2)(a)); additional revenue appropriation on existing programmes (section 28(2))(b); projected savings (section 28(2)(d)); error correction (section 28(2)(f))
Budget Year 2013/14
Description Ref
7. Only complete if a previous adjusted budget has been approved in the same financial year. Reflect most recent adjusted budget.
9. Increases of funds approved under MFMA section 3110. Adjustments approved in accordance with MFMA section 29
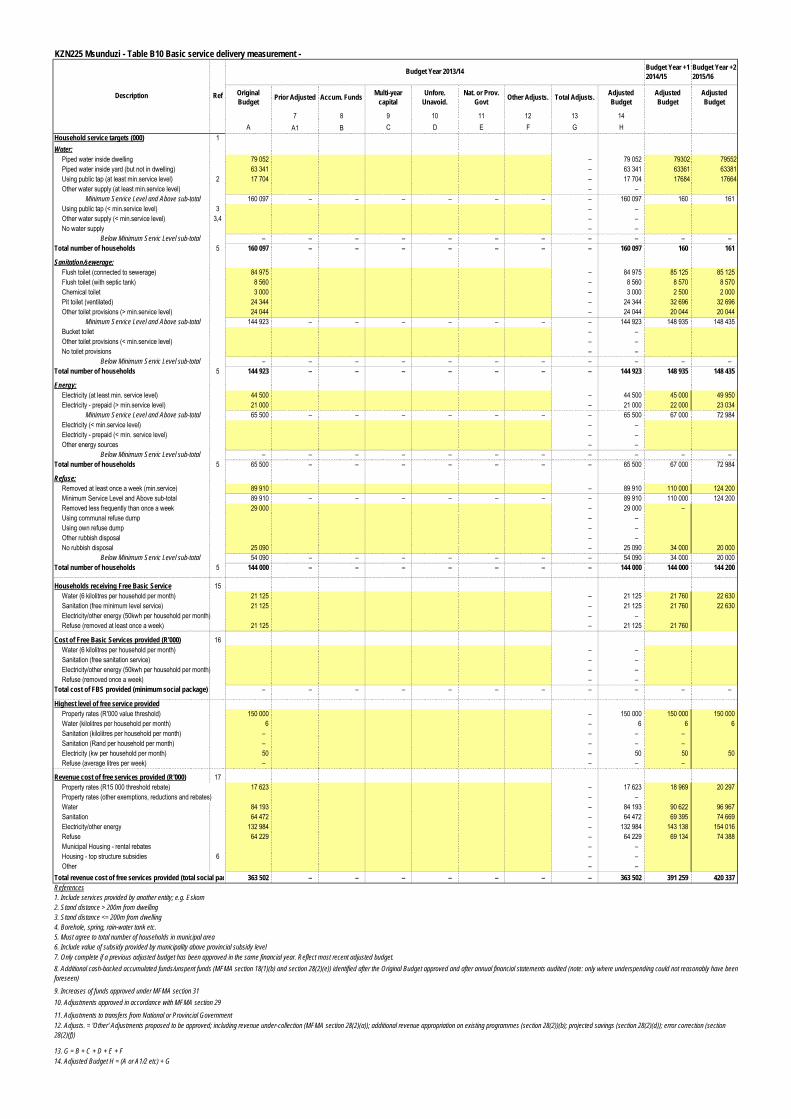
KZN225 Msunduzi - Table B10 Basic service delivery measurement - Budget Year +1 2014/15
Budget Year +2 2015/16
Original Budget Prior Adjusted Accum. Funds Multi-year
capitalUnfore.
Unavoid.Nat. or Prov.
Govt Other Adjusts. Total Adjusts. Adjusted Budget
Adjusted Budget
Adjusted Budget
7 8 9 10 11 12 13 14A A1 B C D E F G H
Household service targets (000) 1Water:
Piped water inside dwelling 79 052 – 79 052 79302 79552Piped water inside yard (but not in dwelling) 63 341 – 63 341 63361 63381Using public tap (at least min.service level) 2 17 704 – 17 704 17684 17664Other water supply (at least min.service level) – –
Minimum Service Level and Above sub-total 160 097 – – – – – – – 160 097 160 161 Using public tap (< min.service level) 3 – – Other water supply (< min.service level) 3,4 – – No water supply – –
Below Minimum Servic Level sub-total – – – – – – – – – – – Total number of households 5 160 097 – – – – – – – 160 097 160 161
Sanitation/sewerage:Flush toilet (connected to sewerage) 84 975 – 84 975 85 125 85 125 Flush toilet (with septic tank) 8 560 – 8 560 8 570 8 570 Chemical toilet 3 000 – 3 000 2 500 2 000 Pit toilet (ventilated) 24 344 – 24 344 32 696 32 696 Other toilet provisions (> min.service level) 24 044 – 24 044 20 044 20 044
Minimum Service Level and Above sub-total 144 923 – – – – – – – 144 923 148 935 148 435 Bucket toilet – – Other toilet provisions (< min.service level) – – No toilet provisions – –
Below Minimum Servic Level sub-total – – – – – – – – – – – Total number of households 5 144 923 – – – – – – – 144 923 148 935 148 435
Energy:Electricity (at least min. service level) 44 500 – 44 500 45 000 49 950 Electricity - prepaid (> min.service level) 21 000 – 21 000 22 000 23 034
Minimum Service Level and Above sub-total 65 500 – – – – – – – 65 500 67 000 72 984 Electricity (< min.service level) – – Electricity - prepaid (< min. service level) – – Other energy sources – –
Below Minimum Servic Level sub-total – – – – – – – – – – – Total number of households 5 65 500 – – – – – – – 65 500 67 000 72 984
Refuse:Removed at least once a week (min.service) 89 910 – 89 910 110 000 124 200 Minimum Service Level and Above sub-total 89 910 – – – – – – – 89 910 110 000 124 200 Removed less frequently than once a week 29 000 – 29 000 – Using communal refuse dump – – Using own refuse dump – – Other rubbish disposal – – No rubbish disposal 25 090 – 25 090 34 000 20 000
Below Minimum Servic Level sub-total 54 090 – – – – – – – 54 090 34 000 20 000 Total number of households 5 144 000 – – – – – – – 144 000 144 000 144 200
Households receiving Free Basic Service 15Water (6 kilolitres per household per month) 21 125 – 21 125 21 760 22 630 Sanitation (free minimum level service) 21 125 – 21 125 21 760 22 630 Electricity/other energy (50kwh per household per month) – – Refuse (removed at least once a week) 21 125 – 21 125 21 760
Cost of Free Basic Services provided (R'000) 16Water (6 kilolitres per household per month) – – Sanitation (free sanitation service) – – Electricity/other energy (50kwh per household per month) – – Refuse (removed once a week) – –
Total cost of FBS provided (minimum social package) – – – – – – – – – – –
Highest level of free service providedProperty rates (R'000 value threshold) 150 000 – 150 000 150 000 150 000 Water (kilolitres per household per month) 6 – 6 6 6 Sanitation (kilolitres per household per month) – – – – Sanitation (Rand per household per month) – – – – Electricity (kw per household per month) 50 – 50 50 50 Refuse (average litres per week) – – – –
Revenue cost of free services provided (R'000) 17Property rates (R15 000 threshold rebate) 17 623 – 17 623 18 969 20 297 Property rates (other exemptions, reductions and rebates) – – Water 84 193 – 84 193 90 622 96 967 Sanitation 64 472 – 64 472 69 395 74 669 Electricity/other energy 132 984 – 132 984 143 138 154 016 Refuse 64 229 – 64 229 69 134 74 388 Municipal Housing - rental rebates – – Housing - top structure subsidies 6 – – Other – –
Total revenue cost of free services provided (total social package) 363 502 – – – – – – – 363 502 391 259 420 337 References1. Include services provided by another entity; e.g. Eskom2. Stand distance > 200m from dwelling3. Stand distance <= 200m from dwelling4. Borehole, spring, rain-water tank etc.5. Must agree to total number of households in municipal area6. Include value of subsidy provided by municipality above provincial subsidy level
11. Adjustments to transfers from National or Provincial Government
13. G = B + C + D + E + F14. Adjusted Budget H = (A or A1/2 etc) + G
12. Adjusts. = 'Other' Adjustments proposed to be approved; including revenue under-collection (MFMA section 28(2)(a)); additional revenue appropriation on existing programmes (section 28(2))(b); projected savings (section 28(2)(d)); error correction (section 28(2)(f))
Description Ref
Budget Year 2013/14
8. Additional cash-backed accumulated funds/unspent funds (MFMA section 18(1)(b) and section 28(2)(e)) identified after the Original Budget approved and after annual financial statements audited (note: only where underspending could not reasonably have been foreseen)
7. Only complete if a previous adjusted budget has been approved in the same financial year. Reflect most recent adjusted budget.
9. Increases of funds approved under MFMA section 3110. Adjustments approved in accordance with MFMA section 29
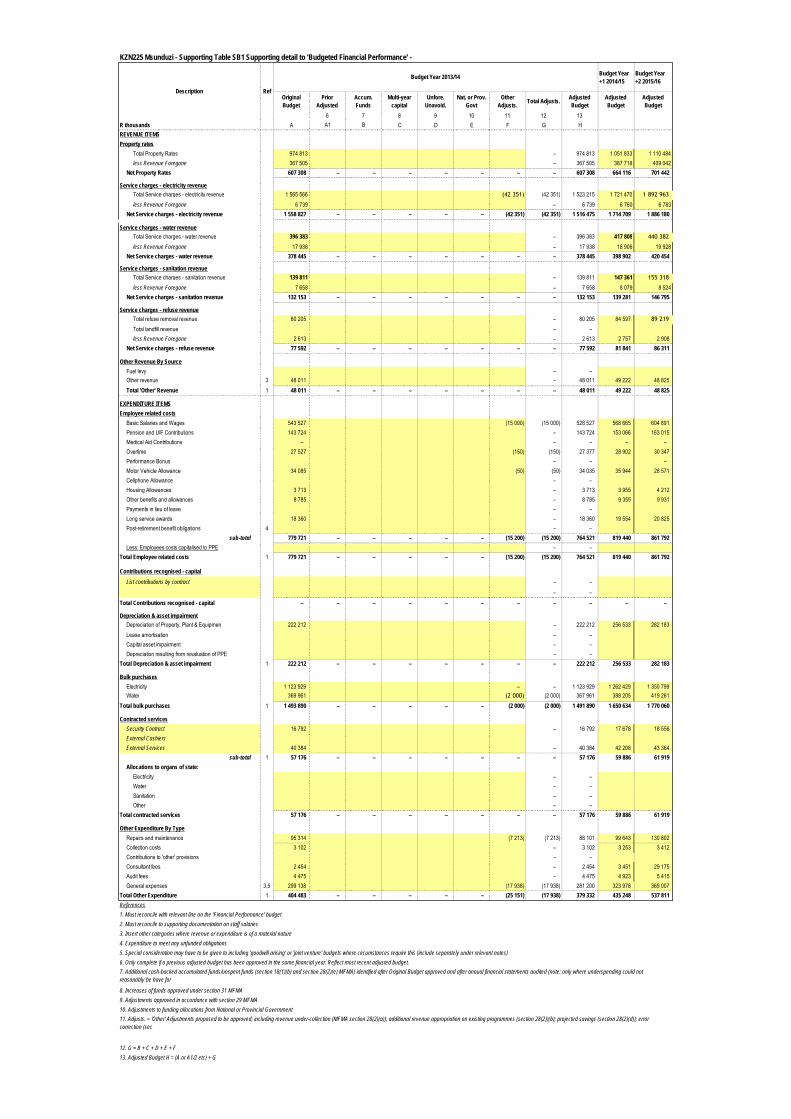
KZN225 Msunduzi - Supporting Table SB1 Supporting detail to 'Budgeted Financial Performance' -
Budget Year +1 2014/15
Budget Year +2 2015/16
Original Budget
Prior Adjusted
Accum. Funds
Multi-year capital
Unfore. Unavoid.
Nat. or Prov. Govt
Other Adjusts. Total Adjusts. Adjusted
BudgetAdjusted Budget
Adjusted Budget
6 7 8 9 10 11 12 13R thousands A A1 B C D E F G HREVENUE ITEMSProperty rates
Total Property Rates 974 813 – 974 813 1 051 833 1 110 484less Revenue Foregone 367 505 – 367 505 387 718 409 042
Net Property Rates 607 308 – – – – – – – 607 308 664 116 701 442
Service charges - electricity revenueTotal Service charges - electricity revenue 1 565 566 (42 351) (42 351) 1 523 215 1 721 470 1 892 963
less Revenue Foregone 6 739 – 6 739 6 760 6 783Net Service charges - electricity revenue 1 558 827 – – – – – (42 351) (42 351) 1 516 475 1 714 709 1 886 180
Service charges - water revenueTotal Service charges - water revenue 396 383 – 396 383 417 808 440 382
less Revenue Foregone 17 938 – 17 938 18 906 19 928Net Service charges - water revenue 378 445 – – – – – – – 378 445 398 902 420 454
Service charges - sanitation revenueTotal Service charges - sanitation revenue 139 811 – 139 811 147 361 155 318
less Revenue Foregone 7 658 – 7 658 8 079 8 524Net Service charges - sanitation revenue 132 153 – – – – – – – 132 153 139 281 146 795 .
Service charges - refuse revenueTotal refuse removal revenue 80 205 – 80 205 84 597 89 219
Total landfill revenue – – less Revenue Foregone 2 613 – 2 613 2 757 2 908
Net Service charges - refuse revenue 77 592 – – – – – – – 77 592 81 841 86 311
Other Revenue By SourceFuel levy – – Other revenue 3 48 011 – 48 011 49 222 48 825 Total 'Other' Revenue 1 48 011 – – – – – – – 48 011 49 222 48 825
EXPENDITURE ITEMSEmployee related costs
Basic Salaries and Wages 543 527 (15 000) (15 000) 528 527 568 665 604 891 Pension and UIF Contributions 143 724 – 143 724 153 066 163 015 Medical Aid Contributions – – – – – Overtime 27 527 (150) (150) 27 377 28 902 30 347 Performance Bonus – – – Motor Vehicle Allowance 34 085 (50) (50) 34 035 35 944 28 571 Cellphone Allowance – – Housing Allowances 3 713 – 3 713 3 955 4 212 Other benefits and allowances 8 785 – 8 785 9 355 9 931 Payments in lieu of leave – – Long service awards 18 360 – 18 360 19 554 20 825 Post-retirement benefit obligations 4 – –
sub-total 779 721 – – – – – (15 200) (15 200) 764 521 819 440 861 792 Less: Employees costs capitalised to PPE – –
Total Employee related costs 1 779 721 – – – – – (15 200) (15 200) 764 521 819 440 861 792
Contributions recognised - capitalList contributions by contract – –
– – Total Contributions recognised - capital – – – – – – – – – – –
Depreciation & asset impairmentDepreciation of Property, Plant & Equipment 222 212 – 222 212 256 533 282 183 Lease amortisation – – Capital asset impairment – – Depreciation resulting from revaluation of PPE – –
Total Depreciation & asset impairment 1 222 212 – – – – – – – 222 212 256 533 282 183
Bulk purchasesElectricity 1 123 929 – – 1 123 929 1 262 429 1 350 799 Water 369 961 (2 000) (2 000) 367 961 388 205 419 261
Total bulk purchases 1 1 493 890 – – – – – (2 000) (2 000) 1 491 890 1 650 634 1 770 060
Contracted servicesSecurity Contract 16 792 – 16 792 17 678 18 556 External CashiersExternal Services 40 384 – 40 384 42 208 43 364
sub-total 1 57 176 – – – – – – – 57 176 59 886 61 919 Allocations to organs of state:
Electricity – – Water – – Sanitation – – Other – –
Total contracted services 57 176 – – – – – – – 57 176 59 886 61 919
Other Expenditure By TypeRepairs and maintenance 95 314 (7 213) (7 213) 88 101 99 643 130 802 Collection costs 3 102 – 3 102 3 253 3 412 Contributions to 'other' provisions – – Consultant fees 2 454 – 2 454 3 451 29 175 Audit fees 4 475 – 4 475 4 923 5 415 General expenses 3,5 299 138 (17 938) (17 938) 281 200 323 978 369 007
Total Other Expenditure 1 404 483 – – – – – (25 151) (17 938) 379 332 435 248 537 811 References1. Must reconcile with relevant line on the 'Financial Performance' budget2. Must reconcile to supporting documentation on staff salaries3. Insert other categories where revenue or expenditure is of a material nature4. Expenditure to meet any unfunded obligations5. Special consideration may have to be given to including 'goodwill arising' or 'joint venture' budgets where circumstances require this (include separately under relevant notes)6. Only complete if a previous adjusted budget has been approved in the same financial year. Reflect most recent adjusted budget.
8. Increases of funds approved under section 31 MFMA9. Adjustments approved in accordance with section 29 MFMA10. Adjustments to funding allocations from National or Provincial Government
12. G = B + C + D + E + F13. Adjusted Budget H = (A or A1/2 etc) + G
11. Adjusts. = 'Other' Adjustments proposed to be approved; including revenue under-collection (MFMA section 28(2)(a)); additional revenue appropriation on existing programmes (section 28(2))(b); projected savings (section 28(2)(d)); error correction (sec
7. Additional cash-backed accumulated funds/unspent funds (section 18(1)(b) and section 28(2)(e) MFMA) identified after Original Budget approved and after annual financial statements audited (note: only where underspending could not reasonably be have for
Description Ref
Budget Year 2013/14
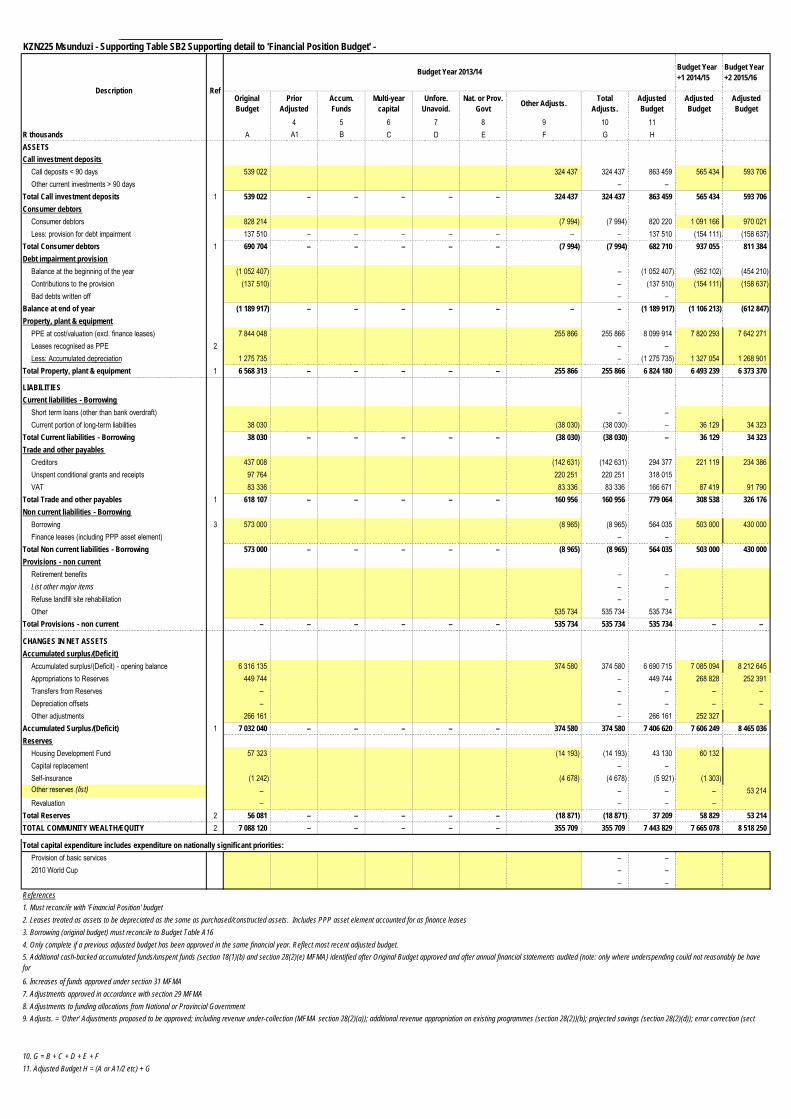
KZN225 Msunduzi - Supporting Table SB2 Supporting detail to 'Financial Position Budget' -
Budget Year +1 2014/15
Budget Year +2 2015/16
Original Budget
Prior Adjusted
Accum. Funds
Multi-year capital
Unfore. Unavoid.
Nat. or Prov. Govt Other Adjusts. Total
Adjusts.Adjusted Budget
Adjusted Budget
Adjusted Budget
4 5 6 7 8 9 10 11R thousands A A1 B C D E F G HASSETSCall investment deposits
Call deposits < 90 days 539 022 324 437 324 437 863 459 565 434 593 706 Other current investments > 90 days – –
Total Call investment deposits 1 539 022 – – – – – 324 437 324 437 863 459 565 434 593 706 Consumer debtors
Consumer debtors 828 214 (7 994) (7 994) 820 220 1 091 166 970 021 Less: provision for debt impairment 137 510 – – – – – – – 137 510 (154 111) (158 637)
Total Consumer debtors 1 690 704 – – – – – (7 994) (7 994) 682 710 937 055 811 384 Debt impairment provision
Balance at the beginning of the year (1 052 407) – (1 052 407) (952 102) (454 210) Contributions to the provision (137 510) – (137 510) (154 111) (158 637) Bad debts written off – –
Balance at end of year (1 189 917) – – – – – – – (1 189 917) (1 106 213) (612 847) Property, plant & equipment
PPE at cost/valuation (excl. finance leases) 7 844 048 255 866 255 866 8 099 914 7 820 293 7 642 271 Leases recognised as PPE 2 – – Less: Accumulated depreciation 1 275 735 – (1 275 735) 1 327 054 1 268 901
Total Property, plant & equipment 1 6 568 313 – – – – – 255 866 255 866 6 824 180 6 493 239 6 373 370
LIABILITIESCurrent liabilities - Borrowing
Short term loans (other than bank overdraft) – – Current portion of long-term liabilities 38 030 (38 030) (38 030) – 36 129 34 323
Total Current liabilities - Borrowing 38 030 – – – – – (38 030) (38 030) – 36 129 34 323 Trade and other payables
Creditors 437 008 (142 631) (142 631) 294 377 221 119 234 386 Unspent conditional grants and receipts 97 764 220 251 220 251 318 015 VAT 83 336 83 336 83 336 166 671 87 419 91 790
Total Trade and other payables 1 618 107 – – – – – 160 956 160 956 779 064 308 538 326 176 Non current liabilities - Borrowing
Borrowing 3 573 000 (8 965) (8 965) 564 035 503 000 430 000 Finance leases (including PPP asset element) – –
Total Non current liabilities - Borrowing 573 000 – – – – – (8 965) (8 965) 564 035 503 000 430 000 Provisions - non current
Retirement benefits – – List other major items – – Refuse landfill site rehabilitation – – Other 535 734 535 734 535 734
Total Provisions - non current – – – – – – 535 734 535 734 535 734 – –
CHANGES IN NET ASSETSAccumulated surplus/(Deficit)
Accumulated surplus/(Deficit) - opening balance 6 316 135 374 580 374 580 6 690 715 7 085 094 8 212 645 Appropriations to Reserves 449 744 – 449 744 268 828 252 391 Transfers from Reserves – – – – – Depreciation offsets – – – – – Other adjustments 266 161 – 266 161 252 327
Accumulated Surplus/(Deficit) 1 7 032 040 – – – – – 374 580 374 580 7 406 620 7 606 249 8 465 036 Reserves
Housing Development Fund 57 323 (14 193) (14 193) 43 130 60 132 Capital replacement – – Self-insurance (1 242) (4 678) (4 678) (5 921) (1 303) Other reserves (list) – – – – 53 214 Revaluation – – – –
Total Reserves 2 56 081 – – – – – (18 871) (18 871) 37 209 58 829 53 214 TOTAL COMMUNITY WEALTH/EQUITY 2 7 088 120 – – – – – 355 709 355 709 7 443 829 7 665 078 8 518 250
Total capital expenditure includes expenditure on nationally significant priorities:Provision of basic services – – 2010 World Cup – –
– – References1. Must reconcile with 'Financial Position' budget2. Leases treated as assets to be depreciated as the same as purchased/constructed assets. Includes PPP asset element accounted for as finance leases3. Borrowing (original budget) must reconcile to Budget Table A164. Only complete if a previous adjusted budget has been approved in the same financial year. Reflect most recent adjusted budget.
6. Increases of funds approved under section 31 MFMA7. Adjustments approved in accordance with section 29 MFMA8. Adjustments to funding allocations from National or Provincial Government
10. G = B + C + D + E + F11. Adjusted Budget H = (A or A1/2 etc) + G
9. Adjusts. = 'Other' Adjustments proposed to be approved; including revenue under-collection (MFMA section 28(2)(a)); additional revenue appropriation on existing programmes (section 28(2))(b); projected savings (section 28(2)(d)); error correction (sect
5. Additional cash-backed accumulated funds/unspent funds (section 18(1)(b) and section 28(2)(e) MFMA) identified after Original Budget approved and after annual financial statements audited (note: only where underspending could not reasonably be have for
RefDescription
Budget Year 2013/14
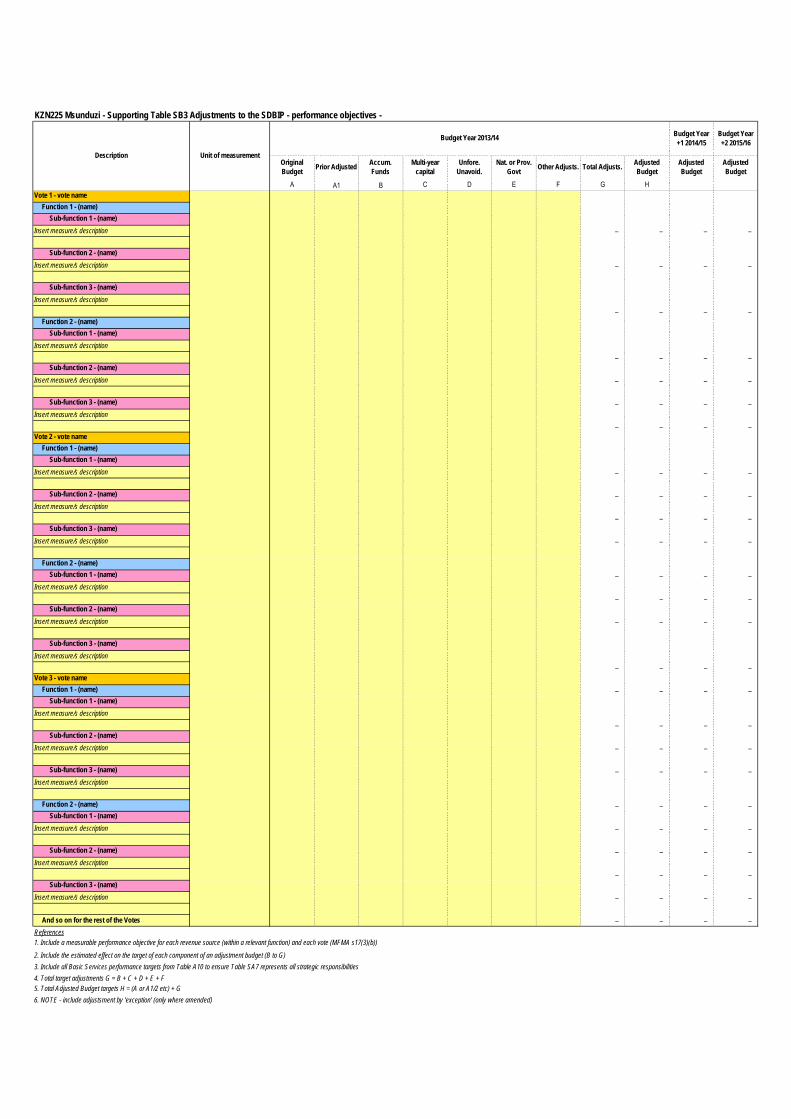
KZN225 Msunduzi - Supporting Table SB3 Adjustments to the SDBIP - performance objectives -
Budget Year +1 2014/15
Budget Year +2 2015/16
Original Budget Prior Adjusted Accum.
FundsMulti-year
capitalUnfore.
Unavoid.Nat. or Prov.
Govt Other Adjusts. Total Adjusts. Adjusted Budget
Adjusted Budget
Adjusted Budget
A A1 B C D E F G HVote 1 - vote name
Function 1 - (name)Sub-function 1 - (name)
Insert measure/s description – – – –
Sub-function 2 - (name)Insert measure/s description – – – –
Sub-function 3 - (name)Insert measure/s description
– – – – Function 2 - (name)
Sub-function 1 - (name)Insert measure/s description
– – – – Sub-function 2 - (name)
Insert measure/s description – – – –
Sub-function 3 - (name) – – – – Insert measure/s description
– – – – Vote 2 - vote name
Function 1 - (name)Sub-function 1 - (name)
Insert measure/s description – – – –
Sub-function 2 - (name) – – – – Insert measure/s description
– – – – Sub-function 3 - (name)
Insert measure/s description – – – –
Function 2 - (name)Sub-function 1 - (name) – – – –
Insert measure/s description– – – –
Sub-function 2 - (name)Insert measure/s description – – – –
Sub-function 3 - (name)Insert measure/s description
– – – – Vote 3 - vote name
Function 1 - (name) – – – – Sub-function 1 - (name)
Insert measure/s description– – – –
Sub-function 2 - (name)Insert measure/s description – – – –
Sub-function 3 - (name) – – – – Insert measure/s description
Function 2 - (name) – – – – Sub-function 1 - (name)
Insert measure/s description – – – –
Sub-function 2 - (name) – – – – Insert measure/s description
– – – – Sub-function 3 - (name)
Insert measure/s description – – – –
And so on for the rest of the Votes – – – – References
2. Include the estimated effect on the target of each component of an adjustment budget (B to G)3. Include all Basic Services performance targets from Table A10 to ensure Table SA7 represents all strategic responsibilities4. Total target adjustments G = B + C + D + E + F
6. NOTE - include adjustsment by 'exception' (only where amended)
1. Include a measurable performance objective for each revenue source (within a relevant function) and each vote (MFMA s17(3)(b))
Description Unit of measurement
Budget Year 2013/14
5. Total Adjusted Budget targets H = (A or A1/2 etc) + G
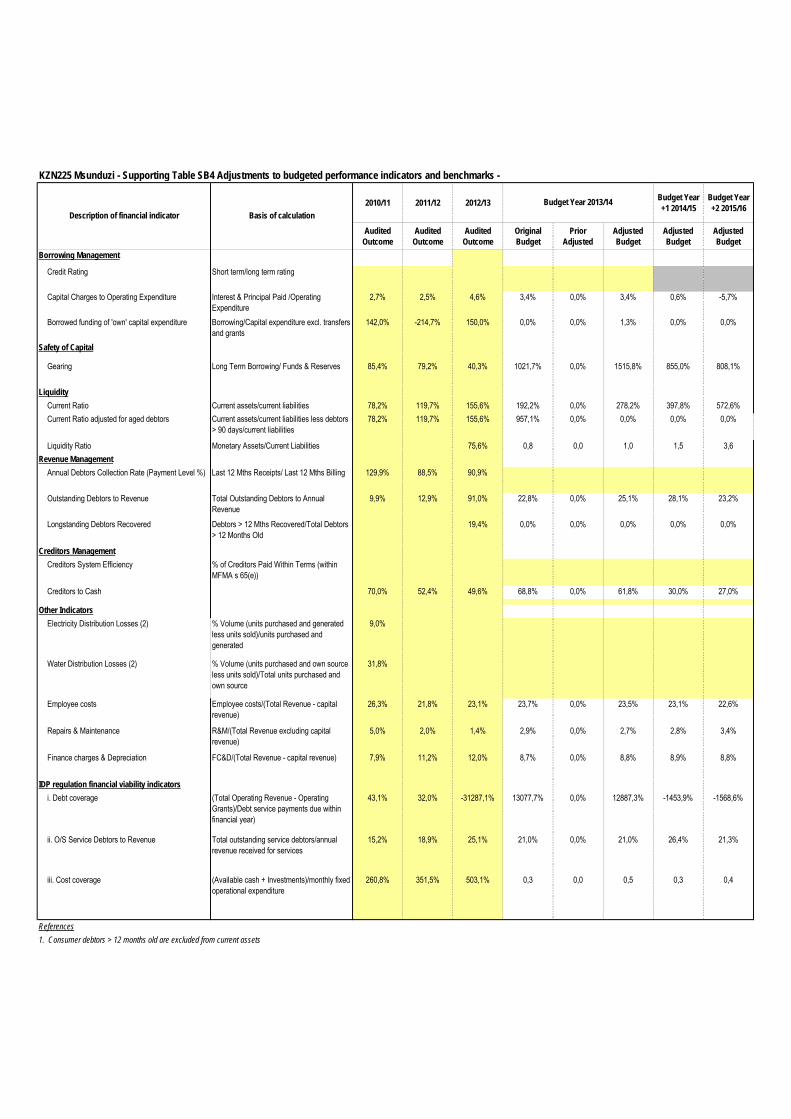
KZN225 Msunduzi - Supporting Table SB4 Adjustments to budgeted performance indicators and benchmarks -
2010/11 2011/12 2012/13 Budget Year +1 2014/15
Budget Year +2 2015/16
Audited Outcome
Audited Outcome
Audited Outcome
Original Budget
Prior Adjusted
Adjusted Budget
Adjusted Budget
Adjusted Budget
Borrowing Management
Credit Rating Short term/long term rating
Capital Charges to Operating Expenditure Interest & Principal Paid /Operating Expenditure
2,7% 2,5% 4,6% 3,4% 0,0% 3,4% 0,6% -5,7%
Borrowed funding of 'own' capital expenditure Borrowing/Capital expenditure excl. transfers and grants
142,0% -214,7% 150,0% 0,0% 0,0% 1,3% 0,0% 0,0%
Safety of Capital
Gearing Long Term Borrowing/ Funds & Reserves 85,4% 79,2% 40,3% 1021,7% 0,0% 1515,8% 855,0% 808,1%
LiquidityCurrent Ratio Current assets/current liabilities 78,2% 119,7% 155,6% 192,2% 0,0% 278,2% 397,8% 572,6%Current Ratio adjusted for aged debtors Current assets/current liabilities less debtors
> 90 days/current liabilities78,2% 119,7% 155,6% 957,1% 0,0% 0,0% 0,0% 0,0%
Liquidity Ratio Monetary Assets/Current Liabilities 75,6% 0,8 0,0 1,0 1,5 3,6Revenue Management
Annual Debtors Collection Rate (Payment Level %) Last 12 Mths Receipts/ Last 12 Mths Billing 129,9% 88,5% 90,9%
Outstanding Debtors to Revenue Total Outstanding Debtors to Annual Revenue
9,9% 12,9% 91,0% 22,8% 0,0% 25,1% 28,1% 23,2%
Longstanding Debtors Recovered Debtors > 12 Mths Recovered/Total Debtors > 12 Months Old
19,4% 0,0% 0,0% 0,0% 0,0% 0,0%
Creditors ManagementCreditors System Efficiency % of Creditors Paid Within Terms (within
MFMA s 65(e))
Creditors to Cash 70,0% 52,4% 49,6% 68,8% 0,0% 61,8% 30,0% 27,0%
Other IndicatorsElectricity Distribution Losses (2) % Volume (units purchased and generated
less units sold)/units purchased and generated
9,0%
Water Distribution Losses (2) % Volume (units purchased and own source less units sold)/Total units purchased and own source
31,8%
Employee costs Employee costs/(Total Revenue - capital revenue)
26,3% 21,8% 23,1% 23,7% 0,0% 23,5% 23,1% 22,6%
Repairs & Maintenance R&M/(Total Revenue excluding capital revenue)
5,0% 2,0% 1,4% 2,9% 0,0% 2,7% 2,8% 3,4%
Finance charges & Depreciation FC&D/(Total Revenue - capital revenue) 7,9% 11,2% 12,0% 8,7% 0,0% 8,8% 8,9% 8,8%
IDP regulation financial viability indicatorsi. Debt coverage (Total Operating Revenue - Operating
Grants)/Debt service payments due within financial year)
43,1% 32,0% -31287,1% 13077,7% 0,0% 12887,3% -1453,9% -1568,6%
ii. O/S Service Debtors to Revenue Total outstanding service debtors/annual revenue received for services
15,2% 18,9% 25,1% 21,0% 0,0% 21,0% 26,4% 21,3%
iii. Cost coverage (Available cash + Investments)/monthly fixed operational expenditure
260,8% 351,5% 503,1% 0,3 0,0 0,5 0,3 0,4
References1. Consumer debtors > 12 months old are excluded from current assets
Description of financial indicator Basis of calculationBudget Year 2013/14
KZN225 Msunduzi - Supporting Table SB5 Adjustments Budget - social, economic and demographic statistics and assumptions -
Description of economic indicator Ref. 1996 Census 2001 Census 2007 Survey 2010/11 2011/12 2012/13 Current year Original Budget
Adjusted Budget
DemographicsPopulation 552 837 616 730 616 730 616 730 616 730 616 730 616 730 616 730 Females aged 5 - 14 60 191 60 191 60 191 60 191 60 191 60 191 60 191 Males aged 5 - 14 62 027 62 027 62 027 62 027 62 027 62 027 62 027 Females aged 15 - 34 121 878 121 878 121 878 121 878 121 878 121 878 121 878 Males aged 15 - 34 122 889 122 889 122 889 122 889 122 889 122 889 122 889 Unemployment 97 816 97 816 97 816 97 816 97 816 97 816 97 816
Monthly Household income ( no. of households) 1, 12NoneR1 - R1 600 119 039 119 039 119 039 R1 601 - R3 200 77 281 77 281 77 281 R3 201 - R6 400 28 922 28 922 28 922 R6 401 - R12 800 22 852 22 852 22 852 R12 801 - R25 600 5968 5968 5968 R25 601 - R51 200 3086 3086 3086 R52 201 - R102 400 461 461 461 R102 401 - R204 800 581 581 581 R204 801 - R409 600 No Data No Data No Data R409 601 - R819 200 No Data No Data No Data > R819 200 No Data No Data No Data
Poverty profiles (no. of households)< R2 060 per household per month 13Insert description 2
Household/demographics (000)Number of people in municipal area 616 730 617 617 617 617 617 617 Number of poor people in municipal area No Data No Data No DataNumber of households in municipal area 134 390 134 134 134 134 134 134 Number of poor households in municipal area No Data No Data No DataDefinition of poor household (R per month) No Data No Data No Data
Housing statistics 3Formal 67 899 67 899 67 899 67 899 No Data No Data Informal 10 369 10 369 10 369 10 369 No Data No Data Total number of households - - 78 268 78 268 78 268 78 268 - - - Dwellings provided by municipality 4 134 390 134 390 134 390 134 390 134 390 No Data No Data Dwellings provided by province/s 2 155 151 2 155 151 2 155 151 2 155 151 2 155 151 No Data No Data Dwellings provided by private sector 5Total new housing dwellings - - 2 289 541 2 289 541 2 289 541 2 289 541 2 289 541 - -
Economic 6Inflation/inflation outlook (CPIX) 4,0% 4,0% No Data No Data No DataInterest rate - borrowing 9,0% 9,0% No Data No Data No DataInterest rate - investment 5,0% 5,0% No Data No Data No DataRemuneration increases 8,5% 7,0% No Data No Data No DataConsumption growth (electricity) 8,0% No Data No Data No DataConsumption growth (water) 8,0% No Data No Data No Data
Collection rates 7Property tax/service charges % % 89,5% % % %Rental of facilities & equipment % % % % %Interest - external investments % % 5,0% % % %Interest - debtors % % 89,5% % % %Revenue from agency services % % % % % %
References1. Monthly household income threshold. Should include all sources of income.2. Show the poverty analysis the municipality uses to determine its indigents policy and the provision of services3. Include total of all housing units within the municipality4. Number of subsidised dwellings to be constructed by the municipality under agency agreement with province5. Provide estimate based on building approval information. Include any non-subsidised dwellings constructed by the municipality6. Insert actual or estimated % increases assumed as a basis for budget calculations
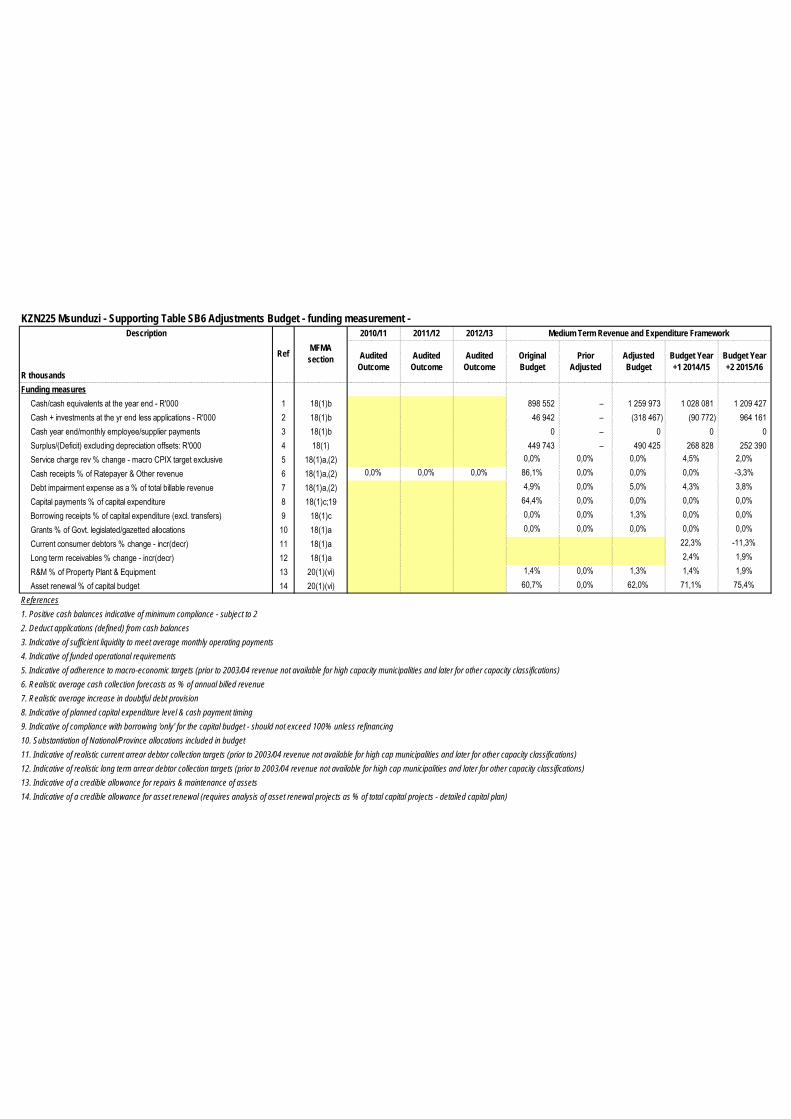
KZN225 Msunduzi - Supporting Table SB6 Adjustments Budget - funding measurement - Description 2010/11 2011/12 2012/13 Medium Term Revenue and Expenditure Framework
R thousands
Audited Outcome
Audited Outcome
Audited Outcome
Original Budget
Prior Adjusted
Adjusted Budget
Budget Year +1 2014/15
Budget Year +2 2015/16
Funding measuresCash/cash equivalents at the year end - R'000 1 18(1)b 898 552 – 1 259 973 1 028 081 1 209 427 Cash + investments at the yr end less applications - R'000 2 18(1)b 46 942 – (318 467) (90 772) 964 161 Cash year end/monthly employee/supplier payments 3 18(1)b 0 – 0 0 0 Surplus/(Deficit) excluding depreciation offsets: R'000 4 18(1) 449 743 – 490 425 268 828 252 390 Service charge rev % change - macro CPIX target exclusive 5 18(1)a,(2) 0,0% 0,0% 0,0% 4,5% 2,0%Cash receipts % of Ratepayer & Other revenue 6 18(1)a,(2) 0,0% 0,0% 0,0% 86,1% 0,0% 0,0% 0,0% -3,3%Debt impairment expense as a % of total billable revenue 7 18(1)a,(2) 4,9% 0,0% 5,0% 4,3% 3,8%Capital payments % of capital expenditure 8 18(1)c;19 64,4% 0,0% 0,0% 0,0% 0,0%Borrowing receipts % of capital expenditure (excl. transfers) 9 18(1)c 0,0% 0,0% 1,3% 0,0% 0,0%Grants % of Govt. legislated/gazetted allocations 10 18(1)a 0,0% 0,0% 0,0% 0,0% 0,0%Current consumer debtors % change - incr(decr) 11 18(1)a 22,3% -11,3%Long term receivables % change - incr(decr) 12 18(1)a 2,4% 1,9%R&M % of Property Plant & Equipment 13 20(1)(vi) 1,4% 0,0% 1,3% 1,4% 1,9%Asset renewal % of capital budget 14 20(1)(vi) 60,7% 0,0% 62,0% 71,1% 75,4%
References1. Positive cash balances indicative of minimum compliance - subject to 22. Deduct applications (defined) from cash balances3. Indicative of sufficient liquidity to meet average monthly operating payments4. Indicative of funded operational requirements5. Indicative of adherence to macro-economic targets (prior to 2003/04 revenue not available for high capacity municipalities and later for other capacity classifications)6. Realistic average cash collection forecasts as % of annual billed revenue7. Realistic average increase in doubtful debt provision8. Indicative of planned capital expenditure level & cash payment timing9. Indicative of compliance with borrowing 'only' for the capital budget - should not exceed 100% unless refinancing10. Substantiation of National/Province allocations included in budget11. Indicative of realistic current arrear debtor collection targets (prior to 2003/04 revenue not available for high cap municipalities and later for other capacity classifications)12. Indicative of realistic long term arrear debtor collection targets (prior to 2003/04 revenue not available for high cap municipalities and later for other capacity classifications)13. Indicative of a credible allowance for repairs & maintenance of assets14. Indicative of a credible allowance for asset renewal (requires analysis of asset renewal projects as % of total capital projects - detailed capital plan)
Ref MFMA section
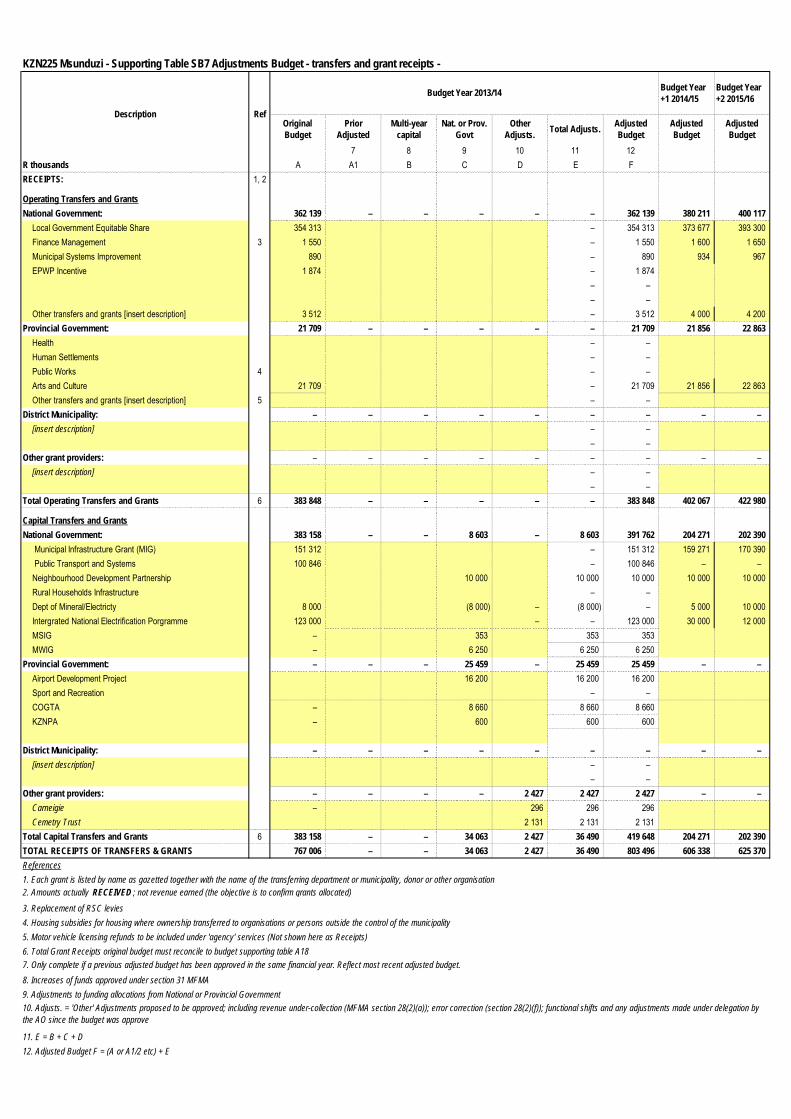
KZN225 Msunduzi - Supporting Table SB7 Adjustments Budget - transfers and grant receipts -
Budget Year +1 2014/15
Budget Year +2 2015/16
Original Budget
Prior Adjusted
Multi-year capital
Nat. or Prov. Govt
Other Adjusts. Total Adjusts. Adjusted
BudgetAdjusted Budget
Adjusted Budget
7 8 9 10 11 12R thousands A A1 B C D E FRECEIPTS: 1, 2
Operating Transfers and GrantsNational Government: 362 139 – – – – – 362 139 380 211 400 117
Local Government Equitable Share 354 313 – 354 313 373 677 393 300 Finance Management 3 1 550 – 1 550 1 600 1 650 Municipal Systems Improvement 890 – 890 934 967 EPWP Incentive 1 874 – 1 874
– – – –
Other transfers and grants [insert description] 3 512 – 3 512 4 000 4 200 Provincial Government: 21 709 – – – – – 21 709 21 856 22 863
Health – – Human Settlements – – Public Works 4 – – Arts and Culture 21 709 – 21 709 21 856 22 863 Other transfers and grants [insert description] 5 – –
District Municipality: – – – – – – – – – [insert description] – –
– – Other grant providers: – – – – – – – – –
[insert description] – – – –
Total Operating Transfers and Grants 6 383 848 – – – – – 383 848 402 067 422 980
Capital Transfers and GrantsNational Government: 383 158 – – 8 603 – 8 603 391 762 204 271 202 390
Municipal Infrastructure Grant (MIG) 151 312 – 151 312 159 271 170 390 Public Transport and Systems 100 846 – 100 846 – – Neighbourhood Development Partnership 10 000 10 000 10 000 10 000 10 000 Rural Households Infrastructure – – Dept of Mineral/Electricty 8 000 (8 000) – (8 000) – 5 000 10 000 Intergrated National Electrification Porgramme 123 000 – – 123 000 30 000 12 000 MSIG – 353 353 353 MWIG – 6 250 6 250 6 250
Provincial Government: – – – 25 459 – 25 459 25 459 – – Airport Development Project 16 200 16 200 16 200 Sport and Recreation – – COGTA – 8 660 8 660 8 660 KZNPA – 600 600 600
District Municipality: – – – – – – – – – [insert description] – –
– – Other grant providers: – – – – 2 427 2 427 2 427 – –
Carneigie – 296 296 296 Cemetry Trust 2 131 2 131 2 131
Total Capital Transfers and Grants 6 383 158 – – 34 063 2 427 36 490 419 648 204 271 202 390 TOTAL RECEIPTS OF TRANSFERS & GRANTS 767 006 – – 34 063 2 427 36 490 803 496 606 338 625 370 References1. Each grant is listed by name as gazetted together with the name of the transferring department or municipality, donor or other organisation2. Amounts actually RECEIVED ; not revenue earned (the objective is to confirm grants allocated)
3. Replacement of RSC levies4. Housing subsidies for housing where ownership transferred to organisations or persons outside the control of the municipality5. Motor vehicle licensing refunds to be included under 'agency' services (Not shown here as Receipts)6. Total Grant Receipts original budget must reconcile to budget supporting table A18
8. Increases of funds approved under section 31 MFMA9. Adjustments to funding allocations from National or Provincial Government
11. E = B + C + D12. Adjusted Budget F = (A or A1/2 etc) + E
10. Adjusts. = 'Other' Adjustments proposed to be approved; including revenue under-collection (MFMA section 28(2)(a)); error correction (section 28(2)(f)); functional shifts and any adjustments made under delegation by the AO since the budget was approve
7. Only complete if a previous adjusted budget has been approved in the same financial year. Reflect most recent adjusted budget.
Description Ref
Budget Year 2013/14
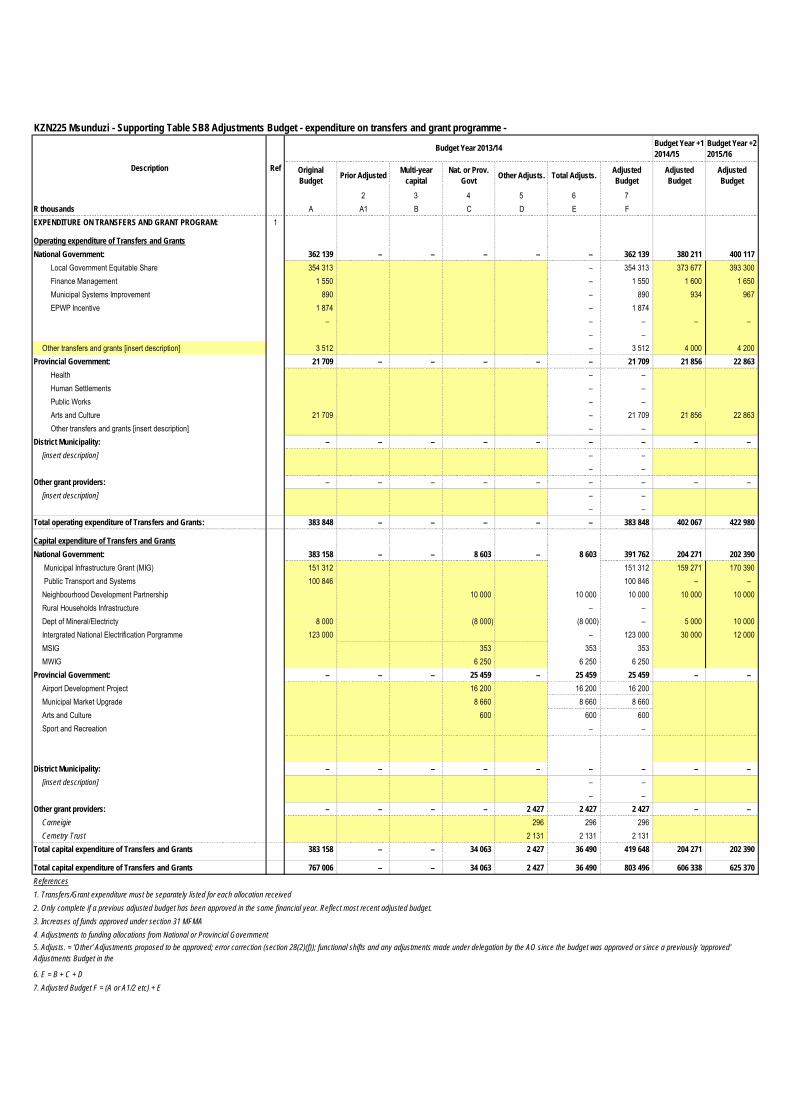
KZN225 Msunduzi - Supporting Table SB8 Adjustments Budget - expenditure on transfers and grant programme - Budget Year +1 2014/15
Budget Year +2 2015/16
Original Budget Prior Adjusted Multi-year
capitalNat. or Prov.
Govt Other Adjusts. Total Adjusts. Adjusted Budget
Adjusted Budget
Adjusted Budget
2 3 4 5 6 7R thousands A A1 B C D E FEXPENDITURE ON TRANSFERS AND GRANT PROGRAM: 1
Operating expenditure of Transfers and GrantsNational Government: 362 139 – – – – – 362 139 380 211 400 117
Local Government Equitable Share 354 313 – 354 313 373 677 393 300 Finance Management 1 550 – 1 550 1 600 1 650 Municipal Systems Improvement 890 – 890 934 967 EPWP Incentive 1 874 – 1 874
– – – – – – –
Other transfers and grants [insert description] 3 512 – 3 512 4 000 4 200 Provincial Government: 21 709 – – – – – 21 709 21 856 22 863
Health – – Human Settlements – – Public Works – – Arts and Culture 21 709 – 21 709 21 856 22 863 Other transfers and grants [insert description] – –
District Municipality: – – – – – – – – – [insert description] – –
– – Other grant providers: – – – – – – – – –
[insert description] – – – –
Total operating expenditure of Transfers and Grants: 383 848 – – – – – 383 848 402 067 422 980
Capital expenditure of Transfers and GrantsNational Government: 383 158 – – 8 603 – 8 603 391 762 204 271 202 390
Municipal Infrastructure Grant (MIG) 151 312 151 312 159 271 170 390 Public Transport and Systems 100 846 100 846 – – Neighbourhood Development Partnership 10 000 10 000 10 000 10 000 10 000 Rural Households Infrastructure – – Dept of Mineral/Electricty 8 000 (8 000) (8 000) – 5 000 10 000 Intergrated National Electrification Porgramme 123 000 – 123 000 30 000 12 000 MSIG 353 353 353 MWIG 6 250 6 250 6 250
Provincial Government: – – – 25 459 – 25 459 25 459 – – Airport Development Project 16 200 16 200 16 200 Municipal Market Upgrade 8 660 8 660 8 660 Arts and Culture 600 600 600 Sport and Recreation – –
District Municipality: – – – – – – – – – [insert description] – –
– – Other grant providers: – – – – 2 427 2 427 2 427 – –
Carneigie 296 296 296 Cemetry Trust 2 131 2 131 2 131
Total capital expenditure of Transfers and Grants 383 158 – – 34 063 2 427 36 490 419 648 204 271 202 390
Total capital expenditure of Transfers and Grants 767 006 – – 34 063 2 427 36 490 803 496 606 338 625 370 References1. Transfers/Grant expenditure must be separately listed for each allocation received2. Only complete if a previous adjusted budget has been approved in the same financial year. Reflect most recent adjusted budget.3. Increases of funds approved under section 31 MFMA4. Adjustments to funding allocations from National or Provincial Government
6. E = B + C + D7. Adjusted Budget F = (A or A1/2 etc) + E
5. Adjusts. = 'Other' Adjustments proposed to be approved; error correction (section 28(2)(f)); functional shifts and any adjustments made under delegation by the AO since the budget was approved or since a previously 'approved' Adjustments Budget in the
Description Ref
Budget Year 2013/14
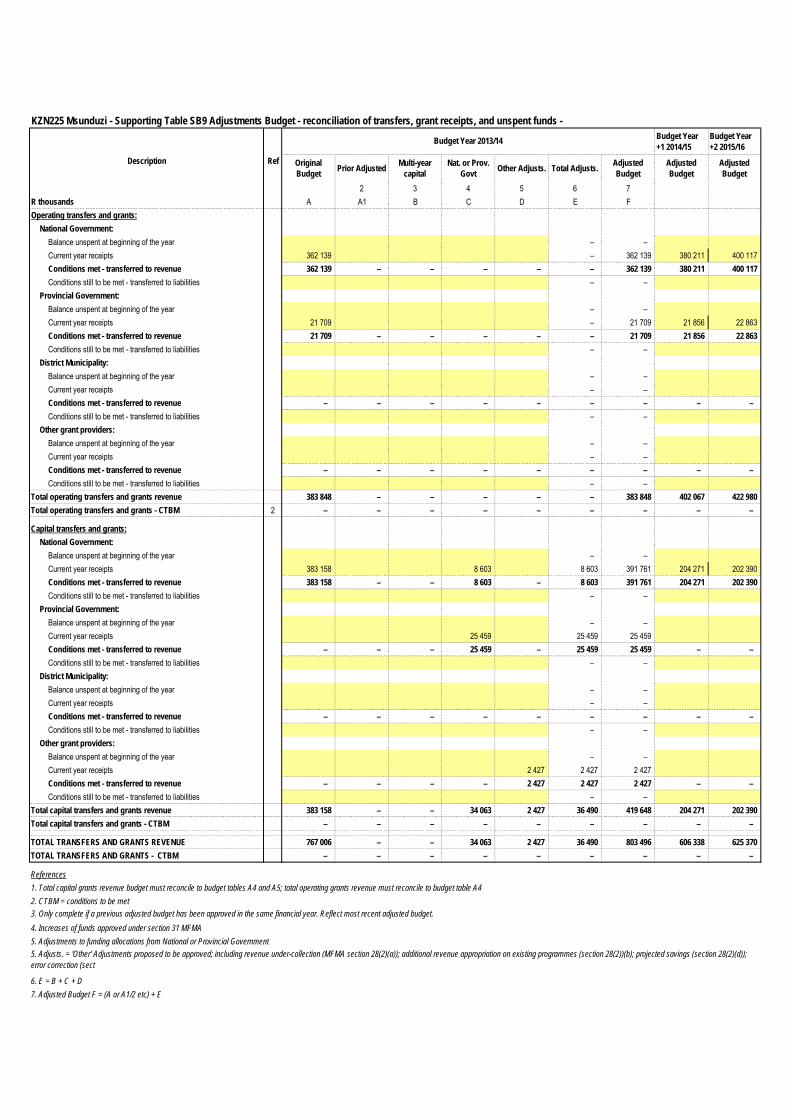
KZN225 Msunduzi - Supporting Table SB9 Adjustments Budget - reconciliation of transfers, grant receipts, and unspent funds - Budget Year +1 2014/15
Budget Year +2 2015/16
Original Budget Prior Adjusted Multi-year
capitalNat. or Prov.
Govt Other Adjusts. Total Adjusts. Adjusted Budget
Adjusted Budget
Adjusted Budget
2 3 4 5 6 7R thousands A A1 B C D E FOperating transfers and grants:
National Government:Balance unspent at beginning of the year – – Current year receipts 362 139 – 362 139 380 211 400 117 Conditions met - transferred to revenue 362 139 – – – – – 362 139 380 211 400 117 Conditions still to be met - transferred to liabilities – –
Provincial Government:Balance unspent at beginning of the year – – Current year receipts 21 709 – 21 709 21 856 22 863 Conditions met - transferred to revenue 21 709 – – – – – 21 709 21 856 22 863 Conditions still to be met - transferred to liabilities – –
District Municipality:Balance unspent at beginning of the year – – Current year receipts – – Conditions met - transferred to revenue – – – – – – – – – Conditions still to be met - transferred to liabilities – –
Other grant providers:Balance unspent at beginning of the year – – Current year receipts – – Conditions met - transferred to revenue – – – – – – – – – Conditions still to be met - transferred to liabilities – –
Total operating transfers and grants revenue 383 848 – – – – – 383 848 402 067 422 980 Total operating transfers and grants - CTBM 2 – – – – – – – – –
Capital transfers and grants:National Government:
Balance unspent at beginning of the year – – Current year receipts 383 158 8 603 8 603 391 761 204 271 202 390 Conditions met - transferred to revenue 383 158 – – 8 603 – 8 603 391 761 204 271 202 390 Conditions still to be met - transferred to liabilities – –
Provincial Government:Balance unspent at beginning of the year – – Current year receipts 25 459 25 459 25 459 Conditions met - transferred to revenue – – – 25 459 – 25 459 25 459 – – Conditions still to be met - transferred to liabilities – –
District Municipality:Balance unspent at beginning of the year – – Current year receipts – – Conditions met - transferred to revenue – – – – – – – – – Conditions still to be met - transferred to liabilities – –
Other grant providers:Balance unspent at beginning of the year – – Current year receipts 2 427 2 427 2 427 Conditions met - transferred to revenue – – – – 2 427 2 427 2 427 – – Conditions still to be met - transferred to liabilities – –
Total capital transfers and grants revenue 383 158 – – 34 063 2 427 36 490 419 648 204 271 202 390 Total capital transfers and grants - CTBM – – – – – – – – –
TOTAL TRANSFERS AND GRANTS REVENUE 767 006 – – 34 063 2 427 36 490 803 496 606 338 625 370 TOTAL TRANSFERS AND GRANTS - CTBM – – – – – – – – –
References1. Total capital grants revenue budget must reconcile to budget tables A4 and A5; total operating grants revenue must reconcile to budget table A42. CTBM = conditions to be met
4. Increases of funds approved under section 31 MFMA5. Adjustments to funding allocations from National or Provincial Government
6. E = B + C + D7. Adjusted Budget F = (A or A1/2 etc) + E
3. Only complete if a previous adjusted budget has been approved in the same financial year. Reflect most recent adjusted budget.
5. Adjusts. = 'Other' Adjustments proposed to be approved; including revenue under-collection (MFMA section 28(2)(a)); additional revenue appropriation on existing programmes (section 28(2))(b); projected savings (section 28(2)(d)); error correction (sect
Budget Year 2013/14
Description Ref
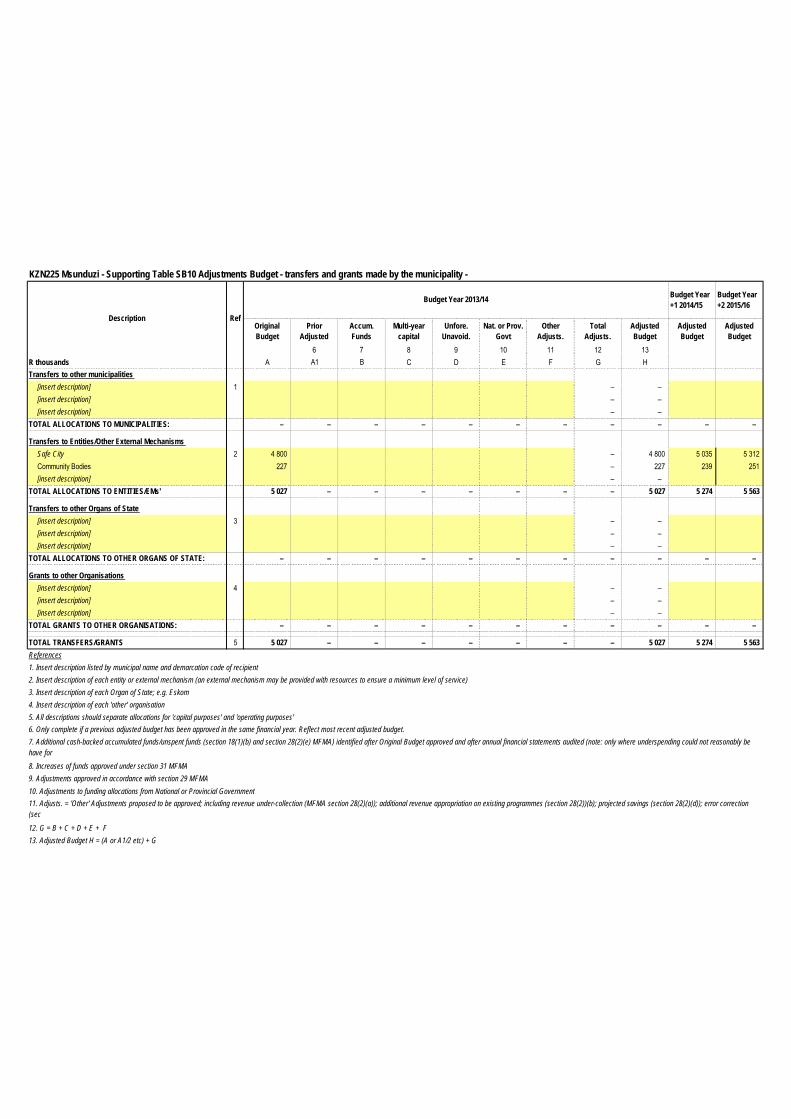
KZN225 Msunduzi - Supporting Table SB10 Adjustments Budget - transfers and grants made by the municipality -
Budget Year +1 2014/15
Budget Year +2 2015/16
Original Budget
Prior Adjusted
Accum. Funds
Multi-year capital
Unfore. Unavoid.
Nat. or Prov. Govt
Other Adjusts.
Total Adjusts.
Adjusted Budget
Adjusted Budget
Adjusted Budget
6 7 8 9 10 11 12 13R thousands A A1 B C D E F G HTransfers to other municipalities
[insert description] 1 – – [insert description] – – [insert description] – –
TOTAL ALLOCATIONS TO MUNICIPALITIES: – – – – – – – – – – –
Transfers to Entities/Other External MechanismsSafe City 2 4 800 – 4 800 5 035 5 312 Community Bodies 227 – 227 239 251 [insert description] – –
TOTAL ALLOCATIONS TO ENTITIES/EMs' 5 027 – – – – – – – 5 027 5 274 5 563
Transfers to other Organs of State[insert description] 3 – – [insert description] – – [insert description] – –
TOTAL ALLOCATIONS TO OTHER ORGANS OF STATE: – – – – – – – – – – –
Grants to other Organisations[insert description] 4 – – [insert description] – – [insert description] – –
TOTAL GRANTS TO OTHER ORGANISATIONS: – – – – – – – – – – –
TOTAL TRANSFERS/GRANTS 5 5 027 – – – – – – – 5 027 5 274 5 563 References1. Insert description listed by municipal name and demarcation code of recipient2. Insert description of each entity or external mechanism (an external mechanism may be provided with resources to ensure a minimum level of service)3. Insert description of each Organ of State; e.g. Eskom4. Insert description of each 'other' organisation5. All descriptions should separate allocations for 'capital purposes' and 'operating purposes'
10. Adjustments to funding allocations from National or Provincial Government
12. G = B + C + D + E + F13. Adjusted Budget H = (A or A1/2 etc) + G
Description Ref
7. Additional cash-backed accumulated funds/unspent funds (section 18(1)(b) and section 28(2)(e) MFMA) identified after Original Budget approved and after annual financial statements audited (note: only where underspending could not reasonably be have for
Budget Year 2013/14
11. Adjusts. = 'Other' Adjustments proposed to be approved; including revenue under-collection (MFMA section 28(2)(a)); additional revenue appropriation on existing programmes (section 28(2))(b); projected savings (section 28(2)(d)); error correction (sec
6. Only complete if a previous adjusted budget has been approved in the same financial year. Reflect most recent adjusted budget.
9. Adjustments approved in accordance with section 29 MFMA8. Increases of funds approved under section 31 MFMA
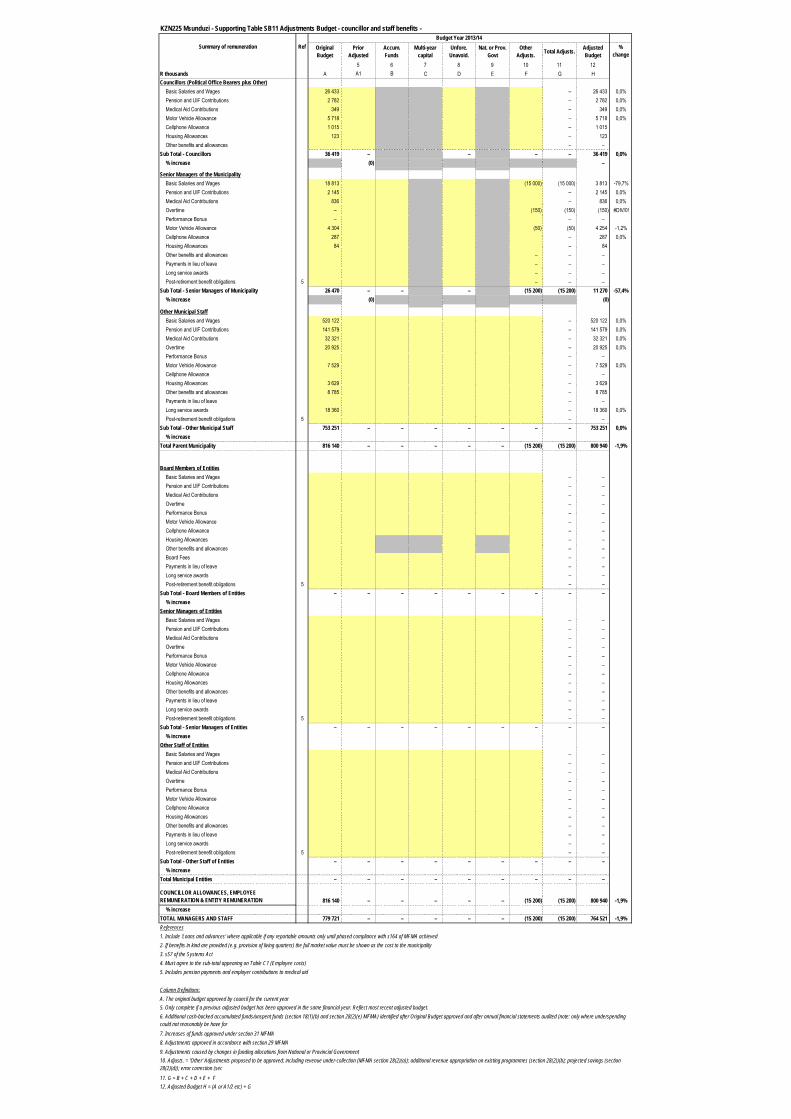
KZN225 Msunduzi - Supporting Table SB11 Adjustments Budget - councillor and staff benefits -
Original Budget
Prior Adjusted
Accum. Funds
Multi-year capital
Unfore. Unavoid.
Nat. or Prov. Govt
Other Adjusts. Total Adjusts. Adjusted
Budget%
change
5 6 7 8 9 10 11 12R thousands A A1 B C D E F G HCouncillors (Political Office Bearers plus Other)
Basic Salaries and Wages 26 433 – 26 433 0,0%Pension and UIF Contributions 2 782 – 2 782 0,0%Medical Aid Contributions 349 – 349 0,0%Motor Vehicle Allowance 5 718 – 5 718 0,0%Cellphone Allowance 1 015 – 1 015 Housing Allowances 123 – 123 Other benefits and allowances – –
Sub Total - Councillors 36 419 – – – – 36 419 0,0%% increase (0) –
Senior Managers of the MunicipalityBasic Salaries and Wages 18 813 (15 000) (15 000) 3 813 -79,7%Pension and UIF Contributions 2 145 – 2 145 0,0%Medical Aid Contributions 836 – 836 0,0%Overtime – (150) (150) (150) #DIV/0!Performance Bonus – – – Motor Vehicle Allowance 4 304 (50) (50) 4 254 -1,2%Cellphone Allowance 287 – 287 0,0%Housing Allowances 84 – 84 Other benefits and allowances – – – Payments in lieu of leave – – – Long service awards – – – Post-retirement benefit obligations 5 – – –
Sub Total - Senior Managers of Municipality 26 470 – – – (15 200) (15 200) 11 270 -57,4%% increase (0) (0)
Other Municipal StaffBasic Salaries and Wages 520 122 – 520 122 0,0%Pension and UIF Contributions 141 579 – 141 579 0,0%Medical Aid Contributions 32 321 – 32 321 0,0%Overtime 20 925 – 20 925 0,0%Performance Bonus – – Motor Vehicle Allowance 7 529 – 7 529 0,0%Cellphone Allowance – – Housing Allowances 3 629 – 3 629 Other benefits and allowances 8 785 – 8 785 Payments in lieu of leave – – Long service awards 18 360 – 18 360 0,0%Post-retirement benefit obligations 5 – –
Sub Total - Other Municipal Staff 753 251 – – – – – – – 753 251 0,0%% increase
Total Parent Municipality 816 140 – – – – – (15 200) (15 200) 800 940 -1,9%
Board Members of EntitiesBasic Salaries and Wages – – Pension and UIF Contributions – – Medical Aid Contributions – – Overtime – – Performance Bonus – – Motor Vehicle Allowance – – Cellphone Allowance – – Housing Allowances – – Other benefits and allowances – – Board Fees – – Payments in lieu of leave – – Long service awards – – Post-retirement benefit obligations 5 – –
Sub Total - Board Members of Entities – – – – – – – – – % increase
Senior Managers of EntitiesBasic Salaries and Wages – – Pension and UIF Contributions – – Medical Aid Contributions – – Overtime – – Performance Bonus – – Motor Vehicle Allowance – – Cellphone Allowance – – Housing Allowances – – Other benefits and allowances – – Payments in lieu of leave – – Long service awards – – Post-retirement benefit obligations 5 – –
Sub Total - Senior Managers of Entities – – – – – – – – – % increase
Other Staff of EntitiesBasic Salaries and Wages – – Pension and UIF Contributions – – Medical Aid Contributions – – Overtime – – Performance Bonus – – Motor Vehicle Allowance – – Cellphone Allowance – – Housing Allowances – – Other benefits and allowances – – Payments in lieu of leave – – Long service awards – – Post-retirement benefit obligations 5 – –
Sub Total - Other Staff of Entities – – – – – – – – – % increase
Total Municipal Entities – – – – – – – – –
COUNCILLOR ALLOWANCES, EMPLOYEE REMUNERATION & ENTITY REMUNERATION 816 140 – – – – – (15 200) (15 200) 800 940 -1,9%
% increaseTOTAL MANAGERS AND STAFF 779 721 – – – – – (15 200) (15 200) 764 521 -1,9%References1. Include 'Loans and advances' where applicable if any reportable amounts only until phased compliance with s164 of MFMA achieved2. If benefits in kind are provided (e.g. provision of living quarters) the full market value must be shown as the cost to the municipality3. s57 of the Systems Act4. Must agree to the sub-total appearing on Table C1 (Employee costs)5. Includes pension payments and employer contributions to medical aid
Column Definitions:A. The original budget approved by council for the current year
9. Adjustments caused by changes in funding allocations from National or Provincial Government
11. G = B + C + D + E + F
Summary of remuneration Ref
10. Adjusts. = 'Other' Adjustments proposed to be approved; including revenue under-collection (MFMA section 28(2)(a)); additional revenue appropriation on existing programmes (section 28(2))(b); projected savings (section 28(2)(d)); error correction (sec
12. Adjusted Budget H = (A or A1/2 etc) + G
5. Only complete if a previous adjusted budget has been approved in the same financial year. Reflect most recent adjusted budget.
7. Increases of funds approved under section 31 MFMA8. Adjustments approved in accordance with section 29 MFMA
6. Additional cash-backed accumulated funds/unspent funds (section 18(1)(b) and section 28(2)(e) MFMA) identified after Original Budget approved and after annual financial statements audited (note: only where underspending could not reasonably be have for
Budget Year 2013/14
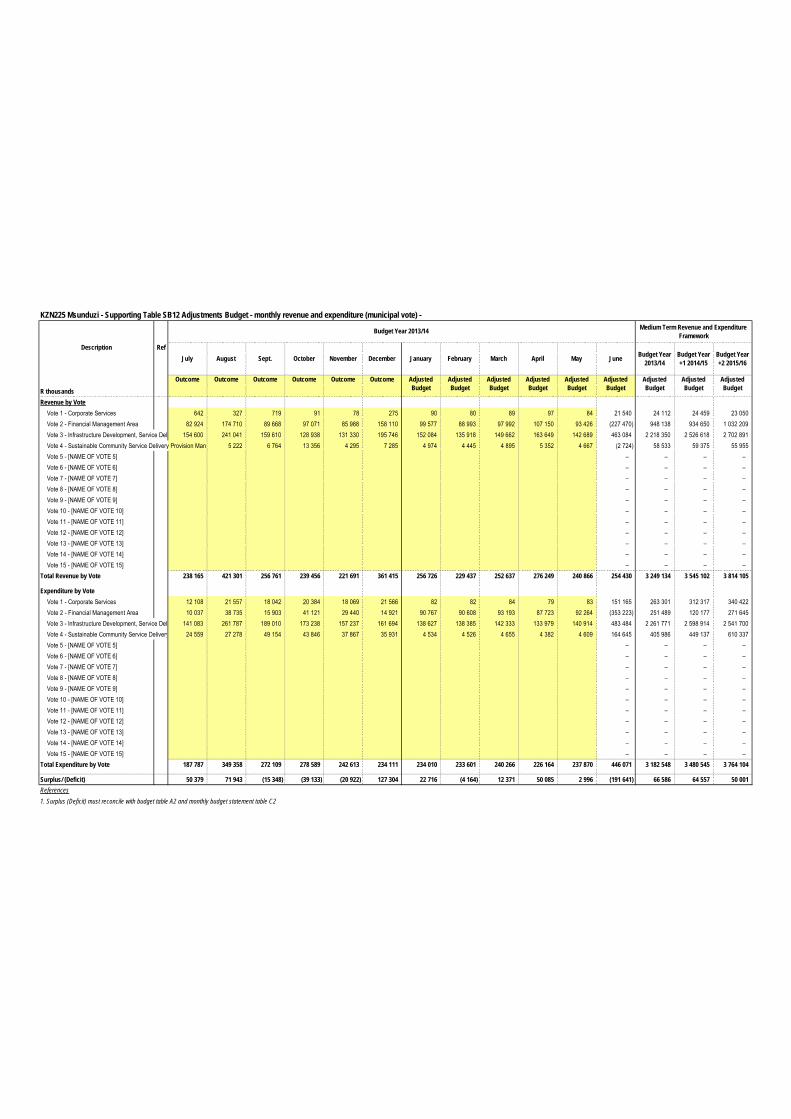
KZN225 Msunduzi - Supporting Table SB12 Adjustments Budget - monthly revenue and expenditure (municipal vote) - Medium Term Revenue and Expenditure
Framework
July August Sept. October November December January February March April May June Budget Year 2013/14
Budget Year +1 2014/15
Budget Year +2 2015/16
R thousands
Outcome Outcome Outcome Outcome Outcome Outcome Adjusted Budget
Adjusted Budget
Adjusted Budget
Adjusted Budget
Adjusted Budget
Adjusted Budget
Adjusted Budget
Adjusted Budget
Adjusted Budget
Revenue by VoteVote 1 - Corporate Services 642 327 719 91 78 275 90 80 89 97 84 21 540 24 112 24 459 23 050 Vote 2 - Financial Management Area 82 924 174 710 89 668 97 071 85 988 158 110 99 577 88 993 97 992 107 150 93 426 (227 470) 948 138 934 650 1 032 209 Vote 3 - Infrastructure Development, Service Delivery and Maintenance Management154 600 241 041 159 610 128 938 131 330 195 746 152 084 135 918 149 662 163 649 142 689 463 084 2 218 350 2 526 618 2 702 891 Vote 4 - Sustainable Community Service Delivery Provision Management5 222 6 764 13 356 4 295 7 285 4 974 4 445 4 895 5 352 4 667 (2 724) 58 533 59 375 55 955 Vote 5 - [NAME OF VOTE 5] – – – – Vote 6 - [NAME OF VOTE 6] – – – – Vote 7 - [NAME OF VOTE 7] – – – – Vote 8 - [NAME OF VOTE 8] – – – – Vote 9 - [NAME OF VOTE 9] – – – – Vote 10 - [NAME OF VOTE 10] – – – – Vote 11 - [NAME OF VOTE 11] – – – – Vote 12 - [NAME OF VOTE 12] – – – – Vote 13 - [NAME OF VOTE 13] – – – – Vote 14 - [NAME OF VOTE 14] – – – – Vote 15 - [NAME OF VOTE 15] – – – –
Total Revenue by Vote 238 165 421 301 256 761 239 456 221 691 361 415 256 726 229 437 252 637 276 249 240 866 254 430 3 249 134 3 545 102 3 814 105
Expenditure by VoteVote 1 - Corporate Services 12 108 21 557 18 042 20 384 18 069 21 566 82 82 84 79 83 151 165 263 301 312 317 340 422 Vote 2 - Financial Management Area 10 037 38 735 15 903 41 121 29 440 14 921 90 767 90 608 93 193 87 723 92 264 (353 223) 251 489 120 177 271 645 Vote 3 - Infrastructure Development, Service Delivery and Maintenance Management141 083 261 787 189 010 173 238 157 237 161 694 138 627 138 385 142 333 133 979 140 914 483 484 2 261 771 2 598 914 2 541 700 Vote 4 - Sustainable Community Service Delivery Provision Management24 559 27 278 49 154 43 846 37 867 35 931 4 534 4 526 4 655 4 382 4 609 164 645 405 986 449 137 610 337 Vote 5 - [NAME OF VOTE 5] – – – – Vote 6 - [NAME OF VOTE 6] – – – – Vote 7 - [NAME OF VOTE 7] – – – – Vote 8 - [NAME OF VOTE 8] – – – – Vote 9 - [NAME OF VOTE 9] – – – – Vote 10 - [NAME OF VOTE 10] – – – – Vote 11 - [NAME OF VOTE 11] – – – – Vote 12 - [NAME OF VOTE 12] – – – – Vote 13 - [NAME OF VOTE 13] – – – – Vote 14 - [NAME OF VOTE 14] – – – – Vote 15 - [NAME OF VOTE 15] – – – –
Total Expenditure by Vote 187 787 349 358 272 109 278 589 242 613 234 111 234 010 233 601 240 266 226 164 237 870 446 071 3 182 548 3 480 545 3 764 104
Surplus/ (Deficit) 50 379 71 943 (15 348) (39 133) (20 922) 127 304 22 716 (4 164) 12 371 50 085 2 996 (191 641) 66 586 64 557 50 001 References1. Surplus (Deficit) must reconcile with budget table A2 and monthly budget statement table C2
Description
Budget Year 2013/14
Ref
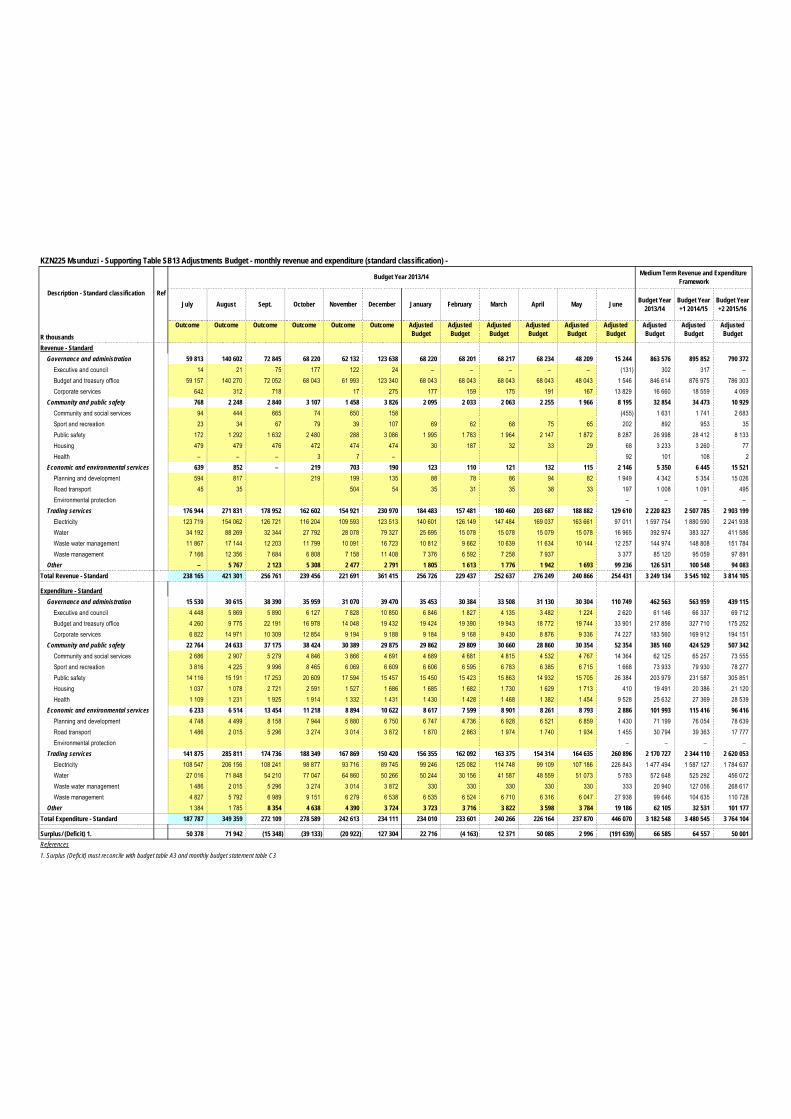
KZN225 Msunduzi - Supporting Table SB13 Adjustments Budget - monthly revenue and expenditure (standard classification) - Medium Term Revenue and Expenditure
Framework
July August Sept. October November December January February March April May June Budget Year 2013/14
Budget Year +1 2014/15
Budget Year +2 2015/16
R thousands
Outcome Outcome Outcome Outcome Outcome Outcome Adjusted Budget
Adjusted Budget
Adjusted Budget
Adjusted Budget
Adjusted Budget
Adjusted Budget
Adjusted Budget
Adjusted Budget
Adjusted Budget
Revenue - StandardGovernance and administration 59 813 140 602 72 845 68 220 62 132 123 638 68 220 68 201 68 217 68 234 48 209 15 244 863 576 895 852 790 372
Executive and council 14 21 75 177 122 24 – – – – – (131) 302 317 – Budget and treasury office 59 157 140 270 72 052 68 043 61 993 123 340 68 043 68 043 68 043 68 043 48 043 1 546 846 614 876 975 786 303 Corporate services 642 312 718 17 275 177 159 175 191 167 13 829 16 660 18 559 4 069
Community and public safety 768 2 248 2 840 3 107 1 458 3 826 2 095 2 033 2 063 2 255 1 966 8 195 32 854 34 473 10 929 Community and social services 94 444 665 74 650 158 (455) 1 631 1 741 2 683 Sport and recreation 23 34 67 79 39 107 69 62 68 75 65 202 892 953 35 Public safety 172 1 292 1 632 2 480 288 3 086 1 995 1 783 1 964 2 147 1 872 8 287 26 998 28 412 8 133 Housing 479 479 476 472 474 474 30 187 32 33 29 68 3 233 3 260 77 Health – – – 3 7 – 92 101 108 2
Economic and environmental services 639 852 – 219 703 190 123 110 121 132 115 2 146 5 350 6 445 15 521 Planning and development 594 817 219 199 135 88 78 86 94 82 1 949 4 342 5 354 15 026 Road transport 45 35 504 54 35 31 35 38 33 197 1 008 1 091 495 Environmental protection – – – –
Trading services 176 944 271 831 178 952 162 602 154 921 230 970 184 483 157 481 180 460 203 687 188 882 129 610 2 220 823 2 507 785 2 903 199 Electricity 123 719 154 062 126 721 116 204 109 593 123 513 140 601 126 149 147 484 169 037 163 661 97 011 1 597 754 1 880 590 2 241 938 Water 34 192 88 269 32 344 27 792 28 078 79 327 25 695 15 078 15 078 15 079 15 078 16 965 392 974 383 327 411 586 Waste water management 11 867 17 144 12 203 11 799 10 091 16 723 10 812 9 662 10 639 11 634 10 144 12 257 144 974 148 808 151 784 Waste management 7 166 12 356 7 684 6 808 7 158 11 408 7 376 6 592 7 258 7 937 3 377 85 120 95 059 97 891
Other – 5 767 2 123 5 308 2 477 2 791 1 805 1 613 1 776 1 942 1 693 99 236 126 531 100 548 94 083 Total Revenue - Standard 238 165 421 301 256 761 239 456 221 691 361 415 256 726 229 437 252 637 276 249 240 866 254 431 3 249 134 3 545 102 3 814 105
Expenditure - StandardGovernance and administration 15 530 30 615 38 390 35 959 31 070 39 470 35 453 30 384 33 508 31 130 30 304 110 749 462 563 563 959 439 115
Executive and council 4 448 5 869 5 890 6 127 7 828 10 850 6 846 1 827 4 135 3 482 1 224 2 620 61 146 66 337 69 712 Budget and treasury office 4 260 9 775 22 191 16 978 14 048 19 432 19 424 19 390 19 943 18 772 19 744 33 901 217 856 327 710 175 252 Corporate services 6 822 14 971 10 309 12 854 9 194 9 188 9 184 9 168 9 430 8 876 9 336 74 227 183 560 169 912 194 151
Community and public safety 22 764 24 633 37 175 38 424 30 389 29 875 29 862 29 809 30 660 28 860 30 354 52 354 385 160 424 529 507 342 Community and social services 2 686 2 907 5 279 4 846 3 866 4 691 4 689 4 681 4 815 4 532 4 767 14 364 62 125 65 257 73 555 Sport and recreation 3 816 4 225 9 996 8 465 6 069 6 609 6 606 6 595 6 783 6 385 6 715 1 668 73 933 79 930 78 277 Public safety 14 116 15 191 17 253 20 609 17 594 15 457 15 450 15 423 15 863 14 932 15 705 26 384 203 979 231 587 305 851 Housing 1 037 1 078 2 721 2 591 1 527 1 686 1 685 1 682 1 730 1 629 1 713 410 19 491 20 386 21 120 Health 1 109 1 231 1 925 1 914 1 332 1 431 1 430 1 428 1 468 1 382 1 454 9 528 25 632 27 369 28 539
Economic and environmental services 6 233 6 514 13 454 11 218 8 894 10 622 8 617 7 599 8 901 8 261 8 793 2 886 101 993 115 416 96 416 Planning and development 4 748 4 499 8 158 7 944 5 880 6 750 6 747 4 736 6 928 6 521 6 859 1 430 71 199 76 054 78 639 Road transport 1 486 2 015 5 296 3 274 3 014 3 872 1 870 2 863 1 974 1 740 1 934 1 455 30 794 39 363 17 777 Environmental protection – – – –
Trading services 141 875 285 811 174 736 188 349 167 869 150 420 156 355 162 092 163 375 154 314 164 635 260 896 2 170 727 2 344 110 2 620 053 Electricity 108 547 206 156 108 241 98 877 93 716 89 745 99 246 125 082 114 748 99 109 107 186 226 843 1 477 494 1 587 127 1 784 637 Water 27 016 71 848 54 210 77 047 64 860 50 266 50 244 30 156 41 587 48 559 51 073 5 783 572 648 525 292 456 072 Waste water management 1 486 2 015 5 296 3 274 3 014 3 872 330 330 330 330 330 333 20 940 127 056 268 617 Waste management 4 827 5 792 6 989 9 151 6 279 6 538 6 535 6 524 6 710 6 316 6 047 27 938 99 646 104 635 110 728
Other 1 384 1 785 8 354 4 638 4 390 3 724 3 723 3 716 3 822 3 598 3 784 19 186 62 105 32 531 101 177 Total Expenditure - Standard 187 787 349 359 272 109 278 589 242 613 234 111 234 010 233 601 240 266 226 164 237 870 446 070 3 182 548 3 480 545 3 764 104
Surplus/ (Deficit) 1. 50 378 71 942 (15 348) (39 133) (20 922) 127 304 22 716 (4 163) 12 371 50 085 2 996 (191 639) 66 585 64 557 50 001 References1. Surplus (Deficit) must reconcile with budget table A3 and monthly budget statement table C3
Description - Standard classification Ref
Budget Year 2013/14
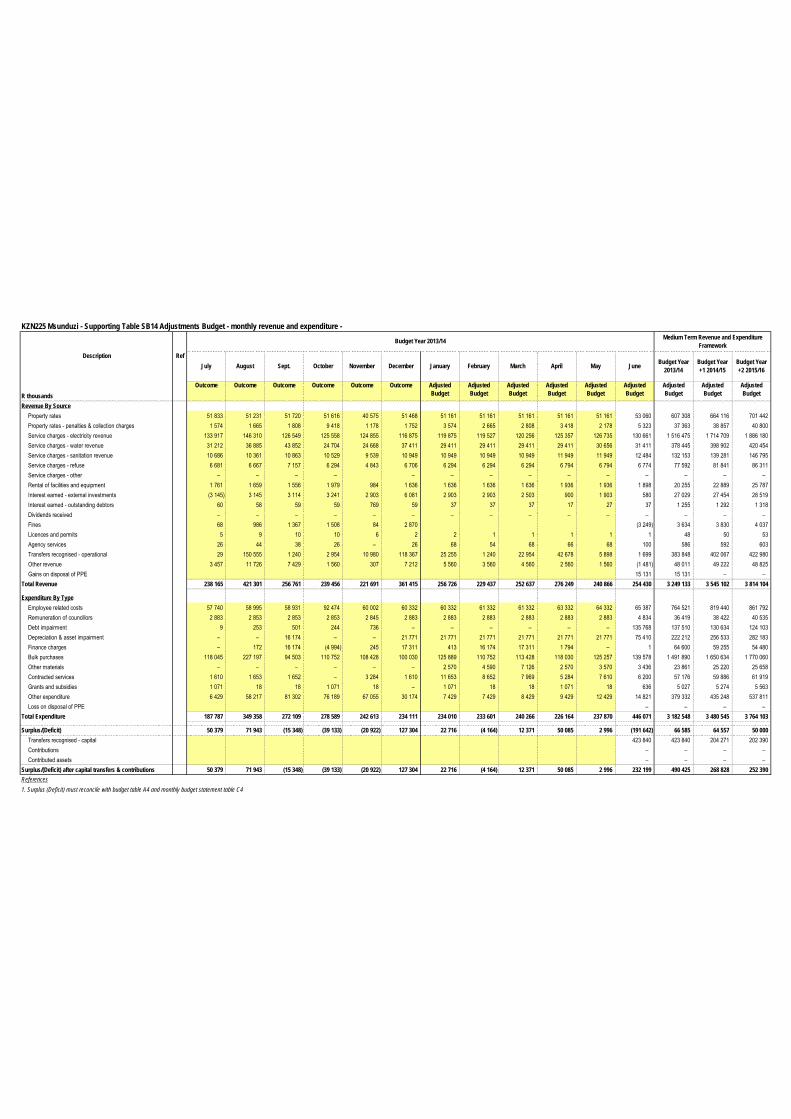
KZN225 Msunduzi - Supporting Table SB14 Adjustments Budget - monthly revenue and expenditure - Medium Term Revenue and Expenditure
Framework
July August Sept. October November December January February March April May June Budget Year 2013/14
Budget Year +1 2014/15
Budget Year +2 2015/16
R thousandsOutcome Outcome Outcome Outcome Outcome Outcome Adjusted
BudgetAdjusted Budget
Adjusted Budget
Adjusted Budget
Adjusted Budget
Adjusted Budget
Adjusted Budget
Adjusted Budget
Adjusted Budget
Revenue By SourceProperty rates 51 833 51 231 51 720 51 616 40 575 51 468 51 161 51 161 51 161 51 161 51 161 53 060 607 308 664 116 701 442 Property rates - penalties & collection charges 1 574 1 665 1 808 9 418 1 178 1 752 3 574 2 665 2 808 3 418 2 178 5 323 37 363 38 857 40 800 Service charges - electricity revenue 133 917 146 310 126 549 125 558 124 855 116 875 119 875 119 527 120 256 125 357 126 735 130 661 1 516 475 1 714 709 1 886 180 Service charges - water revenue 31 212 36 885 43 852 24 704 24 668 37 411 29 411 29 411 29 411 29 411 30 656 31 411 378 445 398 902 420 454 Service charges - sanitation revenue 10 686 10 361 10 863 10 529 9 539 10 949 10 949 10 949 10 949 11 949 11 949 12 484 132 153 139 281 146 795 Service charges - refuse 6 681 6 667 7 157 6 294 4 843 6 706 6 294 6 294 6 294 6 794 6 794 6 774 77 592 81 841 86 311 Service charges - other – – – – – – – – – – – – – – Rental of facilities and equipment 1 761 1 659 1 556 1 979 984 1 636 1 636 1 636 1 636 1 936 1 936 1 898 20 255 22 889 25 787 Interest earned - external investments (3 145) 3 145 3 114 3 241 2 903 6 081 2 903 2 903 2 503 900 1 903 580 27 029 27 454 28 519 Interest earned - outstanding debtors 60 58 59 59 769 59 37 37 37 17 27 37 1 255 1 292 1 318 Dividends received – – – – – – – – – – – – – – – Fines 68 986 1 367 1 508 84 2 870 (3 249) 3 634 3 830 4 037 Licences and permits 5 9 10 10 6 2 2 1 1 1 1 1 48 50 53 Agency services 26 44 38 26 – 26 68 54 68 66 68 100 586 592 603 Transfers recognised - operational 29 150 555 1 240 2 954 10 980 118 367 25 255 1 240 22 954 42 678 5 898 1 699 383 848 402 067 422 980 Other revenue 3 457 11 726 7 429 1 560 307 7 212 5 560 3 560 4 560 2 560 1 560 (1 481) 48 011 49 222 48 825 Gains on disposal of PPE 15 131 15 131 – –
Total Revenue 238 165 421 301 256 761 239 456 221 691 361 415 256 726 229 437 252 637 276 249 240 866 254 430 3 249 133 3 545 102 3 814 104
Expenditure By TypeEmployee related costs 57 740 58 995 58 931 92 474 60 002 60 332 60 332 61 332 61 332 63 332 64 332 65 387 764 521 819 440 861 792 Remuneration of councillors 2 883 2 853 2 853 2 853 2 845 2 883 2 883 2 883 2 883 2 883 2 883 4 834 36 419 38 422 40 535 Debt impairment 9 253 501 244 736 – – – – – – 135 768 137 510 130 634 124 103 Depreciation & asset impairment – – 16 174 – – 21 771 21 771 21 771 21 771 21 771 21 771 75 410 222 212 256 533 282 183 Finance charges – 172 16 174 (4 994) 245 17 311 413 16 174 17 311 1 794 – 1 64 600 59 255 54 480 Bulk purchases 118 045 227 197 94 503 110 752 108 428 100 030 125 889 110 752 113 428 118 030 125 257 139 578 1 491 890 1 650 634 1 770 060 Other materials – – – – – – 2 570 4 590 7 126 2 570 3 570 3 436 23 861 25 220 25 658 Contracted services 1 610 1 653 1 652 – 3 284 1 610 11 653 8 652 7 969 5 284 7 610 6 200 57 176 59 886 61 919 Grants and subsidies 1 071 18 18 1 071 18 – 1 071 18 18 1 071 18 636 5 027 5 274 5 563 Other expenditure 6 429 58 217 81 302 76 189 67 055 30 174 7 429 7 429 8 429 9 429 12 429 14 821 379 332 435 248 537 811 Loss on disposal of PPE – – – –
Total Expenditure 187 787 349 358 272 109 278 589 242 613 234 111 234 010 233 601 240 266 226 164 237 870 446 071 3 182 548 3 480 545 3 764 103
Surplus/(Deficit) 50 379 71 943 (15 348) (39 133) (20 922) 127 304 22 716 (4 164) 12 371 50 085 2 996 (191 642) 66 585 64 557 50 000 Transfers recognised - capital 423 840 423 840 204 271 202 390 Contributions – – – – Contributed assets – – – –
Surplus/(Deficit) after capital transfers & contributions 50 379 71 943 (15 348) (39 133) (20 922) 127 304 22 716 (4 164) 12 371 50 085 2 996 232 199 490 425 268 828 252 390 References1. Surplus (Deficit) must reconcile with budget table A4 and monthly budget statement table C4
Description Ref
Budget Year 2013/14
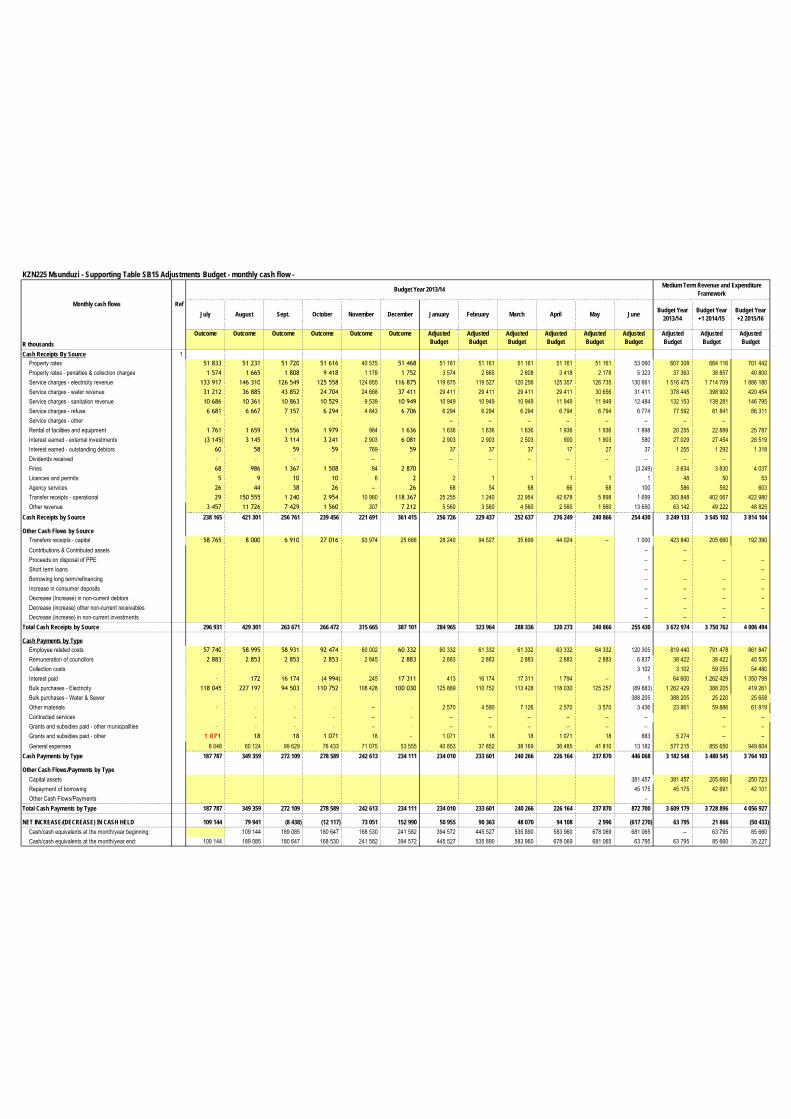
KZN225 Msunduzi - Supporting Table SB15 Adjustments Budget - monthly cash flow -
July August Sept. October November December January February March April May June Budget Year 2013/14
Budget Year +1 2014/15
Budget Year +2 2015/16
R thousandsOutcome Outcome Outcome Outcome Outcome Outcome Adjusted
BudgetAdjusted Budget
Adjusted Budget
Adjusted Budget
Adjusted Budget
Adjusted Budget
Adjusted Budget
Adjusted Budget
Adjusted Budget
Cash Receipts By Source 1Property rates 51 833 51 231 51 720 51 616 40 575 51 468 51 161 51 161 51 161 51 161 51 161 53 060 607 308 664 116 701 442 Property rates - penalties & collection charges 1 574 1 665 1 808 9 418 1 178 1 752 3 574 2 665 2 808 3 418 2 178 5 323 37 363 38 857 40 800 Service charges - electricity revenue 133 917 146 310 126 549 125 558 124 855 116 875 119 875 119 527 120 256 125 357 126 735 130 661 1 516 475 1 714 709 1 886 180 Service charges - water revenue 31 212 36 885 43 852 24 704 24 668 37 411 29 411 29 411 29 411 29 411 30 656 31 411 378 445 398 902 420 454 Service charges - sanitation revenue 10 686 10 361 10 863 10 529 9 539 10 949 10 949 10 949 10 949 11 949 11 949 12 484 132 153 139 281 146 795 Service charges - refuse 6 681 6 667 7 157 6 294 4 843 6 706 6 294 6 294 6 294 6 794 6 794 6 774 77 592 81 841 86 311 Service charges - other – – – – – – – – – – – – – Rental of facilities and equipment 1 761 1 659 1 556 1 979 984 1 636 1 636 1 636 1 636 1 936 1 936 1 898 20 255 22 889 25 787 Interest earned - external investments (3 145) 3 145 3 114 3 241 2 903 6 081 2 903 2 903 2 503 900 1 903 580 27 029 27 454 28 519 Interest earned - outstanding debtors 60 58 59 59 769 59 37 37 37 17 27 37 1 255 1 292 1 318 Dividends received – – – – – – – – – – – – – – Fines 68 986 1 367 1 508 84 2 870 (3 249) 3 634 3 830 4 037 Licences and permits 5 9 10 10 6 2 2 1 1 1 1 1 48 50 53 Agency services 26 44 38 26 – 26 68 54 68 66 68 100 586 592 603 Transfer receipts - operational 29 150 555 1 240 2 954 10 980 118 367 25 255 1 240 22 954 42 678 5 898 1 699 383 848 402 067 422 980 Other revenue 3 457 11 726 7 429 1 560 307 7 212 5 560 3 560 4 560 2 560 1 560 13 650 63 142 49 222 48 825
Cash Receipts by Source 238 165 421 301 256 761 239 456 221 691 361 415 256 726 229 437 252 637 276 249 240 866 254 430 3 249 133 3 545 102 3 814 104
Other Cash Flows by SourceTransfers receipts - capital 58 765 8 000 6 910 27 016 93 974 25 686 28 240 94 527 35 699 44 024 – 1 000 423 840 205 660 192 390 Contributions & Contributed assets – – Proceeds on disposal of PPE – – – – Short term loans – – Borrowing long term/refinancing – – – – Increase in consumer deposits – – – – Decrease (Increase) in non-current debtors – – – – Decrease (increase) other non-current receivables – – – – Decrease (increase) in non-current investments – – –
Total Cash Receipts by Source 296 931 429 301 263 671 266 472 315 665 387 101 284 965 323 964 288 336 320 273 240 866 255 430 3 672 974 3 750 762 4 006 494
Cash Payments by TypeEmployee related costs 57 740 58 995 58 931 92 474 60 002 60 332 60 332 61 332 61 332 63 332 64 332 120 305 819 440 791 478 861 847 Remuneration of councillors 2 883 2 853 2 853 2 853 2 845 2 883 2 883 2 883 2 883 2 883 2 883 6 837 38 422 38 422 40 535 Collection costs 3 102 3 102 59 255 54 480 Interest paid – 172 16 174 (4 994) 245 17 311 413 16 174 17 311 1 794 – 1 64 600 1 262 429 1 350 799 Bulk purchases - Electricity 118 045 227 197 94 503 110 752 108 428 100 030 125 889 110 752 113 428 118 030 125 257 (89 883) 1 262 429 388 205 419 261 Bulk purchases - Water & Sewer 388 205 388 205 25 220 25 658 Other materials – – – – – – 2 570 4 590 7 126 2 570 3 570 3 436 23 861 59 886 61 919 Contracted services – – – – – – – – – – – – – Grants and subsidies paid - other municipalities – – – – – – – – – – – – – – Grants and subsidies paid - other 1 071 18 18 1 071 18 – 1 071 18 18 1 071 18 883 5 274 – – General expenses 8 048 60 124 99 629 76 433 71 075 53 555 40 853 37 852 38 169 36 485 41 810 13 182 577 215 855 650 949 604
Cash Payments by Type 187 787 349 359 272 109 278 589 242 613 234 111 234 010 233 601 240 266 226 164 237 870 446 068 3 182 548 3 480 545 3 764 103
Other Cash Flows/Payments by TypeCapital assets 381 457 381 457 205 660 250 723 Repayment of borrowing 45 175 45 175 42 691 42 101 Other Cash Flows/Payments –
Total Cash Payments by Type 187 787 349 359 272 109 278 589 242 613 234 111 234 010 233 601 240 266 226 164 237 870 872 700 3 609 179 3 728 896 4 056 927
NET INCREASE/(DECREASE) IN CASH HELD 109 144 79 941 (8 438) (12 117) 73 051 152 990 50 955 90 363 48 070 94 108 2 996 (617 270) 63 795 21 866 (50 433) Cash/cash equivalents at the month/year beginning: 109 144 189 085 180 647 168 530 241 582 394 572 445 527 535 890 583 960 678 069 681 065 – 63 795 85 660 Cash/cash equivalents at the month/year end: 109 144 189 085 180 647 168 530 241 582 394 572 445 527 535 890 583 960 678 069 681 065 63 795 63 795 85 660 35 227
Monthly cash flows
Medium Term Revenue and Expenditure Framework
Ref
Budget Year 2013/14
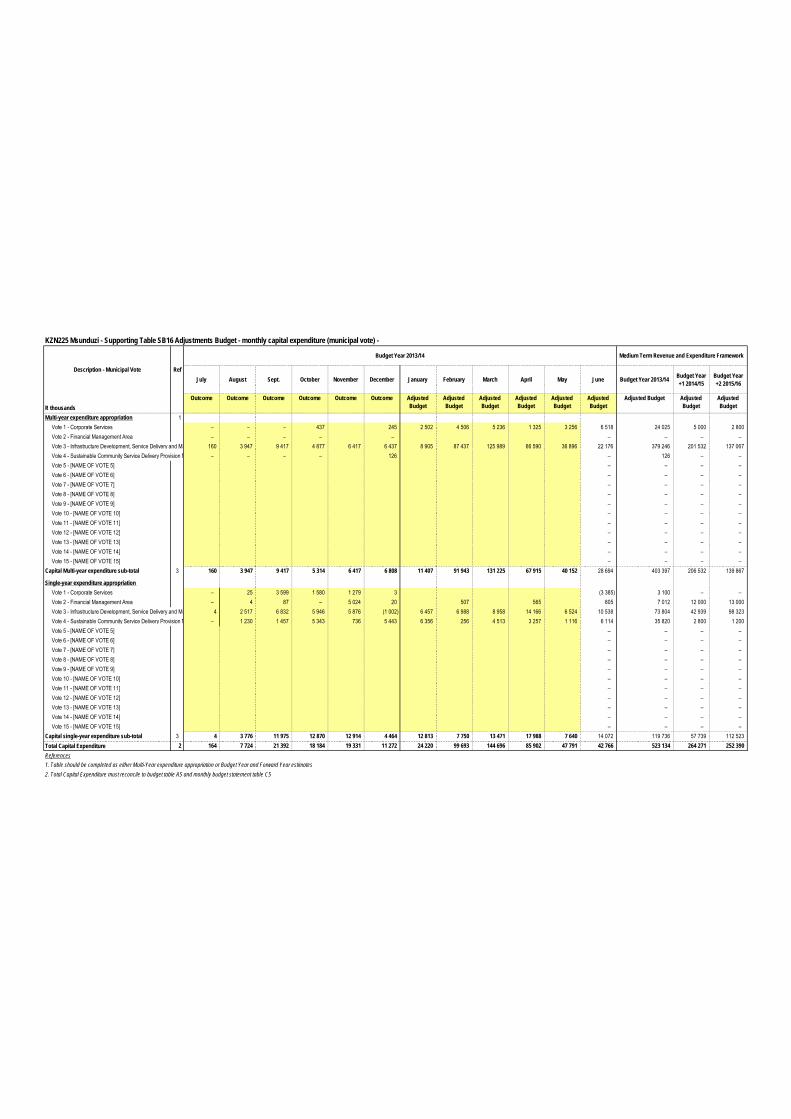
KZN225 Msunduzi - Supporting Table SB16 Adjustments Budget - monthly capital expenditure (municipal vote) -
Budget Year 2013/14 Medium Term Revenue and Expenditure Framework
July August Sept. October November December January February March April May June Budget Year 2013/14 Budget Year +1 2014/15
Budget Year +2 2015/16
R thousandsOutcome Outcome Outcome Outcome Outcome Outcome Adjusted
BudgetAdjusted Budget
Adjusted Budget
Adjusted Budget
Adjusted Budget
Adjusted Budget
Adjusted Budget Adjusted Budget
Adjusted Budget
Multi-year expenditure appropriation 1Vote 1 - Corporate Services – – – 437 245 2 502 4 506 5 236 1 325 3 256 6 518 24 025 5 000 2 800 Vote 2 - Financial Management Area – – – – – – – – – Vote 3 - Infrastructure Development, Service Delivery and Maintenance Management160 3 947 9 417 4 877 6 417 6 437 8 905 87 437 125 989 66 590 36 896 22 176 379 246 201 532 137 067 Vote 4 - Sustainable Community Service Delivery Provision Management– – – – 126 – 126 – – Vote 5 - [NAME OF VOTE 5] – – – – Vote 6 - [NAME OF VOTE 6] – – – – Vote 7 - [NAME OF VOTE 7] – – – – Vote 8 - [NAME OF VOTE 8] – – – – Vote 9 - [NAME OF VOTE 9] – – – – Vote 10 - [NAME OF VOTE 10] – – – – Vote 11 - [NAME OF VOTE 11] – – – – Vote 12 - [NAME OF VOTE 12] – – – – Vote 13 - [NAME OF VOTE 13] – – – – Vote 14 - [NAME OF VOTE 14] – – – – Vote 15 - [NAME OF VOTE 15] – – – –
Capital Multi-year expenditure sub-total 3 160 3 947 9 417 5 314 6 417 6 808 11 407 91 943 131 225 67 915 40 152 28 694 403 397 206 532 139 867 50 870 782 769 408 064 276 934 Single-year expenditure appropriation
Vote 1 - Corporate Services – 25 3 599 1 580 1 279 3 (3 385) 3 100 – – Vote 2 - Financial Management Area – 4 87 – 5 024 20 507 565 805 7 012 12 000 13 000 Vote 3 - Infrastructure Development, Service Delivery and Maintenance Management4 2 517 6 832 5 946 5 876 (1 002) 6 457 6 988 8 958 14 166 6 524 10 538 73 804 42 939 98 323 Vote 4 - Sustainable Community Service Delivery Provision Management– 1 230 1 457 5 343 736 5 443 6 356 256 4 513 3 257 1 116 6 114 35 820 2 800 1 200 Vote 5 - [NAME OF VOTE 5] – – – – Vote 6 - [NAME OF VOTE 6] – – – – Vote 7 - [NAME OF VOTE 7] – – – – Vote 8 - [NAME OF VOTE 8] – – – – Vote 9 - [NAME OF VOTE 9] – – – – Vote 10 - [NAME OF VOTE 10] – – – – Vote 11 - [NAME OF VOTE 11] – – – – Vote 12 - [NAME OF VOTE 12] – – – – Vote 13 - [NAME OF VOTE 13] – – – – Vote 14 - [NAME OF VOTE 14] – – – – Vote 15 - [NAME OF VOTE 15] – – – –
Capital single-year expenditure sub-total 3 4 3 776 11 975 12 870 12 914 4 464 12 813 7 750 13 471 17 988 7 640 14 072 119 736 57 739 112 523 Total Capital Expenditure 2 164 7 724 21 392 18 184 19 331 11 272 24 220 99 693 144 696 85 902 47 791 42 766 523 134 264 271 252 390 References1. Table should be completed as either Multi-Year expenditure appropriation or Budget Year and Forward Year estimates2. Total Capital Expenditure must reconcile to budget table A5 and monthly budget statement table C5
Description - Municipal Vote Ref
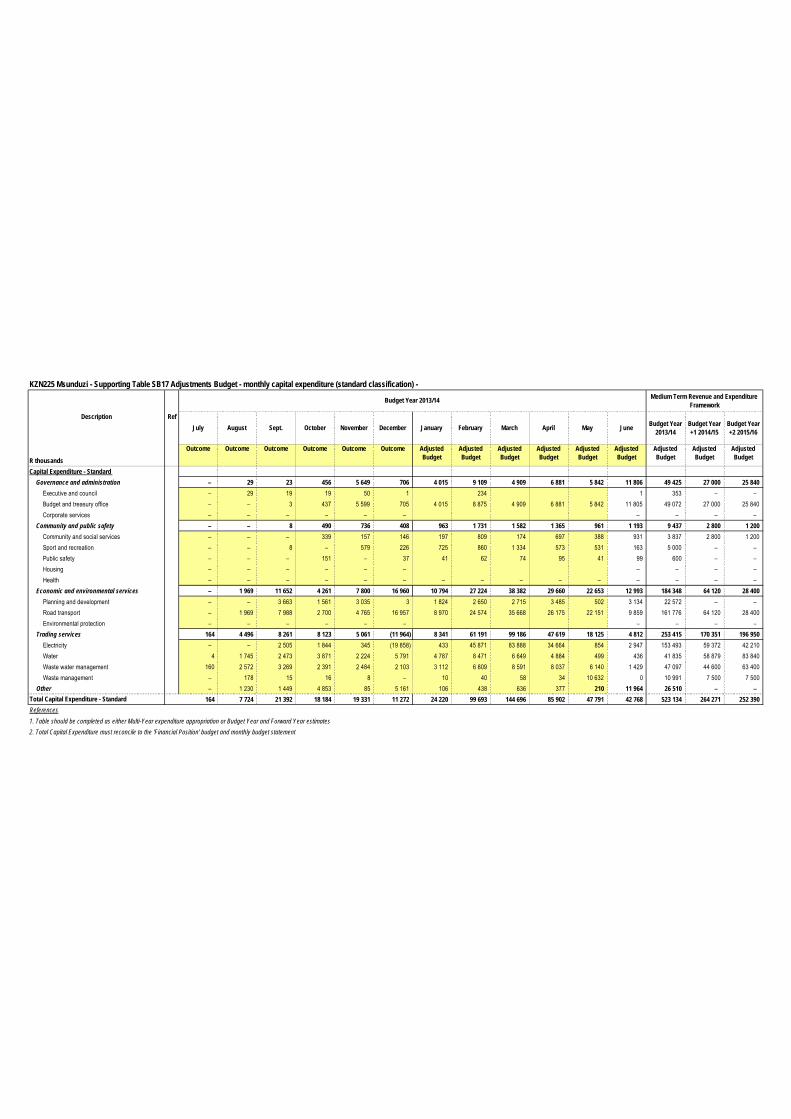
KZN225 Msunduzi - Supporting Table SB17 Adjustments Budget - monthly capital expenditure (standard classification) - Medium Term Revenue and Expenditure
Framework
July August Sept. October November December January February March April May June Budget Year 2013/14
Budget Year +1 2014/15
Budget Year +2 2015/16
R thousands
Outcome Outcome Outcome Outcome Outcome Outcome Adjusted Budget
Adjusted Budget
Adjusted Budget
Adjusted Budget
Adjusted Budget
Adjusted Budget
Adjusted Budget
Adjusted Budget
Adjusted Budget
Capital Expenditure - StandardGovernance and administration – 29 23 456 5 649 706 4 015 9 109 4 909 6 881 5 842 11 806 49 425 27 000 25 840
Executive and council – 29 19 19 50 1 234 1 353 – – Budget and treasury office – – 3 437 5 599 705 4 015 8 875 4 909 6 881 5 842 11 805 49 072 27 000 25 840 Corporate services – – – – – – – – – –
Community and public safety – – 8 490 736 408 963 1 731 1 582 1 365 961 1 193 9 437 2 800 1 200 Community and social services – – – 339 157 146 197 809 174 697 388 931 3 837 2 800 1 200 Sport and recreation – – 8 – 579 226 725 860 1 334 573 531 163 5 000 – – Public safety – – – 151 – 37 41 62 74 95 41 99 600 – – Housing – – – – – – – – – – Health – – – – – – – – – – – – – – –
Economic and environmental services – 1 969 11 652 4 261 7 800 16 960 10 794 27 224 38 382 29 660 22 653 12 993 184 348 64 120 28 400 Planning and development – – 3 663 1 561 3 035 3 1 824 2 650 2 715 3 485 502 3 134 22 572 – – Road transport – 1 969 7 988 2 700 4 765 16 957 8 970 24 574 35 668 26 175 22 151 9 859 161 776 64 120 28 400 Environmental protection – – – – – – – – – –
Trading services 164 4 496 8 261 8 123 5 061 (11 964) 8 341 61 191 99 186 47 619 18 125 4 812 253 415 170 351 196 950 Electricity – – 2 505 1 844 345 (19 858) 433 45 871 83 888 34 664 854 2 947 153 493 59 372 42 210 Water 4 1 745 2 473 3 871 2 224 5 791 4 787 8 471 6 649 4 884 499 436 41 835 58 879 83 840 Waste water management 160 2 572 3 269 2 391 2 484 2 103 3 112 6 809 8 591 8 037 6 140 1 429 47 097 44 600 63 400 Waste management – 178 15 16 8 – 10 40 58 34 10 632 0 10 991 7 500 7 500
Other – 1 230 1 449 4 853 85 5 161 106 438 636 377 210 11 964 26 510 – – Total Capital Expenditure - Standard 164 7 724 21 392 18 184 19 331 11 272 24 220 99 693 144 696 85 902 47 791 42 768 523 134 264 271 252 390 References1. Table should be completed as either Multi-Year expenditure appropriation or Budget Year and Forward Year estimates2. Total Capital Expenditure must reconcile to the 'Financial Position' budget and monthly budget statement
Description Ref
Budget Year 2013/14
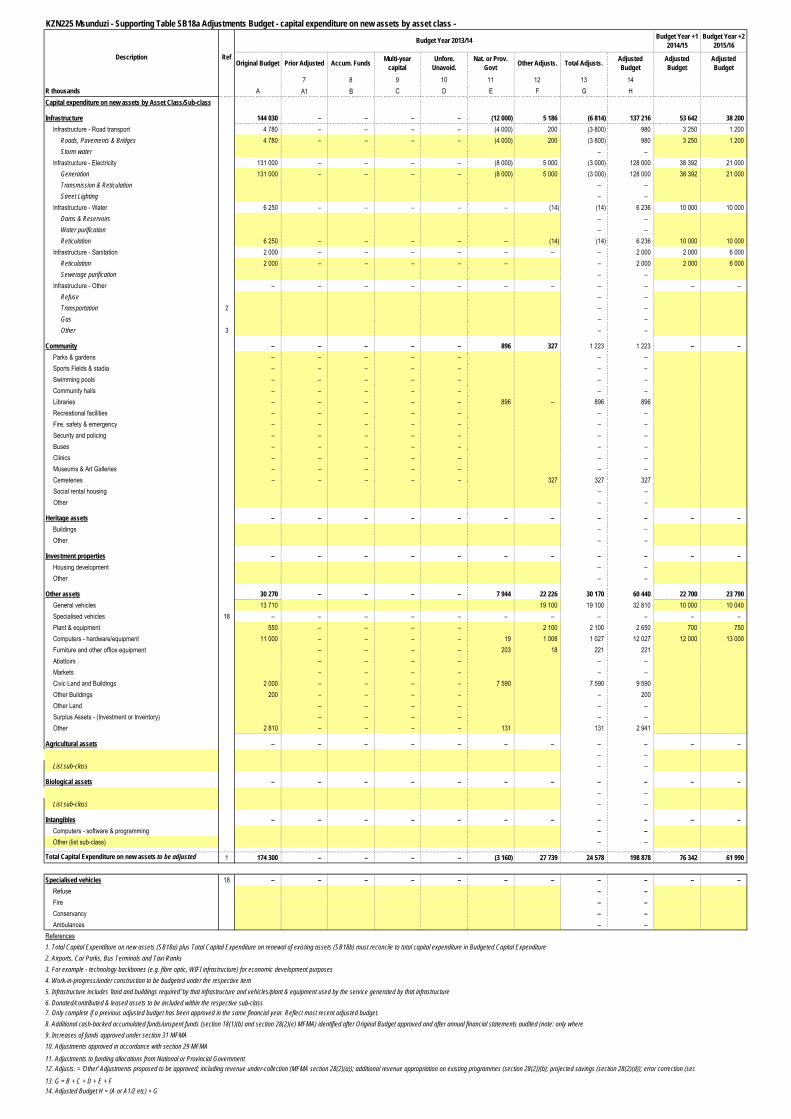
KZN225 Msunduzi - Supporting Table SB18a Adjustments Budget - capital expenditure on new assets by asset class - Budget Year +1
2014/15Budget Year +2
2015/16
Original Budget Prior Adjusted Accum. Funds Multi-year capital
Unfore. Unavoid.
Nat. or Prov. Govt Other Adjusts. Total Adjusts. Adjusted
BudgetAdjusted Budget
Adjusted Budget
7 8 9 10 11 12 13 14R thousands A A1 B C D E F G HCapital expenditure on new assets by Asset Class/Sub-class
Infrastructure 144 030 – – – – (12 000) 5 186 (6 814) 137 216 53 642 38 200 Infrastructure - Road transport 4 780 – – – – (4 000) 200 (3 800) 980 3 250 1 200
Roads, Pavements & Bridges 4 780 – – – – (4 000) 200 (3 800) 980 3 250 1 200 Storm water – –
Infrastructure - Electricity 131 000 – – – – (8 000) 5 000 (3 000) 128 000 38 392 21 000 Generation 131 000 – – – – (8 000) 5 000 (3 000) 128 000 38 392 21 000 Transmission & Reticulation – – Street Lighting – –
Infrastructure - Water 6 250 – – – – – (14) (14) 6 236 10 000 10 000 Dams & Reservoirs – – Water purification – – Reticulation 6 250 – – – – – (14) (14) 6 236 10 000 10 000
Infrastructure - Sanitation 2 000 – – – – – – – 2 000 2 000 6 000 Reticulation 2 000 – – – – – – 2 000 2 000 6 000 Sewerage purification – –
Infrastructure - Other – – – – – – – – – – – Refuse – – Transportation 2 – – Gas – – Other 3 – – – –
Community – – – – – 896 327 1 223 1 223 – – Parks & gardens – – – – – – – Sports Fields & stadia – – – – – – – Swimming pools – – – – – – – Community halls – – – – – – – Libraries – – – – – 896 – 896 896 Recreational facilities – – – – – – – Fire, safety & emergency – – – – – – – Security and policing – – – – – – – Buses – – – – – – – Clinics – – – – – – – Museums & Art Galleries – – – – – – – Cemeteries – – – – – 327 327 327 Social rental housing – – Other – –
Heritage assets – – – – – – – – – – – Buildings – – Other – –
Investment properties – – – – – – – – – – – Housing development – – Other – –
Other assets 30 270 – – – – 7 944 22 226 30 170 60 440 22 700 23 790 General vehicles 13 710 19 100 19 100 32 810 10 000 10 040 Specialised vehicles 18 – – – – – – – – – – – Plant & equipment 550 – – – – 2 100 2 100 2 650 700 750 Computers - hardware/equipment 11 000 – – – – 19 1 008 1 027 12 027 12 000 13 000 Furniture and other office equipment – – – – 203 18 221 221 Abattoirs – – – – – – Markets – – – – – – Civic Land and Buildings 2 000 – – – – 7 590 7 590 9 590 Other Buildings 200 – – – – – 200 Other Land – – – – – – Surplus Assets - (Investment or Inventory) – – – – – – Other 2 810 – – – – 131 131 2 941
Agricultural assets – – – – – – – – – – – – –
List sub-class – –
Biological assets – – – – – – – – – – – – –
List sub-class – –
Intangibles – – – – – – – – – – – Computers - software & programming – – Other (list sub-class) – –
Total Capital Expenditure on new assets to be adjusted 1 174 300 – – – – (3 160) 27 739 24 578 198 878 76 342 61 990
Specialised vehicles 18 – – – – – – – – – – – Refuse – – Fire – – Conservancy – – Ambulances – –
References1. Total Capital Expenditure on new assets (SB18a) plus Total Capital Expenditure on renewal of existing assets (SB18b) must reconcile to total capital expenditure in Budgeted Capital Expenditure2. Airports, Car Parks, Bus Terminals and Taxi Ranks3. For example - technology backbones (e.g. fibre optic, WIFI infrastructure) for economic development purposes4. Work-in-progress/under construction to be budgeted under the respective item5. Infrastructure includes 'land and buildings required' by that infrastructure and vehicles/plant & equipment used by the service generated by that infrastructure6. Donated/contributed & leased assets to be included within the respective sub-class
11. Adjustments to funding allocations from National or Provincial Government
13. G = B + C + D + E + F
Description
12. Adjusts. = 'Other' Adjustments proposed to be approved; including revenue under-collection (MFMA section 28(2)(a)); additional revenue appropriation on existing programmes (section 28(2))(b); projected savings (section 28(2)(d)); error correction (sec
14. Adjusted Budget H = (A or A1/2 etc) + G
7. Only complete if a previous adjusted budget has been approved in the same financial year. Reflect most recent adjusted budget.8. Additional cash-backed accumulated funds/unspent funds (section 18(1)(b) and section 28(2)(e) MFMA) identified after Original Budget approved and after annual financial statements audited (note: only where underspending could not reasonably be have for9. Increases of funds approved under section 31 MFMA10. Adjustments approved in accordance with section 29 MFMA
Budget Year 2013/14
Ref
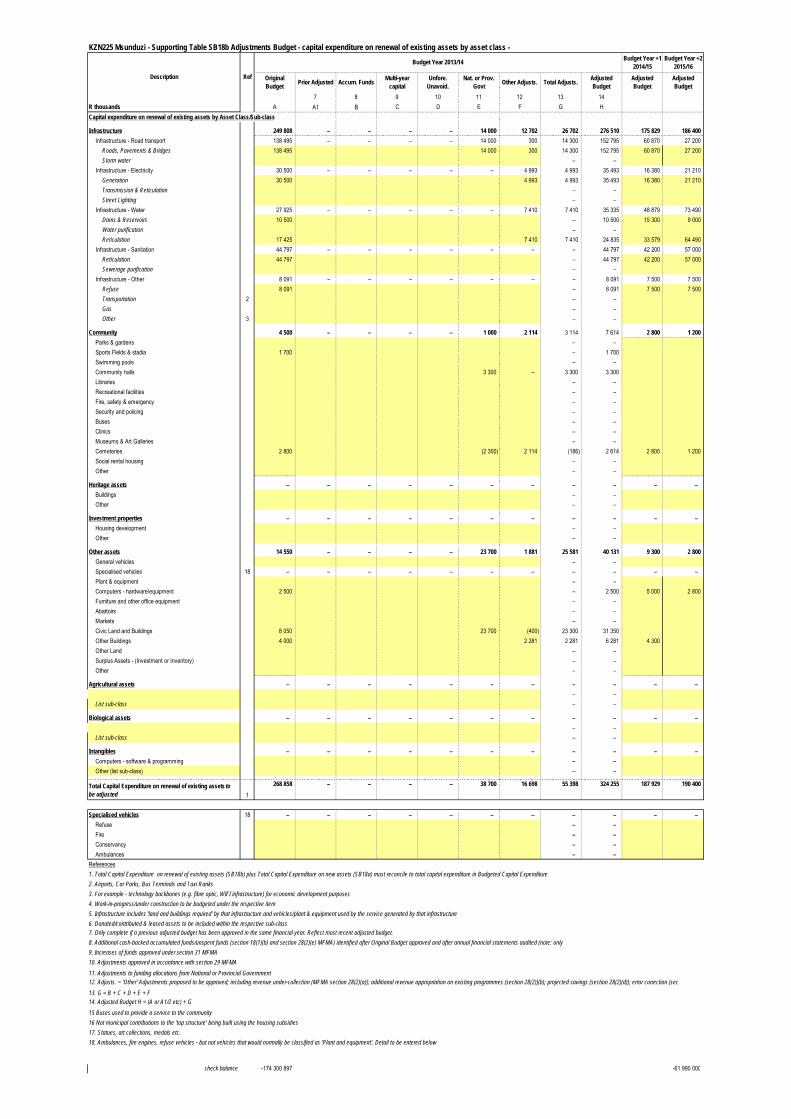
KZN225 Msunduzi - Supporting Table SB18b Adjustments Budget - capital expenditure on renewal of existing assets by asset class - Budget Year +1
2014/15Budget Year +2
2015/16
Original Budget Prior Adjusted Accum. Funds Multi-year
capitalUnfore.
Unavoid.Nat. or Prov.
Govt Other Adjusts. Total Adjusts. Adjusted Budget
Adjusted Budget
Adjusted Budget
7 8 9 10 11 12 13 14R thousands A A1 B C D E F G HCapital expenditure on renewal of existing assets by Asset Class/Sub-class
Infrastructure 249 808 – – – – 14 000 12 702 26 702 276 510 175 829 186 400 Infrastructure - Road transport 138 495 – – – – 14 000 300 14 300 152 795 60 870 27 200
Roads, Pavements & Bridges 138 495 14 000 300 14 300 152 795 60 870 27 200 Storm water – –
Infrastructure - Electricity 30 500 – – – – – 4 993 4 993 35 493 16 380 21 210 Generation 30 500 4 993 4 993 35 493 16 380 21 210 Transmission & Reticulation – – Street Lighting – –
Infrastructure - Water 27 925 – – – – – 7 410 7 410 35 335 48 879 73 490 Dams & Reservoirs 10 500 – 10 500 15 300 9 000 Water purification – – Reticulation 17 425 7 410 7 410 24 835 33 579 64 490
Infrastructure - Sanitation 44 797 – – – – – – – 44 797 42 200 57 000 Reticulation 44 797 – 44 797 42 200 57 000 Sewerage purification – –
Infrastructure - Other 8 091 – – – – – – – 8 091 7 500 7 500 Refuse 8 091 – 8 091 7 500 7 500 Transportation 2 – – Gas – – Other 3 – – – –
Community 4 500 – – – – 1 000 2 114 3 114 7 614 2 800 1 200 Parks & gardens – – Sports Fields & stadia 1 700 – 1 700 Swimming pools – – Community halls 3 300 – 3 300 3 300 Libraries – – Recreational facilities – – Fire, safety & emergency – – Security and policing – – Buses – – Clinics – – Museums & Art Galleries – – Cemeteries 2 800 (2 300) 2 114 (186) 2 614 2 800 1 200 Social rental housing – – Other – –
Heritage assets – – – – – – – – – – – Buildings – – Other – –
Investment properties – – – – – – – – – – – Housing development – – Other – –
Other assets 14 550 – – – – 23 700 1 881 25 581 40 131 9 300 2 800 General vehicles – – Specialised vehicles 18 – – – – – – – – – – – Plant & equipment – – Computers - hardware/equipment 2 500 – 2 500 5 000 2 800 Furniture and other office equipment – – Abattoirs – – Markets – – Civic Land and Buildings 8 050 23 700 (400) 23 300 31 350 Other Buildings 4 000 2 281 2 281 6 281 4 300 Other Land – – Surplus Assets - (Investment or Inventory) – – Other – –
Agricultural assets – – – – – – – – – – – – –
List sub-class – –
Biological assets – – – – – – – – – – – – –
List sub-class – –
Intangibles – – – – – – – – – – – Computers - software & programming – – Other (list sub-class) – –
Total Capital Expenditure on renewal of existing assets to be adjusted 1
268 858 – – – – 38 700 16 698 55 398 324 255 187 929 190 400
Specialised vehicles 18 – – – – – – – – – – – Refuse – – Fire – – Conservancy – – Ambulances – –
References1. Total Capital Expenditure on renewal of existing assets (SB18b) plus Total Capital Expenditure on new assets (SB18a) must reconcile to total capital expenditure in Budgeted Capital Expenditure2. Airports, Car Parks, Bus Terminals and Taxi Ranks3. For example - technology backbones (e.g. fibre optic, WIFI infrastructure) for economic development purposes4. Work-in-progress/under construction to be budgeted under the respective item5. Infrastructure includes 'land and buildings required' by that infrastructure and vehicles/plant & equipment used by the service generated by that infrastructure6. Donated/contributed & leased assets to be included within the respective sub-class
11. Adjustments to funding allocations from National or Provincial Government
13. G = B + C + D + E + F
15 Buses used to provide a service to the community16 Not municipal contributions to the 'top structure' being built using the housing subsidies17. Statues, art collections, medals etc.18. Ambulances, fire engines, refuse vehicles - but not vehicles that would normally be classified as 'Plant and equipment'. Detail to be entered below
check balance -174 300 897 -61 990 000
Description Ref
Budget Year 2013/14
7. Only complete if a previous adjusted budget has been approved in the same financial year. Reflect most recent adjusted budget.
14. Adjusted Budget H = (A or A1/2 etc) + G
8. Additional cash-backed accumulated funds/unspent funds (section 18(1)(b) and section 28(2)(e) MFMA) identified after Original Budget approved and after annual financial statements audited (note: only where underspending could not reasonably be have for9. Increases of funds approved under section 31 MFMA10. Adjustments approved in accordance with section 29 MFMA
12. Adjusts. = 'Other' Adjustments proposed to be approved; including revenue under-collection (MFMA section 28(2)(a)); additional revenue appropriation on existing programmes (section 28(2))(b); projected savings (section 28(2)(d)); error correction (sec

KZN225 Msunduzi - Supporting Table SB18c Adjustments Budget - expenditure on repairs and maintenance by asset class - Budget Year +1
2014/15Budget Year +2
2015/16
Original Budget Prior Adjusted Accum. Funds Multi-year
capitalUnfore.
Unavoid.Nat. or Prov.
Govt Other Adjusts. Total Adjusts. Adjusted Budget
Adjusted Budget
Adjusted Budget
7 8 9 10 11 12 13 14R thousands A A1 B C D E F G HRepairs and maintenance expenditure by Asset Class/Sub-class
Infrastructure 57 165 – – – – – (5 303) (5 303) 51 862 61 144 64 090 Infrastructure - Road transport 7 094 – – – – – (3 248) (3 248) 3 847 7 548 7 729
Roads, Pavements & Bridges 7 094 (3 248) (3 248) 3 847 7 548 7 729 Storm water – –
Infrastructure - Electricity 48 014 – – – – – (2 055) (2 055) 45 959 51 432 54 071 Generation – – Transmission & Reticulation 47 899 (2 055) (2 055) 45 844 51 295 53 908 Street Lighting 115 – 115 137 163
Infrastructure - Water 1 554 – – – – – – – 1 554 1 632 1 728 Dams & Reservoirs – – Water purification – – Reticulation 1 554 – 1 554 1 632 1 728
Infrastructure - Sanitation 502 – – – – – – – 502 531 561 Reticulation 502 – 502 531 561 Sewerage purification – –
Infrastructure - Other – – – – – – – – – – – Refuse – – Transportation 2 – – Gas – – Other 3 – – – –
Community – – – – – – – – – – – Parks & gardens – – Sports Fields & stadia – – Swimming pools – – Community halls – – Libraries – – Recreational facilities – – Fire, safety & emergency – – Security and policing – – Buses – – Clinics – – Museums & Art Galleries – – Cemeteries – – Social rental housing – – Other – –
Heritage assets – – – – – – – – – – – Buildings – – Other – –
Investment properties – – – – – – – – – – – Housing development – – Other – –
Other assets 37 792 – – – – – (1 910) (1 910) 35 882 38 123 66 317 General vehicles 11 618 21 21 11 639 11 689 19 817 Specialised vehicles 18 – – – – – – – – – – – Plant & equipment 22 091 (1 010) (1 010) 21 081 22 311 40 180 Computers - hardware/equipment – – Furniture and other office equipment – – Abattoirs – – Markets – – Civic Land and Buildings 3 474 (721) (721) 2 754 3 509 5 379 Other Buildings – – Other Land – – Surplus Assets - (Investment or Inventory) – – Other 608 (200) (200) 408 614 941
Agricultural assets – – – – – – – – – – – – –
List sub-class – –
Biological assets – – – – – – – – – – – – –
List sub-class – –
Intangibles – – – – – – – – – – – Computers - software & programming – – Other (list sub-class) – –
Total Repairs and Maintenance Expenditure to be adjusted1
94 956 – – – – – (7 213) (7 213) 87 743 99 267 130 406
Specialised vehicles 18 – – – – – – – – – – – Refuse – – Fire – – Conservancy – – Ambulances – –
References1. Total Repairs and Maintenance Expenditure by Asset Category must reconcile to total repairs and maintenance expenditure on Table SB12. Airports, Car Parks, Bus Terminals and Taxi Ranks3. For example - technology backbones (e.g. fibre optic, WIFI infrastructure) for economic development purposes4. Work-in-progress/under construction to be budgeted under the respective item5. Infrastructure includes 'land and buildings required' by that infrastructure and vehicles/plant & equipment used by the service generated by that infrastructure6. Donated/contributed & leased assets to be included within the respective sub-class
11. Adjustments to funding allocations from National or Provincial Government
13. G = B + C + D + E + F
15. Buses used to provide a service to the community16. Not municipal contributions to the 'top structure' being built using the housing subsidies17. Statues, art collections, medals etc.18. Ambulances, fire engines, refuse vehicles - but not vehicles that would normally be classified as 'Plant and equipment'. Detail to be entered below
check balance -348 202 182 -121 983 572
Description Ref
Budget Year 2013/14
7. Only complete if a previous adjusted budget has been approved in the same financial year. Reflect most recent adjusted budget.
14. Adjusted Budget H = (A or A1/2 etc) + G
8. Additional cash-backed accumulated funds/unspent funds (section 18(1)(b) and section 28(2)(e) MFMA) identified after Original Budget approved and after annual financial statements audited (note: only where underspending could not reasonably be have for9. Increases of funds approved under section 31 MFMA10. Adjustments approved in accordance with section 29 MFMA
12. Adjusts. = 'Other' Adjustments proposed to be approved; including revenue under-collection (MFMA section 28(2)(a)); additional revenue appropriation on existing programmes (section 28(2))(b); projected savings (section 28(2)(d)); error correction (sec
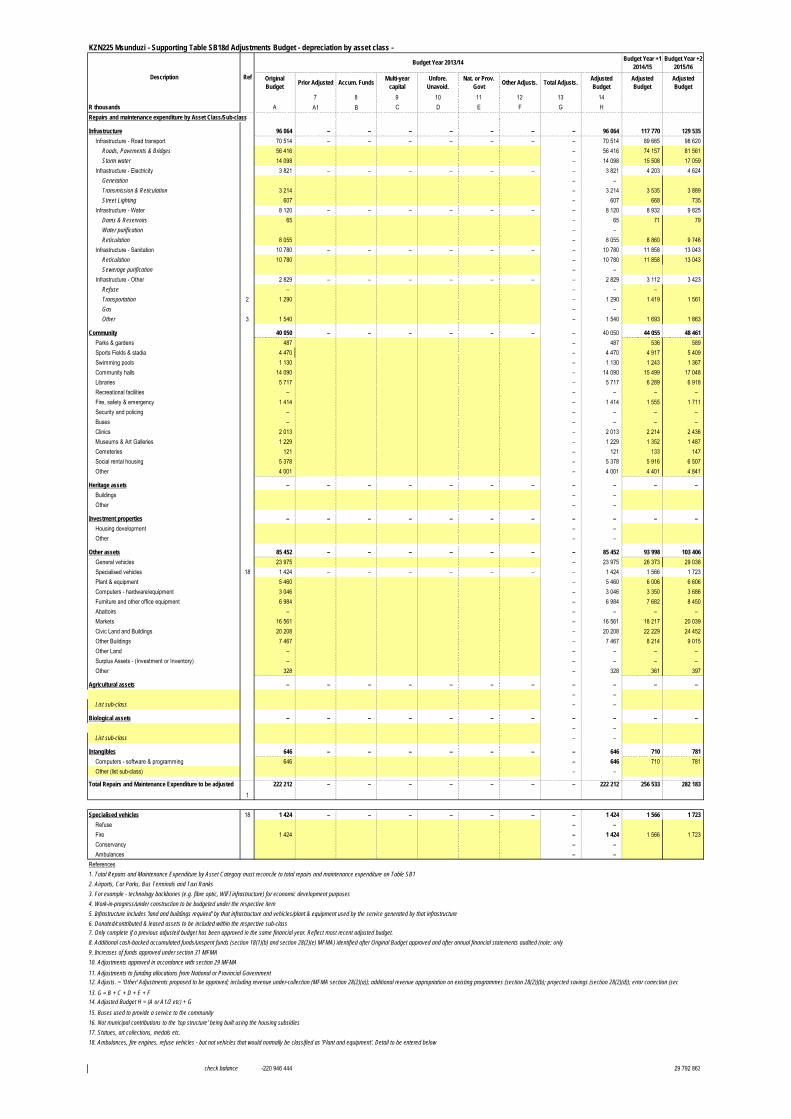
KZN225 Msunduzi - Supporting Table SB18d Adjustments Budget - depreciation by asset class - Budget Year +1
2014/15Budget Year +2
2015/16
Original Budget Prior Adjusted Accum. Funds Multi-year
capitalUnfore.
Unavoid.Nat. or Prov.
Govt Other Adjusts. Total Adjusts. Adjusted Budget
Adjusted Budget
Adjusted Budget
7 8 9 10 11 12 13 14R thousands A A1 B C D E F G HRepairs and maintenance expenditure by Asset Class/Sub-class
Infrastructure 96 064 – – – – – – – 96 064 117 770 129 535 Infrastructure - Road transport 70 514 – – – – – – – 70 514 89 665 98 620
Roads, Pavements & Bridges 56 416 – 56 416 74 157 81 561 Storm water 14 098 – 14 098 15 508 17 059
Infrastructure - Electricity 3 821 – – – – – – – 3 821 4 203 4 624 Generation – – Transmission & Reticulation 3 214 – 3 214 3 535 3 889 Street Lighting 607 – 607 668 735
Infrastructure - Water 8 120 – – – – – – – 8 120 8 932 9 825 Dams & Reservoirs 65 – 65 71 79 Water purification – – Reticulation 8 055 – 8 055 8 860 9 746
Infrastructure - Sanitation 10 780 – – – – – – – 10 780 11 858 13 043 Reticulation 10 780 – 10 780 11 858 13 043 Sewerage purification – –
Infrastructure - Other 2 829 – – – – – – – 2 829 3 112 3 423 Refuse – – – – Transportation 2 1 290 – 1 290 1 419 1 561 Gas – – Other 3 1 540 – 1 540 1 693 1 863 – –
Community 40 050 – – – – – – – 40 050 44 055 48 461 Parks & gardens 487 – 487 536 589 Sports Fields & stadia 4 470 – 4 470 4 917 5 409 Swimming pools 1 130 – 1 130 1 243 1 367 Community halls 14 090 – 14 090 15 499 17 048 Libraries 5 717 – 5 717 6 289 6 918 Recreational facilities – – – – – Fire, safety & emergency 1 414 – 1 414 1 555 1 711 Security and policing – – – – – Buses – – – – – Clinics 2 013 – 2 013 2 214 2 436 Museums & Art Galleries 1 229 – 1 229 1 352 1 487 Cemeteries 121 – 121 133 147 Social rental housing 5 378 – 5 378 5 916 6 507 Other 4 001 – 4 001 4 401 4 841
Heritage assets – – – – – – – – – – – Buildings – – Other – –
Investment properties – – – – – – – – – – – Housing development – – Other – –
Other assets 85 452 – – – – – – – 85 452 93 998 103 406 General vehicles 23 975 – 23 975 26 373 29 038 Specialised vehicles 18 1 424 – – – – – – – 1 424 1 566 1 723 Plant & equipment 5 460 – 5 460 6 006 6 606 Computers - hardware/equipment 3 046 – 3 046 3 350 3 686 Furniture and other office equipment 6 984 – 6 984 7 682 8 450 Abattoirs – – – – – Markets 16 561 – 16 561 18 217 20 039 Civic Land and Buildings 20 208 – 20 208 22 229 24 452 Other Buildings 7 467 – 7 467 8 214 9 015 Other Land – – – – – Surplus Assets - (Investment or Inventory) – – – – – Other 328 – 328 361 397
Agricultural assets – – – – – – – – – – – – –
List sub-class – –
Biological assets – – – – – – – – – – – – –
List sub-class – –
Intangibles 646 – – – – – – – 646 710 781 Computers - software & programming 646 – 646 710 781 Other (list sub-class) – –
Total Repairs and Maintenance Expenditure to be adjusted1
222 212 – – – – – – – 222 212 256 533 282 183
Specialised vehicles 18 1 424 – – – – – – – 1 424 1 566 1 723 Refuse – – Fire 1 424 – 1 424 1 566 1 723 Conservancy – – Ambulances – –
References1. Total Repairs and Maintenance Expenditure by Asset Category must reconcile to total repairs and maintenance expenditure on Table SB12. Airports, Car Parks, Bus Terminals and Taxi Ranks3. For example - technology backbones (e.g. fibre optic, WIFI infrastructure) for economic development purposes4. Work-in-progress/under construction to be budgeted under the respective item5. Infrastructure includes 'land and buildings required' by that infrastructure and vehicles/plant & equipment used by the service generated by that infrastructure6. Donated/contributed & leased assets to be included within the respective sub-class
11. Adjustments to funding allocations from National or Provincial Government
13. G = B + C + D + E + F
15. Buses used to provide a service to the community16. Not municipal contributions to the 'top structure' being built using the housing subsidies17. Statues, art collections, medals etc.18. Ambulances, fire engines, refuse vehicles - but not vehicles that would normally be classified as 'Plant and equipment'. Detail to be entered below
check balance -220 946 444 29 792 863
10. Adjustments approved in accordance with section 29 MFMA
12. Adjusts. = 'Other' Adjustments proposed to be approved; including revenue under-collection (MFMA section 28(2)(a)); additional revenue appropriation on existing programmes (section 28(2))(b); projected savings (section 28(2)(d)); error correction (sec
14. Adjusted Budget H = (A or A1/2 etc) + G
Description Ref
Budget Year 2013/14
7. Only complete if a previous adjusted budget has been approved in the same financial year. Reflect most recent adjusted budget.8. Additional cash-backed accumulated funds/unspent funds (section 18(1)(b) and section 28(2)(e) MFMA) identified after Original Budget approved and after annual financial statements audited (note: only where underspending could not reasonably be have for9. Increases of funds approved under section 31 MFMA
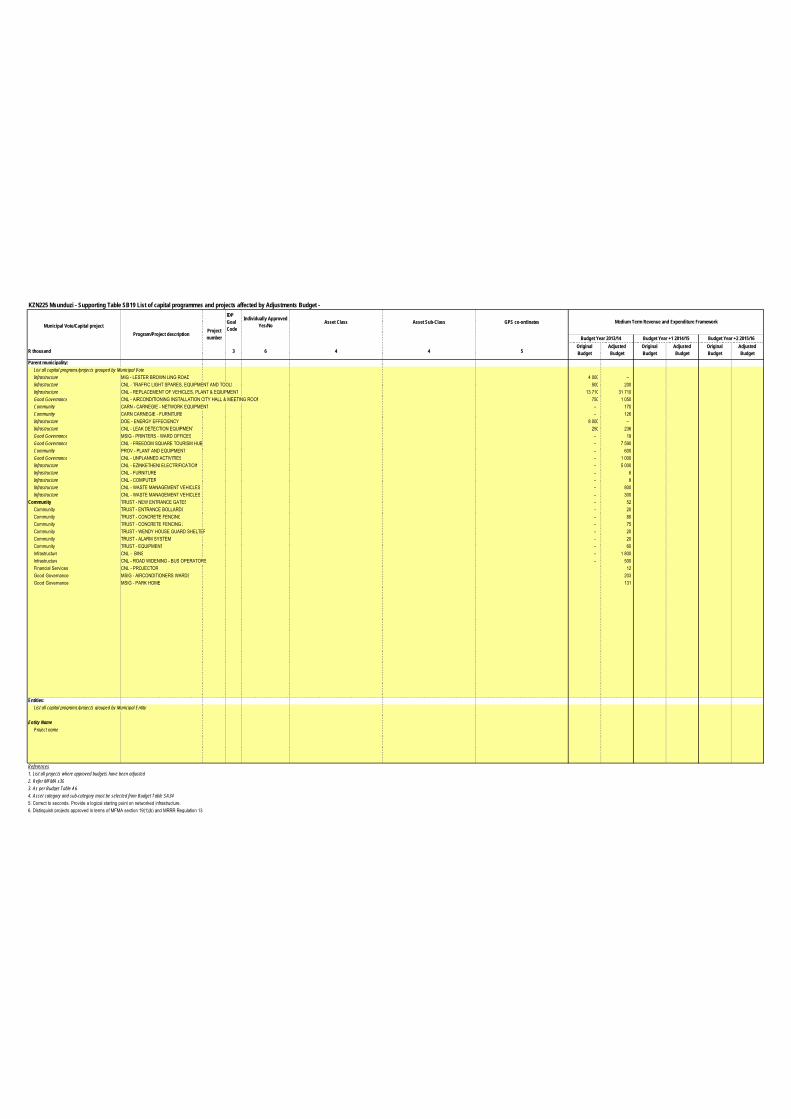
KZN225 Msunduzi - Supporting Table SB19 List of capital programmes and projects affected by Adjustments Budget - IDP Goal Code
Individually ApprovedYes/No Asset Class Asset Sub-Class GPS co-ordinates
R thousand 3 6 4 4 5Original Budget
Adjusted Budget
Original Budget
Adjusted Budget
Original Budget
Adjusted Budget
Parent municipality:List all capital programs/projects grouped by Municipal VoteInfrastructure MIG - LESTER BROWN LING ROAD 4 000 – Infrastructure CNL - TRAFFIC LIGHT SPARES, EQUIPMENT AND TOOLS 500 200 Infrastructure CNL - REPLACEMENT OF VEHICLES, PLANT & EQIUPMENT 13 710 31 710 Good Governance CNL - AIRCONDITIONING INSTALLATION CITY HALL & MEETING ROOM 750 1 050 Community CARN - CARNEGIE - NETWORK EQUIPMENT – 170 Community CARN CARNEGIE - FURNITURE – 126 Infrastructure DOE - ENERGY EFFECIENCY 8 000 – Infrastructure CNL - LEAK DETECTION EQUIPMENT 250 236 Good Governance MSIG - PRINTERS - WARD OFFICES – 19 Good Governance CNL - FREEDOM SQUARE TOURISM HUB – 7 590 Community PROV - PLANT AND EQUIPMENT – 600 Good Governance CNL - UNPLANNED ACTIVITIES – 1 000 Infrastructure CNL - EZINKETHENI ELECTRIFICATIOIN – 5 000 Infrastructure CNL - FURNITURE – 6 Infrastructure CNL - COMPUTER – 8 Infrastructure CNL - WASTE MANAGEMENT VEHICLES – 800 Infrastructure CNL - WASTE MANAGEMENT VEHICLES – 300
Community TRUST - NEW ENTRANCE GATES – 52 Community TRUST - ENTRANCE BOLLARDS – 20 Community TRUST - CONCRETE FENCING – 80 Community TRUST - CONCRETE FENCING 2 – 75 Community TRUST - WENDY HOUSE GUARD SHELTER – 20 Community TRUST - ALARM SYSTEM – 20 Community TRUST - EQUIPMENT – 60 Infrastructure CNL - BINS – 1 800 Infrastructure CNL - ROAD WIDENING - BUS OPERATORS – 500 Financial Services CNL - PROJECTOR 12 Good Governance MSIG - AIRCONDITIONERS WARDS 203 Good Governance MSIG - PARK HOME 131
Entities:List all capital programs/projects grouped by Municipal Entity
Entity NameProject name
References1. List all projects where approved budgets have been adjusted2. Refer MFMA s303. As per Budget Table A64. Asset category and sub-category must be selected from Budget Table SA345. Correct to seconds. Provide a logical starting point on networked infrastructure.6. Distinguish projects approved in terms of MFMA section 19(1)(b) and MRRR Regulation 13
Medium Term Revenue and Expenditure Framework
Budget Year 2013/14 Budget Year +1 2014/15 Budget Year +2 2015/16
Municipal Vote/Capital projectProgram/Project description Project
number
Budget Year +1 2014/15
Budget Year +2 2015/16
Original Budget
Prior Adjusted
Accum. Funds
Multi-year capital
Unfore. Unavoid.
Nat. or Prov. Govt
Other Adjusts.
Total Adjusts.
Adjusted Budget
Adjusted Budget
Adjusted Budget
3 4 5 6 8 9 10 11R thousands A A1 B C D E F G HRevenue By Municipal Entity
Entity 1 total revenue – – Entity 2 total revenue – – Entity 3 (etc) total revenue – –
– – – – – – – – – – – – – –
Total Operating Revenue 1 – – – – – – – – – – –
Expenditure By Municipal EntityEntity 1 total operating expenditure – – Entity 2 total operating expenditure – – Entity 3 etc. total operating expenditure – –
– – – – – – – – – – – – – –
Total Operating Expenditure 2 – – – – – – – – – – –
Capital Expenditure By Municipal EntityEntity 1 total capital expenditure – – Entity 2 total capital expenditure – – Entity 3 etc. total capital expenditure – –
– – – – – – – – – – – – – –
Total Capital Expenditure 2 – – – – – – – – – – – References1. Must reconcile to the sum of all municipal entity monthly revenue reports2. Must reconcile to the sum of all municipal entity monthly expenditure reports
7. Adjustments made under delegation by the AO since the budget was approved or since a previously 'approved' Adjustments Budget in the same financial year8. Adjustments to funding allocations by National or Provincial Government
10. H = B + C + D + E + F + G11. Adjusted Budget (I) = (A or A1/2 etc) + H
KZN225 Msunduzi - Supporting Table SB20 Not required -
Description Ref
Budget Year 2013/14
9. Adjusts. = 'Other' Adjustments approved by entity Board; including revenue under-collection ; additional revenue appropriation on existing programmes; projected savings; error correction
5. Increases of funds approved under section 87 MFMA6. Adjustments approved in accordance with section 87 MFMA
3. Only complete if a previous adjusted budget has been approved in the same financial year. Reflect most recent adjusted budget.4. Additional cash-backed accumulated funds/unspent funds identified after Original Budget approved and after annual financial statements audited (note: only where underspending could not reasonably be have foreseen)