Influence of mid-latitude cyclones on European background ...
date post
20-Dec-2015Category
view
218download
0
Mid-latitude Cyclones and Mid-latitude Cyclones and Weather ForecastingWeather Forecasting
AT351AT351
Lab 9Lab 9
March 26, 2008March 26, 2008
Mid-latitude (Mid-latitude (ExtratropicalExtratropical) Cyclone) Cyclone
A A cyclonecyclone (area of low pressure) in the middle (area of low pressure) in the middle (35°-70°) latitudes(35°-70°) latitudes
Important for global heat transportImportant for global heat transport Help to redistribute energy between the tropics Help to redistribute energy between the tropics
((equatorequator) and the poles) and the poles Often associated with significant weather eventsOften associated with significant weather events Described by the Described by the Polar Front TheoryPolar Front Theory
Form on boundaries between warm and cold airForm on boundaries between warm and cold air Polar front is the boundary between polar cell and Polar front is the boundary between polar cell and
Ferrel cell Ferrel cell Cold Polar air meeting warm tropical airCold Polar air meeting warm tropical air
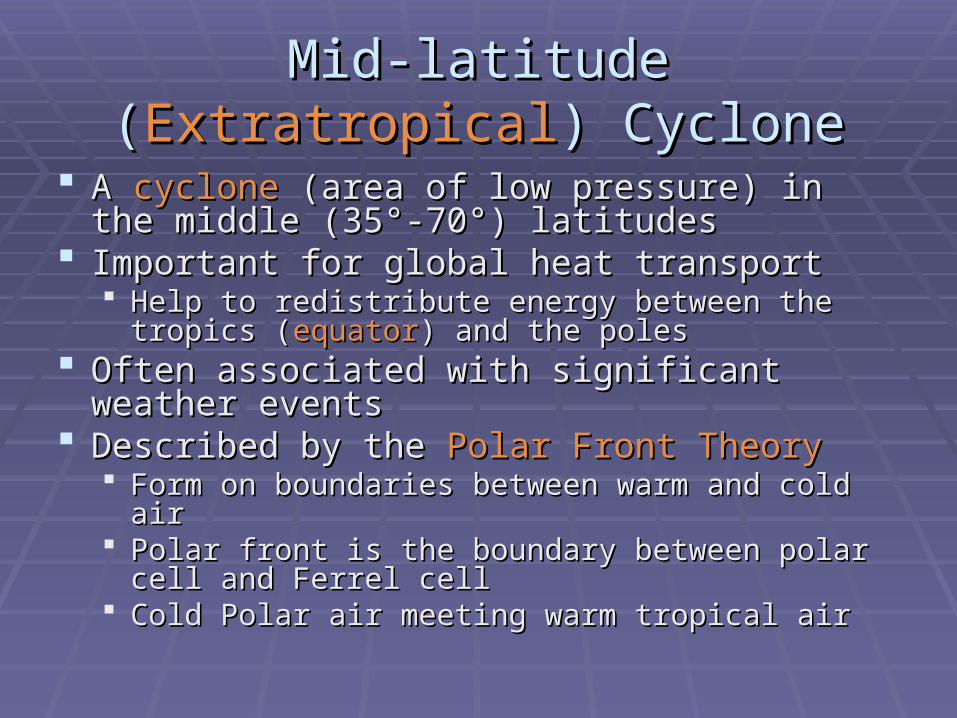
Features of a Mid-latitude CycloneFeatures of a Mid-latitude Cyclone
Deep low pressure area with attached cold and warm Deep low pressure area with attached cold and warm frontsfronts
Often an Often an occlusionocclusion forms, the forms, the triple pointtriple point lending to the lending to the formation of severe weatherformation of severe weather
Precipitation associated with the cold and warm fronts Precipitation associated with the cold and warm fronts organizes in typical “comma cloud” structureorganizes in typical “comma cloud” structure
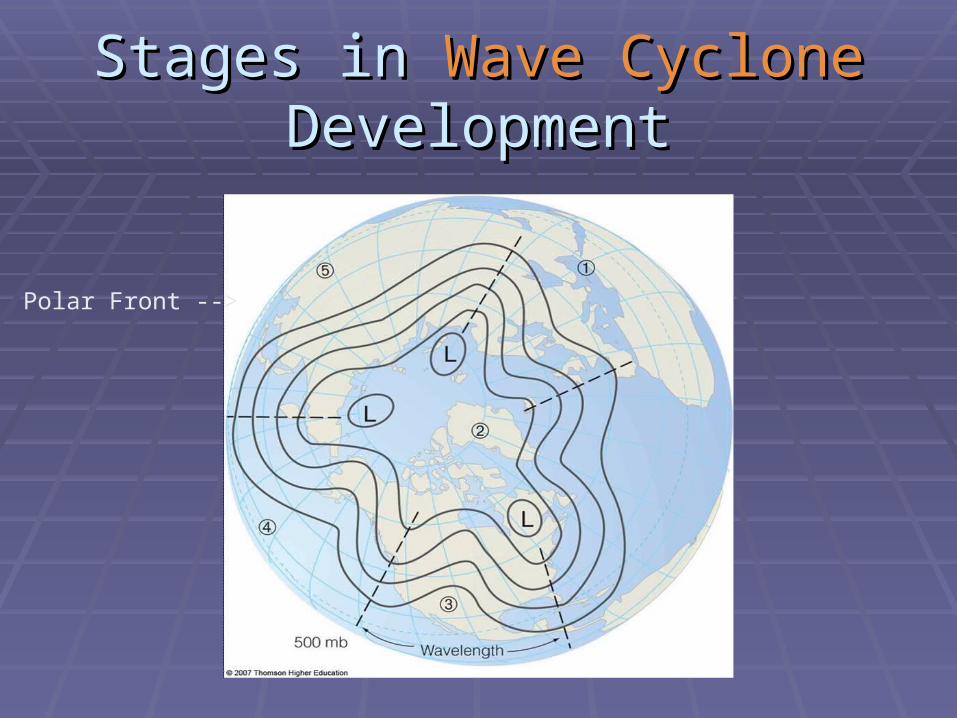
Stages in Stages in Wave CycloneWave Cyclone DevelopmentDevelopment
Polar Front -->
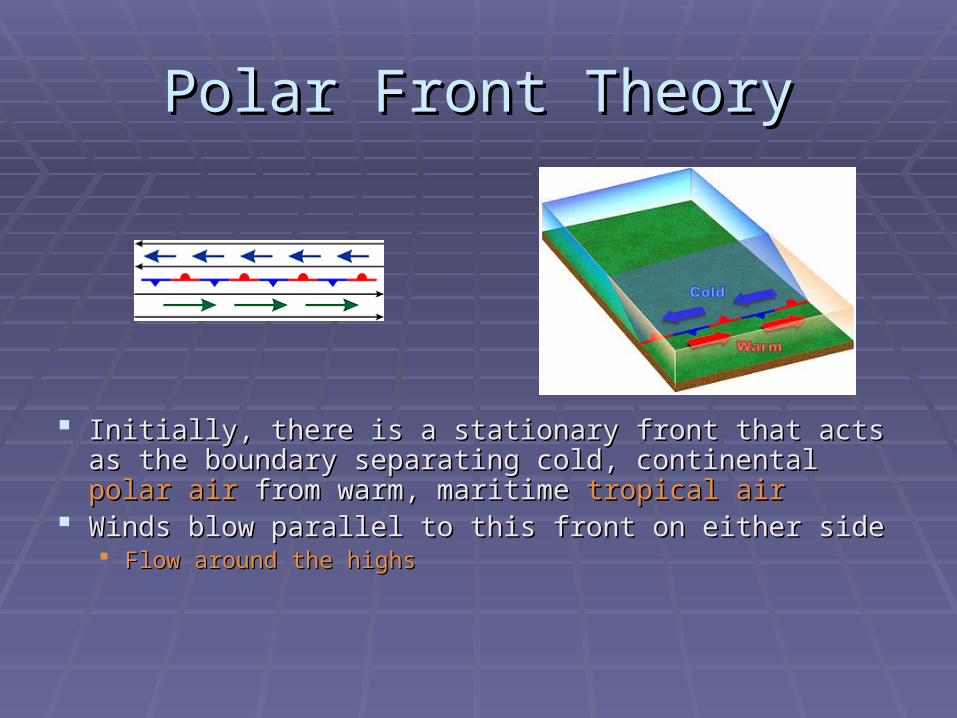
Polar Front TheoryPolar Front Theory
Initially, there is a stationary front that acts as the Initially, there is a stationary front that acts as the boundary separating cold, continental boundary separating cold, continental polar airpolar air from from warm, maritime warm, maritime tropical airtropical air
Winds blow parallel to this front on either sideWinds blow parallel to this front on either side Flow around the highsFlow around the highs
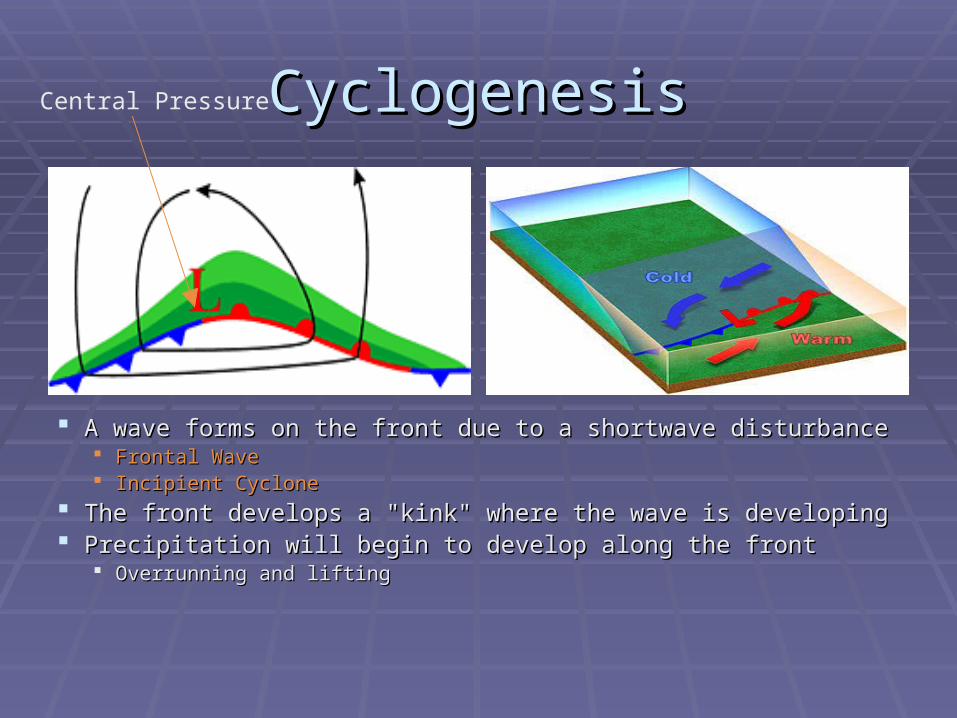
CyclogenesisCyclogenesis
A wave forms on the front due to a shortwave disturbance A wave forms on the front due to a shortwave disturbance Frontal WaveFrontal Wave Incipient CycloneIncipient Cyclone
The front develops a "kink" where the wave is developing The front develops a "kink" where the wave is developing Precipitation will begin to develop along the frontPrecipitation will begin to develop along the front
Overrunning and liftingOverrunning and lifting
Central Pressure

StrengtheningStrengthening
The cyclonic circulation around the low becomes more definedThe cyclonic circulation around the low becomes more defined The The central pressurecentral pressure intensifies intensifies The cold front and warm front have more organized motionThe cold front and warm front have more organized motion Cyclone usually pushed east or northeast by the winds aloft Cyclone usually pushed east or northeast by the winds aloft
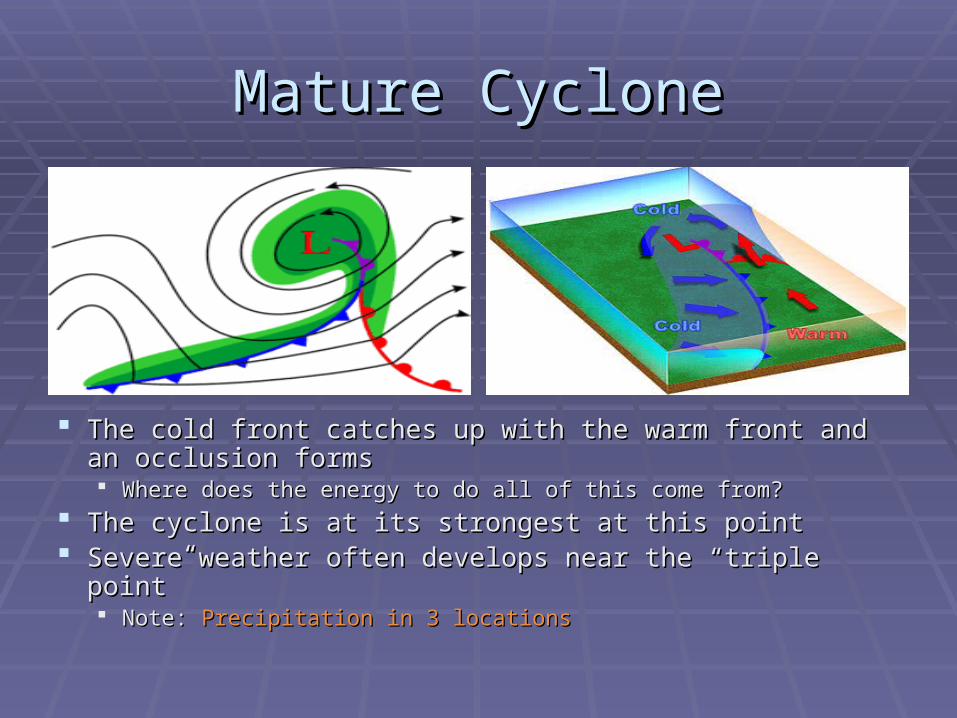
Mature CycloneMature Cyclone
The cold front catches up with the warm front and an The cold front catches up with the warm front and an occlusion formsocclusion forms Where does the energy to do all of this come from?Where does the energy to do all of this come from?
The cyclone is at its strongest at this pointThe cyclone is at its strongest at this point Severe weather often develops near the “triple point”Severe weather often develops near the “triple point”
Note: Note: Precipitation in 3 locationsPrecipitation in 3 locations
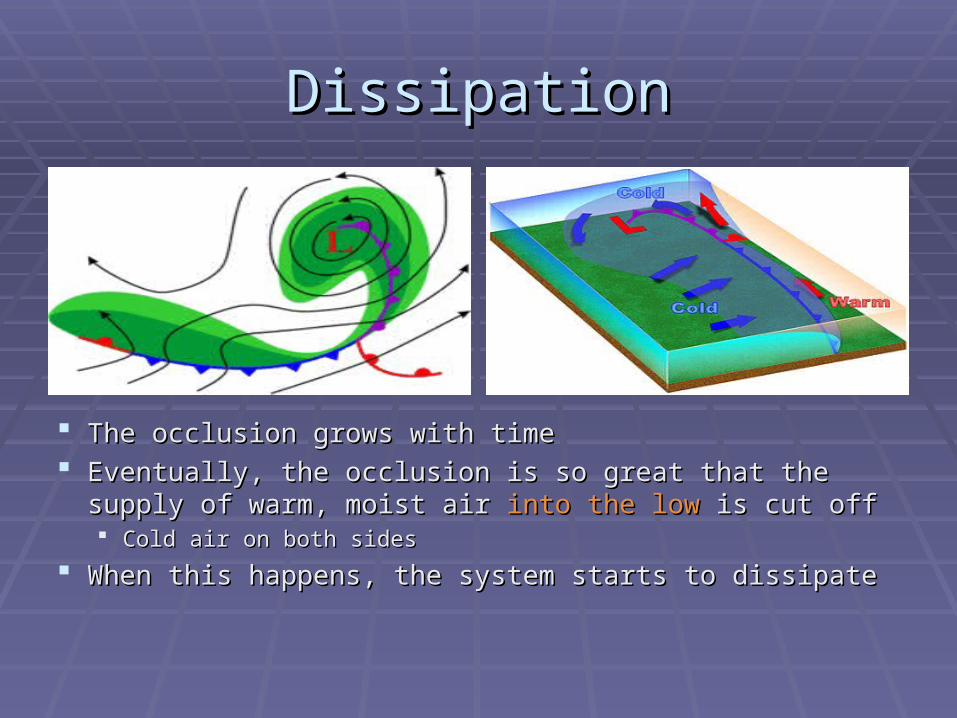
DissipationDissipation
The occlusion grows with timeThe occlusion grows with time Eventually, the occlusion is so great that the supply of Eventually, the occlusion is so great that the supply of
warm, moist air warm, moist air into the lowinto the low is cut off is cut off Cold air on both sidesCold air on both sides
When this happens, the system starts to dissipateWhen this happens, the system starts to dissipate
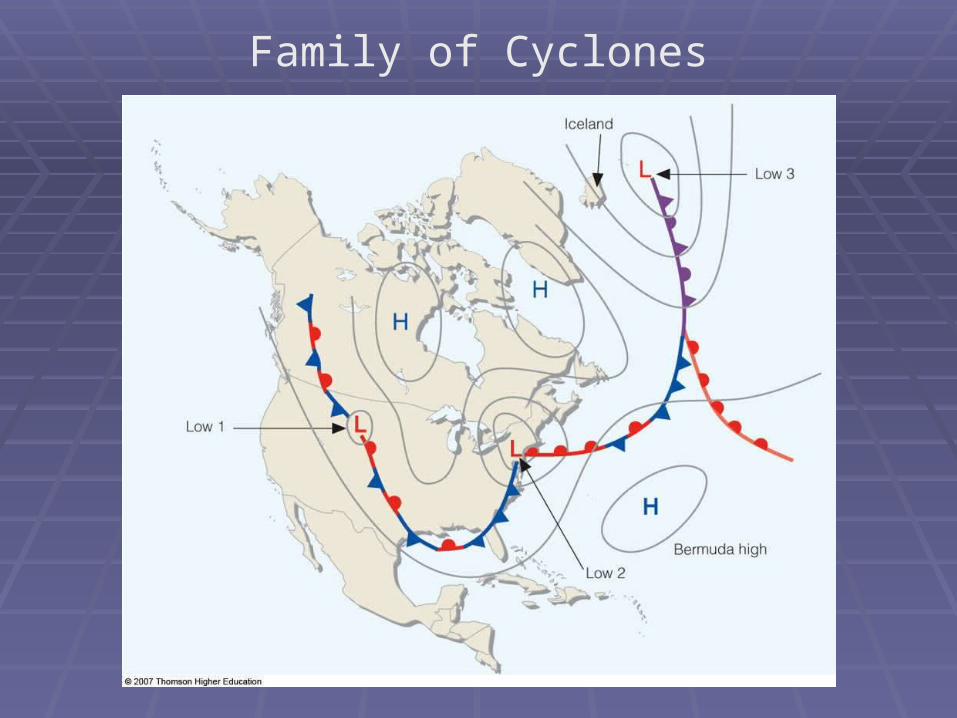
Family of Cyclones

StrengtheningStrengthening
A low pressure area’s strength is defined A low pressure area’s strength is defined by how low the pressure isby how low the pressure is
Hence, all a low needs to strengthen is for Hence, all a low needs to strengthen is for its pressure to drop in the centerits pressure to drop in the center
How might that happen?How might that happen?
Strengthening LowStrengthening Low
We know that for the pressure to drop, air We know that for the pressure to drop, air must leave the columnmust leave the column
It isn’t leaving at the surface, because the It isn’t leaving at the surface, because the wind is spiraling inwardwind is spiraling inward
Therefore, it must leave at the upper levelsTherefore, it must leave at the upper levels Rising motion will cause thisRising motion will cause this

What is this showing?
What do the dashed lines represent?

Long Waves vs Short WavesLong Waves vs Short Waves Uneven heating causes troughs and ridges to form Uneven heating causes troughs and ridges to form
around the globearound the globe An almost constant ring of trough/ridge patterns exist, An almost constant ring of trough/ridge patterns exist,
called called longwaveslongwaves The Polar VortexThe Polar Vortex
Waves usually move west-east, but can sometimes Waves usually move west-east, but can sometimes appear to move westwardappear to move westward Called retrograde motionCalled retrograde motion
Within these longwaves, disturbances exist called Within these longwaves, disturbances exist called shortwavesshortwaves Shortwaves deepen in longwave troughsShortwaves deepen in longwave troughs Shortwaves weaken in longwave ridgesShortwaves weaken in longwave ridges Shortwaves move faster (generally)Shortwaves move faster (generally)

Long WavesLong Waves
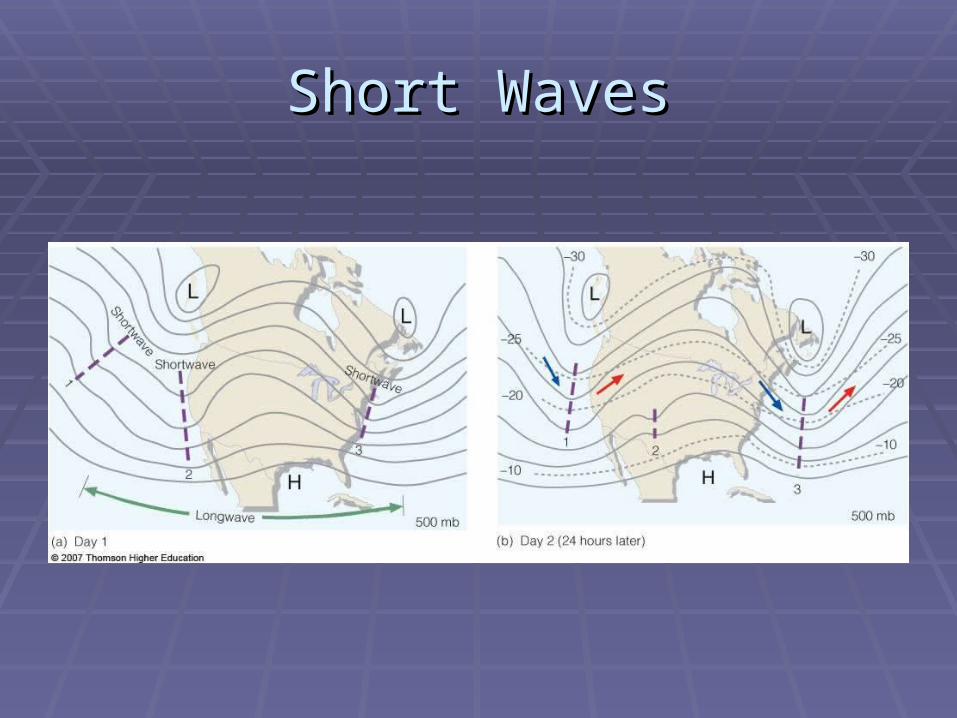
Short WavesShort Waves
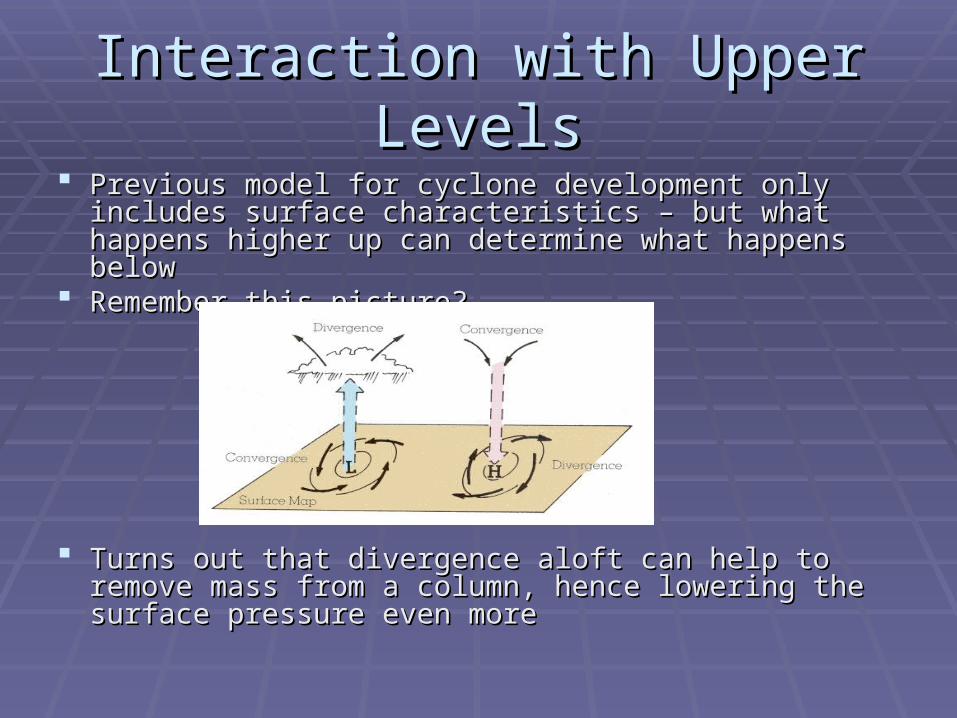
Interaction with Upper LevelsInteraction with Upper Levels Previous model for cyclone development only includes Previous model for cyclone development only includes
surface characteristics – but what happens higher up surface characteristics – but what happens higher up can determine what happens belowcan determine what happens below
Remember this picture?Remember this picture?
Turns out that divergence aloft can help to remove mass Turns out that divergence aloft can help to remove mass from a column, hence lowering the surface pressure from a column, hence lowering the surface pressure even moreeven more
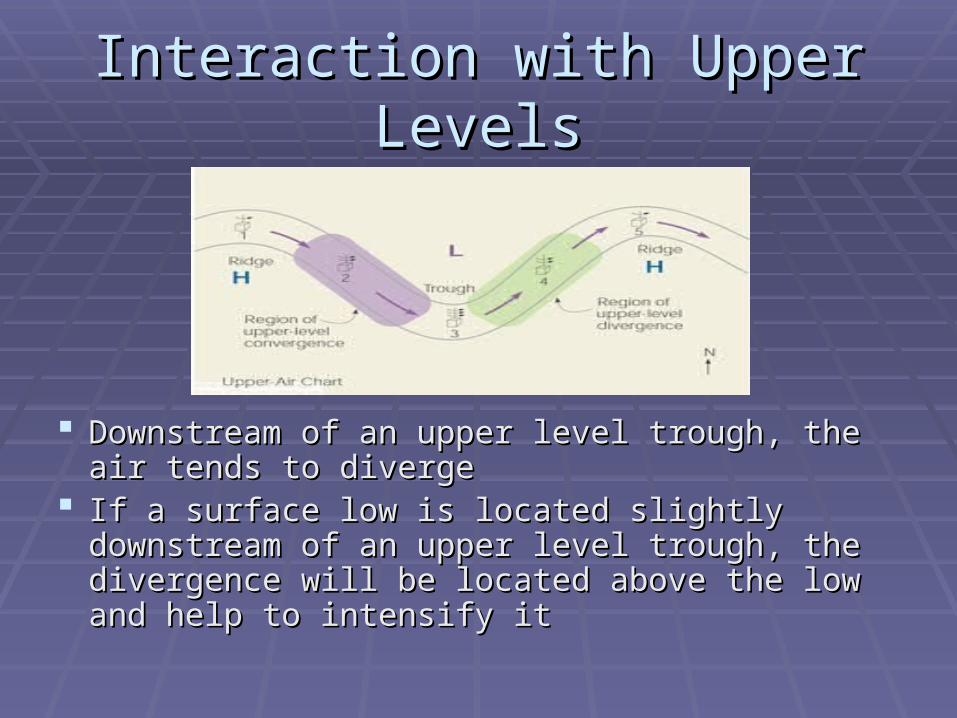
Interaction with Upper LevelsInteraction with Upper Levels
Downstream of an upper level trough, the air Downstream of an upper level trough, the air tends to divergetends to diverge
If a surface low is located slightly downstream of If a surface low is located slightly downstream of an upper level trough, the divergence will be an upper level trough, the divergence will be located above the low and help to intensify itlocated above the low and help to intensify it

Mid-latitude Cyclones : Mid-latitude Cyclones : The Upper LevelThe Upper Level
A 500 mb trough moves into place directly above a A 500 mb trough moves into place directly above a surface stationary frontsurface stationary front
If a shortwave trough moves into the main flow, the If a shortwave trough moves into the main flow, the flow pattern is disturbedflow pattern is disturbed
As the 500 mb trough deepens, the associated upper As the 500 mb trough deepens, the associated upper level divergence strengthens, helping to intensify the level divergence strengthens, helping to intensify the surface lowsurface low
Stronger winds aloft force the upper level trough to move Stronger winds aloft force the upper level trough to move eastward faster, and eventually it becomes located eastward faster, and eventually it becomes located above the surface lowabove the surface low
When the surface and upper level low are “stacked”, When the surface and upper level low are “stacked”, convergence at both levels starts to “fill” the low pressure convergence at both levels starts to “fill” the low pressure area, weakening the cyclonearea, weakening the cyclone


Another Example – Jet StreaksAnother Example – Jet Streaks
A jet streak is an area within a jet stream that A jet streak is an area within a jet stream that has the highest wind speedshas the highest wind speeds
Typically jet streaks are thought of as made up Typically jet streaks are thought of as made up of four quadrants – separated by left and right, of four quadrants – separated by left and right, entrance and exitentrance and exit
The right entrance region and the left exit region The right entrance region and the left exit region both contain divergence (aloft) and so they both contain divergence (aloft) and so they promote the development of surface low promote the development of surface low pressure systemspressure systems Due to shifts in the Coriolis Force brought about by Due to shifts in the Coriolis Force brought about by
acceleration of the windacceleration of the wind


Weather Forecasting - QualitativeWeather Forecasting - Qualitative
Most information for a qualitative forecast can be seen Most information for a qualitative forecast can be seen on a simple weather mapon a simple weather map
If you see a low pressure area that has been moving If you see a low pressure area that has been moving eastward towards Colorado, what type of weather might eastward towards Colorado, what type of weather might you expect?you expect?
If a cold front is moving southward through Wyoming, If a cold front is moving southward through Wyoming, what would you expect the temperature to do?what would you expect the temperature to do?
If it’s going to be cloudy tomorrow, will it be warmer or If it’s going to be cloudy tomorrow, will it be warmer or colder than it was today?colder than it was today?
Often the best forecast is persistence: if it’s warm and Often the best forecast is persistence: if it’s warm and sunny today, and it was warm and sunny yesterday, the sunny today, and it was warm and sunny yesterday, the odds are pretty good that it will be warm and sunny odds are pretty good that it will be warm and sunny tomorrow (unless you know something else)tomorrow (unless you know something else)

Weather Forecasting - QuantitativeWeather Forecasting - Quantitative
In order to predict specific quantities in a In order to predict specific quantities in a forecast (temperature, humidity, rainfall) we rely forecast (temperature, humidity, rainfall) we rely on computer modelson computer models
Numerical weather prediction (NWP) uses a Numerical weather prediction (NWP) uses a system of equations that describes the behavior system of equations that describes the behavior of the atmosphereof the atmosphere
NWP model uses the current state of the NWP model uses the current state of the atmosphere as its initial condition and steps atmosphere as its initial condition and steps through a small time step, recalculating every through a small time step, recalculating every number for each step until the forecast time is number for each step until the forecast time is reachedreached
InitializationInitialization
A computer model has a set of equations in it A computer model has a set of equations in it that dictate what will happen based on what we that dictate what will happen based on what we already knowalready know
Takes the actual initial conditions and applies Takes the actual initial conditions and applies the equations to create a picture of the weather the equations to create a picture of the weather 5 minutes from now5 minutes from now
Calls that prediction the “new data” and runs Calls that prediction the “new data” and runs another 5 minutesanother 5 minutes
Repeats until you get the desired forecast (12 Repeats until you get the desired forecast (12 hours, 24 hours, etc)hours, 24 hours, etc)

MOSMOS
The output from a model can be shown in the The output from a model can be shown in the form of Model Output Statistics (MOS)form of Model Output Statistics (MOS)
MOS is a summary of the predicted condition of MOS is a summary of the predicted condition of the atmosphere at each forecast timethe atmosphere at each forecast time
MOS is often called “model guidance”, because MOS is often called “model guidance”, because forecasters will use the generated numbers as a forecasters will use the generated numbers as a guide to make their forecastguide to make their forecast
MOS isn’t perfect though, and forecasting takes MOS isn’t perfect though, and forecasting takes some intuitionsome intuition

What models produce output for What models produce output for use in MOS? use in MOS?
See UCAR website.See UCAR website.
The Eta Model: runs forward 84 hoursThe Eta Model: runs forward 84 hours The GFS (Global Forecasting System) model runs The GFS (Global Forecasting System) model runs
forward for 10 days.forward for 10 days. Combines the old “Aviation” and “Medium-Range Forecast” Combines the old “Aviation” and “Medium-Range Forecast”
(MRF) models(MRF) models
The NGM (Nested Grid Model): an older model that is The NGM (Nested Grid Model): an older model that is largely replaced by the Eta although it has a high quality largely replaced by the Eta although it has a high quality climatological dataset for use in MOS.climatological dataset for use in MOS.

The premise behind MOSThe premise behind MOS
The (preceding) models produce output describing the The (preceding) models produce output describing the weather over No. America and vicinity at grid points or in weather over No. America and vicinity at grid points or in “wave space”.“wave space”.
Conditions for this time of year at a specific city may Conditions for this time of year at a specific city may have occurred similarly in the historic past (i.e., old have occurred similarly in the historic past (i.e., old climate data are used).climate data are used).
Forecasts of current conditions can be made for a city Forecasts of current conditions can be made for a city using the current model output and based on the historic using the current model output and based on the historic weather outcomes.weather outcomes.

Downfalls of MOSDownfalls of MOS
There isn’t just one model that is used for NWPThere isn’t just one model that is used for NWP Multiple models are used that have differences Multiple models are used that have differences
in resolution and in the equations used and in resolution and in the equations used and assumptions madeassumptions made
The models The models nevernever agree on everything agree on everything A good forecaster will look at multiple model A good forecaster will look at multiple model
predictions and have a feel for which model predictions and have a feel for which model performs the best under certain circumstancesperforms the best under certain circumstances

So why aren’t forecasts always right?So why aren’t forecasts always right?
Observations aren’t good enough!Observations aren’t good enough! A model is only as good as its initial conditionsA model is only as good as its initial conditions Even having an observation for every square meter of the planet would leave out Even having an observation for every square meter of the planet would leave out
smaller details…and we don’t have even close to that many observationssmaller details…and we don’t have even close to that many observations Computers aren’t fast enough!Computers aren’t fast enough!
In order to truly create a perfect forecast, one would have to use the exact In order to truly create a perfect forecast, one would have to use the exact equations on a really, really small spatial scaleequations on a really, really small spatial scale
In order to create a model that will create a 12 hour forecast in less than 12 In order to create a model that will create a 12 hour forecast in less than 12 hours, we must approximate certain parts of equations and run the model on a hours, we must approximate certain parts of equations and run the model on a grid with spacing of multiple kilometersgrid with spacing of multiple kilometers ~1.2 million grid points x thousands of calculations > 1 Billion calculations per time step~1.2 million grid points x thousands of calculations > 1 Billion calculations per time step More than 1 Quadrillion calculations per time step at 1 meter resolution (10More than 1 Quadrillion calculations per time step at 1 meter resolution (101212)) More than 4 Quadrillion calculations to simulate 12 hoursMore than 4 Quadrillion calculations to simulate 12 hours
Forces us to make approximations to the equations that govern the atmosphereForces us to make approximations to the equations that govern the atmosphere Little bit of error added at each time stepLittle bit of error added at each time step
Chaos reigns supreme!Chaos reigns supreme! Ever heard of the butterfly effect? It’s more than just a movieEver heard of the butterfly effect? It’s more than just a movie

Chaos TheoryChaos Theory
Also known as the “Butterfly Effect”, coined by Dr. Also known as the “Butterfly Effect”, coined by Dr. Edward Lorenz in the 60’s (he’s still teaching at MIT)Edward Lorenz in the 60’s (he’s still teaching at MIT)
Basically says that even the most insignificant change to Basically says that even the most insignificant change to initial conditions will magnify into drastic changesinitial conditions will magnify into drastic changes The smallest disturbance will eventually grow into a large difference – The smallest disturbance will eventually grow into a large difference –
this limits the range of forecasts to just a few daysthis limits the range of forecasts to just a few days Even if the initial conditions and computing power were Even if the initial conditions and computing power were
perfectperfect, chaos theory would limit us to a reasonable , chaos theory would limit us to a reasonable range of about 2 weeksrange of about 2 weeks
Computers cannot possibly predict the movement of a Computers cannot possibly predict the movement of a butterfly, or how hard you step on the gas pedalbutterfly, or how hard you step on the gas pedal
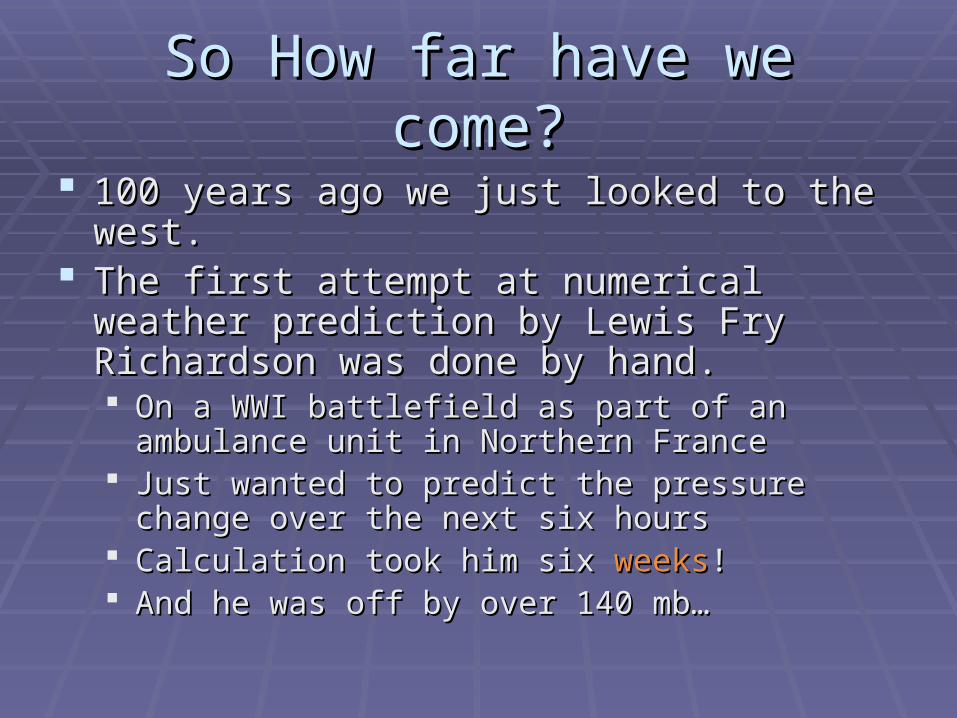
So How far have we come?So How far have we come?
100 years ago we just looked to the west.100 years ago we just looked to the west. The first attempt at numerical weather prediction The first attempt at numerical weather prediction
by Lewis Fry Richardson was done by hand.by Lewis Fry Richardson was done by hand. On a WWI battlefield as part of an ambulance unit in On a WWI battlefield as part of an ambulance unit in
Northern FranceNorthern France Just wanted to predict the pressure change over the Just wanted to predict the pressure change over the
next six hoursnext six hours Calculation took him six Calculation took him six weeksweeks!! And he was off by over 140 mb…And he was off by over 140 mb…

Richardson’s Forecast FactoryRichardson’s Forecast Factory

How far have we come?How far have we come?
In 1937, the US started using weather balloons.In 1937, the US started using weather balloons. It wasn’t until WWII that the existence of a jet stream was It wasn’t until WWII that the existence of a jet stream was
confirmed.confirmed. In 1948, ENIAC was put together by John von Neumann in a In 1948, ENIAC was put together by John von Neumann in a
30 by 50 room.30 by 50 room. In April 1950, the first 24-hr forecast was attempted.In April 1950, the first 24-hr forecast was attempted.
Took more than 24 hours due to breakdownsTook more than 24 hours due to breakdowns
8 years later, forecasts began to show signs of skill.8 years later, forecasts began to show signs of skill. As it stands today, we can have a great deal of faith in a As it stands today, we can have a great deal of faith in a
weather forecast out to about 3 days.weather forecast out to about 3 days. Just 30 years ago, we could only do 2 days Just 30 years ago, we could only do 2 days
Beyond that, the accuracy drops dramaticallyBeyond that, the accuracy drops dramatically If you see a 15 day forecast…don’t believe itIf you see a 15 day forecast…don’t believe it

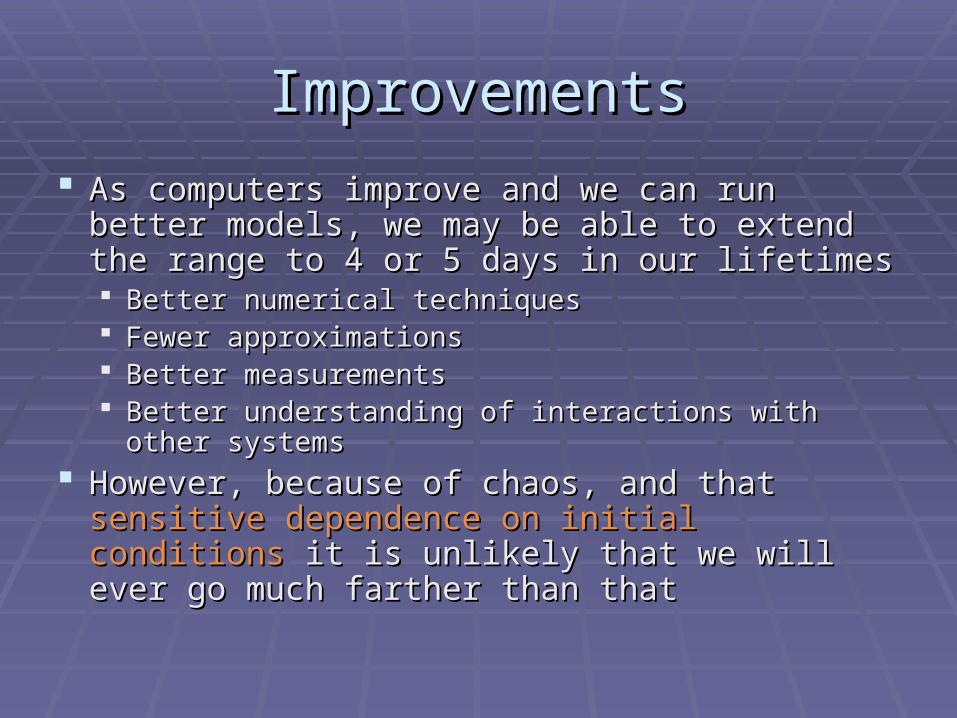
ImprovementsImprovements
As computers improve and we can run better As computers improve and we can run better models, we may be able to extend the range to 4 models, we may be able to extend the range to 4 or 5 days in our lifetimesor 5 days in our lifetimes Better numerical techniquesBetter numerical techniques Fewer approximationsFewer approximations Better measurementsBetter measurements Better understanding of interactions with other Better understanding of interactions with other
systemssystems However, because of chaos, and that However, because of chaos, and that sensitive sensitive
dependence on initial conditionsdependence on initial conditions it is unlikely that it is unlikely that we will ever go much farther than thatwe will ever go much farther than that

Station Name – Artesia, NM Date and Time the Model was run

Decoding MOS – Max and Min Decoding MOS – Max and Min TemperatureTemperature
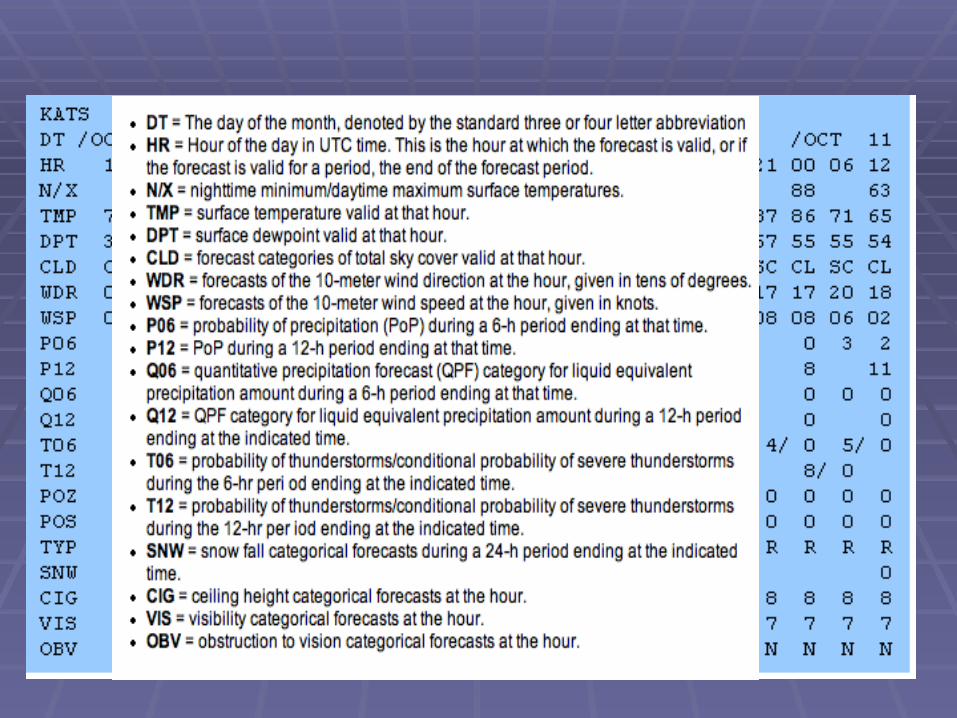
KMIA AVN MOS GUIDANCE 9/04/2003 0600 UTC KMIA AVN MOS GUIDANCE 9/04/2003 0600 UTC DT /SEPT 4 /SEPT 5 /SEPT 6 / DT /SEPT 4 /SEPT 5 /SEPT 6 / HR 12 15 18 21 00 03 06 09 12 15 18 21 00 03 06 09 12 15 18 00 06 HR 12 15 18 21 00 03 06 09 12 15 18 21 00 03 06 09 12 15 18 00 06 X/N 89 77 89 76 91X/N 89 77 89 76 91 TMP 79 85 86 84 81 80 79 79 80 84 85 83 80 79 77 77 79 85 88 82 78 TMP 79 85 86 84 81 80 79 79 80 84 85 83 80 79 77 77 79 85 88 82 78 DPT 77 76 75 75 75 76 76 76 77 76 75 74 74 75 75 75 76 75 74 74 74 DPT 77 76 75 75 75 76 76 76 77 76 75 74 74 75 75 75 76 75 74 74 74 CLD BK BK BK OV OV OV OV OV OV OV OV OV OV OV OV OV OV OV OV OV BK CLD BK BK BK OV OV OV OV OV OV OV OV OV OV OV OV OV OV OV OV OV BK WDR 00 19 17 17 14 13 16 17 20 23 22 24 24 23 24 21 22 25 25 26 24 WDR 00 19 17 17 14 13 16 17 20 23 22 24 24 23 24 21 22 25 25 26 24 WSP 00 01 04 03 01 01 02 05 03 09 09 08 04 04 04 06 06 11 11 06 05 WSP 00 01 04 03 01 01 02 05 03 09 09 08 04 04 04 06 06 11 11 06 05 P06 20 44 25 20 36 55 46 44 35 30 15 P06 20 44 25 20 36 55 46 44 35 30 15 P12 45 30 66 68 54 P12 45 30 66 68 54 Q06 0 2 0 0 2 4 4 2 4 0 0 Q06 0 2 0 0 2 4 4 2 4 0 0 Q12 1 1 4 5 4 Q12 1 1 4 5 4 T06 33/ 0 64/ 0 21/ 0 19/ 0 42/ 0 80/ 0 37/ 0 37/ 0 39/ 0 22/ 0 T06 33/ 0 64/ 0 21/ 0 19/ 0 42/ 0 80/ 0 37/ 0 37/ 0 39/ 0 22/ 0 T12 66/ 0 42/ 0 93/ 0 58/ 0 66/ 0 T12 66/ 0 42/ 0 93/ 0 58/ 0 66/ 0 CIG 7 7 7 6 6 7 7 7 7 6 4 5 4 4 4 5 6 5 5 7 7 CIG 7 7 7 6 6 7 7 7 7 6 4 5 4 4 4 5 6 5 5 7 7 VIS 7 7 7 7 7 7 7 7 7 7 7 7 7 7 7 7 7 7 7 7 7 VIS 7 7 7 7 7 7 7 7 7 7 7 7 7 7 7 7 7 7 7 7 7 OBV N N N N N N N N N N N N N N N N N N N N N OBV N N N N N N N N N N N N N N N N N N N N N

Decoding MOS – 3 hourly Decoding MOS – 3 hourly temperature forecaststemperature forecasts
KMIA AVN MOS GUIDANCE 9/04/2003 0600 UTC KMIA AVN MOS GUIDANCE 9/04/2003 0600 UTC DT /SEPT 4 /SEPT 5 /SEPT 6 / DT /SEPT 4 /SEPT 5 /SEPT 6 / HR 12 15 18 21 00 03 06 09 12 15 18 21 00 03 06 09 12 15 18 00 06 HR 12 15 18 21 00 03 06 09 12 15 18 21 00 03 06 09 12 15 18 00 06 X/N 89 77 89 76 91 X/N 89 77 89 76 91 TMP 79 85 86 84 81 80 79 79 80 84 85 83 80 79 77 77 79 85 88 82 78 TMP 79 85 86 84 81 80 79 79 80 84 85 83 80 79 77 77 79 85 88 82 78 DPT 77 76 75 75 75 76 76 76 77 76 75 74 74 75 75 75 76 75 74 74 74 DPT 77 76 75 75 75 76 76 76 77 76 75 74 74 75 75 75 76 75 74 74 74 CLD BK BK BK OV OV OV OV OV OV OV OV OV OV OV OV OV OV OV OV OV BK CLD BK BK BK OV OV OV OV OV OV OV OV OV OV OV OV OV OV OV OV OV BK WDR 00 19 17 17 14 13 16 17 20 23 22 24 24 23 24 21 22 25 25 26 24 WDR 00 19 17 17 14 13 16 17 20 23 22 24 24 23 24 21 22 25 25 26 24 WSP 00 01 04 03 01 01 02 05 03 09 09 08 04 04 04 06 06 11 11 06 05 WSP 00 01 04 03 01 01 02 05 03 09 09 08 04 04 04 06 06 11 11 06 05 P06 20 44 25 20 36 55 46 44 35 30 15 P06 20 44 25 20 36 55 46 44 35 30 15 P12 45 30 66 68 54 P12 45 30 66 68 54 Q06 0 2 0 0 2 4 4 2 4 0 0 Q06 0 2 0 0 2 4 4 2 4 0 0 Q12 1 1 4 5 4 Q12 1 1 4 5 4 T06 33/ 0 64/ 0 21/ 0 19/ 0 42/ 0 80/ 0 37/ 0 37/ 0 39/ 0 22/ 0 T06 33/ 0 64/ 0 21/ 0 19/ 0 42/ 0 80/ 0 37/ 0 37/ 0 39/ 0 22/ 0 T12 66/ 0 42/ 0 93/ 0 58/ 0 66/ 0 T12 66/ 0 42/ 0 93/ 0 58/ 0 66/ 0 CIG 7 7 7 6 6 7 7 7 7 6 4 5 4 4 4 5 6 5 5 7 7 CIG 7 7 7 6 6 7 7 7 7 6 4 5 4 4 4 5 6 5 5 7 7 VIS 7 7 7 7 7 7 7 7 7 7 7 7 7 7 7 7 7 7 7 7 7 VIS 7 7 7 7 7 7 7 7 7 7 7 7 7 7 7 7 7 7 7 7 7 OBV N N N N N N N N N N N N N N N N N N N N NOBV N N N N N N N N N N N N N N N N N N N N N

Decoding MOS – Cloud CoverDecoding MOS – Cloud Cover
KMIA AVN MOS GUIDANCE 9/04/2003 0600 UTC KMIA AVN MOS GUIDANCE 9/04/2003 0600 UTC DT /SEPT 4 /SEPT 5 /SEPT 6 / DT /SEPT 4 /SEPT 5 /SEPT 6 / HR 12 15 18 21 00 03 06 09 12 15 18 21 00 03 06 09 12 15 18 00 06 HR 12 15 18 21 00 03 06 09 12 15 18 21 00 03 06 09 12 15 18 00 06 X/N 89 77 89 76 91 X/N 89 77 89 76 91 TMP 79 85 86 84 81 80 79 79 80 84 85 83 80 79 77 77 79 85 88 82 78 TMP 79 85 86 84 81 80 79 79 80 84 85 83 80 79 77 77 79 85 88 82 78 DPT 77 76 75 75 75 76 76 76 77 76 75 74 74 75 75 75 76 75 74 74 74 DPT 77 76 75 75 75 76 76 76 77 76 75 74 74 75 75 75 76 75 74 74 74 CLD BK BK BK OV OV OV OV OV OV OV OV OV OV OV OV OV OV OV OV OV BKCLD BK BK BK OV OV OV OV OV OV OV OV OV OV OV OV OV OV OV OV OV BK WDR 00 19 17 17 14 13 16 17 20 23 22 24 24 23 24 21 22 25 25 26 24 WDR 00 19 17 17 14 13 16 17 20 23 22 24 24 23 24 21 22 25 25 26 24 WSP 00 01 04 03 01 01 02 05 03 09 09 08 04 04 04 06 06 11 11 06 05 WSP 00 01 04 03 01 01 02 05 03 09 09 08 04 04 04 06 06 11 11 06 05 P06 20 44 25 20 36 55 46 44 35 30 15 P06 20 44 25 20 36 55 46 44 35 30 15 P12 45 30 66 68 54 P12 45 30 66 68 54 Q06 0 2 0 0 2 4 4 2 4 0 0 Q06 0 2 0 0 2 4 4 2 4 0 0 Q12 1 1 4 5 4 Q12 1 1 4 5 4 T06 33/ 0 64/ 0 21/ 0 19/ 0 42/ 0 80/ 0 37/ 0 37/ 0 39/ 0 22/ 0 T06 33/ 0 64/ 0 21/ 0 19/ 0 42/ 0 80/ 0 37/ 0 37/ 0 39/ 0 22/ 0 T12 66/ 0 42/ 0 93/ 0 58/ 0 66/ 0 T12 66/ 0 42/ 0 93/ 0 58/ 0 66/ 0 CIG 7 7 7 6 6 7 7 7 7 6 4 5 4 4 4 5 6 5 5 7 7 CIG 7 7 7 6 6 7 7 7 7 6 4 5 4 4 4 5 6 5 5 7 7 VIS 7 7 7 7 7 7 7 7 7 7 7 7 7 7 7 7 7 7 7 7 7 VIS 7 7 7 7 7 7 7 7 7 7 7 7 7 7 7 7 7 7 7 7 7 OBV N N N N N N N N N N N N N N N N N N N N NOBV N N N N N N N N N N N N N N N N N N N N N

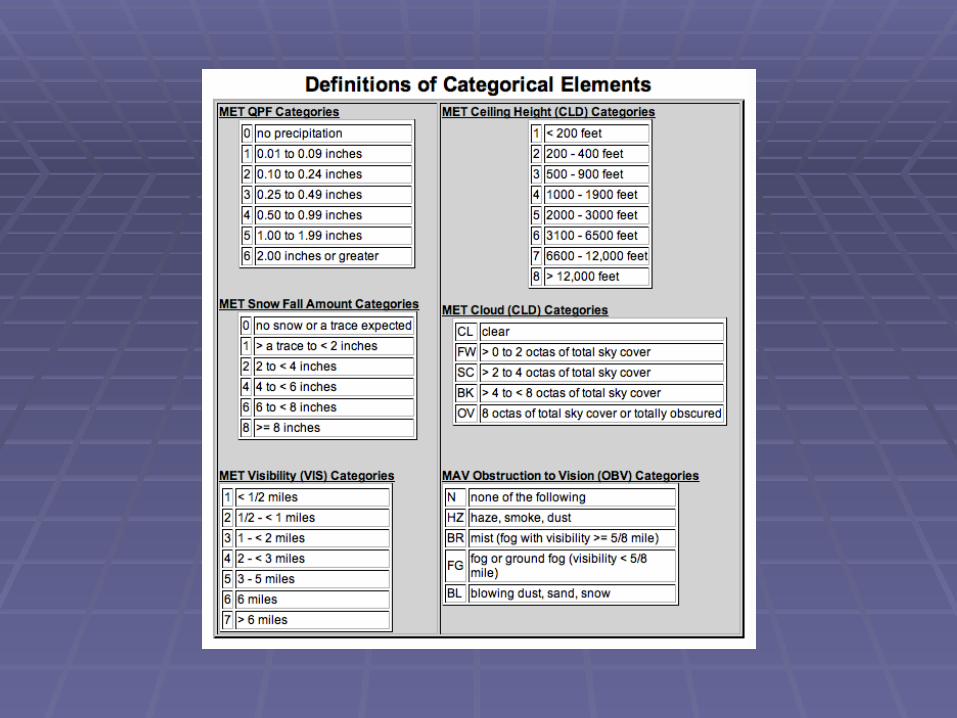
Decoding MOS - Cloud CoverDecoding MOS - Cloud Cover
CL = Clear, no cloudsCL = Clear, no clouds SC = Scattered, between clear and the SC = Scattered, between clear and the
sky ½ filled with cloudssky ½ filled with clouds BK = Broken, between sky ½ filled with BK = Broken, between sky ½ filled with
clouds and totally cloudyclouds and totally cloudy OV = Overcast, sky filled with clouds OV = Overcast, sky filled with clouds
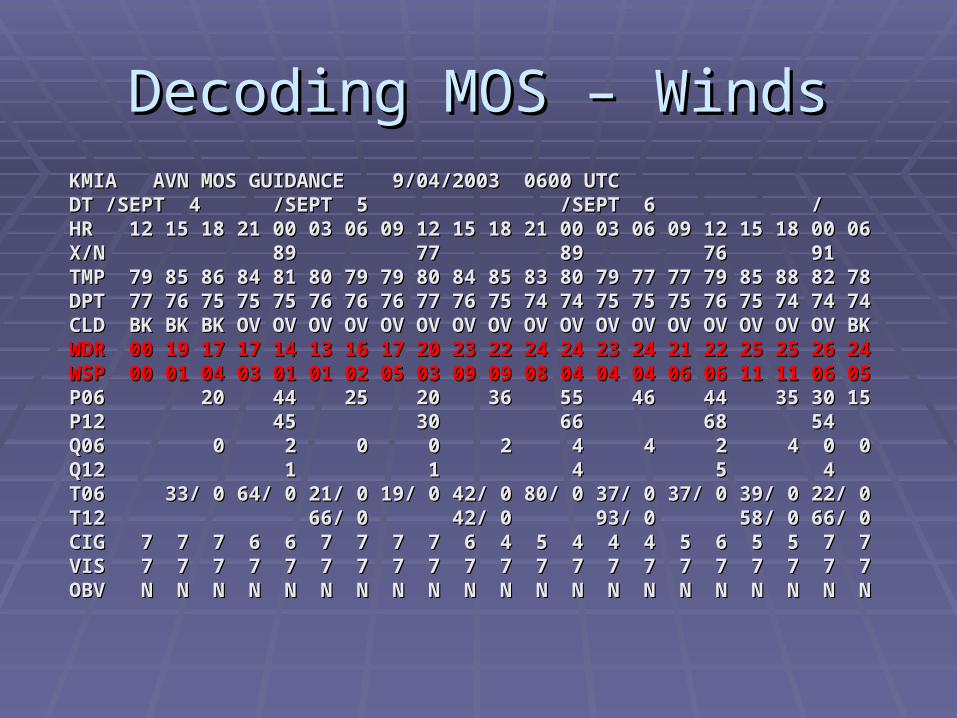
Decoding MOS – WindsDecoding MOS – Winds KMIA AVN MOS GUIDANCE 9/04/2003 0600 UTC KMIA AVN MOS GUIDANCE 9/04/2003 0600 UTC DT /SEPT 4 /SEPT 5 /SEPT 6 / DT /SEPT 4 /SEPT 5 /SEPT 6 / HR 12 15 18 21 00 03 06 09 12 15 18 21 00 03 06 09 12 15 18 00 06 HR 12 15 18 21 00 03 06 09 12 15 18 21 00 03 06 09 12 15 18 00 06 X/N 89 77 89 76 91 X/N 89 77 89 76 91 TMP 79 85 86 84 81 80 79 79 80 84 85 83 80 79 77 77 79 85 88 82 78 TMP 79 85 86 84 81 80 79 79 80 84 85 83 80 79 77 77 79 85 88 82 78 DPT 77 76 75 75 75 76 76 76 77 76 75 74 74 75 75 75 76 75 74 74 74 DPT 77 76 75 75 75 76 76 76 77 76 75 74 74 75 75 75 76 75 74 74 74 CLD BK BK BK OV OV OV OV OV OV OV OV OV OV OV OV OV OV OV OV OV BK CLD BK BK BK OV OV OV OV OV OV OV OV OV OV OV OV OV OV OV OV OV BK WDR 00 19 17 17 14 13 16 17 20 23 22 24 24 23 24 21 22 25 25 26 24 WDR 00 19 17 17 14 13 16 17 20 23 22 24 24 23 24 21 22 25 25 26 24 WSP 00 01 04 03 01 01 02 05 03 09 09 08 04 04 04 06 06 11 11 06 05 WSP 00 01 04 03 01 01 02 05 03 09 09 08 04 04 04 06 06 11 11 06 05 P06 20 44 25 20 36 55 46 44 35 30 15 P06 20 44 25 20 36 55 46 44 35 30 15 P12 45 30 66 68 54 P12 45 30 66 68 54 Q06 0 2 0 0 2 4 4 2 4 0 0 Q06 0 2 0 0 2 4 4 2 4 0 0 Q12 1 1 4 5 4 Q12 1 1 4 5 4 T06 33/ 0 64/ 0 21/ 0 19/ 0 42/ 0 80/ 0 37/ 0 37/ 0 39/ 0 22/ 0 T06 33/ 0 64/ 0 21/ 0 19/ 0 42/ 0 80/ 0 37/ 0 37/ 0 39/ 0 22/ 0 T12 66/ 0 42/ 0 93/ 0 58/ 0 66/ 0 T12 66/ 0 42/ 0 93/ 0 58/ 0 66/ 0 CIG 7 7 7 6 6 7 7 7 7 6 4 5 4 4 4 5 6 5 5 7 7 CIG 7 7 7 6 6 7 7 7 7 6 4 5 4 4 4 5 6 5 5 7 7 VIS 7 7 7 7 7 7 7 7 7 7 7 7 7 7 7 7 7 7 7 7 7 VIS 7 7 7 7 7 7 7 7 7 7 7 7 7 7 7 7 7 7 7 7 7 OBV N N N N N N N N N N N N N N N N N N N N NOBV N N N N N N N N N N N N N N N N N N N N N

Meteorology Wind DirectionMeteorology Wind Direction
000 = From the North
270 = From the West
090 = From the East
180 = From the South

Decoding MOS – Chance of Decoding MOS – Chance of measurable precipitationmeasurable precipitation
KMIA AVN MOS GUIDANCE 9/04/2003 0600 UTC KMIA AVN MOS GUIDANCE 9/04/2003 0600 UTC DT /SEPT 4 /SEPT 5 /SEPT 6 / DT /SEPT 4 /SEPT 5 /SEPT 6 / HR 12 15 18 21 00 03 06 09 12 15 18 21 00 03 06 09 12 15 18 00 06 HR 12 15 18 21 00 03 06 09 12 15 18 21 00 03 06 09 12 15 18 00 06 X/N 89 77 89 76 91 X/N 89 77 89 76 91 TMP 79 85 86 84 81 80 79 79 80 84 85 83 80 79 77 77 79 85 88 82 78 TMP 79 85 86 84 81 80 79 79 80 84 85 83 80 79 77 77 79 85 88 82 78 DPT 77 76 75 75 75 76 76 76 77 76 75 74 74 75 75 75 76 75 74 74 74 DPT 77 76 75 75 75 76 76 76 77 76 75 74 74 75 75 75 76 75 74 74 74 CLD BK BK BK OV OV OV OV OV OV OV OV OV OV OV OV OV OV OV OV OV BK CLD BK BK BK OV OV OV OV OV OV OV OV OV OV OV OV OV OV OV OV OV BK WDR 00 19 17 17 14 13 16 17 20 23 22 24 24 23 24 21 22 25 25 26 24 WDR 00 19 17 17 14 13 16 17 20 23 22 24 24 23 24 21 22 25 25 26 24 WSP 00 01 04 03 01 01 02 05 03 09 09 08 04 04 04 06 06 11 11 06 05 WSP 00 01 04 03 01 01 02 05 03 09 09 08 04 04 04 06 06 11 11 06 05 P06 20 44 25 20 36 55 46 44 35 30 15 P06 20 44 25 20 36 55 46 44 35 30 15 P12 45 30 66 68 54 P12 45 30 66 68 54 Q06 0 2 0 0 2 4 4 2 4 0 0 Q06 0 2 0 0 2 4 4 2 4 0 0 Q12 1 1 4 5 4 Q12 1 1 4 5 4 T06 33/ 0 64/ 0 21/ 0 19/ 0 42/ 0 80/ 0 37/ 0 37/ 0 39/ 0 22/ 0 T06 33/ 0 64/ 0 21/ 0 19/ 0 42/ 0 80/ 0 37/ 0 37/ 0 39/ 0 22/ 0 T12 66/ 0 42/ 0 93/ 0 58/ 0 66/ 0 T12 66/ 0 42/ 0 93/ 0 58/ 0 66/ 0 CIG 7 7 7 6 6 7 7 7 7 6 4 5 4 4 4 5 6 5 5 7 7 CIG 7 7 7 6 6 7 7 7 7 6 4 5 4 4 4 5 6 5 5 7 7 VIS 7 7 7 7 7 7 7 7 7 7 7 7 7 7 7 7 7 7 7 7 7 VIS 7 7 7 7 7 7 7 7 7 7 7 7 7 7 7 7 7 7 7 7 7 OBV N N N N N N N N N N N N N N N N N N N N N OBV N N N N N N N N N N N N N N N N N N N N N

Decoding MOS – Quantitative Decoding MOS – Quantitative Precipitation ForecastPrecipitation Forecast
KMIA AVN MOS GUIDANCE 9/04/2003 0600 UTC KMIA AVN MOS GUIDANCE 9/04/2003 0600 UTC DT /SEPT 4 /SEPT 5 /SEPT 6 / DT /SEPT 4 /SEPT 5 /SEPT 6 / HR 12 15 18 21 00 03 06 09 12 15 18 21 00 03 06 09 12 15 18 00 06 HR 12 15 18 21 00 03 06 09 12 15 18 21 00 03 06 09 12 15 18 00 06 X/N 89 77 89 76 91 X/N 89 77 89 76 91 TMP 79 85 86 84 81 80 79 79 80 84 85 83 80 79 77 77 79 85 88 82 78 TMP 79 85 86 84 81 80 79 79 80 84 85 83 80 79 77 77 79 85 88 82 78 DPT 77 76 75 75 75 76 76 76 77 76 75 74 74 75 75 75 76 75 74 74 74 DPT 77 76 75 75 75 76 76 76 77 76 75 74 74 75 75 75 76 75 74 74 74 CLD BK BK BK OV OV OV OV OV OV OV OV OV OV OV OV OV OV OV OV OV BK CLD BK BK BK OV OV OV OV OV OV OV OV OV OV OV OV OV OV OV OV OV BK WDR 00 19 17 17 14 13 16 17 20 23 22 24 24 23 24 21 22 25 25 26 24 WDR 00 19 17 17 14 13 16 17 20 23 22 24 24 23 24 21 22 25 25 26 24 WSP 00 01 04 03 01 01 02 05 03 09 09 08 04 04 04 06 06 11 11 06 05 WSP 00 01 04 03 01 01 02 05 03 09 09 08 04 04 04 06 06 11 11 06 05 P06 20 44 25 20 36 55 46 44 35 30 15 P06 20 44 25 20 36 55 46 44 35 30 15 P12 45 30 66 68 54 P12 45 30 66 68 54 Q06 0 2 0 0 2 4 4 2 4 0 0 Q06 0 2 0 0 2 4 4 2 4 0 0 Q12 1 1 4 5 4 Q12 1 1 4 5 4 T06 33/ 0 64/ 0 21/ 0 19/ 0 42/ 0 80/ 0 37/ 0 37/ 0 39/ 0 22/ 0 T06 33/ 0 64/ 0 21/ 0 19/ 0 42/ 0 80/ 0 37/ 0 37/ 0 39/ 0 22/ 0 T12 66/ 0 42/ 0 93/ 0 58/ 0 66/ 0T12 66/ 0 42/ 0 93/ 0 58/ 0 66/ 0 CIG 7 7 7 6 6 7 7 7 7 6 4 5 4 4 4 5 6 5 5 7 7 CIG 7 7 7 6 6 7 7 7 7 6 4 5 4 4 4 5 6 5 5 7 7 VIS 7 7 7 7 7 7 7 7 7 7 7 7 7 7 7 7 7 7 7 7 7 VIS 7 7 7 7 7 7 7 7 7 7 7 7 7 7 7 7 7 7 7 7 7 OBV N N N N N N N N N N N N N N N N N N N N N OBV N N N N N N N N N N N N N N N N N N N N N
T06, T12: probability of thunderstorms / severe t-storms over 6, 12hT06, T12: probability of thunderstorms / severe t-storms over 6, 12h

Decoding MOS – Precip. Decoding MOS – Precip. AmountAmount
0 = no precipitation0 = no precipitation 1 = 0.01 to 0.09 inches1 = 0.01 to 0.09 inches 2 = 0.10 to 0.24 inches2 = 0.10 to 0.24 inches 3 = 0.25 to 0.49 inches3 = 0.25 to 0.49 inches 4 = 0.50 to 0.99 inches4 = 0.50 to 0.99 inches 5 = 1.00 to 1.99 inches5 = 1.00 to 1.99 inches 6 = 2.00 inches or greater6 = 2.00 inches or greater

Decoding MOS – Local forecastDecoding MOS – Local forecast KMIA AVN MOS GUIDANCE 9/04/2003 0600 UTC KMIA AVN MOS GUIDANCE 9/04/2003 0600 UTC DT /SEPT 4 DT /SEPT 4 /SEPT 5/SEPT 5 /SEPT 6 / /SEPT 6 / HR 12 15 18 21 00 03 HR 12 15 18 21 00 03 06 09 12 15 18 21 00 03 0606 09 12 15 18 21 00 03 06 09 12 15 18 00 06 09 12 15 18 00 06 X/N 89 X/N 89 77 8977 89 76 91 76 91 TMP 79 85 86 84 81 80 TMP 79 85 86 84 81 80 79 79 80 84 85 83 80 79 7779 79 80 84 85 83 80 79 77 77 79 85 88 82 78 77 79 85 88 82 78 DPT 77 76 75 75 75 76 DPT 77 76 75 75 75 76 76 76 77 76 75 74 74 75 7576 76 77 76 75 74 74 75 75 75 76 75 74 74 74 75 76 75 74 74 74 CLD BK BK BK OV OV OV CLD BK BK BK OV OV OV OV OV OV OV OV OV OV OV OVOV OV OV OV OV OV OV OV OV OV OV OV OV OV BK OV OV OV OV OV BK WDR 00 19 17 17 14 13 WDR 00 19 17 17 14 13 16 17 20 23 22 24 24 23 2416 17 20 23 22 24 24 23 24 21 22 25 25 26 24 21 22 25 25 26 24 WSP 00 01 04 03 01 01 WSP 00 01 04 03 01 01 02 05 03 09 09 08 04 04 0402 05 03 09 09 08 04 04 04 06 06 11 11 06 05 06 06 11 11 06 05 P06 20 44 P06 20 44 25 20 36 55 4625 20 36 55 46 44 35 30 15 44 35 30 15 P12 45 P12 45 30 6630 66 68 54 68 54 Q06 0 2 0Q06 0 2 0 0 2 4 4 0 2 4 4 2 4 0 0 2 4 0 0 Q12 1 Q12 1 1 41 4 5 4 5 4
High Temperature: 89F
Low Temperature: 77F
Precipitation Category: Cat-4
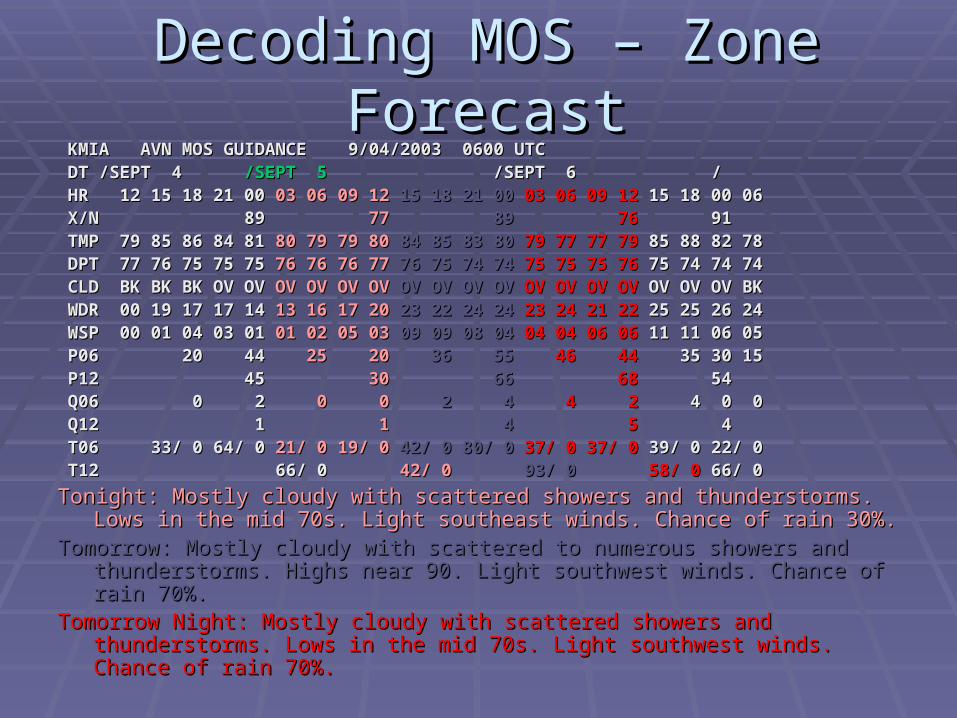
Decoding MOS – Zone ForecastDecoding MOS – Zone Forecast KMIA AVN MOS GUIDANCE 9/04/2003 0600 UTC KMIA AVN MOS GUIDANCE 9/04/2003 0600 UTC DT /SEPT 4 DT /SEPT 4 /SEPT 5/SEPT 5 /SEPT 6 / /SEPT 6 / HR 12 15 18 21HR 12 15 18 21 0000 03 06 09 12 03 06 09 12 15 18 21 00 15 18 21 00 03 06 09 1203 06 09 12 15 18 00 06 15 18 00 06 X/N 89 X/N 89 7777 89 89 7676 91 91 TMP 79 85 86 84TMP 79 85 86 84 8181 80 79 79 80 79 79 8080 84 85 83 80 84 85 83 80 79 77 77 7979 77 77 79 85 88 82 78 85 88 82 78 DPT 77 76 75 75DPT 77 76 75 75 7575 76 76 76 76 76 76 7777 76 75 74 74 76 75 74 74 75 75 75 7675 75 75 76 75 74 74 74 75 74 74 74 CLD BK BK BK OVCLD BK BK BK OV OVOV OV OV OV OV OV OV OV OV OV OV OV OV OV OV OV OV OV OV OV OVOV OV OV OV OV OV OV BK OV OV OV BK WDR 00 19 17 17 14WDR 00 19 17 17 14 13 16 17 20 13 16 17 20 23 22 24 24 23 22 24 24 23 24 21 2223 24 21 22 25 25 26 24 25 25 26 24 WSP 00 01 04 03 01WSP 00 01 04 03 01 01 02 05 03 01 02 05 03 09 09 08 04 09 09 08 04 04 04 06 0604 04 06 06 11 11 06 05 11 11 06 05 P06 20 44 P06 20 44 25 2025 20 36 5536 55 46 4446 44 35 30 15 35 30 15 P12 45 P12 45 3030 6666 6868 54 54 Q06 0 2 Q06 0 2 0 00 0 2 42 4 4 24 2 4 0 0 4 0 0 Q12 1 Q12 1 11 44 55 4 4 T06 33/ 0 64/ 0 T06 33/ 0 64/ 0 21/ 0 19/ 021/ 0 19/ 0 42/ 0 80/ 042/ 0 80/ 0 37/ 0 37/ 037/ 0 37/ 0 39/ 0 22/ 0 39/ 0 22/ 0 T12 66/ 0 T12 66/ 0 42/ 042/ 0 93/ 093/ 0 58/ 058/ 0 66/ 0 66/ 0
Tonight: Mostly cloudy with scattered showers and thunderstorms. Lows in the mid 70s. Tonight: Mostly cloudy with scattered showers and thunderstorms. Lows in the mid 70s. Light southeast winds. Chance of rain 30%.Light southeast winds. Chance of rain 30%.
Tomorrow: Mostly cloudy with scattered to numerous showers and thunderstorms. Highs Tomorrow: Mostly cloudy with scattered to numerous showers and thunderstorms. Highs near 90. Light southwest winds. Chance of rain 70%.near 90. Light southwest winds. Chance of rain 70%.
Tomorrow Night: Mostly cloudy with scattered showers and thunderstorms. Lows in the Tomorrow Night: Mostly cloudy with scattered showers and thunderstorms. Lows in the mid 70s. Light southwest winds. Chance of rain 70%.mid 70s. Light southwest winds. Chance of rain 70%.

MOS on the webMOS on the web
http://www.weather.http://www.weather.gov/mdl/synop/productsgov/mdl/synop/products..phpphp
IntroductionIntroduction
July 1996: USA changes to a more July 1996: USA changes to a more international system for meteorological international system for meteorological data reporting: METAR/TAF. Replaced data reporting: METAR/TAF. Replaced surface airways code.surface airways code.
METAR: A routine aviation weather reportMETAR: A routine aviation weather report SPECI: non-routine wx reportsSPECI: non-routine wx reports TAF: Aerodrome (airport) forecastsTAF: Aerodrome (airport) forecasts

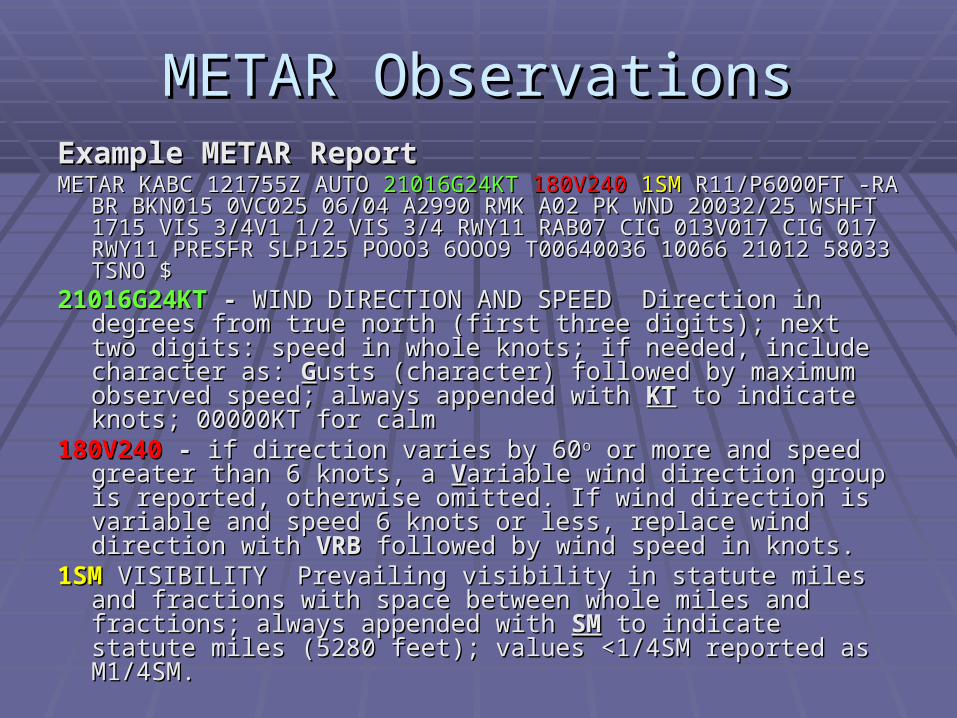
METAR ObservationsMETAR Observations
Example METAR ReportExample METAR Report METAR METAR KABCKABC 121755Z121755Z AUTOAUTO 21016G24KT 180V240 1SM R11/P6000FT 21016G24KT 180V240 1SM R11/P6000FT
-RA BR BKN015 0VC025 06/04 A2990 RMK A02 PK WND 20032/25 -RA BR BKN015 0VC025 06/04 A2990 RMK A02 PK WND 20032/25 WSHFT 1715 VIS 3/4V1 1/2 VIS 3/4 RWY11 RAB07 CIG 013V017 WSHFT 1715 VIS 3/4V1 1/2 VIS 3/4 RWY11 RAB07 CIG 013V017 CIG 017 RWY11 PRESFR SLP125 POOO3 6OOO9 T00640036 10066 CIG 017 RWY11 PRESFR SLP125 POOO3 6OOO9 T00640036 10066 21012 58033 TSNO $ 21012 58033 TSNO $
KABCKABC - ICAO STATION (location) IDENTIFIER Four character ICAO - ICAO STATION (location) IDENTIFIER Four character ICAO location identifier. K = USA; PA = Alaska; PH = Hawaiilocation identifier. K = USA; PA = Alaska; PH = Hawaii
121755Z121755Z - - DATE/TIME All dates and times in UTC using a 24-hour DATE/TIME All dates and times in UTC using a 24-hour clock; two-digit date and four-digit time; always appended with clock; two-digit date and four-digit time; always appended with ZZ to to indicate UTC.indicate UTC.
AUTOAUTO REPORT MODIFIER REPORT MODIFIER AUTOAUTO: Indicates a fully automated report : Indicates a fully automated report with no human intervention. It is removed when an observer logs on with no human intervention. It is removed when an observer logs on to the system. to the system. CORCOR: Indicates a corrected observation. : Indicates a corrected observation. No modifierNo modifier indicates human observer or automated system with human logged indicates human observer or automated system with human logged on for oversight functions.on for oversight functions.
METAR ObservationsMETAR ObservationsExample METAR ReportExample METAR Report METAR KABC 121755Z AUTO METAR KABC 121755Z AUTO 21016G24KT21016G24KT 180V240180V240 1SM1SM R11/P6000FT R11/P6000FT
-RA BR BKN015 0VC025 06/04 A2990 RMK A02 PK WND 20032/25 -RA BR BKN015 0VC025 06/04 A2990 RMK A02 PK WND 20032/25 WSHFT 1715 VIS 3/4V1 1/2 VIS 3/4 RWY11 RAB07 CIG 013V017 WSHFT 1715 VIS 3/4V1 1/2 VIS 3/4 RWY11 RAB07 CIG 013V017 CIG 017 RWY11 PRESFR SLP125 POOO3 6OOO9 T00640036 10066 CIG 017 RWY11 PRESFR SLP125 POOO3 6OOO9 T00640036 10066 21012 58033 TSNO $ 21012 58033 TSNO $
21016G24KT21016G24KT - - WIND DIRECTION AND SPEED Direction in degrees WIND DIRECTION AND SPEED Direction in degrees from true north (first three digits); next two digits: speed in whole from true north (first three digits); next two digits: speed in whole knots; if needed, include character as: knots; if needed, include character as: GGusts (character) followed by usts (character) followed by maximum observed speed; always appended with maximum observed speed; always appended with KTKT to indicate to indicate knots; 00000KT for calmknots; 00000KT for calm
180V240180V240 -- if direction varies by 60 if direction varies by 60oo or more and speed greater than 6 or more and speed greater than 6 knots, a knots, a VVariable wind direction group is reported, otherwise ariable wind direction group is reported, otherwise omitted. If wind direction is variable and speed 6 knots or less, omitted. If wind direction is variable and speed 6 knots or less, replace wind direction with replace wind direction with VRBVRB followed by wind speed in knots. followed by wind speed in knots.
1SM 1SM VISIBILITY Prevailing visibility in statute miles and fractions with VISIBILITY Prevailing visibility in statute miles and fractions with space between whole miles and fractions; always appended with space between whole miles and fractions; always appended with SMSM to indicate statute miles (5280 feet); values <1/4SM reported as to indicate statute miles (5280 feet); values <1/4SM reported as M1/4SM.M1/4SM.

Runway Visual Range (RVR)Runway Visual Range (RVR)
R11/P6000ft: runway 11has 6000 ft R11/P6000ft: runway 11has 6000 ft visibility. [Others: R11R or R11L or R11C] visibility. [Others: R11R or R11L or R11C]
P: RVR is higher than the sensor reportedP: RVR is higher than the sensor reported M: RVR less than sensor (not illustrated M: RVR less than sensor (not illustrated
here)here) V: RVR Variable. Example: V: RVR Variable. Example:
R06L/2000V4000ft for runway 6 left R06L/2000V4000ft for runway 6 left

METAR ObservationsMETAR Observations
Example METAR ReportExample METAR Report METAR KABC 121755Z AUTO 21016G24KT 180V240 1SM R11/P6000FT METAR KABC 121755Z AUTO 21016G24KT 180V240 1SM R11/P6000FT
–RA BR–RA BR BKN015 0VC025 06/04 A2990 RMK A02 PK WND 20032/25 BKN015 0VC025 06/04 A2990 RMK A02 PK WND 20032/25 WSHFT 1715 VIS 3/4V1 1/2 VIS 3/4 RWY11 RAB07 CIG 013V017 WSHFT 1715 VIS 3/4V1 1/2 VIS 3/4 RWY11 RAB07 CIG 013V017 CIG 017 RWY11 PRESFR SLP125 POOO3 6OOO9 T00640036 10066 CIG 017 RWY11 PRESFR SLP125 POOO3 6OOO9 T00640036 10066 21012 58033 TSNO $ 21012 58033 TSNO $
-RA BR-RA BR – Current – Current WEATHER PHENOMENAWEATHER PHENOMENA- Intensity or Proximity “-” Light, “no sign” Moderate, “+” Heavy, VC - Intensity or Proximity “-” Light, “no sign” Moderate, “+” Heavy, VC
VicinityVicinity- - Precipitation: DZ Drizzle, IC Ice Crystals, UP Unknown in automated Precipitation: DZ Drizzle, IC Ice Crystals, UP Unknown in automated
observations, RA Rain, PL Ice pellets, SN Snow, GR Hail, SG Snow observations, RA Rain, PL Ice pellets, SN Snow, GR Hail, SG Snow grains GS Small hail/snow pellets; SH showers; TS thunderstormgrains GS Small hail/snow pellets; SH showers; TS thunderstorm
- Obscuration: BR Mist (< or = 5/8SM), SA Sand, FU Smoke, HZ Obscuration: BR Mist (< or = 5/8SM), SA Sand, FU Smoke, HZ Haze, VA Volcanic Ash, PY Spray, DU Widespread DustHaze, VA Volcanic Ash, PY Spray, DU Widespread Dust
- Other: SQ Squall, FC Funnel Cloud, SS Sandstorm, +FC Tornado/ Other: SQ Squall, FC Funnel Cloud, SS Sandstorm, +FC Tornado/ Waterspout, DS Duststorm, PO Well developed dust/sand whirls.Waterspout, DS Duststorm, PO Well developed dust/sand whirls.
METAR ObservationsMETAR Observations
Example METAR ReportExample METAR Report METAR KABC 121755Z AUTO 21016G24KT 180V240 1SM R11/P6000FT METAR KABC 121755Z AUTO 21016G24KT 180V240 1SM R11/P6000FT
–RA BR –RA BR BKN015 0VC025BKN015 0VC025 06/0406/04 A2990 RMK A02 PK WND 20032/25 A2990 RMK A02 PK WND 20032/25 WSHFT 1715 VIS 3/4V1 1/2 VIS 3/4 RWY11 RAB07 CIG 013V017 WSHFT 1715 VIS 3/4V1 1/2 VIS 3/4 RWY11 RAB07 CIG 013V017 CIG 017 RWY11 PRESFR SLP125 POOO3 6OOO9 T00640036 10066 CIG 017 RWY11 PRESFR SLP125 POOO3 6OOO9 T00640036 10066 21012 58033 TSNO $21012 58033 TSNO $
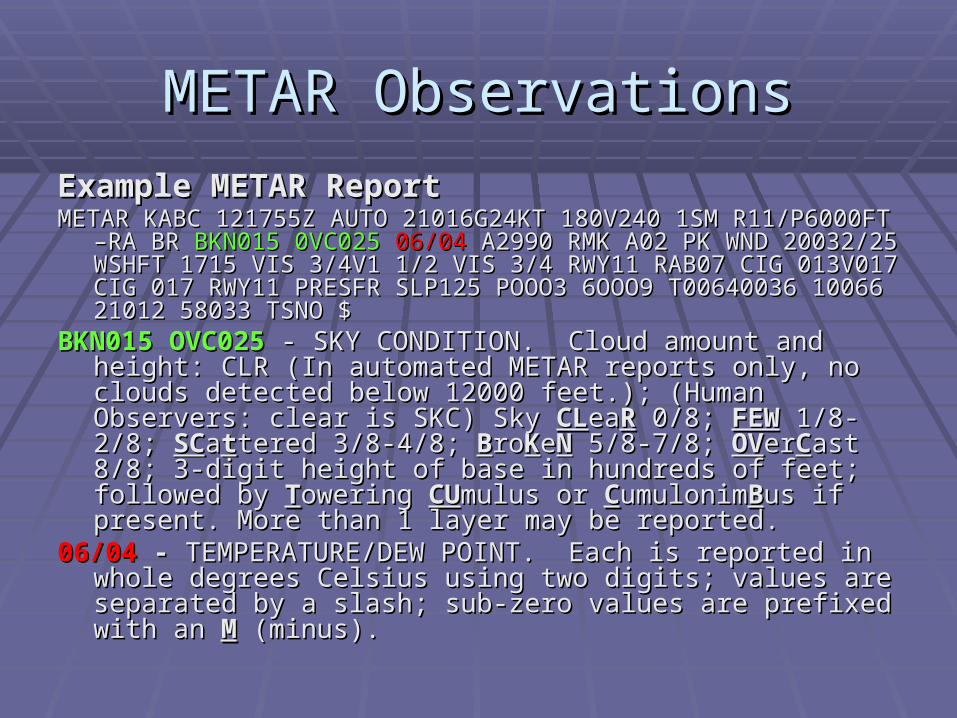
BKN015 OVC025BKN015 OVC025 -- SKY CONDITION. Cloud amount and height: CLR SKY CONDITION. Cloud amount and height: CLR (In automated METAR reports only, no clouds detected below (In automated METAR reports only, no clouds detected below 12000 feet.); (Human Observers: clear is SKC) Sky 12000 feet.); (Human Observers: clear is SKC) Sky CLCLeaeaRR 0/8; 0/8; FEWFEW 1/8-2/8; 1/8-2/8; SCSCaatttered 3/8-4/8; tered 3/8-4/8; BBroroKKeeNN 5/8-7/8; 5/8-7/8; OVOVererCCast 8/8; 3-ast 8/8; 3-digit height of base in hundreds of feet; followed by digit height of base in hundreds of feet; followed by TTowering owering CUCUmulus or mulus or CCumulonimumulonimBBus if present. More than 1 layer may be us if present. More than 1 layer may be reported.reported.
06/04 06/04 -- TEMPERATURE/DEW POINT. Each is reported in whole TEMPERATURE/DEW POINT. Each is reported in whole degrees Celsius using two digits; values are separated by a slash; degrees Celsius using two digits; values are separated by a slash; sub-zero values are prefixed with an sub-zero values are prefixed with an MM (minus). (minus).

METAR ObservationsMETAR Observations
Example METAR ReportExample METAR Report METAR KABC 121755Z AUTO 21016G24KT 180V240 1SM R11/P6000FT METAR KABC 121755Z AUTO 21016G24KT 180V240 1SM R11/P6000FT
–RA BR BKN015 0VC025 06/04 –RA BR BKN015 0VC025 06/04 A2990A2990 RMKRMK A02A02 PK WND 20032/25 PK WND 20032/25 WSHFT 1715 VIS 3/4V1 1/2 VIS 3/4 RWY11 RAB07 CIG 013V017 WSHFT 1715 VIS 3/4V1 1/2 VIS 3/4 RWY11 RAB07 CIG 013V017 CIG 017 RWY11 PRESFR SLP125 POOO3 6OOO9 T00640036 10066 CIG 017 RWY11 PRESFR SLP125 POOO3 6OOO9 T00640036 10066 21012 58033 TSNO $21012 58033 TSNO $
A2990A2990 ALTIMETER. Altimeter setting (in U.S. reports) is always ALTIMETER. Altimeter setting (in U.S. reports) is always prefixed with an prefixed with an AA indicating inches of mercury; reported using four indicating inches of mercury; reported using four digits: tens, units, tenths, and hundredths.digits: tens, units, tenths, and hundredths.
RMKRMK REMARKS IDENTIFIER. Remarks includes clarifying or REMARKS IDENTIFIER. Remarks includes clarifying or augmenting data concerning elements in the body of the METAR, augmenting data concerning elements in the body of the METAR, additive coded data and maintenance data.additive coded data and maintenance data.
AO2 AO2 TYPE OF AUTOMATED STATION. AO1; automated station TYPE OF AUTOMATED STATION. AO1; automated station without a precipitation discriminator. AO2; automated station with without a precipitation discriminator. AO2; automated station with precipitation discriminator.precipitation discriminator.

METAR ObservationsMETAR Observations
Example METAR ReportExample METAR Report METAR KABC 121755Z AUTO 21016G24KT 180V240 1SM R11/P6000FT METAR KABC 121755Z AUTO 21016G24KT 180V240 1SM R11/P6000FT
–RA BR BKN015 0VC025 06/04 A2990 RMK A02 –RA BR BKN015 0VC025 06/04 A2990 RMK A02 PK WND 20032/25PK WND 20032/25 WSHFT 1715WSHFT 1715 VIS 3/4V1 1/2 VIS 3/4 RWY11 RAB07 CIG 013V017 VIS 3/4V1 1/2 VIS 3/4 RWY11 RAB07 CIG 013V017 CIG 017 RWY11 PRESFR SLP125 POOO3 6OOO9 T00640036 10066 CIG 017 RWY11 PRESFR SLP125 POOO3 6OOO9 T00640036 10066 21012 58033 TSNO $ 21012 58033 TSNO $
PK WND 20032/25PK WND 20032/25 - - PEAK WIND. PK WND dddff(F)/(hh)mm; direction PEAK WIND. PK WND dddff(F)/(hh)mm; direction in degrees, speed in whole knots, time in minutes after the hour. in degrees, speed in whole knots, time in minutes after the hour. Only minutes after the hour is included if the hour can be inferred Only minutes after the hour is included if the hour can be inferred from the report.from the report.
WSHFT 1715WSHFT 1715 - - WIND SHIFT. WSHFT followed by hours and minutes WIND SHIFT. WSHFT followed by hours and minutes of occurrence. The term FROPA may be entered after the time if it is of occurrence. The term FROPA may be entered after the time if it is reasonably certain that the wind shift was a result of a frontal reasonably certain that the wind shift was a result of a frontal passage.passage.
METAR ObservationsMETAR Observations
Example METAR ReportExample METAR Report METAR KABC 121755Z AUTO 21016G24KT 180V240 1SM R11/P6000FT METAR KABC 121755Z AUTO 21016G24KT 180V240 1SM R11/P6000FT
–RA BR BKN015 0VC025 06/04 A2990 RMK A02 PK WND 20032/25 –RA BR BKN015 0VC025 06/04 A2990 RMK A02 PK WND 20032/25 WSHFT 1715 VIS 3/4V1 1/2 VIS 3/4 RWY11 RAB07 CIG 013V017 WSHFT 1715 VIS 3/4V1 1/2 VIS 3/4 RWY11 RAB07 CIG 013V017 CIG 017 RWY11 PRESFR SLP125 CIG 017 RWY11 PRESFR SLP125 POOO3POOO3 6OOO96OOO9 T00640036 10066 T00640036 10066 21012 58033 TSNO $ 21012 58033 TSNO $
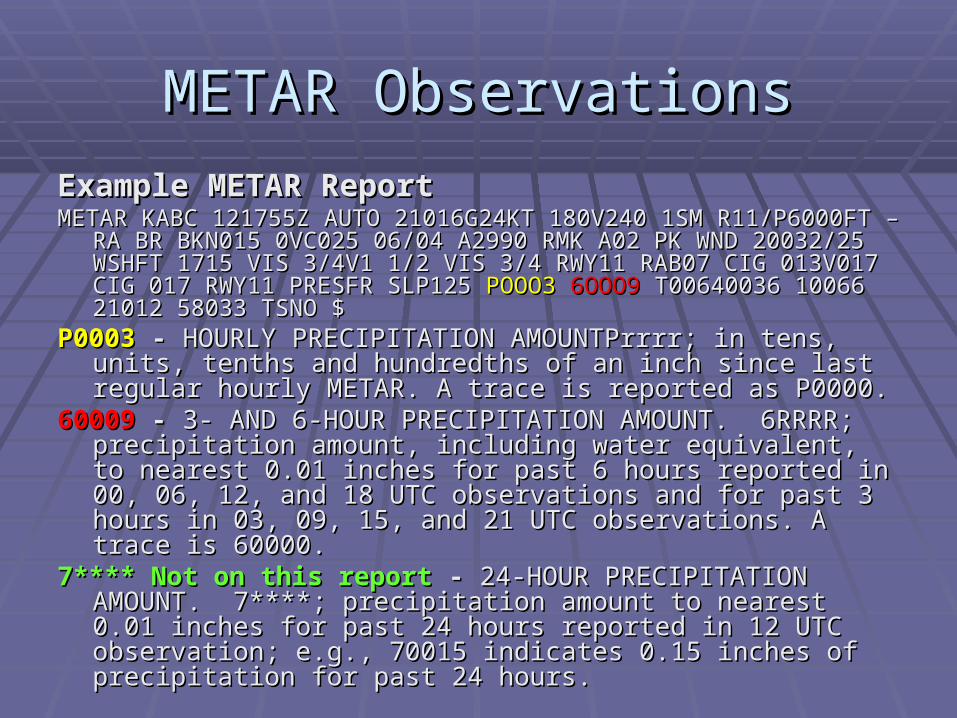
P0003P0003 - - HOURLY PRECIPITATION AMOUNTPrrrr; in tens, units, HOURLY PRECIPITATION AMOUNTPrrrr; in tens, units, tenths and hundredths of an inch since last regular hourly METAR. tenths and hundredths of an inch since last regular hourly METAR. A trace is reported as P0000. A trace is reported as P0000.
6000960009 - - 3- AND 6-HOUR PRECIPITATION AMOUNT. 6RRRR; 3- AND 6-HOUR PRECIPITATION AMOUNT. 6RRRR; precipitation amount, including water equivalent, to nearest 0.01 precipitation amount, including water equivalent, to nearest 0.01 inches for past 6 hours reported in 00, 06, 12, and 18 UTC inches for past 6 hours reported in 00, 06, 12, and 18 UTC observations and for past 3 hours in 03, 09, 15, and 21 UTC observations and for past 3 hours in 03, 09, 15, and 21 UTC observations. A trace is 60000. observations. A trace is 60000.
7**** Not on this report7**** Not on this report - - 24-HOUR PRECIPITATION AMOUNT. 24-HOUR PRECIPITATION AMOUNT. 7****; precipitation amount to nearest 0.01 inches for past 24 hours 7****; precipitation amount to nearest 0.01 inches for past 24 hours reported in 12 UTC observation; e.g., 70015 indicates 0.15 inches of reported in 12 UTC observation; e.g., 70015 indicates 0.15 inches of precipitation for past 24 hours.precipitation for past 24 hours.

METAR ObservationsMETAR Observations
Example METAR ReportExample METAR Report METAR KABC 121755Z AUTO 21016G24KT 180V240 1SM R11/P6000FT METAR KABC 121755Z AUTO 21016G24KT 180V240 1SM R11/P6000FT
–RA BR BKN015 0VC025 06/04 A2990 RMK A02 PK WND 20032/25 –RA BR BKN015 0VC025 06/04 A2990 RMK A02 PK WND 20032/25 WSHFT 1715 VIS 3/4V1 1/2 VIS 3/4 RWY11 RAB07 CIG 013V017 WSHFT 1715 VIS 3/4V1 1/2 VIS 3/4 RWY11 RAB07 CIG 013V017 CIG 017 RWY11 PRESFR SLP125 POOO3 6OOO9 CIG 017 RWY11 PRESFR SLP125 POOO3 6OOO9 T00640036T00640036 1006610066 2101221012 58033 TSNO $ 58033 TSNO $
T00640036T00640036 - - HOURLY TEMPERATURE AND DEW POINT. HOURLY TEMPERATURE AND DEW POINT. TsnTaTaTa snT'aT'aT'a; reported to nearest tenth of TsnTaTaTa snT'aT'aT'a; reported to nearest tenth of ooC; sn: 1 if C; sn: 1 if temperature or dew point below 0temperature or dew point below 0ooC and 0 if temperature/dew point C and 0 if temperature/dew point 00ooC or higher. C or higher.
1006610066 - - 6-HOUR MAXIMUM TEMPERATURE. 1snTxTxTx; maximum 6-HOUR MAXIMUM TEMPERATURE. 1snTxTxTx; maximum temperature for past 6 hours reported to nearest tenth of degree temperature for past 6 hours reported to nearest tenth of degree Celsius; reported on 00, 06, 12, 18 UTC reports; sn = 1 if Celsius; reported on 00, 06, 12, 18 UTC reports; sn = 1 if temperature below 0temperature below 0ooC and 0 if temperature 0C and 0 if temperature 0ooC or higherC or higher
2101221012 - - 6-HOUR MINIMUM TEMPERATURE. 2snTnTnTn; minimum 6-HOUR MINIMUM TEMPERATURE. 2snTnTnTn; minimum temperature for past 6 hours reported to nearest tenth of degree temperature for past 6 hours reported to nearest tenth of degree Celsius; reported on 00, 06, 12, 18 UTC reports; sn = 1 if Celsius; reported on 00, 06, 12, 18 UTC reports; sn = 1 if temperature below 0temperature below 0ooC and 0 if temperature 0C and 0 if temperature 0ooC or higher.C or higher.

For you slackers out there…For you slackers out there…
Metar decoders:Metar decoders: http://lwf.ncdc.noaa.gov/oa/climate/converhttp://lwf.ncdc.noaa.gov/oa/climate/conver
sion/swometardecoder.htmlsion/swometardecoder.html
www.met.tamu.edu/class/METAR/metar.htmlwww.met.tamu.edu/class/METAR/metar.html
Ultra-cool METAR DisplaysUltra-cool METAR Displays
www-frd.fsl.noaa.gov/mab/metarwww-frd.fsl.noaa.gov/mab/metar
www.rap.ucar.edu/weather/surfacewww.rap.ucar.edu/weather/surface Click on Java applets large versionClick on Java applets large version