Effects of Electromagnetic Radiation from Microwave Ovens ...

Microwave Radiation as an Alternative Control for Seed-borne Diseases in
Dry Bean
by
Allison P. Friesen
A Thesis
presented to
The University of Guelph
In partial fulfillment of requirements
for the degree of
Master of Science
in
Plant Agriculture
Guelph, Ontario, Canada
©Allison P. Friesen, March, 2014

ABSTRACT
MICROWAVE RADIATION AS AN ALTERNATIVE CONTROL FOR SEED-BORNE
DISEASES IN DRY BEAN
Allison P. Friesen Advisory Committee:
University of Guelph, 2014 Chris L. Gillard
Darren E. Robinson
Robert L. Conner
Controlling the seed-borne pathogens Xanthomonas axonopodis pv. phaseoli, Pseudomonas
syringae pv. phaseolicola, and Colletotrichum lindemuthianum is difficult in Canadian dry bean
production. Laboratory and field studies conducted in 2012-2013 evaluated microwave radiation
as an alternative control for these pathogens. In the laboratory, seed germination and vigour
decreased by <10% and 25%, respectively, between 40-60 s of microwave exposure. Microwave
radiation of seed infected with C. lindemuthianum resulted in a 0.10-0.14-% s-1
decrease in
disease incidence, but no similar response was observed with bacterial diseases. Field studies
evaluated the effect of microwave radiation and chemical treatment (pyraclostrobin +
fluxapyroxad + metalaxyl, thiamethoxam + fludioxonil + metalaxyl-M + azoxystrobin or copper
hydroxide 53.8%) on seed health and disease control. Microwave treatment decreased emergence
<9%, but did not consistently improve the other parameters. Chemical treatment decreased
disease symptoms, but did not provide season long control. Combining microwave and chemical
treatments provided no additional disease control or economic benefit.

iii
ACKNOWLEDGEMENTS
They say it takes a village to raise a child, but I say it takes a city to complete a thesis! In the
metropolis that helped me build my thesis there are so many people to express my gratitude to,
the first being my advisory committee. Chris Gillard was welcoming from day one, when I
stalked him down at a conference. He was always able to calm me down when mistakes were
made and lifted me up on the days when I needed to just keep going. He also instilled in me that
even though hard work needs to get done, having a little fun is important too. Robert Conner was
an associate I was fortunate enough to meet prior to my studies and someone I hope to continue
my relationship with for long after. His work is impeccable and something I strive for in my
own. I could always rely on him to bring me back to the science and focus of my project. Darren
Robinson brought a little taste from back home, being a Manitoba native as well, and always had
his door open for a chat or the never ending stats questions. Finally, Wayne Barton, who never
officially made the final committee cut, but was along for the whole ride anyway. I thank you for
encouraging me to go back full time and the investment made in my future career.
Like in any city, buildings would not go up without contractors or carpenters and for this
thesis those people were the technicians and summer students. I would first like to thank Waldo
Penner and Dennis Stoesz for all their long distance help preparing seed and running my
Manitoba trials. Thanks for being patient with me! In Ontario, I am grateful for Steve Willis,
who always kept a watchful eye out for my trials in Huron and Cara McCreary for her long hours
in the field with me and willingness to always answer just one more stats question. Thanks goes
to Dr. Greg Boland as well, for letting me utilize his lab space when I was in Guelph. To the
summer students, Jocelyn Hayes, Megan Vyn, Cynthia Xin Zhou, Mitchell Blommestyn, Nikki
Galbraith, Jesse Kankula, Saman Pathirana, and Tonya MacLukiewicz, I know my ratings may

iv
have sent you over the edge of sanity, but I would not have gotten this far without you. I would
also like to thank my fellow M.Sc. candidates, Erin LeClair and Lindsey Goudis, who too were
roped into so many of my ratings. I could not thank you enough for taking time from your own
projects when timelines were tight.
The building blocks of this city were definitely my family and friends, who I am ever grateful
to for encouraging me to pursue this goal. They have always been there for me and were my
cement pillars when times got rough. To my Mom and Dad, words cannot express how thankful I
am for you and the encouragement you have provided me with throughout this journey. As for
my siblings, all snide remarks aside you are my inspiration and have never let me down. My
grandparents were always by my side and cheering me on, but two left too soon to see me finish,
but I hope I have still made them proud. I would also like to thank my faithful editor, seed
counter, and occasional disease rating recorder, Andrew, who kept me sane and brought a whole
lot of laughter into the process.
Finally, as with any project, sky scraper or M.Sc., none of this could have happened without
the help of investors. Therefore, I would like to thank the Manitoba Pulse Growers Association,
the Ontario Bean Growers, BASF Canada and the Natural Sciences and Engineering Research
Council of Canada for funding this project.
v
TABLE OF CONTENTS
Acknowledgements ................................................................................................................ iii Table of Contents ..................................................................................................................... v List of Tables ......................................................................................................................... vii List of Figures .......................................................................................................................... ix Table of Acronyms .................................................................................................................. xi
CHAPTER ONE: Literature Review and Research Proposal
1.1 Introduction to Dry Beans ................................................................................................ 1 1.1.1 History .......................................................................................................................... 1 1.1.2 Development ................................................................................................................ 2 1.1.3 Market Classes ............................................................................................................. 3 1.1.4 Production .................................................................................................................... 4
1.2 Seed-Borne Pathogens ....................................................................................................... 5
1.2.1 Infection ....................................................................................................................... 5 1.2.2 Control & Regulation ................................................................................................... 5 1.3 Common Bacterial Blight .................................................................................................. 8
1.3.1 Development & Symptomology .................................................................................. 8 1.3.2 Vectors ......................................................................................................................... 9 1.3.3 Control Measures ....................................................................................................... 10 1.3.4 Yield Reductions ........................................................................................................ 11
1.4 Halo Blight ........................................................................................................................ 12
1.4.1 Development & Symptomology ................................................................................ 12 1.4.2 Vectors ....................................................................................................................... 13 1.4.3 Control Measures ....................................................................................................... 14 1.4.4 Yield Reductions ........................................................................................................ 15
1.5 Anthracnose ...................................................................................................................... 15 1.5.1 Development & Symptomology ................................................................................ 15 1.5.2 Vectors ....................................................................................................................... 17 1.5.3 Control Measures ....................................................................................................... 17 1.5.4 Yield Reductions ........................................................................................................ 20
1.6 Thermotherapy Treatment ............................................................................................. 21 1.6.1 Introduction ................................................................................................................ 21 1.6.2 Thermotherapy in various crops ................................................................................. 23 1.6.3 Thermotherapy in dry beans ....................................................................................... 25 1.6.4 Microwave Treatment ................................................................................................ 27
1.7 Chemical Treatment ........................................................................................................ 31 1.7.1 Introduction ................................................................................................................ 31 1.7.2 Seed Treatment ........................................................................................................... 32 1.7.3 Foliar Treatment ......................................................................................................... 34
1.8 Economics ......................................................................................................................... 36 1.8.1 Dry Bean Prices & Yield ............................................................................................ 36 1.8.2 Net Yield & Economic Return ................................................................................... 36 1.8.3 Pesticide & Pesticide Application Costs .................................................................... 38
1.9 Research Proposal ............................................................................................................ 38 1.9.1 Hypothesis .................................................................................................................. 38 1.9.2 Objectives & Justification .......................................................................................... 39

vi
CHAPTER TWO: Effect of microwave radiation on dry bean seed infected with
Xanthomonas axonopodis pv. phaseoli with and without the use of chemical seed treatment
2.1 Abstract ............................................................................................................................. 40 2.2 Introduction ...................................................................................................................... 40 2.3 Materials and Methods .................................................................................................... 43
2.3.1 Laboratory Study ........................................................................................................ 43 2.3.2 Field Study ................................................................................................................. 44 2.3.3 Statistical Analysis ..................................................................................................... 48
2.4 Results & Discussion ........................................................................................................ 49 2.4.1 Laboratory Study ........................................................................................................ 49
2.4.2 Field Study ................................................................................................................. 50
CHAPTER THREE: Effect of microwave radiation on dry bean seed infected with
Pseudomonas syringae pv. phaseolicola with and without the use of chemical seed treatment
3.1 Abstract ............................................................................................................................. 66 3.2 Introduction ...................................................................................................................... 66 3.3 Materials and Methods .................................................................................................... 69
3.3.1 Laboratory Study ........................................................................................................ 69 3.3.2 Field Study ................................................................................................................. 70 3.3.3 Statistical Analysis ..................................................................................................... 73
3.4 Results & Discussion ........................................................................................................ 74 2.4.1 Laboratory Study ........................................................................................................ 74
2.4.2 Field Study ................................................................................................................. 75
CHAPTER FOUR: Effect of microwave radiation on dry bean seed infected with
Colletotrichum lindemuthianum with and without the use of chemical seed treatment
4.1 Abstract ............................................................................................................................. 92 4.2 Introduction ...................................................................................................................... 92 4.3 Materials and Methods .................................................................................................... 95
4.3.1 Laboratory Study ........................................................................................................ 95 4.3.2 Field Study ................................................................................................................. 96 4.3.3 Statistical Analysis ................................................................................................... 100
4.4 Results & Discussion ...................................................................................................... 102 2.4.1 Laboratory Study ...................................................................................................... 102
2.4.2 Field Study ............................................................................................................... 103
CHAPTER FIVE: General Discussion
5.1 Summary & Research Contributions ........................................................................... 121 5.2 Research Limitations ..................................................................................................... 122 5.3 Future Research ............................................................................................................. 124
REFERENCES ..................................................................................................................... 126
LIST OF APPENDICES
Appendix A: Effect of Microwave Radiation on Seed with Increasing Moisture Content .. 144

vii
LIST OF TABLES
Table 2.1. Treatments and treatment costs allocated for the dry bean common bacterial blight
seed treatment experiments in 2012 and 2013 ......................................................................... 56
Table 2.2. Contrasts comparing percentage of emergence of navy and pinto beans for various
seed treatments to control common bacterial blight at Morden, MB and Ridgetown and Exeter,
ON in 2012-2013 ..................................................................................................................... 57
Table 2.3. Contrasts comparing percentage of leaf and pod infection on navy and pinto beans for
various seed treatments to control common bacterial blight at Morden, MB and Ridgetown and
Exeter, ON in 2012-2013 ......................................................................................................... 58
Table 2.4. Contrasts comparing yield and percentage of seed pick on navy and pinto beans for
various seed treatments to control common bacterial blight at Morden, MB and Ridgetown and
Exeter, ON in 2012-2013 ......................................................................................................... 59
Table 2.5. Contrasts comparing return on investment (ROI) on navy and pinto beans for various
seed treatments to control common bacterial blight at Morden, MB and Ridgetown and Exeter,
ON in 2012-2013 ..................................................................................................................... 60
Table 3.1. Treatments allocated for the dry bean halo blight seed treatment experiments in 2012
and 2013 ................................................................................................................................... 83
Table 3.2. Contrasts comparing percentage of emergence of navy and kidney beans for various
seed treatments to control halo blight at Morden and Winkler, MB in 2012-2013 ................. 84
Table 3.3. Contrasts comparing percentage of leaf incidence and severity at 7 WAP and pod
infection on navy and kidney beans for various seed treatments to control halo blight at Morden
and Winkler, MB in 2012-2013 ............................................................................................... 85
Table 3.4. Contrasts comparing hundred seed weight (HSW) and percentage of seed pick on
navy and kidney beans for various seed treatments to control halo blight at Morden and Winkler,
MB in 2012-2013 ..................................................................................................................... 86
Table 3.5. Contrasts comparing yield on navy and kidney beans for various seed treatments to
control halo blight at Morden and Winkler, MB in 2012-2013 ............................................... 87
Table 3.6. Contrasts comparing return on investment (ROI) on navy and kidney beans for
various seed treatments to control halo blight at Morden and Winkler, MB in 2012-2013 .... 88
Table 4.1. Treatments allocated for the dry bean anthracnose seed treatment experiments in 2012
and 2013 ................................................................................................................................. 110
Table 4.2. Contrasts comparing percentage of emergence of navy and pinto beans for various
seed treatments to control anthracnose at Ridgetown and Exeter, ON in 2012-2013 ........... 111

viii
Table 4.3. Contrasts comparing the area under the disease progress curve (AUDPC) for leaf and
stem infection on navy and pinto beans for various seed treatments to control anthracnose in
Ridgetown and Exeter, ON in 2012-2013 .............................................................................. 112
Table 4.4. Contrasts comparing the percentage of pod infection on navy and pinto beans for
various seed treatments to control anthracnose in Ridgetown and Exeter, ON in
2012-2013 ............................................................................................................................... 113
Table 4.5. Contrasts comparing pod destruction index and percentage of seed pick for navy and
pinto beans for various seed treatments to control anthracnose in Ridgetown and Exeter, ON in
2012-2013 .............................................................................................................................. 114
Table 4.6. Contrasts comparing yield and return on investment for navy and pinto beans for
various seed treatments to control anthracnose in Ridgetown and Exeter, ON in
2012-2013 .............................................................................................................................. 115

ix
LIST OF FIGURES
Figure 2.1. Nonlinear regressions (NLIN) of percentage of germination of navy and pinto bean
seed incubated at 25oC for 7 d in a germination chamber after various microwave radiation
treatments in 2012 and 2013. Navy data was arcsine square root transformed for data analysis to
meet the assumptions of normality and back-transformed estimates are presented ................ 61
Figure 2.2. Nonlinear regressions (NLIN) of plant vigour (dry weights of germinated material)
from navy and pinto bean seed incubated at 25oC for 7 d in a germination chamber after various
microwave radiation treatments in 2012 and 2013 .................................................................. 62
Figure 2.3. Linear regression of area under the disease progress curve (AUDPC) for leaf
infection and yield for navy and pinto bean seed treatment study for common bacterial blight
control in Ridgetown and Exeter, ON in 2012 and 2013 ......................................................... 63
Figure 2.4. Linear regression of return on investment (ROI) and yield for navy and pinto bean
seed treatment study for common bacterial blight control in Morden, MB and Ridgetown and
Exeter, ON in 2012 and 2013 .................................................................................................. 64
Figure 2.5. Linear regression of area under the disease progress curve (AUDPC) for leaf
infection and return on investment (ROI) for navy and pinto bean seed treatment study for
common bacterial blight control in Ridgetown and Exeter, ON in 2012 and 2013 ................. 65
Figure 3.1. Nonlinear regressions (NLIN) of percentage of germination of navy and kidney bean
seed incubated in a germination chamber for 7 d at 25oC following various microwave radiation
treatments in 2012 and 2013. Navy data was arcsine square root transformed for data analysis to
meet the assumptions of normality and back-transformed estimates are presented ................ 89
Figure 3.2. Nonlinear regressions (NLIN) of plant vigour (dry weights of germinated material)
from navy and kidney bean seed incubated at 25oC for 7 d in a germination chamber after
various microwave radiation treatments in 2012 and 2013 ..................................................... 90
Figure 3.3. Linear regression of return on investment (ROI) and yield for navy and kidney bean
seed treatment study for halo blight control in Morden, MB and Winkler, MB
in 2012 and 2013 ...................................................................................................................... 91
Figure 4.1. Nonlinear regressions (NLIN) of percentage of germination of navy and pinto bean
seed incubated in a germination chamber for 7 d at 25oC following various microwave radiation
treatments in 2012 and 2013 .................................................................................................. 116
Figure 4.2. Nonlinear regressions (NLIN) of plant vigour (dry weights of germinated material)
from navy and pinto bean seed incubated in a germination chamber for 7 day at 25oC following
various microwave radiation treatments in 2012 and 2013 ................................................... 117

x
Figure 4.3. Linear regressions of percentage of pathogen colonization of seed by Colletotrichum
lindemuthianum on potato dextrose agar following various microwave radiation treatments in
2012 ........................................................................................................................................ 118
Figure 4.4. Linear regression of return on investment (ROI) and yield for navy and pinto bean
seed treatment study for anthracnose control in 2012 and 2013 ............................................ 119
Figure 4.5. Linear regression of area under the disease progress curve (AUDPC) for leaf
infection and return on investment (ROI) for navy and pinto bean seed treatment study for
anthracnose control in 2012 and 2013 ................................................................................... 120
Figure A.1. Influence of microwave radiation at varying exposure lengths on dry bean seed with
increasing seed moisture content. Columns within the same moisture content with the same letter
are not significantly different (P ≥ 0.05); A-C 10%; a-e 15%; z-u 20% ............................... 135

xi
TABLE OF ACRONYMS
AUDPC - Area under the disease progress curve
BBCH - Biologische Bundesanstalt, Bundessortenamt and Chemische Industrie scale
CBB - Common bacterial blight
CFIA - Canadian Food Inspection Agency
DAP - Days after planting
DCT - Diazinon + captan + thiophanate-methyl
EMR - Electromagnetic radiation
EPS - Extracellular polysaccharides
HSW - Hundred seed weight
IC - Infected control
IPM - Integrated pest management
MC - Moisture content
MER - Maximum exposure rate
MOA - Mode of action
MSRP - Manufacturer's suggested retail price
NIC - Non-infected control
OAC - Ontario Agricultural College
PDA - Potato dextrose agar
PDI - Pod destruction index
PFM - Pyraclostrobin + fluxapyroxad + metalaxyl
Psp - Pseudomonas syringae pv. phaseolicola
RCBD - Randomized complete block design
RH - Relative humidity
ROI - Return on investment
ST
(fungus)
- Pyraclostrobin + fluxapyroxad + metalaxyl and thiamethoxam + fludioxonil +
metalaxyl –M + azoxystrobin
ST
(blights)
- Pyraclostrobin + fluxapyroxad + metalaxyl and copper hydroxide 53.8%
TFMA - Thiamethoxam + fludioxonil + metalaxyl –M + azoxystrobin
WAP - Weeks after planting
Xap - Xanthomonas axonopodis pv. phaseoli
1
CHAPTER ONE
Literature Review and Research Objectives
1.1 Introduction to Dry Beans
1.1.1 History
Phaseolus vulgaris L., also known as dry bean, belongs to the family Fabaceae and is an
important legume crop grown worldwide for human consumption. Although it prefers temperate
zones and the tropics, dry bean has adapted to numerous climatic conditions and is grown over a
large geographical area (Chase, 1987). The widespread production of dry bean has been
attributed to its similar protein characteristics to the more expensive red meat, which makes dry
bean a cheaper staple food in many countries’ diets (Wright, 2007; Health Canada, 2012). Dry
bean has a high dietary fibre and folate content along with its high protein level (15-25%), which
allows it to serve as an important dietary source of these nutrients compared to other legume
crops (Tosh and Yada, 2010).
The origin of cultivated common bean stems from two specific regions, Middle America and
the Andes, and it is a domesticated form of the wild-growing vine-like ancestor (van
Schoonhaven and Voysest, 1991). The Mesoamerican lines (e.g. navy and black market classes)
originated in Mexico and Central America and typically have a smaller seed size than the
Andean lines (Voysest and Dessert, 1991). The larger seed classes (e.g. cranberry and kidney
beans) are Andean and originated on the western side of South America in Ecuador and Peru.
The domestication of both of these gene pools has led to the distribution of Mesoamerican and
Andean types to other growing regions (van Schoonhaven and Voysest, 1991). Although both
lines are now worldwide, certain classes still predominate in their specific area of development,

2
like black beans in Latin America and white beans in Africa (van Schoonhaven and Voysest,
1991).
1.1.2 Development
Although domestication of dry bean has led to the worldwide distribution of classes from both
ancestries, human selection pressure has also affected the process significantly, as seen with
traits such as growth habit (van Schoonhaven and Voysest, 1991). In dry bean there are four
growth habits (I-IV) classified based on their growing pattern, plant structure and flowering
period (Kelly, 2001). Type I, also known as determinate or bush type, are upright, have limited
ability to produce vines and have a relatively short flowering period (Voysest and Dessert, 1991).
The short nature and upright style of Type I make them easy to harvest and desirable for
commercial production (van Schoonhaven and Voysest, 1991; Kelly, 2001). Types II-IV are
indeterminate, which possess a vegetative meristem that enables increased branch production and
an extended flowering period compared to Type I (Kelly, 2001). The Type IV growth habit is the
least favourable for commercial production as it has a high tendency to vine and intertwine with
neighbouring plants. Type II and III are intermediates of Type I and IV and are commonly used
in commercial production.
Although the vegetative growth pattern varies in dry bean, all types reproduce through self-
pollination (Ibarra-Perez et al., 1997). Cross pollination has been observed in dry bean, however,
the range in frequency was large (0-78%) and environmental factors were shown to have a strong
influence on its frequency (Ibarra-Perez et al., 1997). Insect vectors, such as bumblebees
(Bombus spp.) and bees (Apis spp.) are known to cross pollinate dry bean (Ibarra-Perez et al.,
1999).

3
Pollination begins at the point of initial flowering; this growth stage can be determined and
monitored using the Biologische Bundesanstalt, Bundessortenamt and Chemische Industrie
(BBCH) scale (Hess et al., 2008). The BBCH scale is commonly used in research to separate the
vegetative and reproductive stages of plant development by numerical values, zero to twenty-
nine for stages of vegetative growth and fifty-one to eighty-nine for stages of reproductive
growth.
1.1.3 Market Classes
Dry beans can be classified based into market classes as well as by growth habit. In Canada,
several market classes are grown across the major bean production areas of Manitoba and
Ontario, as well as niche areas in Saskatchewan, Alberta, and Quebec (Goodwin, 2003).
Commonly occurring market classes for these areas are navy, black, pinto, cranberry, great
northern, as well as light red, dark red and white kidney beans (Goodwin, 2003; Kelly et al.,
2009). The navy, black and pinto bean classes are of the Mesoamerican ancestry and are
commonly grown in all bean producing areas of Canada, except Alberta (Goodwin, 2003;
Mamidi et al., 2011). The remaining classes, usually referred to as the coloured beans, originate
from the Andean ancestry and are grown across all the Canadian bean producing regions
(Goodwin, 2003; Mamidi et al., 2011).
In Ontario the navy, coloured, and Japanese (Kintoki and Otebo) classes are commonly
grown. The more common coloured classes grown in Ontario are cranberry and kidney classes.
The Japanese classes consist of otebo beans (Phaseolus spp.) and adzuki beans (Vigna angularis
(Willd.) Ohwi & H. Ohashi) and are primarily used for confectionary purposes (Kelly et al.,
2009). The Japanese classes are specific to Ontario and not produced in Manitoba, where navy,
black and a variety of coloured beans are more commonly grown.

4
1.1.4 Production
Worldwide approximately 20 million tonnes of dry beans are produced annually (FAOSTAT,
2012). The majority of production occurs in developing countries in Asia, Africa, and South
America as well as some developed countries in Oceania, Europe, and North America (Gepts et
al., 2008). Asia and the Americas contribute approximately 81% of bean production each year
and include the top five countries for seed and food grade production (FAOSTAT, 2012). The
individual countries that contribute the most to the total average bean production globally in the
last five years are India (16.1%), Brazil (15.8%), Myanmar (13.7%), China (7.5%), USA (5.8%),
and Mexico (5.2%) (FAOSTAT, 2012).
Canada contributes 1.4 % of the total bean production worldwide and is responsible for an
average production of 250 thousand (K) tonnes annually over the last ten years (Stats Canada,
2012; FAOSTAT, 2012). Of the dry beans grown in Canada, navy beans make up 38% while
coloured beans make up the remainder. Ontario is the largest producer in Canada and accounts
for approximately 42% of bean production in the past ten years (Stats Canada, 2012).
Despite the low percentage that Canada contributes to the total bean production worldwide,
dry bean serves as an important export commodity. Canada is one of the top five countries for
dry bean export and on average Canada exports almost all of its tonnage to the USA and Europe
annually (Agriculture and Agri-Food Canada, 2012; FAOSTAT, 2012). Other major exporting
countries are Myanmar (1.09 M tonnes), China (860 K tonnes), USA (345 K tonnes), and
Argentina (240 K tonnes) (FAOSTAT, 2012). In the last ten years the majority of exports from
these countries go to India and the European Union, who have annually imported over 500 K
tonnes and 1.8 M tonnes, respectively (FAOSTAT, 2012).

5
1.2 Seed-Borne Pathogens
1.2.1 Infection
Seed-borne pathogens commonly occur in dry bean seed and can cause significant crop and
economic loss (Agarwal, 1997). Seed-borne pathogens can be transmitted as an infection (carried
internally) or as an infestation (carried passively) on the seed coat (Maude, 1996). Once infected,
all seed parts can be colonized; however some pathogens are restricted to specific areas of the
seed, like bacterial blights, which occur in the embryo, pericarp or seed coat, but not the
endosperm or perisperm (Agarwal, 1997; Singh, 2004). The location of the pathogen also
depends on factors such as pathogen species, the mode and timing of infection, environmental
conditions, host type and developmental stage, as well as crop management practices (Singh,
2004). Due to the location of some pathogens the seed can appear asymptomatic, causing
problems for the production of clean seed, as the pathogens can be transmitted from seed to
seedling to adult plant (Maude, 1996; Agarwal, 1997).
The transmission of a pathogen from an infected seed to a seedling can occur systemically or
non-systemically depending on the pathogen (Maude, 1996; Agarwal, 1997; Singh, 2004).
Systemic seed transmission is caused when infected seed results in the systemic spread of the
disease at germination, whereas non-systemic transmission occurs as pre- or post-emergence
infection (Agarwal, 1997). Both types of transmission can result in high levels of seed infection
that produce large amounts of inoculum (Agarwal, 1997). These seedlings can cause secondary
infections throughout the crop resulting in reductions in yield and seed quality (Agarwal, 1997).
1.2.2 Control & Regulation
Integrated pest management (IPM) is key to control seed-borne pathogens in dry bean
(Agarwal, 1997). Integrated pest management systems utilize numerous methods to achieve

6
control; such as the use of resistant cultivars, disease-free seed, chemical treatments, eradication
treatments, and alterations of cultural practices (Maude, 1996; Agarwal, 1997; McGee, 1997).
The use of resistant cultivars is the most effective management strategy for disease control,
however, the availability of such cultivars varies for the numerous seed-borne pathogens that
affect dry bean (Singh and Muñoz, 1999). When resistant cultivars are not available the use of
disease-free seed is the next most important strategy, as infected seed is usually the primary
inoculum source for most seed-borne pathogens (McGee, 1997; Bailey et al., 2003).
Disease-free dry bean seed is difficult to maintain in certain production areas, such as Ontario
and Manitoba, due to favorable environmental conditions for disease. Therefore, seed is
imported from areas like Idaho, where humidity levels are low and do not favour the buildup of
disease (Coyne and Schuster, 1974a; Scott and Michaels, 1992). Other management strategies
like avoidance and exclusion also help to maintain disease-free seed by preventing the spread of
seed-borne pathogens to areas where they are not yet present (Siddiqui and Vidhyasekaran, 1990;
Swings and Civerolo, 1993; Maude, 1996; Agarwal, 1997). These strategies are implemented
and supported by legislative and international regulations (e.g. European Plant Protection
Organization OEPP/EPPU), which prevent the movement of infected seed based on biological
concerns for pests that pose potential risks to countries or areas in which that pest does not
currently occur (Agarwal, 1997; McGee, 1997). In order to meet these regulations, seed
certification standards are set for seed health testing to determine and detect incidences of seed
infection and to prevent the further spread of the pathogen (McGee, 1997).
If disease-free seed is not available, eradication practices can be utilized to eliminate or
reduce seed-borne infections (McGee, 1995; Maude, 1996; Agarwal, 1997). Eradication can be
achieved through the application of chemical, physical and biological seed treatments (McGee,
7
1995). The use of chemical pesticides is the most common practice as they may control deep-
seated infections and provide seedling protection for weeks after planting (McGee, 1995). The
use of diazinon, captan, and thiophanate-methyl (DCT) has been the conventional standard seed
treatment since 1978 (Edgington and MacNeill, 1978), however new chemistries like metalaxyl,
azoxystrobin and fludioxonil are now the industry standard (McGee, 1995; MAFRI, 2012;
Gillard and Ranatunga, 2013). Various foliar pesticides are also effective in preventing and
reducing the spread of infection. Foliar pesticide efficacy varies with the pathogen species and
may require numerous applications for effective disease control throughout the growing season
(Garrett and Schwartz, 1998).
Physical and biological treatments are not commonly used in dry bean even though they can
be effective in the removal of pathogens as well. Physical treatments such as hot water, hot air,
and solar heat have been used, however, most of these are ineffective for disease control in dry
bean (Grondeau et al., 1994; McGee, 1995; Agarwal, 1997). The use of biologicals such as
saprophytic bacteria (Pseudomonas spp., Bacillus sp. and Erwinia herbicola [Pantoea
agglomerans (Beijerinck 1888) comb. nov.]) have also been tested for control of bacterial
pathogens. Although they showed some promise, they were not able to control the pathogens
effectively (Arsenijevic et al., 1998).
Finally, alterations to cultural practices can also aid in disease management strategies by
reducing the amount of initial inoculum available (Maude, 1996; Agarwal, 1997). Crop rotation
is highly effective in reducing inoculum build up by using non-host crops, which allows for the
decomposition of infected materials between the production of successive crops (Chase, 1987;
Maude, 1996; Bailey et al., 2000). The management of crop residues via incorporation, burning,
or removal also helps to decrease the viability and amount of inoculum for the upcoming seasons
8
(Chase, 1987; Bailey et al., 2000). Altering planting dates can aid in reducing crop losses by
avoiding key pathogen growth stages; for example, in tropical countries planting later can help to
avoid the rainy season and can decrease the amount of disease spread via rain splash (Maude,
1996).
Integrated pest management practices are the most effective method to manage pathogens in
dry bean production (Peshin and Dhawan, 2009). However, even with the utilization of all
available management strategies, challenges still exist for many of the seed-borne pathogens
affecting dry bean production. Three diseases in particular, common bacterial blight, halo blight
and anthracnose, can significantly affect dry bean yield and seed quality and gaps exist in the
management practices for each.
1.3 Common Bacterial Blight
1.3.1 Development & Symptomology
Xanthomonas axonopodis pv. phaseoli (Smith) Vauterin et al. (Xap) (syn. X. campestris pv.
phaseoli (Smith) Dye), the causal organism responsible for common bacterial blight (CBB) in
dry beans, occurs worldwide and can impact yield and seed quality (Coyne and Schuster, 1974b;
Saettler, 1989a). This gram negative hemibiotrophic bacteria is from the Proteobacteria family
and can be identified in culture by its yellow pigmentation (xanthomonadin) and convex, round,
mucoid colony formation (Hall, 1991).
The Xap bacterium thrives in warm climates with high humidity where the availability of free
water and temperatures of 28-32oC favor rapid disease development (Singh and Muñoz, 1999).
Under favourable conditions, the pathogen can multiply on the plant surface and infect the
foliage and pods of bean via passive movement through natural openings, such as stomata and
hydathodes, or wounds (Swings and Civerolo, 1993; Singh and Muñoz, 1999). Upon entry, the
9
bacteria multiply rapidly inside the sub-stomatal cavity forming microcolonies on top of the
mesophyll cells (Swings and Civerolo, 1993; Goodwin et al., 1995). The colonies become
surrounded by extracellular polysaccharides (EPS) that fill in the intercellular space creating
water soaked lesions (Swings and Civerolo, 1993). The water soaking of the leaves usually
occurs four to ten days after infection and later develops into larger necrotic lesions surrounded
by a small chlorotic zone, giving the host tissue a burnt appearance (Hall, 1991; Gillard et al.,
2009). Pod symptoms appear similar to leaf lesions initially and later develop into circular
lesions with a purple-brown margin and water soaked center (Hall, 1991; Swings and Civerolo,
1993). Extensive bacterial multiplication can cause the extrusion of bacterial colonies from the
stomata of severely infected plants throughout the growing season (Swings and Civerolo, 1993).
These extrusions act as a source for secondary infection by increasing the amount of inoculum
available for spread via rain, wind or aerosols (Hall, 1991).
External symptoms of infection are easily identifiable; however Xap can spread systemically
within the host as well (Weller and Saettler, 1980; Aggour et al., 1989). The systemic movement
of this pathogen allows for the colonization of plant tissues in the absence of visible symptoms,
known as a latent infection (Bozzano-Saguier, 1993; Goodwin et al., 1995). Infected seed is
identifiable by visible butter-yellow to brown discolouration of the seed which may also be
shrivelled in appearance. However, latent infections can go unnoticed at first and later produce
symptoms after planting, which can lead to the unintentional spread of the pathogen (Chase,
1987; Swings and Civerolo, 1993; Singh and Muñoz, 1999).
1.3.2 Vectors
Infected seed is the primary mode of transmission for Xap and is highly efficient, as seed lots
over fifteen years old have been shown to still have viable latent populations (Schuster and

10
Sayre, 1967). The pathogens ability to survive on seed for long periods of time may be due to the
presence of dried EPS, which help to prevent the desiccation of the bacterial cells (Leach et al.,
1957). The preservation of the bacterial cells by EPS is important for its survival from season to
season as Xap forms no spores or other resting structures and therefore relies on passive
dispersal for dissemination (Leach et al., 1957; Wilson and Lilly, 1965).
Other sources of initial inoculum have been found in infected debris and soil where crop
rotation and tillage practices are minimal (Schuster, 1967; Saettler, 1989a). The Xap pathogen
has been shown to survive for up to seven months in Wisconsin on dry crop debris allowing the
disease to survive from season to season (Saettler, 1989a; Gilbertson et al., 1990). Weeds, such
as lamb’s-quarters (Chenopodium album (L.)) and redroot pigweed (Amaranthus retroflexus
(L.)), can act as hosts for Xap allowing it to live epiphytically until favourable conditions return
(Cafati and Saettler, 1980; Chase, 1987; Saettler, 1989a). While living epiphytically on these
hosts, Xap can also be spread via aerosols, or wind and rain dispersal (Hirano and Upper, 1983).
Other dispersal methods include irrigation water, animal and human movement through infested
fields as well as on volunteer seedlings (Chase, 1987).
1.3.3 Control Measures
In order to reduce the spread and destruction of Xap within and between seasons the
previously mentioned IPM strategies can be effective. The application of antibiotics and
bactericides on seed and foliage are a popular method for control of CBB in dry bean (Howard et
al., 2000). However, few foliar treatments are highly effective and the use of antibiotics are now
prohibited in Canada due to concerns regarding the buildup of antibiotic resistance (Swings and
Civerolo, 1993; Howard et al., 2000). Prior to their ban, antibiotics such as streptomycin and
oxytetracycline were commonly used and the most effective control methods available (Taylor

11
and Dudley, 1977; Howard et al., 2000). To replace antibiotic treatments, numerous studies on
alternative seed and foliar treatments have been conducted with products such as copper sulfate
mixtures, zinc based compounds, as well as microbials (Howard et al., 2000). Studies have
demonstrated that all treatments are comparable to streptomycin application, however, each
product was unable to control CBB effectively (Howard et al., 2000).
Due to the lack of control with the above bactericides, the need for resistant cultivars is
important for the management and control of Xap (Gillard et al., 2009). Natural resistance to
CBB in dry bean has been identified in beans, however the resistant loci is tightly linked to a
gene for late maturity and is not widely used (Coyne et al., 1973). However, there are close
relatives to P. vulgaris that do possess more accessible resistance genes, such as tepary bean
(Phaseolus acutifolius A. Gray) and scarlet runner bean (Phaseolus coccineus L.) (Parker, 1985).
Phaseolus vulgaris has been interspecifically crossed with its close relatives to genetically
engineer new resistant P. vulgaris cultivars (Parker, 1985). The cultivar OAC Rex was the first
CBB-resistant navy cultivar registered in Canada and displays resistance in both pods and foliage
(Michaels et al., 2006). Cultivar OAC Rex reduces disease symptoms and allows the plant to
remain healthier and produce higher yields than non-resistant cultivars under high disease
pressure (Tar'an et al., 2001; Gillard et al., 2009). Research continues on breeding of new
resistant lines for other navy bean cultivars as well as other market classes.
1.3.4 Yield Reductions
The development and use of resistant cultivars in combination with the other control methods
mentioned above, is very important in controlling CBB, as it can severely affect dry bean yields
and seed quality. Most treatments are not highly effective in controlling CBB but still impact
yield, as studies have shown that for every 1% increase in CBB severity on leaves there is an

12
average 10 kg ha-1
loss in yield for Mexican-142, Awash-1, and brown speckled bean cultivars
(Tefera, 2006). Yield losses caused by CBB can vary based on the influence of environmental
conditions, crop growth stage, available moisture and cultivar type (Singh and Muñoz, 1999).
Research has shown that yield losses can range between 10-45% over the range of environments
for dry bean production around the world (Saettler, 1989a; Tefera, 2006; Gillard et al., 2009).
These losses can be devastating for dry bean producers and there is a clear incentive for the
development of more effective controls and resistant cultivars.
1.4 Halo Blight
1.4.1 Development & Symptomology
Pseudomonas syringae pv. phaseolicola (Burkholder) Young et al. (Psp), the causal agent of
halo blight in dry beans, is another Proteobacteria that causes damage to foliage, stems, pods,
and seed worldwide (Chase, 1987; Taylor et al., 1996). In culture, Psp appears quite similar to
Xap as it forms round, white to cream, mucoid, convex colonies (Chase, 1987; Arnold et al.,
2011). However Psp is easily distinguishable from Xap on iron-deficient media, as Pseudomonas
spp. produce the siderophore pyoverdine, a fluorescent yellow-green pigment that is visible
under ultra-violet light (Chase, 1987). Another distinguishing feature is that Psp prefers cooler
temperatures (18-22oC) and most commonly occurs in temperate areas (Chase, 1987). This
biotrophic bacterium can survive epiphytically and as a facultative saprophyte in the
phyllosphere on hosts such as Phaseolus spp., mung bean (Vigna radiat (L.) R. Wilczek), azuki
beans (Vigna angularis (Willd.) Ohwi & H. Ohashi)), and soybean (Glycine max (L.) Merr.)
(Chase, 1987; Arnold et al., 2011).
Pseudomonas spp. invade host tissues through natural openings, such as stomata, hydathodes
or wounds during periods of high humidity or when free moisture is available (Chase, 1987).

13
Initial infection usually occurs on the lower leaf surface and symptoms appear similar to those of
CBB (Chase, 1987). The pathogens can be differentiated later in infection as the halo blight
infection foci do not enlarge or become necrotic like Xap infections, instead they develop a
distinctive yellow-green chlorotic ‘halo’ around the small infection foci (Chase, 1987; Arnold et
al., 2011). This chlorosis is due to the production of phaseolotoxin, a non-specific phytotoxin,
which is released into the extracellular space of the host cells (Mitchell and Bieleski, 1977;
Chase, 1987; Arnold et al., 2011). Phaseolotoxin causes the accumulation of ornithine and the
breakdown of chlorophyll, which results in the formation of the chlorotic halo surrounding the
infection foci (Mitchell and Bieleski, 1977).
Although foliar symptoms are expressed mainly as a result of phaseolotoxin, the bacteria can
also move to the pods and cause water-soaked red to brown lesions to develop (Chase, 1987;
Agrios, 2004). These lesions may affect the pod and pod suture, which can result in the
discolouration and shrivelling of the developing seed (Chase, 1987). Infected seed commonly
have a buttery-yellow discolouration that appear similar to that seen with CBB (Arnold et al.,
2011).
1.4.2 Vectors
Seed infected with Psp occurs worldwide and can cause severe infection under conducive
environments at infection rates as low as 1% (Taylor et al., 1979b; Arnold et al., 2011). Infected
seed is the primary inoculum source for Psp and is monitored vigorously to prevent its spread to
other dry bean production areas (Chase, 1987; Maude, 1996; Agarwal, 1997). Under optimal
conditions, a bacterial ooze can develop seven to ten days after infection on both foliar and pod
lesions (Chase, 1987; Arnold et al., 2011). The bacterial ooze acts as a source of secondary
inoculum that can spread the disease to healthy plants by leaf contact, wind, and splashing of rain
14
or irrigation water (Taylor et al., 1979b; Chase, 1987). The spread of Psp between seasons occurs
through its survival on infested plant residue or seed, which can be a concern in warmer climates
(Taylor et al., 1979b; Chase, 1987; Arnold et al., 2011).
1.4.3 Control Measures
In order to control the spread of halo blight the same IPM strategies mentioned earlier for
CBB should be utilized (Chase, 1987; Maude, 1996). The seed and foliar treatments
recommended for CBB are also used in controlling halo blight, however, as with CBB, they are
not highly effective. The use of disease free seed or resistant cultivars are the most successful
control practices when available (McGee, 1997; Bailey et al., 2000). Unfortunately, obtaining
disease free seed is not always possible if environmental conditions are favourable for the
pathogen. In addition, few resistant cultivars are currently available for Psp.
The lack of available resistant cultivars is due to the variance in genes required for leaf and
pod resistance, which makes breeding for total plant resistance difficult, as with CBB (Coyne
and Schuster, 1974b). The genetic variability of Psp also makes breeding for resistance difficult
(Bozkurt and Soylu, 2011). Currently there are nine identified races of Psp, five (race 1, 2, 5, 6,
and 7) of which occur worldwide with race 6 being the most predominant (Taylor et al., 1996;
Bozkurt and Soylu, 2011). The races were identified based on their interactions with eight
differential bean cultivars. Cultivars such as Red Mexican U13 and Tendergreen were among the
first recognized sources of resistance based on their hypersensitive response to races 1 and 3,
respectively (Taylor et al., 1996). Several other resistant cultivars have been documented over
time, but none are resistant to all nine races of Psp (Arnold et al., 2011; Bozkurt and Soylu,
2011). Although breeding for total halo blight resistance is a difficult process, Psp is considered

15
a model organism for studying hypersensitive responses and research continues for a cultivar that
can decrease the impact of this devastating disease (Arnold et al., 2011).
1.4.4 Yield Reductions
The effect of halo blight on dry beans is most notable early in the season when increased
seedling death arises due to high disease pressure (Saettler, 1989b; Hall, 1991). Infected
seedlings that do survive produce the distinctive chlorosis, which can cause premature leaf drop
and result in substantial crop defoliation throughout the season (Saettler, 1989b). Yield losses of
up to 43% have been reported due to halo blight infection, with an even greater economic loss
once seed quality is taken into account (Saettler and Potter, 1970; Arnold et al., 2011).
1.5 Anthracnose
1.5.1 Development & Symptomology
The causal agent of anthracnose in dry beans is Colletotrichum lindemuthianum (Sacc. &
Magnus) Briosi & Cavara, a hemibiotrophic fungus that thrives under moderate, damp conditions
(Holliday et al., 1971; Chase, 1987). Colletotrichum lindemuthianum, the anamorph of
Glomerella lindemuthianum Shear, was first described on dry bean in France in 1843 and is
currently found in bean production areas worldwide (Schwartz and Corrales, 1989; Martínez-
Pacheco et al., 2009). Colletotrichum lindemuthianum can be identified in culture by its slow
growing, compact, grey to black hyphae and salmon coloured conidia (Holliday, 1980; Prusky et
al., 2000).
The fungus causes the greatest damage in tropical and subtropical regions as it thrives under
humid conditions with optimal temperatures between 17-25oC (Chase, 1987; Schwartz and
Corrales, 1989). However, it can tolerate cooler temperatures as well, which enables the fungus
to cause damage in temperate regions where rainfall is frequent and relative humidity is high

16
(Holliday et al., 1971). The presence of free moisture is required for numerous stages of the
infection process, especially the germination phase where the presence of moisture can cause
conidia to germinate six to nine hours after contacting the plant surface (Chase, 1987).
After germination, C. lindemuthianum releases a gelatinous substance to attach itself to the
hosts cuticle and then forms an appressoria with an infection peg, which allows the fungus to
penetrate the host cuticle via mechanical pressure created by the accumulation of melanin
(Chase, 1987; Martínez-Pacheco et al., 2009). Once inside the host, the infective hyphae
continue to grow asymptomatically for two to four days, after which the fungus will switch from
the biotrophic to necrotrophic stage and begin releasing cell wall degrading enzymes (Agrios,
2004; Martínez-Pacheco et al., 2009). The degradation of the cells causes lesions that initially
appear water-soaked and later darken. These lesions are usually first seen on the lower leaf
surface and eventually move to the stems and pods of infected plants (Holliday, 1980; Chase,
1987). Leaf lesions usually form near the petioles on veins and are elongate, angular and brick
red to purple in colour (Chase, 1987). The pod lesions can initially appear similar to those of
CBB, but are easily differentiated a few days after infection due to their sunken nature, raised
black rim and cluster of pink conidia exuded from the lesion (Holliday, 1980; Chase, 1987).
On young pods, severe infection may cause the pods to shrivel and die, while older pods can
survive, but the seed and seed coat of developing seeds are infected (Holliday et al., 1971; Chase,
1987). Infected seed is often discoloured, shrivelled and covered with yellow-brown to black
lesions. When planted, this seed can infect emerging cotyledons, which in turn develop lesions
that appear small and dark brown to black in colour (Chase, 1987; Conner et al., 2009). Conidia
from these lesions can be spread to the developing hypocotyl, where elongated rust coloured
lesions can occur. In severe seedling infections, hypocotyl rot and damping off can occur

17
(Mohammed and Sangchote, 2007). If the seedling survives, the conidia produced from these
lesions can move up the plant through leaf contact or rain splash, causing secondary infections,
which increases the amount of inoculum available (Tu, 1981; Schwartz and Corrales, 1989;
Fininsa and Tefera, 2002).
1.5.2 Vectors
The use of disease-free seed is important to prevent early season infection, which can result in
larger yield losses through a potential increase in secondary inoculum later in the growing season
(Chase, 1987; Chang, 2001). When disease-free seed is replaced with healthy looking common
seed, high infection rates can still occur as anthracnose can cause latent seed infections (Chang,
2001; Conner et al., 2006a). If seed with latent infections are planted the conidia produced from
infected seed can be locally disseminated to healthy plants by leaf contact and splashing from
rain or irrigation water throughout the growing season (Tu, 1981; Chase, 1987).
Colletotrichum lindemuthianum can also survive in infested soil and crop residues for up to
twenty-two months and has occasionally been reported to develop sclerotia (Dillard and Cobb,
1993). The fungus can spread over long distances through dispersal of conidia on infected debris
and driving rains, which have been shown to spread the disease over distances of 4.5 m (Tu,
1981; Fininsa and Tefera, 2002). However, the primary source of inoculum over long distances
is the movement of infected seed, so the use of disease free seed and resistant cultivars is
recommended (Chase, 1987; Conner et al., 2006a).
1.5.3 Control Measures
Integrated pest management strategies for controlling anthracnose include cultural controls
(tillage, crop rotation, planting alterations), chemical controls and genetic resistance to help
reduce disease incidence and severity as well as the survival of the fungus between seasons
18
(Maude, 1996). It is recommended that crop rotations with a minimum of two yea0rs between
susceptible crops be used to reduce inoculum build up and allow for the proper degradation of
infected debris by soil-borne microorganisms (Holliday, 1980; Ntahimpera et al., 1997).
Increased tillage should be practiced to bury debris, since the fungus has been reported to have
an inoculum potential 20% higher for a chisel plow, where the debris remains close to the soil
surface, than for a moldboard plow which buries the debris (Ntahimpera et al., 1997; Fininsa and
Tefera, 2002). The removal or burning of debris and alternative hosts also aids in reducing
potential hosts for inoculum build up (Chase, 1987; Maude, 1996). Cultural alterations are also
practiced within cropping seasons to decrease infection spread. Increased row spacing allows for
cultivation and the removal of weeds which increases air flow in the canopy, which can decrease
leaf wetness, making the environment less conducive for the pathogen (Chase, 1987; Hall and
Nasser, 1996). It is highly recommended to avoid cultivation during periods of leaf wetness or
high humidity, as the pathogen can be transferred onto machinery and spread throughout the crop
and to other fields (Tu, 1988; Norman and Strandberg, 1997; McMullen and Lamey, 2009).
Irrigation practices should also be closely monitored as they can increase the amount of free
water available to the pathogen and cause further spread by splashing of spores or mycelia (Tu,
1981; Chase, 1987).
When cultural practices are not sufficient to control the spread of anthracnose, chemical
controls are commonly used as a secondary measure of protection (Tu, 1996). Chemical
treatments for the control of anthracnose can be applied as seed treatments and foliar fungicides.
The use of chemical seed treatments like DCT, fludioxonil, and azoxystrobin have been reported
to reduce disease incidence and severity early in the season resulting in higher yield (Tu, 1996;
Gillard and Ranatunga, 2013). The foliar fungicides, pyraclostrobin and azoxystrobin, are

19
commonly used for the management of anthracnose by preventing disease progression and the
production of secondary inoculum throughout the season (Gillard et al., 2012b). In the past
benomyl based chemicals were effective in disease control, but were discontinued due to health
concerns (Health Canada, 2009). Altogether, foliar fungicides are effective in increasing yields,
but they are costly and require very specific application timings for the best control (Bailey et al.,
2000; Conner et al., 2004; McMullen and Lamey, 2009; Gillard et al., 2012a). Therefore, more
efficient disease management practices are required, such as the development of resistant
cultivars.
The use of resistant cultivars is the most efficient method of control for anthracnose and has
had considerable success with cultivars such as dark red kidney varieties Montcalm and
Michigan Red (Dongfang et al., 2008). However, C. lindemuthianum exhibits a very high degree
of variability and many races have been identified, which can lessen the durability of many
resistant cultivars (Melotto et al., 2000; Dongfang et al., 2008). The occurrence of new races can
lead to further problems, as they can be easily introduced into new geographic areas through
infected seed (Melotto et al., 2000). Common races that have been introduced to Canada over the
years are alpha, alpha Brazil, delta, epsilon, and kappa (Tu et al., 1984; Tu, 1988; Tu, 1994;
Dongfang et al., 2008). These races have been identified with a Greek lettering system, but this
has been replaced with a binary number system (Pastor-Corrales, 1991; Kelly and Vallejo, 2004).
The use of the new binary system is based on the differential reactions to races of twelve
differential host cultivars, which are assigned a binary value of between 1 and 2048 (Pastor-
Corrales, 1991; Kelly and Vallejo, 2004). The most recently discovered type, race 73, was
reported in 2001 in Manitoba and later in Ontario in 2003 (del Rio et al., 2003). This race is now
the predominant race in major Canadian dry bean growing areas and is a concern, as resistant

20
cultivars effective against the older races (delta, 23 and alpha-Brazil, 89) have little to no
resistance to race 73 (Dongfang et al., 2008).
In the past, breeding programs used monogenic resistance as the focus and the pathogen was
able to quickly overcome the resistant genes by developing new races (Melotto et al., 2000). The
new races displayed genetic variability for virulence as well as changes in morphology, vitamin
requirements and phenolic metabolism, making breeding for resistance against these new races
more difficult (Holliday et al., 1971). Today breeding programs are focusing on the use of
multiple resistance genes pyramided into a single cultivar to avoid the rapid breakdown of
resistance (Melotto et al., 2000; Kelly and Vallejo, 2004; Dongfang et al., 2008). This type of
breeding can extend the durability of resistant varieties, as seen with cultivar G2333, which
carries the resistant genes Co-42, Co-5 and Co-7 and is currently resistant to all known races
(Dongfang et al., 2008). Research continues on molecular genetic detection of lines with
multigenic resistance and development of resistance cultivars that focus on a more durable
approach.
1.5.4 Yield Reductions
In the absence of suitable control measures, anthracnose has been shown to substantially
reduce seed yield and quality (Conner et al., 2006a). In tropical and subtropical regions, yield
losses of up to 95% have been reported following severe infections under favorable conditions
for anthracnose (Mohammed and Sangchote, 2007). In more temperate areas like Manitoba,
yield losses of 15-30% have been reported with infections are as low as 7% (Conner et al., 2004).
The high incidence of seed discoloration associated with infected seed also impacts consumer
acceptance, which further impacts crop value (Pynenburg et al., 2011; Gillard et al., 2012a). This
pathogen is a large threat in dry bean production areas as it is a seed-borne pathogen that can
21
cause significant yield losses and can form new races rapidly. Therefore, it is an important
pathogen that requires further research for new control options.
1.6 Thermotherapy Treatment
1.6.1 Introduction
Controlling pathogens, such as those that cause CBB, halo blight, and anthracnose can be
difficult due to their seed-borne nature. The primary control measure currently recommended is
the use of disease free seed (Janse and Wenneker, 2002); however, production of this seed is
difficult in most dry bean growing areas of Canada due to high humidity. Cultural, chemical, and
genetic controls are utilized by growers to reduce disease pressure in conducive environments
(Grondeau et al., 1994; Janse and Wenneker, 2002). However, poor or inconsistent control with
these methods and the growing concerns with the hazards and costs of chemical control has led
to many studies that utilize alternative control methods (McGee, 1995; Tinivella et al., 2005). A
potential area for alternate control is the use of thermotherapy.
Thermotherapy is a century-old method defined as the application of heat to plant propagation
materials or plant parts using specific temperature-time regimes to damage or kill the pathogen
without causing significant harm to the host (Baker, 1962; Grondeau et al., 1994).
Thermotherapy is also considered an option for organic growers for seed disinfection and an
alternative to the more commonly used chemical controls (Tinivella et al., 2005). Numerous
studies have demonstrated that various thermotherapy treatments can be effective in reducing or
eliminating seed-borne pathogens in vegetables (Shiomi, 1992; Jahn et al., 2006), cereals
(Forsberg, 2004) and legumes (Grondeau et al., 1994).
Studies using thermotherapy have shown that if sufficiently high temperatures are reached,
microbes on or more importantly within the seed can be killed. (Baldi et al., 1981; Grondeau et

22
al., 1994; McGee, 1995). The ability to destroy microbes within the seed is something that
cannot be achieved with most chemical treatments. The application of heat for seed treatment has
been conducted in various forms, including hot water, hot dry air, aerated steam, hot oil soak,
microwave radiation and several other derivations of these heat treatments (Baker, 1962;
Doornik, 1992; Cavalcante and Muchovej, 1993; Grondeau et al., 1994; Grum et al., 1998;
Forsberg, 2004). The first three are the most commonly used forms of thermotherapy with hot
water treatments being the longest used. The first recorded hot water treatment was in 1887 by
Jensen for the control of loose smut in cereals (Baldi et al., 1981; Grondeau et al., 1994).
Water is an ideal treatment source as it can penetrate plant tissues, has a high capacity for
thermic change and therefore requires low temperatures and short exposure time (Baldi et al.,
1981). However, there are many disadvantages associated with this treatment, such as injury to
the seed itself through damage to the seed coat, invasion of saprophytic microorganisms during
drying and its adverse effects on germination (Baldi et al., 1981; Grondeau et al., 1994). Dry heat
has been used as an alternative to hot water, as it causes less injury to the host and does not
require prolonged drying after treatment (Baldi et al., 1981; Grondeau et al., 1994). Yet the
application of dry heat requires increased exposure time and temperatures compared to hot water
and may require rehydration for germination to occur (Grondeau et al., 1994). Aerated steam, on
the other hand, is generally the most efficacious of the three as it is able to penetrate the outer
layers of the seed like hot water, without the adverse effects on seed health and germination, and
requires shorter exposure times than dry heat (Baldi et al., 1981; Grondeau et al., 1994). The
application of aerated steam, however, requires expensive and complex equipment. (Baldi et al.,
1981; Grondeau et al., 1994). Hot oil soaks have been successful in eliminating seed-borne
pathogens without the adverse effects of hot water soaks, but it is not suitable for large scale

23
production due to its cost (Sinclair, 1993; Grondeau et al., 1994). The effect of microwave
radiation will be discussed in detail later.
The application of the aforementioned treatments, as well as the less common derivations of
them, are simple in principle, but their successful use is very dependent on seed type (Grondeau
et al., 1994; Clear et al., 2002). The optimal temperature and time exposure required for each
treatment varies for different crops and sometimes even for different cultivars within a crop
(Grondeau et al., 1994; Clear et al., 2002). The differences in the susceptibility to heat among
seed cultivars and species may be due to seed age, moisture content, vigour, dormancy period
and seed size (Baker, 1962; Grondeau et al., 1994). Therefore, preliminary testing of each crop
and cultivar is required to determine the optimal temperature-time regime as well as the
thermotherapy treatment type required for effective control of the pathogen without harming the
host (Grondeau et al., 1994; McGee, 1995).
1.6.2 Thermotherapy in Various Crops
Thermotherapy has been used for pathogen eradication from seeds for a large range of plant
species, from soybeans (Glycine max (L.) Merr.) to garden poppies (Zinnen and Sinclair, 1982;
Shiomi, 1992). For each plant-pathogen interaction the efficacy of thermotherapy varies based on
seed type, cultivar, treatment type, exposure time, temperature, and pathogen type (Baker, 1962;
Shiomi, 1992). Based on these factors, the impact of thermotherapy on the control of pathogens
and seed germination varies. Studies on these differential interactions have been conducted on
both bacterial and fungal plant pathogens (Baker, 1962; Baldi et al., 1981; Doornik, 1992).
Bacterial pathogens, such as Xanthomonas spp. and Pseudomonas spp., cause bacterial
diseases on a wide range of plant species (Grondeau et al., 1994). Their ability to cause serious
disease outbreaks, when present in as few as one in five thousand seeds, enables these pathogens

24
to have detrimental effects on crop yield (Grondeau et al., 1994). Thermotherapy has been able
to satisfactorily control these diseases in numerous crops. Black rot in Brassica oleracea caused
by Xanthomonas campestris pv. campestris (Pammel) Dowson was eliminated using hot air
treatment at 75oC for 7 days, but adverse effects on germination were observed if seed was not
pre-dried prior to heat exposure (Shiomi, 1992). Hot water soaks were recommended at 50-54oC
for 5-30 minutes for controlling bacterial diseases in Solanum lycopersicum L., Daucus carota
subsp. sativus var. atrorubens Alef., and Brassicaceae spp. with minimal effect on seed
germination (Chupp and Sherf, 1960; Janse and Wenneker, 2002). This same type of treatment
was also recommended for control of fungal diseases of Allium cepa L., Pisum sativum L., and
Solanum tuberosum L. (Chupp and Sherf, 1960; Janse and Wenneker, 2002).
Thermotherapy is effective in controlling the fungal species Fusarium graminearum Schwabe
in barley (Hordeum vulgare L.) and wheat (Triticum spp.) seed using dry air at 60oC for 21 and
15 days, respectively, and Fusarium culmorum (W.G. Smith) Sacc. in winter wheat using dry air
at 60-65oC for 30 min (Hoersten, 1996; Clear et al., 2002). The efficacy of a hot water treatment
on F. culmorum in winter wheat has also been tested and caused the destruction of the pathogen
between 48-55oC without resulting in heat damage to the seed (Hoersten, 1996). The use of
aerated steam was evaluated to treat large batches of cereal crops, using a process of heat and
moisture transfer that was specific to individual seed lots, but was unable to effectively eradicate
deep seated pathogens (Forsberg, 2004). Thermotherapy for the control of fungi has been
particularly successful in cereal crops, as well as in several vegetable crops, poppies, and
soybean. Various temperature-time combinations were utilized for optimal disease control, while
maintaining high seed germination rates (Zinnen and Sinclair, 1982; Grondeau et al., 1994; Jahn
et al., 2006). Treatments such as a hot water soak, a hot oil soak, a carbon tetrachloride soak, a

25
polyethylene glycol soak and an electron treatment are a few of the treatments currently used for
various fungal diseases (Grondeau et al., 1994; McGee, 1995).
The control of Colletotrichum spp. using thermotherapy has been observed in lupins (Lupinus
angustifolius L.) and Anemone spp. corms using hot air and hot water treatments, respectively
(Doornik, 1992; Thomas and Adcock, 2004). The pathogen Colletotrichum acutatum J. H.
Simmonds, which causes leaf curl and necrosis in poppy, is almost completely suppressed using
a hot water treatment at 50oC for 1 h or 47.5
oC for 1.5 h (Doornik, 1992). This treatment had a
slight effect on corm germination, but this problem could be rectified if corms were stored for
four days in moist vermiculite at 20oC between treatment and planting. The use of a dry heat
treatment to control C. acutatum was also tested, however results were inconsistent (Doornik,
1992). Dry heat was successful for treating Lupinis spp. seed infected with Colletotrichum lupini
(Bonden) Nivenberg, Feilert Hagedorn comb. nov. (Thomas and Adcock, 2004). Various
exposure times and temperatures were successful in reducing C. lupini, however the only times
that germination was not affected was at 60oC for seven days or 65
oC for four days (Thomas and
Adcock, 2004). Variable results were seen in different seed lots.
1.6.3 Thermotherapy in Dry Beans
Although there have been many successful uses of thermotherapy on numerous crops, there
has been limited success in dry bean. The control of CBB and halo blight has been limited due to
issues with seed germination and little research has been conducted on the control of anthracnose
(Grondeau et al., 1994). The use of thermotherapy on large seeded legumes such as dry bean, to
control fungal and bacterial pathogens is difficult due to the similar heat tolerance ranges of the
pathogen and the host seed (Grondeau et al., 1994; Hoersten, 1996; Reddy et al., 1998). In an
experiment on P. vulgaris, temperatures above 90oC were lethal for dry bean seed, while

26
temperatures between 60-80oC for various time periods did not affect germination (Baldi et al.,
1981). Therefore, a pathogen must be sensitive to a specific temperature-time regime that does
not result in a significant loss in germination before satisfactory control of the pathogen is
obtained.
Dry bean seed can also be adversely affected by the presence of increased moisture, as was
seen with hot water treatments. When immersed in hot water, the seed quickly imbibes water,
causing the seed to swell and slough off its seed coat (Sinclair, 1993). The use of vegetable oil
was recommended in place of water to eliminate the sloughing of seed coats and the imbibing of
water (Sinclair, 1993; McGee, 1995). The concept of soaking dry beans in vegetable oil was
utilized in a study in Ethiopia and CBB was reduced by 60% when seed was soaked at 65oC for
seven minutes in one out of two years of the study, however, no significant advantages for
disease development, yield, or seed quality were noted in that year (Fininsa and Tefera, 2001).
The use of low seed moisture is another property that decreases the adverse effects of
thermotherapy treatments on dry beans. Moisture content has been shown to be closely
correlated with seed germination and low moisture can minimize the adverse effects of
thermotherapy on germination (McGee, 1995). The need to establish inoculum transmission
thresholds is also required for more pathogens to enable more practical disease control in the
field. Pseudomonas syringae pv. phaseolicola is one of the few pathogens for which such
information is available, where the presence of 12 infected seeds per acre can cause a severe
epidemic (Walker and Patel, 1964; McGee, 1995).
In reviewing the use of thermotherapy, several experiments utilizing hot water or hot air
alone, have been found to not sufficiently control CBB or halo blight in bean seed under varying
temperature time regimes (Grondeau et al., 1994). Other studies using techniques such as

27
electrotherapy and electrostatic treatment to control viruses and increase seed health in dry bean
have also demonstrated poorer efficacy than desired (Morar et al., 1999; Hormozi-Nejad et al.,
2011). Therefore, the use of a two-step process using dry heat was tested for treating both the
seed and the meristem tissue of plants infected with CBB and halo blight (Grum et al., 1998).
This method was successful in eradicating the pathogens from the seed as well as the meristem
tissues; however, this is not practical at a commercial level (Grum et al., 1998).
The success of thermotherapy for controlling or eradicating seed-borne diseases of dry bean is
still lacking. Even though several studies concerning CBB and halo blight have been conducted,
few have had success on a large scale (Grondeau et al., 1994). The dearth of information on the
control of dry bean anthracnose using thermotherapy is also surprising, as success has been noted
for other crops infected by Colletotrichum spp. (Doornik, 1992; Thomas and Adcock, 2004).
Therefore an investigation into a more promising thermotherapy technique like microwave
radiation is required for these seed-borne diseases.
1.6.4 Microwave Radiation
Microwave radiation has been utilized for control of pests in food processing, crop storage,
and seed production (Spilde, 1989; Bouraoui et al., 1993; Cunha et al., 1993; Adu and Otten,
1996). Microwave radiation is believed to use heat as the lethal mode of action for controlling
pathogens (Grondeau et al., 1994; Reddy et al., 1998). It has been suggested that radiation may
disrupt the microbial cells directly, although this has not been confirmed (Copson, 1975; Hankin
and Sands, 1977; Yoshida and Kajimoto, 1988). Although the mode of action is unclear,
microwave radiation shows promise as an alternative to other thermotherapy methods. Benefits
such as earlier germination and increased vigour have been noted in previous studies (Van
Assche and Leuven, 1987; Van Biervliet, 1987; Spilde, 1989; Tylkowska et al., 2010).

28
Another beneficial characteristic of microwave radiation is the short exposure time required
for treatment, due to its ability to rapidly generate heat (Adu et al., 1995). Thermal energy in
microwave radiation is produced through dielectric heating (Copson, 1975). Dielectric heating is
the process in which high-frequency alternating electromagnetic radiation (EMR), 300 MHz-300
GHz, heats a dielectric material using two major mechanisms, namely dipole rotation and ionic
polarization (Bouraoui et al., 1993). Dielectric materials are materials that can become polarized
and are able to store electric energy when exposed to EMR (Adu et al., 1995). These materials
tend to act as insulators, where charges do not flow through the material, but rather are stored
and rearranged to align with the rapidly changing electric field (Copson, 1975). It is through the
rearrangement of the dipoles which causes friction to produce heat and is then transferred
between molecules, warming the material thoroughly (Bouraoui et al., 1993).
The production of heat through dielectric heating is highly dependent on the dielectric
permittivities of the materials involved (Nelson, 1996; Jiao et al., 2011). Permittivity is defined
as how an electric field affects, and is affected by, a dielectric material and is expressed as a
complex quantity with a real and an imaginary part (Nelson, 1996). The real part is associated
with the materials capability to store electric energy and the imaginary part is associated with the
dissipation of electric energy, which is converted to heat energy in the material. Permittivity is a
function of the materials moisture content (MC), temperature, bulk density, and the frequency of
the electric field applied (Nelson, 1996; Berbert et al., 2002; Jiao et al., 2011). Relative
permittivity was positively correlated with MC of dry bean seed at various frequencies (Berbert
et al., 2002). The imaginary part of permittivity, also referred to as dielectric loss or heat
production, was also positively correlated with MC (Berbert et al., 2002). This can be a deterrent
to utilizing microwave radiation for the treatment of seed-borne pathogens, as overheating of
29
seed can have adverse effects on seed germination (Berbert et al., 2002; Han, 2010). In order to
utilize heat treatments like microwave radiation, specific time-temperature regimes, similar to
those used for hot water treatments, are still required to sufficiently harm/kill the pathogen
without overheating the seed itself (Grondeau et al., 1994).
Numerous studies have tried to determine the optimum time-temperature regimes for
microwave radiation on various seed types to eliminate pathogens and to improve seed
germination and vigour. The use of microwave radiation of true seed of cassava (Manihot
esculenta Crantz) infected with Xanthomonas campestris pv. manihotis, Fusarium spp.,
Cladosporium spp., and Colletotrichum spp. was shown to control these pathogens when
temperatures reached 77 o
C after 120 seconds of exposure at 1400 W, 2450 MHz (Lozano et al.,
1986) . The use of various power settings, exposure times, and seed moistures were tested on
wheat seed to control F. graminearum Schwabe. Infection was reduced from 36% to 7% , while
seed quality, (85% germination and 80% vigour) was maintained (Reddy et al., 1998).
The use of microwave radiation on winter wheat has been compared to the traditional hot
water and hot air treatments for the eradication F. culmorum (W.G. Smith) Sacc. (Hoersten,
1996). In this comparison, microwave treatment alone was the only treatment that did not
eradicate the pathogen completely (Hoersten, 1996). However, with the addition of steam to the
microwave treatment, the pathogen was controlled at lower temperatures than hot water and this
process was three times faster than the hot air treatment in a closed system (Hoersten, 1996).
Microwave radiation has also successfully eradicated Erwinia carotovora var. carotovora
(Jones) Dye from tobacco (Nicotiana tobacum L.) seed after twenty minutes of microwave
radiation (Hankin and Sands, 1977). This success led to the testing of other seed types, but after
two minutes of irradiation, seed germination was reduced to 10% in cabbage and to 0% in bean

30
seed (Hankin and Sands, 1977). From this, a relationship between seed size and microwave
tolerance was formed (Hankin and Sands, 1977). It appeared that large seeds are unable to
tolerate long exposure times due to their inability to radiate heat away from seed during
treatment.
Expanding on the previous research on microwave radiation, the tolerance of navy bean was
further tested with exposures at three intensities for various time periods (Spilde, 1989). It was
determined that when seed was exposed to temperatures between 48-52oC, germination increased
significantly (6-10%). However at temperatures over 68oC significant seed damage occurred
(Spilde, 1989). Increases in microwave power, from 32 to 500 W, also resulted in significant
decreases in germination when temperatures rose above 32oC. Further tests on the use of
microwave radiation on dry bean was conducted on seed infected with Alternaria alternata (Fr.)
Keissl., Fusarium spp. and Penicillium spp. (Tylkowska et al., 2010). When exposed to 650 W,
2450 MHz, dry bean seeds were able to tolerate 120 seconds of microwave exposure with no
adverse effects on germination or vigour (Tylkowska et al., 2010). Microwave radiation
significantly decreased the presence of Penicillium spp., but was unable to control A. alternata
and Fusarium spp. (Tylkowska et al., 2010). Other studies have shown contrary results for
Fusarium spp. (Lozano et al., 1986; Reddy et al., 1998). The difference in results may be
attributed to differences in methodology and location of the inoculum in the seed (Tylkowska et
al., 2010).
The placement and morphology of the inoculum may play a large role in the efficacy of
microwave radiation on seed-borne pathogens (Cavalcante and Muchovej, 1993; Tylkowska et
al., 2010). It has been demonstrated that fungal spores react differently to microwave radiation
based on cell composition (Cavalcante and Muchovej, 1993). Pathogens that produce hyaline

31
single-celled spores, like C. lindemuthianum, are believed to be more sensitive to microwave
radiation than those that produce multi-celled or dark pigmented spores, (Fusarium oxysporum
Schlecht and Bipolaris sorokiniana (Sacc.) Shoemaker, respectively) (Tylkowska et al., 2010).
Previous research on C. lindemuthianum and Psp in dry bean showed no control as the inoculum
was applied artificially and did not produce disease symptoms even on the control treatments
(Van Biervliet, 1987). Further research into this topic is required to confirm the implications on
the control of anthracnose and the effect of pathogen placement on the seed.
For dry beans, microwave treatment appears to have less of an adverse impact on seed
germination and vigour than other thermotherapy methods. Previous studies on the control of
seed-borne disease indicate that microwave radiation is capable of reducing or eliminating
pathogens if a suitable temperature-time regime can be developed for the host-pathogen
relationship.
1.7 Chemical Treatment
1.7.1 Introduction
Chemical treatments for the control of seed-borne diseases in dry bean are commonly utilized
when ‘disease free’ seed has latent infections or is unavailable. Despite concerns regarding the
hazards of chemical control, pesticides are currently one of the most effective management
strategies available for the control of seed-borne diseases (McGee, 1995). Several pesticides
provide broad spectrum control and can affect pathogens in multiple ways (Agrios, 2004). Other
pesticides provide a narrow spectrum of control on a specific metabolic site or enzyme that is
affected directly (Agrios, 2004). Both types of pesticides can be applied as seed or foliar
treatments.
32
Seed treatments protect seeds from pathogens in, on or around the seed and aid in germination
and seedling growth. Foliar pesticides are applied after emergence and are used to suppress
disease symptoms that have developed from infected seed or secondary infection (Conner et al.,
2004). Currently there are few pesticides that are highly effective for the control of CBB and
halo blight, while there is little diversity in mode of action of pesticides currently recommended
for the control of anthracnose in dry bean. However, several pesticides have been reported to
suppress disease symptoms and reduce losses in yield and seed quality when applied as seed
treatments, foliarly, or in combination (Gillard et al., 2012a).
1.7.2 Seed Treatment
Seed treatments are utilized for many soil- and seed-borne diseases. Numerous seed
treatments are currently available to protect dry bean seed from a broad range of pathogens, such
as those that cause seed rot, pre- and post-emergent damping off, and root rot (MAFRI, 2012).
However, the spectrum and efficacy of seed treatments is limited for the control of CBB, halo
blight, and anthracnose (Howard et al., 2000; Gillard et al., 2012a).
The use of seed treatments to control bacterial blights in dry bean over the last three decades
has mainly consisted of the use of antibiotics such as streptomycin or copper-based products
(Howard et al., 2000). The use of agricultural streptomycin sulfate was a standard seed treatment
on dry beans in the late 1980’s to the late 1990’s for seed imported into Canada from the US
(Howard et al., 2000). Streptomycin is effective in suppressing bacterial growth through the
inhibition of protein synthesis in the bacterial ribosomes, eventually causing cell death (MAFRI,
2012). However streptomycin was not fully registered in Canada as a seed treatment and
eventually the importation of seed treated with antibiotics was banned due to antibiotic resistance
concerns (Howard et al., 2000). Kasugamycin was another antibiotic tested in the late 1970’s and

33
was effective in reducing bacterial infection by up to 98%, but was never registered for use in
Canada (Taylor and Dudley, 1977; Taylor et al., 1979b).
Copper based products have been commonly used since the early 1970’s and are available in
various formulations, such as copper sulphate (CuSO4), cupric hydroxide, tribasic copper
sulphate, and copper oxychloride (Howard et al., 2000). CuSO4 was as effective as streptomycin
treatment, but both products were only able to suppress the disease (Howard et al., 2000).
Currently registered copper based seed treatments consist of between 35-50% copper hydroxide
and can suppress bacterial growth when copper is in a “free” or “ionic” state (Ritchie, 2004;
MAFRI, 2012). The “ionic” state of copper is very reactive and allows it to bind and kill bacteria
at multiple contact sites (Ritchie, 2004). The reactivity of copper is ideal for suppressing
bacteria; however, it can have phytotoxic effects on the host plant if the pH of the water in
contact with the copper is very acidic. Other inorganic compounds like zinc based products, seed
coat polymers, and micronutrient based products have been tested, but they were generally
ineffective for the control of bacterial blights in dry bean (Howard et al., 2000).
The use of fungicide seed treatments for the control of seed-borne anthracnose in dry beans
was implemented over thirty-five years ago when the use of DCT (diazinon, captan, and
thiophanate-methyl) was first introduced to Ontario (Edgington and MacNeill, 1978). The active
ingredient, thiophanate-methyl, is able to control the pathogen C. lindemuthianum by binding to
tubulin, which then inhibits the fungus from completing mitosis and cell division (Clemons and
Sisler, 1971; Tu, 1996). Although DCT is effective in controlling anthracnose, it has slowly been
phased out in the last ten years due to lack of control of soil pathogens (Conner et al., 2004).
To replace DCT, products like Vitaflo 280 (carbathiin and thiram, Bayer CropScience,
Guelph, ON), Apron Maxx (metalaxyl-M and fludioxonil, Syngenta Crop Production Inc.,

34
Guelph, ON) and FMA (fludioxonil, metalaxyl-M, and azoxystrobin, Syngenta Crop Production
Inc., Guelph, ON) have been tested (Gillard and Ranatunga, 2013). Vitaflo 280, which affects
pathogen respiration and has multisite contact effects on anthracnose, decreased leaf infection
similarly to DCT and improved plant emergence under low disease pressure, however control
under high disease pressure was insufficient (Matus et al., 2004; MAFRI, 2012). When Apron
Maxx, a signal transduction inhibiting fungicide, was compared with DCT, DCT provided
superior disease control on both leaf and pod tissue (Gillard et al., 2012a). The FMA treatment
was the most comparable to DCT for anthracnose control and has currently become the dominant
product in the market place, based on efficacy and ease of use (Gillard and Ranatunga, 2013).
The FMA product controls anthracnose through the inhibition of signal transduction
(fludioxonil) and respiration (azoxystrobin) in the fungal cells (MAFRI, 2012). However, there
are growing concerns about applying strobilurins such as azoxystrobin, as seed treatments, since
they are currently used for foliar treatment. With continuous use, this could lead to a buildup in
insensitivity of the pathogen to this fungicide group (Gillard and Ranatunga, 2013).
1.7.3 Foliar Treatment
Foliar pesticides are important for the season long control of CBB, halo blight and
anthracnose when disease develops on infected plants, as well as for the control of secondary
infections. Pesticides increase seed quality and yield when applied at the early- to mid-flowering
stage. Despite continued research on application timing, few foliar pesticides completely control
these seed-borne diseases (Garrett and Schwartz, 1998; Conner et al., 2004).
For the foliar control of bacterial blights in dry bean, only streptomycin and copper products
are effective. Since streptomycin is banned in Canada, copper products are primarily used for
foliar applications (Howard et al., 2000). These products have the same formulation as in the
35
seed treatments and require continuous application throughout flowering to suppress disease.
Under certain conditions they have little effect on pod infection and no clear benefit for yield
(Weller and Saettler, 1976; Saettler, 1989a). Other inorganic products like potassium and
sulphate have been tested, but they have demonstrated poor efficacy in the control of bacterial
blights in dry bean (Weller and Saettler, 1976; Schwartz and Pastor-Corrales, 1989).
Foliar control of anthracnose in dry beans is currently limited to the strobilurin fungicide
group, including azoxystrobin and pyraclostrobin (Bartlett et al., 2002). Strobilurins control
anthracnose through the inhibition of respiration in fungal cells, and can increase yields by 15-
60% (Oliveira, 2003; Conner et al., 2004; Gillard et al., 2012b). The sequential application of
pyraclostrobin at 40 and 80% bloom has been the most effective timing for decreasing seed
discolouration and leaf and pod disease severity, resulting in increased yields (Conner et al.,
2004). Azoxystrobin also reduces disease severity and seed discolouration, however not as
effectively as pyraclostrobin (Pynenburg et al., 2011; Gillard and Ranatunga, 2013).
Overall, copper and strobilurin foliar treatments for bacterial blights and anthracnose,
respectively, have been shown to decrease disease severity, but not eradicate the disease
completely. The use of these modes of action (MOA) as a foliar treatment is of concern as the
same MOA are being utilized in seed treatments as well (Pynenburg et al., 2011; Gillard et al.,
2012a). The overlap of these MOA’s in seed and foliar treatment raises risks of the buildup of
pesticide resistance in these pathogens, which could eventually leave the few available control
options ineffective.

36
1.8 Economics
1.8.1 Dry Bean Prices & Yield
The overall cost of production must be considered for disease management in a dry bean crop.
Input costs such as fertilizer, herbicides, and pesticides need to be evaluated based on the
economic return a grower may expect in a typical growing season. Factors such as price and
expected yields will also play a large part in this decision. The export demand for dry bean is
high in Canada, which provides good pricing opportunities for growers (FAOSTAT, 2012).
The demand for dry bean production and increased prices for competing crops (corn, soybean,
wheat and canola) is positive for growers and is reflected in the increased average wholesale
prices for dry beans over the last ten years. Navy beans have averaged $30 per hundred weight
(cwt) in the last ten years with 2012 prices increasing to $38 per cwt (Barkley, J., pers. comm.,
Agricorp, 2013). For all market classes, the wholesale price for dry beans in the last ten years has
increased. The increased profit potential in dry bean impacts the level of inputs growers will
consider in order to obtain a higher yield potential and quality for their crop.
1.8.2 Net Yield & Economic Return
Pesticides and other management strategies are needed to maintain a healthy crop to
maximize profit potential in dry bean. The control of diseases in dry beans plays a large role in
crop health, yield and seed quality, which can be seen with the yield increases of up to 32% in
anthracnose infected fields and 43% in CBB and halo blight infected fields when chemical or
thermotherapy treatments were used to control these seed-borne diseases (Saettler, 1989a;
Conner et al., 2004; Arnold et al., 2011; Gillard et al., 2012a; Gillard et al., 2012b). However, the
economic returns from these treatments need to be taken into account when making pest
management decisions, especially under low disease pressure.

37
Factors such as pathogen type, disease pressure, and crop tolerance can influence the
economic return obtained from a particular input. The application of seed treatments is an input
that is usually recommended for all dry bean seed for protection against seed- and soil-borne
organisms, whereas foliar chemical treatments are not always necessary. Foliar treatments are
more dependent on environmental conditions and require further investigation before
application. Economic returns can be increased when continuous field scouting, monitoring of
environmental conditions, and assessment of the economic threshold are carried out in order to
determine what chemical controls are required and the timing of application (Pedigo, 1998).
However, the economic thresholds for many pathogens are still unknown, which makes
management decision difficult for many diseases.
To determine the effect an input can have on a dry bean crop the following formula can be
used to determine the return on investment (ROI) (Gillard and Ranatunga, 2013):
ROI = (((Seed Yield – Dockage – 2(Pick)) * Price kg-1
)
– Pesticide Cost – Pesticide Application Cost
This equation does not account for some production costs, such as cultivation, fertilizer, seeding
materials and equipment, or harvesting equipment, as these are considered fixed costs. It does
take into account moisture, dockage and seed pick, which are used to adjust net yield (Pynenburg
et al., 2011) Moisture is adjusted to 18% for net yield using the moisture conversion formula:
Dockage includes material or seed below the standard quality and split seed (Canadian Grains
Commission, 2010). Seed pick is the estimated percentage of infected or discoloured seed in a
representative sample. Seed pick is removed twice to account for the weight of discoloured seed
and the cost for removing infected seed. Once dock and pick are removed, net yield is converted
100 – wet moisture = dry weight
100 – dry moisture wet weight

38
to kg ha-1
and multiplied by the market price, which is estimated based on crop wholesale values
for that season (Gillard and Ranatunga, 2013). After calculating the crop value, the variable costs
of the pesticide, surfactant and pesticide application are subtracted in order to determine
economic return.
1.8.3 Pesticide & Pesticide Application Costs
The cost of pesticides and their application to control pathogens is an important factor for
determining the economic return in dry bean production. In calculating the return on investment,
the cost of the pesticide as well as the required surfactants and application costs must be
considered. The cost of the pesticides and surfactants are determined using the manufacturer
suggested retail price (MSRP), which for foliar treatments like pyraclostrobin or azoxystrobin
can range from $43.24 to $52.74 per hectare, respectively (Wright, H., pers. comm., Agricorp,
2013). The MSRP for seed treatments such as DCT or FMA, which increase yield by an average
of 25%, can cost $61.87 ha-1
(Gillard and Ranatunga, 2013; Wright, H., pers. comm., Agricorp,
2013). The application costs are estimated using averages from custom framework rates and
average around $25 per hectare for ground application (OMAFRA, 2011; Gillard and Ranatunga,
2013). Therefore, when selecting management strategies and input requirement, the demand,
wholesale price and overall return on investment needs to be considered in order to grow and
maintain a profitable dry bean crop.
1.9 Research Proposal
1.9.1 Hypothesis
Dry bean production in Canada is most common in the provinces of Ontario and Manitoba;
however the environmental conditions in both provinces are highly conducive to the spread of
seed-borne diseases, which can lower yields and seed quality. The use of a chemical treatment as

39
both seed and foliar treatments is common for the control of seed-borne diseases in dry beans.
However, the overlapping use of copper based pesticides and strobilurin fungicides on bacterial
blights and anthracnose, respectively, as a seed treatment and a foliar treatment raises concerns
due to the buildup of resistance of the pathogens to the pesticides. Alternative types of seed
treatment, like thermotherapy, have been reported to reduce decrease disease pressure in
numerous crops and we hypothesize that microwave radiation can reduce or eliminate seed-borne
pathogens from dry bean without causing harm to the seed itself.
1.9.2 Objective & Justification
The objective of this study is to determine if microwave radiation can reduce or eliminate
seed-borne diseases in dry beans without affecting seed germination and vigour. The efficacy of
microwave treatment will be tested with and without the use of chemical treatment to determine
if there is increased control when treatments are applied in combination. The economic benefit of
the microwave treatment will also be evaluated as well as the practicality of this type of
treatment for seed producers. If this treatment is successful it could provide a new pillar of
control for seed-borne diseases and an alternative for organic growers.
40
CHAPTER TWO
Effect of microwave radiation on dry bean seed infected with Xanthomonas axonopodis pv.
phaseoli with and without the use of chemical seed treatment
2.1 Abstract
Common bacterial blight (Xanthomonas axonopodis pv. phaseoli) is a seed-borne pathogen that
is difficult to control in dry bean (Phaseolus vulgaris L.). Laboratory and field studies were
conducted over a two-year period to determine the effect of microwave radiation on navy (cv.
Navigator and Envoy) and pinto (cv. AC Ole) bean. Laboratory tests resulted in a 12-25%
decrease in germination following 50-60 s of radiation, while less than a 10% loss was observed
between 0-40 s. Pathogen viability was also tested, however the incidence of pathogen infection
was low and no correlation was observed between exposure time and the incidence of
colonization. In field studies conducted at Morden, MB (2012) and Ridgetown and Exeter, ON
(2012-2013) microwave radiation and two chemical seed treatments (copper hydroxide 53.8%
and pyraclostrobin + fluxapyroxad + metalaxyl) were evaluated for their effect on emergence,
disease infection, seed pick, yield and return on investment. The application of microwave
treatment decreased emergence up to 7%, but did not impact the other parameters measured.
Chemical treatment alone or in combination with microwave treatment also did not affect
emergence, disease incidence, yield, seed pick, or return on investment.
2.2 Introduction
Xanthomonas axonopodis pv. phaseoli (Smith) Vauterin et al. (Xap) (syn. X. campestris pv.
phaseoli (Smith) Dye) is the causal agent of common bacterial blight (CBB) in dry bean
(Phaseolus vulgaris L.). Common bacterial blight is easily spread from infected seed and is the

41
number one foliar disease of dry bean in Canada (Bailey et al., 2003). Symptoms first appear as
water soaked spots on the leaves, which develop into necrotic lesions surrounded by a chlorotic
border (Hall, 1991). Infection can move to the pods in environments with high humidity and
temperature. Pod lesions initially appear water soaked and become slightly sunken with a brick-
red border (Schwartz et al., 2005). Severe pod lesions can infect the developing seed and cause
shrivelling and a butter-yellow discolouration (Swings and Civerolo, 1993).
Infected seed is the primary inoculum source for CBB and the use of disease-free seed is an
important management strategy to control its spread (Bailey et al., 2003; Schwartz et al., 2005).
In Canada, seed production areas experience frequent rainfall and high humidity, which typically
results in infected seed lots (Gillard et al., 2009). Therefore, seed has to be obtained from
production areas with less conducive environments for foliar disease, such as Idaho. The
transportation of seed from these production areas can be costly, particularly for eastern
Canadian growers (Coyne and Schuster, 1974a). Other strategies have been developed to reduce
CBB, such as the use of cultural (Hall and Nasser, 1996), chemical (Fininsa, 2003), antibiotic
(Howard et al., 2000), and genetic controls (Michaels et al., 2006). Despite these practices, CBB
is often not completely controlled. The development of resistant cultivars is ongoing and the use
of cultivars, such as OAC Rex, has become a primary method of control for CBB. The
development of resistant cultivars continues in navy bean and other market classes. Developing
such cultivars, however, can be difficult as resistance to CBB is a quantitative trait and is
affected by multiple genes, traits, and environmental conditions (St. Clair, 2010).
The use of bactericides applied foliarly and as seed treatments was used to control CBB in
Canada, but the use of antibiotics is now prohibited (Howard et al., 2000). Copper hydroxide
(Cu(OH)2) has become the current industry standard for controlling numerous bacterial blights.

42
However, this product is more efficacious as a foliar spray than as a seed treatment (Fininsa and
Tefera, 2001). Alternative seed treatment methods have also been investigated in order to control
CBB, including the use of thermotherapy (Grondeau et al., 1994).
Thermotherapy has been used to effectively manage various pathogens in many cropping
systems through the use of hot liquid soaks (either oil or water), hot dry air, and steam treatment
(Sinclair, 1993; Grondeau et al., 1994; McGee, 1995; Forsberg, 2004). These thermotherapy
treatments have been less successful in dry bean, due to seed health issues (Spilde, 1989;
Sinclair, 1993). The use of microwave radiation, however, has been shown to have minimal
effect on dry bean seed germination and vigour (Tylkowska et al., 2010). Microwave radiation
has also controlled numerous bacterial and fungal pathogens in tobacco (Nicotiana tabacum
‘Consolidated L.’), Triticum spp., cassava true seed (Manihot esculenta Crantz), and soybean
(Glycine max L.) (Hankin and Sands, 1977; Cavalcante and Muchovej, 1993; Han, 2010; Knox
et al., 2013). In dry bean, the presence of the fungal pathogen Penicillium spp. decreased after
short intervals of radiation (Tylkowska et al., 2010), but its effect on bacterial pathogens was not
tested.
Microwave radiation may be a low cost addition or an alternative to current chemical
treatments, to reduce or eliminate seed-borne pathogens, without affecting seed germination. In
order to determine the benefit of such a treatment, laboratory and field studies were conducted to
evaluate the efficacy of microwave radiation (Tylkowska et al., 2010) using seed naturally
infected with Xap for both navy and pinto seed lots. These seed classes were chosen as they are
common in dry bean production areas of Manitoba and Ontario and few CBB resistant cultivars
are available. The studies were organized to determine the effect of microwave radiation on seed
germination and vigour as well as its effect on Xap viability in the laboratory and field.

43
2.3 Materials & Methods
2.3.1 Laboratory Study
Thermotherapy studies were conducted over a two-year period (2012-2013) using a
randomized complete block design (RCBD) to determine the effect of microwave radiation on
dry bean seed naturally infected with Xap in navy (cv. Navigator in 2012 and cv. Envoy in 2013)
and pinto (cv. AC Ole) bean. Seed was obtained from field trials in 2011 in Morden, MB and
2012 in Exeter, ON for the 2012 and 2013 laboratory studies, respectively. Seed was collected
from plots with foliar disease ratings of 15-25% to ensure high disease pressure. Seed moisture
was assessed using a Fisher Scientific Isotemp Forced Air Oven (120 V, 60 Hz, 1800 w, 15.5 A)
to dry down seed to a uniform moisture. For the seed used in navy bean and the 2012 pinto bean
experiments, the seed moisture ranged between 7.1-8.6% moisture, while the seed for the 2013
pinto bean experiments was 10.3%. A microwave oven (1100W 2450 MHz, General Electric
Co., Fairfield, Connecticut, U.S.) was used to treat four replicates of each seed lot with ten
microwave exposure times ranging from 0-90 s, in 10 s increments. To determine the
temperature change due to microwave radiation, a 450-500 ml beaker containing 200 ml of water
was placed in the center of the microwave oven on a paper plate and the water temperature was
measured before and after the microwave treatment. Each plate contained 150 seeds, which were
evenly spread around the beaker in a single layer.
To determine the effect of microwave radiation on germination, 100 seeds from each
experimental unit were planted into 50 WG 60 Wellpak silica sand (B.P. Dust Control, Walton,
ON) in 21.6 cm x 13.0 cm x 10.2 cm plastic clam lid containers (Par-Pak Ltd., Brampton, ON) .
The containers were incubated for 6-7 days in a germination chamber set at 25oC with a 12L:12D
photoperiod and a relative humidity (RH) above 60%. To evaluate germination, the Canadian

44
Food Inspection Agency’s (CFIA) methods and procedures for testing seed were used (CFIA,
2011). At the end of the study, the total dry weight of germinated plant matter was recorded from
each container as an assessment of plant vigour.
In 2012, an experiment with four replicates was conducted to evaluate seed colonization
through plating on potato dextrose agar (PDA) following different lengths of exposure to
microwave radiation. Before plating, the seed was surface-sterilized in a 10% sodium
hypochlorite solution for 2 min. A total of 50 seeds were distributed evenly over ten 100 x 15
mm petri plates (Fisher Scientific Company, Ottawa, ON) and left to germinate for a minimum
of 7 d at room temperature. Seed was then evaluated for percentage of seed with visible bacterial
colonization and the percent germination.
2.3.2 Field Study
Over a two-year period, two field trials per site were conducted in Morden, MB (2012) and
Exeter and Ridgetown, ON (2012- 2013). At all sites, a randomized complete block design
(RCBD) with four replications was used to arrange a total of ten treatments (Table 2.1). Seed lots
from the laboratory studies were used for the field studies, except for the Exeter navy bean trial
in 2012. At that site, the cv. Envoy was used, due to lack of infected Navigator seed. Disease-
free seed for the non-infected controls (NICs) was obtained from the Archer Daniels Midland
Company (New Plymouth, Idaho) for cv. Navigator, Gentec Seeds Inc. (Twin Falls, Idaho) for
cv. Envoy and disease-free seed increase plots in Morden for pinto bean.
From the germination results in the laboratory studies, a non-linear regression was used to
determine a maximum exposure rate (MER), a point in time in which a less than 10% loss in
germination was noted. This loss was considered an acceptable loss for infected seed, as there
are few treatments currently available that effectively control Xap. The full MER was set as the

45
1x Microwave treatment and half the MER was used for the ½x Microwave treatment. These
microwave treatments were assessed alone and in combination with two chemical treatments;
pyraclostrobin + fluxapyroxad + metalaxyl (PFM) (BASF Canada, Mississauga, ON), at 14.0 g
a.i. per 100 kg of seed and a 53.8% copper hydroxide treatment or Cu(OH)2 (Kocide 2000, E.I.
du Pont Canada Company, Mississauga, ON), at 30.4 g a.i. per 100 kg of seed. To reduce
treatment interference from soil-borne pathogens all treatments included a metalaxyl-M (Bayer
CropScience, Guelph, ON) treatment at a rate of 4.0 g a.i. per 100 kg of seed.
At each location, a navy and pinto trial were planted at a seeding rate of 20 seeds m-1
of row.
In Morden, trials were seeded 2 June 2012 with an eight row cone-seeder with 30 cm spacing.
Each plot consisted of four rows that were trimmed to 5 m in length. Plots were separated by a
border of four rows of soybean (Glycine max (L.) Merr.) at a rate of 50 seeds m-1
of row. In
Exeter, plots were seeded 30 May 2012 and 19 June 2013 with a six row cone-seeder with 38 cm
spacing. The navy and pinto trials had 4 and 3 rows, respectively, that were 6 m long. In the
pinto bean experiment, only three rows were seeded due to limitations of available seed. In
Ridgetown, plots were planted 5 June 2012 and 6 June 2013 using a five row cone-seeder with
43 cm spacing. Plots consisted of three rows that were 6 m long. For all of the Ontario sites, plots
were trimmed to 5 m in length and the middle rows on the cone-seeders were used while the
outer rows were left empty to allow room for evaluation.
Emergence counts were taken at 7, 10, 14 and 21 days after planting (DAP). Emergence was
evaluated as a percentage of seedlings in a 4 m row length from the center row based on the
seeding rate of 20 seeds m-1
of row. Foliar disease ratings were conducted three times throughout
the season at 4, 6 and 8 weeks after planting (WAP). Ratings of the incidence of leaf infection
were taken on ten randomly selected plants per plot once the incidence of leaf symptoms

46
exceeded 3% in the infected control (IC). Plants were evaluated using disease severity scale of 1-
9 for leaf infection (1 equalled 0% infection and 9 >25% infection) (Corrales and van
Schoonhoven, 1987). For severity, a 0-5 scale was used where 0 equalled no lesion and 5
equalled 50-100% of area of leaf covered by the lesion (Mutlu et al., 2005). At the Ontario trial
sites, ratings were recorded as a percentage of area of leaf tissue covered with CBB lesions and
converted to the 1-9 scale afterward. The initial Ontario percentage ratings were used to analyze
the data using the area under the disease progress curve (AUDPC). The AUDPC took the
modified form of:
(
) ( ) (
) ( )
where R1 to R3 were ratings at times t1, t2, and t3 (Wilcoxson et al., 1975). Ratings of the
percentage of pod infection were taken when lesions became visible in the IC. At early
flowering, all of the plots at Exeter (1 July 2012 and 15 July 2013) and Ridgetown (10 July 2012
and 15 July 2013) were sprayed with pyraclostrobin (BASF Canada, Mississauga, ON) at a rate
of 100.0 g a.i. ha-1
to minimize the establishment of fungal diseases, such as anthracnose.
Additional applications were made every two weeks until maturity to minimize other foliar
disease infection. The NIC treatments at Exeter were sprayed every two weeks from July to
September with copper hydroxide 50% (Parasol® WG, Nufarm Agriculture Inc., Calgary, AB) at
1.3 kg ha-1
in an effort to maintain a disease-free environment for this treatment.
In Morden, plots were harvested using a Wintersteiger NurseryMaster plot combine
(Wintersteiger Ag, Ried im Innkreis, Austria). In Exeter, an Almaco SPC 40-2 (Almaco, Nevada,
IA) small-plot combine was used for harvest. In Ridgetown, all plots were cut using an Echo
SRM-260 power trimmer (Kioritz Crop., London, ON) and threshed using a stationary Almaco
thresher (Almaco, Nevada, IA). Seed moisture was determined using a Motomco 919 Moisture

47
Meter (Dickey-John Corp., Patterson, NJ) in order to adjust plot weight to a standard storage
moisture of 18%. Using a 10/64 x 3/4 slotted screen, seed was cleaned to remove foreign
material or split/undersized seed, which is referred to as dockage (Canadian Grains Commission,
2010). Hundred seed weight (HSW) and seed pick were recorded once dockage was removed.
Seed pick was assessed on a random sample of 100 seeds and recorded as the estimated
percentage of seed in a sample visibly discoloured due to CBB infection. Every effort was made
to mimic the methods used by the Ontario dry bean processors in the grading of beans for seed
pick.
Later, seed yield in kg ha-1
and return on investment (ROI) were calculated for each treatment.
The ROI was calculated using the modified equation below (Gillard and Ranatunga, 2013):
ROI = ((Seed Yield - Dockage - 2(Pick))* Seed Price kg-1
) - Cost of Seed Treatment
The formula accounted for seed moisture, dockage and pick to calculate seed yield, the market
price of the seed and the cost of the seed treatments. This equation did not account for pesticide
application costs, but in this study the cost of application for the seed treatments was considered
negligible. The value for pick was doubled, firstly to account for the loss due to poor seed quality
and secondly for the costs of removal of infected seed. The seed prices used were based on
average crop insurance values from 2012-2013 (Agricorp, 2013) and were set at $0.84 per kg
and $0.73 per kg for navy and pinto beans, respectively. The manufacturer’s suggested retail
price (MSRP) was used to calculate the cost of Cu(OH)2. To make the treatments comparable to
the market place, the MSRP for PFM was calculated based on the current industry standard seed
treatment for dry bean, thiamethoxam + fludioxonil + metalaxyl-M + azoxystrobin, as no price
had been set for PFM at the time. The cost of microwave treatment was calculated based on a
cost for electricity of 12.54¢ kWh-1
in accordance with the Ontario Energy Board’s average cost
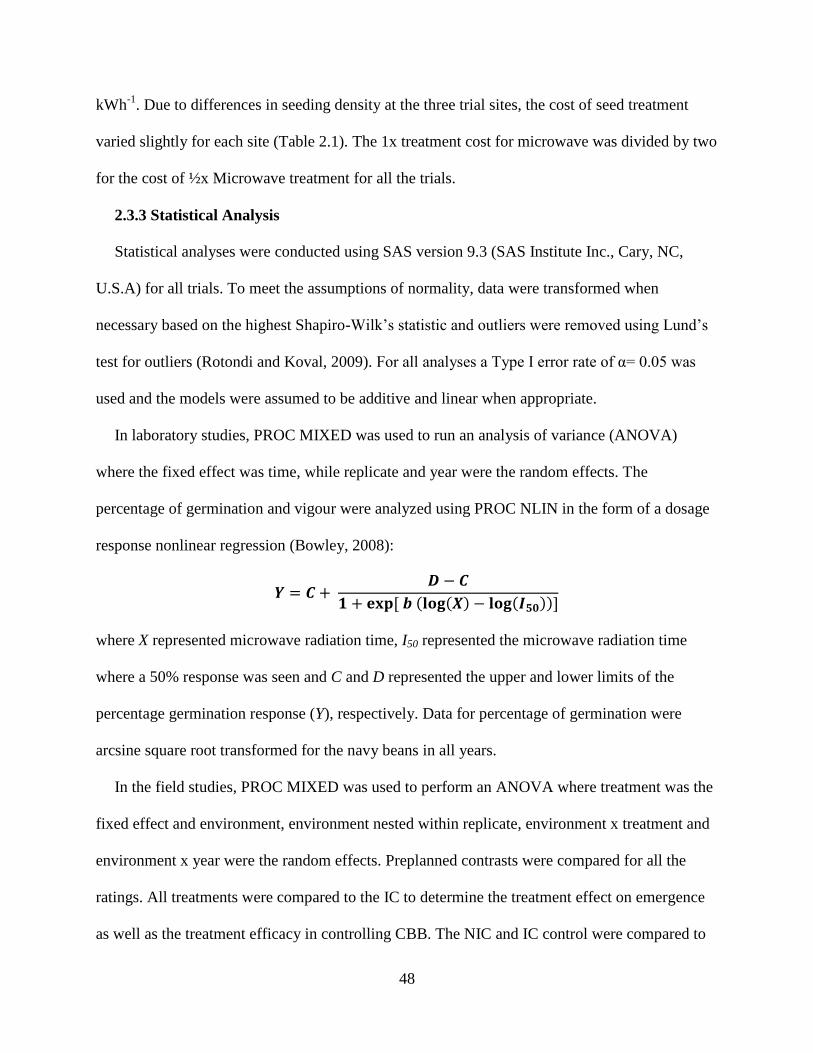
48
kWh-1
. Due to differences in seeding density at the three trial sites, the cost of seed treatment
varied slightly for each site (Table 2.1). The 1x treatment cost for microwave was divided by two
for the cost of ½x Microwave treatment for all the trials.
2.3.3 Statistical Analysis
Statistical analyses were conducted using SAS version 9.3 (SAS Institute Inc., Cary, NC,
U.S.A) for all trials. To meet the assumptions of normality, data were transformed when
necessary based on the highest Shapiro-Wilk’s statistic and outliers were removed using Lund’s
test for outliers (Rotondi and Koval, 2009). For all analyses a Type I error rate of α= 0.05 was
used and the models were assumed to be additive and linear when appropriate.
In laboratory studies, PROC MIXED was used to run an analysis of variance (ANOVA)
where the fixed effect was time, while replicate and year were the random effects. The
percentage of germination and vigour were analyzed using PROC NLIN in the form of a dosage
response nonlinear regression (Bowley, 2008):
( ( ) ( ))
where X represented microwave radiation time, I50 represented the microwave radiation time
where a 50% response was seen and C and D represented the upper and lower limits of the
percentage germination response (Y), respectively. Data for percentage of germination were
arcsine square root transformed for the navy beans in all years.
In the field studies, PROC MIXED was used to perform an ANOVA where treatment was the
fixed effect and environment, environment nested within replicate, environment x treatment and
environment x year were the random effects. Preplanned contrasts were compared for all the
ratings. All treatments were compared to the IC to determine the treatment effect on emergence
as well as the treatment efficacy in controlling CBB. The NIC and IC control were compared to

49
estimate the impact of the disease. To analyse the effect of prolonged microwave treatment 1x
Microwave and ½x Microwave treatments were compared. The PFM treatment was compared to
a standard (Cu(OH)2) for the efficacy of CBB control in the field. Microwave and chemical
treatment applied alone and in combination were also compared to determine if there was any
increase in emergence or control of CBB. Emergence for all sites was arcsine square root
transformed for data analysis. To determine the correlation between yield and AUDPC, ROI and
yield, and ROI and AUDPC, linear regressions were performed using PROC GLM.
2.4 Results & Discussion
2.4.1 Laboratory Study
Seed germination, vigour, and pathogen viability were not affected by short intervals of
microwave radiation (<40 s) on navy or pinto bean seed naturally infected with Xap (Figure 2.1).
A dramatic decrease in germination (12-25%) was observed between 40-60 s. A greater decrease
in germination was observed for the 2013 pinto beans compared to the 2012 pinto beans and the
navy beans for both years. This was likely due to the higher moisture content (MC) of the pinto
bean seed lot in 2013. Microwave radiation uses dielectric heating to align dipole water
molecules through the use of high-frequency electromagnetic radiation (Bouraoui et al., 1993).
Therefore, when more water was present in the dielectric material (i.e., the seed), greater friction
from the realignment of the molecules occurred, increasing the amount of heat produced within
the material (Bouraoui et al., 1993). The 2013 pinto bean seed had a lower tolerance to
microwave radiation due to the increased seed temperature, which caused seed mortality at a
lower exposure time (Appendix A) (Knox et al., 2013). At microwave exposure times over 60 s
the effect of increased seed temperature continued, resulting in decreased seed germination
(Figure 2.1) due to increased seed mortality. Plant vigour, assessed as total dry weight of

50
germinated plant matter, also decreased rapidly over 60 s of exposure, while in the 0-60 s
exposure range a decrease up to only 19% was measured (Figure 2.2). For incidence of Xap
colonization, there was no correlation between microwave exposure and Xap viability, as there
was a low incidence of colonization at all exposure times (data not shown).
Following the laboratory tests, microwave radiation showed some promise as an alternate
seed treatment for Xap, due to minor effects on seed germination and vigour, despite a lack of
difference in pathogen incidence. To further evaluate the control of Xap with microwave
radiation, field studies were conducted using a MER determined from non-linear regression
performed on the data for each seed lot from the laboratory experiments. For field studies, a
MER of 60 s was set for the 2012 pinto beans and navy bean (both years) and 50 s for 2013 pinto
bean (Figure 2.1).
2.4.2 Field Study
Weather Conditions
Weather conditions in both 2012 and 2013 were conducive for CBB development. During
early emergence in 2012, cooler conditions were experienced at the Morden trial sites than at the
Ontario sites, resulting in delayed emergence in the pinto bean class. However, warmer
conditions in the following weeks evened out the emergence patterns. Hail events occurred at the
Exeter trial site on 21 June 2012 and the Ridgetown trial site on 17 June 2013. Hail damage
incurred by the seedlings did not severely impact emergence ratings, but did cause noticeable
leaf wounds. The differences in disease incidence, however, did not appear to be significantly
affected. At the Ridgetown trials sites in 2012, increased heat and humidity during flowering and
pod formation resulted in high disease pressure at the early foliar ratings.
51
Emergence
The NIC had 7- 9% lower emergence than the IC for the majority of the trials (Table 2.2).
This result was unexpected, as infected seed usually has lower seed germination compared to
non-infected seed. Lower emergence may have been related to the origin of the seed lot, as the
NIC were obtained from a different environment than the IC and the other treatments. Factors
that may have contributed to the decreased emergence include seed viability, size or seed coat
thickness (Lush and Wien, 1980; Souza and Marcos-Filho, 2001), storage conditions (Spilde,
1989; TeKrony and Egli, 1991), mechanical damage (Moore, 1972) or various environmental
factors during seed production. Lower emergence was also observed for cv. Envoy, which was
used in place of cv. Navigator in the 2012 Exeter navy trial site. This location was analyzed
separately due to the lower percentage of emergence (data not shown). The lower emergence
observed for the Envoy seed at Exeter in 2012 was likely due to poorer germination of the seed
lot, as well as a MER that was too high for the MC of the seed, as emergence was lowest in the
1x Microwave treatment. Neither assumption was confirmed in the laboratory, as a preliminary
germination test was not performed. Lower emergence was also observed at 10 DAP in the 2012
Morden pinto bean trial. Emergence for this trial was likely delayed due to the cold, wet
conditions during the first WAP. At 14 and 21 DAP, no differences were seen between the pinto
trial sites and therefore the data were combined for analysis.
The application of chemical treatments did not increase emergence compared to the IC (Table
2.2). However, a loss of up to 7% was observed in several contrast comparisons when
microwave treatment was applied. This loss was most notable in several pinto bean trials where
the IC and PFM + Cu(OH)2 (ST) and ½x Microwave treatments had increased emergence
compared to the microwave treatment. In navy bean, differences in treatments with chemical

52
components only occurred 14 DAP where ST + Microwave decreased emergence compared to
the IC. The combination of chemical and microwave treatment did not affect emergence
compared to microwave or chemical treatment alone, except between PFM and PFM +
Microwave treatment in the pinto bean. Increased emergence has been associated with PFM (W.
R. Barton, personal communication, BASF Canada, Mississauga, ON); however, this was not
observed in the other PFM treatments and a substantial number of field observations did not
support this claim. Finally, up to a 7% loss in emergence was observed when comparing 1x
Microwave treatment to ½x Microwave treatment at all trial sites. This decrease was likely due
to the increased seed temperature from prolonged microwave exposure. Even though increased
microwave exposure lowered emergence in all trials, the loss was still below the 10% standard
set for the MER in this study.
Disease Incidence
Incidence of leaf infection collected using a 1-9 scale indicated few differences in CBB
control (Table 2.3). At 4 WAP, the 2012 Ridgetown navy bean trial was analysed separately
because of higher initial disease symptoms which was likely due to high humidity and heat. The
NIC had the lowest disease incidence in navy bean for both leaf (4 and 8 WAP) and pod
infection (Table 2.3). Low disease incidence was expected in the NIC; however infection was
still quite evident, particularly in the pinto bean. The presence of disease in the NIC may have
been due to bacterial infection on the seed, which was not visible at planting, as disease plating
was not conducted on the disease-free lots prior to seeding.
The use of microwave and chemical treatments had little impact on incidence of CBB. At 4
WAP, no differences in leaf infection were detected in pinto bean, but minor differences were
seen in four of the five navy bean trial sites (Table 2.3) where the 1x Microwave had a lower

53
disease incidence than the ½x Microwave. This may be attributed to increased microwave
exposure time; however, disease symptoms were not reduced in the microwave treatments in
navy bean at Ridgetown or the pinto beans or in the later ratings, suggesting the microwave
treatment had little effect overall. When comparing microwave treatment to Cu(OH)2 +
Microwave treatment, greater disease control was observed in the Cu(OH)2 + Microwave
treatment. The addition of Cu(OH)2 likely provided the increased control seen in the Cu(OH)2 +
Microwave treatment in the navy beans. The effect of Cu(OH)2 was also observed at 8 WAP in
navy bean when compared to PFM, indicating potential for more prolonged disease control using
Cu(OH)2. This result was expected, as PFM has less activity on CBB and more activity on other
plant pathogens (Barton, W. R., pers. comm., BASF Canada, Mississauga, ON). However, the
benefits observed with Cu(OH)2 had limited value, since the treatment was not significantly
better than the IC.
The microwave and chemical treatments did not reduce pod infection (Table 2.3), since the
only difference observed was between the NIC and IC in navy bean. The lower disease
symptoms in the NIC check are likely due to the use of disease-free seed and frequent oversprays
with Cu(OH)2 to promote a disease-free environment. The effect of Cu(OH)2 as a seed treatment
is not as well studied as a foliar application (Fininsa, 2003) and the results of this study suggests
Cu(OH)2 is quite ineffective as a seed treatment in reducing CBB symptoms.
Yield & Seed Pick
There were no differences in yield for any of the contrast comparisons, including the NIC and
IC (Table 2.4). This was likely due to the similar emergence and disease pressure patterns
observed across all treatments. In linear regressions of leaf AUDPC and yield, there was a
negative linear relationship between disease progression and yield based on data from the

54
Ontario trials only (Figure 2.3). Increased disease pressure lowered yield by 2.91-2.92 kg ha-1
in
navy bean and 5.24 kg ha-1
in pinto bean (Figure 2.3); however the correlation between yield and
disease was low (R2= 0.07- 0.20). The low correlation between disease incidence and yield
indicates the lack of differences observed in yield contrasts (Table 2.4).
No differences between treatments were observed for seed pick (Table 2.4), even when trials
were analyzed separately to adjust for sites with increased seed pick (Morden 2012 navy bean
and Ridgetown 2013 pinto bean). The effect on seed pick and final yield was not as obvious for
CBB as it can be with other seed-borne diseases like anthracnose, which can be more destructive
to the pods and seed (Schwartz et al., 2005). However, the lack of differences noted between the
microwave and chemical treatments compared to the IC for both yield and seed pick likely
indicate the poor efficacy of these treatments. This corresponds with the lack of difference for
disease incidence ratings (Table 2.3), for the microwave and chemical treatments compared to
the IC.
Return on Investment
Contrast comparisons showed no differences in ROI (Table 2.5). The relationship between
ROI and yield was strong, as observed in a linear regression in Figure 2.4 (R2= 0.92-0.97). For
every kg ha-1
of yield increase, ROI increased $0.79 and $0.59 ha-1
in navy and pinto bean,
respectively. The absence of differences in the contrasts (Table 2.5) was not surprising as there
were no differences in yield, which has a large influence on ROI. Any benefit resulting from
differences between the costs of microwave and chemical treatments were not apparent. The
uniform disease pressure observed between treatments resulted in a minimal impact on the ROI.
From a linear regression on the Ontario trials, an increase of up to $3.17 ha-1
and $2.52 ha-1
was
observed for navy and pinto bean, respectively, when leaf disease pressure was low (Figure 2.5).

55
The relationship between ROI and AUDPC was poor (R2= 0.10- 0.14) however, and did little to
clarify the lack of differences in contrast comparisons for ROI (Table 2.5).
Overall, the results from these studies showed that the use of short intervals of microwave
radiation had little negative effect on seed germination and emergence, but also had little positive
effect on disease incidence of Xap infected seed. The use of chemical treatment applied alone
and in combination with a microwave treatment did not impact seed emergence or CBB control
in the field compared to the IC. The lack of disease control observed from both treatments was
reflected in the lack of differences in yield and pick. Despite the fact that Cu(OH)2 and
microwave treatments were less costly than the PFM treatment, no differences were seen in ROI.
Although previous laboratory studies have indicated the effectiveness of microwave treatment on
seed-borne pathogens (Tylkowska et al., 2010), the use of microwave treatment as an alternative
seed treatment for control of Xap was not supported in these studies. Further research on the
efficacy of PFM and Cu(OH)2 is necessary to determine if these treatments are beneficial for
CBB control as seed treatments.

56
Navy & Pinto 2012 Pinto 2013 Navy Pinto Navy Pinto 2012 Pinto 2013 Navy Pinto 2012 Pinto 2013
1 Non-infected control - - - 0.00 0.00 0.00 0.00 0.00 0.00 0.00 0.00
2 Infected control - - - 0.00 0.00 0.00 0.00 0.00 0.00 0.00 0.00
3 PFMz
14.0 - - 77.33 77.33 53.96 53.96 53.96 61.87 61.87 61.87
4 Cu(OH)2y
30.4 - - 1.47 1.47 1.02 1.02 1.02 1.17 1.17 1.17
51/2x Microwave - 30.0 25.0 1.74 2.32 1.22 1.62 1.35 1.39 1.86 1.55
6 1 x Microwave - 60.0 50.0 3.48 4.64 2.43 3.24 2.70 2.79 3.72 3.10
71/2x Microwave + PFM 14.0 30.0 25.0 79.07 79.65 55.18 55.58 55.31 63.26 63.73 63.42
8 1 x Microwave + PFM 14.0 60.0 50.0 80.81 81.97 56.39 57.20 56.66 64.66 65.59 64.97
91/2x Microwave + Cu(OH)2 30.4 30.0 25.0 3.21 3.79 2.24 0.64 2.37 2.56 3.03 2.72
10 1x Microwave + Cu(OH)2 30.4 60.0 50.0 4.95 6.11 3.45 4.26 3.72 3.96 4.89 4.27
yCu(OH)2= Copper Hyrdoxide 53.8%
Microwave Time (s)Chemical Rate
(a.i. g 100 kg-1
)
Table 2.1. Treatments and treatment costs allocated for the dry bean common bacterial blight seed treatment experiments in 2012 and 2013
Treatments
zPFM= pyraclostrobin + fluxapyroxad + metalaxyl
Morden Ridgetown Exeter
Treatment Cost ($ ha-1
)

57
Treatment comparison
ICw vs NIC 96 vs 87 ** 95 vs 88 ** 79 vs 70 97 vs 89 ** 95 vs 87 ** 97 vs 90 96 vs 91 **
IC vs ST 96 vs 94 95 vs 95 79 vs 75 97 vs 95 95 vs 95 97 vs 95 96 vs 96
IC vs Microwave 96 vs 95 95 vs 94 79 vs 74 97 vs 94 95 vs 92 * 97 vs 94 96 vs 93 *
IC vs ST + Microwave 96 vs 92 95 vs 94 79 vs 76 97 vs 92 * 95 vs 93 97 vs 92 96 vs 94 *
PFM vs Cu(OH)2 94 vs 94 97 vs 93 76 vs 73 95 vs 95 96 vs 93 95 vs 96 97 vs 94
PFM vs PFM + Microwave 94 vs 94 97 vs 93 * 76 vs 72 95 vs 94 96 vs 93 * 95 vs 94 97 vs 93 **
Cu(OH)2 vs Cu(OH)2 + Microwave 94 vs 90 93 vs 94 73 vs 80 95 vs 90 93 vs 93 96 vs 91 94 vs 94
ST vs Microwave 94 vs 95 95 vs 94 75 vs 74 95 vs 94 95 vs 92 95 vs 94 96 vs 93 *
ST vs ST + Microwave 94 vs 92 95 vs 94 75 vs 76 95 vs 92 95 vs 93 95 vs 92 96 vs 94 *1/2x Microwave vs 1x Microwave 98 vs 91 * 97 vs 91 ** 74 vs 73 97 vs 90 * 95 vs 90 * 97 vs 91 96 vs 89 **
Microwave vs PFM + Microwave 95 vs 94 94 vs 93 74 vs 72 94 vs 94 92 vs 93 94 vs 94 93 vs 93
Microwave vs Cu(OH)2 + Microwave 95 vs 90 94 vs 94 74 vs 80 94 vs 90 92 vs 93 94 vs 91 93 vs 94
Microwave vs ST + Microwave 95 vs 92 94 vs 94 74 vs 76 94 vs 92 92 vs 93 94 vs 92 93 vs 94
yExeter 2012 trial was excluded from analysis due to low germination in seed lot.
xMorden 2012 trial presented separately to meet the assumptions of normality.
*,** Denotes significance at P <0.05 and P <0.01, respectively, based on orthogonal contrasts.
Table 2.2. Contrasts comparing percentage of emergence of navy and pinto beans for various seed treatments to control common bacterial
blight at Morden, MB and Ridgetown and Exeter, ON in 2012-2013
Emergencez
(%)
wIC= infected control; NIC= non-infected control; Microwave=
1/2x and 1x Microwave rates; ST= PFM and Cu(OH)2; PFM= pyraclostrobin +
fluxapyroxad + metalaxyl; Cu(OH)2= Copper Hydroxide 53.8%.
Navyy Pinto Navy
yPinto
x Pinto Navyy
10 DAP 14 DAP 21 DAP
Pinto
zEmergence was arcsine square root transformed for data analysis to satisfy the assumptions of analysis and back-transformed estimates are presented.
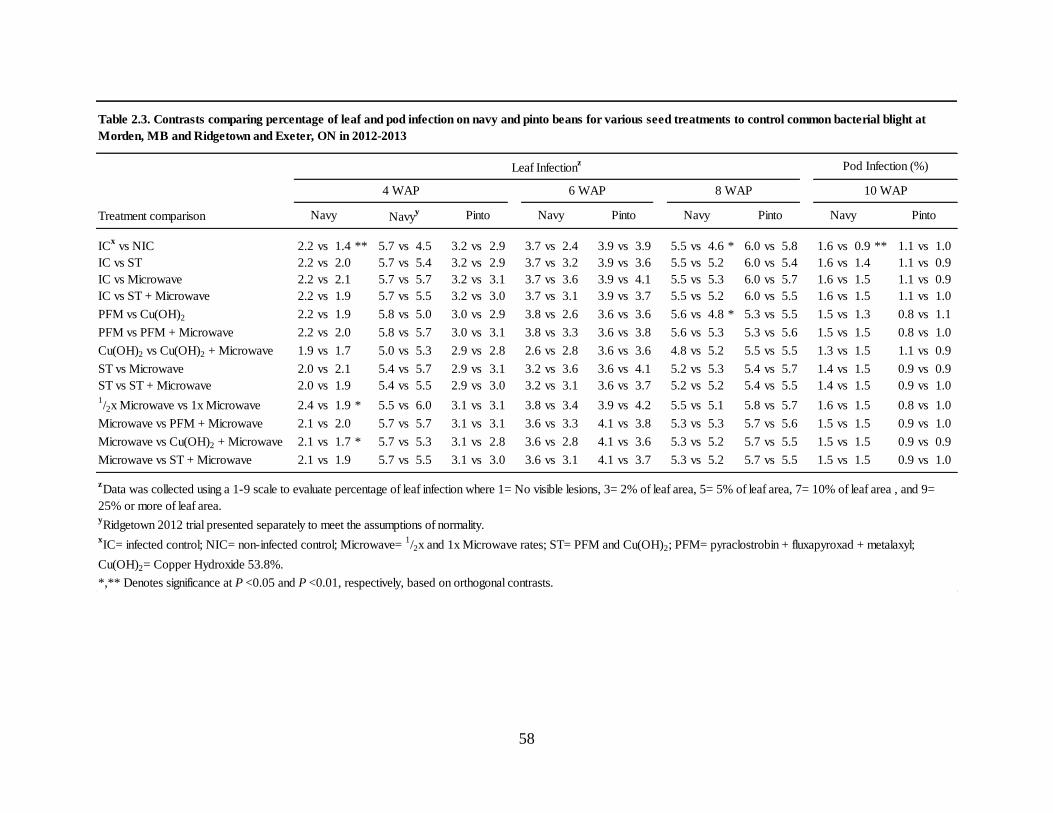
58
Treatment comparison
ICx vs NIC 2.2 vs 1.4 ** 5.7 vs 4.5 3.2 vs 2.9 3.7 vs 2.4 3.9 vs 3.9 5.5 vs 4.6 * 6.0 vs 5.8 1.6 vs 0.9 ** 1.1 vs 1.0
IC vs ST 2.2 vs 2.0 5.7 vs 5.4 3.2 vs 2.9 3.7 vs 3.2 3.9 vs 3.6 5.5 vs 5.2 6.0 vs 5.4 1.6 vs 1.4 1.1 vs 0.9
IC vs Microwave 2.2 vs 2.1 5.7 vs 5.7 3.2 vs 3.1 3.7 vs 3.6 3.9 vs 4.1 5.5 vs 5.3 6.0 vs 5.7 1.6 vs 1.5 1.1 vs 0.9
IC vs ST + Microwave 2.2 vs 1.9 5.7 vs 5.5 3.2 vs 3.0 3.7 vs 3.1 3.9 vs 3.7 5.5 vs 5.2 6.0 vs 5.5 1.6 vs 1.5 1.1 vs 1.0
PFM vs Cu(OH)2 2.2 vs 1.9 5.8 vs 5.0 3.0 vs 2.9 3.8 vs 2.6 3.6 vs 3.6 5.6 vs 4.8 * 5.3 vs 5.5 1.5 vs 1.3 0.8 vs 1.1
PFM vs PFM + Microwave 2.2 vs 2.0 5.8 vs 5.7 3.0 vs 3.1 3.8 vs 3.3 3.6 vs 3.8 5.6 vs 5.3 5.3 vs 5.6 1.5 vs 1.5 0.8 vs 1.0
Cu(OH)2 vs Cu(OH)2 + Microwave 1.9 vs 1.7 5.0 vs 5.3 2.9 vs 2.8 2.6 vs 2.8 3.6 vs 3.6 4.8 vs 5.2 5.5 vs 5.5 1.3 vs 1.5 1.1 vs 0.9
ST vs Microwave 2.0 vs 2.1 5.4 vs 5.7 2.9 vs 3.1 3.2 vs 3.6 3.6 vs 4.1 5.2 vs 5.3 5.4 vs 5.7 1.4 vs 1.5 0.9 vs 0.9
ST vs ST + Microwave 2.0 vs 1.9 5.4 vs 5.5 2.9 vs 3.0 3.2 vs 3.1 3.6 vs 3.7 5.2 vs 5.2 5.4 vs 5.5 1.4 vs 1.5 0.9 vs 1.01/2x Microwave vs 1x Microwave 2.4 vs 1.9 * 5.5 vs 6.0 3.1 vs 3.1 3.8 vs 3.4 3.9 vs 4.2 5.5 vs 5.1 5.8 vs 5.7 1.6 vs 1.5 0.8 vs 1.0
Microwave vs PFM + Microwave 2.1 vs 2.0 5.7 vs 5.7 3.1 vs 3.1 3.6 vs 3.3 4.1 vs 3.8 5.3 vs 5.3 5.7 vs 5.6 1.5 vs 1.5 0.9 vs 1.0
Microwave vs Cu(OH)2 + Microwave 2.1 vs 1.7 * 5.7 vs 5.3 3.1 vs 2.8 3.6 vs 2.8 4.1 vs 3.6 5.3 vs 5.2 5.7 vs 5.5 1.5 vs 1.5 0.9 vs 0.9
Microwave vs ST + Microwave 2.1 vs 1.9 5.7 vs 5.5 3.1 vs 3.0 3.6 vs 3.1 4.1 vs 3.7 5.3 vs 5.2 5.7 vs 5.5 1.5 vs 1.5 0.9 vs 1.0
yRidgetown 2012 trial presented separately to meet the assumptions of normality.
*,** Denotes significance at P <0.05 and P <0.01, respectively, based on orthogonal contrasts.
xIC= infected control; NIC= non-infected control; Microwave=
1/2x and 1x Microwave rates; ST= PFM and Cu(OH)2; PFM= pyraclostrobin + fluxapyroxad + metalaxyl;
Cu(OH)2= Copper Hydroxide 53.8%.
10 WAP4 WAP
Pod Infection (%)Leaf Infectionz
8 WAP6 WAP
Table 2.3. Contrasts comparing percentage of leaf and pod infection on navy and pinto beans for various seed treatments to control common bacterial blight at
Morden, MB and Ridgetown and Exeter, ON in 2012-2013
Pinto NavyNavyy Navy
zData was collected using a 1-9 scale to evaluate percentage of leaf infection where 1= No visible lesions, 3= 2% of leaf area, 5= 5% of leaf area, 7= 10% of leaf area , and 9=
25% or more of leaf area.
Navy Pinto Navy PintoPinto

59
Treatment comparison
ICx vs NIC 3946 vs 4064 4223 vs 4382 4 vs 3 6 vs 3 5 vs 5 5 vs 3
IC vs ST 3946 vs 3808 4223 vs 4232 4 vs 4 6 vs 9 5 vs 5 5 vs 4
IC vs Microwave 3946 vs 3895 4223 vs 4179 4 vs 5 6 vs 6 5 vs 5 5 vs 4
IC vs ST + Microwave 3946 vs 3835 4223 vs 4288 4 vs 4 6 vs 7 5 vs 5 5 vs 4
PFM vs Cu(OH)2 3714 vs 3903 4199 vs 4264 4 vs 4 8 vs 10 4 vs 5 5 vs 4
PFM vs PFM + Microwave 3714 vs 3862 4199 vs 4205 4 vs 4 8 vs 6 4 vs 5 5 vs 3
Cu(OH)2 vs Cu(OH)2 + Microwave 3903 vs 3808 4264 vs 4371 4 vs 4 10 vs 7 5 vs 6 4 vs 4
ST vs Microwave 3808 vs 3895 4232 vs 4179 4 vs 5 9 vs 6 5 vs 5 4 vs 4
ST vs ST + Microwave 3808 vs 3835 4232 vs 4288 4 vs 4 9 vs 7 5 vs 5 4 vs 41/2x Microwave vs 1x Microwave 3776 vs 4013 4280 vs 4077 5 vs 4 8 vs 5 5 vs 5 4 vs 3
Microwave vs PFM + Microwave 3895 vs 3862 4179 vs 4205 5 vs 4 6 vs 6 5 vs 5 4 vs 3
Microwave vs Cu(OH)2 + Microwave 3895 vs 3808 4179 vs 4371 5 vs 4 6 vs 7 5 vs 6 4 vs 4
Microwave vs ST + Microwave 3895 vs 3835 4179 vs 4288 5 vs 4 6 vs 7 5 vs 5 4 vs 4
yMorden 2012 trial presented separately to meet the assumptions of normality.
*,** Denotes significance at P <0.05 and P <0.01, respectively, based on orthogonal contrasts.
zRidgetown 2013 trial presented separately to satisfy the assumptions of normality.
Yield (kg ha-1
) Seed Pick (%)
Table 2.4. Contrasts comparing yield and percentage of seed pick on navy and pinto beans for various seed
treatments to control common bacterial blight at Morden, MB and Ridgetown and Exeter, ON in 2012-2013
Pinto Pinto PintoyNavy Navy Navy
z
xIC= infected control; NIC= non-infected control; Microwave=
1/2x and 1x Microwave rates; ST= PFM and Cu(OH)2; PFM=
pyraclostrobin + fluxapyroxad + metalaxyl; Cu(OH)2= Copper Hydroxide 53.8%.

60
ICx vs NIC 3150 vs 3281 2800 vs 2965
IC vs ST 3150 vs 2979 2800 vs 2812
IC vs Microwave 3150 vs 3063 2800 vs 2796
IC vs ST + Microwave 3150 vs 3028 2800 vs 2794
PFM vs Cu(OH)2 2860 vs 3098 2759 vs 2865
PFM vs PFM + Microwave 2860 vs 3020 2759 vs 2740
Cu(OH)2 vs Cu(OH)2 + Microwave 3098 vs 3037 2865 vs 2847
ST vs Microwave 2979 vs 3063 2812 vs 2796
ST vs ST + Microwave 2979 vs 3028 2812 vs 27941/2x Microwave vs 1x Microwave 2944 vs 3182 2854 vs 2739
Microwave vs PFM + Microwave 3063 vs 3020 2796 vs 2740
Microwave vs Cu(OH)2 + Microwave 3063 vs 3037 2796 vs 2847
Microwave vs ST + Microwave 3063 vs 3028 2796 vs 2794
xIC= infected control; NIC= non-infected control; Microwave=
1/2x and 1x
Microwave rates; ST= PFM and Cu(OH)2; PFM= pyraclostrobin +
fluxapyroxad + metalaxyl; Cu(OH)2= Copper Hydroxide 53.8%.
*,** Denotes significance at P <0.05 and P <0.01, respectively, based on
orthogonal contrasts.
Navy Pinto
Table 2.5. Contrasts comparing return on investment (ROI) on navy and
pinto beans for various seed treatments to control common bacterial blight
at Morden, MB and Ridgetown and Exeter, ON in 2012-2013
Treatment comparison
ROI ($ ha-1
)
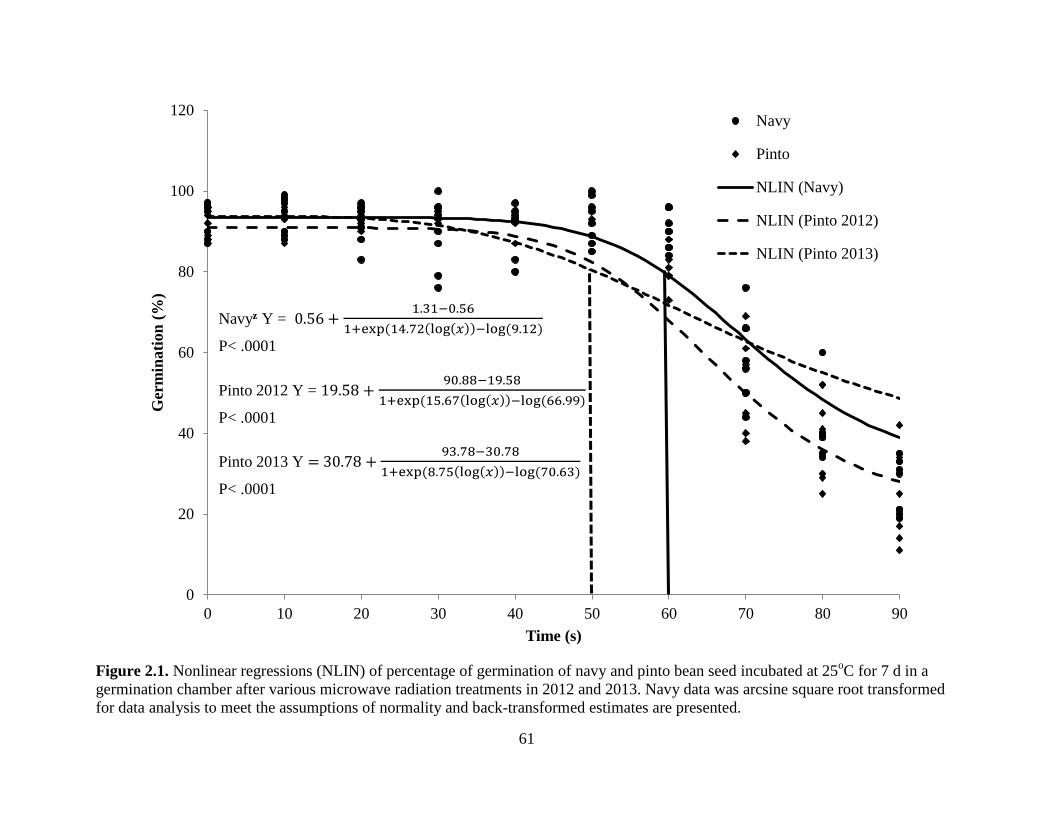
61
Figure 2.1. Nonlinear regressions (NLIN) of percentage of germination of navy and pinto bean seed incubated at 25
oC for 7 d in a
germination chamber after various microwave radiation treatments in 2012 and 2013. Navy data was arcsine square root transformed
for data analysis to meet the assumptions of normality and back-transformed estimates are presented.
0
20
40
60
80
100
120
0 10 20 30 40 50 60 70 80 90
Ger
min
ati
on
(%
)
Time (s)
Navy
Pinto
NLIN (Navy)
NLIN (Pinto 2012)
NLIN (Pinto 2013)
Navyz Y = 0.56 + 1.31−0.56
1+exp(14.72 log 𝑥 −log(9.12)
P< .0001
Pinto 2012 Y = 19.58 + 90.88−19.58
1+exp(15.67 log 𝑥 −log(66.99)
P< .0001
Pinto 2013 Y = 30.78 + 93.78−30.78
1+exp(8.75 log 𝑥 −log(70.63)
P< .0001

62
Figure 2.2. Nonlinear regressions (NLIN) of plant vigour (dry weights of germinated material) from navy and pinto bean seed
incubated at 25oC for 7 d in a germination chamber after various microwave radiation treatments in 2012 and 2013.
0
10
20
30
40
50
0 10 20 30 40 50 60 70 80 90
Dry
Wei
gh
t (g
)
Time (s)
Navy
Pinto
NLIN (Navy)
NLIN (Pinto)
Navy Y = 4.13 + 16.67−4.13
1+exp(11.17 log 𝑥 −log(75.08)
P< .0001
Pinto Y = 12.72 + 35.03−12.72
1+exp(11.18 log 𝑥 −log(71.50)
P< .0001

63
Figure 2.3. Linear regression of area under the disease progress curve (AUDPC) for leaf infection and yield for navy and pinto bean
seed treatment study for common bacterial blight control in Ridgetown and Exeter, ON in 2012 and 2013.
Navy Ridgetown Y = -2.9115x + 5268
R² = 0.0736
P< .0156
Navy Exeter Y = -2.9239x + 3098
R² = 0.1728
P< .0001
Pinto Ridgetown Y = -5.2387x + 5880.9
R² = 0.2028
P< .0001
0
1000
2000
3000
4000
5000
6000
7000
8000
0 50 100 150 200 250 300 350 400
Yie
ld (
kg h
a-1
)
AUDPC Leaf
Navy Ridgetown
Navy Exeter
Pinto Ridgetown
Linear (Navy Ridgetown)
Linear (Navy Exeter)
Linear (Pinto Ridgetown)

64
Figure 2.4. Linear regression of return on investment (ROI) and yield for navy and pinto bean seed treatment study for common
bacterial blight control in Morden, MB and Ridgetown and Exeter, ON in 2012 and 2013.
Navy Y = 0.7896x - 14.887
R² = 0.9724
Kidney Y = 0.5884x + 275.76
R² = 0.9247
0
1000
2000
3000
4000
5000
6000
0 1000 2000 3000 4000 5000 6000 7000 8000
RO
I ($
ha
-1)
Yield (kg ha-1)
Navy
Pinto
Linear (Navy)
Linear (Pinto)

65
Figure 2.5. Linear regression of area under the disease progress curve (AUDPC) for leaf infection and return on investment (ROI) for
navy and pinto bean seed treatment study for common bacterial blight control in Ridgetown and Exeter, ON in 2012 and 2013.
Navy Ridgetown Y = -3.1721x + 4239.5
R² = 0.1189
P< .0019
Navy Exeter Y = -1.8122x + 2399.2
R² = 0.0987
P< .0045
Pinto Ridgetown Y = -2.5233x + 3589
R² = 0.1358
P< .0010
0
1000
2000
3000
4000
5000
6000
0 50 100 150 200 250 300 350 400
RO
I ($
ha
-1)
AUDPC Leaf
Navy Ridgetown
Navy Exeter
Pinto Ridgetown
Linear (Navy Ridgetown)
Linear (Navy Exeter)
Linear (Pinto Ridgetown)

66
CHAPTER THREE
Effect of microwave radiation on dry bean seed infected with Pseudomonas syringae pv.
phaseolicola with and without the use of chemical seed treatment
3.1 Abstract
Halo blight, caused by Pseudomonas syringae pv. phaseolicola, is a seed-borne disease in dry
bean (Phaseolus vulgaris L.) that lowers seed quality and yield. Over two years, laboratory and
field studies were conducted to evaluate the effect of microwave radiation on two market classes:
navy (cv. Envoy) and white kidney bean (cv. GTS 402). In the laboratory, seed germination and
vigour decreased up to 15% after 40 s of microwave exposure, while for 0-30 s less than a 7%
decrease was observed. Disease plating showed no correlation between pathogen colonization of
the seed and microwave radiation, as incidence of pathogen colonization was low across all
exposure times. In field trials in Morden and Winkler, MB microwave radiation was tested alone
and in combination with copper hydroxide 53.8% and pyraclostrobin + fluxapyroxad +
metalaxyl. Microwave radiation lowered seed emergence by up to 9%, but did not reduce disease
infection or increase yield or return on investment when applied alone or in combination with a
chemical treatment. Seed treatment with copper hydroxide slightly decreased the incidence and
severity of halo blight, seed pick and increased hundred seed weight, yield, and return on
investment, while pyraclostrobin + fluxapyroxad + metalaxyl had no effect on any of these
parameters.
3.2 Introduction
Halo blight (caused by Pseudomonas syringae pv. phaseolicola (Burkholder) Young et al.)
(Psp), is a bacterial disease of dry bean (Phaseolus vulgaris L.) that is primarily spread via
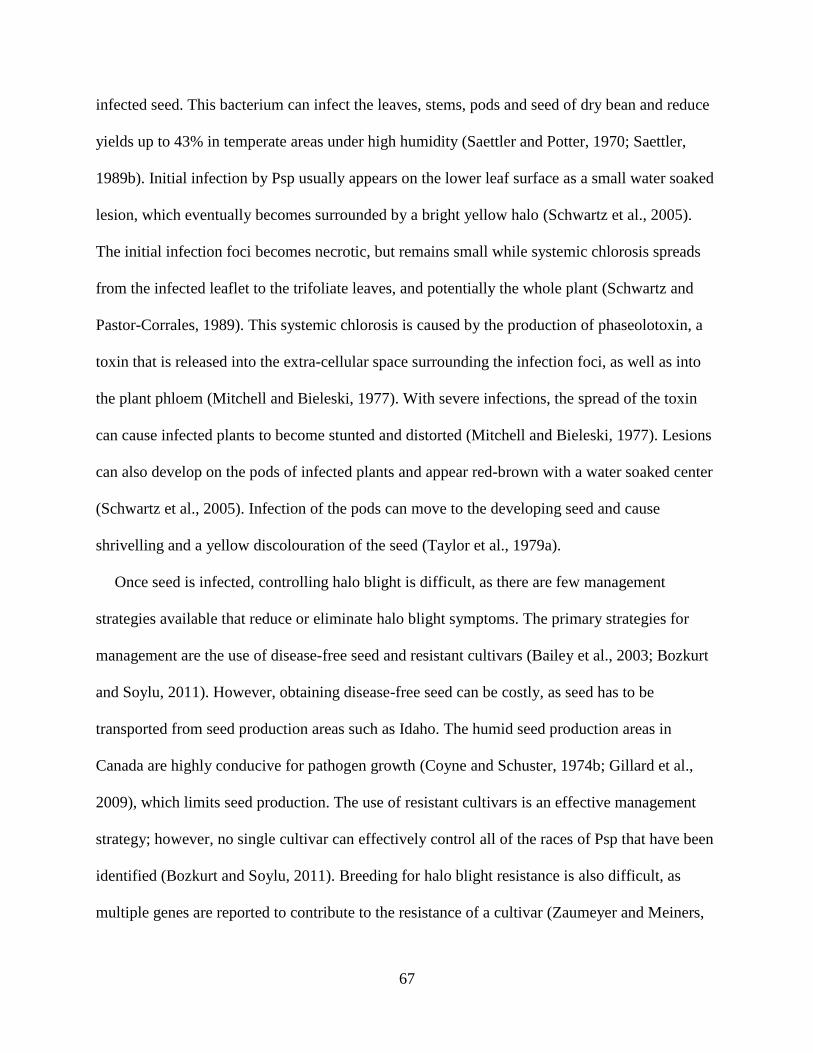
67
infected seed. This bacterium can infect the leaves, stems, pods and seed of dry bean and reduce
yields up to 43% in temperate areas under high humidity (Saettler and Potter, 1970; Saettler,
1989b). Initial infection by Psp usually appears on the lower leaf surface as a small water soaked
lesion, which eventually becomes surrounded by a bright yellow halo (Schwartz et al., 2005).
The initial infection foci becomes necrotic, but remains small while systemic chlorosis spreads
from the infected leaflet to the trifoliate leaves, and potentially the whole plant (Schwartz and
Pastor-Corrales, 1989). This systemic chlorosis is caused by the production of phaseolotoxin, a
toxin that is released into the extra-cellular space surrounding the infection foci, as well as into
the plant phloem (Mitchell and Bieleski, 1977). With severe infections, the spread of the toxin
can cause infected plants to become stunted and distorted (Mitchell and Bieleski, 1977). Lesions
can also develop on the pods of infected plants and appear red-brown with a water soaked center
(Schwartz et al., 2005). Infection of the pods can move to the developing seed and cause
shrivelling and a yellow discolouration of the seed (Taylor et al., 1979a).
Once seed is infected, controlling halo blight is difficult, as there are few management
strategies available that reduce or eliminate halo blight symptoms. The primary strategies for
management are the use of disease-free seed and resistant cultivars (Bailey et al., 2003; Bozkurt
and Soylu, 2011). However, obtaining disease-free seed can be costly, as seed has to be
transported from seed production areas such as Idaho. The humid seed production areas in
Canada are highly conducive for pathogen growth (Coyne and Schuster, 1974b; Gillard et al.,
2009), which limits seed production. The use of resistant cultivars is an effective management
strategy; however, no single cultivar can effectively control all of the races of Psp that have been
identified (Bozkurt and Soylu, 2011). Breeding for halo blight resistance is also difficult, as
multiple genes are reported to contribute to the resistance of a cultivar (Zaumeyer and Meiners,

68
1975). The use of other strategies, like cultural (Hall and Nasser, 1996), antibiotic (Taylor and
Dudley, 1977), and chemical (Garrett and Schwartz, 1998) controls have also been used, but only
have had limited effect in reducing inoculum spread and disease symptoms.
The use of bactericides is a standard practice for most conventional growers. Several products
are readily available in Canada and are easy to apply. The current industry standard, copper
hydroxide (Cu(OH)2), is used as a foliar application and as a seed treatment. The effectiveness of
Cu(OH)2 as a foliar treatment is well understood, but multiple applications are required, which
raises concerns for pathogen resistance (Garrett and Schwartz, 1998).
The use of alternative methods for controlling halo blight are needed as copper resistance has
already been detected (Garrett and Schwartz, 1998). Thermotherapy treatments like dry heat,
steam, and hot water soaks, control bacterial pathogens in other crops like tobacco (Nicotiana
tabacum) ‘Consolidate L.’ (Hankin and Sands, 1977), cereals (Poaceae) and crucifers
(Brassicaceae) (Grondeau et al., 1994). However, large seeded legume seeds like dry bean are
sensitive to these treatments, as they can have a severe impact on seed germination and health
(Spilde, 1989; Sinclair, 1993). One type of thermotherapy treatment that has been reported to
have less of an effect on dry bean seed health and vigour is microwave radiation. The use of
microwave radiation has effectively controlled bacterial and fungal pathogens in tobacco
(Nicotiana tabacum), wheat (Triticum spp.), cassava (Manihot esculenta Crantz), and soybean
(Glycine max L.) (Hankin and Sands, 1977; Cavalcante and Muchovej, 1993; Han, 2010; Knox
et al., 2013). In dry bean, the effect of microwave radiation on bacterial pathogens has not been
tested, but it did lower Penicillium spp. levels in a naturally infected seed lot (Tylkowska et al.,
2010).
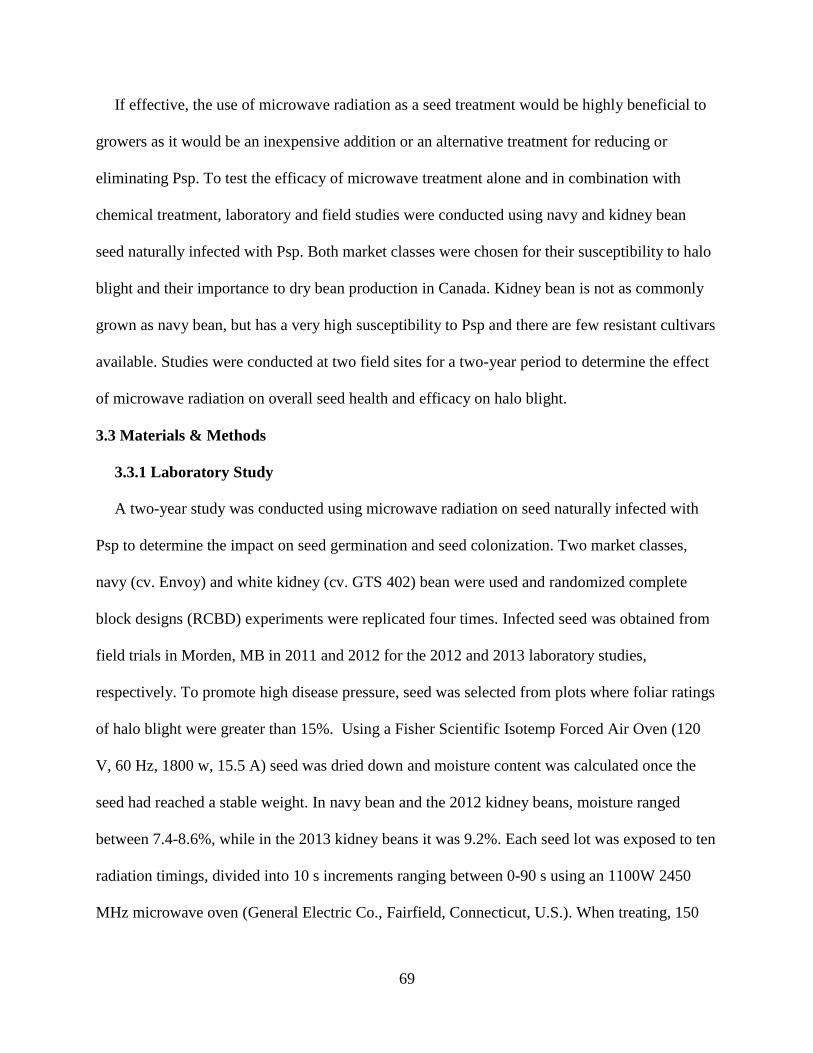
69
If effective, the use of microwave radiation as a seed treatment would be highly beneficial to
growers as it would be an inexpensive addition or an alternative treatment for reducing or
eliminating Psp. To test the efficacy of microwave treatment alone and in combination with
chemical treatment, laboratory and field studies were conducted using navy and kidney bean
seed naturally infected with Psp. Both market classes were chosen for their susceptibility to halo
blight and their importance to dry bean production in Canada. Kidney bean is not as commonly
grown as navy bean, but has a very high susceptibility to Psp and there are few resistant cultivars
available. Studies were conducted at two field sites for a two-year period to determine the effect
of microwave radiation on overall seed health and efficacy on halo blight.
3.3 Materials & Methods
3.3.1 Laboratory Study
A two-year study was conducted using microwave radiation on seed naturally infected with
Psp to determine the impact on seed germination and seed colonization. Two market classes,
navy (cv. Envoy) and white kidney (cv. GTS 402) bean were used and randomized complete
block designs (RCBD) experiments were replicated four times. Infected seed was obtained from
field trials in Morden, MB in 2011 and 2012 for the 2012 and 2013 laboratory studies,
respectively. To promote high disease pressure, seed was selected from plots where foliar ratings
of halo blight were greater than 15%. Using a Fisher Scientific Isotemp Forced Air Oven (120
V, 60 Hz, 1800 w, 15.5 A) seed was dried down and moisture content was calculated once the
seed had reached a stable weight. In navy bean and the 2012 kidney beans, moisture ranged
between 7.4-8.6%, while in the 2013 kidney beans it was 9.2%. Each seed lot was exposed to ten
radiation timings, divided into 10 s increments ranging between 0-90 s using an 1100W 2450
MHz microwave oven (General Electric Co., Fairfield, Connecticut, U.S.). When treating, 150
70
seeds were placed on a paper plate with a 450-500 ml beaker containing 200 ml of water in the
center of the plate (Reddy et al., 2000). The temperature of the water was measured before and
after each treatment to determine the change in temperature due to microwave exposure.
The effect of microwave radiation on seed germination was evaluated on 100 seeds from each
experimental unit using the Canadian Food Inspection Agency (CFIA) methods and procedures
for testing seed (CFIA, 2011). The seed was planted into 50 WG 60 Wellpak silica sand (B.P.
Dust Control, Walton, ON) in 21.6 cm x 13.0 cm x 10.2 cm plastic clam lid containers (Par-Pak
Ltd., Brampton, ON) and left to incubate for 6-7 d in a germination chamber. The incubation
chamber was set at 25oC, had a 12L:12D photoperiod, and a relative humidity (RH) above 60%.
After 6-7 d the seedlings were dried and the total dry weight of the germinated plant matter was
recorded to assess vigour.
Disease plating was conducted in 2012 to determine the effect of microwave radiation on
pathogen viability. Four replicates of plating were carried out with 50 seeds per treatment on
King’s B Medium, a specific media that causes Pseudomonas spp. to fluoresce (Chase, 1987).
Prior to plating, seed was surface-sterilized in a 10% sodium hypochlorite solution for 2 min to
prevent the growth of saprophytic species of fungi and bacteria. Once surface-sterilized, five
seeds were plated per 100 x 15 mm petri plate (Fisher Scientific Company, Ottawa, ON) on 10
plates and allowed to germinate at room temperature for a minimum of 7 d. The seed was then
evaluated for percentage of seed with visible bacterial colonization and germination.
3.3.2 Field Study
Field trials using chemical and microwave treatments were conducted in Morden and
Winkler, MB (1 navy and 1 kidney trial per site) over a two-year period (2012-2013). The trials
consisted of ten treatments (Table 3.1) arranged in a randomized complete block design (RCBD)

71
with four replications. Seed for the field trials came from the same source as the laboratory
study. The seed for the non-infected control, for both Envoy and GTS 402, were obtained from
Gentec Seeds Inc. (Twin Falls, Idaho).
For the microwave radiation treatments, a maximum exposure rate (MER) of 50 s was set for
navy bean (both years) and the 2012 kidney beans and 40 s for 2013 kidney beans, based on the
seed germination results from the laboratory study (Figure 3.1). A half rate exposure time was
set at 50% of the MER. Two chemical treatments were tested alone and in combination with
microwave treatment. These treatments were pyraclostrobin + fluxapyroxad + metalaxyl (PFM)
(BASF Canada, Mississauga, ON) and copper hydroxide 53.8% (Cu(OH)2) (Kocide 2000, E.I. du
Pont Canada Company, Mississauga, ON) applied at 14.0 and 30.4 g a.i. per 100 kg of seed,
respectively. To minimize damping-off from soil pathogens such as Pythium spp., metalaxyl-M
was included in all treatments at 4 g a.i. per 100 kg seed.
In Morden, plots were seeded 2 June 2012 and 8 June 2013 and were 1.2 m wide (four rows
with a 30 cm spacing) and 5.0 m long and surrounded by a border of four rows of soybean
(Glycine max (L.) Merr.). In Winkler, plots were seeded 30 May 2012 and 27 May 2013 and
measured 1.2 m wide (four rows with a 30 cm spacing) and 4.0 m long with 0.6 m spacing
between plots as no soybean borders due to limited space. For both sites, a four row cone-seeder
was used. A seeding rate of 20 dry bean seeds m-1
of row and 25 soybean seeds m-1
were used.
To evaluate emergence, ratings were taken at 7, 10, 14, and 21 days after planting (DAP) in
2012 and at 7, 14, and 21 DAP in 2013. Ratings were not taken at 10 DAP in 2013, as no
differences were noted in the previous year. Ratings on disease incidence and severity were
taken 7 and 11 weeks after planting (WAP) on ten randomly selected plants per plot. Incidence
was measured using a 1-9 scale where 1 equalled 0% infection and 9 equalled >25% infection

72
(Corrales and van Schoonhoven, 1987). Disease severity was measured using a 0-5 scale where 0
equalled no observable lesions and 5 equalled lesions that covered 50-100% of the leaf area
(Mutlu et al., 2005). A pod infection rating was taken at 14 WAP and was based on percentage
of pod area with lesions. In Winkler, plots received 12.7 mm of supplemental water weekly
through overhead irrigation from the start of flowering until plant maturation. To prevent the
development of white mold (Sclerotinia sclerotiorum) boscalid (BASF Canada, Mississauga,
ON) was sprayed at a rate of 539.7 g a.i. ha-1
on 13 August 2012 and 25 July 2013 at the Winkler
trial sites.
A Wintersteiger NurseryMaster plot combine (Wintersteiger Ag, Ried im Innkreis, Austria)
was used to harvest all the plots. Seed moisture was measured using a Motomco 919 Moisture
Meter (Dickey-John Corp., Patterson, NJ). Hundred seed weight (HSW) was then measured and
seed pick was evaluated. Pick was measured as the percentage of visibly discoloured seed in a
random sample of 100 seeds to simulate the methods used for grading by the Ontario dry bean
processors. All sample weights were adjusted to a standard storage moisture of 18% and
converted to seed yield in kg ha-1
. Using the modified equation below, return on investment
(ROI) was calculated for each treatment (Gillard and Ranatunga, 2013):
ROI = ((Seed Yield - 2(Pick))*Price kg-1
) - Cost of Seed Treatment
Seed yield was adjusted for pick and market value price. Pick was doubled, once to account for
poor seed quality and a second time for the cost of removal of infected seed. The market value
prices, based on crop insurance values from 2012-2013, were $0.84 kg-1
and $1.14 kg-1
for navy
and kidney beans, respectively (Agricorp, 2013). The cost of seed treatments were based on a
manufacturer’s suggested retail price (MSRP). A price of $1.47 ha-1
was used for copper
hydroxide and $77.33 ha-1
for PFM. The elevated price of PFM was based on the MSRP for the

73
current industry standard seed treatment in dry bean, thiamethoxam + fludioxonil + metalaxyl-M
+ azoxystrobin (TFMA). This price was used to make PFM comparable in the market, as no
price had been set for PFM as of yet. For the cost of the 1x Microwave treatments, $2.90 ha-1
was used for navy bean and $4.22 and $3.38 ha-1
were used for 2012 and 2013 kidney beans,
respectively. An increased cost was seen in the 2012 kidney beans compared to the 2013 kidney
beans, as a higher MER was used. The 1x Microwave costs were reduced by 50% for the ½x
treatments for all trials. The costs for microwave treatment accounted for the cost of electricity at
a rate of 12.54¢ kWh-1
based on Ontario Energy Board average daytime use.
3.3.3 Statistical Analysis
Data analysis was performed using SAS version 9.3 (SAS Institute Inc., Cary, NC, U.S.A). To
meet the assumptions of normality, transformations were performed when necessary and the
highest Shapiro-Wilk’s statistic was used to determine the best transformation and back-
transformed estimates were presented. Lund’s test for outliers was used to remove outliers
(Rotondi and Koval, 2009). A Type I error rate of α= 0.05 was set and models were assumed to
be additive and linear where appropriate.
In the laboratory, analysis of variance (ANOVA) was performed using PROC MIXED where
time was a fixed effect and replicate and year were random effects. Percentage germination and
vigour were analyzed using a dosage response nonlinear regression in PROC NLIN:
( ( ) ( ))
where a 50% dose response, microwave radiation and the upper and lower limits of percentage
germination response (Y) were represented by I50, X and C and D, respectively. An arcsine square
root transformation was used for data on the navy bean percentage of germination.

74
In the field studies, ANOVA was performed using PROC MIXED where treatment was a
fixed effect and environment, environment nested within replicate, environment x treatment and
environment x year were random effects. Preplanned contrast comparisons were analyzed for
various treatment combinations. To determine the effect on emergence and disease control all
treatments were compared to the infected control (IC). The infected and disease-free controls
were compared to determine the intensity of seed infection. The ½x and 1x rate of microwave
radiation were compared to observe the impact of increased exposure time. To determine the
efficacy of the two chemical products, PFM was compared to the industry standard, Cu(OH)2.
Microwave and chemical treatments applied alone or in combination were compared to
determine if there was any additional emergence or disease control when applied together.
Percentage of emergence was arcsine square root transformed for both navy and kidney bean.
The correlation between yield and ROI was determined through linear regressions using PROC
GLM.s
3.4 Results & Discussion
3.4.1 Laboratory Study
The effect of microwave radiation on seed germination is illustrated in Figure 3.1. A decrease
in germination of between 2-15% was observed after 40 s of radiation in non-linear regressions
for all the seed lots. The most significant decrease noted (15%) was in the 2013 kidney beans.
This was attributed to the higher moisture content (MC) in that seed lot, which made the seed
more susceptible to damage from lower levels of radiation, as microwave radiation produces
energy through dielectric heating (Bouraoui et al., 1993). Dielectric heating uses high-frequency
electromagnetic radiation to produce energy through the alignment of dipole water molecules
(Bouraoui et al., 1993). The increased friction produced due to the higher number of water

75
molecules in the higher MC seed raised the seed temperature more than in the other seed lots,
resulting in greater seed mortality at a lower exposure time (Appendix A) (Knox et al., 2013).
Higher seed mortality (>10%) was also noted at exposure times over 50 s, where this prolonged
exposure increased seed temperatures (Figure 3.1). The effect of microwave radiation on plant
vigour, assessed as the total dry weight of germinated plant matter, also became more
pronounced by 50 s of exposure (Figure 3.2). A decrease of 20-25% in vigour was observed at
50 s in both the navy and pinto bean experiments. Between 0-40 s, vigour decreased less than
14%. There was no correlation between microwave exposure and Psp colonization of the seed, as
disease incidence was low at all exposure times (data not shown).
The use of microwave radiation as an alternate seed treatment for Psp showed potential as
limited exposure had a minimal effect on seed germination and vigour. However, the lack of
differences observed in pathogen colonization of the seed (data not shown) required further
testing to determine the efficacy of microwave radiation. To determine a suitable level of
microwave radiation for the field studies, non-linear regressions were performed to determine a
MER, which was defined as the point where a <10% loss in germination occurred. This loss was
considered acceptable if increased disease control was observed in the infected treatments in
field studies, as there are few management strategies that are effective in controlling halo blight.
In navy bean, a 50 s MER was set and for kidney bean a 50 s and 40 s MER were set for 2012
and 2013, respectively (Figure 3.1).
3.4.2 Field Study
Weather Conditions
At both trial sites, seeding dates were early and temperatures ranged between 18-20oC, which
was conducive for Psp growth. In 2012, moderate rainfall events occurred shortly after seeding

76
and helped to promote disease development throughout the season. In 2013, heavy rainfall
shortly after seeding increased stress at both trial sites. This stress was greatest at the Morden
trial site and resulted in the kidney bean trials having to be re-seeded. Conditions throughout the
rest of the season were favourable for disease development and no other significant weather
conditions occurred that negatively affected the trial sites. At the Winkler site, overhead
irrigation was applied both years starting at early flower at a rate of 12.7 mm per week when
natural rainfall events did not occur, to maintain a conducive environment for disease. The
application of irrigation did increase disease incidence at this site compared to Morden, however
this difference did not result in a significant environmental effect.
Emergence
The NIC had the highest emergence at all ratings in kidney bean, except at the Winkler 2012
trial site at 7 DAP where no differences were observed between any of the contrast comparisons
(Table 3.2). This trial was separated out due to lower emergence at 7 DAP, which was attributed
to lower soil temperature and higher soil moisture. The higher emergence in the NIC observed in
the other kidney bean trials was expected, as seed infection has been reported to lower seed
health and emergence (Tu, 1996). However, no differences were observed in navy bean between
the IC and NIC. The lack of differences between the controls was likely due to similarities in the
percentage of germination in both seed lots and possibly a low pathogen colonization of the
infected seed lot, based on observations in the laboratory study.
When comparing the IC to the seed treatments applied alone and in combination with
microwave treatment, no differences in emergence were observed in either navy or kidney beans
(Table 3.2). Differences between the two chemical treatments also were not detected. The
absence of differences between these treatments suggests little phytotoxicity of the chemical

77
treatments on seedling emergence. The application of PFM has been reported to increase
emergence and aid in controlling fungal pathogens (Barton, W. R., pers. comm., BASF Canada,
Mississauga, ON); however, the presence of Psp in these seed lots may have masked the effect
on emergence as its efficacy on Psp has not been determined. It is unknown if Cu(OH)2 increases
seed emergence, but an increase in emergence was expected as it is a bactericide known for
controlling halo blight. In addition, the efficacy of Cu(OH)2 as a seed treatment is not as well
studied as its application as a foliar treatment (Garrett and Schwartz, 1998).
In comparing the microwave treatment to the chemical treatments, a decrease in emergence
was observed in the majority of the trials (Table 3.2) and no additional control was detected in
any of the combination treatments. In navy bean, a loss between 6-9% in emergence was
detected at all rating dates when microwave treatment was compared to PFM + Cu(OH)2 (ST)
and ST + Microwave. A 9% delay in emergence was also observed at 7 and 10 DAP when
comparing Cu(OH)2 to Cu(OH)2 + Microwave, but this was not evident at 20 DAP. This delay in
emergence was likely due to increased stress on the seed from the 1x Microwave treatment
(Table 3.2). Up to an 18% loss in emergence was measured when comparing the ½x Microwave
and 1x Microwave treatments. This loss was above the 10% standard set for the MER, which
suggests that a lower microwave exposure time was required. Despite these high losses in
germination for the 1x Microwave treatment, no differences were observed between the IC and
microwave treatment and emergence decreased less than the MER of 10% when microwave
treatment was compared to the chemical treatments.
The application of microwave radiation had less impact on germination in kidney bean where
emergence only decreased up to 6% when compared to ST at 10 and 20 DAP and PFM versus
PFM + Microwave at 20 DAP (Table 3.2). The adverse effect of microwave treatment on the

78
emergence ratings for kidney bean occurred later than that observed in navy bean. The difference
in the timing of these effects may be due to the differences in seed size. The kidney bean’s larger
seed size may have led to more uniform emergence early in the season as the larger seeded bean
varieties have a greater food reserve to aid in seedling survival during germination (Conner et al.,
2006b).
Disease Incidence & Severity
Few differences in leaf disease incidence were observed and no differences were detected for
leaf disease severity or percent pod infection (Table 3.3). Disease incidence and severity were
much higher in kidney bean than observed in navy bean. This was attributed to the higher
susceptibility in the kidney market class to halo blight (Zaumeyer and Meiners, 1975; Singh et
al., 2007). Treatment differences for the leaf disease incidence were only observed in kidney
bean at 7 WAP. The NIC had lower disease incidence compared to the IC, but in later ratings no
other differences were detected (Table 3.3). Even though the seed for the NIC was grown in an
area that was suitable for the production of disease-free seed, moderate levels of halo blight
infection were observed. The infection of these seed lots was likely due to latent infection of the
seed.
In comparing the IC to the chemical treatments in kidney bean, increased disease control was
observed when ST was used, but not when ST + Microwave was applied (Table 3.3). This
suggests an negative effect resulted from the combination of the microwave and chemical
treatment. However, when Cu(OH)2 + Microwave treatment was compared to Microwave
treatment alone, a benefit of the addition of Cu(OH)2 was observed. The inconsistency between
these two combination treatments may have been due to the lower efficacy of PFM compared to
Cu(OH)2. The addition of PFM may have reduced the efficacy of ST and ST + Microwave

79
treatments compared to the IC. The application of either PFM or microwave treatment to
Cu(OH)2 did not increase disease control in any of the contrasts.
At 11 WAP, increased disease incidence was observed in navy bean, but no differences
between contrasts were detected in navy or kidney bean (data not shown). The absence of
differences at the later rating of the kidney bean suggests that the ST was unable to control halo
blight under prolonged disease pressure. Disease severity at 11 WAP did not change from that
observed at 7 WAP and no differences were observed (data not shown). Pod infection of both
market classes was low and no differences were detected (Table 3.3).
Hundred Seed Weight & Seed Pick
In contrast comparisons for HSW and seed pick, all treatments were better than the IC in
kidney bean, but no differences were detected in navy bean (Table 3.4). The absence of
differences in navy bean was attributed to the uniform disease pressure observed among all
treatments earlier in the growing season (Table 3.3). In kidney bean, the HSW and seed pick in
the NIC, ST, Microwave, and ST + Microwave treatments were up to 19.5% better than the IC
(Table 3.4). The lower seed weight in the IC was likely in response to halo blight infection
(Taylor et al., 1979a), while the increased seed pick was attributed to higher disease pressure
earlier in the growing season (Table 3.3). However, unlike in the ST and NIC treatments, lower
disease pressure was not observed in the microwave and ST + Microwave treatments in the
disease incidence ratings (Table 3.3). These results could be attributed to the Cu(OH)2
component of ST, as increased disease control with Cu(OH)2 was observed in other contrast
comparisons. The increased HSW for microwave treatment compared to the IC may have been
related to the lower seed pick, as the lower seed pick suggests some measure of disease control.
80
However, differences in disease control were not evident in the leaf disease ratings earlier in the
season (Table 3.3).
No differences in contrast comparisons for HSW were observed between the microwave and
chemical treatments applied alone or in combination, except for the Microwave versus Cu(OH)2
+ Microwave treatment (Table 3.4). An increased HSW was noted in the Cu(OH)2 + Microwave
treatment, which agrees with the better disease control observed earlier in the growing season
(Table 3.3). The increase in control when Cu(OH)2 and Microwave treatment were applied
together, seen in early disease incidence ratings (Table 3.3), was not observed for seed pick
(Table 3.4), indicating that season long control was not achieved.
Yield & Return on Investment
For navy bean, the Morden and Winkler trial sites were analyzed separately due to a
significant (P< 0.05) environment x treatment effect, which was likely due to differences in
environmental conditions such as rainfall, soil conditions, and irrigation levels. For kidney bean,
the Winkler 2012 trial site was presented separately due to decreased yield and ROI compared to
the other site years.
In contrast comparisons for yield only a few differences were observed. The NIC had higher
yields than the IC, but this only was observed in kidney bean trials (Table 3.5). Other treatment
differences were only detected in the Winkler 2012 kidney trial, where ST and ST + Microwave
treatment had yields 237-368 kg ha-1
higher than the IC. This was attributed to the chemical
components, as no increase in yield was seen when the microwave treatment was applied alone.
The benefit of the chemical component was also observed in the Winkler navy bean trials, where
both ST alone and PFM + Microwave treatment had yields 320-327 kg ha-1
higher than
microwave treatment alone. In kidney bean grown in Winkler 2012, yields were 235 kg ha-1

81
higher for Cu(OH)2 + Microwave compared to the microwave treatment. Microwave treatment
applied alone did not increase yields at any of the trial sites and in the Winkler 2012 kidney bean
trial it actually decreased yield when PFM was compared to PFM + Microwave. A similar
difference was observed between the ½x and 1x Microwave treatments in the Winkler navy bean
trials and the 2012 Winkler kidney bean trials. These differences were likely due to the
differences in emergence, as described earlier.
For ROI, differences were only observed in the kidney bean trials (Table 3.6). The NIC had
the highest ROI, which was up to 74% better than the IC. At the Winker 2012 kidney trial site,
the ST, Microwave, and ST + Microwave treatments all had higher ROI than the IC. This
response was not observed in the other kidney bean trials. The larger ROI for microwave
treatment when compared to the IC was not expected as no differences were detected for yield,
but the lower percentage of seed pick for the microwave treatment (Table 3.4) may have been a
contributing factor.
In the kidney bean trials excluding Winkler 2012, the Cu(OH)2 treatment had a ROI $352 ha-1
greater than PFM, which was due to the large difference in cost for the two products, as no yield
differences were observed (Table 3.5). Comparing Microwave to PFM + Microwave, a loss in
ROI was also noted, which provides further evidence that the higher cost of PFM with no
associated benefit on yield negatively impacted ROI (Table 3.6). In several contrast comparisons
(PFM versus PFM + Microwave, ½x versus 1x Microwave, and Microwave versus Cu(OH)2 +
Microwave), a relationship between yield and ROI was observed, in that yield increases resulted
in a higher ROI. This is due to the fact that yield is a large component in the ROI calculation. In
Figure 3.3, a linear regression confirmed the high correlation of these factors (R2= 0.66-0.98). In
the Morden navy bean and kidney bean trials the correlation was greatest and for every 1 kg ha-1

82
increase in yield, the ROI increased between $0.74 and $0.82 ha-1
, respectively. In the Winkler
navy bean trials, this correlation was lower and return was not as high (Figure 3.3) due to lower
seeding emergence early in the growing season (Table 3.2). No significant correlation could be
made between yield and ROI in the Winkler 2012 kidney bean as variability between the
treatments was too great (data not shown).
Microwave radiation had minimal impact on dry bean seed germination, vigour or pathogen
viability following short (0-40 s) intervals of exposure. The application of Cu(OH)2, compared to
the other treatments, slightly increased disease control early in the season in the kidney beans,
which contributed to a lower seed pick and increased HSW, yield, and ROI at the end of the
season. The use of PFM, however, did not provide equivalent control when compared to the
industry standard and did not perform well enough to justify the increased cost. The addition of
microwave radiation to chemical treatment was inexpensive, but did not provide a benefit for
emergence, disease control, HSW, seed pick, yield or ROI. Further research into the benefits of
Cu(OH)2 as a seed treatment and alternative control methods are warranted, as there is little
evidence that microwave radiation provided a measurable level of control for halo blight.
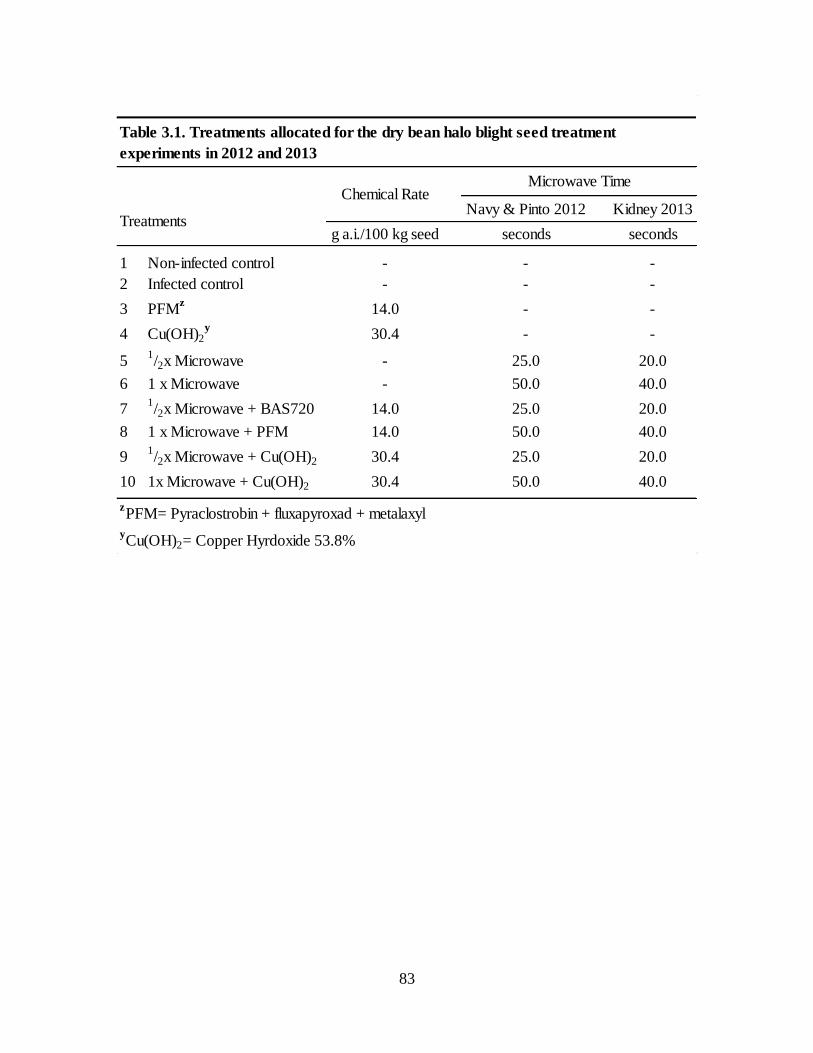
83
Navy & Pinto 2012 Kidney 2013
g a.i./100 kg seed seconds seconds
1 Non-infected control - - -
2 Infected control - - -
3 PFMz
14.0 - -
4 Cu(OH)2y
30.4 - -
51/2x Microwave - 25.0 20.0
6 1 x Microwave - 50.0 40.0
71/2x Microwave + BAS720 14.0 25.0 20.0
8 1 x Microwave + PFM 14.0 50.0 40.0
91/2x Microwave + Cu(OH)2 30.4 25.0 20.0
10 1x Microwave + Cu(OH)2 30.4 50.0 40.0
zPFM= Pyraclostrobin + fluxapyroxad + metalaxyl
yCu(OH)2= Copper Hyrdoxide 53.8%
Table 3.1. Treatments allocated for the dry bean halo blight seed treatment
experiments in 2012 and 2013
Chemical RateMicrowave Time
Treatments
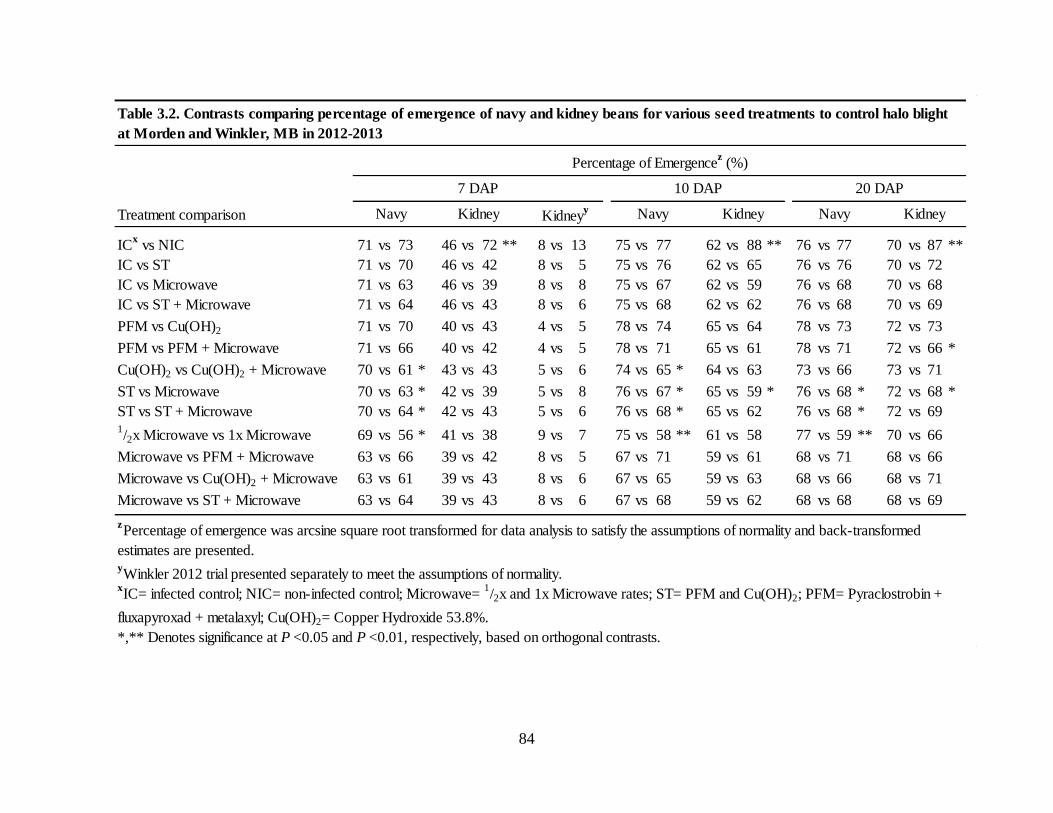
84
Treatment comparison
ICx vs NIC 71 vs 73 46 vs 72 ** 8 vs 13 75 vs 77 62 vs 88 ** 76 vs 77 70 vs 87 **
IC vs ST 71 vs 70 46 vs 42 8 vs 5 75 vs 76 62 vs 65 76 vs 76 70 vs 72
IC vs Microwave 71 vs 63 46 vs 39 8 vs 8 75 vs 67 62 vs 59 76 vs 68 70 vs 68
IC vs ST + Microwave 71 vs 64 46 vs 43 8 vs 6 75 vs 68 62 vs 62 76 vs 68 70 vs 69
PFM vs Cu(OH)2 71 vs 70 40 vs 43 4 vs 5 78 vs 74 65 vs 64 78 vs 73 72 vs 73
PFM vs PFM + Microwave 71 vs 66 40 vs 42 4 vs 5 78 vs 71 65 vs 61 78 vs 71 72 vs 66 *
Cu(OH)2 vs Cu(OH)2 + Microwave 70 vs 61 * 43 vs 43 5 vs 6 74 vs 65 * 64 vs 63 73 vs 66 73 vs 71
ST vs Microwave 70 vs 63 * 42 vs 39 5 vs 8 76 vs 67 * 65 vs 59 * 76 vs 68 * 72 vs 68 *
ST vs ST + Microwave 70 vs 64 * 42 vs 43 5 vs 6 76 vs 68 * 65 vs 62 76 vs 68 * 72 vs 691/2x Microwave vs 1x Microwave 69 vs 56 * 41 vs 38 9 vs 7 75 vs 58 ** 61 vs 58 77 vs 59 ** 70 vs 66
Microwave vs PFM + Microwave 63 vs 66 39 vs 42 8 vs 5 67 vs 71 59 vs 61 68 vs 71 68 vs 66
Microwave vs Cu(OH)2 + Microwave 63 vs 61 39 vs 43 8 vs 6 67 vs 65 59 vs 63 68 vs 66 68 vs 71
Microwave vs ST + Microwave 63 vs 64 39 vs 43 8 vs 6 67 vs 68 59 vs 62 68 vs 68 68 vs 69
yWinkler 2012 trial presented separately to meet the assumptions of normality.
*,** Denotes significance at P <0.05 and P <0.01, respectively, based on orthogonal contrasts.
Table 3.2. Contrasts comparing percentage of emergence of navy and kidney beans for various seed treatments to control halo blight
at Morden and Winkler, MB in 2012-2013
Percentage of Emergencez
(%)
10 DAP
KidneyKidneyy
7 DAP
Navy
20 DAP
Kidney Navy Kidney Navy
zPercentage of emergence was arcsine square root transformed for data analysis to satisfy the assumptions of normality and back-transformed
estimates are presented.
xIC= infected control; NIC= non-infected control; Microwave=
1/2x and 1x Microwave rates; ST= PFM and Cu(OH)2; PFM= Pyraclostrobin +
fluxapyroxad + metalaxyl; Cu(OH)2= Copper Hydroxide 53.8%.
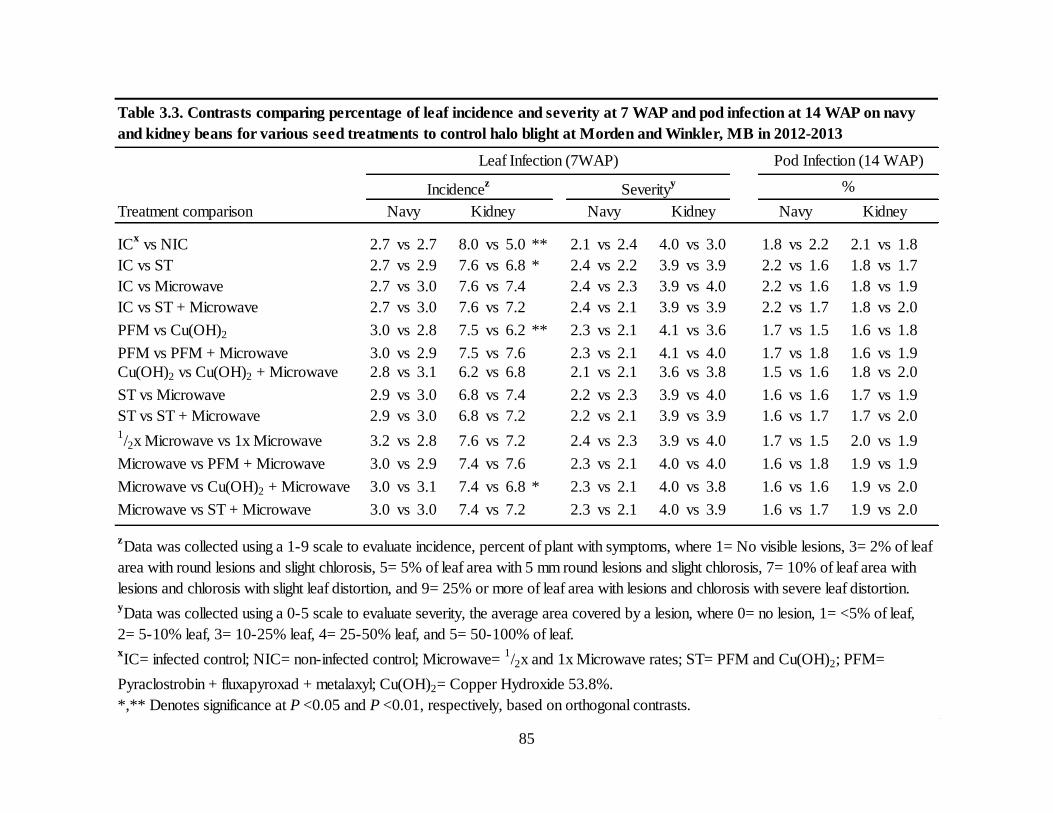
85
Treatment comparison
ICx vs NIC 2.7 vs 2.7 8.0 vs 5.0 ** 2.1 vs 2.4 4.0 vs 3.0 1.8 vs 2.2 2.1 vs 1.8
IC vs ST 2.7 vs 2.9 7.6 vs 6.8 * 2.4 vs 2.2 3.9 vs 3.9 2.2 vs 1.6 1.8 vs 1.7
IC vs Microwave 2.7 vs 3.0 7.6 vs 7.4 2.4 vs 2.3 3.9 vs 4.0 2.2 vs 1.6 1.8 vs 1.9
IC vs ST + Microwave 2.7 vs 3.0 7.6 vs 7.2 2.4 vs 2.1 3.9 vs 3.9 2.2 vs 1.7 1.8 vs 2.0
PFM vs Cu(OH)2 3.0 vs 2.8 7.5 vs 6.2 ** 2.3 vs 2.1 4.1 vs 3.6 1.7 vs 1.5 1.6 vs 1.8
PFM vs PFM + Microwave 3.0 vs 2.9 7.5 vs 7.6 2.3 vs 2.1 4.1 vs 4.0 1.7 vs 1.8 1.6 vs 1.9
Cu(OH)2 vs Cu(OH)2 + Microwave 2.8 vs 3.1 6.2 vs 6.8 2.1 vs 2.1 3.6 vs 3.8 1.5 vs 1.6 1.8 vs 2.0
ST vs Microwave 2.9 vs 3.0 6.8 vs 7.4 2.2 vs 2.3 3.9 vs 4.0 1.6 vs 1.6 1.7 vs 1.9
ST vs ST + Microwave 2.9 vs 3.0 6.8 vs 7.2 2.2 vs 2.1 3.9 vs 3.9 1.6 vs 1.7 1.7 vs 2.01/2x Microwave vs 1x Microwave 3.2 vs 2.8 7.6 vs 7.2 2.4 vs 2.3 3.9 vs 4.0 1.7 vs 1.5 2.0 vs 1.9
Microwave vs PFM + Microwave 3.0 vs 2.9 7.4 vs 7.6 2.3 vs 2.1 4.0 vs 4.0 1.6 vs 1.8 1.9 vs 1.9
Microwave vs Cu(OH)2 + Microwave 3.0 vs 3.1 7.4 vs 6.8 * 2.3 vs 2.1 4.0 vs 3.8 1.6 vs 1.6 1.9 vs 2.0
Microwave vs ST + Microwave 3.0 vs 3.0 7.4 vs 7.2 2.3 vs 2.1 4.0 vs 3.9 1.6 vs 1.7 1.9 vs 2.0
*,** Denotes significance at P <0.05 and P <0.01, respectively, based on orthogonal contrasts.
NavyNavy Navy Kidney Kidney
Incidencez
Severityy
Kidney
Leaf Infection (7WAP) Pod Infection (14 WAP)
%
Table 3.3. Contrasts comparing percentage of leaf incidence and severity at 7 WAP and pod infection at 14 WAP on navy
and kidney beans for various seed treatments to control halo blight at Morden and Winkler, MB in 2012-2013
zData was collected using a 1-9 scale to evaluate incidence, percent of plant with symptoms, where 1= No visible lesions, 3= 2% of leaf
area with round lesions and slight chlorosis, 5= 5% of leaf area with 5 mm round lesions and slight chlorosis, 7= 10% of leaf area with
lesions and chlorosis with slight leaf distortion, and 9= 25% or more of leaf area with lesions and chlorosis with severe leaf distortion.yData was collected using a 0-5 scale to evaluate severity, the average area covered by a lesion, where 0= no lesion, 1= <5% of leaf,
2= 5-10% leaf, 3= 10-25% leaf, 4= 25-50% leaf, and 5= 50-100% of leaf.xIC= infected control; NIC= non-infected control; Microwave=
1/2x and 1x Microwave rates; ST= PFM and Cu(OH)2; PFM=
Pyraclostrobin + fluxapyroxad + metalaxyl; Cu(OH)2= Copper Hydroxide 53.8%.

86
Treatment comparison
ICz vs NIC 21.1 vs 21.0 41.0 vs 49.0 ** 5.1 vs 3.4 23.1 vs 13.7 **
IC vs ST 21.1 vs 20.8 41.0 vs 43.9 ** 5.1 vs 4.4 23.1 vs 19.4 *
IC vs Microwave 21.1 vs 21.1 41.0 vs 42.7 * 5.1 vs 5.0 23.1 vs 19.6 *
IC vs ST + Microwave 21.1 vs 21.4 41.0 vs 43.4 ** 5.1 vs 4.5 23.1 vs 20.0 *
PFM vs Cu(OH)2 20.9 vs 20.7 43.4 vs 44.3 4.5 vs 4.3 20.2 vs 18.7
PFM vs PFM + Microwave 20.9 vs 21.3 43.4 vs 42.1 4.5 vs 4.8 20.2 vs 22.0
Cu(OH)2 vs Cu(OH)2 + Microwave 20.7 vs 21.4 44.3 vs 44.7 4.3 vs 4.2 18.7 vs 17.9
ST vs Microwave 20.8 vs 21.1 43.9 vs 42.7 4.4 vs 5.0 19.4 vs 19.6
ST vs ST + Microwave 20.8 vs 21.4 43.9 vs 43.4 4.4 vs 4.5 19.4 vs 20.01/2x Microwave vs 1x Microwave 21.3 vs 21.0 42.6 vs 42.7 5.2 vs 4.9 17.8 vs 21.3
Microwave vs PFM + Microwave 21.1 vs 21.3 42.7 vs 42.1 5.0 vs 4.8 19.6 vs 22.0
Microwave vs Cu(OH)2 + Microwave 21.1 vs 21.4 42.7 vs 44.7 ** 5.0 vs 4.2 19.6 vs 17.9
Microwave vs ST + Microwave 21.1 vs 21.4 42.7 vs 43.4 5.0 vs 4.5 19.6 vs 20.0
*,** Denotes significance at P <0.05 and P <0.01, respectively, based on orthogonal contrasts.
Table 3.4. Contrasts comparing hundred seed weight (HSW) and percentage of seed pick on navy and kidney
beans for various seed treatments to control halo blight at Morden and Winkler, MB in 2012-2013
HSW Seed Pick (%)
zIC= infected control; NIC= non-infected control; Microwave=
1/2x and 1x Microwave rates; ST= PFM and Cu(OH)2;
PFM= Pyraclostrobin + fluxapyroxad + metalaxyl; Cu(OH)2= Copper Hydroxide 53.8%.
Navy Kidney Navy Kidney

87
Treatment comparison
ICx vs NIC 4119 vs 3981 4100 vs 3808 2144 vs 3363 ** 558 vs 1371 **
IC vs ST 4119 vs 4050 4100 vs 4331 2144 vs 2372 558 vs 926 **
IC vs Microwave 4119 vs 3910 4100 vs 4004 2144 vs 2206 558 vs 741
IC vs ST + Microwave 4119 vs 4196 4100 vs 4159 2144 vs 2190 558 vs 795 *
PFM vs Cu(OH)2 3999 vs 4101 4366 vs 4295 2180 vs 2564 876 vs 975
PFM vs PFM + Microwave 3999 vs 4252 4366 vs 4324 2180 vs 2033 876 vs 641 *
Cu(OH)2 vs Cu(OH)2 + Microwave 4101 vs 4140 4295 vs 3995 2564 vs 2347 975 vs 950
ST vs Microwave 4050 vs 3910 4331 vs 4004 * 2372 vs 2206 926 vs 741
ST vs ST + Microwave 4050 vs 4196 4331 vs 4159 2372 vs 2190 926 vs 7951/2x Microwave vs 1x Microwave 4131 vs 3688 4299 vs 3709 ** 2271 vs 2141 892 vs 590 *
Microwave vs PFM + Microwave 3910 vs 4252 4004 vs 4324 * 2206 vs 2033 741 vs 641
Microwave vs Cu(OH)2 + Microwave 3910 vs 4140 4004 vs 3995 2206 vs 2347 741 vs 950 *
Microwave vs ST + Microwave 3910 vs 4196 4004 vs 4159 2206 vs 2190 741 vs 795
zWinkler 2012 trial separated out to meet the assumptions of normality.
*,** Denotes significance at P <0.05 and P <0.01, respectively, based on orthogonal contrasts.
Kidneyz
Table 3.5. Contrasts comparing yield on navy and kidney beans for various seed treatments to control halo
blight at Morden and Winkler, MB in 2012-2013
Yield (kg ha-1
)
xIC= infected control; NIC= non-infected control; Microwave=
1/2x and 1x Microwave rates; ST= PFM and Cu(OH)2;
PFM= Pyraclostrobin + fluxapyroxad + metalaxyl; Cu(OH)2= Copper Hydroxide 53.8%.
Navy Morden Navy Winkler Kidney

88
Treatment comparison
ICx vs NIC 3223 vs 3173 2977 vs 2924 1388 vs 2696 ** 286 vs 1108 **
IC vs ST 3223 vs 3183 2977 vs 3123 1388 vs 1538 286 vs 695 **
IC vs Microwave 3223 vs 3032 2977 vs 2930 1388 vs 1495 286 vs 522 *
IC vs ST + Microwave 3223 vs 3267 2977 vs 3020 1388 vs 1384 286 vs 553 *
PFM vs Cu(OH)2 3125 vs 3241 3102 vs 3145 1362 vs 1714 * 600 vs 791
PFM vs PFM + Microwave 3125 vs 3249 3102 vs 3098 1362 vs 1170 600 vs 357 *
Cu(OH)2 vs Cu(OH)2 + Microwave 3241 vs 3285 3145 vs 2943 1714 vs 1598 791 vs 750
ST vs Microwave 3183 vs 3032 3123 vs 2930 1538 vs 1495 695 vs 522
ST vs ST + Microwave 3183 vs 3267 3123 vs 3020 1538 vs 1384 695 vs 5531/2x Microwave vs 1x Microwave 3193 vs 2872 3118 vs 2742 1562 vs 1427 681 vs 364 *
Microwave vs PFM + Microwave 3032 vs 3249 2930 vs 3098 1495 vs 1170 ** 522 vs 357
Microwave vs Cu(OH)2 + Microwave 3032 vs 3285 2930 vs 2943 1495 vs 1598 522 vs 750 *
Microwave vs ST + Microwave 3032 vs 3267 2930 vs 3020 1495 vs 1384 522 vs 553
zWinkler 2012 trial separated out to meet the assumptions of normality.
*,** Denotes significance at P <0.05 and P <0.01, respectively, based on orthogonal contrasts.
Table 3.6. Contrasts comparing return on investment (ROI) on navy and kidney beans for various seed
treatments to control halo blight at Morden and Winkler, MB in 2012-2013
xIC= infected control; NIC= non-infected control; Microwave=
1/2x and 1x Microwave rates; ST= PFM and
Cu(OH)2; PFM= Pyraclostrobin + fluxapyroxad + metalaxyl; Cu(OH)2= Copper Hydroxide 53.8%.
ROI ($ ha-1
)
Navy Morden Navy Winkler Kidney Kidneyz

89
Figure 3.1. Nonlinear regressions (NLIN) of percentage of germination of navy and kidney bean seed incubated in a germination
chamber for 7 d at 25oC following various microwave radiation treatments in 2012 and 2013.Navy data was arcsine square root
transformed for data analysis to meet the assumptions of normality and back-transformed estimates are presented.
0
20
40
60
80
100
120
0 10 20 30 40 50 60 70 80 90
Ger
min
taio
n (
%)
Time (s)
Navy
Kidney
NLIN (Navy)
NLIN (Kidney 2012)
NLIN (Kidney 2013)
Navy Y = 0.35 + 1.08−0.35
1+exp(9.14 log 𝑥 −log(64.12)
P< .0001
Kidney 2012 Y = 13.72 + 60.58−13.72
1+exp(13.61 log 𝑥 −log(65.86)
P< .0001
Kidney 2013 Y = 72.20
1+exp(6.98 log 𝑥 −log(61.87)
P< .0001

90
Figure 3.2. Nonlinear regressions (NLIN) of plant vigour (dry weights of germinated material) from navy and kidney bean seed
incubated at 25oC for 7 d in a germination chamber after various microwave radiation treatments in 2012 and 2013.
0
5
10
15
20
25
30
35
40
45
0 10 20 30 40 50 60 70 80 90
Dry
Wei
gh
t (g
)
Time (s)
Navy
Kidney
NLIN (Navy)
NLIN (Kidney)
Navy Y = = 2.06 + 15.52−2.06
1+exp(6.84 log 𝑥 −log(74.97)
P< .0001
Kidney Y = = 0.71 + 32.40−0.71
1+exp(7.62 log 𝑥 −log(69.11)
P< .0001
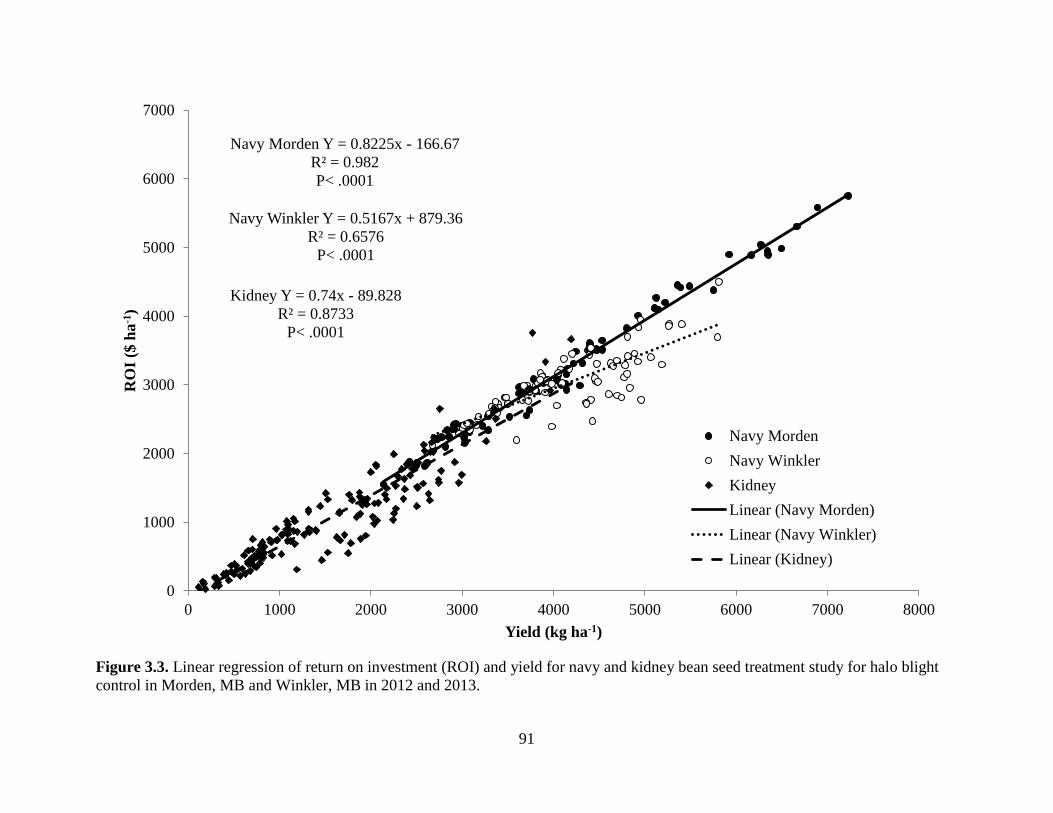
91
Figure 3.3. Linear regression of return on investment (ROI) and yield for navy and kidney bean seed treatment study for halo blight
control in Morden, MB and Winkler, MB in 2012 and 2013.
Navy Morden Y = 0.8225x - 166.67
R² = 0.982
P< .0001
Navy Winkler Y = 0.5167x + 879.36
R² = 0.6576
P< .0001
Kidney Y = 0.74x - 89.828
R² = 0.8733
P< .0001
0
1000
2000
3000
4000
5000
6000
7000
0 1000 2000 3000 4000 5000 6000 7000 8000
RO
I ($
ha
-1)
Yield (kg ha-1)
Navy Morden
Navy Winkler
Kidney
Linear (Navy Morden)
Linear (Navy Winkler)
Linear (Kidney)
92
CHAPTER FOUR
Effect of Microwave Radiation on Dry Bean Seed Infected with Colletotrichum
lindemuthianum with and without the Use of Chemical Seed Treatment
4.1 Abstract
Seed-borne anthracnose, caused by Colletotrichum lindemuthianum, is a serious disease that
affects dry bean (Phaseolus vulgaris L.) seed quality and yield. A two-year study was conducted
to examine the effect of microwave radiation on two market classes: navy (cv. Navigator) and
pinto (cv. AC Ole) bean. In the laboratory, an exposure time between 40-50 s caused <10%
decrease in seed germination and 0.14 and 0.10% s-1
decrease in pathogen viability for navy and
pinto bean, respectively. Field studies conducted at Ridgetown and Exeter, ON evaluated the
effect of microwave radiation and two chemical seed treatments (thiamethoxam + fludioxonil +
metalaxyl-M + azoxystrobin and pyraclostrobin + fluxapyroxad + metalaxyl), on emergence,
percentage of infection, seed pick, yield and return on investment. Microwave treatment
decreased emergence by <10% in both market classes and decreased disease symptoms by 17-
30% for leaf and stem infection in the pinto bean when combined with chemical seed treatment.
Chemical treatment alone decreased disease symptoms by 30% in navy bean. Microwave
treatment did not affect pod infection, seed pick, yield, or the return on investment, yet chemical
treatment increased yield between 6-25% in the navy bean.
4.2 Introduction
Colletotrichum lindemuthianum (Sacc. & Magnus) Briosi & Cavara is the causal agent of the
seed-borne disease anthracnose in dry bean (Phaseolus vulgaris L.). When present, anthracnose
can lower seed quality and reduce yields by up to 100% in environments with high humidity and

93
frequent rainfall (Schwartz et al., 2005). Disease symptoms can develop early in the growing
season and occur primarily on petioles and veins of the lower leaf surface of seedlings. Later in
the growing season, the lesions become black and sunken with a dark brown margin and can
spread to the upper leaves, stems and pods (Schwartz et al., 2005). The development of lesions
on the pods can lead to infection of the developing seed coats and cotyledons, resulting in
discolouration and dark brown to black cankers on the seed (Tu, 1988).
Many management strategies have been suggested to reduce the spread of anthracnose via
infected seed. The use of disease-free seed is the primary control measure recommended for
anthracnose; however, sourcing this seed can be difficult and expensive. The use of other
management strategies, such as cultural (Dillard and Cobb, 1993; Schwartz et al., 2005),
chemical control (Trutmann et al., 1992) and genetic resistance (Ntahimpera et al., 1996) have
also been utilized to reduce spread of anthracnose. Even with these control practices, anthracnose
can still be difficult to manage as it can survive on infected crop debris (Dillard and Cobb, 1993).
In addition, the anthracnose fungus possesses a high level of pathogenic variation, which limits
the effectiveness of genetic control methods (Schwartz and Corrales, 1989).
Chemical seed treatment has been commonly used for controlling anthracnose as it has been
shown to effectively reduce disease transmission from seed with small to medium sized
anthracnose lesions (Tu, 1988). The use of thiamethoxam + fludioxonil + metalaxyl-M +
azoxystrobin (TFMA) as a seed treatment has become the latest industry standard for controlling
anthracnose as well as numerous soil-borne pathogens (Gillard and Ranatunga, 2013). The
azoxystrobin component of TFMA, a strobilurin, has recently replaced the thiophanate-methyl
component of DCT (diazinon + captan + thiophanate-methyl), the former industry standard in
Ontario (Gillard et al., 2012a; Gillard and Ranatunga, 2013). However, even the application of

94
seed treatments like TFMA and DCT have been unable to fully eradicate anthracnose. Despite a
reduction in incidence, disease symptoms are still frequently observed in treated fields (Gillard
and Ranatunga, 2013).
The use of alternative seed treatment methods, such as thermotherapy, has been reported to
effectively reduce or eliminate seed-borne pathogens from numerous crops (Grondeau et al.,
1994). In dry bean, the use of alternative treatments like hot water or hot dry air decreased
pathogen viability, but severely impacted bean germination (Sinclair, 1993). The use of
microwave radiation as an alternate form of thermotherapy has successfully controlled pathogens
in crops such as Triticum spp., tobacco (Nicotiana tabacum ‘Consolidate L.’), cassava true seed
(Manihot esculenta Crantz) and soybean (Glycine max L.) (Hankin and Sands, 1977; Cavalcante
and Muchovej, 1993; Han, 2010; Knox et al., 2013). The effect of microwave treatment on dry
bean has been previously tested for its effect on seed germination and vigor and had little impact
on seed germination at low levels of radiation (Spilde, 1989; Tylkowska et al., 2010) The use of
microwave radiation was also tested for its effect on several different fungi (e.g. Alternaria
alternata (Fr.) Keissler, Fusarium spp. and Penicillium spp.) and was effective in reducing the
growth of Penicillium spp. on bean seed (Tylkowska et al., 2010). The authors hypothesized that
microwave radiation would also control C. lindemuthianum, as microwave radiation appeared to
have a greater effect on fungi with single-celled hyaline spores, but this theory was never tested
(Cavalcante and Muchovej, 1993; Tylkowska et al., 2010).
The use of a treatment like microwave radiation could be highly beneficial to growers as a
low cost treatment that could reduce or even eliminate the pathogen from infected seed while not
severely impacting germination. It is unlikely that microwave radiation would be utilized alone
for control of all pathogens, but it could be an inexpensive addition to a chemical seed treatment

95
to increase anthracnose control. Therefore, to further explore the hypotheses suggested by
Tylkowska et al. (2010), the efficacy of microwave radiation on two dry bean market classes,
navy and pinto bean, naturally infected with C. lindemuthianum were tested alone and in
combination with chemical seed treatments. Navy and pinto bean market classes were selected
due to their commercial importance in Canada, the obvious difference in seed size between dry
beans (Swings and Civerolo, 1993) and the high susceptibility of many of the cultivars in these
classes. The purpose of this study was to determine the effect of microwave radiation on seed
germination and vigour and the effect on C. lindemuthianum viability and anthracnose
development.
4.3 Materials & Methods
4.3.1 Laboratory Study
A two-year thermotherapy study organized as a randomized complete block design (RCBD)
was conducted on navy (cv. Navigator) and pinto (cv. AC Ole) bean seed naturally infected with
C. lindemuthianum to determine the effect of microwave radiation on seed germination and C.
lindemuthianum viability. Seed was obtained from field trials in 2011 in Morden, MB and from
Exeter, ON in 2012 for the 2012 and 2013 laboratory studies, respectively. A Sortex electric eye
(model 425BF, Gunson Sortex Ltd., London, UK) was used to sort blemished and unblemished
seed in order to achieve a seed lot with a 10% discolouration rate. Blemished seed had lesions
characteristic of anthracnose, which were identified as race 73 based on the pattern of disease
severity on the 12 differential cultivars (Melotto et al., 2000). Seed was dried down using a
Fisher Scientific Isotemp Forced Air Oven (120 V, 60 Hz, 1800 w, 15.5 A) and dry weights were
taken until seed reached a stable weight to determine the seed moisture content for each seed lot.
In the 2012 and 2013 season, the moisture content of navy bean and 2012 pinto bean ranged

96
between 6.6-7.6%, while in the 2013 pinto beans it was 10.6%. Four replicates of seed were
exposed to ten microwave durations ranging from 0-90 s in 10 s increments using a consumer
grade microwave oven (1100W 2450 MHz, General Electric Co. Fairfield, Connecticut, U.S.).
Experimental units consisting of 150 seeds were placed on a paper plate. A 450-500 ml beaker
containing 200 ml of water was placed at the center of the plate. The temperature of the water
was measured before and after each microwave radiation to determine the change in temperature
resulting from the microwave treatment (Reddy et al., 2000).
After treatment, 100 seeds per treatment were planted in 21.6 cm x 13.0 cm x 10.2 cm clam
lid plastic containers (Par-Pak Ltd., Brampton, ON) using 50 WG 60 Wellpack silica sand (B.P.
Dust Control, Walton, ON) as the growing medium. The seed was incubated in a germination
chamber set at 25oC for 6-7 d using a 12L:12D photoperiod and relative humidity (RH) above
60%. Germination was evaluated using the Canadian Food Inspection Agency (CFIA) methods
and procedures for testing seed (CFIA, 2011). Vigour was assessed as total dry weight of
germinated plant matter in each container.
In 2012, four replicates of disease plating were conducted to evaluate seed infection for each
seed lot, using potato dextrose agar (PDA) amended with 50% lactic acid. Microwave treated
seed was surface-sterilized for 2 min in a 10% sodium hypochlorite solution and five seeds were
placed per plate for a total of 50 seeds per experimental unit. Plated seed was left to germinate
for a minimum of 7 d at room temperature (21-22oC) and evaluated for the percentage of
germination and the percentage of seeds that produced visible colonies of C. lindemuthianum.
4.3.2 Field Study
Field trials were conducted in 2012 and 2013 to further evaluate the effects of microwave
radiation on infected seed. Four studies were conducted at Exeter, ON (one navy and one pinto

97
per year) and three studies at Ridgetown, ON (one pinto and one navy in 2012 and one pinto in
2013). Ten treatments (Table 4.1) were arranged in a randomized complete block design with
four replications, using infected seed from the same seed lots as the laboratory study. Non-
infected control (NIC) treatments were planted using cv. AC Ole pinto bean seed obtained from
disease-free plots in Manitoba and cv. Navigator navy bean seed produced in Idaho (Archer
Daniels Midland Company, Decatur, IL).
The maximum microwave exposure rate (MER), determined from the microwave laboratory
studies, resulted in <10% germination loss (Figure 4.1). This minor loss in germination was
deemed acceptable if the microwave treatment could provide a sufficient level of anthracnose
control. A MER of 50 s was established for the navy bean and 2012 pinto beans trials and 40 s
for the 2013 pinto bean trials. The MER was used as the full microwave treatment (1x
Microwave), while the half microwave (½x Microwave) treatment received half of the MER.
Two chemical seed treatments were evaluated, namely pyraclostrobin + fluxapyroxad +
metalaxyl (PFM) (BASF Canada, Mississauga, ON) and thiamethoxam + fludioxonil +
metalaxyl –M + azoxystrobin (TFMA) (Syngenta Crop Protection Canada Inc., Guelph, ON) at
rates of 14 g a.i. and 51 g a.i. per 100 kg of seed, respectively. All treatments included a
treatment with metalaxyl-M (Bayer CropScience, Guelph, ON) at a rate of 4 g a.i. per 100 kg of
seed to reduce any interference among treatments due to soil-borne pathogens, such as Pythium
spp.
In Exeter, 1.5 m wide (four rows spaced 38 cm apart) by 6.0 m long plots were seeded 14
June 2012 and 21 June 2013. Plots were seeded using a six row cone-seeder in which the middle
four rows were planted and the outer two rows left empty to provide space for evaluations. In
Ridgetown, 1.3 m wide (three rows spaced 43 cm apart) and 6.0 m long plots were seeded 12
98
June 2012 and 17 June 2013. Plots were planted using a five row cone-seeder in which the three
middle rows were planted and the outer two rows left unseeded. At Ridgetown and Exeter, plots
were separated by 5 and 6 rows of soybean (Glycine max (L.) Merr.), respectively. Soybean was
chosen as it is a non-host crop for C. lindemuthianum and minimized disease movement between
plots (Gillard and Ranatunga, 2013). The seeding rate was 20 seeds m-1
of row for the navy and
pinto beans and 33 seeds m-1
of row for soybeans. All plots were trimmed to 5.0 m in length after
emergence.
Emergence and vigour were determined at 7, 10, 14 and 21 d after planting (DAP).
Emergence was measured as the total number of plants emerged in a 4 m length of the center row
and then calculated as a percentage of the seeding rate of 20 seeds m-1
of row. Vigour was
evaluated using a 0-10 scale (0 = poor vigour and 10 = excellent vigour) and each treatment was
compared to the infected control (IC). Non-destructive visual ratings of leaf vein, stem, and pod
symptoms were based on the percentage of the plant tissue covered with anthracnose lesions.
The first leaf vein and stem ratings were initiated when disease incidence had exceeded 3% plant
infection in the IC. Two subsequent ratings were taken for leaf and stem infection at two and
four weeks following the first rating. These ratings were used to calculate the area under the
disease progress curve (AUDPC) using the modified equation:
(
) ( ) (
) ( )
where R1 to R3 are ratings matching to timing t1, t2, and t3 (Wilcoxson et al., 1975). This equation
was modified from the original where four ratings were used to calculate AUDPC. Pod infection
was assessed at the same time as the last leaf and stem rating.
A blanket application of pyraclostrobin (BASF Canada, Mississauga, ON) at a rate of 100 g
a.i. ha-1
was made when 15% of the leaf veins were infected in the IC. The pyraclostrobin

99
application was used to maintain the treatment effects present in the experiments and to
minimize additional disease spread. A pod destruction index (PDI) was carried out on the pods
just prior to harvest using the equation (Gillard et al., 2012a):
PDI = (100*% destroyed pods) + ((% pod area with lesions)*(1 - % destroyed pods))*100
In Exeter, the plots were harvested using an Almaco SPC 40-2 (Almaco, Nevada, IA) small-
plot combine. In Ridgetown, the plots were cut using a SRM-260 Echo power trimmer (Kioritz
Crop., London, ON) and then seed was threshed with a stationary thresher (Almaco, Nevada,
IA). For all plots, total seed weight was recorded and moisture content was determined using a
Motomco 919 moisture meter (Dickey-John Corp., Patterson, NJ). Seed was cleaned using a
10/64 x 3/4 slotted screen to remove dockage (foreign material and split/undersized seed), which
was then expressed as a percentage of the total seed weight (Canadian Grains Commission,
2010). After the dockage was removed, hundred-seed weight (HSW) and seed yield were
determined and adjusted to 18% moisture. Seed pick was recorded as a percentage of seed with
visible anthracnose lesions in a 100 seed sample. Evaluations on seed pick were made to mimic
the methods used by Ontario dry bean processors in the grading of beans. The return on
investment (ROI) for each treatment was calculated using the modified calculation (Gillard and
Ranatunga, 2013):
ROI = ((Seed Yield - Dockage - 2(Pick))* Seed Price kg-1
) - Cost of Seed Treatment
Seed prices for navy and pinto beans were $0.84 kg-1
and $0.73 kg-1
, respectively (Agricorp,
2013). The percentage of pick was doubled, once to account for loss of poor quality seed and
once for the cost of removing the infected seed. To determine the cost of the seed treatments,
seeding density and manufacturer’s suggested retail prices were used. Differences in row width
resulted in a slight difference in seeding density, which led to differences in seed treatment costs

100
between the Ridgetown and Exeter sites. For TFMA, a cost of $53.96 ha-1
in Ridgetown and
$61.87 ha-1
in Exeter were calculated. The same prices were used for PFM to make the treatment
costs comparable, because no price has been set for this product. Microwave treatment costs
were calculated using seeding density and electricity costs at a rate of 12.54¢ kWh-1
according to
the Ontario Energy Board average cost per kWh. In navy bean, 1x Microwave treatment costs
were $2.03 ha-1
and $2.32 ha-1
for Ridgetown and Exeter, respectively. In pinto bean, 1x
Microwave treatment costs were $2.70 ha-1
and $3.10 ha-1
in 2012 and $2.32 ha-1
and $2.48 ha-1
in 2013 for Ridgetown and Exeter respectively. Lower exposure times were used in 2013 than in
2012, resulting in differences in cost for pinto bean. The cost was divided by two in all trials for
the ½x Microwave treatments.
4.3.3 Statistical Analysis
Statistical analyses were performed with SAS version 9.3 (SAS Institute Inc., Cary, NC,
USA). When necessary, data was transformed to meet the assumptions of normality based on the
highest Shapiro-Wilk’s statistic and outliers were removed using Lund’s test for outliers
(Rotondi and Koval, 2009). Significance for all tests was determined by a Type I error rate of
α=0.05 and it was assumed that the models were additive, and linear where appropriate.
In the laboratory studies, analysis of variance (ANOVA) was performed using PROC MIXED
where length of microwave exposure was the fixed effect and replicate and year were random
effects. A dosage response nonlinear regression was performed on percentage of germination and
vigour using PROC NLIN to determine the exposure time at which germination and vigour start
to decrease. The dosage response equation took the form:
( ( ) ( ))
101
where C and D represented the upper and lower limit of the percentage of germination response
(Y), respectively, I50 was the time at which there was 50% response, and X represented
microwave radiation time (Bowley, 2008). Linear regression was performed on disease incidence
of seed colonization over time using PROC GLM to determine the decrease in percentage of
colonization by C. lindemuthianum in the seed plating.
For the field studies, ANOVA was performed using PROC MIXED where treatment was the
fixed effect and environment, environment nested in replicate, environment x treatment and
environment x year were random effects. Preplanned contrasts were utilized to evaluate
differences between treatments for all the variables. Comparisons between the NIC and IC were
conducted to detect the absence and presence of disease, respectively. Microwave and chemical
treatments were compared to the IC to determine the efficacy of each treatment on seed
emergence and disease control. The 1x Microwave and ½x Microwave treatment were compared
to observe the effect of increased microwave radiation. The two chemical treatments were
compared to determine if PFM was equivalent to the current industry standard and the efficacy
of both products on anthracnose. The combination of microwave and chemical treatments was
also compared to the individual microwave and chemical treatments and the IC to determine if
there were any additional effects on disease when they were applied in combination. Emergence
and percentage of pod infection were arcsine square root transformed and the AUDPC for stem
infection was square root transformed. Linear regressions were performed using PROC GLM to
determine the correlation between ROI and yield and ROI and AUDPC.

102
4.4 Results & Discussion
4.4.1 Laboratory Study
Microwave radiation had little effect on seed germination when the seed was exposed to short
time intervals of radiation. In non-linear regressions, a decrease of less than 10% in germination
(Figure 4.1) and vigour (Figure 4.2) was observed when microwave radiation was below 40 s of
exposure in the navy bean and 2012 pinto bean experiments; there was a decrease in germination
after 30 s of exposure (Figure 4.1) in the 2013 pinto bean experiment. Using the regression
formulas, a MER was determined for each of the seed lots based on <10% germination loss. A
50 s MER was used for the navy bean and the 2012 pinto bean experiments and 40 s MER was
used for the 2013 pinto bean experiment (Figure 4.1). The lower MER in 2013 pinto beans was
likely due to the difference in moisture content (MC) of the seed, compared to other seed lots.
Microwave radiation produces energy through dielectric heating, which is a process that utilizes
high-frequency electromagnetic radiation to heat dielectric materials through the aligning of
dipole water molecules. When dielectric materials, such as seed, are exposed to microwave
radiation the realignment of the water molecules creates friction, which produces heat and
increases seed temperatures (Bouraoui et al., 1993). Therefore, when the seed MC increased,
more heat was produced, which lowered the seeds tolerance to prolonged microwave radiation
(Appendix) (Knox et al., 2013). Increased exposure time also increased seed temperature and it
was observed that as microwave radiation exposure surpassed 30 s the percentage of germination
(Figure 4.1) and plant dry weight for vigour (Figure 4.2) began to decrease slightly. Germination
decreased up to 11% for navy bean and the 2012 pinto bean experiments and 8% for the 2013
pinto bean experiments in the 30-50 s exposure range. Vigour was not as severely affected at the
30-50 s for the navy bean experiments, but there was a similar trend in the percentage of

103
germination with a decrease in dry weight of 19% (i.e. 6.3 g) in the pinto bean trials at 50 s
(Figure 4.2). After more than 50 s of exposure, percentage of seed germination (Figure 4.1) and
vigour (Figure 4.2) decreased rapidly; which was likely due to increased seed temperature
resulting in higher seedling mortality.
Microwave exposure also affected pathogen colonization of the seed in the disease plating
experiments for both navy and pinto bean. A linear reduction in visible pathogen growth was
observed and with every second of microwave exposure, pathogen colonization of the seed
decreased 0.14% and 0.10% for navy and pinto bean, respectively (Figure 4.3). The reduction in
colonization in combination with the slight decrease in seed germination between 30-50 s of
exposure were indicative of the potential of microwave radiation as an alternative seed treatment
option.
4.4.2 Field Study
Weather Conditions
In 2012, heavy rainfall occurred shortly after planting and was followed by hot dry weather in
early July. The appearance of anthracnose symptoms was minimal until late July-early August
after which frequent rainfalls promoted disease development. In Ridgetown, rainfall during pod
set resulted in higher disease pressure than at the Exeter site. In 2013, recurrent rainfall and high
humidity at 4 WAP resulted in heavy disease pressure on bean seedlings, which resulted in
thinner stands, especially at the Exeter sites which received 113.9 mm of rainfall within 20 d of
planting. However, after mid-July conditions were hot and dry and anthracnose symptoms were
not as evident in the pod ratings.

104
Emergence
Treatment comparisons showed that the application of microwave radiation and chemical
treatment had a minimal effect on the percentage of emergence in the field trials. At 7 DAP no
differences were observed in emergence or vigour for both the navy and pinto trials (data not
shown). At subsequent ratings, treatment differences in emergence occurred and the results
varied between the navy and pinto market classes (Table 4.2); however, no differences in vigour
were observed (data not shown). The differences between the market classes may be a result of
their difference in seed size and infection (Tu, 1996; Conner et al., 2006b). Pinto bean seed on
average is two times the size of navy bean seed (Conner et al., 2006b). The increased seed size
provides more food reserves, which can minimize differences in emergence between treatments
compared to the smaller navy bean seed (Conner et al., 2006b; Conner et al., 2009). The more
uniform emergence of the pinto bean and the minimal effect observed from microwave treatment
may explain why fewer differences were seen in pinto bean.
In the navy bean trials, microwave radiation did not lower emergence compared to the IC.
However, the microwave treatment decreased emergence by 5-11% in contrasts comparing ½x
Microwave to 1x Microwave, PFM to PFM + Microwave and ST + Microwave to ST alone
(Table 4.2). In comparing the efficacy of the ST and microwave treatments, a decrease in
emergence was also noted at 10, 14 and 21 DAP. When the two chemical treatments were
combined (i.e. ST) and compared to the microwave treatments, a delay in emergence was seen in
the TFMA treatments. The lack of differences between the ST and microwave treatment at 10
DAP may have been due to TFMA, as the azoxystrobin component has been shown to delay
early seed emergence (Gillard, C. unpublished). This delay was also observed when TFMA
treatment was compared to PFM at 10 and 14 DAP. Overall, the lower percentage of emergence

105
observed due to microwave treatment in navy bean could be attributed to the MER that was set
for the seed lots in the laboratory studies. This loss in emergence was close to the preplanned
10% standard reduction and did not appear to affect emergence any more than the IC, therefore it
was considered an acceptable loss for the microwave treatments.
In pinto bean, the analysis on emergence was conducted on the combined results from both
Exeter sites and the 2013 Ridgetown site. The 2012, the Ridgetown trial site was excluded from
analysis as there was uneven and delayed emergence due to intense water stress caused by heavy
rainfall during the first four weeks after planting. In the analysed trials, treatment differences
were only observed at 10 DAP. The NIC had 9% lower emergence compared to the IC during the
first 2 WAP; likely due to the fact that seed for the NIC control was produced and harvested in a
different environment. Differences in seed size or seed coat thickness (Lush and Wien, 1980;
Souza and Marcos-Filho, 2001), storage conditions (Spilde, 1989; TeKrony and Egli, 1991),
mechanical damage (Moore, 1972) or other environmental factors could have contributed to the
early delay in emergence. Additionally, the 1x Microwave treatment had 9% higher emergence
than ½x Microwave treatment, opposite to that seen in navy bean. In previous studies,
microwave exposure has been observed to speed up germination rates through the introduction of
energy via radiation (Spilde, 1989; Aladjadjian and Svetleva, 1997). The introduced energy has
been suggested to stimulate molecular transformations that provide substances that speed up the
germination rate (Aladjadjian and Svetleva, 1997; Aladjadjiyan, 2007; Tylkowska et al., 2010).
The increased energy introduced in the 1x Microwave treatment compared to the ½ x Microwave
treatment may have attributed to the higher early emergence observed at the 1x Microwave
treatment. However, these results were inconsistent between bean varieties in this study and with
previous published work on dry bean emergence and vigour in both the laboratory and field

106
(Nelson et al., 1970; Nelson and Stetson, 1985; Spilde, 1989). Since no differences in emergence
were observed for any of the other microwave treatments in this study, no firm conclusions can
be made about increased germination in the field when microwave treatment was applied.
Disease Incidence
In all studies, disease symptoms on the leaves and stems were higher in the IC compared to
the NIC (Table 4.3), which agrees with previous studies on anthracnose development from seed
infected with C. lindemuthianum (Conner et al., 2009). Lower disease intensity over time was
observed for ST and ST + Microwave treatment in comparison to the IC in both the leaf and stem
evaluations (Table 4.3). The increase in disease control over time in this study was comparable
to that observed in previous studies conducted using chemical seed treatments such as
azoxystrobin and diazinon + captan + thiophanate-methyl (Gillard et al., 2012a; Gillard and
Ranatunga, 2013). The PFM treatment provided similar disease control of leaf infection
compared to the TFMA treatment, but lower control of stem infection in the navy bean.
The microwave treatments had less leaf infection than the IC in pinto bean. When ST and
microwave treatments were compared, no differences in control were detected in pinto bean.
However in navy bean, ST lowered the AUDPC value by more than 30% compared to the
microwave treatments. The addition of microwave treatment to ST increased disease control
when compared to ST in pinto bean and microwave treatment alone in both navy and pinto bean.
Additional control was observed in pinto bean, when the combination of chemical treatment and
microwave treatment (ST + Microwave, PFM + Microwave, and TFMA + Microwave)
decreased disease severity between 17-30% compared to ST or microwave treatment alone
(Table 4.3). In navy bean, chemical treatment and microwave treatment in combination had a
lower AUDPC value than the microwave treatments alone. This suggests that additional control

107
occurred between these two treatments since no differences were seen when microwave
treatment was applied alone compared to the IC and ST.
For pod infection, trends similar to the leaf and stem ratings were observed in navy bean, but
no differences were observed in pinto bean (Table 4.4). The Ridgetown 2012 navy bean trial site
was analyzed separately due to lower disease pressure until flowering and higher disease
pressure during pod set. The only treatment differences observed for these studies were due to
ST with no additional effect from the microwave treatment (Table 4.4). In comparing the two
chemical treatments, the PFM treatment was less effective in reducing pod infection than the
TFMA in navy bean.
Pod Destruction Index & Seed Pick
Contrast comparisons indicated that the NIC had the lowest PDI and seed pick values at the
majority of the trial sties, compared with the IC (Table 4.5). The application of a ST +
Microwave treatment lowered the PDI compared to the IC and the microwave treatment alone in
both market classes, while the application of ST alone only lowered PDI in the pinto bean trials.
No significant differences were detected for seed pick in the navy bean study. In pinto bean
study, the TFMA treatment had higher percentage of seed pick compared to the PFM and TFMA
+ Microwave treatments. The increase in percentage of seed pick may be due to decreased pod
shrivelling or fewer pods aborted by the plant before reaching maturity in the TFMA treatment
since it had less leaf and pod disease.
Yield & Return on Investment
For yield, the 2012 and 2013 navy bean sites were separated due to a significant year x
treatment reaction due to lower yields in the 2013 trial. The decrease in yield observed in 2013
was attributed to high disease pressure at 28 DAP, which resulted in stand thinning due to

108
seedling death in the infected treatments, which allowed for improved differentiation of the yield
response among treatments in 2013. Yield was higher in the NIC than in the IC for the navy bean
only (Table 4.6). In treatments where TFMA was applied (TFMA alone and ST) yields were
increased by 6-25% when compared to the IC, PFM, and microwave treatments. Chemical
treatments such as TFMA have been shown to effectively reduce disease symptoms early in the
season, therefore increasing seedling survival and final yields (Gillard et al., 2012a).
In contrast comparisons of navy bean, the NIC increased ROI by $1008 ha-1
compared to the
IC (Table 4.6). Although the microwave treatment was a low cost treatment, the only differences
in ROI were seen when microwave and ST + Microwave were compared to ST alone in three of
four pinto bean trials. The inconsistency between market classes and trials may have been due to
the large differences in yield observed. Linear regressions were performed (Figure 4.4) and ROI
was shown to be closely correlated with yield (R2= 0.84-0.94), where an increase of $0.63-0.86
occurred for every yield increase of 1 kg ha-1
. In contrast comparisons, the application of TFMA
+ Microwave treatment increased ROI (Table 4.5) in navy bean, which was associated with the
lower disease symptoms on leaf, stem (Table 4.3) and pods (Table 4.4). In linear regressions of
ROI and AUDPC (Figure 4.5), increased leaf infection was shown to decrease ROI at a rate of
$6.66 ha-1
and $6.85 ha-1
for navy and pinto bean, respectively, for every unit of increase in
AUDPC (R2= 0.34-0.58). The overall effect of microwave and chemical treatment on ROI was
minimal and the lower cost microwave treatment did not increase ROI compared to the IC or
chemical treatments.
In conclusion, microwave radiation is an inexpensive seed treatment method that has a
minimal effect on seed germination and emergence at low levels of radiation. However, even
though Tylkowska et al. (2010) predicted microwave radiation would control C.

109
lindemuthianum, the impact on pathogen viability was not consistent between the laboratory and
field studies. Microwave radiation decreased leaf and stem infection in the pinto bean field trials
when combined with seed treatment. However, in the navy bean field trials microwave treatment
did not perform consistently compared to the chemical seed treatments. For both navy and pinto
bean, microwave treatment provided little control of pod infection, PDI or seed pick, resulting in
few differences in final yield and ROI. The difference between the two market classes may be
attributed to differences in their seed size and moisture content. Clearly, further research is
required to determine how microwave radiation affects different dry bean market classes and
why disease control was more evident in the laboratory than in the field.
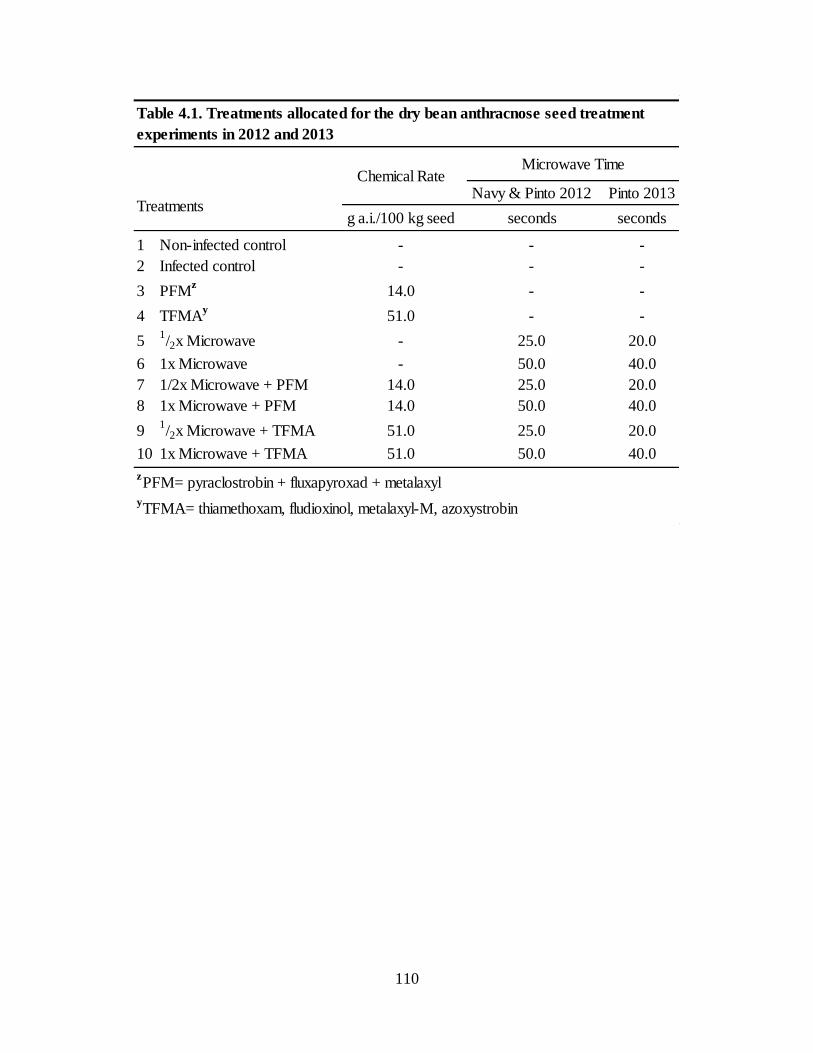
110
Navy & Pinto 2012 Pinto 2013
g a.i./100 kg seed seconds seconds
1 Non-infected control - - -
2 Infected control - - -
3 PFMz
14.0 - -
4 TFMAy
51.0 - -
51/2x Microwave - 25.0 20.0
6 1x Microwave - 50.0 40.0
7 1/2x Microwave + PFM 14.0 25.0 20.0
8 1x Microwave + PFM 14.0 50.0 40.0
91/2x Microwave + TFMA 51.0 25.0 20.0
10 1x Microwave + TFMA 51.0 50.0 40.0
Treatments
Microwave Time
zPFM= pyraclostrobin + fluxapyroxad + metalaxyl
Chemical Rate
yTFMA= thiamethoxam, fludioxinol, metalaxyl-M, azoxystrobin
Table 4.1. Treatments allocated for the dry bean anthracnose seed treatment
experiments in 2012 and 2013

111
Treatment comparison
ICx vs NIC 85 vs 91 80 vs 71 * 91 vs 96 * 85 vs 81 92 vs 96 86 vs 82
IC vs ST 85 vs 88 80 vs 80 91 vs 95 85 vs 84 92 vs 95 86 vs 85
IC vs Microwave 85 vs 83 80 vs 75 91 vs 89 85 vs 81 92 vs 89 86 vs 82
IC vs ST + Microwave 85 vs 81 80 vs 76 91 vs 89 85 vs 84 92 vs 90 86 vs 85
PFM vs TFMA 93 vs 82 ** 77 vs 82 97 vs 92 ** 83 vs 85 97 vs 93 86 vs 84
PFM vs PFM + Microwave 93 vs 84 ** 77 vs 75 97 vs 89 ** 83 vs 82 97 vs 89 ** 86 vs 84
TFMA vs TFMA + Microwave 82 vs 79 82 vs 78 92 vs 89 85 vs 85 93 vs 91 84 vs 86
ST vs Microwave 88 vs 83 80 vs 75 95 vs 89 ** 84 vs 81 95 vs 89 ** 85 vs 82
ST vs ST + Microwave 88 vs 81 ** 80 vs 76 95 vs 89 ** 84 vs 84 95 vs 90 ** 85 vs 851/2x Microwave vs 1x Microwave 87 vs 79 70 vs 79 * 92 vs 86 * 76 vs 85 92 vs 86 78 vs 85
Microwave vs PFM + Microwave 83 vs 84 75 vs 75 89 vs 89 81 vs 82 89 vs 89 82 vs 84
Microwave vs TFMA + Microwave 83 vs 79 75 vs 78 89 vs 89 81 vs 85 89 vs 91 82 vs 86
Microwave vs ST + Microwave 83 vs 81 75 vs 76 89 vs 89 81 vs 84 89 vs 90 82 vs 85
yRidgetown 2012 trial not included as emergence was delayed due to water stress.
*,** Denotes significance at P <0.05 and P <0.01, respectively, based on orthogonal contrasts.
Emergencez (%)
10 DAP 14 DAP 21 DAP
zEmergence was arcsine square root transformed for data analysis to satisfy the assumptions of normality and back-transformed estimates
are presented.
Navy Pintoy Navy Pinto
y Navy
xIC= infected control; NIC= non-infected control; Microwave=
1/2x and 1x Microwave rates; PFM= pyraclostrobin + fluxapyroxad +
metalaxyl; TFMA= thiamethoxam, fludioxonil, metalaxyl-M, azoxystrobin; ST= PFM + TFMA.
Table 4.2. Contrasts comparing percentage of emergence of navy and pinto beans for various seed treatments to control
anthracnose at Ridgetown and Exeter, ON in 2012-2013
Pintoy

112
Treatment comparison
ICy vs NIC 145 vs 42 ** 101 vs 25 ** 80 vs 25 ** 33 vs 8 **
IC vs ST 145 vs 103 101 vs 80 * 80 vs 56 * 33 vs 24 **
IC vs Microwave 145 vs 161 101 vs 83 * 80 vs 82 33 vs 27
IC vs ST + Microwave 145 vs 92 * 101 vs 64 ** 80 vs 52 ** 33 vs 20 **
PFM vs TFMA 124 vs 82 71 vs 88 68 vs 44 * 21 vs 27
PFM vs PFM + Microwave 124 vs 112 71 vs 61 68 vs 60 21 vs 19
TFMA vs TFMA + Microwave 82 vs 73 88 vs 68 * 44 vs 45 27 vs 22
ST vs Microwave 103 vs 161 * 80 vs 83 56 vs 82 ** 24 vs 27
ST vs ST + Microwave 103 vs 92 80 vs 64 * 56 vs 52 24 vs 20 *1/2x Microwave vs 1x Microwave 156 vs 165 81 vs 84 86 vs 78 27 vs 27
Microwave vs PFM + Microwave 161 vs 112 * 83 vs 61 ** 82 vs 60 * 27 vs 19 **
Microwave vs TFMA + Microwave 161 vs 73 ** 83 vs 68 * 82 vs 45 ** 27 vs 22 *
Microwave vs ST + Microwave 161 vs 92 ** 83 vs 64 ** 82 vs 52 ** 27 vs 20 **
Table 4.3. Contrasts comparing the area under the disease progress curve (AUDPC) for leaf and stem
infection on navy and pinto beans for various seed treatments to control anthracnose in Ridgetown
and Exeter, ON in 2012-2013
AUDPC
Stem Infection
Pinto
zAUDPC data for stem infection in pinto bean were square root +0.5 transformed to satisfy the assumptions of
yIC= infected control; NIC= non-infected control; Microwave=
1/2x and 1x Microwave rates; PFM=
pyraclostrobin + fluxapyroxad + metalaxyl; TFMA= thiamethoxam, fludioxonil, metalaxyl-M, azoxystrobin; ST=
PFM + TFMA.
*,** Denotes significance at P <0.05 and P <0.01, respectively, based on orthogonal contrasts.
Leaf Infection
Navy Navy Pintoz

113
Treatment comparison
ICx vs NIC 2.0 vs 0.0 ** 5.0 vs 0.0 * 2.0 vs 0.0
IC vs ST 1.8 vs 0.9 * 4.9 vs 2.5 2.4 vs 4.0
IC vs Microwave 1.8 vs 2.6 4.9 vs 6.8 2.4 vs 2.6
IC vs ST + Microwave 1.8 vs 1.1 * 4.9 vs 2.3 2.4 vs 2.7
PFM vs TFMA 1.3 vs 0.6 * 5.6 vs 0.6 * 2.9 vs 5.3
PFM vs PFM + Microwave 1.3 vs 1.2 5.6 vs 5.3 2.9 vs 2.9
TFMA vs TFMA + Microwave 0.6 vs 0.9 0.6 vs 0.6 5.3 vs 2.6
ST vs Microwave 0.9 vs 2.6 ** 2.5 vs 6.8 * 4.0 vs 2.6
ST vs ST + Microwave 0.9 vs 1.1 2.5 vs 2.3 4.0 vs 2.71/2x Microwave vs 1x Microwave 2.9 vs 2.3 5.5 vs 8.1 3.0 vs 2.3
Microwave vs PFM + Microwave 2.6 vs 1.2 ** 6.8 vs 5.3 2.6 vs 2.9
Microwave vs TFMA + Microwave 2.6 vs 0.9 ** 6.8 vs 0.6 ** 2.6 vs 2.6
Microwave vs ST + Microwave 2.6 vs 1.1 ** 6.8 vs 2.3 * 2.6 vs 2.7
yRidgetown 2012 trial presented separately to meet the assumptions of normality.
*,** Denotes significance at P <0.05 and P <0.01, respectively, based on orthogonal contrasts.
xIC= infected control; NIC= non-infected control; Microwave=
1/2x and 1x Microwave rates;
PFM= pyraclostrobin + fluxapyroxad + metalaxyl; TFMA= thiamethoxam, fludioxonil, metalaxyl-
M, azoxystrobin; ST= PFM + TFMA.
Pinto
zPod infection data were arcsine square root transformed to satisfy the assumptions of normaility
and back-transformed estimates are presented
Table 4.4. Contrasts comparing the percentage of pod infection on navy and pinto beans
for various seed treatments to control anthracnose in Ridgetown and Exeter, ON in 2012-
2013
Pod Infectionz (%)
10 WAP
Navy Navyy
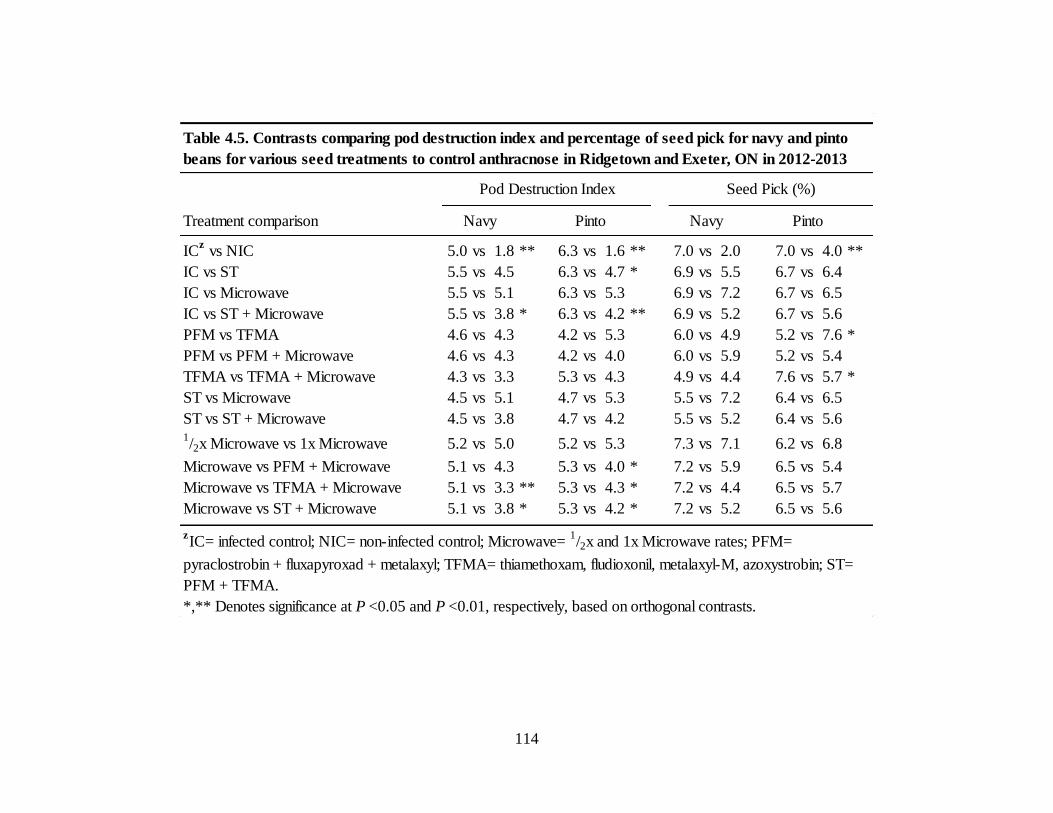
114
Treatment comparison
ICz vs NIC 5.0 vs 1.8 ** 6.3 vs 1.6 ** 7.0 vs 2.0 7.0 vs 4.0 **
IC vs ST 5.5 vs 4.5 6.3 vs 4.7 * 6.9 vs 5.5 6.7 vs 6.4
IC vs Microwave 5.5 vs 5.1 6.3 vs 5.3 6.9 vs 7.2 6.7 vs 6.5
IC vs ST + Microwave 5.5 vs 3.8 * 6.3 vs 4.2 ** 6.9 vs 5.2 6.7 vs 5.6
PFM vs TFMA 4.6 vs 4.3 4.2 vs 5.3 6.0 vs 4.9 5.2 vs 7.6 *
PFM vs PFM + Microwave 4.6 vs 4.3 4.2 vs 4.0 6.0 vs 5.9 5.2 vs 5.4
TFMA vs TFMA + Microwave 4.3 vs 3.3 5.3 vs 4.3 4.9 vs 4.4 7.6 vs 5.7 *
ST vs Microwave 4.5 vs 5.1 4.7 vs 5.3 5.5 vs 7.2 6.4 vs 6.5
ST vs ST + Microwave 4.5 vs 3.8 4.7 vs 4.2 5.5 vs 5.2 6.4 vs 5.61/2x Microwave vs 1x Microwave 5.2 vs 5.0 5.2 vs 5.3 7.3 vs 7.1 6.2 vs 6.8
Microwave vs PFM + Microwave 5.1 vs 4.3 5.3 vs 4.0 * 7.2 vs 5.9 6.5 vs 5.4
Microwave vs TFMA + Microwave 5.1 vs 3.3 ** 5.3 vs 4.3 * 7.2 vs 4.4 6.5 vs 5.7
Microwave vs ST + Microwave 5.1 vs 3.8 * 5.3 vs 4.2 * 7.2 vs 5.2 6.5 vs 5.6
*,** Denotes significance at P <0.05 and P <0.01, respectively, based on orthogonal contrasts.
Table 4.5. Contrasts comparing pod destruction index and percentage of seed pick for navy and pinto
beans for various seed treatments to control anthracnose in Ridgetown and Exeter, ON in 2012-2013
zIC= infected control; NIC= non-infected control; Microwave=
1/2x and 1x Microwave rates; PFM=
pyraclostrobin + fluxapyroxad + metalaxyl; TFMA= thiamethoxam, fludioxonil, metalaxyl-M, azoxystrobin; ST=
PFM + TFMA.
Pod Destruction Index
Pinto PintoNavy Navy
Seed Pick (%)
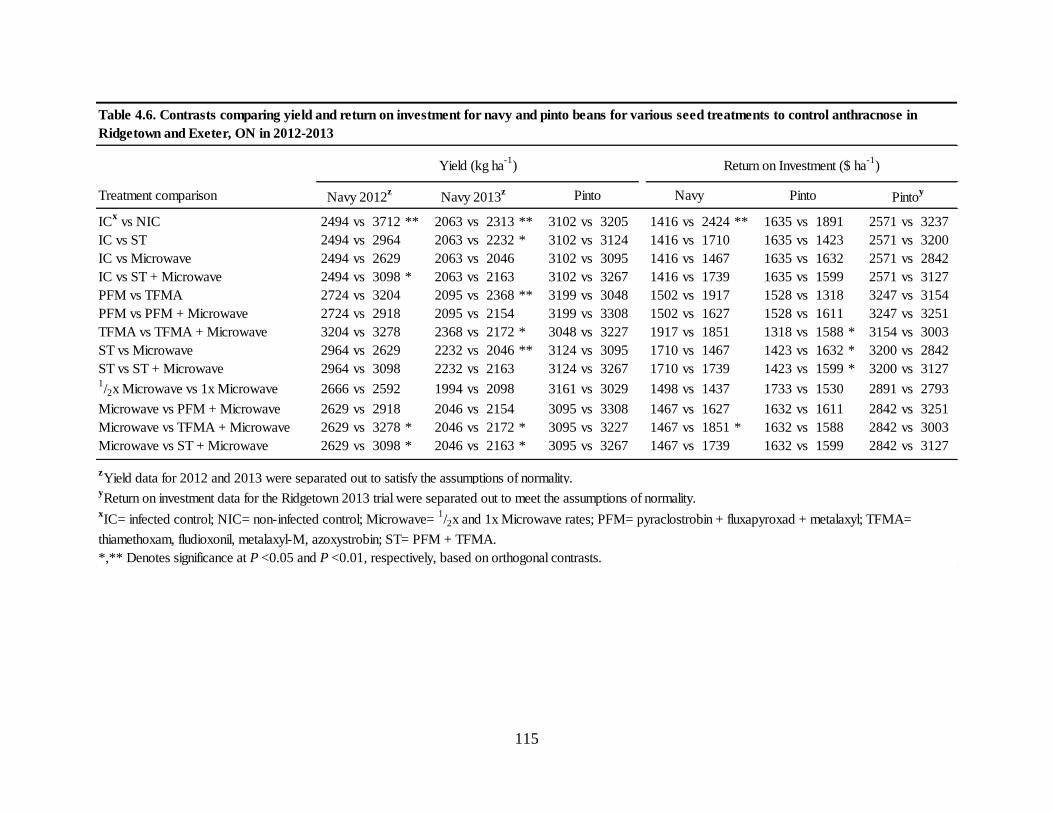
115
Treatment comparison
ICx vs NIC 2494 vs 3712 ** 2063 vs 2313 ** 3102 vs 3205 1416 vs 2424 ** 1635 vs 1891 2571 vs 3237
IC vs ST 2494 vs 2964 2063 vs 2232 * 3102 vs 3124 1416 vs 1710 1635 vs 1423 2571 vs 3200
IC vs Microwave 2494 vs 2629 2063 vs 2046 3102 vs 3095 1416 vs 1467 1635 vs 1632 2571 vs 2842
IC vs ST + Microwave 2494 vs 3098 * 2063 vs 2163 3102 vs 3267 1416 vs 1739 1635 vs 1599 2571 vs 3127
PFM vs TFMA 2724 vs 3204 2095 vs 2368 ** 3199 vs 3048 1502 vs 1917 1528 vs 1318 3247 vs 3154
PFM vs PFM + Microwave 2724 vs 2918 2095 vs 2154 3199 vs 3308 1502 vs 1627 1528 vs 1611 3247 vs 3251
TFMA vs TFMA + Microwave 3204 vs 3278 2368 vs 2172 * 3048 vs 3227 1917 vs 1851 1318 vs 1588 * 3154 vs 3003
ST vs Microwave 2964 vs 2629 2232 vs 2046 ** 3124 vs 3095 1710 vs 1467 1423 vs 1632 * 3200 vs 2842
ST vs ST + Microwave 2964 vs 3098 2232 vs 2163 3124 vs 3267 1710 vs 1739 1423 vs 1599 * 3200 vs 31271/2x Microwave vs 1x Microwave 2666 vs 2592 1994 vs 2098 3161 vs 3029 1498 vs 1437 1733 vs 1530 2891 vs 2793
Microwave vs PFM + Microwave 2629 vs 2918 2046 vs 2154 3095 vs 3308 1467 vs 1627 1632 vs 1611 2842 vs 3251
Microwave vs TFMA + Microwave 2629 vs 3278 * 2046 vs 2172 * 3095 vs 3227 1467 vs 1851 * 1632 vs 1588 2842 vs 3003
Microwave vs ST + Microwave 2629 vs 3098 * 2046 vs 2163 * 3095 vs 3267 1467 vs 1739 1632 vs 1599 2842 vs 3127
zYield data for 2012 and 2013 were separated out to satisfy the assumptions of normality.
yReturn on investment data for the Ridgetown 2013 trial were separated out to meet the assumptions of normality.
*,** Denotes significance at P <0.05 and P <0.01, respectively, based on orthogonal contrasts.
Yield (kg ha-1
) Return on Investment ($ ha-1
)
Navy Pinto Pintoy
Table 4.6. Contrasts comparing yield and return on investment for navy and pinto beans for various seed treatments to control anthracnose in
Ridgetown and Exeter, ON in 2012-2013
xIC= infected control; NIC= non-infected control; Microwave=
1/2x and 1x Microwave rates; PFM= pyraclostrobin + fluxapyroxad + metalaxyl; TFMA=
thiamethoxam, fludioxonil, metalaxyl-M, azoxystrobin; ST= PFM + TFMA.
Navy 2012z
Navy 2013z Pinto

116
Figure 4.1. Nonlinear regressions (NLIN) of percentage of germination of navy and pinto bean seed incubated in a germination
chamber for 7 d at 25oC following various microwave radiation treatments in 2012 and 2013.
0
10
20
30
40
50
60
70
80
90
100
0 10 20 30 40 50 60 70 80 90
Ger
min
ati
on
(%
)
Time (s)
Navy
Pinto
NLIN (Navy)
NLIN (Pinto 2012)
NLIN (Pinto 2013)
Navy Y= 14.24 + 70.35−14.24
1+exp (8.44 log 𝑥 −log (67.89)
P< .0001
Pinto 2012 Y= 12.13 + 90.05−12.13
1+exp (12.44 log 𝑥 −log (68.25)
P< .0001
Pinto 2013 Y= 72.20
1+exp(6.98 log 𝑥 −log(61.87)
P< .0001

117
Figure 4.2. Nonlinear regressions (NLIN) of plant vigour (dry weights of germinated material) from navy and pinto bean seed
incubated in a germination chamber for 7 day at 25oC following various microwave radiation treatments in 2012 and 2013.
0
5
10
15
20
25
30
35
40
45
0 10 20 30 40 50 60 70 80 90
Dry
Wei
gh
t (g
)
Time (s)
Navy
Pinto
NLIN (Navy)
NLIN (Pinto)
Navy Y= 1.48 + 15.50−1.48
1+exp (6.07 log 𝑥 −log (83.74)
P< .0001
Pinto Y= 33.23
1+exp (8.35 log 𝑥 −log (770.15)
P< .0001

118
Figure 4.3. Linear regressions of percentage of pathogen colonization of seed by Colletotrichum lindemuthianum on potato dextrose
agar following various microwave radiation treatments in 2012.
0
5
10
15
20
25
0 10 20 30 40 50 60 70 80 90
Path
ogen
Colo
niz
ati
on
of
See
d (
%)
Time (s)
Navy
Pinto
Linear (Navy)
Linear (Pinto)
Navy Y= -0.14x+16.36
R2= 0.4331
P< .0001
Pinto Y= -0.10x+11.06
R2= 0.5321
P< .0001

119
Figure 4.4. Linear regression of return on investment (ROI) and yield for navy and pinto bean seed treatment study for anthracnose
control in 2012 and 2013.
Navy 2012 Y = 0.8626x - 420.49
R² = 0.924
Navy 2013 Y = 0.8762x - 198.65
R² = 0.9221
Pinto Y = 0.6322x - 48.148
R² = 0.8389
0
500
1000
1500
2000
2500
3000
3500
4000
0 1000 2000 3000 4000 5000 6000
Ret
urn
on
In
ves
tmen
t ($
ha
-1)
Yield (kg ha-1)
Navy 2012
Navy 2013
Pinto
Linear (Navy 2012)
Linear (Navy 2013)
Linear (Pinto)
Linear (Pinto Ridgetown 2013)
Pinto Ridgetown 2013 Y = 0.7479x - 263.66
R2 = 0.9445
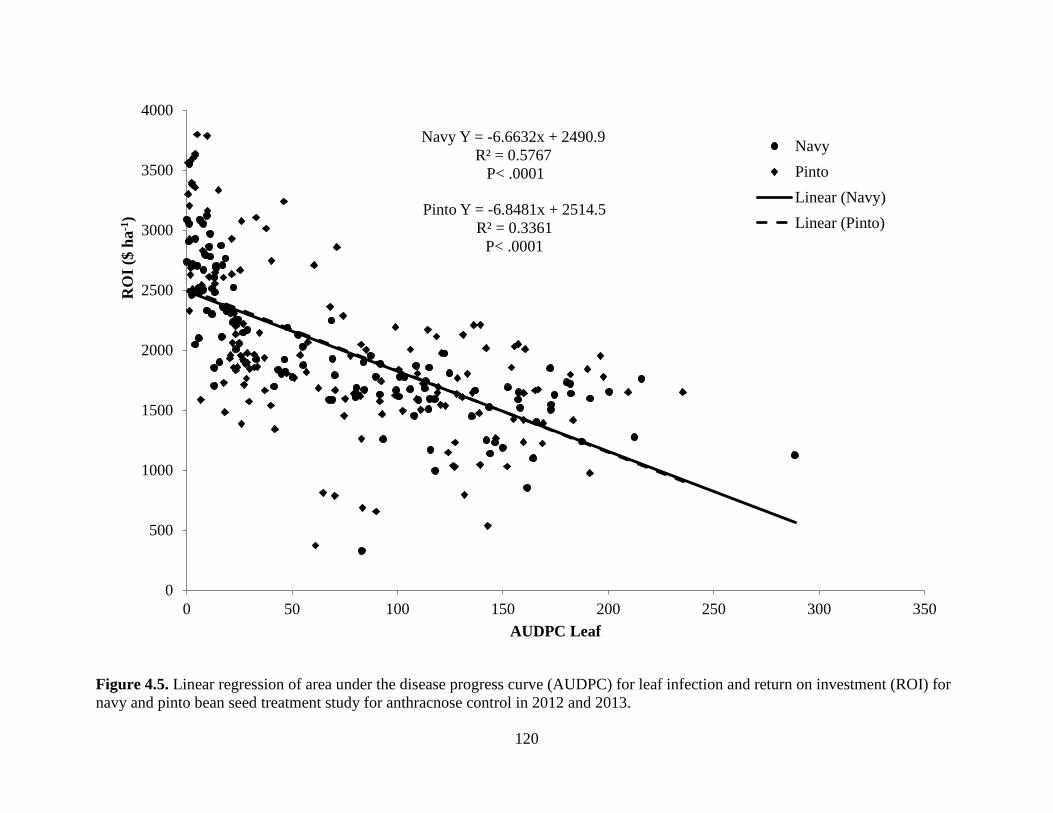
120
Figure 4.5. Linear regression of area under the disease progress curve (AUDPC) for leaf infection and return on investment (ROI) for
navy and pinto bean seed treatment study for anthracnose control in 2012 and 2013.
Navy Y = -6.6632x + 2490.9
R² = 0.5767
P< .0001
Pinto Y = -6.8481x + 2514.5
R² = 0.3361
P< .0001
0
500
1000
1500
2000
2500
3000
3500
4000
0 50 100 150 200 250 300 350
RO
I ($
ha
-1)
AUDPC Leaf
Navy
Pinto
Linear (Navy)
Linear (Pinto)
121
CHAPTER FIVE
General Discussion
5.1 Research Contributions
This study was the first to examine the effect of microwave radiation on dry bean seed
germination and vigour as well as the control of the seed-borne pathogens Xap, Psp, and C.
lindemuthianum in both the laboratory and the field. Various dry bean market classes were used
to better understand how seed size, moisture content, and pathogen colonization impacted the
effect of microwave treatment. These studies also studied the potential of microwave radiation as
an option for organic growers, or as a complimentary treatment for the conventional control
methods currently being practiced.
The effect of microwave radiation on seed germination and emergence was consistent
between the laboratory and field studies and indicative of how microwave radiation has little
adverse effect on seed health when applied at an optimal exposure time for the seed lot.
Determining the optimal microwave radiation exposure time for use under field conditions
depended on the moisture content of the seed. Previous research on this relationship had been
conducted in cereal crops (Knox et al., 2013), but this was the first study to examine the use of
microwave radiation on various dry bean market classes. The effect of microwave radiation on
the various market classes was also informative, as the larger seeded class tended to be more
sensitive to prolonged microwave radiation than the smaller navy bean class.
The effect of microwave radiation on pathogen colonization and disease control in the
laboratory and the field was less consistent. The lack of disease control observed with
microwave radiation throughout the entire season suggests it has little effect on the seed-borne

122
pathogens tested and would not be highly beneficial to organic growers. In majority of the field
trials, no differences in disease control were observed when the microwave treatment was
applied in combination with chemical treatment. The lack of improvement in control would not
justify the addition of an inexpensive microwave treatment to growers, as yield and ROI did not
improve. Chemical treatments increased disease control in the C. lindemuthianum experiments,
but were largely ineffective for the bacterial diseases. Despite the efficacy of the chemical
treatments, there is concern regarding the overuse of products in the same chemical family if
they are applied both as a seed and foliar treatment (Garrett and Schwartz, 1998; Gillard et al.,
2012a).
5.2 Research Limitations
The use of laboratory and field studies in this project allowed for the observation of the effect
of microwave radiation in both a controlled and natural environment. However, the methodology
used may have limited some of the evaluations. In the laboratory, the use of plastic tray
containers limited the growth of the seedling roots and shoots. The use of deeper, open pots may
have allowed for greater growth and the option to assess vigour based on root and shoot growth,
rather than only as the dry weight of germinated plant matter, which was closely associated with
seed mortality. In the field, environmental conditions played a large role in the variability in
disease pressure between sites. Increasing the buffer area between the plots may have helped to
decrease disease spread from rain splash and plant to plant contact between plots. However, a
larger trial area would increase variability due to soil type and topography.
The use of two market classes for each disease studied allowed the examination of the effect
of microwave radiation on a small- and large-seeded dry bean class. However, the reactions
between the market classes were not always consistent and suggest that further testing of more

123
market classes is warranted. The moisture content of the seed lots also varied between market
classes, which affected the maximum microwave exposure rate. A consistent seed moisture
content between the seed lots would have provided a more uniform exposure time, which may
have provided a more consistent measure of disease control from the microwave treatment. The
infected seed used was obtained from areas where disease symptoms were visibly apparent and
infection rates were high. The disease incidence in infected seed and the NICs were only
determined based on the presence and absence of visible infection on the seed in 2013. This
limited the understanding of actual disease incidence in the infected lots for the second season.
The disease-free nature of the NICs was assumed based on the area where they were produced,
but seed infection levels were not tested in the laboratory prior to seeding. The lack of seed
plating for the disease-free seed lots may have limited the differences observed between the IC
and NIC, as seen with the bacterial blights. Obtaining the NIC treatments from a different
environment than that of the IC also affected emergence results in the field trials. In these trials,
the cost for the NIC was also not considered in the ROI calculation and limits the actual gain in
ROI observed when disease-free is obtained from less conducive growing areas.
Microwave radiation was only tested at one power setting in this study. Simplifying the
microwave settings was done to fully examine the radiation effect on six seed lots and three
seed-borne diseases, but this limited the exposure time that could be applied to the seed. The use
of time intervals as a measure of exposure may have also limited the effectiveness of microwave
treatment. Currently, the mode of action for a microwave radiation treatment is assumed to be
heat production; however, this has not been scientifically proven. If heat production is the main
mode of action, maximizing the temperature increase of exposed seed would have been more
effective than maximizing the exposure time.

124
The mode of action for the chemical treatments was also limited in the C. lindemuthianum
trials where both compounds were based on the strobilurin family. The diversification for
anthracnose control is required as strobilurin fungicides were the primary foliar treatment as
well, to prevent resistance in the future. The use of a chemical like DCT may have diversified
this study more than the use of a new treatment with a strobilurin MOA as well.
5.3 Future Research
Further research into the effect of microwave radiation and other thermotherapy methods as a
treatment for seed-borne diseases in dry bean would be beneficial in the seed production industry
as microwave radiation proved to have minimal effect on seed health and potential control of
some fungal pathogens based on the laboratory results. The use of microwave radiation or other
radiation treatments as alternative control methods would be valuable to growers as they tend to
be inexpensive and have a minimal adverse impact on the seed and the environment. Microwave
radiation offers two advantages; it would be a simple addition to the current seed treatment
methods, and based on these studies no negative effects on the efficacy of the chemical treatment
was observed.
The effect of microwave radiation could be further explored to confirm the mode of action of
this treatment as well as experimentation with different microwave power levels where exposure
time could be extended without harming seed germination. Research into other forms of
radiation, like infrared and ultraviolet radiation, could also provide more options for alternative
control methods. These treatments were tested previously as a post-harvest treatment for dry
bean storage (Cunha et al., 1993) and for the sterilization of processing plants (Bintsis et al.,
2000), but could aid in the control of disease as a pre-plant treatment as well. However, the
effect of these types of treatment would also need to be tested to determine the effect they would

125
have on dry bean seed health. Studies using electron beam and plasma technology are also a
promising front for a thermotherapy control in dry bean (Rogner, 2011). This technique has been
tested on cereal crops and reported to eliminate pathogenic bacteria and fungi and should be
further explored for leguminous crops.
Future studies should also concentrate on the modes of action of the chemical seed treatments
tested in this study. For anthracnose control, the current industry standard (TFMA) and PFM
were from the strobilurin family and provided some efficacy in field. For the bacterial blights,
the Cu(OH)2 treatments had fairly low efficacy and PFM was ineffective and therefore should
not be considered as an alternative control. Research into the benefits of these seed treatments
and the stacking of the same mode of action in the seed treatment and foliar application is
required to prevent fungicide resistance in the future.

126
REFERENCES
Agriculture and Agri-Food Canada. 2012. Statistical Information. Available [Online]
http://www.agr.gc.ca/eng/industry-markets-and-trade/statistics-and-market-information/by-
product-sector/horticulture/horticulture-canadian-industry/statistical-
information/?id=1184695062667. January 10, 2012
Adu, B. and Otten, L. 1996. Diffusion characteristics of white beans during microwave drying.
J. Agr. Engineering Res. 64(1):61-69.
Adu, B., Otten, L., Afenya, E. and Groenevelt, P. 1995. Thermodynamics of microwave
(polarized) heating systems. J. Micro. Power and Electromag. Energy 30(2):90-96.
Agarwal, V. K. and Sinclair, J.B. 1997. Principles of seed pathology. CRC Press, Boca Raton,
Fla.
Aggour, A. R., Coyne, D. P., Vidaver, A. K. and Eskridge, K. M. 1989. Transmission of the
common blight pathogen in bean seed. J. Amer. Soc. Hort. Sci. 114(6):1002-1008.
Agricorp. 2013. Average crop insurance values for dry bean market classes in Ontario. Guelph,
ON.
Agrios, G. N. 2004. Plant pathology. Elsevier Academic Press, Amsterdam.
Aladjadjian, A. and Svetleva, D. 1997. Influence of magnetron irradiation on common bean
(Phaseolus vulgaris L.) seeds. J. Agr. Sci. 3:741-747.
Aladjadjiyan, A. 2007. The use of physical methods for plant growing stimulation in Bulgaria.
J. Cent. Eur. Agr. 8(3):369-380.
Arnold, D. L., Lovell, H. C., Jackson, R. W. and Mansfield, J. W. 2011. Pseudomonas
syringae pv. phaseolicola: from ‘has bean’ to supermodel. Mol. Plant Pathol. 12(7):617-627.

127
Arsenijevic, M., Obradovic, A., Stevanovic, D. and Ivanovic, M. 1998. Antagonistic effect of
some saprophytic bacteria to Pseudomonas syringae pv. phaseolicola and Xanthomonas
campestris pv. phaseoli. IOBC WPRS Bulletin 21:297-300.
Bailey, K. L., Gossen, B. D., Gugel, R. K. and Morrall, R. A. A., (eds.) 2003. Diseases of field
crops in Canada. Can. Phytopathol. Soc.
Bailey, K. L., Johnston, A. M., Kutcher, H. R., Gossen, B. D. and Morrall, R. A. A. 2000.
Managing crop losses from foliar diseases with fungicides, rotation, and tillage in the
Saskatchewan Parkland. Can. J. Plant Sci. 80(1):169-175.
Baker, K. F. 1962. Thermotherapy of planting material. Phytopathology 52:1244-1255.
Baldi, A., Belletti, P. and Quagliotti, L. 1981. Genetic variability of bean seed in resistance to
heat treatment. Proc. Symp. Veg. Flower Seed Prod. 111, Castrocaro, Forli, Italy.
Bartlett, D. W., Clough, J. M., Godwin, J. R., Hall, A. A., Hamer, M. and Parr‐Dobrzanski,
B. 2002. The strobilurin fungicides. Pest Manage. Sci. 58(7):649-662.
Berbert, P. A., Queiroz, D. M. and Melo, E. C. 2002. Postharvest Technology: Dielectric
Properties of Common Bean. Biosystems Engineering 83(4):449-462.
Bintsis, T., Litopoulou-Tzanetaki, E. and Robinson, R. K. 2000. Existing and potential
applications of ultraviolet light in the food industry – a critical review. J. Sci. Food Agr.
80(6):637-645.
Bouraoui, M., Richard, P. and Fichtali, J. 1993. A review of moisture content determination in
foods using microwave oven drying. Food Res. Int. 26(1):49-57.
Bowley, S. R. 2008. A hitchhiker's guide to statistics in plant biology. Second ed. Any Old
Subject Books, a division of plants et al., Inc., Guelph, ON.

128
Bozkurt, İ. and Soylu, S. 2011. Determination of responses of different bean cultivars against
races of Pseudomonas syringae pv phaseolicola, causal agent of halo blight of bean. Euphytica
179(3):417-425.
Bozzano-Saguier, G. 1993. Unterschiedliche sortenresistenz von busch-bohnen (Phaseolus
vulgaris L.) gegenuber den beiden formen des bakteriellen bohnenbrandes (Xanthomonas
campestris pv. phaseoli und Xc pv. phaseoli var. fusc. University of Göttingen, Gottingen,
Germany.
Cafati, C. R. and Saettler, A. W. 1980. Role of nonhost species as alternate inoculum sources
of Xanthomonas phaseoli. Plant Dis. 64:194-196.
Canadian Grain Commission. 2010. Official grain grading guide: Determination of Dockage.
Available [Online] http://www.grainscanada.gc.ca/oggg-gocg/19/oggg-gocg-19a-eng.htm.
March, 25, 2013
Cavalcante, M. J. B. and Muchovej, J. J. 1993. Microwave irradiation of seeds and selected
fungal spores. Proc. Seed Sci. Tech.
CFIA. 2011. Canadian methods and procedures for testing seed. Canadian Food Inspection
Agency, Saskatoon, SK.
Chang, K. F. 2001. Relationship of bean seed infection with anthracnose to disease development
and seed microflora (Abstr.). Can. J. Plant Pathol. 23:196.
Chase, A. R. 1987. Compendium of ornamental foliage plant diseases. Amer. Phytopathol. Soc.,
St. Paul, MN. 92pp. pp.
Chupp, C. and Sherf, A. F. 1960. Vegetable diseases and their control. Vegetable diseases and
their control.
129
Clear, R. M., Patrick, S. K., Wallis, R. and Turkington, T. K. 2002. Effect of dry heat
treatment on seed-borne Fusarium graminearum and other cereal pathogens. Can. J. Plant
Pathol. 24(4):489-498.
Clemons, G. P. and Sisler, H. 1971. Localization of the site of action of a fungitoxic benomyl
derivative. Pestic. Biochem. Physiol. 1(1):32-43.
Conner, R. L., Chen, Y., Hou, A., Balasubramanian, P. M., McLaren, D. L. and McRae, K.
B. 2009. Seedborne infection affects anthracnose development in two dry bean cultivars. Can. J.
Plant Pathol. 31(4):449-455.
Conner, R. L., McAndrew, D. W., Balasubramanian, P. and Kiehn, F. A. 2006a. Effect of
rate of seed infection on anthracnose severity and yield loss in dry beans. Ann. Rep.- Bean
Improv. Coop. 49:81.
Conner, R. L., McAndrew, D. W., Balasubramanian, P., Kiehn, F. A. and Dongfang, Y.
2006b. Influence of growth habit, row spacing, and seed infection on bean anthracnose
development. Can. J. Plant Pathol. 28(3):411-418.
Conner, R. L., McAndrew, D. W., Kiehn, F. A., Chapman, S. R. and Froese, N. T. 2004.
Effect of foliar fungicide application timing on the control of bean anthracnose in the navy bean
‘Navigator’. Can. J. Plant Pathol. 26(3):299-303.
Copson, D. A., (ed.) 1975. Microwave Heating. Second ed. AVI Publishing Company, Inc.,
Westport, Connecticut.
Corrales, M. A. P. and van Schoonhoven, A., (eds.) 1987. Standard system for the evaluation
of bean germplasm. CIAT.
130
Coyne, D., Schuster, M. and Hill, K. 1973. Genetic control of reaction to common blight
bacterium in bean (Phaseolus vulgaris) as influenced by plant age and bacterial multiplication. J.
Amer. Soc. Hort. Sci. 98(1):94-99.
Coyne, D. P. and Schuster, M. 1974a. Inheritance and linkage relations of reaction to
Xanthomonas phaseoli (EF Smith) Dowson (common blight), stage of plant development and
plant habit in Phaseolus vulgaris L. Euphytica 23(2):195-204.
Coyne, D. P. and Schuster, M. L. 1974b. Breeding and genetic studies of tolerance to several
bean (Phaseolus vulgaris L.) bacterial pathogens. Euphytica 23(3):651-656.
Cunha, M. F., Sgarbieri, V. C. and Damasio, M. H. 1993. Effects of pretreatment with gamma
rays or microwaves on storage stability of dry beans. J. Agr. Food Chem. 41(10):1710-1715.
del Rio, L. E., Lamppa, R. S., Gross, P. L., Brolley, B. and Prischmann, J. 2003.
Identification of Colletotrichum lindemuthianum race 73 in Manitoba, Canada. Can. J. Plant
Pathol. 25(1):104-107.
Dillard, H. R. and Cobb, A. C. 1993. Survival of Colletotrichum lindemuthianum in bean
debris in New York State. Plant Dis. 77(12):1233-1238.
Dongfang, Y., Conner, R. L., Yu, K., Balasubramanian, P., Penner, W. C. and Yager, L. M.
2008. Identification of anthracnose resistance genes in dry bean cultivars grown in Manitoba.
Can J. Plant Sci. 88(4):771-781.
Doornik, A. W. 1992. Heat treatment to control Colletotrichum acutatum on corms of Anemone
coronaria. Eur. J. Plant Pathol. 98(6):377-386.
Edgington, L. V. and MacNeill, B. H. 1978. Control of bean anthracnose by seed treatment
with systemic fungicides. Phytopathol. News 12:235.
FAOSTAT. 2012. FOASTAT- Production & Trade. Food and Agricultural Organization.

131
Fininsa, C. 2003. Relationship between common bacterial blight severity and bean yield loss in
pure stand and bean and maize intercropping systems. Int. J. Pest Manage. 49(3):177-185.
Fininsa, C. and Tefera, T. 2001. Effect of primary inoculum sources of bean common bacterial
blight on early epidemics, seed yield and quality aspects. Int. J. Pest Manage. 47(3):221-225.
Fininsa, C. and Tefera, T. 2002. Inoculum sources of bean anthracnose and their effect on
epidemics and yield. Trop. Sci. 42(1):30-34.
Forsberg, G. 2004. Control of cereal seed-borne diseases by hot humid air seed treatment.
Doctoral. Swedish University of Agricultural Sciences, Uppsala. 49 pp.
Garrett, K. and Schwartz, H. 1998. Epiphytic Pseudomonas syringae on dry beans treated with
copper-based bactericides. Plant Dis. 82(1):30-35.
Gepts, P., Aragão, F. J. L., Barros, E., Blair, M. W., Brondani, R., Broughton, W., Galasso,
I., Hernández, G., Kami, J. and Lariguet, P. 2008. Genomics of Phaseolus beans, a major
source of dietary protein and micronutrients in the tropics. Genom. Trop. Crop Plants:113-143.
Gilbertson, R. L., Rand, R. E. and Hagedorn, D. J. 1990. Survival of Xanthomonas
campestris pv. phaseoli and pectolytic strains of X. campestris in bean debris. Plant Dis.
74(4):322-327.
Gillard, C. L., Conner, R. L., Howard, R. J., Pauls, K. P., Shaw, L. and Taran, B. 2009. The
performance of dry bean cultivars with and without common bacterial blight resistance in field
studies across Canada. Can. J. Plant Sci. 89(2):405-410.
Gillard, C. L. and Ranatunga, N. K. 2013. Interaction between seed treatments, surfactants and
foliar fungicides on controlling dry bean anthracnose (Colletotrichum lindemuthianum). Crop
Prot. 45:22-28.

132
Gillard, C. L., Ranatunga, N. K. and Conner, R. L. 2012a. The control of dry bean
anthracnose through seed treatment and the correct application timing of foliar fungicides. Crop
Prot. 37:81-90.
Gillard, C. L., Ranatunga, N. K. and Conner, R. L. 2012b. The effect of foliar fungicide
application timing on the control of dry bean anthracnose. Can. J. Plant Sci. 92(1):109-118.
Goodwin, M. 2003. Crop Profile for Dry Beans. Pulse Canada.
Goodwin, P. H., Sopher, C. R. and Michaels, T. E. 1995. Multiplication of Xanthomonas
campestris pv. phaseoli and intercellular enzyme activities in resistant and susceptible beans. J.
Phytopathol. 143(1):11-15.
Grondeau, C., Samson, R. and Sands, D. D. C. 1994. A review of thermotherapy to free plant
materials from pathogens, especially seeds from bacteria. Crit. Rev. Plant Sci. 13(1):57-75.
Grum, M., Camloh, M., Rudolph, K. and Ravnikar, M. 1998. Elimination of bean seed-borne
bacteria by thermotherapy and meristem culture. Plant Cell, Tiss. Organ Cult. 52(1):79-82.
Hall, R., (ed.) 1991. Compendium of bean diseases. Amer. Phytopathol. Soc., St. Paul,
Minnesota.
Hall, R. and Nasser, L. C. B. 1996. Practice and precept in cultural management of bean
diseases. Can. J. Plant Pathol. 18(2):176-185.
Han, F. 2010. The effect of microwave treatment on germination, vigour and health of China
aster (Callistephus chinensis nees.) seeds. J. Agr. Sci. 2(4):p201.
Hankin, L. and Sands, D. C. 1977. Microwave treatment of tobacco seed to eliminate bacteria
on the seed surface. Phytopathology 67:794-795.
Health Canada. 2009. Substances assessed for developmental hazards. in E. W. Health, ed.
Health Canada.

133
Health Canada, 2012. Dietary Supplements. Available [Online] canada.gc.ca. January 23, 2012
Hess, M., Barralis, G., Bleiholder, H., Buhr, L., Eggers, T., Hack, H. and Stauss, R. 2008.
Use of the extended BBCH scale—general for the descriptions of the growth stages of mono;
and dicotyledonous weed species. Weed Res. 37(6):433-441.
Hirano, S. S. and Upper, C. D. 1983. Ecology and epidemiology of foliar bacterial plant-
pathogens. Ann. Rev. Phytopathol. 21:243-269.
Hoersten, D. 1996. Thermal seed treatment comparing different methods for destruction of
pathogens. Landtechnik 51.
Holliday, P. 1980. Fungus diseases of tropical crops. Cambridge University Press Archive.
Holliday, P., Mordue, J. E. M. and Sivanesan, A. 1971. Commonwealth Mycological Institue
descriptions of pathogenic fungi and bacteria. Commonwealth Mycological Institute
Descriptions of Fungi and Bacteria(Set 32):Nos. 311-320; 51, 1179, 1180.
Hormozi-Nejad, M. H., Mozafari, J. and Rakhshandehroo, F. 2011. Elimination of bean
common mosaic virus using an electrotherapy technique. J. Plant Dis. Plant Prot. 5(117):201-
205.
Howard, R., Burke, D. and Huggons, P. 2000. Finding an effective replacement for
streptomycin for controlling seed-borne bacterial blight on dry beans. Crop Diversification
Centre South., Edmonton, AB.
Ibarra-Perez, F. J., Barnhart, D., Ehdaie, B., Knio, K. M. and Waines, J. G. 1999. Effects of
insect tripping on seed yield of common bean. Crop Sci. 39(2):428-433.
Ibarra-Perez, F. J., Ehdaie, B. and Waines, J. G. 1997. Estimation of outcrossing rate in
common bean. Crop Sci. 37(1):60-65.

134
Jahn, M., Nega, E., Kromphardt, C., Forsberg, G. and and Werner, S. 2006. Optimisation of
different physical methods for control of seed-borne pathogens in organic vegetable production.
Proc. Joint Organic Congress, Odense, Denmark.
Janse, J. D. and Wenneker, M. 2002. Possibilities of avoidance and control of bacterial plant
diseases when using pathogen‐tested (certified) or‐treated planting material. Plant Pathology
51(5):523-536.
Jiao, S., Johnson, J., Tang, J., Tiwari, G. and Wang, S. 2011. Dielectric properties of cowpea
weevil, black-eyed peas and mung beans with respect to the development of radio frequency heat
treatments. Biosystems Engineering 108(3):280-291.
Kelly, J. D. 2001. Remaking bean plant architecture for efficient production. Pages 109-143
Advan. Agron. Academic Press.
Kelly, J. D. and Vallejo, V. A. 2004. A comprehensive review of the major genes conditioning
resistance to anthracnose in common bean. HortScience 39(6):1196-1207.
Kelly, J. D., Varner, G. V., Roman, B. and Long, B. 2009. Registration of ‘Fuji’Otebo Bean.
J. Plant Regist. 3(3):223-225.
Knox, O. G. G., McHugh, M. J., Fountaine, J. M. and Havis, N. D. 2013. Effects of
microwaves on fungal pathogens in wheat seed. Crop Prot. 50:12-16.
Leach, J. G., Lilly, V. G., Wilson, H. A. and Purvis Jr, M. R. 1957. Bacterial polysaccharides:
the nature and function of the exudate produced by Xanthomonas phaseoli. . Phytopathology
47:113-120.
Lozano, J. C., Laberry, R. and Bermudez, A. 1986. Microwave treatment to eradicate seed-
borne pathogens in cassava true seed. J. Phytopathology 117(1):1-8.

135
Lush, W. M. and Wien, H. C. 1980. The importance of seed size in early growth of wild and
domesticated cowpeas. J. Agr. Sci. 94(01):177-182.
MAFRI. 2012. Guide to Field Crop Protection. Pages 522 in Agriculture, ed., Winnipeg.
Mamidi, S., Rossi, M., Annam, D., Moghaddam, S., Lee, R., Papa, R. and McClean, P.
2011. Investigation of the domestication of common bean (Phaseolus vulgaris) using multilocus
sequence data. Func. Plant Bio. 38(12):953-967.
Martínez-Pacheco, M. M., Saucedo-Luna, J., Flores-García, A., Martínez-Muñoz, R. E.
and Campos-García, J. 2009. Colletotrichum lindemuthianum (Sacc. & Magn.) Scrib. is a
potential cellulase producer microorganism. Revista Latinoamericana de Microbiología 51:23-
31.
Matus, A., Sadleir, J., Cronkwright, L. and McLeod, R. 2004. Efficacy of new vitaflo 280
(carbathiin and thiram) to control soil-and seed borne diseases of common bean (Phaseolus
vulgaris L.), soybean (Glycine max (L.) Merrill), pea (Pisum sativum L.), and lentil (Lens
culinaris Medicus) and compatibility with rhizobium inoculants. Ann. Rep. Bean Improv. Coop.
47:49-50.
Maude, R. B. 1996. Seedborne diseases and their control : principles and practice. . CAB
International, Wallingford, Oxon, UK.
McGee, D. C. 1995. Epidemiological approach to disease management through seed technology.
Ann. Rev. Phytopathol. 33(1):445-466.
McGee, D. C. 1997. Plant pathogens and the worldwide movement of seeds. Amer. Phytopathol.
Soc., St. Paul, Minn.

136
McMullen, M. P. and Lamey, H. A. 2009. Plant diseases development and management. North
Dakota State University of Agriculture and Applied Science and U.S. Department of Agriculture,
Fargo, ND.
Melotto, M., Balardin, R. S. and Kelly, J. D. 2000. Host-pathogen interaction and variability of
Colletotrichum lindemuthianum. Pages 346-361. Amer. Phytopathol. Soc., St. Paul, MN.
Michaels, T. E., Smith, T. H., Larsen, J., Beattie, A. D. and Pauls, K. P. 2006. OAC Rex
common bean. Can. J. Plant Sci. 86(3):733-736.
Mitchell, R. E. and Bieleski, R. L. 1977. Involvement of phaseolotoxin in halo blight of beans:
transport and conversion to functional toxin. Plant Physio. 60(5):723-729.
Mohammed, Y. and Sangchote, S. 2007. Survival and transmission of Colletotrichum
lindemuthianum from naturally infected common bean seeds to the seedlings. Tropical Sci.
47(2):96-103.
Moore, R. P. 1972. Effects of mechanical injuries on viability. Pages 94-113 in E. H. Roberts,
ed. Viability of Seeds. Springer Netherlands.
Morar, R., Munteanu, R., Simion, E., Munteanu, I. and Dascalescu, L. 1999. Electrostatic
treatment of bean seeds. Industry Applications, IEEE Transactions 35(1):208-212.
Mutlu, N., Miklas, P., Reiser, J. and Coyne, D. 2005. Backcross breeding for improved
resistance to common bacterial blight in pinto bean (Phaseolus vulgaris L.). Plant Breeding
124(3):282-287.
Nelson, S., Nutile, G. and Stetson, L. 1970. Effects of radiofrequency electrical treatment on
germination of vegetable seeds. J. Amer. Soc. Hort. Sci. 95:359-66.
Nelson, S. and Stetson, L. 1985. Germination responses of selected plant species to RF
electrical seed treatment. Trans. Amer. Soc. Agr. Engineers 28.

137
Nelson, S. O. 1996. A review and assessment of microwave energy for soil treatment to control
pests. Trans. Amer. Soc. Agr. Engineers 39(1):281-290.
Norman, D. J. and Strandberg, J. O. 1997. Survival of Colletotrichum acutatum in soil and
plant debris of leatherleaf fern. Plant Dis. 81(10):1177-1180.
Ntahimpera, N., Dillard, H. R., Cobb, A. C. and Seem, R. C. 1996. Anthracnose development
in mixtures of resistant and susceptible dry bean cultivars. Phytopathology 86:668-973.
Ntahimpera, N., Dillard, H. R., Cobb, A. C. and Seem, R. C. 1997. Influence of tillage
practices on anthracnose development and distribution in dry bean fields. Plant Dis. 81(1):71-76.
Oliveira, S. H. F. 2003. New fungicides and spraying schedules in the control of anthracnose
and angular leaf spot of common bean. Summa Phytopathologica 29.
OMAFRA. 2011. Field Crop Statistics. Available [Online]
http://www.omafra.gov.on.ca/english/stats/welcome.html. January 29, 2012.
Parker, J. P. K. 1985. Interspecific transfer of common bacterial blight resistance from
Phaseolus acutifolius A. Gray to Phaseolus vulgaris L. M.Sc. University of Guelph, Guelph,
ON.
Pastor-Corrales, M. A. 1991. Estandarización de variedades diferenciales y de designación de
razas de Colletotrichum lindemuthianum. Phytopathology 81(694).
Pedigo, L. P. 1998. Entomology and pest management. Prentice-Hall International.
Peshin, R. and Dhawan, A. K., (eds.) 2009. Integrated pest management: innovation-
development process Springer, Dordecht.
Prusky, D., Freeman, S. and Dickman, M. B., (eds.) 2000. Colletotrichum: host specificity,
pathology, and host-pathogen interaction. Amer. Phytopathol. Soc., St. Paul, MN.

138
Pynenburg, G. M., Sikkema, P. H. and Gillard, C. L. 2011. Agronomic and economic
assessment of intensive pest management of dry bean (Phaseolus vulgaris). Crop Prot.
30(3):340-348.
Reddy, M. V. B., Raghavan, G. S. V., Kushalappa, A. C. and Paulitz, T. C. 1998. Effect of
microwave treatment on quality of wheat seeds infected with Fusarium graminearum. J. Agr.
Engineering Res. 71(2):113-117.
Reddy, P., Mycock, D. and Berjak, P. 2000. The effect of microwave irradiation on the
ultrastructure and internal fungi of soybean seed tissues. Seed Sci. Tech. 28(2):277-289.
Ritchie, D. 2004. Copper-containing fungicides/bactericides and their use in management of
bacterial spot on peaches. Southeast Regional Newsletter. North Carolina State University.
Rogner, F. M. 2011. Fraunhofer FEP Process disinfectes seeds effectively and efficiently.
Innov. Rep. Available: http://www.innovations-
report.com/html/reports/life_sciences/fraunhofer_fep_process_disinfects_seeds_effectively_176
985.html. December 14, 2011.
Rotondi, M. and Koval, J. 2009. Computation of critical values of lund’s test for outliers in
linear models. Stat. Biopharm. Res. 1(3):337-341.
Saettler, A. W. 1989a. Common bacterial blight. Pages 261-284 in H. F. a. P.-C. Schwartz,
M.A., ed. Bean production problems in the tropics. CIAT, Cali, Colombia. Centro Internacional
de Agricultura Tropical.
Saettler, A. W. 1989b. Halo Blight. Pages 261-284 in H. F. a. P.-C. Schwartz, M.A., ed. Bean
production problems in the tropics. CIAT, Cali, Colombia. Centro Internacional de Agricultura
Tropical.
139
Saettler, A. W. and Potter, H. S. 1970. Chemical control of halo bacterial blight in field beans.
Res. Rep. Michigan Agr. Exp. Station 98:8 pp.
Schuster, M. L. 1967. Survival of bean bacterial pathogens in the field and greenhouse under
different environmental conditions. Phytopathology 57:830.
Schuster, M. L. and Sayre, R. M. 1967. A coryneform bacterium induces purple-colored seed
and leaf hypertrophy of Phaseolus vulgaris and other Leguminosae. Phytopathology 57:1064-6.
Schwartz, H. F. and Corrales, M. A. P. 1989. Bean production problems in the tropics.
Agribookstore/Winrock.
Schwartz, H. F. and Pastor-Corrales, M. 1989. Halo blight. Bean production problems in the
tropics 2nd ed CIAT, Cali, Colombia:285-301.
Schwartz, H. F., Steadman, J. R., Hall, R. and Forster, R. L. 2005. Compendium of bean
diseases. Amer. Phytopathol. Soc. St Paul, MN.
Scott, M. E. and Michaels, T. E. 1992. Xanthomonas resistance of Phaseolus interspecific cross
selections confirmed by field performance. HortScience 27(4):348-350.
Shiomi, T. 1992. Black rot of cabbage seeds and its disinfection under a hot-air treatment. Japan
Agr. Res. Quarterly 26:13-13.
Siddiqui, M. R. and Vidhyasekaran, P., (eds.) 1990. Management of seed borne diseases:
basic research for crop disease management. Daya Publishing House, New Delhi, India.
Sinclair, J. B. 1993. Control of seedborne pathogens and diseases of soybean seeds and
seedlings. Pestic. Sci. 37(1):15-19.
Singh, D., Mathur, S.B. 2004. Histopathology of seed-borne infections. CRC Press, Boca
Raton.

140
Singh, S. P. and Muñoz, C. G. 1999. Resistance to common bacterial blight among Phaseolus
species and common bean improvement. Crop Sci. 39(1):80-89.
Singh, S. P., Terán, H., Lema, M., Webster, D. M., Strausbaugh, C. A., Miklas, P. N.,
Schwartz, H. F. and Brick, M. A. 2007. Seventy-five years of breeding dry bean of the Western
USA. Crop Sci. 47(3):981-989.
Souza, F. H. D. d. and Marcos-Filho, J. 2001. The seed coat as a modulator of seed-
environment relationships in Fabaceae. Brazilian J. Bot. 24:365-375.
Spilde, L. A. 1989. Navy bean seed vigor and field performance in relation to microwave
radiation. Agron. J. 79(5):827-830.
St. Clair, D. A. 2010. Quantitative disease resistance and quantitative resistance loci in breeding.
Ann. Rev. Phytopathol. 48:247-268.
Stats Canada. 2013. Estimated areas, yield, production, and average farm price of principal field
crops, in metric units. Statistics Canada. January 20, 2012.
Swings, J. G. and Civerolo, E. L., (eds.) 1993. Xanthomonas. Chapman & Hall, London ; New
York.
Tar'an, B., Michaels, T. E. and Pauls, K. P. 2001. Mapping genetic factors affecting the
reaction to Xanthomonas axonopodis pv. phaseoli in Phaseolus vulgaris L. under field
conditions. Genome 44(6):1046-1056.
Taylor, J. D. and Dudley, C. L. 1977. Seed treatment for the control of halo-blight of beans
(Pseudomonas phaseolicola). Ann. App. Bio. 85(2):223-232.
Taylor, J. D., Dudley, C. L. and Gray, L. P. 1979a. Studies of halo-blight seed infection and
disease transmission in dwarf beans. Ann. App. Bio. 93(3):267-277.

141
Taylor, J. D., Phelps, K. and Dudley, C. L. 1979b. Epidemiology and strategy for the control
of halo-blight of beans. Ann.App. Bio. 93(2):167-172.
Taylor, J. D., Teverson, D. M., Allen, D. J. and Pastor-Corrales, M. A. 1996. Identification
and origin of races of Pseudomonas syringae pv. phaseolicola from Africa and other bean
growing areas. Plant Pathol. 45(3):469-478.
Tefera, T. 2006. Effect of common bacterial blight severity on common bean yield. Tropical
Sci. 46(1):41-44.
TeKrony, D. M. and Egli, D. B. 1991. Relationship of seed vigor to crop yield: A review. Crop
Sci. 31(3):816-822.
Thomas, G. J. and Adcock, K. G. 2004. Exposure to dry heat reduces anthracnose infection of
lupin seed. Australasian Plant Pathol. 33(4):537-540.
Tinivella, F., Gullino, M. L. and Garibaldi, A. 2005. Organic seed: rules and new techniques
of seed dressing to control plant pathogens. Informatore Fitopatologico 55.
Tosh, S. M. and Yada, S. 2010. Dietary fibres in pulse seeds and fractions: Characterization,
functional attributes, and applications. Food Res. Int. 43(2):450-460.
Trutmann, P., Paul, K. and Cishabayo, D. 1992. Seed treatments increase yield of farmer
varietal field bean mixtures in the central African highlands through multiple disease and beanfly
control. Crop Prot. 11(5):458-464.
Tu, J. C. 1981. Anthracnose (Colletotrichum lindemuthianum) on white bean (Phaseolus
vulgaris L.) in southern ontario: spread of the disease from an infection focus. Plant Dis. 65:477-
480.
Tu, J. C. 1988. Control of bean anthracnose caused by the delta and lambda races of
Colletotrichum lindemuthianum in Canada. Plant Dis. 72(1):5-8.
142
Tu, J. C. 1994. Occurrence and characterization of the alpha-Brazil race of bean anthracnose
[Colletotrichum lindemuthianum] in Ontario. Can. J. Plant Pathol. 16(2):129-131.
Tu, J. C. 1996. Re-evaluation of DCT seed treatment against the new alpha-Brazil race of bean
anthracnose caused by Colletotrichum lindemuthianum. Ann. Rep. Bean Improv. Coop. 39:294.
Tu, J. C., Sheppard, J. W. and Laidlaw, D. M. 1984. Occurrence and characterization of the
epsilon race of bean anthracnose in ontario. Plant Dis. 68(1):69-70.
Tylkowska, K., Turek, M. and Prieto, R. B. 2010. Health, germination and vigour of common
bean seeds in relation to microwave irradiation. Phytopathologia 55:5-12.
Van Assche, C. and Leuven, K. U. 1987. The importance of seed control and seed treatment for
a guaranteed plant production. Proc. Int. Symp. Veg. Proc. 220.
Van Biervliet, M. 1987. Microgolfenergie voor de ontsmetting van
plantenvermeerderingsmaterialen (Microwave energy for the decontamination of plant
propagation materials). Agricultural Engineer. Katholieke Universiteit te Leuven, Leuven,
Belgium 51 pp.
van Schoonhaven, A. and Voysest, O., (eds.) 1991. Common beans: research for crop
improvement. CABI, Cali, Colombia.
Voysest, O. and Dessert, M. 1991. Bean cultivars: classes and commercial seed types. Common
beans: research for crop improvement CAB International and CIAT, Wallingford, UK p:119-
162.
Walker, J. C. and Patel, P. N. 1964. Splash dispersal and wind as factors in epidemiology of
halo blight of bean. Phytopathology 54:140-1.
Weller, D. M. and Saettler, A. W. 1976. Chemical control of common and fuscous bacterial
blights in Michigan navy (pea) beans. Plant Dis. Rep. 60(9):793-797.

143
Weller, D. M. and Saettler, A. W. 1980. Colonization and distribution of Xanthomonas
phaseoli and Xanthomonas phaseoli var. fuscans in field-grown navy beans. Phytopathology
70(6):500-506.
Wilcoxson, R. D., Skovmand, B. and Atif, A. H. 1975. Evaluation of wheat cultivars for ability
to retard development of stem rust. Ann. App. Bio. 80(3):275-281.
Wilson, H. A. and Lilly, V. G. 1965. Bacterial polysaccharides. IV. Longevity of Xanthomonas
phaseoli and Serratia marcescens in bacterial exudates. Phytopathology 55(10):1135-1138.
Wright, J. 2007. Beans: A History/Food: The History of Taste. History Today 57(11):64-65.
Yoshida, H. and Kajimoto, G. 1988. Effects of microwave treatment on the trypsin inhibitor
and molecular species of triglycerides in soybeans. J. Food Sci. 53(6):1756-1760.
Zaumeyer, W. and Meiners, J. 1975. Disease resistance in beans. Ann. Rev.
Phytopathol.13(1):313-334.
Zinnen, T. M. and Sinclair, J. B. 1982. Thermotherapy of soybean seeds to control seedborne
fungi. Phytopathology 72(7):831-834.

144
LIST OF APPENDICES
APPENDIX A: Effect of Microwave Radiation on Seed with Increasing Moisture Content
Figure A.1. Influence of microwave radiation at varying exposure lengths on dry bean seed with increasing seed moisture content.
Columns within the same moisture content with the same letter are not significantly different (P ≥ 0.05); A-C 10%; a-e 15%; z-u 20%.
0
10
20
30
40
50
60
70
80
90
100
0 10 20 30 40 50 60 70
Per
cen
t G
erm
inati
on
(%
)
Time (s)
10% Moisture
15% Moisture
20% Moisture
A A
A A A
A
a a
a
b
c
d
e
e
B
C
z z
y
x
w
v uv
u