MICROVAL ISO 16140:2003 Validation of SimPlate Total … TPC-CI MicroVal... · The results are...
64
ADRIA DEVELOPPEMENT Creac’h Gwen - F. 29196 QUIMPER Cedex - Tél. (33) 02.98.10.18.18 - Fax (33) 02.98.10.18.08 E-mail : [email protected] - Site web : http://www.adria.tm.fr - Site réservé adhérents : http://www.clubiaa.net ASSOCIATION LOI DE 1901 - N° SIRET 306 964 271 00036 - N° EXISTENCE 532900006329 - N°TVA FR4530696427100036 BIOCONTROL SYSTEMS Inc. 12822 SE 32nd Street BELLEVUE, WA 98005 USA MICROVAL ISO 16140:2003 Validation of SimPlate Total Plate Count Color Indicator method Quantitative method This report includes 64 pages, with 6 annexes. Only copies including the totality of this report are authorised. SimPlate TVC Version 0 December 21, 2009
Transcript of MICROVAL ISO 16140:2003 Validation of SimPlate Total … TPC-CI MicroVal... · The results are...
ADRIA DEVELOPPEMENT Creac’h Gwen - F. 29196 QUIMPER Cedex - Tél. (33) 02.98.10.18.18 - Fax (33) 02.98.10.18.08
E-mail : [email protected] - Site web : http://www.adria.tm.fr - Site réservé adhérents : http://www.clubiaa.net
ASSOCIATION LOI DE 1901 - N° SIRET 306 964 271 00036 - N° EXISTENCE 532900006329 - N°TVA FR4530696427100036
BIOCONTROL SYSTEMS Inc.
12822 SE 32nd Street
BELLEVUE, WA 98005
USA
MICROVAL ISO 16140:2003
Validation of SimPlate Total Plate Count
Color Indicator method
Quantitative method
This report includes 64 pages, with 6 annexes.
Only copies including the totality of this report are authorised.
SimPlate TVC
Version 0
December 21, 2009

BIOCONTROL SYSTEMS Inc.
ADRIA Développement 2/64 December 21, 2009
SimPlate TVC - Version 0
Summary
1 INTRODUCTION _______________________________________________ 4
1.1 Validation standard ________________________________________ 4
1.2 Reference method _________________________________________ 4
1.3 SimPlate Total Plate Count method ___________________________ 4
2 METHODS COMPARISON STUDY ________________________________ 5
2.1 Linearity, relative accuracy, relative sensitivity and determination of
unknown samples _________________________________________ 5
2.1.1 Food categories and food types ________________________________ 5
2.1.2 Experimental design _________________________________________ 6
2.1.3 Calculations and interpretations ________________________________ 7
2.2 Detection and quantification limits ___________________________ 9
3 CONCLUSION ________________________________________________ 10
Annexes __________________________________________________________________ 11
Annex 1 - Diagram of the reference method test procedure ISO 4833 - Horizontal method
for the enumeration of micro- organisms - Colony-count technique at 30 °C __________ 12
Annex 2 - The alternative method test procedure SimPlate Total Plate Count _________ 13
Annex 3 - Raw data of the linearity and the accuracy Summary ____________________ 14
Annex 4 – Linearity: statistical interpretations ___________________________________ 27
Annex 5 - Relative accuracy: Statistical interpretations ___________________________ 41
Annex 6 - Detection and quantification limits ____________________________________ 63

BIOCONTROL SYSTEMS Inc.
ADRIA Développement 3/64 December 21, 2009
SimPlate TVC - Version 0
Before comment
Elements which allow the certification of the analysis quality can be consulted
by BIOCONTROL SYSTEMS Inc.
The results are presented according to the NF EN ISO 16140 standard.
Firm: BIOCONTROL SYSTEMS Inc.
12822 SE 32nd Street
BELLEVUE, WA 98005
USA
Expert Laboratory : ADRIA Développement
ZA Creac’h Gwen
F-29196 QUIMPER Cedex
Studied method: SimPlate Total Plate Count Color Indicator
Validation standard: NF EN ISO 16140 (October 2003): Food
microbiology – Protocol for the validation of
alternative methods
Reference method: ISO 4833 method (2003): “Microbiology of food and
animal feeding stuffs - Horizontal method for the
enumeration of microorganisms - Colony-count
technique at 30 °C”.
Products categories: All food categories

BIOCONTROL SYSTEMS Inc.
ADRIA Développement 4/64 December 21, 2009
SimPlate TVC - Version 0
1 INTRODUCTION
1.1 Validation standard
The validation study is performed according to the ISO 16140 (October
2003): Food microbiology – Protocol for the validation of alternative methods.
1.2 Reference method
The reference method used for this validation, is: 4833 standard
“Microbiology of food and animal feeding stuffs - Horizontal method for the
enumeration of micro-organisms - Colony-count technique at 30 °C” (Cf.
annex 1)
1.3 SimPlate Total Plate Count method
SimPlate Total Plate Count Color Indicator (TPC-CI) method is used for the
detection and quantification of total aerobic micro-organism populations. It is
based on binary detection technology (BDT) which equates the presence of
total aerobic micro-organisms to the presence of a colour change in the
medium. The medium/sample mixture is dispensed into a SimPlate device,
and incubated for 24 - 28 h. The medium changes colour in the presence of
total aerobic micro-organisms. The total aerobic plate count is determined by
counting the wells with changed colour and referring to the SimPlate
Conversion Table. The SimPlate device is packaged separately.
The protocol of the proprietary method is described in annex 2.
The Single Test Medium of SimPlate TPC-CI consists in a kit with 100
individually-packaged dehydrated TPC-CI Medium containers. The Multiple
Test Medium consists in a kit with 50 multi-test dehydrated TPC-CI Medium
containers. There should be no difference in performance between these two
kit components. The kind of component kit used in the different validation
study parts should be mentioned.

BIOCONTROL SYSTEMS Inc.
ADRIA Développement 5/64 December 21, 2009
SimPlate TVC - Version 0
2 METHODS COMPARISON STUDY
2.1 Linearity, relative accuracy, relative sensitivity and
determination of unknown samples
Linearity is the ability of the method when used with a given matrix to give results that are in proportion to the
amount of analyte present in the sample, that is an increase in analyte corresponds to a linear or proportional
increase in results.
The accuracy is the closeness of agreement between a test result and the accepted reference value.
The bias is the difference between the expectation of the test results and an accepted reference value.
The relative sensitivity is defined as the ability of the alternative method to detect two different amounts of analyte
measured by the reference method within a given matrix, at a specified average value, or over the whole
measurement range; that is, it is the minimal quantity variation (increase of the analyte concentration x) which
gives a significant variation of the measured signal (response y).
2.1.1 Food categories and food types
Three food categories were tested, with three food types minimum per
category. The repartition per category and food type is given below:
Table 1 - Number and nature of the samples
Food category Food type Number of samples
analysed
Number of samples
exploited
Meat and meat products Raw meat 13 11
Fermented 4 1
Heat processed 4 3
Dairy products Raw 3 3
Dry 3 2
Heat processed 15 12
Fruits and vegetables Fresh 5 2
Frozen 5 5
Juices and concentrates 12 7
Bakery and others Pastry 11 11
Dressing 1 0
Desserts 8 4
Seafood products Raw 4 2
Smoked 3 2
Heat processed 18 13
TOTAL 109 78

BIOCONTROL SYSTEMS Inc.
ADRIA Développement 6/64 December 21, 2009
SimPlate TVC - Version 0
2.1.2 Experimental design
2.1.2.1. Relative linearity and precision profile
Five matrices were studied. Five levels of contamination were tested to cover
a minimum, a central, a maximum and two intermediary levels.
The linearity was investigated with one food item per category. The
contamination levels, the tested samples and the strain are presented in the
table below:
Product Strains Contamination levels (CFU/g)
Ground beef Naturally contaminated samples
Half creamed
pasteurized milk 1
Serratia marcescens Ad 455,
isolated from milk 2.102 to 2.107
Fresh orange juice Xanthomonas maltophilia II.2,
isolated from vegetables 2.102 to 5.106
Pastry Naturally contaminated samples
Scallops terrine Naturally contaminated samples
2.1.2.2. Relative accuracy
In complement to the data obtained according to experimental design
described in 2.1.2, 69 samples were analysed in duplicate by both methods,
i.e. ISO 4833 and SimPlate TVC method. 138 measurements were
performed (69 samples x 2 replicates). 40 samples gave interpretable results.
2.1.2.3. Raw data
All the raw data (linearity and accuracy) are provided annex 3.
1 Note that the linearity was done at first on naturally contaminated samples from a same batch.
Some incoherent results were observed by the alternative method; it was not possible and
“realistic” to perform the lack-of-fit test. A sample from the same batch of milk (n° 1254) is
mentioned in the accuracy study.
BIOCONTROL SYSTEMS Inc.
ADRIA Développement 7/64 December 21, 2009
SimPlate TVC - Version 0
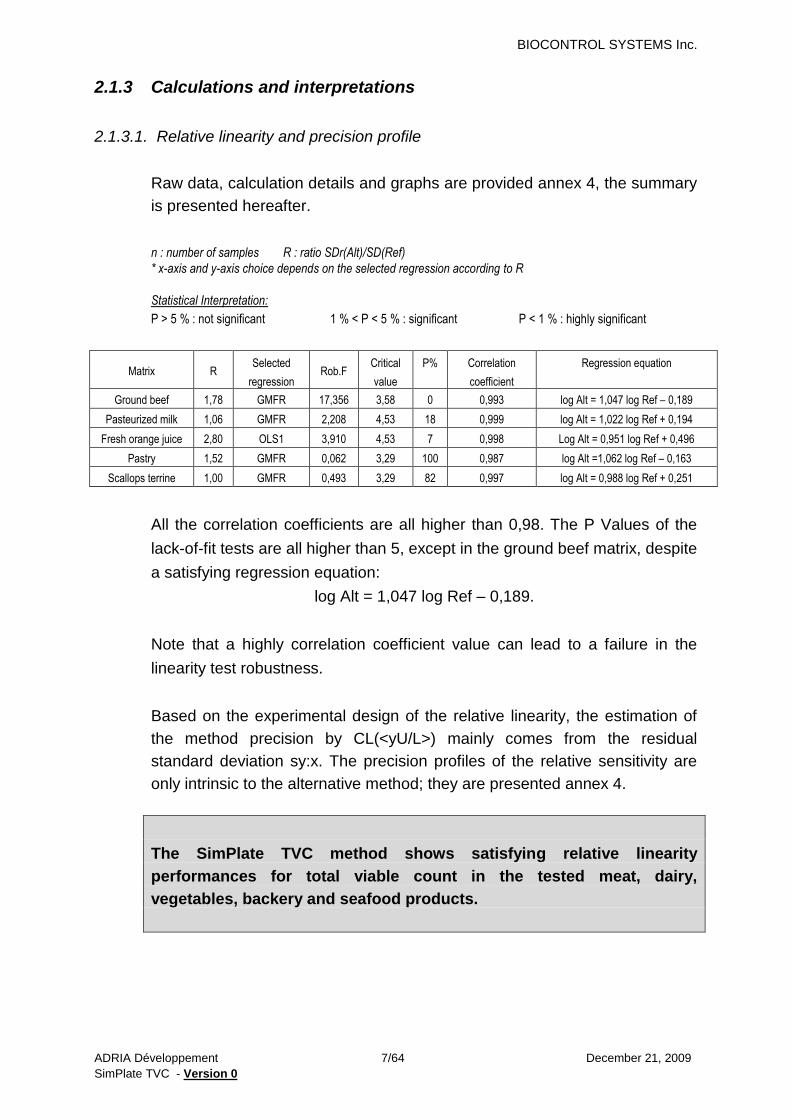
2.1.3 Calculations and interpretations
2.1.3.1. Relative linearity and precision profile
Raw data, calculation details and graphs are provided annex 4, the summary
is presented hereafter.
n : number of samples R : ratio SDr(Alt)/SD(Ref)
* x-axis and y-axis choice depends on the selected regression according to R
Statistical Interpretation:
P > 5 % : not significant 1 % < P < 5 % : significant P < 1 % : highly significant
Matrix R Selected
regression Rob.F
Critical
value
P% Correlation
coefficient
Regression equation
Ground beef 1,78 GMFR 17,356 3,58 0 0,993 log Alt = 1,047 log Ref – 0,189
Pasteurized milk 1,06 GMFR 2,208 4,53 18 0,999 log Alt = 1,022 log Ref + 0,194
Fresh orange juice 2,80 OLS1 3,910 4,53 7 0,998 Log Alt = 0,951 log Ref + 0,496
Pastry 1,52 GMFR 0,062 3,29 100 0,987 log Alt =1,062 log Ref – 0,163
Scallops terrine 1,00 GMFR 0,493 3,29 82 0,997 log Alt = 0,988 log Ref + 0,251
All the correlation coefficients are all higher than 0,98. The P Values of the
lack-of-fit tests are all higher than 5, except in the ground beef matrix, despite
a satisfying regression equation:
log Alt = 1,047 log Ref – 0,189.
Note that a highly correlation coefficient value can lead to a failure in the
linearity test robustness.
Based on the experimental design of the relative linearity, the estimation of
the method precision by CL(<yU/L>) mainly comes from the residual
standard deviation sy:x. The precision profiles of the relative sensitivity are
only intrinsic to the alternative method; they are presented annex 4.
The SimPlate TVC method shows satisfying relative linearity
performances for total viable count in the tested meat, dairy,
vegetables, backery and seafood products.

BIOCONTROL SYSTEMS Inc.
ADRIA Développement 8/64 December 21, 2009
SimPlate TVC - Version 0
2.1.3.2. Relative accuracy
Raw data, calculation details and graphs are provided annex 5, the summary
is presented hereafter.
n : number of samples R : ratio SDr(Alt)/SD(Ref)
a : ordinate b: slope Critical T : critical value to Student t table
* x-axis and y-axis choice depends on the selected regression according to R
Statistical Interpretation: P > 5 % : not significant 1 % < P < 5 % : significant P < 1 % : highly significant
Category n R Regression
used a t(a) b t(b) Critical T
P% Bias
Intercept (0) Slope (1)
Meat products 16 1,67 GMFR 0,546 1,499 0,872 1,833 2,145 16 9 0,058
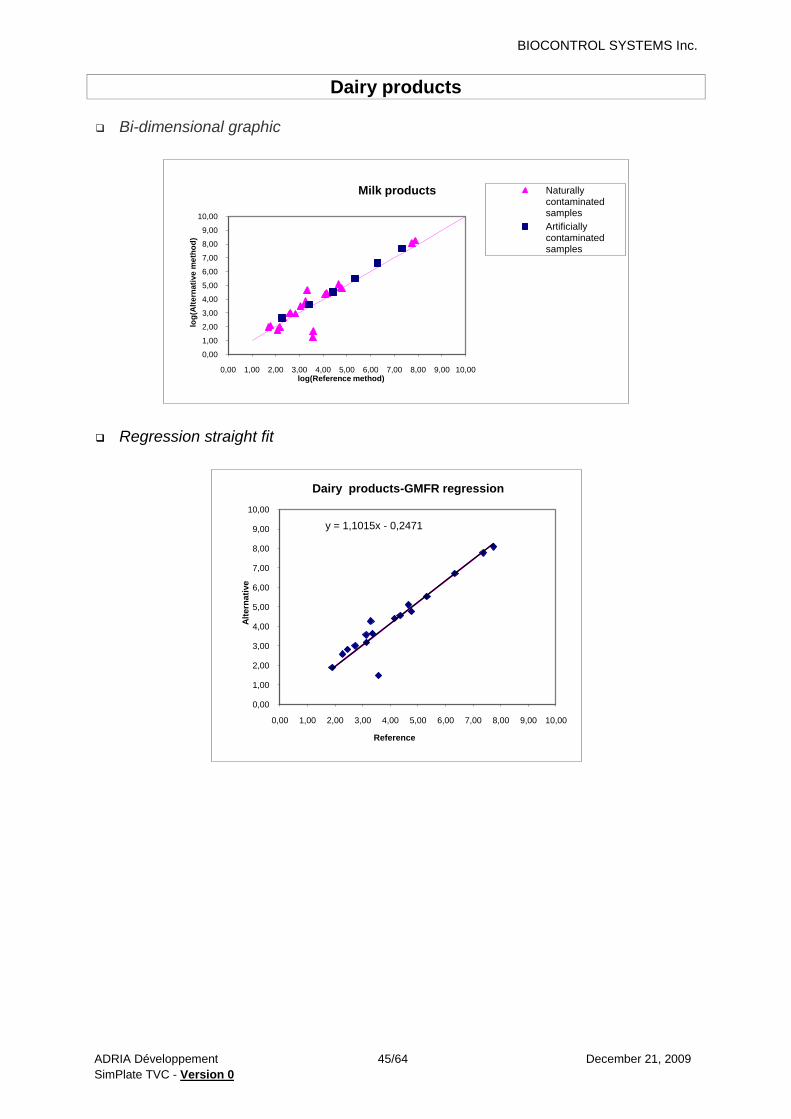
Dairy products 17 1,10 GMFR -0,247 0,586 1,106 1,075 2,131 57 30 0,290
Fruits and vegetables 14 3,33 OLS1 -0,527 1,026 1,081 0,769 2,179 32 46 0,153
Bakery and others 15 1,75 GMFR -0,259 1,602 1,087 2,052 2,160 13 6 0,030
Seafood products 17 0,33 OLS2 -0,238 1,883 1,011 0,436 2,131 8 67 0,215
All products 79 1,50 GMFR -0,074 0,532 1,026 0,872 1,991 60 39 0,150
Five disagreements were observed between the alternative and the
reference methods. Some streaks were realised on PCA from several wells
of the SimPlate TVC device. Colonies with different morphologies and
colours were identified by 16S rDNA sequencing. Molecular identifications
were also realised for the different isolates observed by the reference
method. Results are presented hereafter:
Sample
n° Product
Identifications
ISO 4833 SimPlate TVC
Enumeration Identification Enumeration Identification
1138
Frozen
artichoke
hearts
3,60 (log CFU/g)
and
3,60 (log CFU/g)
Brachybacterium sacelli
Dermacoccus sp.
Dermacoccus barathri
Arsenicicoccus bolidensis
1,30 (log CFU/g)
and
2,20 (log CFU/g)
Microbacterium aurum
Microbacterium arborescens
Microbacterium arborescens
Rathayibacter tritici
Microbacterium arborescens
1246 Dry sausage
8,58 (log CFU/g)
and
8,56 (log CFU/g)
Lactobacillus sakei
Lactobacillus sakei
7,45 (log CFU/g)
and
7,00 (log CFU/g)
Staphylococcus saprophyticus
Lactobacillus sakei
Staphylococcus saprophyticus
1254 Half creamed
pasteurized milk
3,58 (log CFU/g)
and
3,56 (log CFU/g)
In progress
1,70 (log CFU/g)
and
1,26 (log CFU/g)
Pseudomonas (fluorescens)
Bacillus subtilis
1370 Guacamole
4,60 (log CFU/g)
and
4,43 (log CFU/g)
Lactobacillus plantarum
Microbacterium oxydens
3,62 (log CFU/g)
and
3,49 (log CFU/g)
Enterococcus casseliflavus
Bacillus pumilus
Microbacterium oxydans
Bacillus subtilis
1371 Half creamed
pasteurized milk
3,26 (log CFU/g)
and
3,32 (log CFU/g)
Pseudomonas sp
Microbacterium phyllosphaerae
Pseudomonas sp
Microbacterium sp
Pseudomonas sp
3,88 (log CFU/g)
and
4,67 (log CFU/g)
Pseudomonas sp.
Bold typing indicates common identification results between both methods.

BIOCONTROL SYSTEMS Inc.
ADRIA Développement 9/64 December 21, 2009
SimPlate TVC - Version 0
According to the observed biodiversity, the recovery performances could be
different between the alternative and the reference methods. Note that
depending of the analysed ecosystems, total viable count could be higher by
the reference method or by the alternative method. There is as well no
relationship with a production process or a food category.
However, taking into account all the analysed samples, bias between both
methods are characterised by small values, varying from 0,030 to 0,290 Log
CFU/g.
The intercept close to 0 and the slope close to 1 are validated for all the
tested categories.
The SimPlate TVC method shows satisfying relative accuracy
performances for total viable count enumeration:
- meat products,
- dairy products,
- fruits and vegetables,
- bakery and others,
- seafood products.
2.2 Detection and quantification limits
The critical level is the defined as the smallest amount which can be detected (not null), but
not quantified as an exact value. Below this value, it cannot be sure that the true value is not
null.
The detection limit is defined as being higher than the critical level because it involves a
power, the probability 1-, which has to be well over 50 %, for example 95 %.
The quantification limit is defined as the smallest amount of analyte (that is the lowest actual
number of organisms), which can be measured and quantified with defined precision and
accuracy under the experimental conditions by the method under validation.
The detection and quantification limits were determined with a pure culture of
Escherichia coli strain Adria 1.
Five different levels of inoculation were tested, with six replicates per level,
i.e. a total of 30 analyses by the alternative method.

BIOCONTROL SYSTEMS Inc.
ADRIA Développement 10/64 December 21, 2009
SimPlate TVC - Version 0
Quantification limit were calculated for six independent blank samples
determinations.
All the data and the details of calculation are provided in the annex 6.
The critical level (50% of detection) were estimated and calculations were
performed to determine the limit of detection (LOD) and limit of quantification
(LOQ). Results are the following:
Calculation formula Calculated values
LC 1,65 So + Xo 3,9
LOD 3,3 So + Xo 5,8
LOQ 10So + Xo 13,5
3 CONCLUSION
The conclusions of the methods comparative study according to the
ISO16140 standard are:
- the SimPlate TVC method shows satisfying relative linearity and
accuracy results;
- the detection and quantification limits are respectively:
5,8 and 13,5 CFU/g.

BIOCONTROL SYSTEMS Inc.
ADRIA Développement 11/64 December 21, 2009
SimPlate TVC - Version 0
Annexes

BIOCONTROL SYSTEMS Inc.
ADRIA Développement 12/64 December 21, 2009
SimPlate TVC - Version 0
Annex 1 - Diagram of the reference method test procedure ISO 4833 -
Horizontal method for the enumeration of micro- organisms - Colony-count technique at 30 °C
10 g + 90 ml peptone salt
Stomach
Inoculate 2 plates per dilution
Incubate at 30°C 1°C for 72 h 3 h
Reading

BIOCONTROL SYSTEMS Inc.
ADRIA Développement 13/64 December 21, 2009
SimPlate TVC - Version 0
Annex 2 - The alternative method test procedure SimPlate Total Plate Count
10 g sample + 90 ml peptone salt
Powdered medium + 9 ml Stomach
sterile deionized water containing 1 ml + 9 ml medium
1 ml of supplement A/100 ml
Pour sample/medium mixture onto
the center of a plate
Replace the lid
Incubate at 30°C 1°C for 24 to 28 h
During the validation, an incubation time of 24 h will be tested
Reading

BIOCONTROL SYSTEMS Inc.
ADRIA Développement 14/64 December 21, 2009
SimPlate TVC - Version 0
Annex 3 - Raw data of the linearity and the accuracy
Summary

BIOCONTROL SYSTEMS Inc.
ADRIA Développement 15/64 December 21, 2009
SimPlate TVC - Version 0
LINEARITY
Sample N°
Product
Reference method:ISO 4833 Alternative method:Simplate Total Plate Count
Dilution
Replicate 1 Replicate 2 cfu/g
Replicate1 cfu/g
Replicate2 log cfu/g
Replicate1 log cfu/g
Replicate2 Dilution
Replicate 1 Replicate 2 Replicate1
(cfu/g) Replicate2
(cfu/g) Replicate1 (log cfu/g)
Replicate2 (log cfu/g) cfu/plate
(a) cfu/plate
(b) cfu/plate
(a) cfu/plate
(b) Positive wells
Result (cfu/g)
Positive wells
Result (cfu/g)
1870
Fre
sh o
rang
e ju
ice
10 22 16 21 18 210 190 2,32 2,28 10 27 640 27 640 640 640 2,81 2,81
100 4 3 0 3
100 2 400 2 400
1871 10 166 189 204 187 1800 1900 3,26 3,28 10 70 2980 75 3720 3000 3700 3,48 3,57
100 22 12 19 16
100 23 5400 11 2400
1872 100 197 211 204 192 20000 19000 4,30 4,28 100 67 26600 68 27600 27000 28000 4,43 4,45
1000 18 21 13 18
1000 13 28000 15 32000
1873 1000 239 184 236 200 210000 210000 5,32 5,32 1000 74 354000 76 392000 350000 390000 5,54 5,59
10000 23 16 22 13
10000 13 280000 16 360000
1874 10000 184 238 182 156 2100000 1700000 6,32 6,23 10000 77 4140000 84 >7380000 4100000 3200000 6,61 6,51
100000 22 23 18 13
100000 10 2200000 15 3200000
1875 10000 >300 >300 >300 >300 5700000 5400000 6,76 6,73 10000 84 >7380000 83 7380000 9000000 7000000 6,95 6,85
100000 60 53 54 54
100000 35 9000000 29 7000000

BIOCONTROL SYSTEMS Inc.
ADRIA Développement 16/64 December 21, 2009
SimPlate TVC - Version 0
LINEARITY
Sample N°
Product
Reference method:ISO 4833 Alternative method:Simplate Total Plate Count
Dilution
Replicate 1 Replicate 2 cfu/g
Replicate1 cfu/g
Replicate2 log cfu/g
Replicate1 log cfu/g
Replicate2 Dilution
Replicate 1 Replicate 2 Replicate1
(cfu/g) Replicate2
(cfu/g) Replicate1 (log cfu/g)
Replicate2 (log cfu/g) cfu/plate
(a) cfu/plate
(b) cfu/plate
(a) cfu/plate
(b) Positive wells
Result (cfu/g)
Positive wells
Result (cfu/g)
1876
Pas
try
10 29 24 43 38 290 400 2,46 2,60 10 23 540 9 180 540 180 2,73 2,26
100 6 4 4 2
100 1
0
1880 10 22 26 62 64 250 630 2,40 2,80 10 24 560 35 900 560 900 2,75 2,95
100 3 4 5 8
100 3 600 7 1400
1883 10 94 106 80 79 1000 800 3,00 2,90 10 39 1040 24 560 1000 560 3,00 2,75
100 13 10 9 8
100 7 140 2 40
1884 10 136 148 77 124 1500 1000 3,18 3,00 10 68 2760 35 900 2800 900 3,45 2,95
100 13 22 10 14
100 8 1600 4 800
1917 10 67 69 176 134 720 1500 2,86 3,18 10 43 1200 69 2880 1200 2900 3,08 3,46
100 14 9 12 14
100 13 280 28 6800
1918 100 >300 >300 >300 >300 93000 39000 4,97 4,59 100 82 62400 76 39200 62000 39000 4,79 4,59
1000 85 100 31 46
1000 29 70000 3 28000
1981 10 163 130 271 250 1500 2700 3,18 3,43 10 53 1660 24 560 1700 560 3,23 2,75
100 11 16 24 50
100 5 1000 2 400
1982 1000 >300 >300 >300 >300 440000 2600000 5,64 6,41 1000 83 738000 84 >738000 1100000 5100000 6,04 6,71
10000 35 52 257 270
10000 41 1120000 80 5080000
2103 10 90 89 133 111 880 1300 2,94 3,11 10 31 760 53 1660 760 1700 2,88 3,23
100 9 6 19 17
100 4 800 16 3600

BIOCONTROL SYSTEMS Inc.
ADRIA Développement 17/64 December 21, 2009
SimPlate TVC - Version 0
LINEARITY
Sample N°
Product
Reference method:ISO 4833 Alternative method:Simplate Total Plate Count
Dilution
Replicate 1 Replicate 2 cfu/g
Replicate1 cfu/g
Replicate2 log cfu/g
Replicate1 log cfu/g
Replicate2 Dilution
Replicate 1 Replicate 2 Replicate1
(cfu/g) Replicate2
(cfu/g) Replicate1 (log cfu/g)
Replicate2 (log cfu/g) cfu/plate
(a) cfu/plate
(b) cfu/plate
(a) cfu/plate
(b) Positive wells
Result (cfu/g)
Positive wells
Result (cfu/g)
1877
Sca
llops
terr
ine
10 3 1 2 3 20 25 1,30 1,40 10 0 <10 0 <10 <10 <10 <1,00 <1,00
100 0 1 1 1
100 0
0
1878 10 1 0 2 1 5 15 0,70 1,18 10 1 20 3 60 20 60 1,30 1,78
100 0 0 0 0
100
1879 10 0 4 4 4 20 40 1,30 1,60 10 1 20 2 40 20 40 1,30 1,60
100 0 0 0 1
100
1881 10 2 7 2 3 45 25 1,65 1,40 10 5 100 2 40 100 40 2,00 1,60
100 0 0 0 0
100 0
0
1882 10 8 10 17 10 86 160 1,93 2,20 10 10 220 11 240 220 240 2,34 2,38
100 0 1 3 4
100 1
1
1916 100 >300 >300 >300 >300 >300000 >300000 >5,48 >5,48 100 84
84
>738000 >738000 >5,87 5,87
1000 >300 >300 >300 >300
1000 84 >738000 84 >738000
1979 10 3 5 13 9 40 100 1,60 2,00 10 1 20 14 300 20 300 1,30 2,48
100 0 1 0 0
100 0
1 200
1980 100000 >300 >300 113 127 55000000 13000000 7,74 7,11 100000 84 >73800000 74 35400000 48000000 42000000 7,68 7,62
1000000 53 56 20 15
1000000 21 48000000 19 42000000
2005 10 120 140 118 132 1500 1400 3,18 3,15 10 65 2480 62 2240 2500 2200 3,40 3,34
100 31 32 28 25
100 12 2600 13 2800
2005 bis 100 140 201 137 125 20000 15000 4,30 4,18 100 52 16000 54 17200 16000 17000 4,20 4,23
1000 36 64 29 32
1000 12 26000 10 22000
2074 1000 >300 >300 >300 >300 2000000 490000 6,30 5,69 10000 36 940000 72 3240000 940000 3240000 5,97 6,51
10000 219 183 55 43

BIOCONTROL SYSTEMS Inc.
ADRIA Développement 18/64 December 21, 2009
SimPlate TVC - Version 0
LINEARITY
Sample N°
Product
Reference method:ISO 4833 Alternative method:Simplate Total Plate Count
Dilution
Replicate 1 Replicate 2 cfu/g
Replicate1 cfu/g
Replicate2 log cfu/g
Replicate1 log cfu/g
Replicate2 Dilution
Replicate 1 Replicate 2 Replicate1
(cfu/g) Replicate2
(cfu/g) Replicate1 (log cfu/g)
Replicate2 (log cfu/g) cfu/plate
(a) cfu/plate
(b) cfu/plate
(a) cfu/plate
(b) Positive wells
Result (cfu/g)
Positive wells
Result (cfu/g)
1919
Gro
und
beef
100 108 80 127 120 9400 13000 3,97 4,11 100 54 17200 51 15600 17000 16000 4,23 4,20
1000 7 11 16 15
1000 5 10000 5 10000
1983 100 226 303 234 276 28000 26000 4,45 4,41 100 76 39200 70 29800 39000 30000 4,59 4,48
1000 38 52 23 33
1000 17 38000 14 30000
1984 10000 6 7 7 4 65000 55000 4,81 4,74 10000 5 100000 3 60000 100000 60000 5,00 4,78
100000 1 0 2 0
100000 0
0
1995 100000 298 297 296 293 30000000 30000000 7,48 7,48 100000 79 47000000 76 39200000 47000000 39000000 7,67 7,59
1000000 24 38 38 34
1000000 18 400000000 12 26000000
1996 1000 114 97 115 102 110000 110000 5,04 5,04 1000 56 184000 50 150000 180000 150000 5,26 5,18
10000 12 9 9 8
10000 8 160000 11 240000
2073 100 134 115 127 110 12000 12000 4,08 4,08 100 43 12000 43 12000 12000 12000 4,08 4,08
1000 9 8 19 9
1000 9 18000 6 12000
2146 1000 >300 >300 >300 >300 410000 460000 5,61 5,66 1000 80 508000 81 556000 510000 560000 5,71 5,75
10000 39 42 47 44
2147 100 25 30 22 25 2800 2400 3,45 3,38 10 52 1600 47 1360 1600 1400 3,20 3,15
1000 0 7 1 4
100 5 1000 9 1800
2013
Pas
teur
ized
hal
f cre
amed
milk
1 171 184 170 171 190 180 2,28 2,26 1 78 440 73 338 440 340 2,64 2,53
10 25 34 26 30
10 15 320 13 280
2014 10 245 237 175 222 2500 2000 3,40 3,30 10 77 4140 79 4700 4100 4700 3,61 3,67
100 29 36 30 19
100 23 5400 21 4800
2015 100 259 263 225 178 26000 20000 4,41 4,30 100 74 35400 75 37200 35000 37000 4,54 4,57
1000 31 22 21 26
1000 22 50000 19 42000
2016 1000 206 207 199 209 220000 200000 5,34 5,30 1000 71 312000 75 372000 310000 370000 5,49 5,57
10000 41 23 20 22
10000 25 580000 14 300000
2017 10000 181 184 248 229 1900000 2400000 6,28 6,38 10000 78 4400000 82 6240000 4400000 6200000 6,64 6,79
100000 29 22 25 33
100000 19 4200000 30 7400000
2018 100000 187 220 238 252 21000000 25000000 7,32 7,40 100000 79 47000000 83 73800000 47000000 74000000 7,67 7,87
1000000 17 30 26 32
1000000 19 42000000 28 68000000

BIOCONTROL SYSTEMS Inc.
ADRIA Développement 19/64 December 21, 2009
SimPlate TVC - Version 0
Linearity: summary results
Product ISO 4833 Simplate TVC
Replicate1 Replicate2 Replicate1 Replicate2
Fre
sh o
rang
e
juic
e
2,32 2,28 2,81 2,81
3,26 3,28 3,48 3,57
4,30 4,28 4,43 4,45
5,32 5,32 5,54 5,59
6,32 6,23 6,61 6,51
6,76 6,73 6,95 6,85 P
astr
y
2,46 2,60 2,73 2,26
2,40 2,80 2,75 2,95
3,00 2,90 3,00 2,75
3,18 3,00 3,45 2,95
2,86 3,18 3,08 3,46
4,97 4,59 4,79 4,59
3,18 3,43 3,23 2,75
5,64 6,41 6,04 6,71
2,94 3,11 2,88 3,23
Sca
llops
terr
ine
1,30 1,40 <1,00 <1,00
0,70 1,18 1,30 1,78
1,30 1,60 1,30 1,60
1,65 1,40 2,00 1,60
1,93 2,20 2,34 2,38
>5,48 >5,48 >5,87 5,87
1,60 2,00 1,30 2,48
7,74 7,11 7,68 7,62
3,18 3,15 3,40 3,34
4,30 4,18 4,20 4,23
6,30 5,69 5,97 6,51
Gro
und
beef
3,97 4,11 4,23 4,20
4,45 4,41 4,59 4,48
4,81 4,74 5,00 4,78
7,48 7,48 7,67 7,59
5,04 5,04 5,26 5,18
4,08 4,08 4,08 4,08
5,61 5,66 5,71 5,75
3,45 3,38 3,20 3,15
Pas
teur
ized
hal
f
crea
med
milk
2,28 2,26 2,64 2,53
3,40 3,30 3,61 3,67
4,41 4,30 4,54 4,57
5,34 5,30 5,49 5,57
6,28 6,38 6,64 6,79
7,32 7,40 7,67 7,87

BIOCONTROL SYSTEMS Inc.
ADRIA Développement 20/64 December 21, 2009
SimPlate TVC - Version 0
ACCURACY – MEAT PRODUCTS
Sample N°
Product
Reference method:ISO 4833 Alternative method:Simplate Total Plate Count
Dilution
Replicate 1 Replicate 2 cfu/g
Replicate1 cfu/g
Replicate2 log cfu/g
Replicate1 log cfu/g
Replicate2 Dilution
Replicate 1 Replicate 2 Replicate1
(cfu/g) Replicate2
(cfu/g) Replicate1 (log cfu/g)
Replicate2 (log cfu/g)
cfu/plate
(a) cfu/plate
(b) cfu/plate
(a) cfu/plate
(b) Positive wells
Result (cfu/g)
Positive wells
Result (cfu/g)
1131 Beef meat (Bavette) 10000 >300 >300 >300 >300 14000000 >30000000 7,15 >7,48 10000 84 >7380000 84 >7380000 >7400000 >7400000 >6,87 >6,87
100000 155 130 >300 >300
1132 Escalope of turkey 10000 >300 >300 >300 >300 41000000 >30000000 7,61 >7,48 10000 84 >7380000 84 >7380000 >7400000 >7400000 >6,87 >6,87
100000 444 381 >300 >300
1133 Sausage with garlic 10000 >300 >300 280 291 9400000 2800000 6,97 6,45 1000 84 >738000 84 >738000 >740000 >740000 >5,87 >5,87
100000 78 110 29 25
1134 Dry sausage 10000 >300 >300 >300 >300 >30000000 >30000000 >7,48 >7,48 1000 84 >738000 84 >738000 >740000 >740000 >5,87 >5,87
10000 >300 >300 >300 >300
1135 Calf olive 10 203 231 253 253 2200 2500 3,34 3,40 10 66 2560 71 3120 2600 3100 3,41 3,49
(ready to eat meal) 100 19 24 25 24
100 10 2200 16 3600
1136 Duck with boletus 1000 171 150 127 138 160000 130000 5,20 5,11 1000 77 414000 65 248000 410000 250000 5,61 5,40
(ready to eat meal) 10000 19 22 12 18
1178 Ground beef 100 54 72 63 81 6200 7000 3,79 3,85 10 81 5560 5 (1/100
dilution)
10000 5600 10000 3,75 4,00
1000 7 4 3 7
1179 Escalope of turkey 1000 122 111 117 119 120000 120000 5,08 5,08 10000 6 120000 8 160000 120000 160000 5,08 5,20
10000 11 9 13 9
1180 Steak 1000 214 142 123 154 170000 140000 5,23 5,15 1000 67 266000 61 224000 27000 22000 4,43 4,34
10000 12 14 19 13
1181 Raw ham 1000 277 311 226 196 300000 210000 5,48 5,32 1000 57 190000 47 136000 190000 136000 5,28 5,13
10000 33 29 15 24
1183 Cooked chicken(columbo)
10000 >300 >300 >300 >300 >3000000 >3000000 >6,48 >6,48 100000 84 >73800000 84 >73800000 >74000000 >74000000 >7,87 >7,87
10000 >300 >300 >300 >300
1184 Cooked beef(Bourguignon)
1000 100 95 125 145 96000 140000 4,98 5,15 1000 38 100000 33 84000 100000 84000 5,00 4,92
10000 4 13 18 12
1246 Dry sausage 1000000 >300 >300 >300 >300 380000000 360000000 8,58 8,56 1000000 13 2,80E+07 5 1,00E+07 2,80E+07 1,00E+07 7,45 7,00
10000000 34 42 31 41
BIOCONTROL SYSTEMS Inc.
ADRIA Développement 21/64 December 21, 2009
SimPlate TVC - Version 0
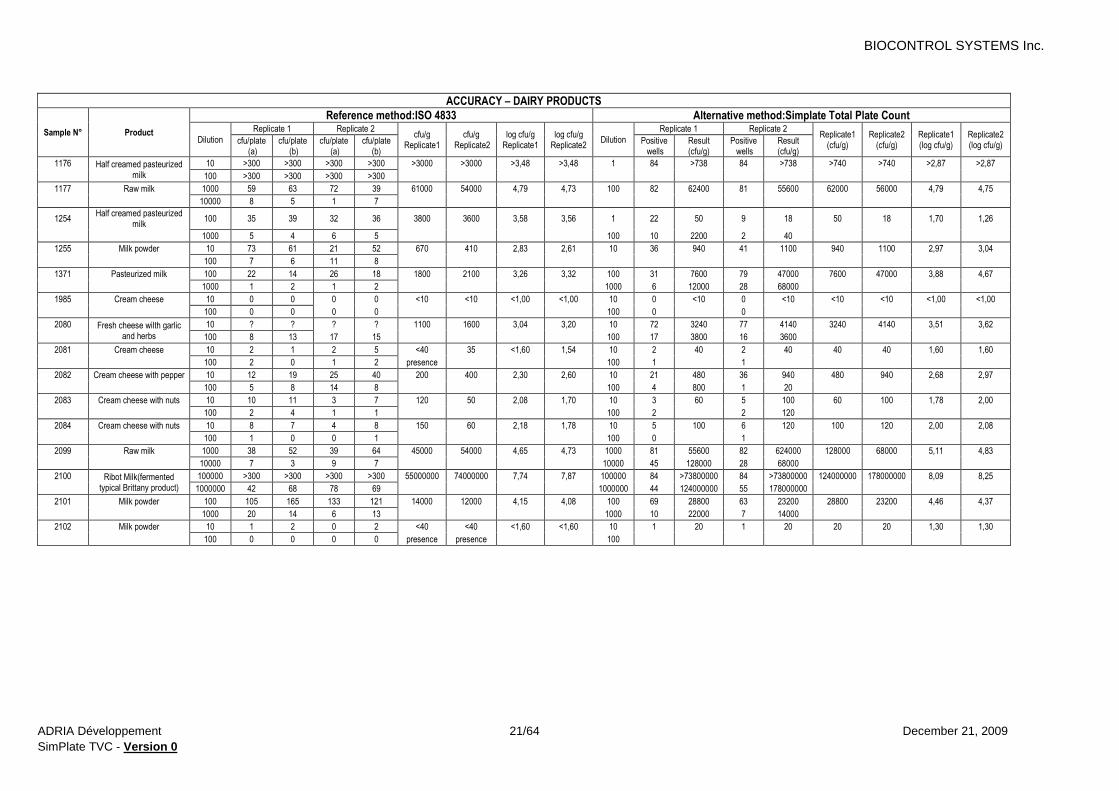
ACCURACY – DAIRY PRODUCTS
Sample N° Product
Reference method:ISO 4833 Alternative method:Simplate Total Plate Count
Dilution
Replicate 1 Replicate 2 cfu/g
Replicate1 cfu/g
Replicate2 log cfu/g
Replicate1 log cfu/g
Replicate2 Dilution
Replicate 1 Replicate 2 Replicate1
(cfu/g) Replicate2
(cfu/g) Replicate1 (log cfu/g)
Replicate2 (log cfu/g)
cfu/plate
(a) cfu/plate
(b) cfu/plate
(a) cfu/plate
(b) Positive wells
Result (cfu/g)
Positive wells
Result (cfu/g)
1176 Half creamed pasteurized milk
10 >300 >300 >300 >300 >3000 >3000 >3,48 >3,48 1 84 >738 84 >738 >740 >740 >2,87 >2,87
100 >300 >300 >300 >300
1177 Raw milk 1000 59 63 72 39 61000 54000 4,79 4,73 100 82 62400 81 55600 62000 56000 4,79 4,75
10000 8 5 1 7
1254 Half creamed pasteurized
milk 100 35 39 32 36 3800 3600 3,58 3,56 1 22 50 9 18 50 18 1,70 1,26
1000 5 4 6 5
100 10 2200 2 40
1255 Milk powder 10 73 61 21 52 670 410 2,83 2,61 10 36 940 41 1100 940 1100 2,97 3,04
100 7 6 11 8
1371 Pasteurized milk 100 22 14 26 18 1800 2100 3,26 3,32 100 31 7600 79 47000 7600 47000 3,88 4,67
1000 1 2 1 2
1000 6 12000 28 68000
1985 Cream cheese 10 0 0 0 0 <10 <10 <1,00 <1,00 10 0 <10 0 <10 <10 <10 <1,00 <1,00
100 0 0 0 0
100 0
0
2080 Fresh cheese wilth garlic
and herbs
10 ? ? ? ? 1100 1600 3,04 3,20 10 72 3240 77 4140 3240 4140 3,51 3,62
100 8 13 17 15
100 17 3800 16 3600
2081 Cream cheese 10 2 1 2 5 <40 35 <1,60 1,54 10 2 40 2 40 40 40 1,60 1,60
100 2 0 1 2 presence
100 1
1
2082 Cream cheese with pepper 10 12 19 25 40 200 400 2,30 2,60 10 21 480 36 940 480 940 2,68 2,97
100 5 8 14 8
100 4 800 1 20
2083 Cream cheese with nuts 10 10 11 3 7 120 50 2,08 1,70 10 3 60 5 100 60 100 1,78 2,00
100 2 4 1 1
100 2
2 120
2084 Cream cheese with nuts 10 8 7 4 8 150 60 2,18 1,78 10 5 100 6 120 100 120 2,00 2,08
100 1 0 0 1
100 0
1
2099 Raw milk 1000 38 52 39 64 45000 54000 4,65 4,73 1000 81 55600 82 624000 128000 68000 5,11 4,83
10000 7 3 9 7
10000 45 128000 28 68000
2100 Ribot Milk(fermented
typical Brittany product)
100000 >300 >300 >300 >300 55000000 74000000 7,74 7,87 100000 84 >73800000 84 >73800000 124000000 178000000 8,09 8,25
1000000 42 68 78 69
1000000 44 124000000 55 178000000
2101 Milk powder 100 105 165 133 121 14000 12000 4,15 4,08 100 69 28800 63 23200 28800 23200 4,46 4,37
1000 20 14 6 13
1000 10 22000 7 14000
2102 Milk powder 10 1 2 0 2 <40 <40 <1,60 <1,60 10 1 20 1 20 20 20 1,30 1,30
100 0 0 0 0 presence presence
100
BIOCONTROL SYSTEMS Inc.
ADRIA Développement 22/64 December 21, 2009
SimPlate TVC - Version 0
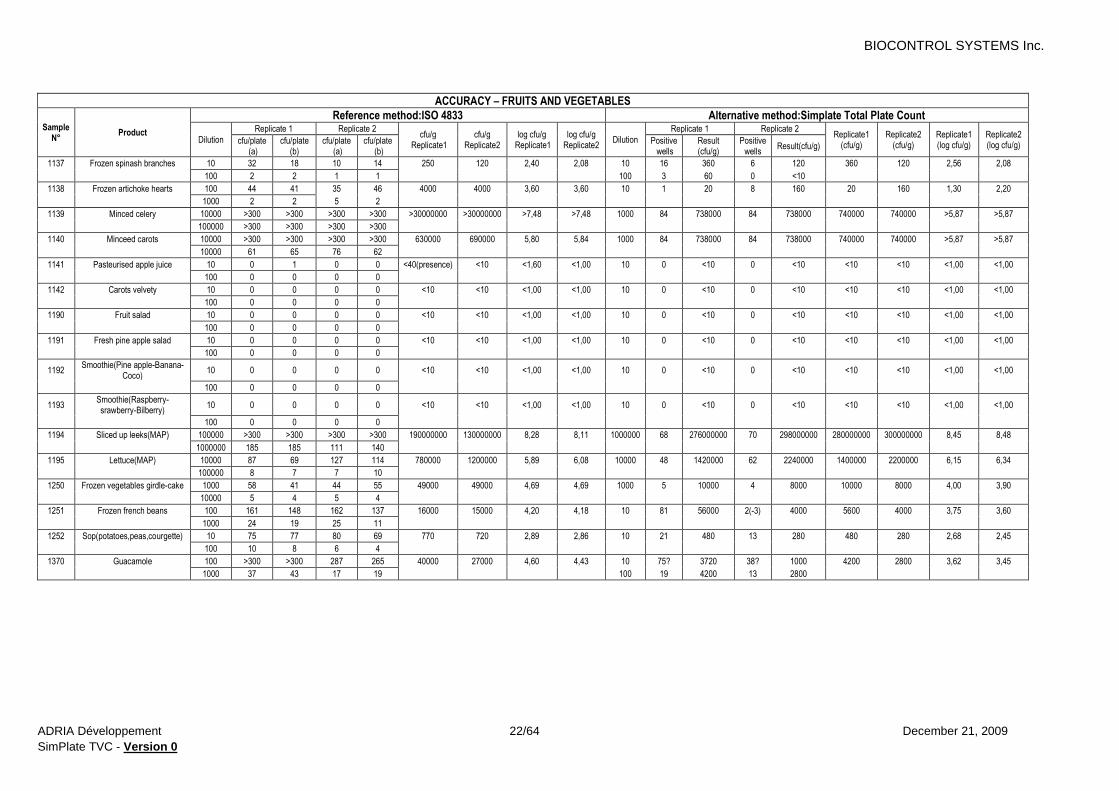
ACCURACY – FRUITS AND VEGETABLES
Sample N°
Product
Reference method:ISO 4833 Alternative method:Simplate Total Plate Count
Dilution
Replicate 1 Replicate 2 cfu/g
Replicate1 cfu/g
Replicate2 log cfu/g
Replicate1 log cfu/g
Replicate2 Dilution
Replicate 1 Replicate 2 Replicate1
(cfu/g) Replicate2
(cfu/g) Replicate1 (log cfu/g)
Replicate2 (log cfu/g)
cfu/plate
(a) cfu/plate
(b) cfu/plate
(a) cfu/plate
(b) Positive wells
Result (cfu/g)
Positive wells
Result(cfu/g)
1137 Frozen spinash branches 10 32 18 10 14 250 120 2,40 2,08 10 16 360 6 120 360 120 2,56 2,08
100 2 2 1 1
100 3 60 0 <10
1138 Frozen artichoke hearts 100 44 41 35 46 4000 4000 3,60 3,60 10 1 20 8 160 20 160 1,30 2,20
1000 2 2 5 2
1139 Minced celery 10000 >300 >300 >300 >300 >30000000 >30000000 >7,48 >7,48 1000 84 738000 84 738000 740000 740000 >5,87 >5,87
100000 >300 >300 >300 >300
1140 Minceed carots 10000 >300 >300 >300 >300 630000 690000 5,80 5,84 1000 84 738000 84 738000 740000 740000 >5,87 >5,87
10000 61 65 76 62
1141 Pasteurised apple juice 10 0 1 0 0 <40(presence) <10 <1,60 <1,00 10 0 <10 0 <10 <10 <10 <1,00 <1,00
100 0 0 0 0
1142 Carots velvety 10 0 0 0 0 <10 <10 <1,00 <1,00 10 0 <10 0 <10 <10 <10 <1,00 <1,00
100 0 0 0 0
1190 Fruit salad 10 0 0 0 0 <10 <10 <1,00 <1,00 10 0 <10 0 <10 <10 <10 <1,00 <1,00
100 0 0 0 0
1191 Fresh pine apple salad 10 0 0 0 0 <10 <10 <1,00 <1,00 10 0 <10 0 <10 <10 <10 <1,00 <1,00
100 0 0 0 0
1192 Smoothie(Pine apple-Banana-
Coco) 10 0 0 0 0 <10 <10 <1,00 <1,00 10 0 <10 0 <10 <10 <10 <1,00 <1,00
100 0 0 0 0
1193 Smoothie(Raspberry-srawberry-Bilberry)
10 0 0 0 0 <10 <10 <1,00 <1,00 10 0 <10 0 <10 <10 <10 <1,00 <1,00
100 0 0 0 0
1194 Sliced up leeks(MAP) 100000 >300 >300 >300 >300 190000000 130000000 8,28 8,11 1000000 68 276000000 70 298000000 280000000 300000000 8,45 8,48
1000000 185 185 111 140
1195 Lettuce(MAP) 10000 87 69 127 114 780000 1200000 5,89 6,08 10000 48 1420000 62 2240000 1400000 2200000 6,15 6,34
100000 8 7 7 10
1250 Frozen vegetables girdle-cake 1000 58 41 44 55 49000 49000 4,69 4,69 1000 5 10000 4 8000 10000 8000 4,00 3,90
10000 5 4 5 4
1251 Frozen french beans 100 161 148 162 137 16000 15000 4,20 4,18 10 81 56000 2(-3) 4000 5600 4000 3,75 3,60
1000 24 19 25 11
1252 Sop(potatoes,peas,courgette) 10 75 77 80 69 770 720 2,89 2,86 10 21 480 13 280 480 280 2,68 2,45
100 10 8 6 4
1370 Guacamole 100 >300 >300 287 265 40000 27000 4,60 4,43 10 75? 3720 38? 1000 4200 2800 3,62 3,45
1000 37 43 17 19
100 19 4200 13 2800

BIOCONTROL SYSTEMS Inc.
ADRIA Développement 23/64 December 21, 2009
SimPlate TVC - Version 0
ACCURACY – BAKERY AND OTHERS
Sample N°
Product
Reference method:ISO 4833 Alternative method:Simplate Total Plate Count
Dilution
Replicate 1 Replicate 2 cfu/g
Replicate1 cfu/g
Replicate2 log cfu/g
Replicate1 log cfu/g
Replicate2 Dilution
Replicate 1 Replicate 2 Replicate1
(cfu/g) Replicate2
(cfu/g) Replicate1 (log cfu/g)
Replicate2( log cfu/g)
cfu/plate (a)
cfu/plate (b)
cfu/plate (a)
cfu/plate (b)
Positive wells
Result (cfu/g)
Positive wells
Result (cfu/g)
1188 Pastry(Eclair café) 10 128 138 167 147 1300 1500 3,11 3,18 10 24 560 34 860 560 860 2,75 2,93
100 4 8 15 11
1189 Pastry(Religieuse chocolat) 10 9 11 3 7 110 50 2,04 1,70 10 4 80 4 80 80 80 1,90 1,90
100 1 3 1 2
Ne
1244 Pancakes 10 28 56 25 20 420 240 2,62 2,38 10 17 380 37 960 380 960 2,58 2,98
100 3 6 4 3
1245 Baked custard 10 128 129 90 88 1300 880 3,11 2,94 10 41 1120 33 840 1100 840 3,04 2,92
100 21 14 7 9
1364 Whipped cream with
strawberries 10 0 0 0 0 <10 <10 <1,00 <1,00 10 1 20 0 <10 20 <10 1,30 <1,00
100 0 0 0 0
1365 Rice with milk 10 0 0 0 0 <10 <10 <1,00 <1,00 10 0 <10 0 <10 <10 <10 <1,00 <1,00
100 0 0 0 0
1366 Raspberry and currant
"coulis" 10 0 0 0 0 <10 <10 <1,00 <1,00 10 0 <10 0 <10 <10 <10 <1,00 <1,00
100 0 0 0 0
1367 Semolina with milk 10 0 0 0 0 <10 <10 <1,00 <1,00 10 0 <10 0 <10 <10 <10 <1,00 <1,00
100 0 0 0 0
1368 Bavarian cream with
strawberries 100 83 102 74 45 9400 5900 3,97 3,77 10 83 7380 66 2560 7400 2600 3,87 3,41
1000 11 11 5 6
100 28 6800 8 1600
1369 White cheese sauce with
smeet pepper 100 >300 >300 >300 >300 >300000 >300000 >5,48 >5,48 100 84 >73800 84 >73800 >74000 >74000 >4,87 >4,87
1000 >300 >300 >300 >300
1751 Custard 10000 >300 >300 >300 >300 18000000 21000000 7,26 7,32 100000 82 62400000 83 73800000 62000000 74000000 7,79 7,87
100000 177 176 214 206

BIOCONTROL SYSTEMS Inc.
ADRIA Développement 24/64 December 21, 2009
SimPlate TVC - Version 0
ACCURACY – SEAFOOD PRODUCTS
Sample N°
Product
Reference method:ISO 4833 Alternative method:Simplate Total Plate Count
Dilution
Replicate 1 Replicate 2 cfu/g
Replicate1 cfu/g
Replicate2 log cfu/g
Replicate1 log cfu/g
Replicate2 Dilution
Replicate 1 Replicate 2 Replicate1
(cfu/g) Replicate2
(cfu/g) Replicate1 (log cfu/g)
Replicate2 (log cfu/g)
cfu/plate (a)
cfu/plate (b)
cfu/plate (a)
cfu/plate (b)
Positive wells
Result (cfu/g)
Positive wells
Result (cfu/g)
1143 Whiting-pout fillet 10000 >300 >300 >300 >300 25000000 >30000000 7,40 >7,48 1000 84 >738000 84 >738000 >740000 >740000 >5,87 >5,87
100000 275 215 >300 >300
1144 Cod fillet 10000 >300 >300 235 194 6500000 2200000 6,81 6,34 1000 84 >738000 84 >738000 >740000 >740000 >5,87 >5,87
100000 63 67 26 21
1145 Cooked salmon 10 0 0 0 0 <10 <10 <1,00 <1,00 10 1 20 0 <10 20 <10 1,30 <1,00
100 0 0 0 0
1146 Salt cod pounded with garlic oil
and cream
10 0 0 0 0 <10 <10 <1,00 <1,00 10 0 <10 0 <10 <10 <10 <1,00 <1,00
100 0 0 0 0
1147 Smoked Kipper 10000 >300 >300 >300 >300 5300000 5900000 6,72 6,77 1000 84 >738000 84 >738000 >740000 >740000 >5,87 >5,87
100000 63 42 54 63
1182 Cooked Shark(curry) 10000 >300 >300 >300 >300 31000000 47000000 7,49 7,67 100000 67 26600000 77 41400000 27000000 42000000 7,43 7,62
100000 319 292 480 460
1185 Cooked peeled shrimps 1000 >300 >300 >300 >300 850000 2200000 5,93 6,34 1000 84 >738000 84 >738000 >738000 >738000 >5,87 >5,87
10000 89 81 233 204
1186 Smoked salmon 10000 205 19 278 290 1200000 2800000 6,08 6,45 100000 20 4600000 22 5000000 4600000 5000000 6,66 6,70
100000 11 21 10 27
1187 Smoked trout 10 5 2 6 7 35 65 1,54 1,81 10 5 100 3 60 100 60 2,00 1,78
100 2 0 0 1
Ne Ne
1247 Pink cooked shrimps 100 251 246 >300 >300 26000 50000 4,41 4,70 1000 21 48000 30 74000 48000 74000 4,68 4,87
1000 32 33 39(4-4) 61(7-4)
1248 Fish ready to eat meal 1000 182 188 234 225 190000 230000 5,28 5,36 10000 14 300000 16 360000 300000 360000 5,48 5,56
(Timbale) 10000 29 26 17 19
1249 Whiting fillet 10000 42 42 33 46 430000 410000 5,63 5,61 10000 22 500000 26 620000 500000 620000 5,70 5,79
100000 3 7 6 5
1253 Frozen tropical Sole fillet 1000 60 54 70 76 57000 77000 4,76 4,89 1000 24 56000 28 68000 56000 68000 4,75 4,83
10000 5 6 7 16
1745 Scallops terrine 10000 >300 >300 >300 >300 19000000 19000000 7,28 7,28 100000 69 28800000 74 354000000 29000000 35000000 7,46 7,54
100000 200 172 210 175

BIOCONTROL SYSTEMS Inc.
ADRIA Développement 25/64 December 21, 2009
SimPlate TVC - Version 0
Accuracy : summary results
Sample N°
Product ISO 4833 Simplate TVC
Replicate1 Replicate 2 Replicate1 Replicate 2
1131 Beef meat (Bavette) 7,15 >7,48 >6,87 >6,87
1132 Escalope of turkey 7,61 >7,48 >6,87 >6,87
1133 Sausage with garlic 6,97 6,45 >5,87 >5,87
1134 Dry sausage >7,48 >7,48 >5,87 >5,87
1135 Calf olive 3,34 3,40 3,41 3,49
1136 Duck with boletus 5,20 5,11 5,61 5,40
1137 Frozen spinash branches 2,40 2,08 2,56 2,08
1138 Frozen artichoke hearts 3,60 3,60 1,30 2,20
1139 Minced celery >7,48 >7,48 >5,87 >5,87
1140 Minceed carots 5,80 5,84 >5,87 >5,87
1141 Pasteurised apple juice <1,60 <1,00 <1,00 <1,00
1142 Carots velvety <1,00 <1,00 <1,00 <1,00
1143 Whiting-pout fillet 7,40 >7,48 >5,87 >5,87
1144 Cod fillet 6,81 6,34 >5,87 >5,87
1145 Cooked salmon <1,00 <1,00 1,30 <1,00
1146 Salt cod pounded with garlic oil and cream <1,00 <1,00 <1,00 <1,00
1147 Smoked Kipper 6,72 6,77 >5,87 >5,87
1176 Half creamed pasteurized milk >3,48 >3,48 >2,87 >2,87
1177 Raw milk 4,79 4,73 4,79 4,75
1178 Ground beef 3,79 3,85 3,75 4,00
1179 Escalope of turkey 5,08 5,08 5,08 5,20
1180 Steak 5,23 5,15 4,43 4,34
1181 Raw ham 5,48 5,32 5,28 5,13
1182 Cooked Shark(curry) 7,49 7,67 7,43 7,62
1183 Cooked chicken(columbo) >6,48 >6,48 >7,87 >7,87
1184 Cooked beef(Bourguignon) 4,98 5,15 5,00 4,92
1185 Cooked peeled shrimps 5,93 6,34 >5,87 >5,87
1186 Smoked salmon 6,08 6,45 6,66 6,70
1187 Smoked trout 1,54 1,81 2,00 1,78
1188 Pastry(Eclair café) 3,11 3,18 2,75 2,93
1189 Pastry(Religieuse chocolat) 2,04 1,70 1,90 1,90
1190 Fruit salad <1,00 <1,00 <1,00 <1,00
1191 Fresh pine apple salad <1,00 <1,00 <1,00 <1,00
1192 Smoothie (Pine apple-Banana-Coco) <1,00 <1,00 <1,00 <1,00
1193 Smoothie (Raspberry-srawberry-Bilberry) <1,00 <1,00 <1,00 <1,00
1194 Sliced up leeks(MAP) 8,28 8,11 8,45 8,48
1195 Lettuce(MAP) 5,89 6,08 6,15 6,34
1244 Pancakes 2,62 2,38 2,58 2,98
1245 Baked custard 3,11 2,94 3,04 2,92
1246 Dry sausage 8,58 8,56 7,45 7,00
1247 Pink cooked shrimps 4,41 4,70 4,68 4,87
1248 Fish ready to eat meal 5,28 5,36 5,48 5,56
1249 Whiting fillet 5,63 5,61 5,70 5,79
1250 Frozen vegetables girdle-cake 4,69 4,69 4,00 3,90
1251 Frozen french beans 4,20 4,18 3,75 3,60
1252 Sop(potatoes,peas,courgette) 2,89 2,86 2,68 2,45
1253 Frozen tropical Sole fillet 4,76 4,89 4,75 4,83
1254 Half creamed pasteurized milk 3,58 3,56 1,70 1,26
1255 Milk powder 2,83 2,61 2,97 3,04
BIOCONTROL SYSTEMS Inc.
ADRIA Développement 26/64 December 21, 2009
SimPlate TVC - Version 0
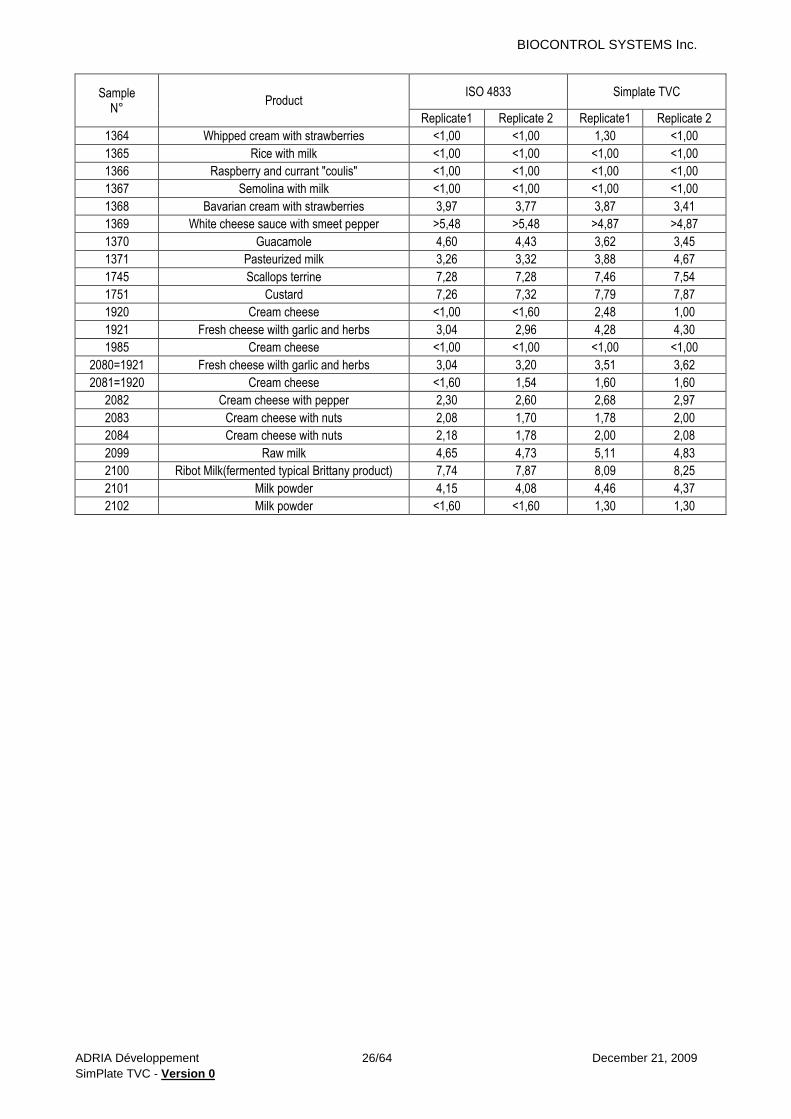
Sample N°
Product ISO 4833 Simplate TVC
Replicate1 Replicate 2 Replicate1 Replicate 2
1364 Whipped cream with strawberries <1,00 <1,00 1,30 <1,00
1365 Rice with milk <1,00 <1,00 <1,00 <1,00
1366 Raspberry and currant "coulis" <1,00 <1,00 <1,00 <1,00
1367 Semolina with milk <1,00 <1,00 <1,00 <1,00
1368 Bavarian cream with strawberries 3,97 3,77 3,87 3,41
1369 White cheese sauce with smeet pepper >5,48 >5,48 >4,87 >4,87
1370 Guacamole 4,60 4,43 3,62 3,45
1371 Pasteurized milk 3,26 3,32 3,88 4,67
1745 Scallops terrine 7,28 7,28 7,46 7,54
1751 Custard 7,26 7,32 7,79 7,87
1920 Cream cheese <1,00 <1,60 2,48 1,00
1921 Fresh cheese wilth garlic and herbs 3,04 2,96 4,28 4,30
1985 Cream cheese <1,00 <1,00 <1,00 <1,00
2080=1921 Fresh cheese wilth garlic and herbs 3,04 3,20 3,51 3,62
2081=1920 Cream cheese <1,60 1,54 1,60 1,60
2082 Cream cheese with pepper 2,30 2,60 2,68 2,97
2083 Cream cheese with nuts 2,08 1,70 1,78 2,00
2084 Cream cheese with nuts 2,18 1,78 2,00 2,08
2099 Raw milk 4,65 4,73 5,11 4,83
2100 Ribot Milk(fermented typical Brittany product) 7,74 7,87 8,09 8,25
2101 Milk powder 4,15 4,08 4,46 4,37
2102 Milk powder <1,60 <1,60 1,30 1,30

BIOCONTROL SYSTEMS Inc.
ADRIA Développement 27/64 December 21, 2009
SimPlate TVC - Version 0
Annex 4 – Linearity: statistical interpretations
Annex 4.1: Relative linearity graphs, regression lines
and calculations
Annex 4.2: Precision profiles
BIOCONTROL SYSTEMS Inc.
ADRIA Développement 28/64 December 21, 2009
SimPlate TVC - Version 0
Annex 4.1. - Relative linearity graphs, regression lines and calculations

BIOCONTROL SYSTEMS Inc.
ADRIA Développement 29/64 December 21, 2009
SimPlate TVC - Version 0
Ground beef Bi-dimensional graphic
Regression straight fit
BIOCONTROL SYSTEMS Inc.
ADRIA Développement 30/64 December 21, 2009
SimPlate TVC - Version 0
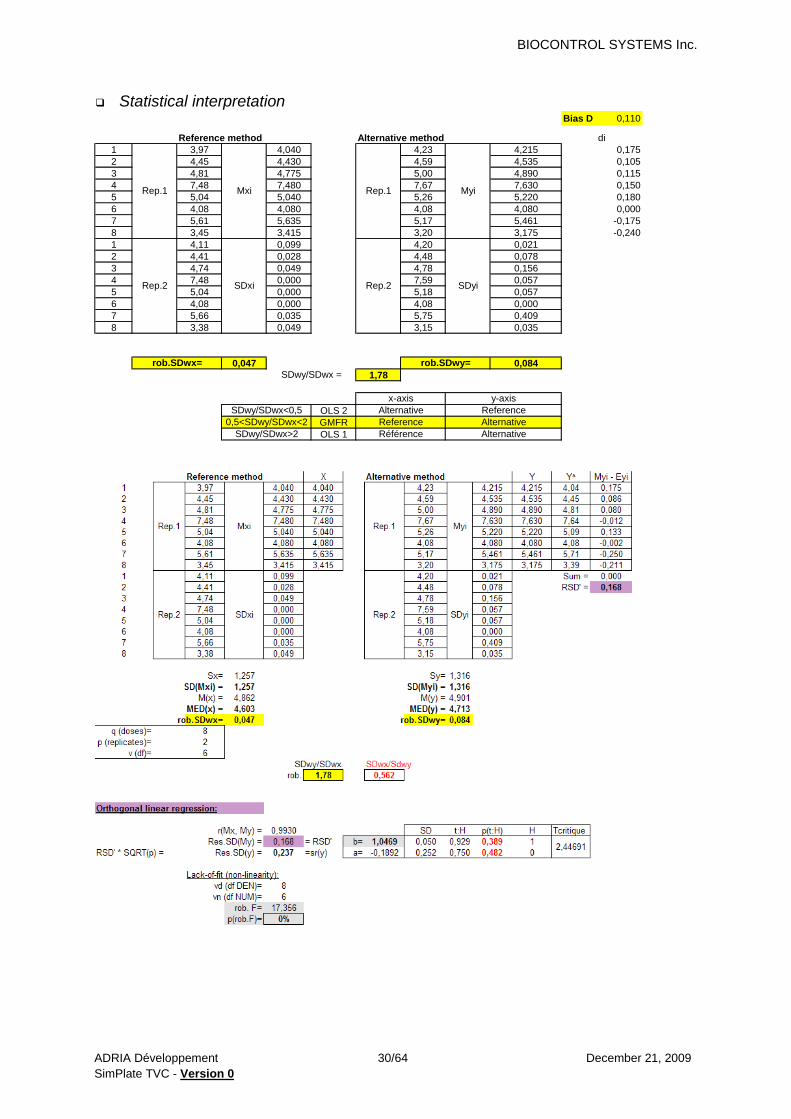
Statistical interpretation
Bias D 0,110
Reference method Alternative method di
1 3,97 4,040 4,23 4,215 0,175
2 4,45 4,430 4,59 4,535 0,105
3 4,81 4,775 5,00 4,890 0,115
4 7,48 7,480 7,67 7,630 0,150
5 5,04 5,040 5,26 5,220 0,180
6 4,08 4,080 4,08 4,080 0,000
7 5,61 5,635 5,17 5,461 -0,175
8 3,45 3,415 3,20 3,175 -0,240
1 4,11 0,099 4,20 0,021
2 4,41 0,028 4,48 0,078
3 4,74 0,049 4,78 0,156
4 7,48 0,000 7,59 0,057
5 5,04 0,000 5,18 0,057
6 4,08 0,000 4,08 0,000
7 5,66 0,035 5,75 0,409
8 3,38 0,049 3,15 0,035
0,047 0,084
1,78
OLS 2
GMFR
OLS 1
Alternative
Alternative
rob.SDwx= rob.SDwy=
SDwy/SDwx =
x-axis y-axis
Reference
Myi
Rep.2 SDyi
Rep.1
Rep.2
Mxi
SDxi
SDwy/SDwx<0,5
0,5<SDwy/SDwx<2
SDwy/SDwx>2
Rep.1
Référence
Alternative
Reference

BIOCONTROL SYSTEMS Inc.
ADRIA Développement 31/64 December 21, 2009
SimPlate TVC - Version 0
Pasteurized milk Bi-dimensional graphic
0
1
2
3
4
5
6
7
8
9
0 1 2 3 4 5 6 7 8 9
log
(Alt
ern
ati
ve
me
tho
d)
log(Reference method)
Pasteurized milk
Regression straight fit
y = 1,0224x + 0,1935
0,00
1,00
2,00
3,00
4,00
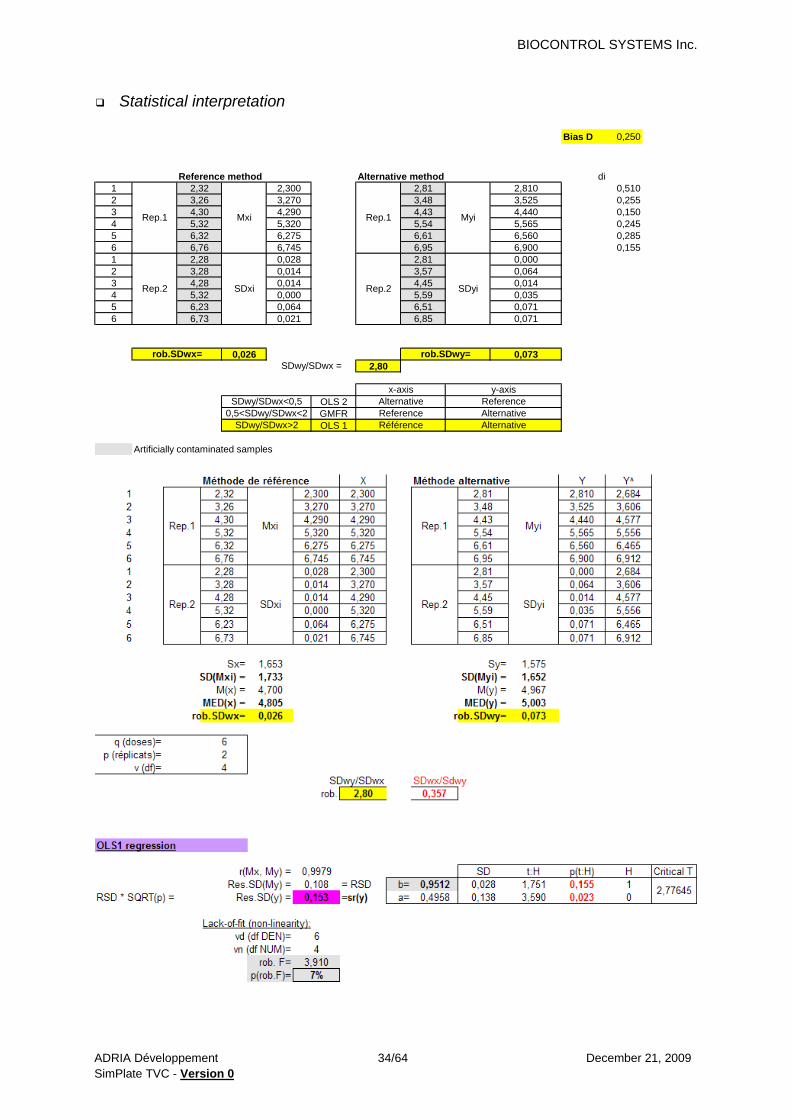
5,00
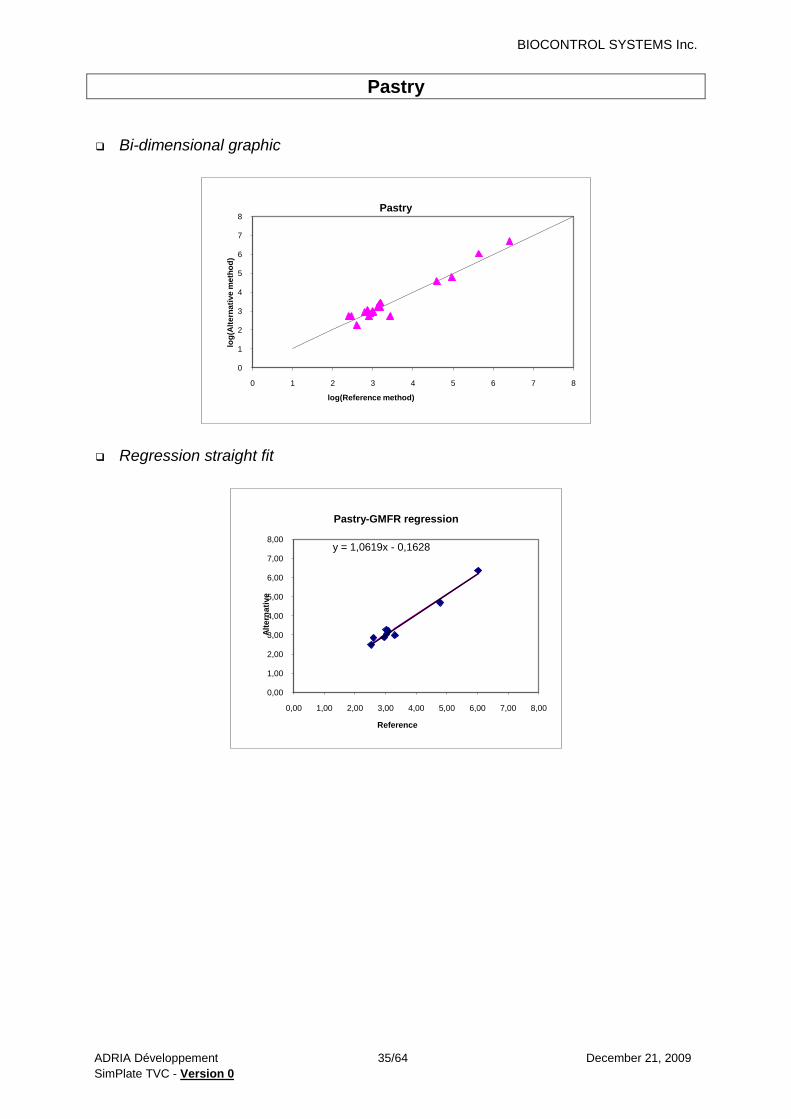
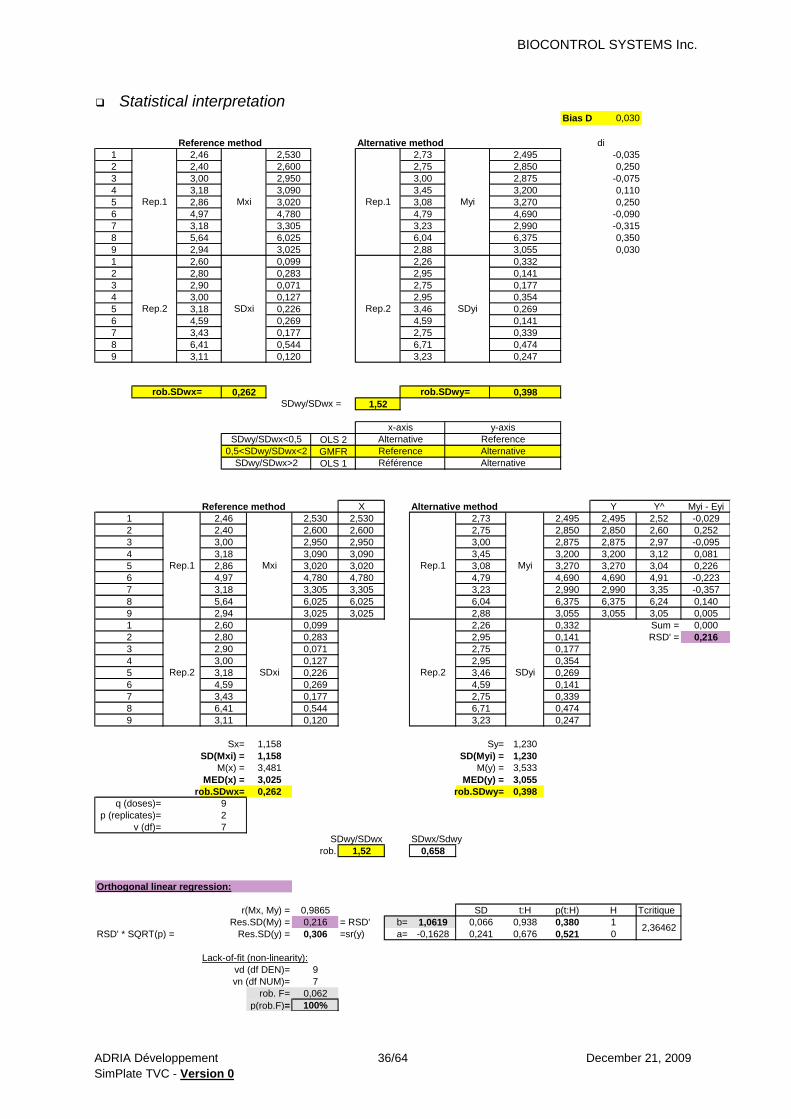
6,00
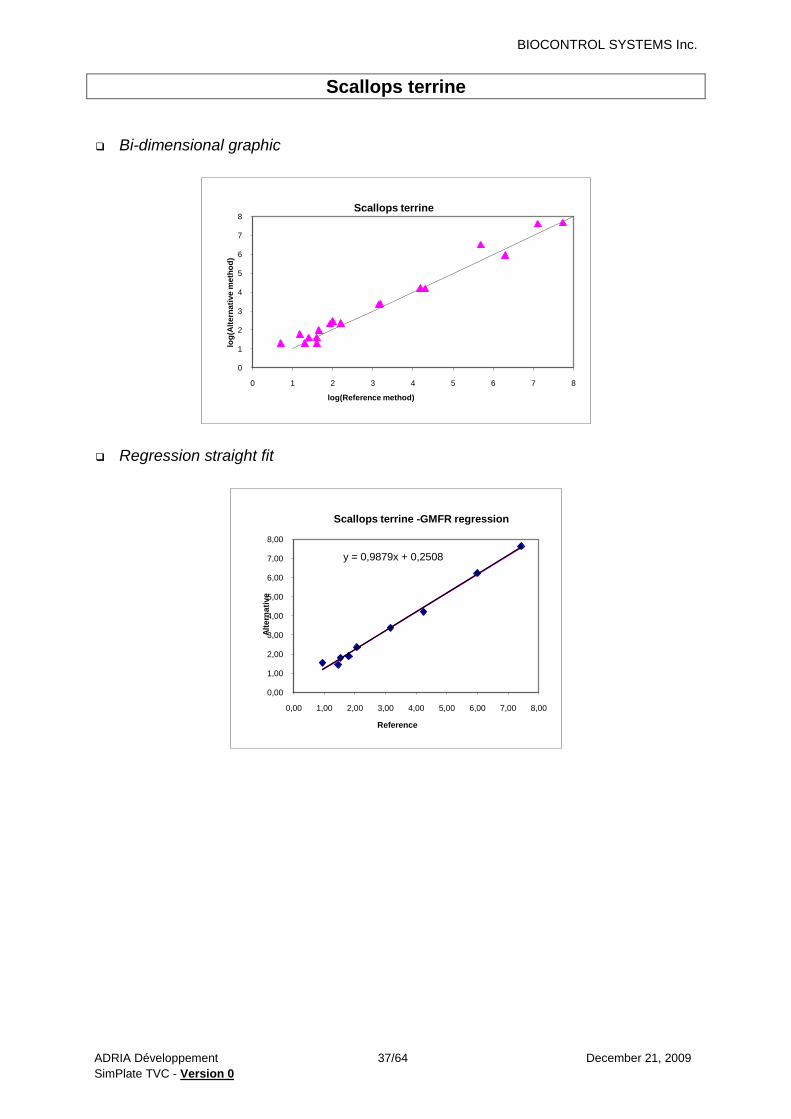
7,00
8,00
9,00
0,00 1,00 2,00 3,00 4,00 5,00 6,00 7,00 8,00 9,00
Alt
ern
ati
ve
Reference
Pasteurized milk-GMFR regression

BIOCONTROL SYSTEMS Inc.
ADRIA Développement 32/64 December 21, 2009
SimPlate TVC - Version 0
Statistical interpretation
Bias D 0,303
Reference method Alternative method di
1 2,28 2,270 2,64 2,585 0,315
2 3,40 3,350 3,61 3,640 0,290
3 4,41 4,355 4,54 4,555 0,200
4 5,34 5,320 5,49 5,530 0,210
5 6,28 6,330 6,64 6,715 0,385
6 7,32 7,360 7,67 7,770 0,410
1 2,26 0,014 2,53 0,078
2 3,30 0,071 3,67 0,042
3 4,30 0,078 4,57 0,021
4 5,30 0,028 5,57 0,057
5 6,38 0,071 6,79 0,106
6 7,40 0,057 7,87 0,141
0,094 0,100
1,06
OLS 2
GMFR
OLS 1
Artificially contaminated samples
Alternative
Alternative
rob.SDwx= rob.SDwy=
SDwy/SDwx =
x-axis y-axis
Reference
Myi
Rep.2 SDyi
Rep.1
Rep.2
Mxi
SDxi
SDwy/SDwx<0,5
0,5<SDwy/SDwx<2
SDwy/SDwx>2
Rep.1
Référence
Alternative
Reference

BIOCONTROL SYSTEMS Inc.
ADRIA Développement 33/64 December 21, 2009
SimPlate TVC - Version 0
Fresh orange juice Bi-dimensional graphic
0
1
2
3
4
5
6
7
8
0 1 2 3 4 5 6 7 8
log
(Alt
ern
ati
ve
me
tho
d)
log(Reference method)
Fresh orange juice
Regression straight fit
y = 0,9512x + 0,4958
0,00
1,00
2,00
3,00
4,00
5,00
6,00
7,00
8,00
0,00 1,00 2,00 3,00 4,00 5,00 6,00 7,00 8,00
Alt
ern
ati
ve
Reference
Fresh orange juice-OLS1 regression
BIOCONTROL SYSTEMS Inc.
ADRIA Développement 34/64 December 21, 2009
SimPlate TVC - Version 0
Statistical interpretation
Bias D 0,250
Reference method Alternative method di
1 2,32 2,300 2,81 2,810 0,510
2 3,26 3,270 3,48 3,525 0,255
3 4,30 4,290 4,43 4,440 0,150
4 5,32 5,320 5,54 5,565 0,245
5 6,32 6,275 6,61 6,560 0,285
6 6,76 6,745 6,95 6,900 0,155
1 2,28 0,028 2,81 0,000
2 3,28 0,014 3,57 0,064
3 4,28 0,014 4,45 0,014
4 5,32 0,000 5,59 0,035
5 6,23 0,064 6,51 0,071
6 6,73 0,021 6,85 0,071
0,026 0,073
2,80
OLS 2
GMFR
OLS 1
Artificially contaminated samples
Alternative
Alternative
rob.SDwx= rob.SDwy=
SDwy/SDwx =
x-axis y-axis
Reference
Myi
Rep.2 SDyi
Rep.1
Rep.2
Mxi
SDxi
SDwy/SDwx<0,5
0,5<SDwy/SDwx<2
SDwy/SDwx>2
Rep.1
Référence
Alternative
Reference
BIOCONTROL SYSTEMS Inc.
ADRIA Développement 35/64 December 21, 2009
SimPlate TVC - Version 0
Pastry Bi-dimensional graphic
0
1
2
3
4
5
6
7
8
0 1 2 3 4 5 6 7 8
log
(Alt
ern
ati
ve
me
tho
d)
log(Reference method)
Pastry
Regression straight fit
y = 1,0619x - 0,1628
0,00
1,00
2,00
3,00
4,00
5,00
6,00
7,00
8,00
0,00 1,00 2,00 3,00 4,00 5,00 6,00 7,00 8,00
Alt
ern
ati
ve
Reference
Pastry-GMFR regression
BIOCONTROL SYSTEMS Inc.
ADRIA Développement 36/64 December 21, 2009
SimPlate TVC - Version 0
Statistical interpretation
Bias D 0,030
Reference method Alternative method di
1 2,46 2,530 2,73 2,495 -0,035
2 2,40 2,600 2,75 2,850 0,250
3 3,00 2,950 3,00 2,875 -0,075
4 3,18 3,090 3,45 3,200 0,110
5 2,86 3,020 3,08 3,270 0,250
6 4,97 4,780 4,79 4,690 -0,090
7 3,18 3,305 3,23 2,990 -0,315
8 5,64 6,025 6,04 6,375 0,350
9 2,94 3,025 2,88 3,055 0,030
1 2,60 0,099 2,26 0,332
2 2,80 0,283 2,95 0,141
3 2,90 0,071 2,75 0,177
4 3,00 0,127 2,95 0,354
5 3,18 0,226 3,46 0,269
6 4,59 0,269 4,59 0,141
7 3,43 0,177 2,75 0,339
8 6,41 0,544 6,71 0,474
9 3,11 0,120 3,23 0,247
0,262 0,398
1,52
OLS 2
GMFR
OLS 1
SDwy/SDwx<0,5
0,5<SDwy/SDwx<2
SDwy/SDwx>2
Rep.1
Référence
Alternative
Myi
Rep.2 SDyi
Rep.1
Rep.2
Mxi
SDxi
rob.SDwx= rob.SDwy=
SDwy/SDwx =
x-axis y-axis
Reference
Reference Alternative
Alternative
Reference method X Alternative method Y Y^ Myi - Eyi
1 2,46 2,530 2,530 2,73 2,495 2,495 2,52 -0,029
2 2,40 2,600 2,600 2,75 2,850 2,850 2,60 0,252
3 3,00 2,950 2,950 3,00 2,875 2,875 2,97 -0,095
4 3,18 3,090 3,090 3,45 3,200 3,200 3,12 0,081
5 2,86 3,020 3,020 3,08 3,270 3,270 3,04 0,226
6 4,97 4,780 4,780 4,79 4,690 4,690 4,91 -0,223
7 3,18 3,305 3,305 3,23 2,990 2,990 3,35 -0,357
8 5,64 6,025 6,025 6,04 6,375 6,375 6,24 0,140
9 2,94 3,025 3,025 2,88 3,055 3,055 3,05 0,005
1 2,60 0,099 2,26 0,332 Sum = 0,000
2 2,80 0,283 2,95 0,141 RSD' = 0,216
3 2,90 0,071 2,75 0,177
4 3,00 0,127 2,95 0,354
5 3,18 0,226 3,46 0,269
6 4,59 0,269 4,59 0,141
7 3,43 0,177 2,75 0,339
8 6,41 0,544 6,71 0,474
9 3,11 0,120 3,23 0,247
Sx= 1,158 Sy= 1,230
SD(Mxi) = 1,158 SD(Myi) = 1,230
M(x) = 3,481 M(y) = 3,533
MED(x) = 3,025 MED(y) = 3,055
rob.SDwx= 0,262 rob.SDwy= 0,398
q (doses)= 9
p (replicates)= 2
v (df)= 7
SDwy/SDwx SDwx/Sdwy
rob. 1,52 0,658
Orthogonal linear regression:
r(Mx, My) = 0,9865 SD t:H p(t:H) H Tcritique
Res.SD(My) = 0,216 = RSD' b= 1,0619 0,066 0,938 0,380 1
RSD' * SQRT(p) = Res.SD(y) = 0,306 =sr(y) a= -0,1628 0,241 0,676 0,521 0
Lack-of-fit (non-linearity):
vd (df DEN)= 9
vn (df NUM)= 7
rob. F= 0,062
p(rob.F)= 100%
2,36462
SDyiRep.2
Rep.1
Rep.2
Mxi
SDxi
MyiRep.1
BIOCONTROL SYSTEMS Inc.
ADRIA Développement 37/64 December 21, 2009
SimPlate TVC - Version 0
Scallops terrine Bi-dimensional graphic
0
1
2
3
4
5
6
7
8
0 1 2 3 4 5 6 7 8
log
(Alt
ern
ati
ve
me
tho
d)
log(Reference method)
Scallops terrine
Regression straight fit
y = 0,9879x + 0,2508
0,00
1,00
2,00
3,00
4,00
5,00
6,00
7,00
8,00
0,00 1,00 2,00 3,00 4,00 5,00 6,00 7,00 8,00
Alt
ern
ati
ve
Reference
Scallops terrine -GMFR regression

BIOCONTROL SYSTEMS Inc.
ADRIA Développement 38/64 December 21, 2009
SimPlate TVC - Version 0
Statistical interpretation
Bias D 0,225
Reference method Alternative method di
1 0,70 0,940 1,30 1,540 0,600
2 1,30 1,450 1,30 1,450 0,000
3 1,65 1,525 2,00 1,800 0,275
4 1,93 2,065 2,34 2,360 0,295
5 1,60 1,800 1,30 1,890 0,090
6 7,74 7,425 7,68 7,650 0,225
7 3,18 3,165 3,40 3,370 0,205
8 4,30 4,240 4,20 4,215 -0,025
9 6,30 5,995 5,97 6,240 0,245
1 1,18 0,339 1,78 0,339
2 1,60 0,212 1,60 0,212
3 1,40 0,177 1,60 0,283
4 2,20 0,191 2,38 0,028
5 2,00 0,283 2,48 0,834
6 7,11 0,445 7,62 0,042
7 3,15 0,021 3,34 0,042
8 4,18 0,085 4,23 0,021
9 5,69 0,431 6,51 0,382
0,315 0,315
1,00
OLS 2
GMFR
OLS 1
SDwy/SDwx<0,5
0,5<SDwy/SDwx<2
SDwy/SDwx>2
Rep.1
Référence
Alternative
Myi
Rep.2 SDyi
Rep.1
Rep.2
Mxi
SDxi
rob.SDwx= rob.SDwy=
SDwy/SDwx =
x-axis y-axis
Reference
Reference Alternative
Alternative
Reference method X Alternative method Y Y^ Myi - Eyi
1 0,70 0,940 0,940 1,30 1,540 1,540 1,18 0,361
2 1,30 1,450 1,450 1,30 1,450 1,450 1,68 -0,233
3 1,65 1,525 1,525 2,00 1,800 1,800 1,76 0,043
4 1,93 2,065 2,065 2,34 2,360 2,360 2,29 0,069
5 1,60 1,800 1,800 1,30 1,890 1,890 2,03 -0,139
6 7,74 7,425 7,425 7,68 7,650 7,650 7,59 0,064
7 3,18 3,165 3,165 3,40 3,370 3,370 3,38 -0,007
8 4,30 4,240 4,240 4,20 4,215 4,215 4,44 -0,224
9 6,30 5,995 5,995 5,97 6,240 6,240 6,17 0,067
1 1,18 0,339 1,78 0,339 Sum = 0,000
2 1,60 0,212 1,60 0,212 RSD' = 0,196
3 1,40 0,177 1,60 0,283
4 2,20 0,191 2,38 0,028
5 2,00 0,283 2,48 0,834
6 7,11 0,445 7,62 0,042
7 3,15 0,021 3,34 0,042
8 4,18 0,085 4,23 0,021
9 5,69 0,431 6,51 0,382
Sx= 2,263 Sy= 2,235
SD(Mxi) = 2,263 SD(Myi) = 2,235
M(x) = 3,178 M(y) = 3,391
MED(x) = 2,065 MED(y) = 2,360
rob.SDwx= 0,315 rob.SDwy= 0,315
q (doses)= 9
p (replicates)= 2
v (df)= 7
SDwy/SDwx SDwx/Sdwy
rob. 1,00 1,000
Orthogonal linear regression:
r(Mx, My) = 0,9966 SD t:H p(t:H) H Tcritique
Res.SD(My) = 0,196 = RSD' b= 0,9879 0,031 0,396 0,704 1
RSD' * SQRT(p) = Res.SD(y) = 0,277 =sr(y) a= 0,2508 0,117 2,138 0,070 0
Lack-of-fit (non-linearity):
vd (df DEN)= 9
vn (df NUM)= 7
rob. F= 0,493
p(rob.F)= 82%
2,306
SDyiRep.2
Rep.1
Rep.2
Mxi
SDxi
MyiRep.1
BIOCONTROL SYSTEMS Inc.
ADRIA Développement 39/64 December 21, 2009
SimPlate TVC - Version 0
Annex 4.2. - Precision profiles

BIOCONTROL SYSTEMS Inc.
ADRIA Développement 40/64 December 21, 2009
SimPlate TVC - Version 0
0,0%
5,0%
10,0%
15,0%
20,0%
25,0%
30,0%
35,0%
40,0%
45,0%
50,0%
0 1 2 3 4 5 6 7
CV
(<x
(y)>
)
Reference method log cfu/g (x)
Precision profiles obtained for the different food matrices
Ground beef Pasteurized milk Fresh orange juice Scallops terrine Pastry

BIOCONTROL SYSTEMS Inc.
ADRIA Développement 41/64 December 21, 2009
SimPlate TVC - Version 0
Annex 5 - Relative accuracy: Statistical interpretations
Relative accuracy graphs, regression lines
and calculations

BIOCONTROL SYSTEMS Inc.
ADRIA Développement 42/64 December 21, 2009
SimPlate TVC - Version 0
Meat products Bi-dimensional graphic
0,00
1,00
2,00
3,00
4,00
5,00
6,00
7,00
8,00
9,00
10,00
0,00 1,00 2,00 3,00 4,00 5,00 6,00 7,00 8,00 9,00 10,00
log
(Alt
ern
ati
ve
me
tho
d)
log(Reference method)
Meat p roducts
Regression straight fit
y = 0,8718x + 0,5458
0,00
1,00
2,00
3,00
4,00
5,00
6,00
7,00
8,00
9,00
10,00
0,00 1,00 2,00 3,00 4,00 5,00 6,00 7,00 8,00 9,00 10,00
Alt
ern
ati
ve
Reference
Meat products-GMFR regression

BIOCONTROL SYSTEMS Inc.
ADRIA Développement 43/64 December 21, 2009
SimPlate TVC - Version 0
Statistical interpretation
Bias D 0,058
Reference method Alternative method di
1 3,97 4,040 4,23 4,215 0,175
2 4,45 4,430 4,59 4,535 0,105
3 4,81 4,775 5,00 4,890 0,115
4 7,48 7,480 7,67 7,630 0,150
5 5,04 5,040 5,26 5,220 0,180
6 4,08 4,080 4,08 4,080 0,000
7 5,61 5,635 5,17 5,461 -0,175
8 3,45 3,415 3,20 3,175 -0,240
9 3,34 3,370 3,41 3,450 0,080
10 5,20 5,155 5,61 5,505 0,350
11 3,79 3,820 3,75 3,875 0,055
12 5,08 5,080 5,08 5,140 0,060
13 5,23 5,190 4,43 4,385 -0,805 1180 Steak
14 5,48 5,400 5,28 5,205 -0,195
15 4,98 5,065 5,00 4,960 -0,105
16 8,58 8,570 7,45 7,225 -1,345 1246 Dry sausage
1 4,11 0,099 4,20 0,021
2 4,41 0,028 4,48 0,078
3 4,74 0,049 4,78 0,156
4 7,48 0,000 7,59 0,057
5 5,04 0,000 5,18 0,057
6 4,08 0,000 4,08 0,000
7 5,66 0,035 5,75 0,409
8 3,38 0,049 3,15 0,035
9 3,40 0,042 3,49 0,057
10 5,11 0,064 5,40 0,148
11 3,85 0,042 4,00 0,177
12 5,08 0,000 5,20 0,085
13 5,15 0,057 4,34 0,064
14 5,32 0,113 5,13 0,106
15 5,15 0,120 4,92 0,057
16 8,56 0,014 7,00 0,318
0,063 0,105
1,67
OLS 2
GMFR
OLS 1
Mxi
SDxi
SDwy/SDwx<0,5
0,5<SDwy/SDwx<2
SDwy/SDwx>2
Rep.1
Référence
Alternative
rob.SDwx= rob.SDwy=
SDwy/SDwx =
x-axis y-axis
Myi
Rep.2 SDyi
Rep.1
Rep.2
Reference
Reference Alternative
Alternative

BIOCONTROL SYSTEMS Inc.
ADRIA Développement 44/64 December 21, 2009
SimPlate TVC - Version 0
Reference method X Alternative method Y Y^ Myi - Eyi
1 3,97 4,040 4,040 4,23 4,215 4,215 4,07 0,147
2 4,45 4,430 4,430 4,59 4,535 4,535 4,41 0,127
3 4,81 4,775 4,775 5,00 4,890 4,890 4,71 0,181
4 7,48 7,480 7,480 7,67 7,630 7,630 7,07 0,563
5 5,04 5,040 5,040 5,26 5,220 5,220 4,94 0,280
6 4,08 4,080 4,080 4,08 4,080 4,080 4,10 -0,023
7 5,61 5,635 5,635 5,17 5,461 5,461 5,46 0,002
8 3,45 3,415 3,415 3,20 3,175 3,175 3,52 -0,348
9 3,34 3,370 3,370 3,41 3,450 3,450 3,48 -0,034
10 5,20 5,155 5,155 5,61 5,505 5,505 5,04 0,465
11 3,79 3,820 3,820 3,75 3,875 3,875 3,88 -0,001
12 5,08 5,080 5,080 5,08 5,140 5,140 4,97 0,166
13 5,23 5,190 5,190 4,43 4,385 4,385 5,07 -0,685
14 5,48 5,400 5,400 5,28 5,205 5,205 5,25 -0,048
15 4,98 5,065 5,065 5,00 4,960 4,960 4,96 -0,001
16 8,58 8,570 8,570 7,45 7,225 7,225 8,02 -0,792
1 4,11 0,099 4,20 0,021 Sum = 0,000
2 4,41 0,028 4,48 0,078 RSD' = 0,372
3 4,74 0,049 4,78 0,156
4 7,48 0,000 7,59 0,057
5 5,04 0,000 5,18 0,057
6 4,08 0,000 4,08 0,000
7 5,66 0,035 5,75 0,409
8 3,38 0,049 3,15 0,035
9 3,40 0,042 3,49 0,057
10 5,11 0,064 5,40 0,148
11 3,85 0,042 4,00 0,177
12 5,08 0,000 5,20 0,085
13 5,15 0,057 4,34 0,064
14 5,32 0,113 5,13 0,106
15 5,15 0,120 4,92 0,057
16 8,56 0,014 7,00 0,318
Sx= 1,372 Sy= 1,196
SD(Mxi) = 1,372 SD(Myi) = 1,196
M(x) = 5,034 M(y) = 4,934
MED(x) = 5,053 MED(y) = 4,925
rob.SDwx= 0,063 rob.SDwy= 0,105
q (doses)= 16
p (replicates)= 2
v (df)= 14
SDwy/SDwx SDwx/Sdwy
rob. 1,67 0,600
Orthogonal linear regression:
r(Mx, My) = 0,9549 SD t:H p(t:H) H Tcritique
Res.SD(My) = 0,372 = RSD' b= 0,8718 0,070 1,833 0,088 1
RSD' * SQRT(p) = Res.SD(y) = 0,525 =sr(y) a= 0,5458 0,364 1,499 0,156 0
Lack-of-fit (non-linearity):
vd (df DEN)= 16
vn (df NUM)= 14
rob. F= 52,682
p(rob.F)= 0%
2,14479
SDyiRep.2
Rep.1
Rep.2
Mxi
SDxi
MyiRep.1
BIOCONTROL SYSTEMS Inc.
ADRIA Développement 45/64 December 21, 2009
SimPlate TVC - Version 0
Dairy products Bi-dimensional graphic
0,00
1,00
2,00
3,00
4,00
5,00
6,00
7,00
8,00
9,00
10,00
0,00 1,00 2,00 3,00 4,00 5,00 6,00 7,00 8,00 9,00 10,00
log
(Alt
ern
ati
ve
me
tho
d)
log(Reference method)
Milk products Naturally contaminated samples
Artificially contaminated samples
Regression straight fit
y = 1,1015x - 0,2471
0,00
1,00
2,00
3,00
4,00
5,00
6,00
7,00
8,00
9,00
10,00
0,00 1,00 2,00 3,00 4,00 5,00 6,00 7,00 8,00 9,00 10,00
Alt
ern
ati
ve
Reference
Dairy products-GMFR regression
BIOCONTROL SYSTEMS Inc.
ADRIA Développement 46/64 December 21, 2009
SimPlate TVC - Version 0
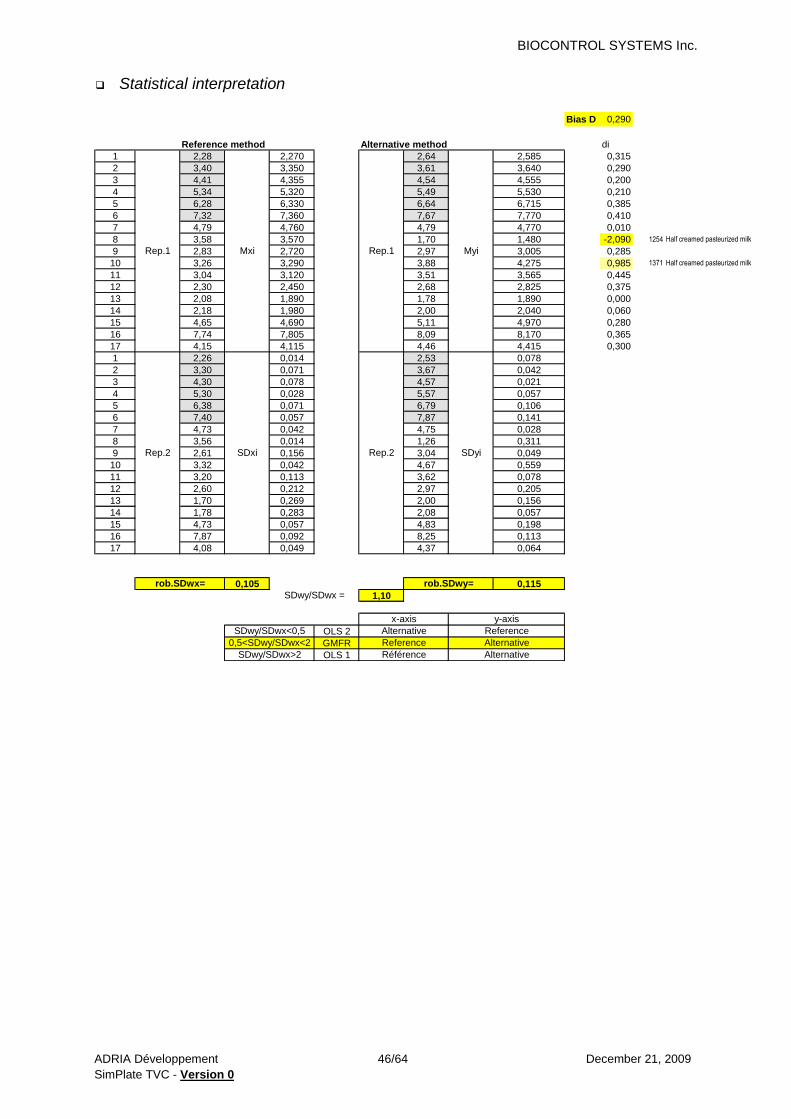
Statistical interpretation
Bias D 0,290
Reference method Alternative method di
1 2,28 2,270 2,64 2,585 0,315
2 3,40 3,350 3,61 3,640 0,290
3 4,41 4,355 4,54 4,555 0,200
4 5,34 5,320 5,49 5,530 0,210
5 6,28 6,330 6,64 6,715 0,385
6 7,32 7,360 7,67 7,770 0,410
7 4,79 4,760 4,79 4,770 0,010
8 3,58 3,570 1,70 1,480 -2,090 1254 Half creamed pasteurized milk
9 2,83 2,720 2,97 3,005 0,285
10 3,26 3,290 3,88 4,275 0,985 1371 Half creamed pasteurized milk
11 3,04 3,120 3,51 3,565 0,445
12 2,30 2,450 2,68 2,825 0,375
13 2,08 1,890 1,78 1,890 0,000
14 2,18 1,980 2,00 2,040 0,060
15 4,65 4,690 5,11 4,970 0,280
16 7,74 7,805 8,09 8,170 0,365
17 4,15 4,115 4,46 4,415 0,300
1 2,26 0,014 2,53 0,078
2 3,30 0,071 3,67 0,042
3 4,30 0,078 4,57 0,021
4 5,30 0,028 5,57 0,057
5 6,38 0,071 6,79 0,106
6 7,40 0,057 7,87 0,141
7 4,73 0,042 4,75 0,028
8 3,56 0,014 1,26 0,311
9 2,61 0,156 3,04 0,049
10 3,32 0,042 4,67 0,559
11 3,20 0,113 3,62 0,078
12 2,60 0,212 2,97 0,205
13 1,70 0,269 2,00 0,156
14 1,78 0,283 2,08 0,057
15 4,73 0,057 4,83 0,198
16 7,87 0,092 8,25 0,113
17 4,08 0,049 4,37 0,064
0,105 0,115
1,10
OLS 2
GMFR
OLS 1
Mxi
SDxi
SDwy/SDwx<0,5
0,5<SDwy/SDwx<2
SDwy/SDwx>2
Rep.1
Référence
Alternative
rob.SDwx= rob.SDwy=
SDwy/SDwx =
x-axis y-axis
Myi
Rep.2 SDyi
Rep.1
Rep.2
Reference
Reference Alternative
Alternative

BIOCONTROL SYSTEMS Inc.
ADRIA Développement 47/64 December 21, 2009
SimPlate TVC - Version 0
Reference method X Alternative method Y Y^ Myi - Eyi
1 2,28 2,270 2,270 2,64 2,585 2,585 2,25 0,332
2 3,40 3,350 3,350 3,61 3,640 3,640 3,44 0,197
3 4,41 4,355 4,355 4,54 4,555 4,555 4,55 0,005
4 5,34 5,320 5,320 5,49 5,530 5,530 5,61 -0,083
5 6,28 6,330 6,330 6,64 6,715 6,715 6,73 -0,010
6 7,32 7,360 7,360 7,67 7,770 7,770 7,86 -0,090
7 4,79 4,760 4,760 4,79 4,770 4,770 5,00 -0,226
8 3,58 3,570 3,570 1,70 1,480 1,480 3,69 -2,205
9 2,83 2,720 2,720 2,97 3,005 3,005 2,75 0,256
10 3,26 3,290 3,290 3,88 4,275 4,275 3,38 0,898
11 3,04 3,120 3,120 3,51 3,565 3,565 3,19 0,375
12 2,30 2,450 2,450 2,68 2,825 2,825 2,45 0,373
13 2,08 1,890 1,890 1,78 1,890 1,890 1,83 0,055
14 2,18 3,130 3,130 2,00 3,185 3,185 3,20 -0,016
15 4,65 4,650 4,650 5,11 5,110 5,110 4,87 0,235
16 7,74 7,740 7,740 8,09 8,090 8,090 8,28 -0,188
17 4,15 4,150 4,150 4,46 4,415 4,415 4,32 0,091
1 2,26 0,014 2,53 0,078 Sum = 0,000
2 3,30 0,071 3,67 0,042 RSD' = 0,650
3 4,30 0,078 4,57 0,021
4 5,30 0,028 5,57 0,057
5 6,38 0,071 6,79 0,106
6 7,40 0,057 7,87 0,141
7 4,73 0,042 4,75 0,028
8 3,56 0,014 1,26 0,311
9 2,61 0,156 3,04 0,049
10 3,32 0,042 4,67 0,559
11 3,20 0,113 3,62 0,078
12 2,60 0,212 2,97 0,205
13 1,70 0,269 2,00 0,156
14 1,78 0,283 2,08 0,057
15 4,73 0,057 4,83 0,198
16 7,87 0,092 8,25 0,113
17 4,08 0,049 4,37 0,064
Sx= 1,721 Sy= 1,895
SD(Mxi) = 1,721 SD(Myi) = 1,895
M(x) = 4,144 M(y) = 4,318
MED(x) = 3,570 MED(y) = 4,275
rob.SDwx= 0,105 rob.SDwy= 0,115
q (doses)= 17
p (replicates)= 2
v (df)= 15
SDwy/SDwx SDwx/Sdwy
rob. 1,10 0,909
Orthogonal linear regression:
r(Mx, My) = 0,9449 SD t:H p(t:H) H Tcritique
Res.SD(My) = 0,650 = RSD' b= 1,1015 0,094 1,075 0,299 1
RSD' * SQRT(p) = Res.SD(y) = 0,919 =sr(y) a= -0,2471 0,422 0,586 0,567 0
Lack-of-fit (non-linearity):
vd (df DEN)= 17
vn (df NUM)= 15
rob. F= 134,327
p(rob.F)= 0%
2,13145
SDyiRep.2
Rep.1
Rep.2
Mxi
SDxi
MyiRep.1

BIOCONTROL SYSTEMS Inc.
ADRIA Développement 48/64 December 21, 2009
SimPlate TVC - Version 0
Fruits and vegetables Bi-dimensional graphic
0,00
1,00
2,00
3,00
4,00
5,00
6,00
7,00
8,00
9,00
10,00
0,00 1,00 2,00 3,00 4,00 5,00 6,00 7,00 8,00 9,00 10,00
log
(Alt
ern
ati
ve
me
tho
d)
log(Reference method)
Fruit and vegetablesArtificially contaminated samples
Naturally contaminated samples
Regression straight fit
y = 1,0806x - 0,5274
0,00
1,00
2,00
3,00
4,00
5,00
6,00
7,00
8,00
9,00
10,00
0,00 1,00 2,00 3,00 4,00 5,00 6,00 7,00 8,00 9,00 10,00
Alt
ern
ati
ve
Reference
Fruits and vegetables-OLS1 regression

BIOCONTROL SYSTEMS Inc.
ADRIA Développement 49/64 December 21, 2009
SimPlate TVC - Version 0
Statistical interpretation Bias D 0,153
Reference method Alternative method di
1 2,32 2,300 2,81 2,810 0,510
2 3,26 3,270 3,48 3,525 0,255
3 4,30 4,290 4,43 4,440 0,150
4 5,32 5,320 5,54 5,565 0,245
5 6,32 6,275 6,61 6,560 0,285
6 6,76 6,745 6,95 6,900 0,155
7 2,40 2,240 2,56 2,320 0,080
8 3,60 3,600 1,30 1,750 -1,850 Frozen artichoke hearts
9 8,28 8,195 8,45 8,465 0,270
10 5,89 5,985 6,15 6,245 0,260
11 4,69 4,690 4,00 3,950 -0,740 Frozen vegetables girdle-cake
12 4,20 4,190 3,75 3,675 -0,515
13 2,89 2,875 2,68 2,565 -0,310
14 4,60 4,515 3,62 3,535 -0,980 Guacamole
1 2,28 0,028 2,81 0,000
2 3,28 0,014 3,57 0,064
3 4,28 0,014 4,45 0,014
4 5,32 0,000 5,59 0,035
5 6,23 0,064 6,51 0,071
6 6,73 0,021 6,85 0,071
7 2,08 0,226 2,08 0,339
8 3,60 0,000 2,20 0,636
9 8,11 0,120 8,48 0,021
10 6,08 0,134 6,34 0,134
11 4,69 0,000 3,90 0,071
12 4,18 0,014 3,60 0,106
13 2,86 0,021 2,45 0,163
14 4,43 0,120 3,45 0,120
0,031 0,105
3,33
OLS 2
GMFR
OLS 1
Artificially contaminated samples
Alternative
Alternative
rob.SDwx= rob.SDwy=
SDwy/SDwx =
x-axis y-axis
Reference
Myi
Rep.2 SDyi
Rep.1
Rep.2
Mxi
SDxi
SDwy/SDwx<0,5
0,5<SDwy/SDwx<2
SDwy/SDwx>2
Rep.1
Référence
Alternative
Reference

BIOCONTROL SYSTEMS Inc.
ADRIA Développement 50/64 December 21, 2009
SimPlate TVC - Version 0
Reference method X Alternative method Y Y^
1 2,32 2,300 2,300 2,81 2,810 1,958
2 3,26 3,270 3,270 3,48 3,525 3,006
3 4,30 4,290 4,290 4,43 4,440 4,108
4 5,32 5,320 5,320 5,54 5,565 5,221
5 6,32 6,275 6,275 6,61 6,560 6,253
6 6,76 6,745 6,745 6,95 6,900 6,761
7 2,40 2,240 2,240 2,56 2,320 1,893
8 3,60 3,600 3,600 1,30 1,750 3,363
9 8,28 8,195 8,195 8,45 8,465 8,328
10 5,89 5,985 5,985 6,15 6,245 5,940
11 4,69 4,690 4,690 4,00 3,950 4,541
12 4,20 4,190 4,190 3,75 3,675 4,000
13 2,89 2,875 2,875 2,68 2,565 2,579
14 4,60 4,515 4,515 3,62 3,535 4,352
1 2,28 0,028 2,300 2,81 0,000 1,958
2 3,28 0,014 3,270 3,57 0,064 3,006
3 4,28 0,014 4,290 4,45 0,014 4,108
4 5,32 0,000 5,320 5,59 0,035 5,221
5 6,23 0,064 6,275 6,51 0,071 6,253
6 6,73 0,021 6,745 6,85 0,071 6,761
7 2,08 0,226 2,240 2,08 0,339 1,893
8 3,60 0,000 3,600 2,20 0,636 3,363
9 8,11 0,120 8,195 8,48 0,021 8,328
10 6,08 0,134 5,985 6,34 0,134 5,940
11 4,69 0,000 4,690 3,90 0,071 4,541
12 4,18 0,014 4,190 3,60 0,106 4,000
13 2,86 0,021 2,875 2,45 0,163 2,579
14 4,43 0,120 4,515 3,45 0,120 4,352
Sx= 1,714 Sy= 1,962
SD(Mxi) = 1,746 SD(Myi) = 1,993
M(x) = 4,606 M(y) = 4,450
MED(x) = 4,403 MED(y) = 3,813
rob.SDwx= 0,031 rob.SDwy= 0,105
q (doses)= 14
p (réplicates)= 2
v (df)= 12
SDwy/SDwx SDwx/Sdwy
rob. 3,33 0,300
OLS1 regression
r(Mx, My) = 0,9440 SD t:H p(t:H) H Critical T
Res.SD(My) = 0,660 = RSD b= 1,0806 0,105 0,769 0,457 1
RSD * SQRT(p) = Res.SD(y) = 0,933 =sr(y) a= -0,5274 0,514 1,026 0,325 0
Lack-of-fit (non-linearity):
vd (df DEN)= 14
vn (df NUM)= 12
rob. F= 84,644
p(rob.F)= 0%
2,17881
SDyi
Rep.1
Rep.2
MyiRep.1
Rep.2
Mxi
SDxi

BIOCONTROL SYSTEMS Inc.
ADRIA Développement 51/64 December 21, 2009
SimPlate TVC - Version 0
Bakery and others Bi-dimensional graphic
0
1
2
3
4
5
6
7
8
0 1 2 3 4 5 6 7 8
log
(Alt
ern
ati
ve
me
tho
d)
log(Reference method)
Bakery and others
Regression straight fit
y = 1,0874x - 0,2593
0,00
1,00
2,00
3,00
4,00
5,00
6,00
7,00
8,00
9,00
0,00 1,00 2,00 3,00 4,00 5,00 6,00 7,00 8,00 9,00
Alt
ern
ati
ve
Reference
Bakery and others-GMFR regression

BIOCONTROL SYSTEMS Inc.
ADRIA Développement 52/64 December 21, 2009
SimPlate TVC - Version 0
Statistical interpretation Bias D 0,030
Reference method Alternative method di
1 2,46 2,530 2,73 2,495 -0,035
2 2,40 2,600 2,75 2,850 0,250
3 3,00 2,950 3,00 2,875 -0,075
4 3,18 3,090 3,45 3,200 0,110
5 2,86 3,020 3,08 3,270 0,250
6 4,97 4,780 4,79 4,690 -0,090
7 3,18 3,305 3,23 2,990 -0,315
8 5,64 6,025 6,04 6,375 0,350
9 2,94 3,025 2,88 3,055 0,030
10 3,11 3,145 2,75 2,840 -0,305
11 2,04 1,870 1,90 1,900 0,030
12 2,62 2,500 2,58 2,780 0,280
13 3,11 3,025 3,04 2,980 -0,045
14 3,97 3,870 3,87 3,640 -0,230
15 7,26 7,290 7,79 7,830 0,540
1 2,60 0,099 2,26 0,332
2 2,80 0,283 2,95 0,141
3 2,90 0,071 2,75 0,177
4 3,00 0,127 2,95 0,354
5 3,18 0,226 3,46 0,269
6 4,59 0,269 4,59 0,141
7 3,43 0,177 2,75 0,339
8 6,41 0,544 6,71 0,474
9 3,11 0,120 3,23 0,247
10 3,18 0,049 2,93 0,127
11 1,70 0,240 1,90 0,000
12 2,38 0,170 2,98 0,283
13 2,94 0,120 2,92 0,085
14 3,77 0,141 3,41 0,325
15 7,32 0,042 7,87 0,057
0,210 0,367
1,75
OLS 2
GMFR
OLS 1
Mxi
SDxi
SDwy/SDwx<0,5
0,5<SDwy/SDwx<2
SDwy/SDwx>2
Rep.1
Référence
Alternative
rob.SDwx= rob.SDwy=
SDwy/SDwx =
x-axis y-axis
Myi
Rep.2 SDyi
Rep.1
Rep.2
Reference
Reference Alternative
Alternative

BIOCONTROL SYSTEMS Inc.
ADRIA Développement 53/64 December 21, 2009
SimPlate TVC - Version 0
Reference method X Alternative method Y Y^ Myi - Eyi
1 2,46 2,530 2,530 2,73 2,495 2,495 2,49 0,003
2 2,40 2,600 2,600 2,75 2,850 2,850 2,57 0,282
3 3,00 2,950 2,950 3,00 2,875 2,875 2,95 -0,074
4 3,18 3,090 3,090 3,45 3,200 3,200 3,10 0,099
5 2,86 3,020 3,020 3,08 3,270 3,270 3,02 0,245
6 4,97 4,780 4,780 4,79 4,690 4,690 4,94 -0,248
7 3,18 3,305 3,305 3,23 2,990 2,990 3,33 -0,345
8 5,64 6,025 6,025 6,04 6,375 6,375 6,29 0,083
9 2,94 3,025 3,025 2,88 3,055 3,055 3,03 0,025
10 3,11 3,145 3,145 2,75 2,840 2,840 3,16 -0,321
11 2,04 1,870 1,870 1,90 1,900 1,900 1,77 0,126
12 2,62 2,500 2,500 2,58 2,780 2,780 2,46 0,321
13 3,11 3,025 3,025 3,04 2,980 2,980 3,03 -0,050
14 3,97 3,870 3,870 3,87 3,640 3,640 3,95 -0,309
15 7,26 7,290 7,290 7,79 7,830 7,830 7,67 0,162
1 2,60 0,099 2,26 0,332 Sum = 0,000
2 2,80 0,283 2,95 0,141 RSD' = 0,230
3 2,90 0,071 2,75 0,177
4 3,00 0,127 2,95 0,354
5 3,18 0,226 3,46 0,269
6 4,59 0,269 4,59 0,141
7 3,43 0,177 2,75 0,339
8 6,41 0,544 6,71 0,474
9 3,11 0,120 3,23 0,247
10 3,18 0,049 2,93 0,127
11 1,70 0,240 1,90 0,000
12 2,38 0,170 2,98 0,283
13 2,94 0,120 2,92 0,085
14 3,77 0,141 3,41 0,325
15 7,32 0,042 7,87 0,057
Sx= 1,445 Sy= 1,571
SD(Mxi) = 1,445 SD(Myi) = 1,571
M(x) = 3,535 M(y) = 3,585
MED(x) = 3,025 MED(y) = 2,990
rob.SDwx= 0,210 rob.SDwy= 0,367
q (doses)= 15
p (replicates)= 2
v (df)= 13
SDwy/SDwx SDwx/Sdwy
rob. 1,75 0,571
Orthogonal linear regression:
r(Mx, My) = 0,9900 SD t:H p(t:H) H Tcritique
Res.SD(My) = 0,230 = RSD' b= 1,0874 0,043 2,052 0,061 1
RSD' * SQRT(p) = Res.SD(y) = 0,326 =sr(y) a= -0,2593 0,162 1,602 0,133 0
Lack-of-fit (non-linearity):
vd (df DEN)= 15
vn (df NUM)= 13
rob. F= 0,541
p(rob.F)= 86%
2,16037
SDyiRep.2
Rep.1
Rep.2
Mxi
SDxi
MyiRep.1

BIOCONTROL SYSTEMS Inc.
ADRIA Développement 54/64 December 21, 2009
SimPlate TVC - Version 0
Seafood products Bi-dimensional graphic
0
1
2
3
4
5
6
7
8
9
10
0 1 2 3 4 5 6 7 8 9 10
log
(Alt
ern
ati
ve
me
tho
d)
log(Reference method)
Seafood products
Regression straight fit
y = 1,0112x - 0,2384
0,00
1,00
2,00
3,00
4,00
5,00
6,00
7,00
8,00
9,00
10,00
0,00 1,00 2,00 3,00 4,00 5,00 6,00 7,00 8,00 9,00 10,00
Re
fere
nc
e
Alternative
Seafood products-OLS2 regression

BIOCONTROL SYSTEMS Inc.
ADRIA Développement 55/64 December 21, 2009
SimPlate TVC - Version 0
Statistical interpretation
Bias D 0,215
Reference method Alternative method di
1 0,70 0,940 1,30 1,540 0,600
2 1,30 1,450 1,30 1,450 0,000
3 1,65 1,525 2,00 1,800 0,275
4 1,93 2,065 2,34 2,360 0,295
5 1,60 1,800 1,30 1,890 0,090
6 7,74 7,425 7,68 7,650 0,225
7 3,18 3,165 3,40 3,370 0,205
8 4,30 4,240 4,20 4,215 -0,025
9 6,30 5,995 5,97 6,240 0,245
10 7,49 7,580 7,43 7,525 -0,055
11 6,08 6,265 6,66 6,680 0,415
12 1,54 1,675 2,00 1,890 0,215
13 4,41 4,555 4,68 4,775 0,220
14 5,28 5,320 5,48 5,520 0,200
15 5,63 5,620 5,70 5,745 0,125
16 4,76 4,825 4,75 4,790 -0,035
17 7,28 7,280 7,46 7,500 0,220
1 1,18 0,339 1,78 0,339
2 1,60 0,212 1,60 0,212
3 1,40 0,177 1,60 0,283
4 2,20 0,191 2,38 0,028
5 2,00 0,283 2,48 0,834
6 7,11 0,445 7,62 0,042
7 3,15 0,021 3,34 0,042
8 4,18 0,085 4,23 0,021
9 5,69 0,431 6,51 0,382
10 7,67 0,127 7,62 0,134
11 6,45 0,262 6,70 0,028
12 1,81 0,191 1,78 0,156
13 4,70 0,205 4,87 0,134
14 5,36 0,057 5,56 0,057
15 5,61 0,014 5,79 0,064
16 4,89 0,092 4,83 0,057
17 7,28 0,000 7,54 0,057
0,283 0,094
0,33
OLS 2
GMFR
OLS 1
Mxi
SDxi
SDwy/SDwx<0,5
0,5<SDwy/SDwx<2
SDwy/SDwx>2
Rep.1
Référence
Alternative
rob.SDwx= rob.SDwy=
SDwy/SDwx =
x-axis y-axis
Myi
Rep.2 SDyi
Rep.1
Rep.2
Reference
Reference Alternative
Alternative

BIOCONTROL SYSTEMS Inc.
ADRIA Développement 56/64 December 21, 2009
SimPlate TVC - Version 0
Reference method X Alternative method Y Y^
1 1,30 1,540 1,540 0,70 0,940 1,319
2 1,30 1,450 1,450 1,30 1,450 1,228
3 2,00 1,800 1,800 1,65 1,525 1,582
4 2,34 2,360 2,360 1,93 2,065 2,148
5 1,30 1,890 1,890 1,60 1,800 1,673
6 7,68 7,650 7,650 7,74 7,425 7,497
7 3,40 3,370 3,370 3,18 3,165 3,169
8 4,20 4,215 4,215 4,30 4,240 4,024
9 5,97 6,240 6,240 6,30 5,995 6,071
10 7,43 7,525 7,525 7,49 7,580 7,371
11 6,66 6,680 6,680 6,08 6,265 6,516
12 2,00 1,890 1,890 1,54 1,675 1,673
13 4,68 4,775 4,775 4,41 4,555 4,590
14 5,48 5,520 5,520 5,28 5,320 5,343
15 5,70 5,745 5,745 5,63 5,620 5,571
16 4,75 4,790 4,790 4,76 4,825 4,605
17 7,46 7,500 7,500 7,28 7,280 7,345
1 1,78 0,339 1,540 1,18 0,339 1,319
2 1,60 0,212 1,450 1,60 0,212 1,228
3 1,60 0,283 1,800 1,40 0,177 1,582
4 2,38 0,028 2,360 2,20 0,191 2,148
5 2,48 0,834 1,890 2,00 0,283 1,673
6 7,62 0,042 7,650 7,11 0,445 7,497
7 3,34 0,042 3,370 3,15 0,021 3,169
8 4,23 0,021 4,215 4,18 0,085 4,024
9 6,51 0,382 6,240 5,69 0,431 6,071
10 7,62 0,134 7,525 7,67 0,127 7,371
11 6,70 0,028 6,680 6,45 0,262 6,516
12 1,78 0,156 1,890 1,81 0,191 1,673
13 4,87 0,134 4,775 4,70 0,205 4,590
14 5,56 0,057 5,520 5,36 0,057 5,343
15 5,79 0,064 5,745 5,61 0,014 5,571
16 4,83 0,057 4,790 4,89 0,092 4,605
17 7,54 0,057 7,500 7,28 0,000 7,345
Sx= 2,248 Sy= 2,285
SD(Mxi) = 2,283 SD(Myi) = 2,314
M(x) = 4,408 M(y) = 4,219
MED(x) = 4,775 MED(y) = 4,555
rob.SDwx= 0,094 rob.SDwy= 0,283
q (doses)= 17
p (replicates)= 2
v (df)= 15
SDwy/SDwx SDwx/Sdwy
rob. 3,00 0,333
OLS2 regression
r(Mx, My) = 0,9949 SD t:H p(t:H) H Critical T
Res.SD(My) = 0,234 = RSD b= 1,0112 0,026 0,436 0,669 1
RSD * SQRT(p) = Res.SD(y) = 0,331 =sr(y) a= -0,2384 0,127 1,883 0,079 0
Lack-of-fit (non-linearity):
vd (df DEN)= 17
vn (df NUM)= 15
rob. F= 0,328
p(rob.F)= 98%
2,13145
SDyi
Rep.1
Rep.2
MyiRep.1
Rep.2
Mxi
SDxi
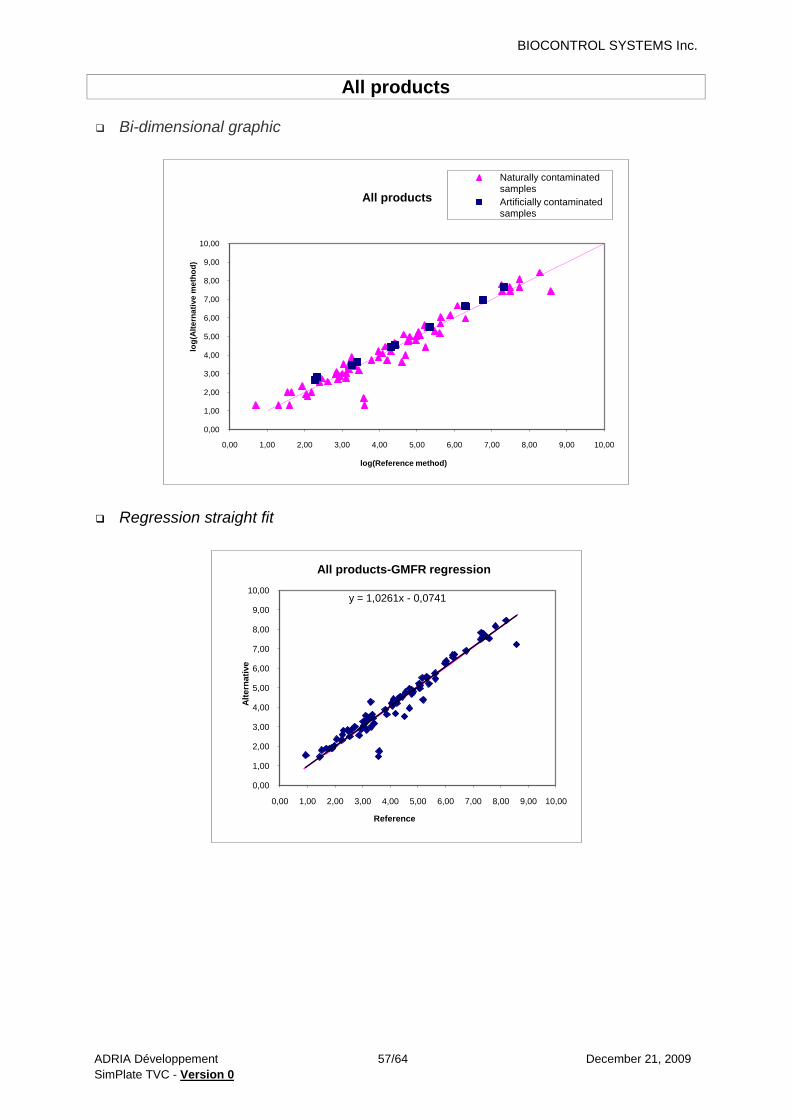
BIOCONTROL SYSTEMS Inc.
ADRIA Développement 57/64 December 21, 2009
SimPlate TVC - Version 0
All products Bi-dimensional graphic
0,00
1,00
2,00
3,00
4,00
5,00
6,00
7,00
8,00
9,00
10,00
0,00 1,00 2,00 3,00 4,00 5,00 6,00 7,00 8,00 9,00 10,00
log
(Alt
ern
ati
ve
me
tho
d)
log(Reference method)
All products
Naturally contaminated samples
Artificially contaminated samples
Regression straight fit
y = 1,0261x - 0,0741
0,00
1,00
2,00
3,00
4,00
5,00
6,00
7,00
8,00
9,00
10,00
0,00 1,00 2,00 3,00 4,00 5,00 6,00 7,00 8,00 9,00 10,00
Alt
ern
ati
ve
Reference
All products-GMFR regression

BIOCONTROL SYSTEMS Inc.
ADRIA Développement 58/64 December 21, 2009
SimPlate TVC - Version 0
Statistical interpretation
Bias D 0,150
Reference method Alternative method di
1 2,28 2,270 2,64 2,585 0,315
2 3,40 3,350 3,61 3,640 0,290
3 4,41 4,355 4,54 4,555 0,200
4 5,34 5,320 5,49 5,530 0,210
5 6,28 6,330 6,64 6,715 0,385
6 7,32 7,360 7,67 7,770 0,410
7 4,79 4,760 4,79 4,770 0,010
8 3,58 3,570 1,70 1,480 -2,090 1254 Half creamed pasteurized milk
9 2,83 2,720 2,97 3,005 0,285
10 3,26 3,290 3,88 4,275 0,985 1371 Half creamed pasteurized milk
11 3,04 3,120 3,51 3,565 0,445
12 2,30 2,450 2,68 2,825 0,375
13 2,08 1,890 1,78 1,890 0,000
14 2,18 1,980 2,00 2,040 0,060
15 4,65 4,690 5,11 4,970 0,280
16 7,74 7,805 8,09 8,170 0,365
17 4,15 4,115 4,46 4,415 0,300
18 3,97 4,040 4,23 4,215 0,175
19 4,45 4,430 4,59 4,535 0,105
20 4,81 4,775 5,00 4,890 0,115
21 7,48 7,480 7,67 7,630 0,150
22 5,04 5,040 5,26 5,220 0,180
23 4,08 4,080 4,08 4,080 0,000
24 5,61 5,635 5,17 5,461 -0,175
25 3,45 3,415 3,20 3,175 -0,240
26 3,34 3,370 3,41 3,450 0,080
27 5,20 5,155 5,61 5,505 0,350
28 3,79 3,820 3,75 3,875 0,055
29 5,08 5,080 5,08 5,140 0,060
30 5,23 5,190 4,43 4,385 -0,805 1180 Steak
31 5,48 5,400 5,28 5,205 -0,195
32 4,98 5,065 5,00 4,960 -0,105
33 8,58 8,570 7,45 7,225 -1,345 1246 Dry sausage
34 2,32 2,300 2,81 2,810 0,510
35 3,26 3,270 3,48 3,525 0,255
36 4,30 4,290 4,43 4,440 0,150
37 5,32 5,320 5,54 5,565 0,245
38 6,32 6,275 6,61 6,560 0,285
39 6,76 6,745 6,95 6,900 0,155
40 2,40 2,240 2,56 2,320 0,080
41 3,60 3,600 1,30 1,750 -1,850 1138 Frozen artichoke hearts
42 8,28 8,195 8,45 8,465 0,270
43 5,89 5,985 6,15 6,245 0,260
44 4,69 4,690 4,00 3,950 -0,740
45 4,20 4,190 3,75 3,675 -0,515
46 2,89 2,875 2,68 2,565 -0,310
47 4,60 4,515 3,62 3,535 -0,980 1370 Guacamole
48 0,70 0,940 1,30 1,540 0,600
49 1,30 1,450 1,30 1,450 0,000
50 1,65 1,525 2,00 1,800 0,275
51 1,93 2,065 2,34 2,360 0,295
52 1,60 1,800 1,30 1,890 0,090
53 7,74 7,425 7,68 7,650 0,225
54 3,18 3,165 3,40 3,370 0,205
55 4,30 4,240 4,20 4,215 -0,025
56 6,30 5,995 5,97 6,240 0,245
57 7,49 7,580 7,43 7,525 -0,055
58 6,08 6,265 6,66 6,680 0,415
59 1,54 1,675 2,00 1,890 0,215
60 4,41 4,555 4,68 4,775 0,220
61 5,28 5,320 5,48 5,520 0,200
62 5,63 5,620 5,70 5,745 0,125
63 4,76 4,825 4,75 4,790 -0,035
64 7,28 7,280 7,46 7,500 0,220
65 2,46 2,530 2,73 2,495 -0,035
66 2,40 2,600 2,75 2,850 0,250
67 3,00 2,950 3,00 2,875 -0,075
68 3,18 3,090 3,45 3,200 0,110
69 2,86 3,020 3,08 3,270 0,250
70 4,97 4,780 4,79 4,690 -0,090
71 3,18 3,305 3,23 2,990 -0,315
72 5,64 6,025 6,04 6,375 0,350
73 2,94 3,025 2,88 3,055 0,030
74 3,11 3,145 2,75 2,840 -0,305
75 2,04 1,870 1,90 1,900 0,030
76 2,62 2,500 2,58 2,780 0,280
77 3,11 3,025 3,04 2,980 -0,045
78 3,97 3,870 3,87 3,640 -0,230
79 7,26 7,290 7,79 7,830 0,540
Rep.1 Mxi
Seafo
od p
roducts
Bakery
and o
ther p
roducts
MyiRep.1
Milk
pro
ducts
Meat p
roducts
Fru
it and v
egeta
ble
s

BIOCONTROL SYSTEMS Inc.
ADRIA Développement 59/64 December 21, 2009
SimPlate TVC - Version 0
Reference method Alternative method
1 2,26 0,014 2,53 0,078
2 3,30 0,071 3,67 0,042
3 4,30 0,078 4,57 0,021
4 5,30 0,028 5,57 0,057
5 6,38 0,071 6,79 0,106
6 7,40 0,057 7,87 0,141
7 4,73 0,042 4,75 0,028
8 3,56 0,014 1,26 0,311
9 2,61 0,156 3,04 0,049
10 3,32 0,042 4,67 0,559
11 3,20 0,113 3,62 0,078
12 2,60 0,212 2,97 0,205
13 1,70 0,269 2,00 0,156
14 1,78 0,283 2,08 0,057
15 4,73 0,057 4,83 0,198
16 7,87 0,092 8,25 0,113
17 4,08 0,049 4,37 0,064
18 4,11 0,099 4,20 0,021
19 4,41 0,028 4,48 0,078
20 4,74 0,049 4,78 0,156
21 7,48 0,000 7,59 0,057
22 5,04 0,000 5,18 0,057
23 4,08 0,000 4,08 0,000
24 5,66 0,035 5,75 0,409
25 3,38 0,049 3,15 0,035
26 3,40 0,042 3,49 0,057
27 5,11 0,064 5,40 0,148
28 3,85 0,042 4,00 0,177
29 5,08 0,000 5,20 0,085
30 5,15 0,057 4,34 0,064
31 5,32 0,113 5,13 0,106
32 5,15 0,120 4,92 0,057
33 8,56 0,014 7,00 0,318
34 2,28 0,028 2,81 0,000
35 3,28 0,014 3,57 0,064
36 4,28 0,014 4,45 0,014
37 5,32 0,000 5,59 0,035
38 6,23 0,064 6,51 0,071
39 6,73 0,021 6,85 0,071
40 2,08 0,226 2,08 0,339
41 3,60 0,000 2,20 0,636
42 8,11 0,120 8,48 0,021
43 6,08 0,134 6,34 0,134
44 4,69 0,000 3,90 0,071
45 4,18 0,014 3,60 0,106
46 2,86 0,021 2,45 0,163
47 4,43 0,120 3,45 0,120
48 1,18 0,339 1,78 0,339
49 1,60 0,212 1,60 0,212
50 1,40 0,177 1,60 0,283
51 2,20 0,191 2,38 0,028
52 2,00 0,283 2,48 0,834
53 7,11 0,445 7,62 0,042
54 3,15 0,021 3,34 0,042
55 4,18 0,085 4,23 0,021
56 5,69 0,431 6,51 0,382
57 7,67 0,127 7,62 0,134
58 6,45 0,262 6,70 0,028
59 1,81 0,191 1,78 0,156
60 4,70 0,205 4,87 0,134
61 5,36 0,057 5,56 0,057
62 5,61 0,014 5,79 0,064
63 4,89 0,092 4,83 0,057
64 7,28 0,000 7,54 0,057
65 2,60 0,099 2,26 0,332
66 2,80 0,283 2,95 0,141
67 2,90 0,071 2,75 0,177
68 3,00 0,127 2,95 0,354
69 3,18 0,226 3,46 0,269
70 4,59 0,269 4,59 0,141
71 3,43 0,177 2,75 0,339
72 6,41 0,544 6,71 0,474
73 3,11 0,120 3,23 0,247
74 3,18 0,049 2,93 0,127
75 1,70 0,240 1,90 0,000
76 2,38 0,170 2,98 0,283
77 2,94 0,120 2,92 0,085
78 3,77 0,141 3,41 0,325
79 7,32 0,042 7,87 0,057
SDyiRep.2 SDxi Rep.2
0,105 0,157
1,50
OLS 2
GMFR
OLS 1 Alternative
rob.SDwx= rob.SDwy=
SDwy/SDwx =
x-axis y-axis
ReferenceSDwy/SDwx<0,5
Alternative0,5<SDwy/SDwx<2
SDwy/SDwx>2 Référence
Alternative
Reference

BIOCONTROL SYSTEMS Inc.
ADRIA Développement 60/64 December 21, 2009
SimPlate TVC - Version 0
Reference method X Alternative method Y Y^ Myi - Eyi
1 2,28 2,270 2,270 2,64 2,585 2,585 2,26 0,330
2 3,40 3,350 3,350 3,61 3,640 3,640 3,36 0,277
3 4,41 4,355 4,355 4,54 4,555 4,555 4,39 0,160
4 5,34 5,320 5,320 5,49 5,530 5,530 5,38 0,145
5 6,28 6,330 6,330 6,64 6,715 6,715 6,42 0,294
6 7,32 7,360 7,360 7,67 7,770 7,770 7,48 0,292
7 4,79 4,760 4,760 4,79 4,770 4,770 4,81 -0,040
8 3,58 3,570 3,570 1,70 1,480 1,480 3,59 -2,109
9 2,83 2,720 2,720 2,97 3,005 3,005 2,72 0,288
10 3,26 3,290 3,290 3,88 4,275 4,275 3,30 0,973
11 3,04 3,120 3,120 3,51 3,565 3,565 3,13 0,438
12 2,30 2,450 2,450 2,68 2,825 2,825 2,44 0,385
13 2,08 1,890 1,890 1,78 1,890 1,890 1,87 0,025
14 2,18 1,980 1,980 2,00 2,040 2,040 1,96 0,082
15 4,65 4,690 4,690 5,11 4,970 4,970 4,74 0,232
16 7,74 7,805 7,805 8,09 8,170 8,170 7,93 0,235
17 4,15 4,115 4,115 4,46 4,415 4,415 4,15 0,267
18 3,97 4,040 4,040 4,23 4,215 4,215 4,07 0,144
19 4,45 4,430 4,430 4,59 4,535 4,535 4,47 0,063
20 4,81 4,775 4,775 5,00 4,890 4,890 4,83 0,064
21 7,48 7,480 7,480 7,67 7,630 7,630 7,60 0,029
22 5,04 5,040 5,040 5,26 5,220 5,220 5,10 0,122
23 4,08 4,080 4,080 4,08 4,080 4,080 4,11 -0,032
24 5,61 5,635 5,635 5,17 5,461 5,461 5,71 -0,248
25 3,45 3,415 3,415 3,20 3,175 3,175 3,43 -0,255
26 3,34 3,370 3,370 3,41 3,450 3,450 3,38 0,066
27 5,20 5,155 5,155 5,61 5,505 5,505 5,22 0,289
28 3,79 3,820 3,820 3,75 3,875 3,875 3,85 0,029
29 5,08 5,080 5,080 5,08 5,140 5,140 5,14 0,001
30 5,23 5,190 5,190 4,43 4,385 4,385 5,25 -0,866
31 5,48 5,400 5,400 5,28 5,205 5,205 5,47 -0,262
32 4,98 5,065 5,065 5,00 4,960 4,960 5,12 -0,163
33 8,58 8,570 8,570 7,45 7,225 7,225 8,72 -1,495
34 2,32 2,300 2,300 2,81 2,810 2,810 2,29 0,524
35 3,26 3,270 3,270 3,48 3,525 3,525 3,28 0,244
36 4,30 4,290 4,290 4,43 4,440 4,440 4,33 0,112
37 5,32 5,320 5,320 5,54 5,565 5,565 5,38 0,180
38 6,32 6,275 6,275 6,61 6,560 6,560 6,36 0,195
39 6,76 6,745 6,745 6,95 6,900 6,900 6,85 0,053
40 2,40 2,240 2,240 2,56 2,320 2,320 2,22 0,096
41 3,60 3,600 3,600 1,30 1,750 1,750 3,62 -1,870
42 8,28 8,195 8,195 8,45 8,465 8,465 8,33 0,130
43 5,89 5,985 5,985 6,15 6,245 6,245 6,07 0,178
44 4,69 4,690 4,690 4,00 3,950 3,950 4,74 -0,788
45 4,20 4,190 4,190 3,75 3,675 3,675 4,23 -0,550
46 2,89 2,875 2,875 2,68 2,565 2,565 2,88 -0,311
47 4,60 4,515 4,515 3,62 3,535 3,535 4,56 -1,024
48 0,70 0,940 0,940 1,30 1,540 1,540 0,89 0,650
49 1,30 1,450 1,450 1,30 1,450 1,450 1,41 0,036
50 1,65 1,525 1,525 2,00 1,800 1,800 1,49 0,309
51 1,93 2,065 2,065 2,34 2,360 2,360 2,04 0,315
52 1,60 1,800 1,800 1,30 1,890 1,890 1,77 0,117
53 7,74 7,425 7,425 7,68 7,650 7,650 7,54 0,105
54 3,18 3,165 3,165 3,40 3,370 3,370 3,17 0,196
55 4,30 4,240 4,240 4,20 4,215 4,215 4,28 -0,062
56 6,30 5,995 5,995 5,97 6,240 6,240 6,08 0,162
57 7,49 7,580 7,580 7,43 7,525 7,525 7,70 -0,179
58 6,08 6,265 6,265 6,66 6,680 6,680 6,35 0,325
59 1,54 1,675 1,675 2,00 1,890 1,890 1,64 0,245
60 4,41 4,555 4,555 4,68 4,775 4,775 4,60 0,175
61 5,28 5,320 5,320 5,48 5,520 5,520 5,38 0,135
62 5,63 5,620 5,620 5,70 5,745 5,745 5,69 0,052
63 4,76 4,825 4,825 4,75 4,790 4,790 4,88 -0,087
64 7,28 7,280 7,280 7,46 7,500 7,500 7,40 0,104
65 2,46 2,530 2,530 2,73 2,495 2,495 2,52 -0,027
66 2,40 2,600 2,600 2,75 2,850 2,850 2,59 0,256
67 3,00 2,950 2,950 3,00 2,875 2,875 2,95 -0,078
68 3,18 3,090 3,090 3,45 3,200 3,200 3,10 0,103
69 2,86 3,020 3,020 3,08 3,270 3,270 3,02 0,245
70 4,97 4,780 4,780 4,79 4,690 4,690 4,83 -0,141
71 3,18 3,305 3,305 3,23 2,990 2,990 3,32 -0,327
72 5,64 6,025 6,025 6,04 6,375 6,375 6,11 0,267
73 2,94 3,025 3,025 2,88 3,055 3,055 3,03 0,025
74 3,11 3,145 3,145 2,75 2,840 2,840 3,15 -0,313
75 2,04 1,870 1,870 1,90 1,900 1,900 1,84 0,055
76 2,62 2,500 2,500 2,58 2,780 2,780 2,49 0,289
77 3,11 3,025 3,025 3,04 2,980 2,980 3,03 -0,050
78 3,97 3,870 3,870 3,87 3,640 3,640 3,90 -0,257
79 7,26 7,290 7,290 7,79 7,830 7,830 7,41 0,424
Rep.1Mxi MyiRep.1
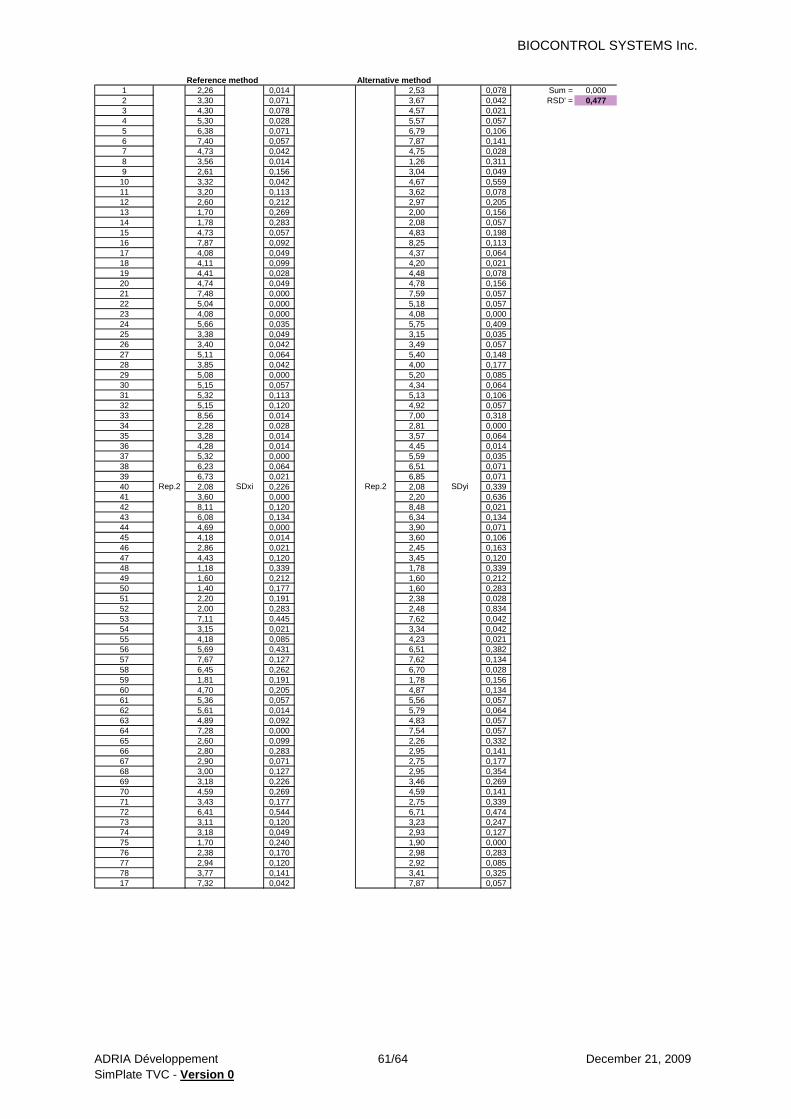
BIOCONTROL SYSTEMS Inc.
ADRIA Développement 61/64 December 21, 2009
SimPlate TVC - Version 0
Reference method Alternative method
1 2,26 0,014 2,53 0,078 Sum = 0,000
2 3,30 0,071 3,67 0,042 RSD' = 0,477
3 4,30 0,078 4,57 0,021
4 5,30 0,028 5,57 0,057
5 6,38 0,071 6,79 0,106
6 7,40 0,057 7,87 0,141
7 4,73 0,042 4,75 0,028
8 3,56 0,014 1,26 0,311
9 2,61 0,156 3,04 0,049
10 3,32 0,042 4,67 0,559
11 3,20 0,113 3,62 0,078
12 2,60 0,212 2,97 0,205
13 1,70 0,269 2,00 0,156
14 1,78 0,283 2,08 0,057
15 4,73 0,057 4,83 0,198
16 7,87 0,092 8,25 0,113
17 4,08 0,049 4,37 0,064
18 4,11 0,099 4,20 0,021
19 4,41 0,028 4,48 0,078
20 4,74 0,049 4,78 0,156
21 7,48 0,000 7,59 0,057
22 5,04 0,000 5,18 0,057
23 4,08 0,000 4,08 0,000
24 5,66 0,035 5,75 0,409
25 3,38 0,049 3,15 0,035
26 3,40 0,042 3,49 0,057
27 5,11 0,064 5,40 0,148
28 3,85 0,042 4,00 0,177
29 5,08 0,000 5,20 0,085
30 5,15 0,057 4,34 0,064
31 5,32 0,113 5,13 0,106
32 5,15 0,120 4,92 0,057
33 8,56 0,014 7,00 0,318
34 2,28 0,028 2,81 0,000
35 3,28 0,014 3,57 0,064
36 4,28 0,014 4,45 0,014
37 5,32 0,000 5,59 0,035
38 6,23 0,064 6,51 0,071
39 6,73 0,021 6,85 0,071
40 2,08 0,226 2,08 0,339
41 3,60 0,000 2,20 0,636
42 8,11 0,120 8,48 0,021
43 6,08 0,134 6,34 0,134
44 4,69 0,000 3,90 0,071
45 4,18 0,014 3,60 0,106
46 2,86 0,021 2,45 0,163
47 4,43 0,120 3,45 0,120
48 1,18 0,339 1,78 0,339
49 1,60 0,212 1,60 0,212
50 1,40 0,177 1,60 0,283
51 2,20 0,191 2,38 0,028
52 2,00 0,283 2,48 0,834
53 7,11 0,445 7,62 0,042
54 3,15 0,021 3,34 0,042
55 4,18 0,085 4,23 0,021
56 5,69 0,431 6,51 0,382
57 7,67 0,127 7,62 0,134
58 6,45 0,262 6,70 0,028
59 1,81 0,191 1,78 0,156
60 4,70 0,205 4,87 0,134
61 5,36 0,057 5,56 0,057
62 5,61 0,014 5,79 0,064
63 4,89 0,092 4,83 0,057
64 7,28 0,000 7,54 0,057
65 2,60 0,099 2,26 0,332
66 2,80 0,283 2,95 0,141
67 2,90 0,071 2,75 0,177
68 3,00 0,127 2,95 0,354
69 3,18 0,226 3,46 0,269
70 4,59 0,269 4,59 0,141
71 3,43 0,177 2,75 0,339
72 6,41 0,544 6,71 0,474
73 3,11 0,120 3,23 0,247
74 3,18 0,049 2,93 0,127
75 1,70 0,240 1,90 0,000
76 2,38 0,170 2,98 0,283
77 2,94 0,120 2,92 0,085
78 3,77 0,141 3,41 0,325
17 7,32 0,042 7,87 0,057
SDyiRep.2 Rep.2SDxi

BIOCONTROL SYSTEMS Inc.
ADRIA Développement 62/64 December 21, 2009
SimPlate TVC - Version 0
Sx= 1,804 Sy= 1,851
SD(Mxi) = 1,804 SD(Myi) = 1,851
M(x) = 4,293 M(y) = 4,331
MED(x) = 4,190 MED(y) = 4,215
rob.SDwx= 0,105 rob.SDwy= 0,157
q (doses)= 79
p (replicates)= 2
v (df)= 77
SDwy/SDwx SDwx/Sdwy
rob. 1,50 0,667
Orthogonal linear regression:
r(Mx, My) = 0,9672 SD t:H p(t:H) H Tcritique
Res.SD(My) = 0,477 = RSD' b= 1,0261 0,030 0,872 0,386 1
RSD' * SQRT(p) = Res.SD(y) = 0,675 =sr(y) a= -0,0741 0,139 0,532 0,597 0
Lack-of-fit (non-linearity):
vd (df DEN)= 79
vn (df NUM)= 77
rob. F= 36,321
p(rob.F)= 0%
1,99125

BIOCONTROL SYSTEMS Inc.
ADRIA Développement 63/64 December 21, 2009
SimPlate TVC - Version 0
Annex 6 - Detection and quantification limits
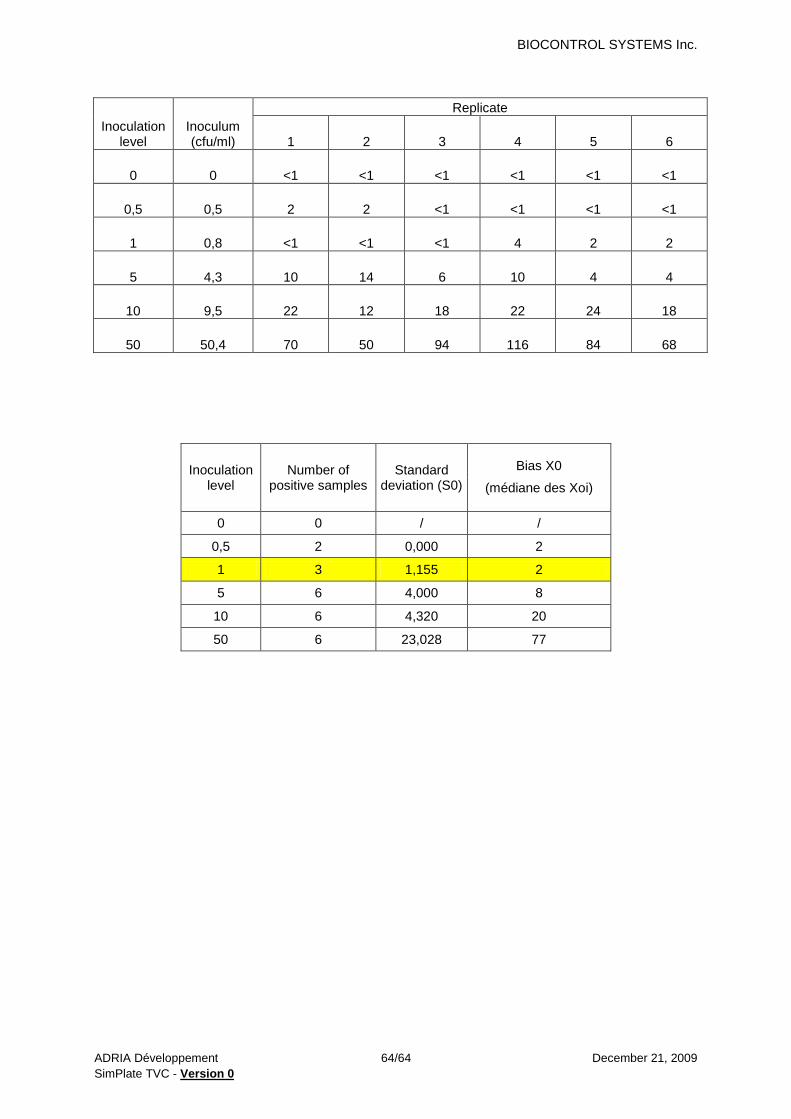
BIOCONTROL SYSTEMS Inc.
ADRIA Développement 64/64 December 21, 2009
SimPlate TVC - Version 0
Inoculation level
Inoculum (cfu/ml)
Replicate
1 2 3 4 5 6
0 0 <1 <1 <1 <1 <1 <1
0,5 0,5 2 2 <1 <1 <1 <1
1 0,8 <1 <1 <1 4 2 2
5 4,3 10 14 6 10 4 4
10 9,5 22 12 18 22 24 18
50 50,4 70 50 94 116 84 68
Inoculation level
Number of positive samples
Standard deviation (S0)
Bias X0
(médiane des Xoi)
0 0 / /
0,5 2 0,000 2
1 3 1,155 2
5 6 4,000 8
10 6 4,320 20
50 6 23,028 77