Microstructures and abrasive wear performance of...
10
Wear 274–275 (2012) 345–354 Contents lists available at SciVerse ScienceDirect Wear jou rnal h om epage: www.elsevier.com/locate/wear Microstructures and abrasive wear performance of PTAW deposited Ni–WC overlays using different Ni-alloy chemistries T. Liyanage a , G. Fisher b , A.P. Gerlich a,∗ a University of Alberta, Chemical and Materials Engineering, Edmonton, Alberta T6G 2V4, Canada b Alberta Innovates – Technology Futures, 250 Karl Clark Road, Edmonton, Alberta, T6N 1E4, Canada a r t i c l e i n f o Article history: Received 21 April 2011 Received in revised form 29 September 2011 Accepted 10 October 2011 Available online 15 October 2011 Keywords: Three-body abrasion Hardness Metal-matrix composite Hardfacing Mining Mineral processing Electron microscopy a b s t r a c t The microstructures and performance of Ni–WC (nickel–tungsten carbide) composite overlays deposited by plasma transferred arc welding are studied using a combination of microscopy, hardness, and wear testing. The Ni–WC overlays had microstructures consisting of -Ni dendrites, with interdendritic Ni- based eutectics, borides and carbides. Overlays which were produced with a low hardness Ni-alloy matrix contained a smaller fraction of interdendritic phases relative to the high hardness Ni-alloys. The dissolution of WC particles was observed following deposition of the MMCs, and this promoted the formation of secondary carbide phases. Ni-alloys with low carbon and low Cr content exhibited the least dissolution of WC. The Ni–WC overlays produced using these dilute alloys generally performed better in ASTM G65 wear tests. This was due to the increased fraction of retained WC phase, and the reduced fraction of brittle secondary carbide phases when the Ni-alloy contained no Cr. Crown Copyright © 2011 Published by Elsevier B.V. All rights reserved. 1. Introduction Overlay welding is used to improve the wear resistance of sur- faces on industrial parts by depositing a protective layer of abrasion and/or corrosion resistant weld metal onto a base material surface. This technique is especially useful in high wear environments such as those experienced in a wide range of mining industries, in partic- ular those encountered in the oil sands of Alberta. The extreme wear decreases productivity and the useful life of equipment, as such overlay welding is used to apply a thick coating onto components in order to reduce the overall maintenance costs [1–3]. The abrasive wear resistance increases strongly with the addi- tion of tungsten carbide (WC) into the metallic matrix [2,4–8]. As a result, WC particles are an ideal candidate for addition into Ni- based alloys as the reinforcing phase since the low melting point of NiCrBSi alloys (about 1025 ◦ C) allows tungsten carbide to endure the deposition process without degradation more readily than in Fe-based matrix alloys [9]. A central problem with plasma transferred arc welded (PTAW) Ni–WC overlays is the degree of dissolution of the WC particles [10]. Dissolution results in lowered wear resistance as there is less WC ∗ Corresponding author. Tel.: +1 780 492 8853; fax: +1 780 492 2881. E-mail address: [email protected] (A.P. Gerlich). reinforcing material remaining to offer protection from abrasive wear [11]. In addition, the dissolved W, and C allow the formation of brittle secondary phases which may be detrimental to the abra- sion resistance of the deposit [3]. Particle dissolution occurs when excessive arc current provides sufficient heat to cause WC material to go into solution above a critical temperature [12]. In order to prevent precipitation of brittle hard phases during laser welding, it was found that alloys with low contents of carbon, boron, and chromium should be used [13]. The diffusion coefficient of carbon in the matrix material is usually higher than the diffusion coefficient of the carbide-forming metal [14]. Thus, carbon diffuses much faster out of the carbide, allowing it to form mixed carbides. Complex carbides such as the metastable and extremely brittle phase M 3 W 3 C form in MMCs due to the low carbon concentration in matrix alloys and the rapid cooling of the melt when WC is used as reinforcing particles [13]. Laser cladding of a NiCrBSi alloy with WC particles resulted in a matrix microstructure similar to that pro- cessed with no WC particles present, since the dissolution of WC particles is very low (∼5%) using the laser cladding process [15]. The matrix was composed of -Ni dendrites and -Ni + Ni 3 B lamel- lar eutectic in the interdendritic region. Blocky precipitates formed both near and away from the WC-matrix interface were found to be -W 2 C and contained some Cr. Quadrilateral precipitates were found to be 1 -M 6 C with some Cr and Ni (possibly (Cr,Ni) 3 W 3 C) and thin-plate carbides were reported as -W 2 C [15]. In addition, 0043-1648/$ – see front matter. Crown Copyright © 2011 Published by Elsevier B.V. All rights reserved. doi:10.1016/j.wear.2011.10.001
Transcript of Microstructures and abrasive wear performance of...

Mo
Ta
b
a
ARR2AA
KTHMHMME
1
faTaudoi
tabNtF
ND
0d
Wear 274– 275 (2012) 345– 354
Contents lists available at SciVerse ScienceDirect
Wear
jou rna l h om epage: www.elsev ier .com/ locate /wear
icrostructures and abrasive wear performance of PTAW deposited Ni–WCverlays using different Ni-alloy chemistries
. Liyanagea, G. Fisherb, A.P. Gerlicha,∗
University of Alberta, Chemical and Materials Engineering, Edmonton, Alberta T6G 2V4, CanadaAlberta Innovates – Technology Futures, 250 Karl Clark Road, Edmonton, Alberta, T6N 1E4, Canada
r t i c l e i n f o
rticle history:eceived 21 April 2011eceived in revised form9 September 2011ccepted 10 October 2011vailable online 15 October 2011
eywords:
a b s t r a c t
The microstructures and performance of Ni–WC (nickel–tungsten carbide) composite overlays depositedby plasma transferred arc welding are studied using a combination of microscopy, hardness, and weartesting. The Ni–WC overlays had microstructures consisting of �-Ni dendrites, with interdendritic Ni-based eutectics, borides and carbides. Overlays which were produced with a low hardness Ni-alloy matrixcontained a smaller fraction of interdendritic phases relative to the high hardness Ni-alloys.
The dissolution of WC particles was observed following deposition of the MMCs, and this promoted theformation of secondary carbide phases. Ni-alloys with low carbon and low Cr content exhibited the least
hree-body abrasionardnessetal-matrix compositeardfacinginingineral processing
lectron microscopy
dissolution of WC. The Ni–WC overlays produced using these dilute alloys generally performed betterin ASTM G65 wear tests. This was due to the increased fraction of retained WC phase, and the reducedfraction of brittle secondary carbide phases when the Ni-alloy contained no Cr.
Crown Copyright © 2011 Published by Elsevier B.V. All rights reserved.
. Introduction
Overlay welding is used to improve the wear resistance of sur-aces on industrial parts by depositing a protective layer of abrasionnd/or corrosion resistant weld metal onto a base material surface.his technique is especially useful in high wear environments suchs those experienced in a wide range of mining industries, in partic-lar those encountered in the oil sands of Alberta. The extreme wearecreases productivity and the useful life of equipment, as suchverlay welding is used to apply a thick coating onto componentsn order to reduce the overall maintenance costs [1–3].
The abrasive wear resistance increases strongly with the addi-ion of tungsten carbide (WC) into the metallic matrix [2,4–8]. As
result, WC particles are an ideal candidate for addition into Ni-ased alloys as the reinforcing phase since the low melting point ofiCrBSi alloys (about 1025 ◦C) allows tungsten carbide to endure
he deposition process without degradation more readily than ine-based matrix alloys [9].
A central problem with plasma transferred arc welded (PTAW)i–WC overlays is the degree of dissolution of the WC particles [10].issolution results in lowered wear resistance as there is less WC
∗ Corresponding author. Tel.: +1 780 492 8853; fax: +1 780 492 2881.E-mail address: [email protected] (A.P. Gerlich).
043-1648/$ – see front matter. Crown Copyright © 2011 Published by Elsevier B.V. All rioi:10.1016/j.wear.2011.10.001
reinforcing material remaining to offer protection from abrasivewear [11]. In addition, the dissolved W, and C allow the formationof brittle secondary phases which may be detrimental to the abra-sion resistance of the deposit [3]. Particle dissolution occurs whenexcessive arc current provides sufficient heat to cause WC materialto go into solution above a critical temperature [12].
In order to prevent precipitation of brittle hard phases duringlaser welding, it was found that alloys with low contents of carbon,boron, and chromium should be used [13]. The diffusion coefficientof carbon in the matrix material is usually higher than the diffusioncoefficient of the carbide-forming metal [14]. Thus, carbon diffusesmuch faster out of the carbide, allowing it to form mixed carbides.Complex carbides such as the metastable and extremely brittle �phase M3W3C form in MMCs due to the low carbon concentrationin matrix alloys and the rapid cooling of the melt when WC is usedas reinforcing particles [13]. Laser cladding of a NiCrBSi alloy withWC particles resulted in a matrix microstructure similar to that pro-cessed with no WC particles present, since the dissolution of WCparticles is very low (∼5%) using the laser cladding process [15].The matrix was composed of �-Ni dendrites and �-Ni + Ni3B lamel-lar eutectic in the interdendritic region. Blocky precipitates formed
both near and away from the WC-matrix interface were found tobe �-W2C and contained some Cr. Quadrilateral precipitates werefound to be �1-M6C with some Cr and Ni (possibly (Cr,Ni)3W3C)and thin-plate carbides were reported as �-W2C [15]. In addition,ghts reserved.

3 ar 274– 275 (2012) 345– 354
itWifr
mlocsrWpgcbo
mgaodsw
frWio[mlcctMtsgdotim
Nmccwt
2
pcwMri
Table 1Matrix alloy element compositions (in wt%).
B C Cr Fe Ni Si
Alloy A (Cr-free) 3.45 0.027 0.16 0.64 92.64 3.08Alloy B (low-Cr) 1.93 0.67 8.39 5.2 79.79 4.02Alloy C (high-Cr) 2.73 0.92 13.8 5.5 71.25 5.8
46 T. Liyanage et al. / We
n the interface between WC particles and the matrix, M6C tendso form as well as small fractions of Fe3W3C [16]. Away from the
C/matrix interface, more complex carbides have also been foundn NiCrBSi alloys containing W; their chemistry was suggested toollow the formula (NiSi)A(CrW)B, with A and B taking values in theanges (2.5–2.9) and (2.5–3.6), respectively [16].
The secondary particles resulting after WC dissolution occursay produce Cr7C3, secondary tungsten carbide W2C and metal-
ic tungsten (W), Cr3Ni2, and Cr23C6, and these have been readilybserved by XRD following thermal spray deposition of a lowhromium NiCrBSi alloy with WC particles [17]. Laser cladding ofpherical WC particles with a Ni-alloy also showed XRD peaks cor-esponding to �-Ni, WC, W2C and WC1−X, Ni2W4C and CrFeNi [18].
hen PTAW was used to deposit two NiCrBSi alloys with WC hardarticles, dissolution of WC was evident due to the presence of elon-ated precipitates rich in W next to the WC particles and a smalloncentration of W in solid solution [3]. Dissolution of WC car-ides also was noted using similar methods during laser claddingf another MMC (75% Ni–25% WC) alloy [19].
It is important to consider the formation of these phases in theatrix, since during abrasive wear the surface of a soft material is
ouged out by the abrasive particles/phases of the harder materialnd produces wear chips when the abraded material is elastoplasticr viscoelastic-plastic. Abrasive wear involves subsurface plasticeformation (increases as wear particles themselves develop flaturfaces) in addition to cutting of the surface and generation ofear chips [20].
It is generally understood that increasing the hard particleraction will increase coating hardness and hence abrasive wearesistance. It was found that for laser deposited Ni-based alloys with
C particles, increasing the WC volume fraction from 0 to ∼50% didndeed show a linear dependence of hardness on the concentrationf carbides but there was no correlation with the size of the particles4]. Ball-on-disc wear testing showed that smaller carbides were
ore effective for dry sliding wear resistance since coatings witharge carbides revealed evidence of cracks at the interface betweenarbides and matrix [4]. The effect of morphology of the WC parti-les (spherical or angular) on wear rate has also been compared, andhe ASTM-G65 dry sand rubber wheel apparatus test reveals that
MCs with angular WC powder exhibit up to 50% lower wear rateshan those obtained with spherical powder. It was argued that theurfaces of the clad layer formed with spherical powder had largeaps between reinforcing particles whereas with the angular pow-er, the particles formed an interlocking structure, exposing lessf the matrix material to the abrasive particles [18]. This implieshat the mean free distance between WC particles also plays anmportant role in wear resistance, where any dissolution of the WC
aterial will be detrimental to the performance.To assess the wear performance and carbide dissolution of
i–WC composites during PTAW, three commercially availableatrix alloys were tested with and without WC reinforcing parti-
les. The matrix alloys differed in their compositions and could beategorized as being Cr-free, low-Cr, and high-Cr. These chemistriesere chosen in order to compare the effect of alloying elements on
he dissolution of carbides and their wear performance as MMCs.
. Materials and methods
The matrix alloys used were two NiCrBSi powders and one NiBSiowder with compositions shown in Table 1. The WC powder usedonsisted of angular, monocrystalline particles (without any W2C)
ith a size distribution of 50–180 �m and average of 100 �m. TheMC powders were mixed as 500 g batches (for each alloy) to aatio of 60 wt% monocrystalline WC with 40 wt% Ni-alloy (whichs approximately 50 vol%). Powders were mixed on a tumbler for a
minimum of 2 h and the mixed powders were poured directly fromthe tumbler into the PTAW system hopper to be welded (i.e. withoutstoring between mixing and welding) to minimize any settling ofthe dense WC particles.
The MMC overlays were applied using a Stellite Starweld 300Mconstant current power source with a Stellite Excalibur PTA torch.The PTAW parameters were as follows: arc voltage of 25 V, currentof 150–160 A (in DC electrode negative polarity), powder feed rateof 25–30 g/min, Ar gas shielding at a flow rate of 12 l/min, 14 mmworking distance, and a travel speed of 0.3–0.5 mm/s. In order tocompare the influence of the WC particles on the properties, the Ni-alloys were also deposited alone (without WC) using comparablePTAW parameters. The deposits were about 25–30 mm wide andabout 4–6 mm in thickness.
2.1. Microscopy
MMC overlay deposits were cut (using a diamond reinforcedcutting wheel) from the middle of the deposit and were then pol-ished using standard laboratory techniques to a 1 �m finish. Afterpolishing, optical microscopy was performed to quantify the WCfractions and examine some of the other phases in the matrix.Electron probe microanalysis (EPMA) with wavelength dispersivespectroscopy (WDS) was conducted using a CAMECA SX100 with a20 keV accelerating voltage to map the elemental distribution in thedeposits. Auger Electron Spectroscopy (AES) was also conductedusing a JEOL JAMP-9500F instrument at an accelerating voltageof 15 keV to quantify the chemistry of phases contained in thedeposits, and Ar ion sputtering was applied for 30 s prior to analysisto remove surface contamination. AES provides elemental quantifi-cation for small phases since it is a very surface sensitive technique(Auger electrons are emitted only from the first few nanometersof the surface), and consequently does not suffer from undesirableinteraction volume effects observed with X-ray spectroscopy scan-ning electron microscopy (SEM) methods. In addition, AES is ableto quantify the chemistry of lighter elements such as boron andcarbon. Conventional SEM was then used to analyze the wear scarsproduced after abrasion testing. The volume fractions of WC andtheir mean free path in the composite overlays were calculated afterexamining at least 450 particles, over a region of at least 10.2 mm2
in each Ni–WC overlay.
2.2. Hardness testing
Vickers microhardness testing was conducted using a MitutoyoMVK-H1 indentation system, with a 25 g to 1 kg load and 15 s loadtime to determine the hardness of the matrix and WC particles,and this was complemented by Rockwell C testing to investigatethe macro-scale hardness in the overlays. When analysis of specificphases was required, Vickers testing with a 25 load was used, how-ever the average hardness of the matrix and WC particles in thecomposites could be obtained using 500 and 200 g loads respec-
tively. The average hardness values are reported along with ±1standard deviation, and the number of indents tested (n).
T. Liyanage et al. / Wear 274
Fu
2
um(lrmOtddwt
2
utcTfpttscc
3
3
Natdobt
te
ig. 1. Average hardness values of the Ni-alloy and Ni–WC composite overlays madesing the different alloys studied.
.3. Wear testing
Wear testing was performed as per the ASTM-G65-04 standardsing Procedure A (dry sand rubber wheel apparatus), and theass loss results were recorded for two consecutive wear scars
with 6000 revolutions of the abrasive wheel each) using a 130 Noad on the wheel. Only the second wear scar mass loss values areeported, as the first scar generally involves preferential wear of theatrix during the so-called ‘break-in’ period. The abrasive used wasttawa silica sand in a 50/70 mesh size (212–300 �m diameter par-
icle size) with an angular morphology. Most deposits had a layerevoid of WC at the top of the deposit, and in order to avoid scatterue to the reduced WC fraction observed near the surface, samplesere ground down by 1–2 mm to remove this region before wear
esting.
.4. Thermodynamic modeling
Thermodynamic modeling of the MMC system was performedsing the ThermoCalc software package in order to comparehe predicted phases expected to be stable with different alloyhemistries. A Scheil-type solidification model was applied in theTNI8 database, with carbon as a fast diffuser and no bcc to fcc trans-ormations. The results were then plotted as mass fractions of solidhases versus temperature. During calculation, it was assumed thathe entire WC particle has initially dissolved (in order to representhe locally enriched region around the particles during partial dis-olution), and the stability of various phases during subsequentooling are compared using the Scheil plots for the three alloyhemistries studied.
. Results
.1. WC distribution and overlay hardness
Two major issues in achieving optimal performance of thei–WC composite overlays involve the non-uniform distributionnd possible degradation or dissolution of the WC particles. All ofhe overlays contained a region devoid of WC at the top of theeposit as well as a higher density of WC particles at the sidesf the weave weld. This inhomogeneity of the WC particles haseen accounted for mostly by settling during the brief time that
he overlay is fully molten [21].The Rockwell C hardness values measured for the Ni-alloys andhe Ni–WC composite overlays are compared in Fig. 1. The strength-ning contribution of the WC particles is clear when Alloy A or B
– 275 (2012) 345– 354 347
is employed, however the addition of WC particles did not have asignificant contribution to the hardness of Alloy C. Vickers micro-hardness testing was also performed on the Ni-alloys with a 1 kgload at 250 �m intervals from the bottom (at the substrate/depositinterface) to the top of the deposit and compared to the hardnessof the matrix alloy alone without WC particles. The trend in aver-age Vickers microhardness through the thickness of the depositcenterline was comparable to the Rockwell hardness results.
When Alloys A, B, and C were deposited without WC particles,they exhibited hardness values of 529 ± 40 HV (n = 25), 503 ± 27 HV(n = 15), and 732 ± 62 HV (n = 17) respectively. Combining the alloyswith WC particles slightly increased the microhardness of the alloy,where selective area measurements revealed that the metal matrixin the Ni–WC overlays made using Alloys A, B, and C were 617 ± 58HV (n = 20), 601 ± 88 HV (n = 20), and 752 ± 100 HV (n = 20) respec-tively. The microhardness of the WC particles ranged significantlydue to the anisotropy of the hexagonal crystal structure in the indi-vidual grains [22] and the average value was comparable in each ofthe composite overlays, being 1540 ± 242 HV (n = 43).
3.2. WC dissolution and microconstituents
Optical image analysis of the composite alloys (sections of lowand high WC dissolution alloys are shown in Fig. 2a and b, AlloyA and Alloy C, respectively) was used to estimate the dissolutionof the WC particles. Based on a 60/40 wt% ratio between WC/Ni-alloy, the volume fraction of the deposit should theoretically be45 vol% WC–55 vol% Ni but 50 vol% WC was used for the purposeof dissolution calculations as some deviation occurs as a result of aminor difference in deposition efficiency of the materials (favoringWC). The highest dissolution was evident in the alloys which con-tained Cr and increased alloying elements. Most notably, the Ni–WCoverlays produced using Alloy B and Alloy C which had high levelsof Cr and C, exhibited high dissolution levels with more than 26%of the original WC material dissolving. No direct correlation couldbe determined between dissolution and specific alloying additions,since both the Cr and carbon content of each alloy increased in aroughly equal proportion.
Cross-sections were examined from the middle of the depositto ensure consistency and to lessen any microstructural differencesdue to starting and ending the weave weld. The total WC fractionsmeasured for each Ni–WC overlay are compared in Fig. 3, witha total of 10.2 mm2 being examined for each value. However, itshould be noted that along the length, some heating of the sub-strate will occur during preparation of the sample due to the slowtravel speeds used. To take into consideration any scatter in thedissolution rate along the deposit length, sections were also madeat the start, middle, and end of Alloys A and C. It was found thatthe difference in WC fraction calculation varied by 2–8% from thestart to the end of the deposit. This suggests there was relativelylittle variation in the WC dissolution along the length of the depositwhich could stem from the accumulation of heat in the substratecoupon during welding.
EPMA analysis revealed dissolution of primary WC carbidesoccurs and leads to the formation of secondary carbides surround-ing the WC particles. Alloy A showed negligible dissolution withonly some of the matrix appearing slightly enriched in tungsten(Fig. 4). A feathery Cr–W–C phase formed at the periphery sur-rounding the WC particles in Alloy B (Fig. 56) and AES elementquantification (Table 2) of this phase suggested that the stoichiom-etry corresponds to Cr7W3C6. The AES points analyzed in Alloy Bare indicated in Fig. 6.
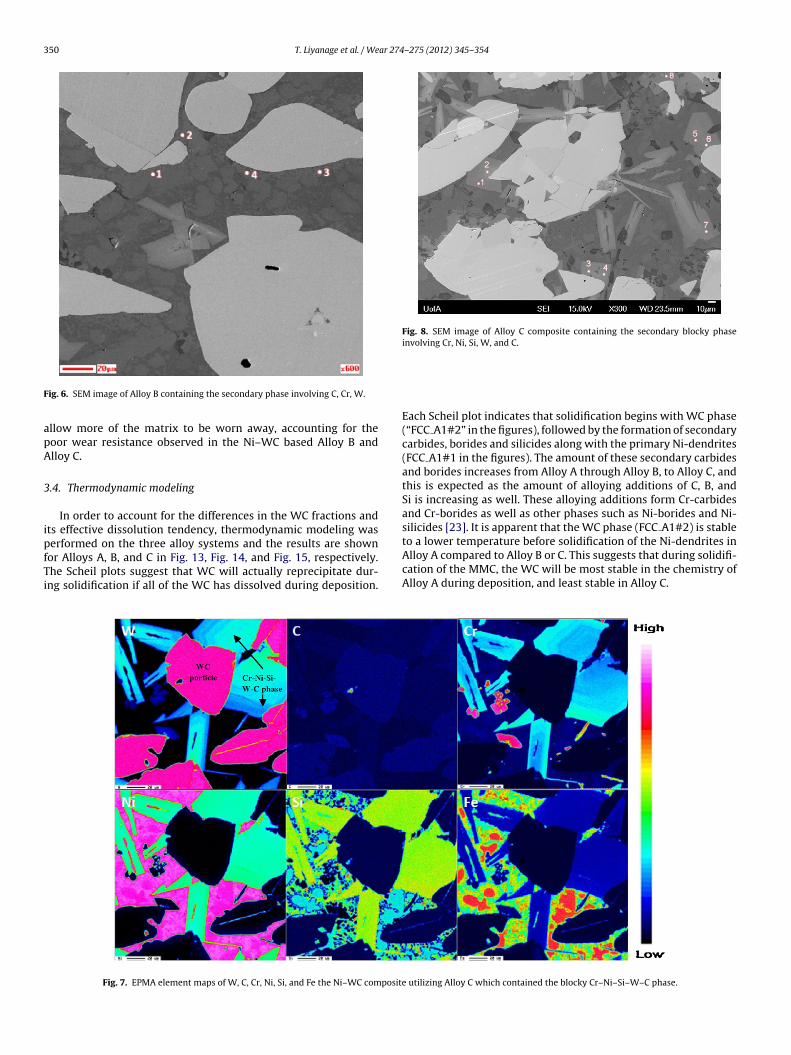
The Ni–WC overlay produced using Alloy C (which contained thehighest fractions of Cr, C, and Si) contained blocky Cr–Ni–Si–W–Cphases located between the WC particles (Fig. 7). Repeated AESelement quantification of points in Fig. 8 revealed the stoichiometry

348 T. Liyanage et al. / Wear 274– 275 (2012) 345– 354
Fig. 2. MMC cross-sections illustrating examples of (a) low dissolution of W
oiqd
cdUwHpn
TRW
wear performance, the overlays produced with matrix alloys withthe lowest hardness, actually yielded the best wear resistance, asindicated in Fig. 11
Fig. 3. Total WC fraction in Ni–WC overlays.
f the blocky 5-component phase to be about Ni4Cr5Si2W4C4.5 asndicated in Table 3, although there may be some error in the Cuantification due to some preferential removal of lighter elementsuring ion sputtering of the surface prior to collecting the AES data.
Microhardness testing was performed on the blocky 5-omponent phase observed in Alloy C (see Fig. 8) in order toetermine its contribution to the overall hardness of the composite.sing a 25 g load, the average hardness of this 5-component phaseas found to be 1570 ± 266 HV (n = 17), compared to 1540 ± 242
V (n = 43) for the WC particles. One would expect that this blockyhase would make a significant contribution to the matrix hard-ess, however, only a marginal increase the microhardness of theable 2epeated AES quantifications of the 3-component phase at the periphery regions ofC particles in Alloy B (the analysis points are shown in Fig. 6).
Point Atomic concentration (%)
C Cr W
1 37.2 43.9 17.32 36.6 46.9 16.53 34.5 40.3 14.64 37 44.6 18.4Average 36.32 43.92 16.7Stoichiometry (est.) 6 7 3
C when using Alloy A and (b) high WC dissolution when using Alloy C.
metal matrix was oberved in Alloy C when this phase formed in thepresence of WC particles (732 vs 752 HV). It should be noted thatindents on the blocky 5-component phase using loads higher than50 g consistently resulted in cracking of the phase, suggesting theseare particularly brittle. When the regions adjacent to the Rockwellindents were examined, widespread cracking of the 5-componentphases was observed in Alloy C (see Fig. 9), while negligible crack-ing was detected in the matrix of the Ni–WC overlays made usingAlloy A or B. This provides strong evidence that this 5-componentphase is likely more brittle than WC particles (only one of whichcontains a crack in Fig. 9 for example). This has drastic implicationsfor the wear resistance of this Ni–WC overlay made using Alloy C.It should also be noted that extensive formation of slip bands wereobserved in the WC particles closer to the indent, which is a form ofductility widely observed in this carbide [22]. Due to the irregularcrack paths at the Vickers indents, the toughness of the differentphases could not be estimated directly from the crack lengths.
3.3. Wear testing results
Wear testing as per ASTM-G65 on the matrix alloys indicatedthat wear resistance correlated almost directly with hardness foreach of the Ni-alloys, and the values were roughly in proportionto the measured hardness values (Fig. 10). In the case of the MMC
Table 3Repeated AES quantifications of the 5-component blocky phase between WC-particles in the Ni–WC composite produced using Alloy C (the analysis points shownin Fig. 8).
Point Atomic concentration (%)
C Cr Ni Si W
1 21.6 26.6 20.9 11 19.92 21.5 25.4 21.1 9.1 22.93 22.6 24.4 21 12 204 22.4 24.2 20.2 10.4 22.85 24.1 26.3 20.2 9.9 19.56 22.3 26.6 21.6 11 18.57 23.3 26.5 21.1 9.8 19.38 22 26.7 20.5 12.2 18.6Average 22.5 25.8 20.8 10.7 20.2Stoichiometry (est.) 4.5 5 4 2 4

T. Liyanage et al. / Wear 274– 275 (2012) 345– 354 349
ps of A
wopsss
Fig. 4. EPMA element ma
. It is interesting to note that the wear rate drastically increaseshen the mean free path exceeds a critical value above 114 �m
bserved in Alloy B. The mean free path for the Ni–WC overlayroduced using Alloy C was 129.5 ± 60 �m, which indicates that a
ignificant fraction of the metal matrix on the surface of the wearcar can be in direct contact with the 212–300 �m diameter silicaand particles.Fig. 5. EPMA element maps for W, C, Cr, Si, and Fe in Alloy B, showin
lloy A with WC particles.
The wear scars examined by SEM imaging show that theWC particles are mostly intact and protrude above the metalmatrix. In the case of the Ni–WC utilizing Alloy A, the sur-face of the WC particles is flat and smooth, with a short
mean free path between adjacent WC particles (Fig. 12a). ForAlloys B and C, the WC particles have a wider spacing due toincreased dissolution and have a fractured, rough surface appear-ance (Fig. 12c). The wider separation between WC particles wouldg the Cr–W–C rich phases at the periphery of the WC particles.
350 T. Liyanage et al. / Wear 274– 275 (2012) 345– 354
F
apA
3
ipfTi
Fig. 8. SEM image of Alloy C composite containing the secondary blocky phaseinvolving Cr, Ni, Si, W, and C.
ig. 6. SEM image of Alloy B containing the secondary phase involving C, Cr, W.
llow more of the matrix to be worn away, accounting for theoor wear resistance observed in the Ni–WC based Alloy B andlloy C.
.4. Thermodynamic modeling
In order to account for the differences in the WC fractions andts effective dissolution tendency, thermodynamic modeling was
erformed on the three alloy systems and the results are shownor Alloys A, B, and C in Fig. 13, Fig. 14, and Fig. 15, respectively.he Scheil plots suggest that WC will actually reprecipitate dur-ng solidification if all of the WC has dissolved during deposition.Fig. 7. EPMA element maps of W, C, Cr, Ni, Si, and Fe the Ni–WC composit
Each Scheil plot indicates that solidification begins with WC phase(“FCC A1#2” in the figures), followed by the formation of secondarycarbides, borides and silicides along with the primary Ni-dendrites(FCC A1#1 in the figures). The amount of these secondary carbidesand borides increases from Alloy A through Alloy B, to Alloy C, andthis is expected as the amount of alloying additions of C, B, andSi is increasing as well. These alloying additions form Cr-carbidesand Cr-borides as well as other phases such as Ni-borides and Ni-silicides [23]. It is apparent that the WC phase (FCC A1#2) is stableto a lower temperature before solidification of the Ni-dendrites inAlloy A compared to Alloy B or C. This suggests that during solidifi-cation of the MMC, the WC will be most stable in the chemistry of
Alloy A during deposition, and least stable in Alloy C.e utilizing Alloy C which contained the blocky Cr–Ni–Si–W–C phase.

T. Liyanage et al. / Wear 274– 275 (2012) 345– 354 351
Fig. 9. Extensive cracking of the Cr–Ni–Si–W–C blocky phase observed adjacent toa Rockwell indent in the Ni–WC composite utilizing Alloy C.
Fig. 10. ASTM-G65 wear results for the Ni-alloys tested (wear results are for thesecond wear scar).
Fig. 12. Wear scars for Ni–WC composites utiliz
Fig. 11. Mean free path between WC particles, and ASTM-G65 wear results for theNi–WC overlays (wear results are for the second wear scar).
4. Discussion
4.1. Microstructure
Dissolution of the primary tungsten carbide particles was clearlyobserved after PTAW and this resulted in the formation of sec-ondary phases bearing W, C, Cr, as well as Ni and Si when thechemistry increased in Cr and Si. Alloy A contained very few sec-ondary phases formed from dissolved WC since the dissolution waslimited to less than 4%. Some phases also appeared to be slightlyenriched in W that also contained Fe, and Si in solution. These
phases containing Fe and Si were found in the MMC overlay involv-ing Alloy A, and suggesting they have a high affinity for dissolvedtungsten in the composite alloys. The secondary phase containeding (a) Alloy A, (b) Alloy B, and (c) Alloy C.

352 T. Liyanage et al. / Wear 274– 275 (2012) 345– 354
CltgCcvoqnat
ppude
Fig. 13. Calculated Scheil plot for Alloy A.
r, W, and C in the case of Alloy B and formed at the periphery out-ining the primary tungsten carbides and was quantified by AESo be about C6Cr7W3. Based on the C–Cr–W ternary phase dia-ram, the intermetallic phases expected in this system are C3Cr6W,4Cr2W3, and possibly C3Cr5W. Although there may be some inac-uracy in the quantification of carbon which makes it difficult toerify which of these ternary phases are actually observed, the ratiof Cr to W is not consistent with the equilibrium phases. Conse-uently, it is possible that the observed C–Cr–W ternary phase is aon-equilibrium (meta-stable) precipitate. It is not likely that this isctually a M7C3, where M is comprised of Cr or W since the C–Cr–Wernary particle was observed in both Alloys B and C.
In the case of Alloy C, the secondary phases formed a large blockyhase and contained Cr, W, C, Ni, and Si. A similar W–Cr–Ni–Sihase was also detected in the case of Ni–WC overlay deposits made
sing gas metal arc welding, however, carbon may not have beenetected in that study due to the use of EDX which is not sensitivenough to quantify C without significant error [21]. In addition,Fig. 14. Calculated Scheil plot for Alloy B.
Fig. 15. Calculated Scheil plot for Alloy C.
laser remelted NiCrBSi + WC alloy analyzed by EDS also revealedthat some secondary phases had W, Ni, Cr, Si as well as possiblyother elements that were not reliably detected by EDS [7]. Using AEShowever, this blocky secondary phase was quantified and found tohave a stoichiometric formula of about Ni4Cr5Si2W4C4.5. It shouldbe noted that although this phase appears to nucleate from the WCparticles in the micrographs, is more likely to have grown from liq-uid phase in between the WC particles during solidification, sincethese are rather coarse and the time for solid state nucleation andgrowth is limited during cooling. Based on the morphology andsmall gradients in the chemistry across these particles, it appearsthese have grown as single crystals. Evidence of this is visible inthe EPMA map of W in Fig. 7 where there appears to be segregationof elements outward from a central point which is away from theWC particle, and the gradient in W chemistry follows the angulargeometry of the particle boundary. Similarly, fine dendrites in thematrix of other Ni–WC composites were attributed to the formationof numerous primary mixed carbides in the melt which then pro-vided heterogeneous sites for the nucleation of the �-nickel phase[24].
In comparison, when several Ni-base alloys with WC parti-cles were deposited by laser on steel substrates so that the weldpool surface exceeded 3273 K and the alloy/substrate temperaturewas about 1788 K, very little dissolution of the WC particles wasobserved however they would dissolve completely if the W and Cconcentrations in the bulk alloy are reduced [12]. Thermodynamiccalculations suggested that the terminal solidification temperaturewould be about 1617 K and could contain austenite, WC particles,and graphite once solidified. It was also suggested that at slowerlaser traveling speeds, enrichment of the interparticle region withcarbon from dissolved WC results in the eutectic formation ofaustenite and carbide from liquid [12].
4.2. Hardness and wear resistance
The average Rockwell hardness of alloys A and B increased dueto the fraction of WC reinforcing particles in the deposited overlay,however that of Alloy C actually decreased marginally when WC
was present. However, one should consider that the volume frac-tion of WC was much lower when using Alloy C, and that when thealloy is deposited it contains a large fraction of Cr-borides and Cr-carbides which have hardness values ranging from 1250 to 2300 HV
ar 274
[aWmt
tbasihsiarp
cidwctetsreaarmtp
W(irtwcdAramlF
ablacbteeeb
rop
T. Liyanage et al. / We
23], some of which are harder than WC. Hardness testing of Alloy Clso revealed that the blocky secondary phases formed only whenC is present were brittle and promoted surface cracking, and thisay contribute to the lower Rockwell hardness value observed in
he composite.In an abrasive wear situation, the load is transferred mostly
o the reinforcing particles since any of the softer matrix phaseetween particles would either be gouged out or plastically deformway from the abrading surface/particles [7]. If the hard phasetructures in the composite coatings form a load support system,t limits the amount of stress imposed on individual particles andence ensures the particles are not at their mechanical and adhe-ive limits [7,25]. When a particularly hard matrix material is used,t may not be able to absorb energy during impacts with the largerbrasive particles [26] and this leads to chipping and acceleratedemoval of the matrix. This can ultimately lead to the reinforcingarticles decohering from the matrix and being removed.
The relative size of abrasive particles to the reinforcing parti-les and their spacing in the metal matrix of an MMC also has annfluence on wear resistance. Wear in the 3-body loading situationuring ASTM G65 testing mainly results from the loss of matrixhen the abrasive particles are small (low stress abrasion), while it
ould result more from microcracking and particle pull-out whenhe abrasive particles are large (high stress abrasion) [26]. How-ver, a size ratio around 1:1 (for the reinforcing particle relative tohe abrasive particle) could facilitate the penetration of the abra-ive particles into the matrix to damage both the matrix and theeinforcement, thus enhancing the wear attack [26]. For the alloysxamined, the WC particles were up to 180 �m in size with anverage size of 100 �m and the sand particles were between 212nd 300 �m, and so the WC particle size versus abrasive size ratioanges from approximately 1:1 to 1:2. As such the mechanisms ofatrix damage, microcracking, and particle pull-out were expected
o be the major causes of wear, although little evidence of particleull-out was found in this study.
In the case of Ni–WC deposits which exhibited a high level ofC dissolution (e.g. Alloy C), there is a higher mean free path
129.5 ± 60 �m) between particles. Considering the sand size used,t is possible for silica abrasive to fit between the WC particles andeadily gouge out the metal matrix. Fig. 11 shows a direct correla-ion between the mean free path (between WC particles) and theear rate, in which the wear rate dramatically increases when a
ritical mean free path is exceeded (Alloy C). The much wider stan-ard deviation observed in the mean free path observed when usinglloy C results in a far greater surface area of the matrix mate-ial being exposed to the sand particles. Considering the geometryspect of the mean free path, coupled with the fact that the matrixaterial in the Ni–WC composite made using Alloy C contained a
arge volume of the brittle 5-component phase (demonstrated byig. 9), it is not surprising that its wear rate was so drastically higher.
Another aspect of abrasive wear in these composites is that once portion of the matrix is removed, the sand is also able to slideetween and impact the sides of the WC particles, leading to shear
oads being imposed on the WC particles which promoted fractures shown in Fig. 12c. Shear loading is detrimental to the WC parti-les, leading to increased fracture since ceramics generally performetter under compressive loads. This explains why Ni–WC overlayshat exhibit higher WC dissolution did not perform as well as thosexperiencing minimal WC dissolution. Chipping of the WC particledges can occur in all overlays regardless of WC dissolution, how-ver it was clearly more prevalent when the dissolution is highased on the surface appearance of the WC particles in Alloy C.
The toughness of the overlays has some influence on the wearesistance, particularly in high stress abrasion since the formationf ductile primary Ni-dentrites in the matrix allows the overlay tolastically deform and absorb impact during abrassive wear. The
– 275 (2012) 345– 354 353
overlays produced with a high hardness metal matrix have a lowerfraction of primary Ni-dendrite, and mainly comprise brittle inter-dentritic phases which reduce the potential impact absorption. Forexample, it is worth noting that the uppermost crack highlighted inFig. 9 propagates throught the brittle 5-component phase, howeverthe primary Ni-dendrites to the left of this phase are not crackedand have obstructured the crack path. The more abundant inter-dendritic material undergoes brittle failure and is worn away toexpose the edges of the WC particles to impacts by the abrasivemedia.
It has been suggested that secondary phases which form as aresult of dissolution around the reinforcing WC phase aid in wearresistance as they bind the WC particles more strongly to the matrixand prevent particle pull out [14,27]. However, analysis of wearscars by SEM did not show evidence of particle pull-out in thewear scars examined for any of the overlays examined. As such, thereinforcement-matrix interface strength does not appear to havea major influence on the wear performance in the MMC depositsconsidered in this study.
4.3. Thermodynamic modeling
Thermodynamic modeling of the alloy systems suggested thatthe stability of the WC phase was reduced as alloying elements(particularly Cr) was increased in Alloys B and C, and this correlatedwell with the WC fraction measurements. Dissolution of WC parti-cles was highest in the Cr-containing alloys (B and C) and is likely aresult of: (a) WC being stable down to a lower temperature in theCr-free alloy, (b) the WC starting to solidify at a lower temperaturein the Cr-free alloy, and (c) the precipitation of high melting tem-perature phases such as Cr-carbides and Cr-borides being preferredover WC. The reprecipitation of WC was also predicted to occur at1844 K in recent ThermoCalc modeling of the laser cladding process[12].
In the Cr-free alloy, WC as well as the primary Ni-dendrites startto solidify at a lower temperature, which facilitates the applicationof lower heat input values into the weld and reduces the disso-lution. Solidification continues to a lower temperature in Alloy Acompared to Alloys B and C, along with less competition for thecarbon to form from other carbides. In the case of Alloys B and C,there are many more high melting temperature phases incorporat-ing carbon, boron, and silicon relative to the Cr-free alloy, and thisresults in an increased solid fraction that may require higher heatinput needed to maintain a low viscosity weld pool during welding.It was noted that the higher Cr content alloys were more difficultto promote wetting with the steel substrate during deposition.
Based on the observed results, the fundamental issue whichleads to severe wear in WC composite overlays is the replacementof WC by other carbides or phases with inferior properties. This ispredicted by the thermodynamic modeling, which shows that thetemperature range for stability of the WC is reduced when alloyingadditions such as Cr and Fe are made to the Ni-alloy matrix, whichreduces the volume fraction of WC in the overlay and promotesformation of brittle phases in the metal matrix.
5. Conclusions
The Ni–WC composite overlays examined showed similarmicrostructures and phases to that of the matrix alloys, howeverthere were also other secondary phases that formed during deposi-tion as a result of WC particle dissolution. A Cr-free alloy (Alloy A)
exhibited little dissolution of WC, while the addition of approx-imately 8% Cr to the matrix (Alloy B) promoted dissolution ofWC and the formation of small secondary carbides (approximatelyCr7W3C6). When high values of Cr are added to the matrix alloy
3 ar 274
(ci
siotshbaioo
A
aR
R
[
[
[
[
[
[
[
[
[
[
[[
[
[
[
[
[
54 T. Liyanage et al. / We
nearly 14% in Alloy C), significant fractions of brittle secondaryarbides with stoichiometry around Ni4Cr5Si2W4C4.5 were precip-tated after WC dissolution.
The average Rockwell hardness of the Ni-alloys increased moreignificantly with the addition of WC particles when the Ni-alloynitially has a hardness <50 HRc. In terms of wear loss, the MMCverlays were from two to five times more wear resistant thanhe matrix alloys without the WC particles. The MMCs with theofter matrix alloys generally performed better than those withard matrix alloys. It is suggested that this is due to the presence ofrittle secondary phases, less energy absorption by the matrix, and
larger mean free path between WC particles (due to dissolution)n the MMC overlays when Cr-rich Ni-alloys are used. Particle pull-ut, which has been observed in previous studies, was not widelybserved in the wear samples examined.
cknowledgements
The authors wish to thank the support of the Natural Sciencesnd Engineering Council (NSERC) of Canada, and the Alberta Energyesearch Institute (AERI).
eferences
[1] D.J. Branagan, M.C. Marshall, B.E. Meacham, High toughness high hardness ironbased PTAW weld materials, Materials Science and Engineering: A 428 (2006)116–123.
[2] E. Badisch, M. Kirchgaßner, Influence of welding parameters on microstruc-ture and wear behaviour of a typical NiCrBSi hardfacing alloy reinforced withtungsten carbide, Surface and Coatings Technology 202 (2008) 6016–6022.
[3] J.F. Flores, A. Neville, N. Kapur, A. Gnanavelu, An experimental study of theerosion-corrosion behavior of plasma transferred arc MMCs, Wear 267 (2009)213–222.
[4] K. Van Acker, D. Vanhoyweghen, R. Persoons, J. Vangrunderbeek, Influence oftungsten carbide particle size and distribution on the wear resistance of laserclad WC/Ni coatings, Wear 258 (2005) 194–202.
[5] H.-J. Kim, S.-Y. Hwang, C.-H. Lee, P. Juvanon, Assessment of wear performanceof flame sprayed and fused Ni-based coatings, Surface and Coatings Technology172 (2003) 262–269.
[6] N.Y. Sari, M. Yilmaz, Improvement of wear resistance of wire drawing rolls withCr–Ni–B–Si+WC thermal spraying powders, Surface and Coatings Technology
202 (2008) 3136–3141.[7] H. Wang, W. Xia, Y. Jin, A study on abrasive resistance of Ni-based coatings witha WC hard phase, Wear 195 (1996) 47–52.
[8] W. Cerri, R. Martinella, G.P. Mor, P. Bianchi, D.D. Angelo, Laser deposition ofcarbide-reinforced coatings, Surface and Coatings Technology 49 (1991) 40–45.
[
– 275 (2012) 345– 354
[9] J. Nurminen, J. Näkki, P. Vuoristo, Microstructure and properties of hard andwear resistant MMC coatings deposited by laser cladding, International Journalof Refractory Metals and Hard Materials 27 (2009) 472–478.
10] K.W.D. Hart, D.H. Harper, M.J. Gill, Case studies in wear resistance using HVOF,PTAW and Spray Fusion surfacing, in: 1st International Thermal Spray Con-ference, Materials Park, OH, ASM International, Montreal, Canada, 2000, pp.1117–1125.
11] A. Klimpel, A. Lisiecki, A. St. Klimpel, A. Rzeznikiewicz, Robotized GMA surfacingof cermetal deposits, Journal of Achievements in Materials and ManufacturingEngineering 18 (2006) 4.
12] S. Babu, S. David, R. Martukanitz, K. Parks, Toward prediction of microstructuralevolution during laser surface alloying, Metallurgical and Materials Transac-tions A 33 (2002) 1189–1200.
13] R.C. Gassmann, Laser cladding with (WCW2C)/CoCrC and (WCW2C)/NiBSicomposites for enhanced abrasive wear resistance, Materials Science and Tech-nology 12 (1996) 691–696.
14] C. Just, E. Badisch, J. Wosik, Influence of welding current on carbide/matrixinterface properties in MMCs, Journal of Materials Processing Technology 210(2010) 408–414.
15] Q. Li, T.C. Lei, W.Z. Chen, Microstructural characterization of WCp reinforcedNi–Cr–B–Si–C composite coatings, Surface and Coatings Technology 114 (1999)285–291.
16] I.C. Grigorescu, C. Di Rauso, R. Drira-Halouani, B. Lavelle, R. Di Giampaolo, J. Lira,Phase characterization in Ni alloy-hard carbide composites for fused coatings,Surface and Coatings Technology 76–77 (1995) 494–498.
17] V. Stoica, R. Ahmed, T. Itsukaichi, Influence of heat-treatment on the slidingwear of thermal spray cermet coatings, Surface and Coatings Technology 199(2005) 7–21.
18] S.W. Huang, M. Samandi, M. Brandt, Abrasive wear performanceand microstructure of laser clad WC/Ni layers, Wear 256 (2004)1095–1105.
19] J. Przybylowicz, J. Kusinski, Structure of laser cladded tungsten carbide compos-ite coatings, Journal of Materials Processing Technology 109 (2001) 154–160.
20] N.P. Suh, Tribophysics, Prentice-Hall, New Jersey, 1986.21] T. Wolfe, Chemical and Materials Engineering, University of Alberta, Edmonton,
Canada, 2010.22] E. Lassner, W.D. Schubert, TUNGSTEN: Properties, Chemistry, Technology of the
Element, Alloys and Chemical Compounds, Kluwer Academic/Plenum Publish-ers, New York, 1990.
23] T. Liyanage, G. Fisher, A.P. Gerlich, Influence of alloy chemistry on microstruc-ture and properties in NiCrBSi overlay coatings deposited by plasmatransferred arc welding (PTAW), Surface and Coatings Technology 205 (2010)759–765.
24] L.C. Lim, Q. Ming, Z.D. Chen, Microstructures of laser-clad nickel-based hard-facing alloys, Surface and Coatings Technology 106 (1998) 183–192.
25] S. Bahadur, C.-N. Yang, Friction and wear behavior of tungsten and titaniumcarbide coatings, Wear 196 (1996) 156–163.
26] J. Hu, D.Y. Li, R. Llewellyn, Synergistic effects of microstructure and abrasion
condition on abrasive wear of composites – A modeling study, Wear 263 (2007)218–227.27] M.J. Tobar, C. Álvarez, J.M. Amado, G. Rodríguez, A. Yánez, Morphology andcharacterization of laser clad composite NiCrBSi–WC coatings on stainless steel,Surface and Coatings Technology 200 (2006) 6313–6317.