Microstructured Hydroxyapatite Membranes for Ion … · 2016-03-25 · Microstructured...
130
Microstructured Hydroxyapatite Membranes for Ion Conducting and Orthopedic Applications by Keith Savino Submitted in Partial Fulfillment of the Requirements for the Degree Doctor of Philosophy Supervised by Professor Matthew Z. Yates Department of Chemical Engineering Arts, Science and Engineering Edmund A. Hajim School of Engineering and Applied Sciences University of Rochester Rochester, New York 2013
Transcript of Microstructured Hydroxyapatite Membranes for Ion … · 2016-03-25 · Microstructured...
Microstructured Hydroxyapatite Membranes
for Ion Conducting and Orthopedic Applications
by
Keith Savino
Submitted in Partial Fulfillment of the
Requirements for the Degree
Doctor of Philosophy
Supervised by Professor Matthew Z. Yates
Department of Chemical Engineering
Arts, Science and Engineering Edmund A. Hajim School of Engineering and Applied Sciences
University of Rochester Rochester, New York
2013
II
Biographical Sketch
The author was born in Rochester, New York on September 21, 1985. In 2004, he
graduated from Pittsford Sutherland High School with honors. In 2008, he received his Bachelor
of Science degree in Chemical Engineering and minor in mathematics from Clarkson University
in Potsdam, NY with honors. He came to the University of Rochester in the fall of 2008 as a PhD
candidate in the Department of Chemical Engineering under the supervision of Professor
Matthew Z. Yates. He received a Master of Science degree in Chemical Engineering in 2011.
Funding for the author’s stipend was provided by a Horton Fellowship from the University of
Rochester Laser Lab for Energetics. He was also awarded a one year Breadth fellowship in 2009-
2010 to teach a WRT 105 freshman composition course. In the summer of 2013, he participated
in an NSF I-Corps program to investigate the commercial potential for his research. His area of
research is focused on synthesizing and characterizing novel hydroxyapatite membranes for
potential applications such as electrets, sensors, fuel cells, piezoelectrics, and orthopedic
implants with antimicrobial properties.
III
Publications and Presentations
1) Savino, K., Gabrys, P., Gillespie, M., and M.Z. Yates. Electrochemical reduction of silver
nanoparticles onto hydroxyapatite films. In draft stages. 2) Savino, K. and M.Z. Yates. Improved thermal stability of fluoride doped hydroxyapatite
membranes. In draft stages. 3) Fu, C., Savino, K., Zeng, A., M.Z. Yates, Olvera, D., and Awad, H. Large stored charge in
electrochemically synthesized hydroxyapatite coatings. In draft stages. 4) Guan, B., Savino, K., and M.Z. Yates. Dense and highly textured ytterbium-doped
hydroxyapatite coatings. In draft stages. 5) NSF I-Corps final presentation of lessons learned from customer interviews. August 22, 2013. 6) Microanalytical Reference Materials topical conference,The Microanalysis Society. A New
Synthesis Method of Doped Hydroxyapatite Reference Materials. May 15, 2012. 7) Kong, B., Yu, J., Savino, K., Zhu, Y., and Guan, B. Synthesis of α-calcium sulfate hemihydrate
submicron-rods in water/n-hexanol/CTAB reverse microemulsion. Colloids and Surfaces A: Physicochemical and Engineering Aspects, 2012. 409: p. 88-93.
8) Wei, X., et al., Carbonated hydroxyapatite coatings with aligned crystal domains. Crystal
Growth & Design, 2012. 12: p. 3474-3480. 9) Wei, X., et al., Fully dense yttrium-substituted hydroxyapatite coatings with aligned crystal
domains. Crystal Growth & Design, 2012. 12: p. 217-223. 10) Liu, D., K. Savino, and M.Z. Yates, Coating of hydroxyapatite films on metal substrates by
seeded hydrothermal deposition. Surface and Coatings Technology, 2011. 205: p. 3975-3986.
11) Liu, D., K. Savino, and M.Z. Yates, Microstructural engineering of hydroxyapatite membranes
to enhance proton conductivity. Advanced Functional Materials, 2009. 19: p. 3941-3947.
IV
Acknowledgements
The work of this thesis was accomplished only because of the amazing support network
of friends, family, and colleagues I am blessed to have. My support network helped make
graduate school a time in my life for growth and enlightenment that I truly enjoyed. Foremost, I
would like to thank my advisor, Professor Matthew Z. Yates. Preparing this thesis has made me
realize how much I have learned in terms of specific technical knowledge, as well as the ability
to study broad and complex issues. The fact that I have grown so much in my years under his
supervision also highlights how little I knew when I started. I am forever grateful for him
entrusting a naïve first year student to take over this challenging project from his gifted
graduating PhD student, Dongxia Liu. His advising style gave me the freedom to grow as a
researcher and explore side projects that became the cornerstone of this work, yet he also
critiqued me enough so I would not stray too far from my goals. I would also like to thank my
committee members, Professor Jacob Jorne, Professor Paul Funkenbusch, and the committee
chair Professor Amy Lerner for their time, guidance, and feedback with my dissertation.
My family, as they are with everything I do in life, were instrumental in helping me
overcome the struggles that inherently come with being a PhD student. I am forever grateful for
my mom’s terrific meals and motherly insights to help me keep persevering. I appreciate my
sister Dani being a great role model as a hard worker who knows how to have fun, and a
constant friend who is always there for me no matter what, when, and where. And even though
my dad did not have the chance to see me attend the University of Rochester, his impact on my
life was great enough where he already gave me all the tools I need to be successful, in
particular bestowing on me a patient mindset and the ability to keep life in perspective.

V
Perhaps the biggest perk of being a graduate student is interacting daily with extremely
refined and well-rounded colleagues. I would like to thank the other graduate students in the
Yates lab, including Alex Lee, Dr. Sherry Tsai, Dr. Weisi Yin, Dr. Dongxia Liu, Dr. Xue Wei, Pavithra
Ramanarayanan, Professor Baohong Guan, Professor Aibin Zeng, Xuefei Zhang, Cong Fu, Boao
Song, Chaoyi Wan, and Wei Peng.
I would like to thank all of the undergraduates that I was fortunate to work with. While
they may have been in our lab for a learning experience, I feel that my interactions with them
helped me so much more, from getting extra experiments done, to questioning something I’ve
never thought of before, to being a social outlet to help the day go by a little better. I’d like to
thank Sean Rodrigues, Alex Pratt, Anna Couglin, Christian Basil, Rebecca Kelly, Mike Peritz, Ben
Seigal, Victoria Zapata, Zhekai Deng, Mikhail Gillespie, Samara Vilar Da Costa, and Paul Gabrys.
Various staff, students, and associates helped with specific projects or to just get
through the daily grind. I’d like to thank Jason Inzana, Professor Hani Awad, Diana Olvera, Jack
Daiss, and John Varrone for help in the medical center, John Hunt for composition analysis help,
Christine Pratt for XRD measurements, Brian McIntyre for SEM training, Nathan Cooley for fuel
cell testing help, John Miller at the machine shop, Dr. Joseph Bringley of Transparent Materials
for supplies, and all the ChemE secretaries for keeping the department afloat.
Finally, I’d like to thank Jim Bonafini for being a great mentor and offering me my first
job after graduating, David Bowen for all the emails and life insights, The John Ditullio Show for
making 3-6 PM more entertaining, my loyal and loving cat Luke for always being there no matter
what, the four V’s, most of my roommates for making life more entertaining, and finally any
family or friend who I am not specifically mentioning, you all know who you are, so thank you
for being you.
VI
Abstract
Hydroxyapatite (Ca5(PO4)3OH) is a highly studied material because of its similar
composition to bone and its ionic conducting capabilities. This thesis investigates a novel
electrochemical-hydrothermal synthesis method for depositing a hydroxyapatite membrane on
metal substrates. The deposited membrane is highly crystalline, oriented along the
crystallographic c-axis, which is perpendicular to the substrate, and is a uniform array of single
crystals. The novel synthesis method was modified by adding the dopants yttrium, ytterbium,
and fluoride during the hydrothermal synthesis. The thermal stability of the films was
characterized using scanning electron microscopy and X-ray diffraction. It was shown that
fluoride helped reduce dehydroxylation of the membrane at elevated temperatures. The stored
charge of yttrium-fluoride co-doped membranes was measured using the thermally stimulated
depolarization current test. The samples were shown to have extremely high stored charge
values even without electrical polarization. Ytterbium doped membranes were characterized
using scanning electron microscopy, energy-dispersive X-ray spectroscopy, and X-ray diffraction.
Conductivity tests were also performed using electrochemical impedance spectroscopy, as well
as fuel cell performance tests. Finally, a new method of electrochemically depositing silver
nanoparticles onto hydroxyapatite films was developed and characterized in order to make an
antimicrobial coating. Preliminary experiments with Staphylococcus aureus demonstrated the
silver coated sample’s ability to retard bacteria growth.
VII
Contributors and Funding Sources
This work was supervised by a dissertation committee consisting of the author’s advisor
Professor Matthew Z. Yates from the department of chemical engineering, Professor Jacob
Jorne from the department of chemical engineering, Professor Paul Funkenbusch from the
department of mechanical engineering, and the committee chair Professor Amy Lerner from the
department of biomedical engineering. Samples that were used for SEM and XRD analysis in
chapter 4 were prepared by visiting scholars Professor Baohong Guan and Aibin Zeng and led to
a paper in the draft stages as listed in Publications and Presentations. In chapter 5, some of the
silver coated hydroxyapatite samples were prepared by undergraduates Paul Gabrys and Mikhail
Gillespie and led to a paper in the draft stages as listed in Publications and Presentations. In
chapter 6, Samara Vilar Da Costa and Paul Gabrys helped prepare the coated screws and Mikhail
Gillespie helped prepare a hydroxyapatite coating with copper nanoparticles. Graduate study
was supported by the Horton Fellowship from the University of Rochester Laser Lab for
Energetics. A one year Breadth fellowship in 2009-2010 to teach a WRT 105 freshman
composition course was also awarded. Research grants were also provided by the NSF grant
“Surface Crystallization to Optimize Nanostructure of Proton Conductors in Hydrogen
Membrane Fuel Cells” NSF-CMMI award number 0856128, DOE grant DE-FG02-05ER15722, DOE
grant DE-FC03-92SF19460 through the Laboratory for Laser Energetics, a University of Rochester
Provost’s Multidisciplinary Research Award in collaboration with Professor Hani Awad’s group
in the orthopedics department, and a six month grant by the NSF I-Corps program, award
number 1343083.
VIII
Table of Contents
Biographical Sketch…………………………………………………………………………………………………………………….II
Publications and Presentations………………………………………………………………………………………………….III
Acknowledgements……………………………………………………………………………………………………………………IV
Abstract……………………………………………………………………………………………………………………………………..VI
Contributors and Funding Sources……………………………………………………………………………………………VII
Table of Contents…………………………………………………………………………………………………………………….VIII
List of Tables………………………………………………………………………………………………………………………………XI
List of Figures……………………………………………………………………………………………………………………………XII
List of Abbreviations and Symbols………………………………………………………………………………………….XVI
Chapter 1. Introduction………………………………………………………………………………………………………1
1.1. Hydroxyapatite Background…………………………………………………………………………………….1
1.2. Hydroxyapatite Synthesis and Coating Methods………………………………………………………3
1.2.1. Electrochemical Deposition……………………………………………………………………..4
1.2.2. Hydrothermal Synthesis…………………………………………………………………………..5
1.2.3. Electrochemical-hydrothermal Synthesis…………………………………………………6
1.3. Fuel Cell Background……………………………………………………………………………………………….7
1.3.1. Fuel Cell Components and Types……………………………………………………………..8
1.3.2. Fuel Cell Operation…………………………………………………………………………………..9
1.3.3. Thermodynamics and Performance……………………………………………………….10
1.3.4. Hydroxyapatite as an Intermediate Temperature Fuel Cell Electrolyte…..11
1.4. Polarizing Hydroxyapatite …………………………………………………………………………………….13
1.5. Reducing Orthopedic Implant Infections……………………………………………………………….15
IX
1.6. Research Objectives………………………………………………………………………………………………16
1.7. Thesis Outline………………………………………………………………………………………………………..16
References……………………………………………………………………………………………………………………18
Chapter 2. Improved Thermal Stability of Novel Hydroxyapatite Membranes via Fluoride
Doping................................................................................................................22
2.1. Introduction…………………………………………………………………………………………………….22
2.2. Experimental……………………………………………………………………………………………………23
2.3. Results and discussion……………………………………………………………………………………..26
2.4. Conclusions……………………………………………………………………………………………………..39
References…….……………………………………………………………………………………………………………..40
Chapter 3. Stored Charge Analysis of Yttrium-fluoride Co-doped Hydroxyapatite
Membranes……….……………………………………………………………………………………………42
3.1. Introduction…………………………………………………………………………………………………….42
3.2. Experimental……………………………………………………………………………………………………44
3.3. Results and discussion……………………………………………………………………………………..48
3.4. Conclusions……………………………………………………………………………………………………..59
References…………….……………………………………………………………………………………………………..60
Chapter 4. Characterization of Ytterbium and Ytterbium-fluorine Doped Hydroxyapatite
Membranes for Ion Conducting Applications…………………………………………………63
4.1. Introduction…………………………………………………………………………………………………….63
X
4.2. Experimental……………………………………………………………………………………………………67
4.3. Results and discussion……………………………………………………………………………………..72
4.4. Conclusions……………………………………………………………………………………………………..89
References…………….……………………………………………………………………………………………………..91
Chapter 5. Electrochemical Reduction of Silver Nanoparticles onto Hydroxyapatite
Films………………………………………………………………………………………………………………..94
5.1. Introduction…………………………………………………………………………………………………….94
5.2. Experimental……………………………………………………………………………………………………96
5.3. Results and discussion……………………………………………………………………………………..99
5.4. Conclusions……………………………………………………………………………………………………105
References…………….……………………………………………………………………………………………………106
Chapter 6. Conclusions and Future Work……………………………………………………………………….109
6.1. Conclusions………………………………………………………………………………………………………….109
6.2. Future Work………………………………………………………………………………………………………..111
References…………….……………………………………………………………………………………………………113
XI
List of Tables
Table Title Page
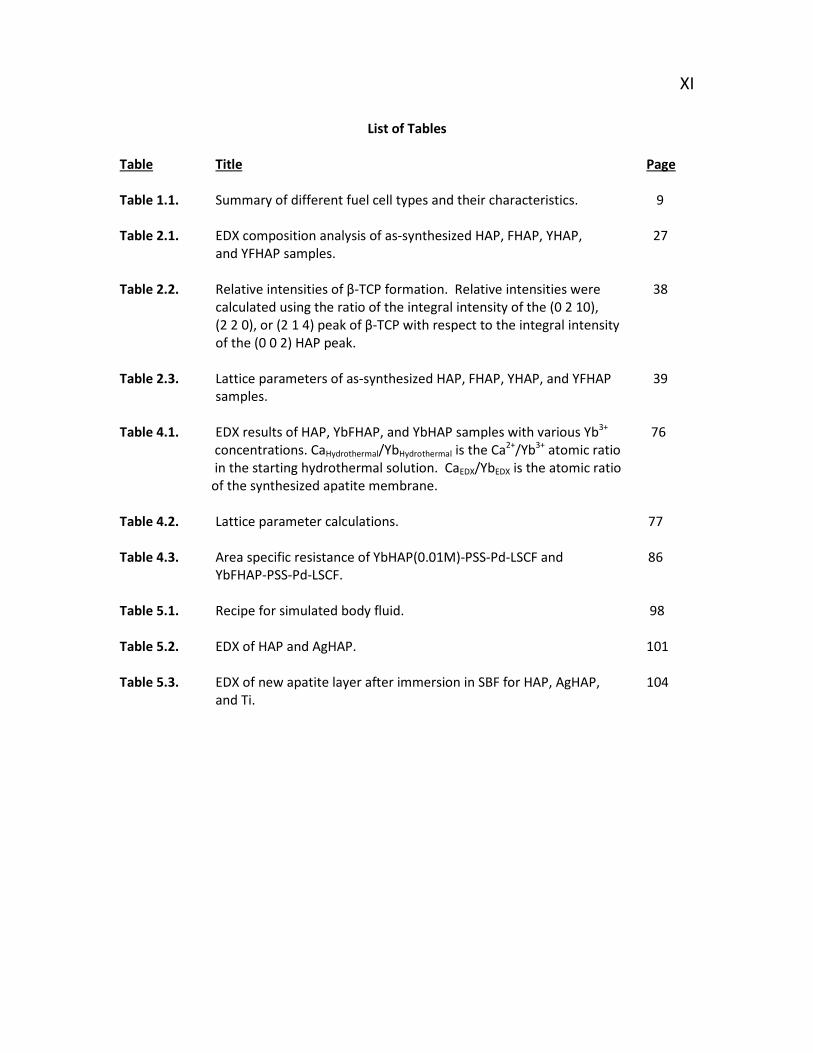
Table 1.1. Summary of different fuel cell types and their characteristics. 9
Table 2.1. EDX composition analysis of as-synthesized HAP, FHAP, YHAP, 27 and YFHAP samples.
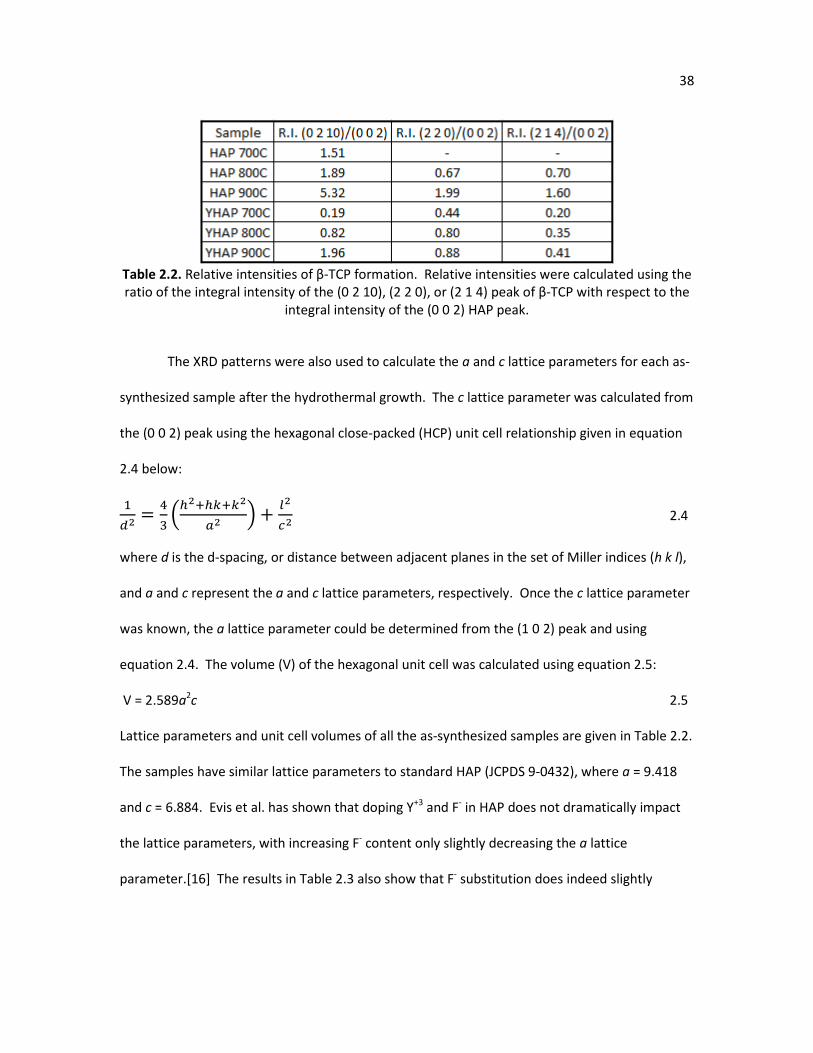
Table 2.2. Relative intensities of β-TCP formation. Relative intensities were 38 calculated using the ratio of the integral intensity of the (0 2 10), (2 2 0), or (2 1 4) peak of β-TCP with respect to the integral intensity of the (0 0 2) HAP peak.
Table 2.3. Lattice parameters of as-synthesized HAP, FHAP, YHAP, and YFHAP 39 samples.
Table 4.1. EDX results of HAP, YbFHAP, and YbHAP samples with various Yb3+ 76 concentrations. CaHydrothermal/YbHydrothermal is the Ca2+/Yb3+ atomic ratio in the starting hydrothermal solution. CaEDX/YbEDX is the atomic ratio of the synthesized apatite membrane. Table 4.2. Lattice parameter calculations. 77 Table 4.3. Area specific resistance of YbHAP(0.01M)-PSS-Pd-LSCF and 86
YbFHAP-PSS-Pd-LSCF. Table 5.1. Recipe for simulated body fluid. 98 Table 5.2. EDX of HAP and AgHAP. 101 Table 5.3. EDX of new apatite layer after immersion in SBF for HAP, AgHAP, 104
and Ti.
XII
List of Figures
Figure Title Page
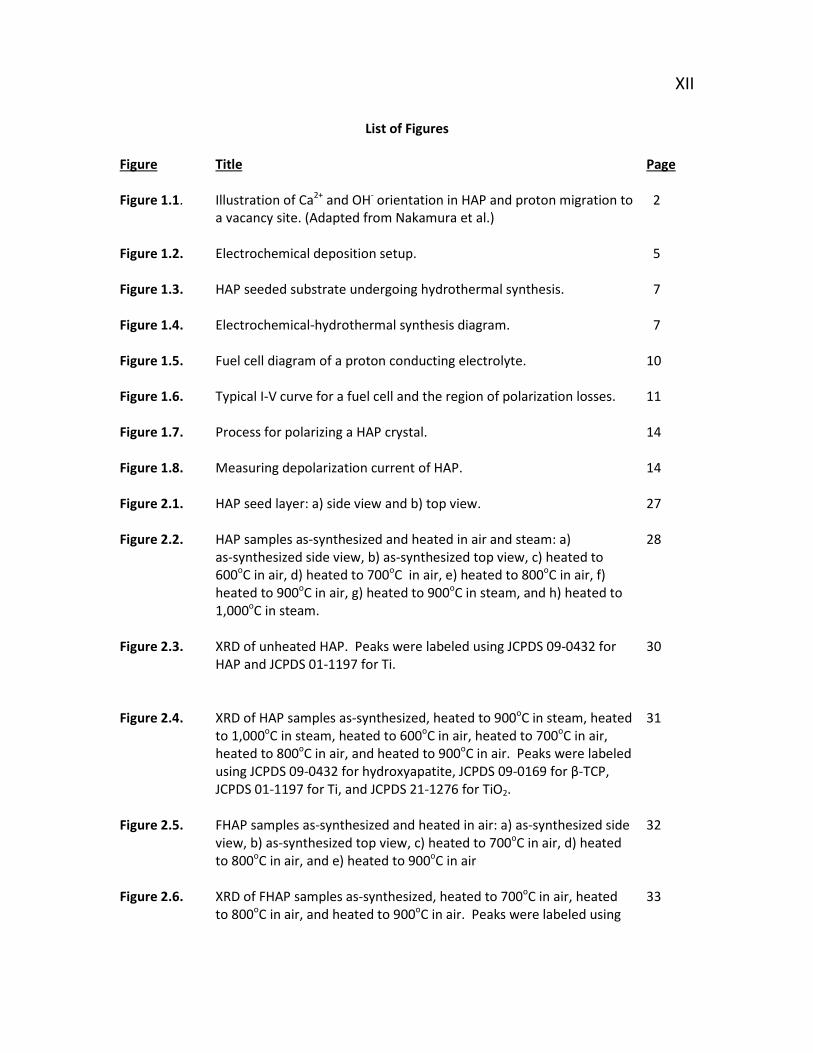
Figure 1.1. Illustration of Ca2+ and OH- orientation in HAP and proton migration to 2 a vacancy site. (Adapted from Nakamura et al.)
Figure 1.2. Electrochemical deposition setup. 5
Figure 1.3. HAP seeded substrate undergoing hydrothermal synthesis. 7 Figure 1.4. Electrochemical-hydrothermal synthesis diagram. 7
Figure 1.5. Fuel cell diagram of a proton conducting electrolyte. 10
Figure 1.6. Typical I-V curve for a fuel cell and the region of polarization losses. 11
Figure 1.7. Process for polarizing a HAP crystal. 14 Figure 1.8. Measuring depolarization current of HAP. 14 Figure 2.1. HAP seed layer: a) side view and b) top view. 27 Figure 2.2. HAP samples as-synthesized and heated in air and steam: a) 28
as-synthesized side view, b) as-synthesized top view, c) heated to 600oC in air, d) heated to 700oC in air, e) heated to 800oC in air, f) heated to 900oC in air, g) heated to 900oC in steam, and h) heated to 1,000oC in steam.
Figure 2.3. XRD of unheated HAP. Peaks were labeled using JCPDS 09-0432 for 30
HAP and JCPDS 01-1197 for Ti.
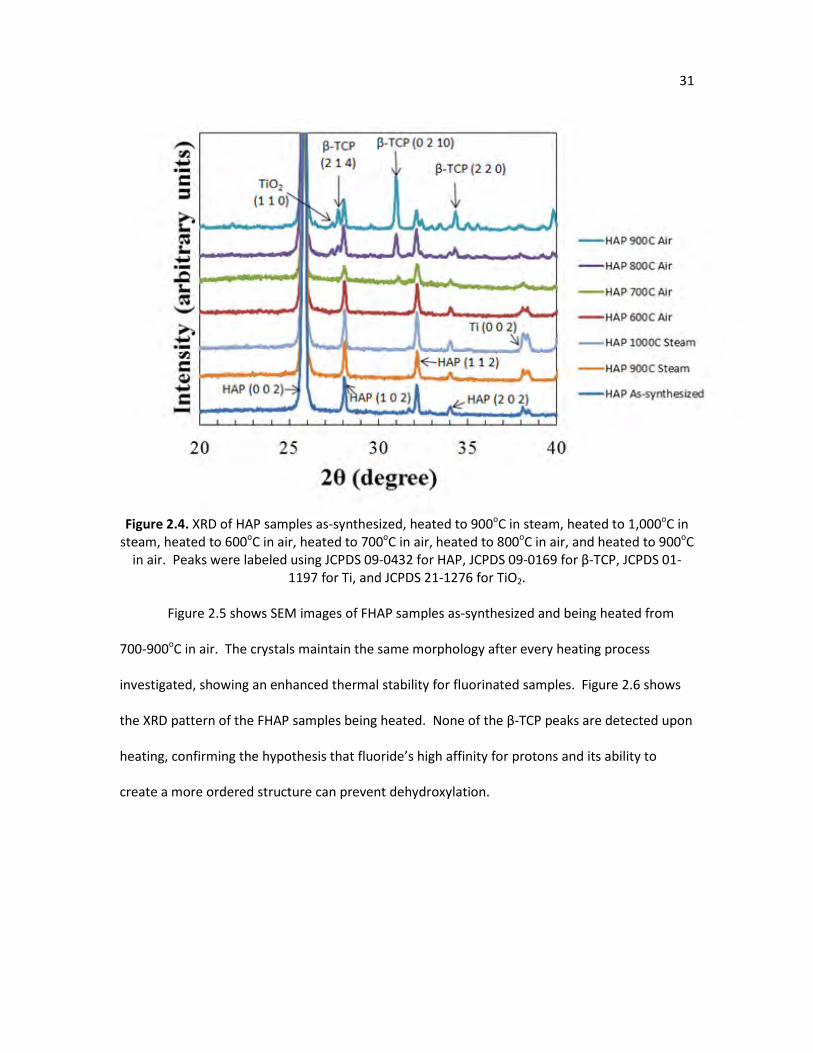
Figure 2.4. XRD of HAP samples as-synthesized, heated to 900oC in steam, heated 31 to 1,000oC in steam, heated to 600oC in air, heated to 700oC in air, heated to 800oC in air, and heated to 900oC in air. Peaks were labeled using JCPDS 09-0432 for hydroxyapatite, JCPDS 09-0169 for β-TCP, JCPDS 01-1197 for Ti, and JCPDS 21-1276 for TiO2.
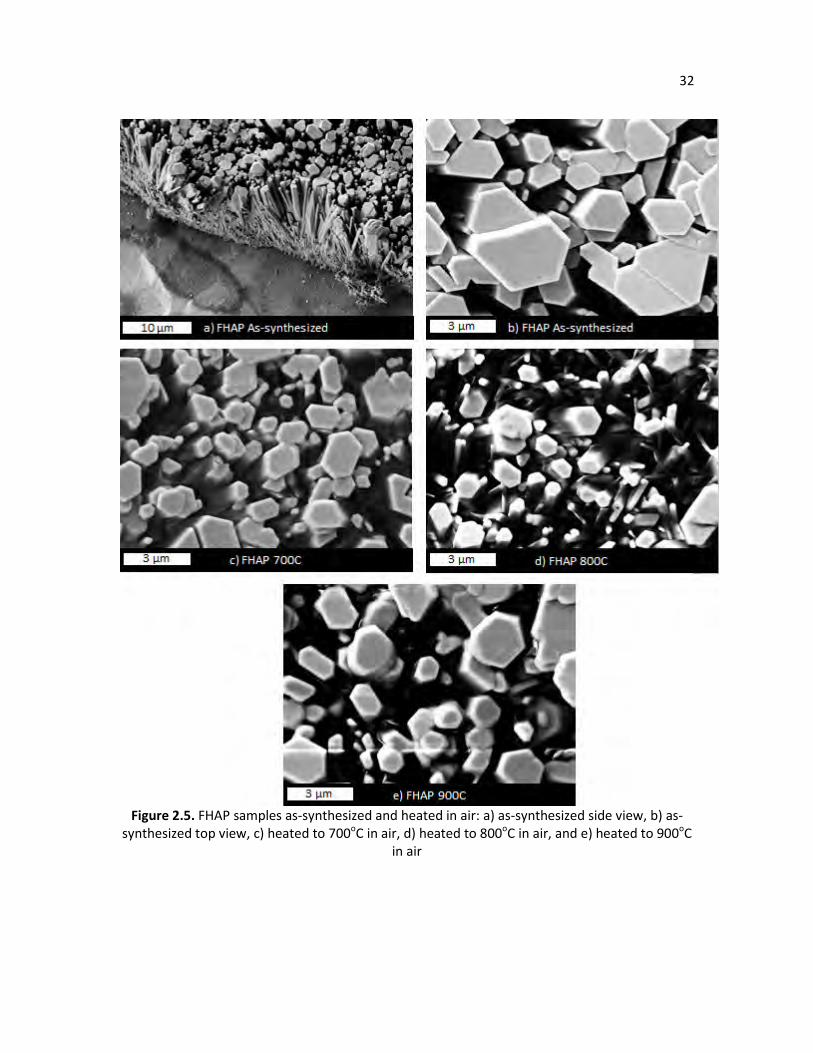
Figure 2.5. FHAP samples as-synthesized and heated in air: a) as-synthesized side 32
view, b) as-synthesized top view, c) heated to 700oC in air, d) heated to 800oC in air, and e) heated to 900oC in air
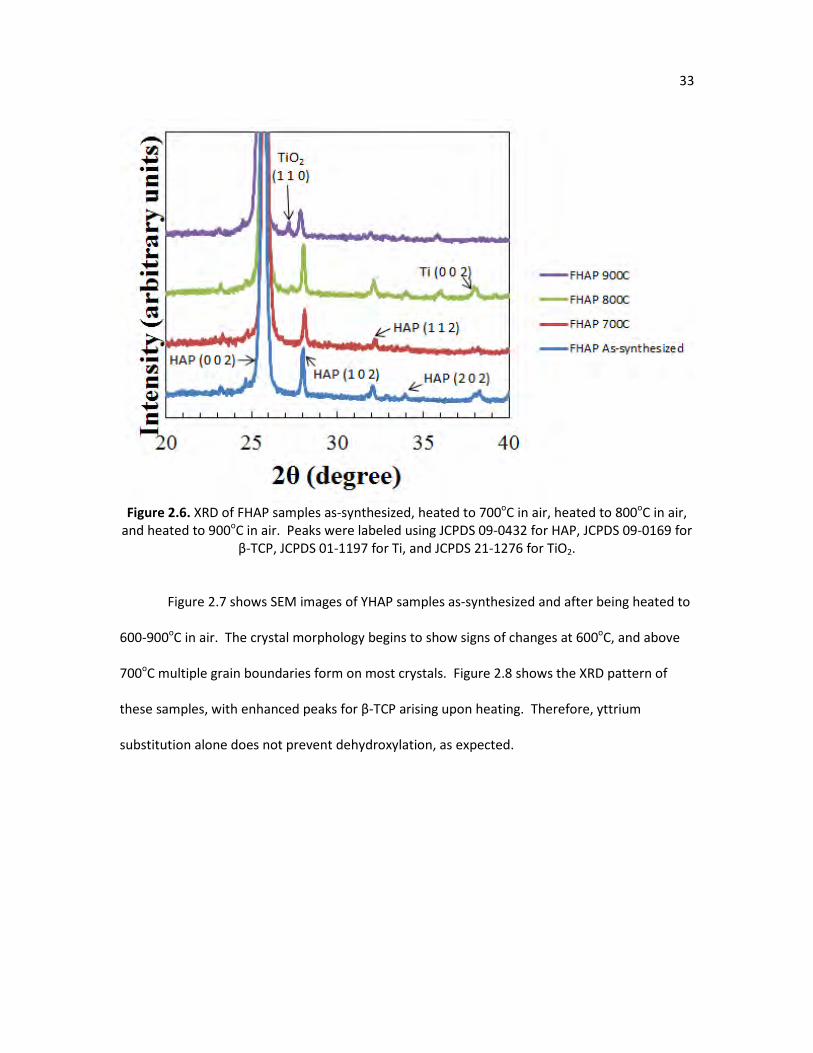
Figure 2.6. XRD of FHAP samples as-synthesized, heated to 700oC in air, heated 33
to 800oC in air, and heated to 900oC in air. Peaks were labeled using
XIII
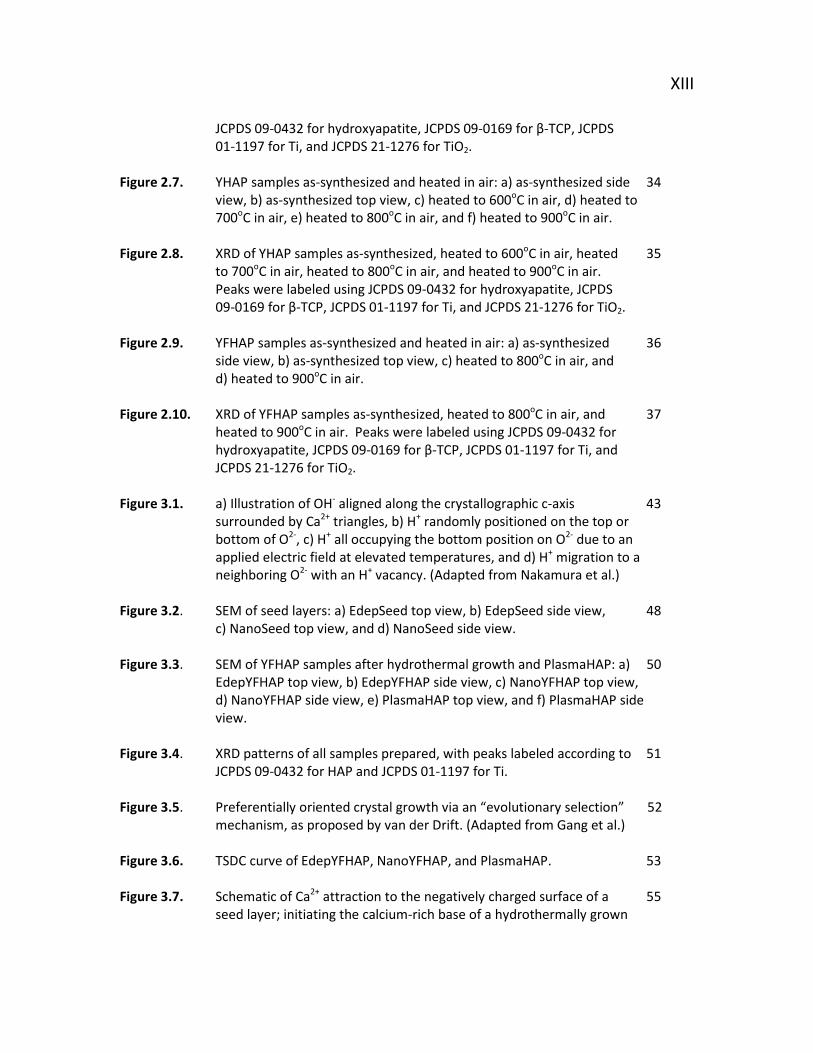
JCPDS 09-0432 for hydroxyapatite, JCPDS 09-0169 for β-TCP, JCPDS 01-1197 for Ti, and JCPDS 21-1276 for TiO2.
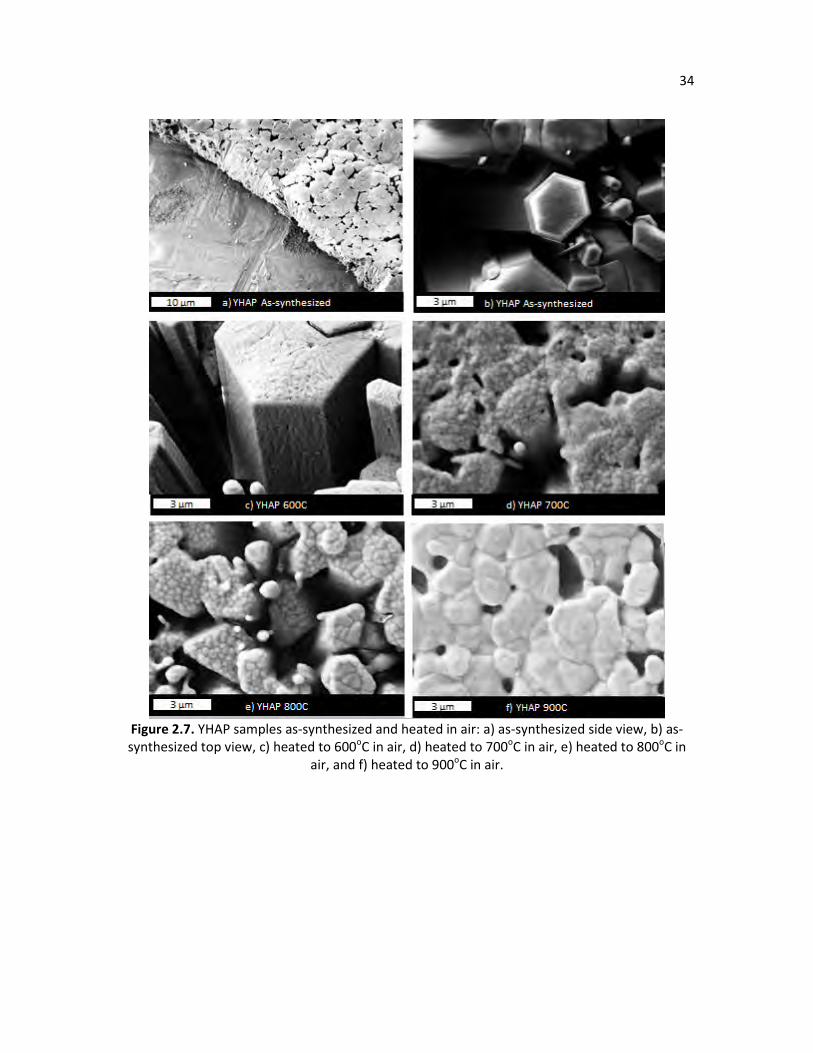
Figure 2.7. YHAP samples as-synthesized and heated in air: a) as-synthesized side 34
view, b) as-synthesized top view, c) heated to 600oC in air, d) heated to 700oC in air, e) heated to 800oC in air, and f) heated to 900oC in air.
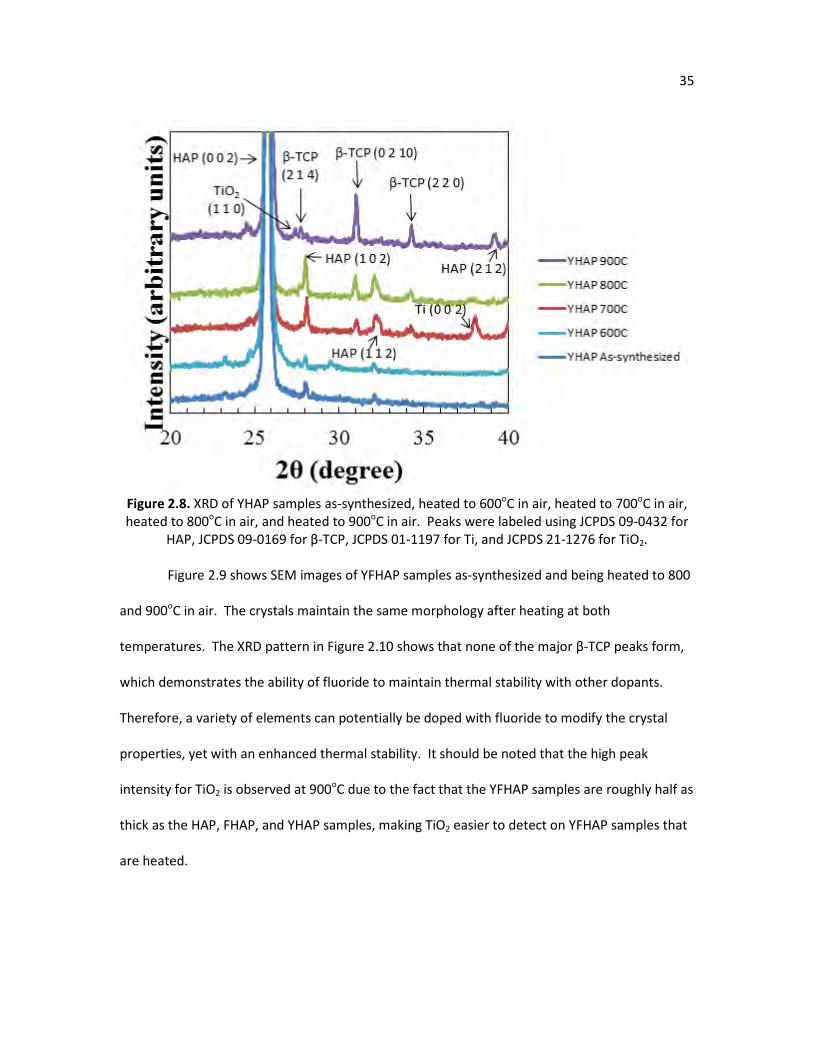
Figure 2.8. XRD of YHAP samples as-synthesized, heated to 600oC in air, heated 35 to 700oC in air, heated to 800oC in air, and heated to 900oC in air. Peaks were labeled using JCPDS 09-0432 for hydroxyapatite, JCPDS 09-0169 for β-TCP, JCPDS 01-1197 for Ti, and JCPDS 21-1276 for TiO2.
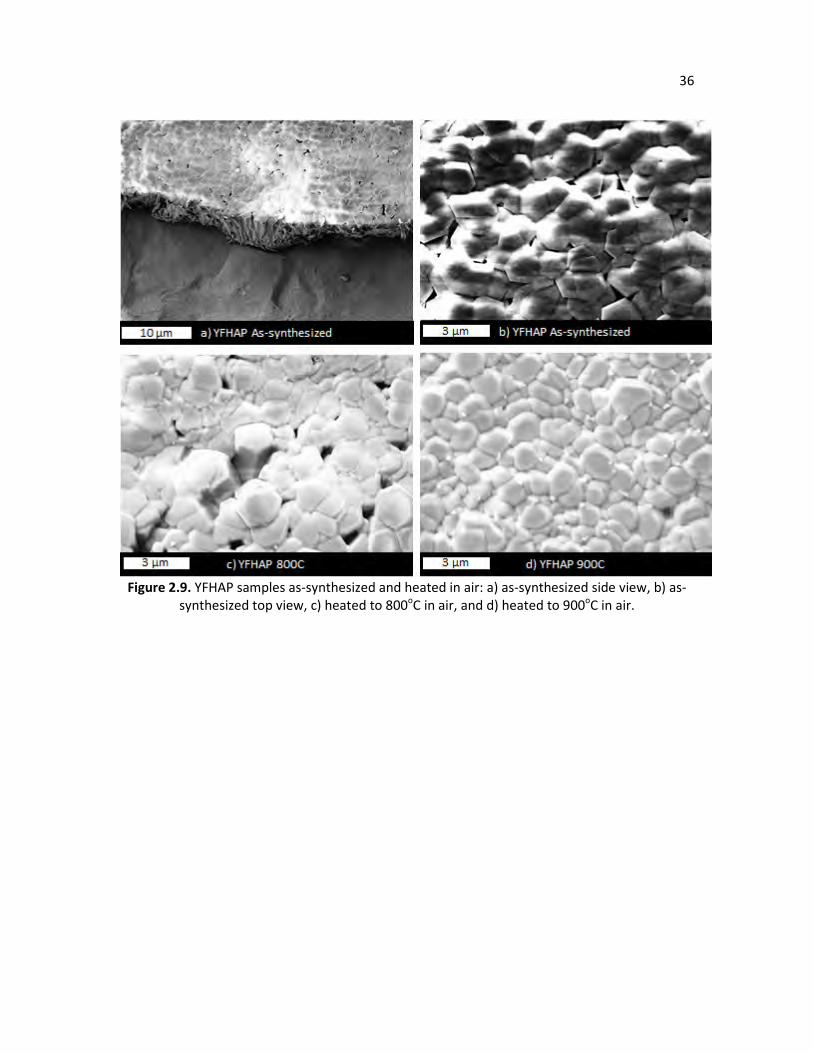
Figure 2.9. YFHAP samples as-synthesized and heated in air: a) as-synthesized 36 side view, b) as-synthesized top view, c) heated to 800oC in air, and d) heated to 900oC in air.
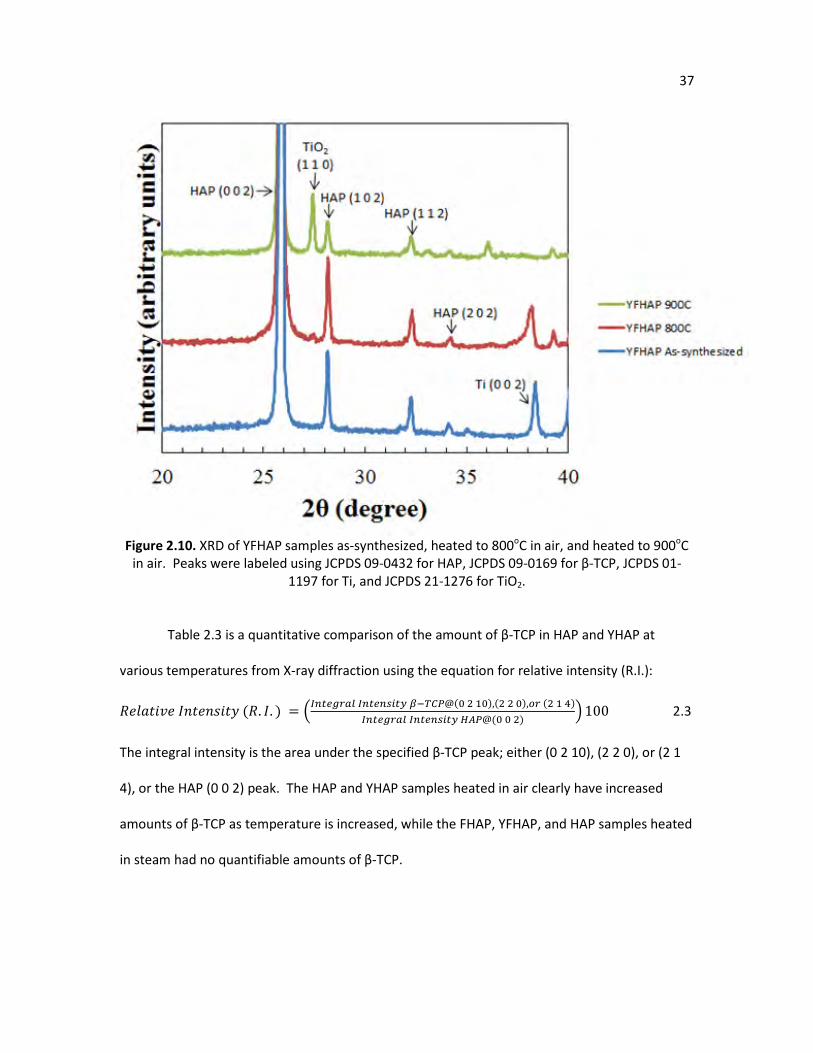
Figure 2.10. XRD of YFHAP samples as-synthesized, heated to 800oC in air, and 37
heated to 900oC in air. Peaks were labeled using JCPDS 09-0432 for hydroxyapatite, JCPDS 09-0169 for β-TCP, JCPDS 01-1197 for Ti, and JCPDS 21-1276 for TiO2.
Figure 3.1. a) Illustration of OH- aligned along the crystallographic c-axis 43 surrounded by Ca2+ triangles, b) H+ randomly positioned on the top or bottom of O2-, c) H+ all occupying the bottom position on O2- due to an applied electric field at elevated temperatures, and d) H+ migration to a neighboring O2- with an H+ vacancy. (Adapted from Nakamura et al.)
Figure 3.2. SEM of seed layers: a) EdepSeed top view, b) EdepSeed side view, 48
c) NanoSeed top view, and d) NanoSeed side view. Figure 3.3. SEM of YFHAP samples after hydrothermal growth and PlasmaHAP: a) 50
EdepYFHAP top view, b) EdepYFHAP side view, c) NanoYFHAP top view, d) NanoYFHAP side view, e) PlasmaHAP top view, and f) PlasmaHAP side view.
Figure 3.4. XRD patterns of all samples prepared, with peaks labeled according to 51
JCPDS 09-0432 for HAP and JCPDS 01-1197 for Ti. Figure 3.5. Preferentially oriented crystal growth via an “evolutionary selection” 52
mechanism, as proposed by van der Drift. (Adapted from Gang et al.) Figure 3.6. TSDC curve of EdepYFHAP, NanoYFHAP, and PlasmaHAP. 53 Figure 3.7. Schematic of Ca2+ attraction to the negatively charged surface of a 55
seed layer; initiating the calcium-rich base of a hydrothermally grown
XIV
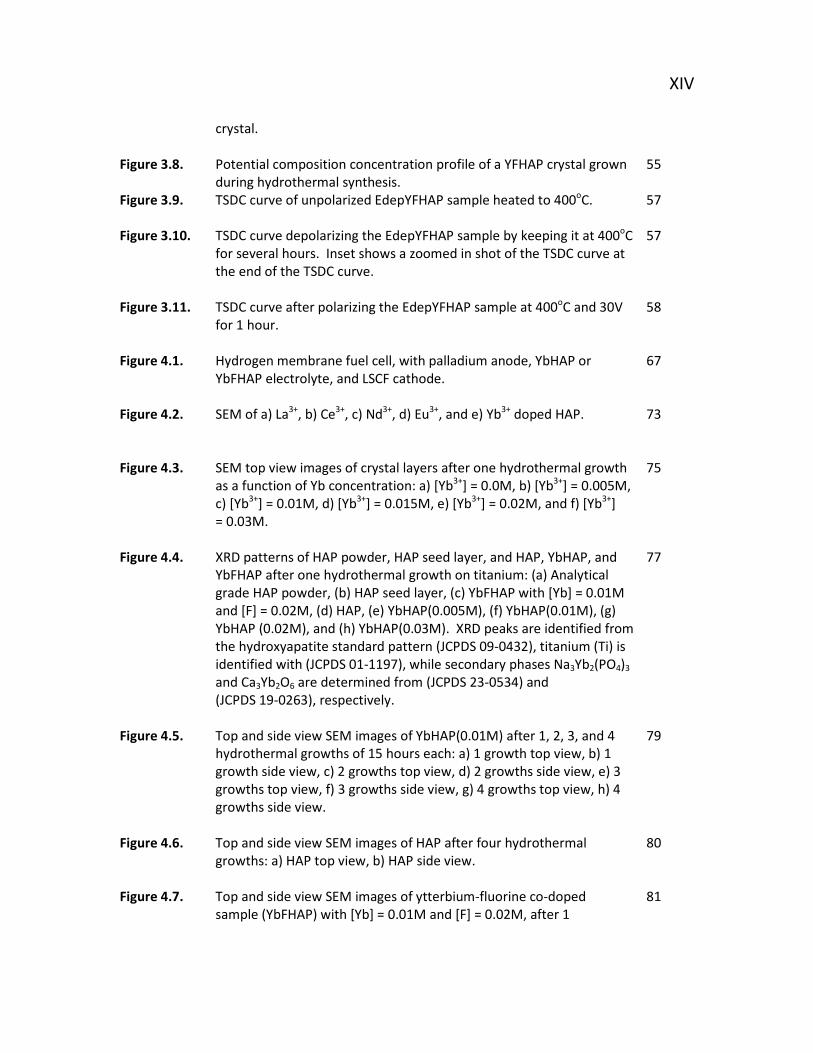
crystal. Figure 3.8. Potential composition concentration profile of a YFHAP crystal grown 55
during hydrothermal synthesis. Figure 3.9. TSDC curve of unpolarized EdepYFHAP sample heated to 400oC. 57 Figure 3.10. TSDC curve depolarizing the EdepYFHAP sample by keeping it at 400oC 57
for several hours. Inset shows a zoomed in shot of the TSDC curve at the end of the TSDC curve.
Figure 3.11. TSDC curve after polarizing the EdepYFHAP sample at 400oC and 30V 58
for 1 hour. Figure 4.1. Hydrogen membrane fuel cell, with palladium anode, YbHAP or 67
YbFHAP electrolyte, and LSCF cathode.
Figure 4.2. SEM of a) La3+, b) Ce3+, c) Nd3+, d) Eu3+, and e) Yb3+ doped HAP. 73
Figure 4.3. SEM top view images of crystal layers after one hydrothermal growth 75 as a function of Yb concentration: a) [Yb3+] = 0.0M, b) [Yb3+] = 0.005M, c) [Yb3+] = 0.01M, d) [Yb3+] = 0.015M, e) [Yb3+] = 0.02M, and f) [Yb3+] = 0.03M.
Figure 4.4. XRD patterns of HAP powder, HAP seed layer, and HAP, YbHAP, and 77
YbFHAP after one hydrothermal growth on titanium: (a) Analytical grade HAP powder, (b) HAP seed layer, (c) YbFHAP with [Yb] = 0.01M and [F] = 0.02M, (d) HAP, (e) YbHAP(0.005M), (f) YbHAP(0.01M), (g) YbHAP (0.02M), and (h) YbHAP(0.03M). XRD peaks are identified from the hydroxyapatite standard pattern (JCPDS 09-0432), titanium (Ti) is identified with (JCPDS 01-1197), while secondary phases Na3Yb2(PO4)3 and Ca3Yb2O6 are determined from (JCPDS 23-0534) and (JCPDS 19-0263), respectively.
Figure 4.5. Top and side view SEM images of YbHAP(0.01M) after 1, 2, 3, and 4 79
hydrothermal growths of 15 hours each: a) 1 growth top view, b) 1 growth side view, c) 2 growths top view, d) 2 growths side view, e) 3 growths top view, f) 3 growths side view, g) 4 growths top view, h) 4 growths side view.
Figure 4.6. Top and side view SEM images of HAP after four hydrothermal 80
growths: a) HAP top view, b) HAP side view. Figure 4.7. Top and side view SEM images of ytterbium-fluorine co-doped 81
sample (YbFHAP) with [Yb] = 0.01M and [F] = 0.02M, after 1
XV
hydrothermal growth and a fluoride doped sample (FHAP) with [F] = 0.02M, after 4 hydrothermal growths: a) YbFHAP top view, b) YbFHAP side view, c) FHAP top view, d) FHAP side view.
Figure 4.8. SEM images of porous stainless steel and palladium (Pd): a) Porous 82
stainless steel, zoomed in, b) Porous stainless steel, zoomed out, c) Pd on porous stainless steel, zoomed in, d) Pd on porous stainless steel, zoomed out.
Figure 4.9. Nyquist plots of YbHAP-PSS-Pd-LSCF from 400-700oC. 84
Figure 4.10. Nyquist plots of YbFHAP-PSS-Pd-LSCF from 400-700oC. 84
Figure 4.11. Arrhenius plot of YbHAP(0.01M)-PSS-Pd-LSCF and 85 YbFHAP-PSS-Pd-LSCF.
Figure 4.12. I-V and power curves of YbHAP(0.01M)-PSS-Pd-LSCF from 400-700oC. 88
Figure 4.13. I-V and power curves of YbFHAP-PSS-Pd-LSCF from 400-700oC. 89
Figure 5.1. SEM of a) HAP side view, b) HAP top view, c) AgHAP side view, d) 100 AgHAP top view, and e) AgHAP zoomed in.
Figure 5.2. EDX spectrum of AgHAP. 101 Figure 5.3. XRD of HAP and AgHAP. 102 Figure 5.4. SEM of new HAP growth after being immersed in SBF for 24 hours, a) 104
HAP after SBF immersion, b) AgHAP after SBF immersion, c) representative top view of samples in images a and b, and d) Ti after SBF immersion.
Figure 5.5. Growth of S. Aureus bacteria when exposed to AgHAP, HAP, and in 105
suspension. Figure 6.1. Electrochemically deposited hydroxyapatite coating on a titanium 111
dental screw. Figure 6.2. Electrochemical reduction of copper nanoparticles onto the HAP 112
seed layer.
XVI
List of Abbreviations and Symbols
AFM Atomic force microscopy ASR Area specific resistance At% Atomic percent C Coulomb cm Centimeter DI Deionized EDX Energy-dispersive X-ray spectroscopy EIS Electrochemical impedance spectroscopy FHAP Fluoride doped hydroxyapatite h Hour HAP Hydroxyapatite I-V Current-Voltage JCPDS Joint Committee on Powder Diffraction Standards LSCF La0.6Sr0.4Co0.2Fe0.8O3-x M Molar (mol/liter) mC Milicoulomb mg Miligram min Minute mL Mililiter MSC Mesenchymal stem cell nA Nanoamp nm Nanometer OCP Open circuit potential PEM Proton exchange membrane Pd Palladium PBS Phosphate buffered solution PSS Porous Stainless Steel S. aureus Staphylococcus aureus S/cm Sieman/centimeter SEM Scanning electron microscope SOFC Solid oxide fuel cell T Temperature TCP Tricalcium phosphate (Ca3(PO4)2) Ti Titanium TSDC Thermally stimulated depolarization current TTCP Tetracalcium phosphate (Ca4P2O9) V Volt XRD X-ray diffraction YbFHAP Ytterbium-fluoride co-doped hydroxyapatite

XVII
YbHAP Ytterbium doped hydroxyapatite YFHAP Yttrium-fluoride co-doped hydroxyapatite YHAP Yttrium doped hydroxyapatite YSZ Yttria-stabilized zirconia Å Angstrom β Heating rate (oC/minute) σ Conductivity (Siemen/cm) µg Microgram µl Microliter Ω Ohms µm Micrometer
1
Chapter 1
Introduction
1.1. Hydroxyapatite Background
Hydroxyapatite (Ca5(PO4)3OH, HAP) has been studied in a variety of applications such as
sensors, fuel cell electrolytes, filters, and electrets due to its unique electrical properties, as well
as a bone implant material and coating on orthopedic implants due to its similar composition to
bone and osteoconductive capabilities.[1-6] HAP belongs to the hexagonal P63/m space group,
with OH- ions forming one-dimensional chains parallel to the c-axis in the center of Ca2+
triangles.[7] At elevated temperatures (T > 300oC), protons can be conducted through
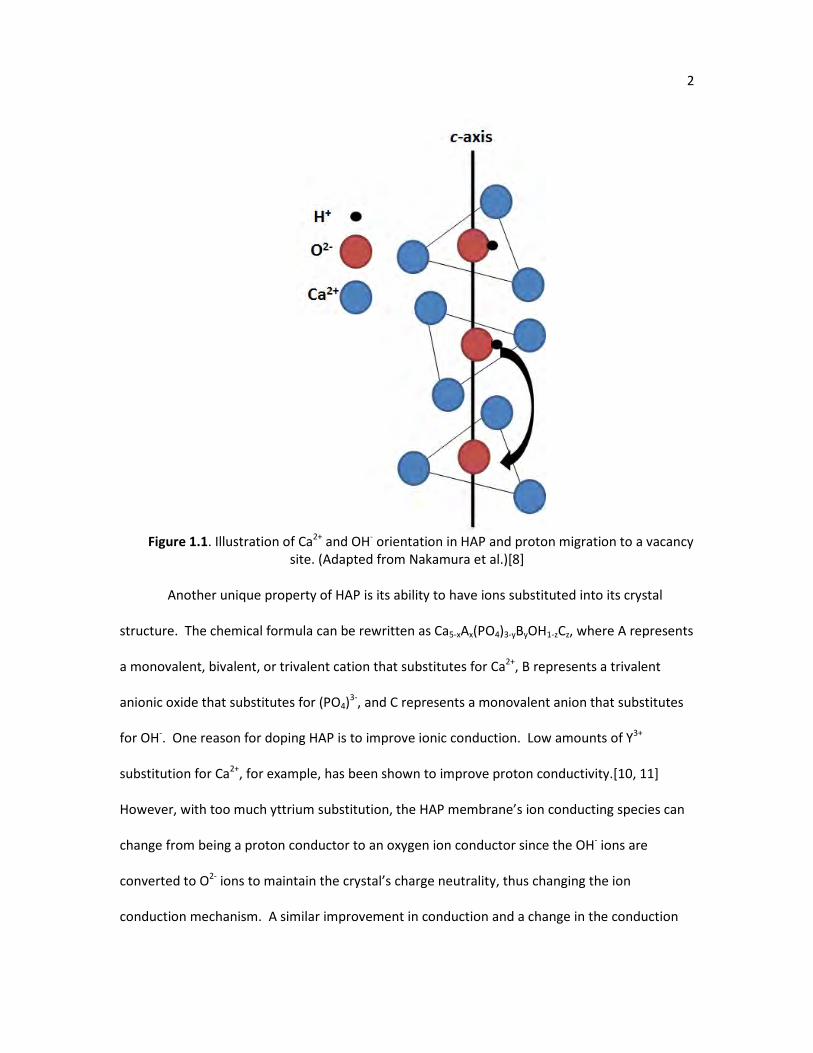
hydroxyapatite by rotating along hydroxyl end groups, as shown in Figure 1.1.[8] However,
while the ion conducting capabilities of HAP provide a unique platform for a variety of
technologies, the ability to exploit HAP’s ion conducting potential is limited since the
conductivity values are relatively low for HAP produced by traditional methods. Traditional HAP
films have grain boundaries within HAP crystals and high interfacial resistance between crystals,
causing conductivity values to be reduced.[9] Also, many HAP synthesis techniques produce
amorphous coatings, which further reduces proton conductivity since different calcium-
phosphate phases either have poor ionic conduction or have a different ion conduction
mechanism from HAP.
2
Figure 1.1. Illustration of Ca2+ and OH- orientation in HAP and proton migration to a vacancy
site. (Adapted from Nakamura et al.)[8]
Another unique property of HAP is its ability to have ions substituted into its crystal
structure. The chemical formula can be rewritten as Ca5-xAx(PO4)3-yByOH1-zCz, where A represents
a monovalent, bivalent, or trivalent cation that substitutes for Ca2+, B represents a trivalent
anionic oxide that substitutes for (PO4)3-, and C represents a monovalent anion that substitutes
for OH-. One reason for doping HAP is to improve ionic conduction. Low amounts of Y3+
substitution for Ca2+, for example, has been shown to improve proton conductivity.[10, 11]
However, with too much yttrium substitution, the HAP membrane’s ion conducting species can
change from being a proton conductor to an oxygen ion conductor since the OH- ions are
converted to O2- ions to maintain the crystal’s charge neutrality, thus changing the ion
conduction mechanism. A similar improvement in conduction and a change in the conduction
3
mechanism occurs when carbonate substitutes for PO43-.[12] Another reason to substitute HAP
with various ions is to modify its chemical and mechanical properties. Magnesium, strontium,
and carbonate are often substituted in order to make synthetic hydroxyapatite more similar in
composition to natural bone.[13-16] Fluoride is often added to improve dissolution properties,
thermal stability, and hardness.[14, 17-20] Fluoride has also been shown to stimulate
proliferation of bone cells, as well as prevent dental carries.[21]
1.2. Hydroxyapatite Synthesis and Coating Methods.
HAP is typically deposited onto a support substrate since HAP is a brittle material. Ideally, a
coating method would be able to control various film properties such as crystallinity,
composition, film thickness, crystal orientation, and porosity, while also utilizing inexpensive
equipment, be fast, scalable, and able to coat a variety of substrate compositions and
shapes.[22] Numerous coating techniques have been investigated to deposit hydroxyapatite
onto substrates. Thermal spraying is the most commonly used method for coating orthopedic
implants and has the benefit of a high deposition rate with control over the porosity, but the
films often have non-uniform crystallinity due to the high temperature of the spraying
process.[23] Sputter coating produces uniform films, but it is a slow deposition process and can
be costly.[23, 24] Sputter coating and thermal spraying are also line of sight techniques, making
uniform coatings on complex and porous substrates difficult. Other techniques such as sol-gel
coating and dip-coating require a high temperature sintering step to improve crystallinity.[23]
This sintering step can cause the HAP coating to crack, unwanted phase changes of the HAP
coating and substrate, and degradation of mechanical properties of the HAP coating and
substrate.
4
1.2.1. Electrochemical Deposition
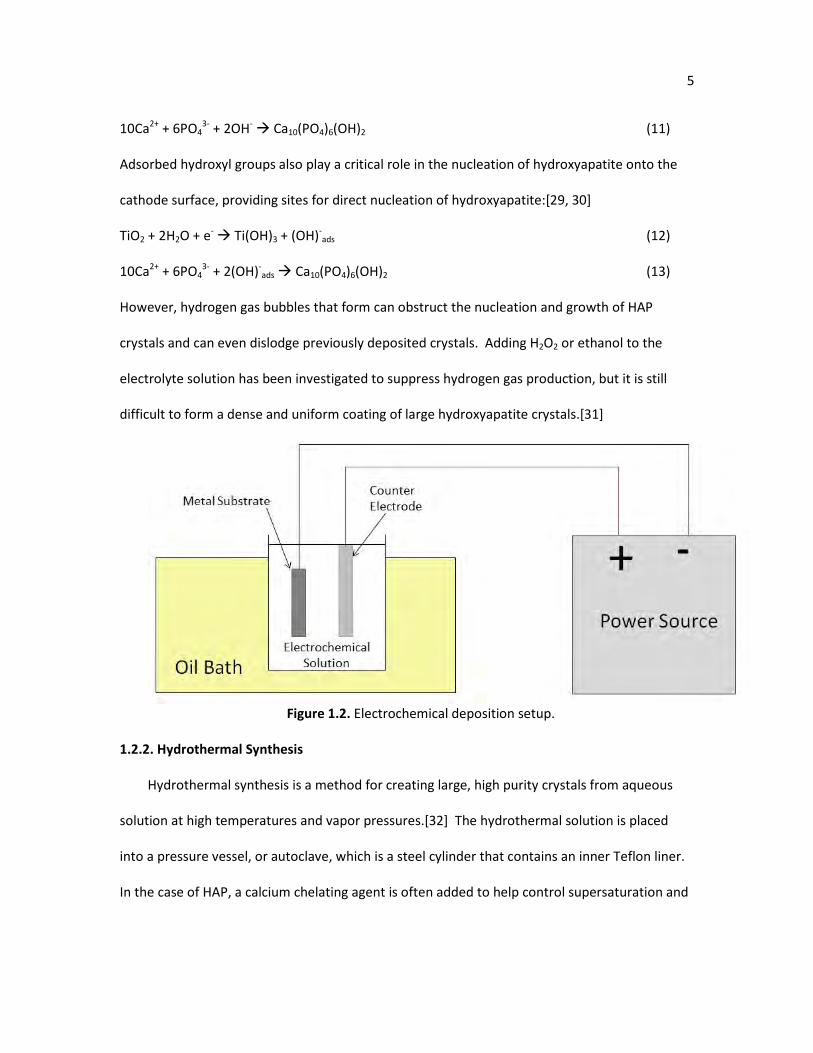
Electrochemical deposition of HAP is an inexpensive and fast method to deposit crystals
onto various shaped metallic substrates.[25-29] The substrate and a counter electrode are
placed in an electrolyte solution containing calcium ions, phosphate ions, a buffer to regulate
pH, and salt to improve the solution’s ionic conductivity, as shown in Figure 1.2. When a current
is passed through the electrodes, a local pH increase occurs at the cathode/substrate surface
due to the increase of OH- ions from the hydrolysis of water:[30]
2H2O + 2e- H2 + 2OH- (1)
In addition, a variety of electrochemical reactions can occur at the cathode surface depending
on the local potential and pH:[29, 30]
O2 + 2H2O + 4e- 4OH- (2)
2H+ + 2e- H2 (3)
H2PO4- + H2O + 2e- H2PO3
- + 2OH- (4)
H2PO4- + e- HPO4
2- + 1/2H2 (5)
H2PO4- + 2e- PO4
3- + H2 (6)
HPO42- + e- PO4
3- + 1/2H2 (7)
The local pH increase causes the calcium and phosphate ions to become insoluble, thus initiating
heterogeneous nucleation. As the pH at the surface increases, a variety of calcium-phosphate
apatite phases can form such as dicalcium phosphate dihydrate, octacalcium phosphate, calcium
deficient hydroxyapatite, and stoichiometric hydroxyapatite:[29, 30]
Ca2+ + HPO42- + 2H2O CaHPO4*2H2O (8)
8Ca2+ + 2HPO42- + 4PO4
3- + 5H2O Ca8H2(PO4)6*5H2O (9)
(10-x)Ca2+ + (6-x)PO43- + xHPO4
- + (2-x)OH- Ca(10-x)(HPO4)x(PO4)6-xOH2-x (10)
5
10Ca2+ + 6PO43- + 2OH- Ca10(PO4)6(OH)2 (11)
Adsorbed hydroxyl groups also play a critical role in the nucleation of hydroxyapatite onto the
cathode surface, providing sites for direct nucleation of hydroxyapatite:[29, 30]
TiO2 + 2H2O + e- Ti(OH)3 + (OH)-ads (12)
10Ca2+ + 6PO43- + 2(OH)-
ads Ca10(PO4)6(OH)2 (13)
However, hydrogen gas bubbles that form can obstruct the nucleation and growth of HAP
crystals and can even dislodge previously deposited crystals. Adding H2O2 or ethanol to the
electrolyte solution has been investigated to suppress hydrogen gas production, but it is still
difficult to form a dense and uniform coating of large hydroxyapatite crystals.[31]
Figure 1.2. Electrochemical deposition setup.
1.2.2. Hydrothermal Synthesis
Hydrothermal synthesis is a method for creating large, high purity crystals from aqueous
solution at high temperatures and vapor pressures.[32] The hydrothermal solution is placed
into a pressure vessel, or autoclave, which is a steel cylinder that contains an inner Teflon liner.
In the case of HAP, a calcium chelating agent is often added to help control supersaturation and
6
thus the growth rate.[25] Once heated to a high enough temperature, the calcium-chelating
agent bond breaks, releasing the calcium slowly into the solution. The calcium eventually reacts
with phosphate to grow into larger HAP crystals in solution. A variety of dopants can also be
introduced to the hydrothermal solution to modify the crystal’s composition. While
hydrothermal synthesis provides a means to make high purity crystals with control over their
size, composition, and morphology, it is not a good method for depositing HAP onto metallic
substrates. For most metals, the HAP crystals do not adhere to the surface during the
hydrothermal growth, and if they do adhere, they are sparse and weakly attached.[25]
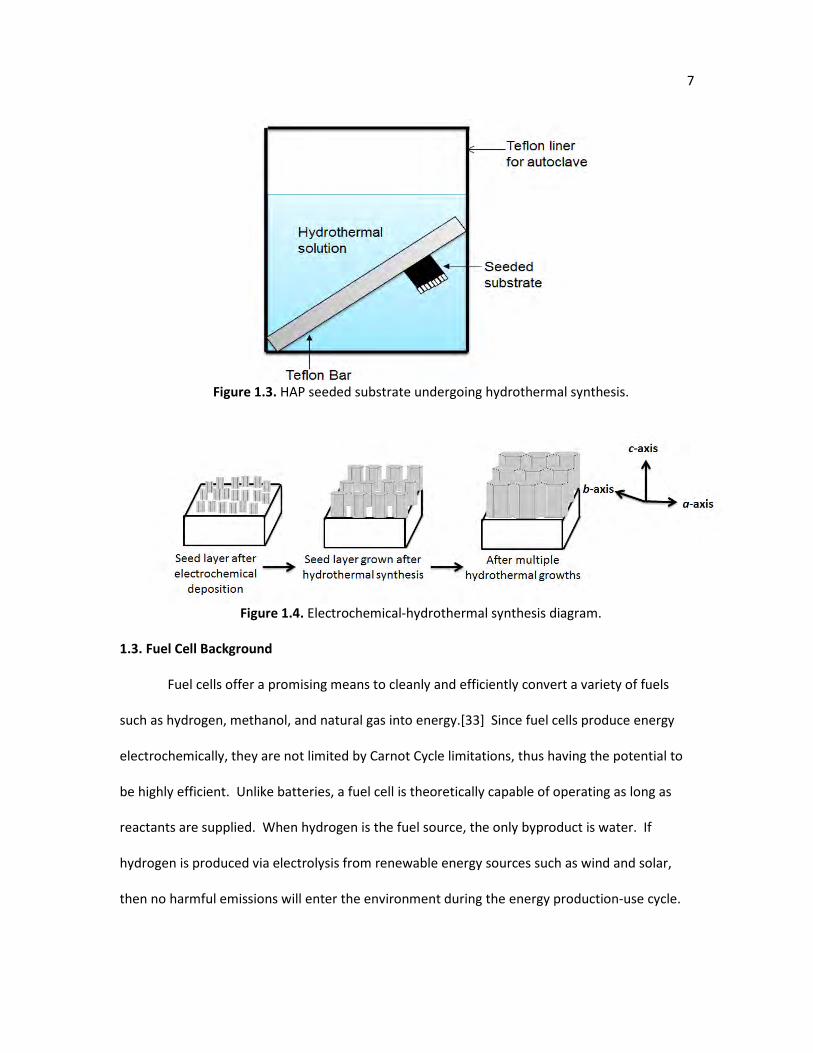
1.2.3. Electrochemical-hydrothermal Synthesis
To mitigate the problems of electrochemical and hydrothermal synthesis, most of the HAP
samples investigated in this thesis were produced by a novel technique that combines both
methods.[13, 25, 26] First, a HAP seed layer was quickly applied to the substrate using
electrochemical deposition. This produces a uniform, thin HAP coating on the entire substrate
and eliminates the issue of the film cracking since the coating is applied so quickly; typically less
than five minutes. Then, this seeded substrate is placed into an autoclave to undergo a
hydrothermal synthesis, as shown in Figure 1.3. The HAP seed layer on the substrate can then
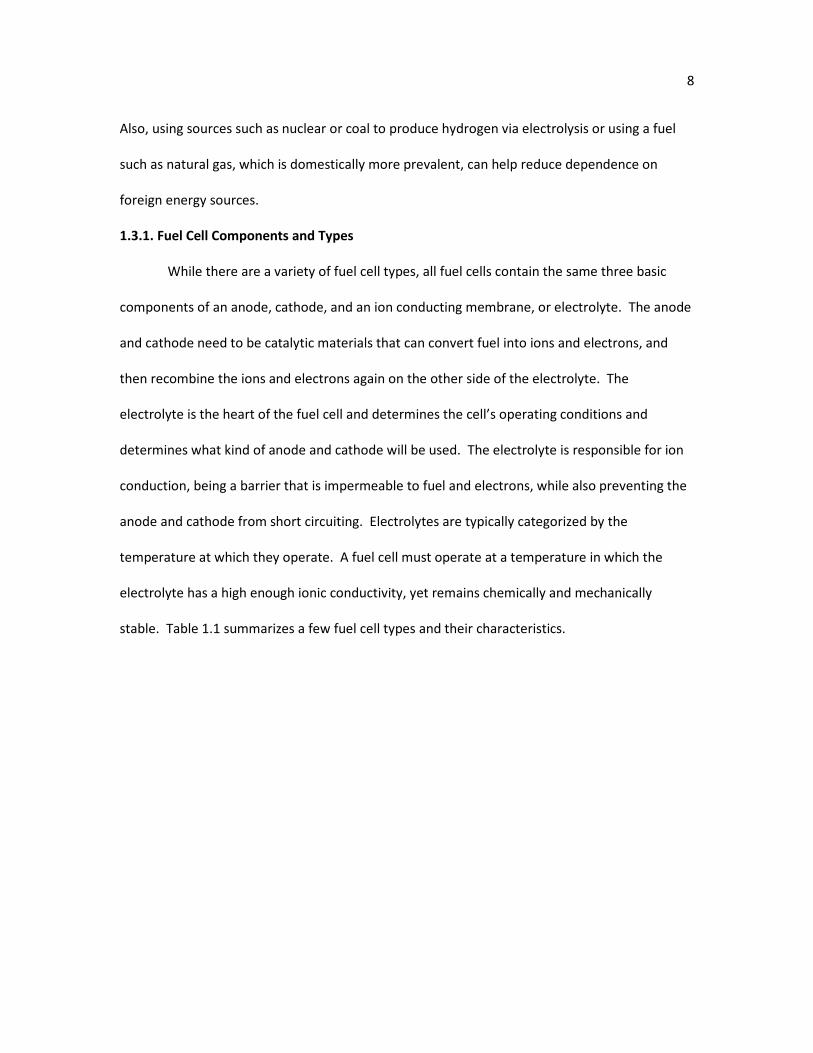
grow during the hydrothermal synthesis. The hydrothermal synthesis can be repeated with
fresh solution to continue growing the crystals to form an even more dense and thick film if
desired, as shown in Figure 1.4. This method not only produces a uniform film of highly
crystalline HAP crystals with good adhesion to the substrate, the crystals produced are also
highly aligned along the c-axis and contains no grain boundaries along the crystal length. This
unique crystal orientation and morphology is the ideal structure for applications that require
higher proton conductivity.[10, 26]
7
Figure 1.3. HAP seeded substrate undergoing hydrothermal synthesis.
Figure 1.4. Electrochemical-hydrothermal synthesis diagram.
1.3. Fuel Cell Background
Fuel cells offer a promising means to cleanly and efficiently convert a variety of fuels
such as hydrogen, methanol, and natural gas into energy.[33] Since fuel cells produce energy
electrochemically, they are not limited by Carnot Cycle limitations, thus having the potential to
be highly efficient. Unlike batteries, a fuel cell is theoretically capable of operating as long as
reactants are supplied. When hydrogen is the fuel source, the only byproduct is water. If
hydrogen is produced via electrolysis from renewable energy sources such as wind and solar,
then no harmful emissions will enter the environment during the energy production-use cycle.
8
Also, using sources such as nuclear or coal to produce hydrogen via electrolysis or using a fuel
such as natural gas, which is domestically more prevalent, can help reduce dependence on
foreign energy sources.
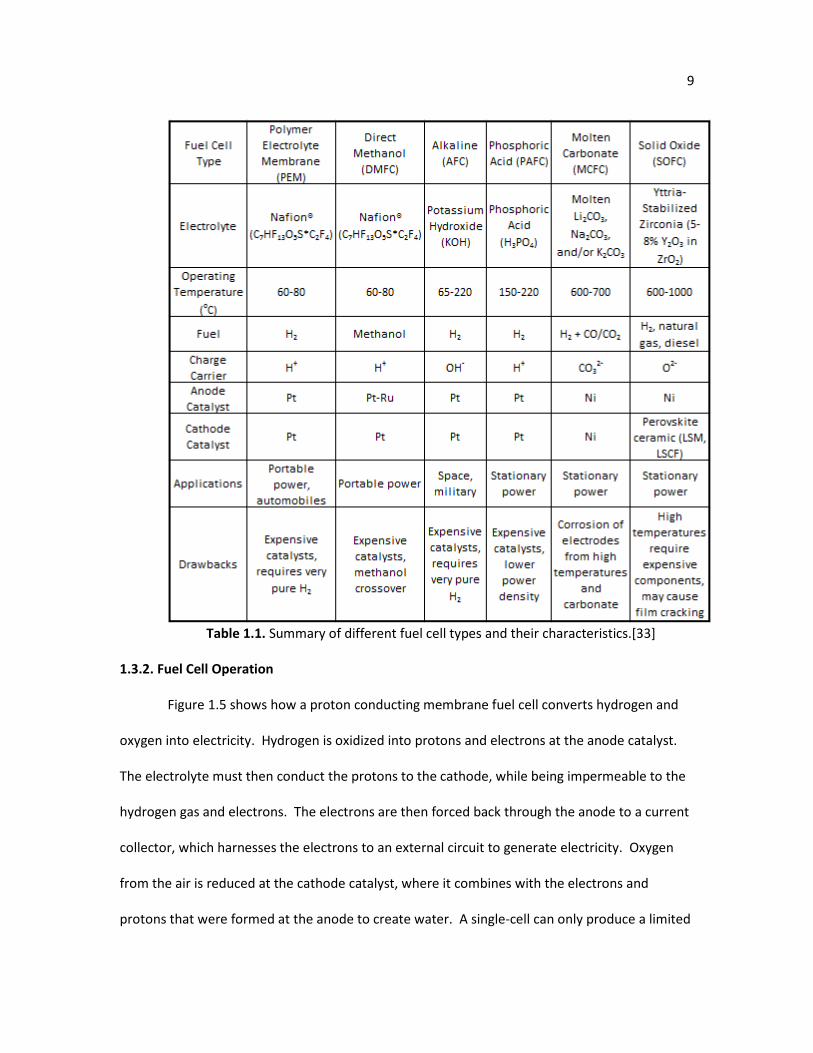
1.3.1. Fuel Cell Components and Types
While there are a variety of fuel cell types, all fuel cells contain the same three basic
components of an anode, cathode, and an ion conducting membrane, or electrolyte. The anode
and cathode need to be catalytic materials that can convert fuel into ions and electrons, and
then recombine the ions and electrons again on the other side of the electrolyte. The
electrolyte is the heart of the fuel cell and determines the cell’s operating conditions and
determines what kind of anode and cathode will be used. The electrolyte is responsible for ion
conduction, being a barrier that is impermeable to fuel and electrons, while also preventing the
anode and cathode from short circuiting. Electrolytes are typically categorized by the
temperature at which they operate. A fuel cell must operate at a temperature in which the
electrolyte has a high enough ionic conductivity, yet remains chemically and mechanically
stable. Table 1.1 summarizes a few fuel cell types and their characteristics.
9
Table 1.1. Summary of different fuel cell types and their characteristics.[33]
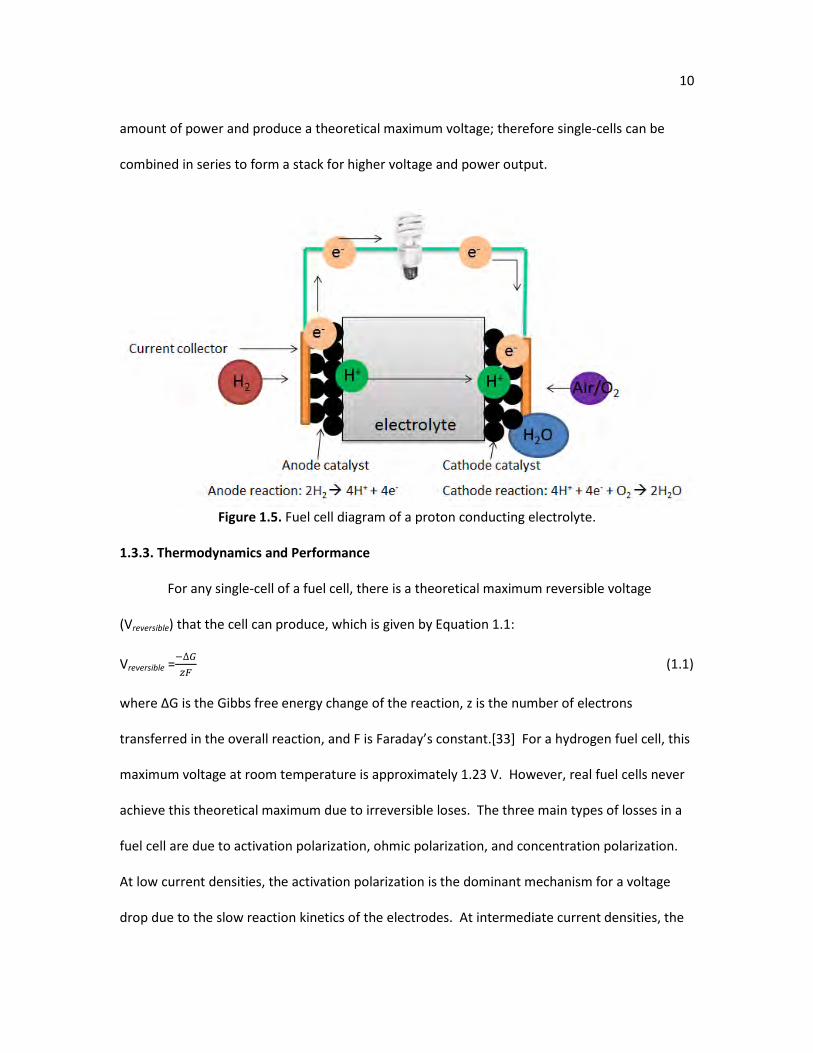
1.3.2. Fuel Cell Operation
Figure 1.5 shows how a proton conducting membrane fuel cell converts hydrogen and
oxygen into electricity. Hydrogen is oxidized into protons and electrons at the anode catalyst.
The electrolyte must then conduct the protons to the cathode, while being impermeable to the
hydrogen gas and electrons. The electrons are then forced back through the anode to a current
collector, which harnesses the electrons to an external circuit to generate electricity. Oxygen
from the air is reduced at the cathode catalyst, where it combines with the electrons and
protons that were formed at the anode to create water. A single-cell can only produce a limited
10
amount of power and produce a theoretical maximum voltage; therefore single-cells can be
combined in series to form a stack for higher voltage and power output.
Figure 1.5. Fuel cell diagram of a proton conducting electrolyte.
1.3.3. Thermodynamics and Performance
For any single-cell of a fuel cell, there is a theoretical maximum reversible voltage
(Vreversible) that the cell can produce, which is given by Equation 1.1:
Vreversible =∆
(1.1)
where ΔG is the Gibbs free energy change of the reaction, z is the number of electrons
transferred in the overall reaction, and F is Faraday’s constant.[33] For a hydrogen fuel cell, this
maximum voltage at room temperature is approximately 1.23 V. However, real fuel cells never
achieve this theoretical maximum due to irreversible loses. The three main types of losses in a
fuel cell are due to activation polarization, ohmic polarization, and concentration polarization.
At low current densities, the activation polarization is the dominant mechanism for a voltage
drop due to the slow reaction kinetics of the electrodes. At intermediate current densities, the
11
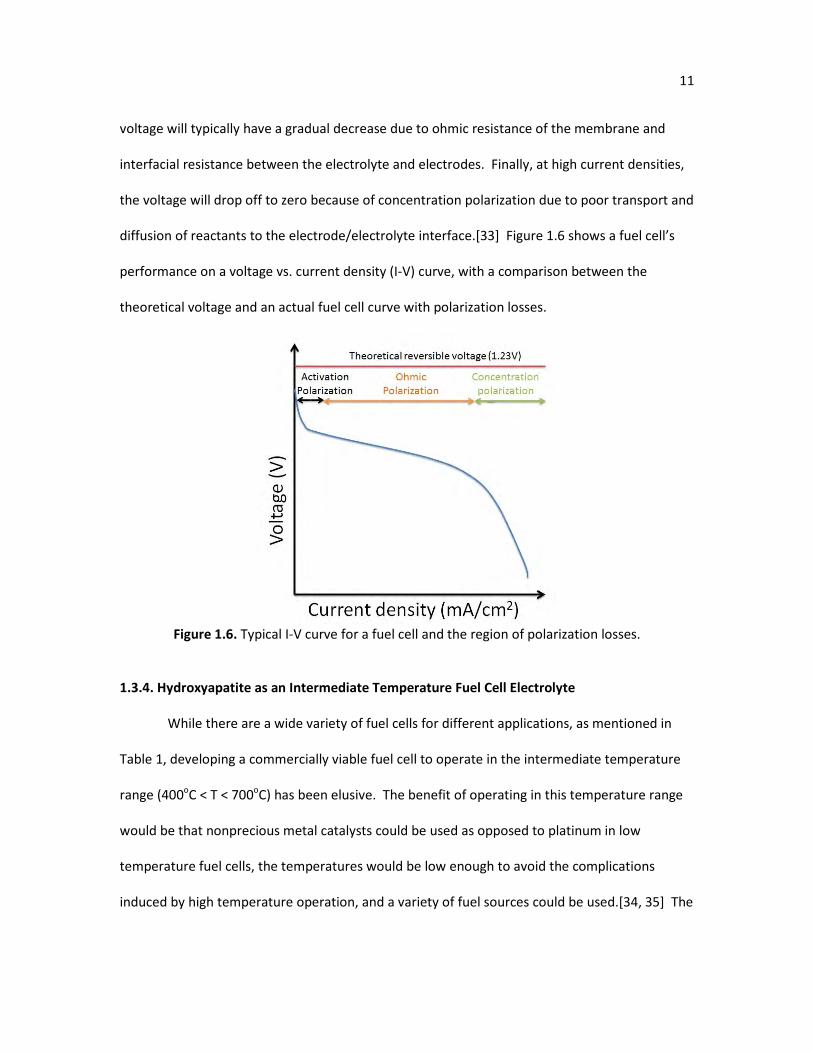
voltage will typically have a gradual decrease due to ohmic resistance of the membrane and
interfacial resistance between the electrolyte and electrodes. Finally, at high current densities,
the voltage will drop off to zero because of concentration polarization due to poor transport and
diffusion of reactants to the electrode/electrolyte interface.[33] Figure 1.6 shows a fuel cell’s
performance on a voltage vs. current density (I-V) curve, with a comparison between the
theoretical voltage and an actual fuel cell curve with polarization losses.
Figure 1.6. Typical I-V curve for a fuel cell and the region of polarization losses.
1.3.4. Hydroxyapatite as an Intermediate Temperature Fuel Cell Electrolyte
While there are a wide variety of fuel cells for different applications, as mentioned in
Table 1, developing a commercially viable fuel cell to operate in the intermediate temperature
range (400oC < T < 700oC) has been elusive. The benefit of operating in this temperature range
would be that nonprecious metal catalysts could be used as opposed to platinum in low
temperature fuel cells, the temperatures would be low enough to avoid the complications
induced by high temperature operation, and a variety of fuel sources could be used.[34, 35] The
12
main reason no intermediate temperature fuel cell has been developed is due to the fact that
no electrolyte material has either a high enough conductivity or is chemically and mechanically
stable in this temperature range. HAP is a potential candidate as a proton conducting material
in the intermediate temperature range since proton mobility has been shown to begin as low as
200oC.[8] However, very little work has been done to investigate HAP as a fuel cell electrolyte
since its conductivity values in the intermediate temperature range are too low. For example, a
typical yttria stabilized zirconia (YSZ) membrane of a solid oxide fuel cell (SOFC) has oxygen ion
conductivity values of ~10-2 S/cm at 700oC, whereas a typical hydroxyapatite pellet sintered in
air has proton conductivity values of ~10-6 S/cm at 700oC.[9, 36] Also, when HAP is exposed to
elevated temperatures for an extended period of time, it will often undergo dehydroxylation
and decompose into secondary phases.[9] Since the hydroxyl groups are essential for proton
mobility, this will further decrease HAP’s conductivity.
In this thesis, the issues regarding HAP as an ion conductor were addressed in a variety
of ways. First, the novel electrochemical-hydrothermal synthesis method produces highly
oriented crystals with very few grain boundaries. This provides a direct path for ion conduction,
which reduces grain boundary resistance. Second, the synthesis method produces a very thin,
but dense film. The thin nature of the film reduces the distance that the protons need to travel,
while the density helps maintain a gas tight barrier to prevent fuel crossover. Finally, by doping
the crystal structure, vacancies can be created in the membrane. With the proper amount of
doping, ionic conducitivity can increase compared to an undoped sample. Also, to address the
issues of dehydroxylation, the HAP membranes were doped with fluoride to investigate its
impact on thermal stability.
13
1.4. Polarizing Hydroxyapatite
While HAP coatings have been shown to improve integration of implants in the body, much
research has been done to speed up the integration process. In recent years, one method that
has gained a lot of attention is manipulating HAP’s ion conducting abilities to control the surface
charge.[8, 37] Many studies have shown that a charged surface, particularly negatively charged
surfaces, can help attract positively charged proteins and cations such as Ca2+ to speed up
osteointegration between the implant and the body.[12, 37] While it has been shown that the
a-surface of a HAP crystal typically contains a slight positive charge due to Ca2+ ions and the c-
surface is slightly negative due to PO43- ions exposed at the surface, the electrostatic charge of
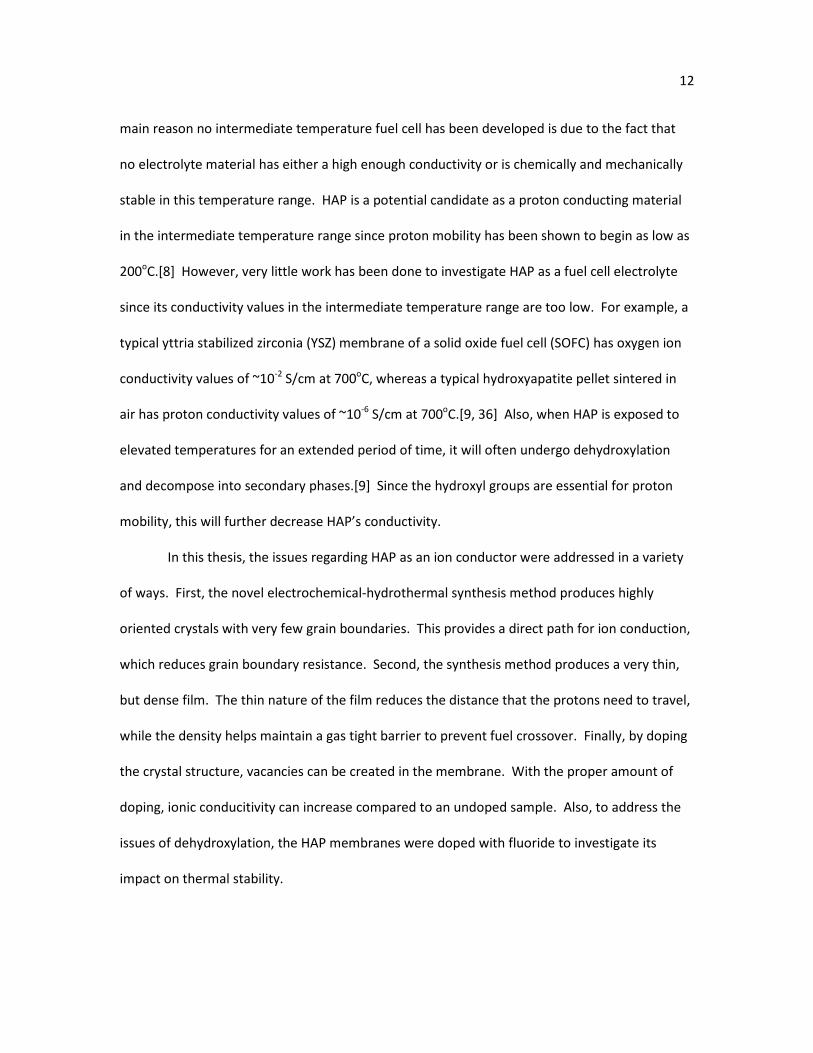
both sides is fairly weak.[5] However, HAP’s ion conducting capabilities can be exploited by
applying a high electric field (> 1 kV/cm) to HAP at elevated temperatures (>300oC), forcing
HAP’s protons to migrate toward the negative electrode. By applying the electric field until the
sample cools to room temperature, the electric polarization will remain fixed since the protons
are immobile at room temperature, forming an electret, which is analogous to a magnet having
a permanent magnetic polarization. The process of polarizing HAP is summarized in Figure 1.7.
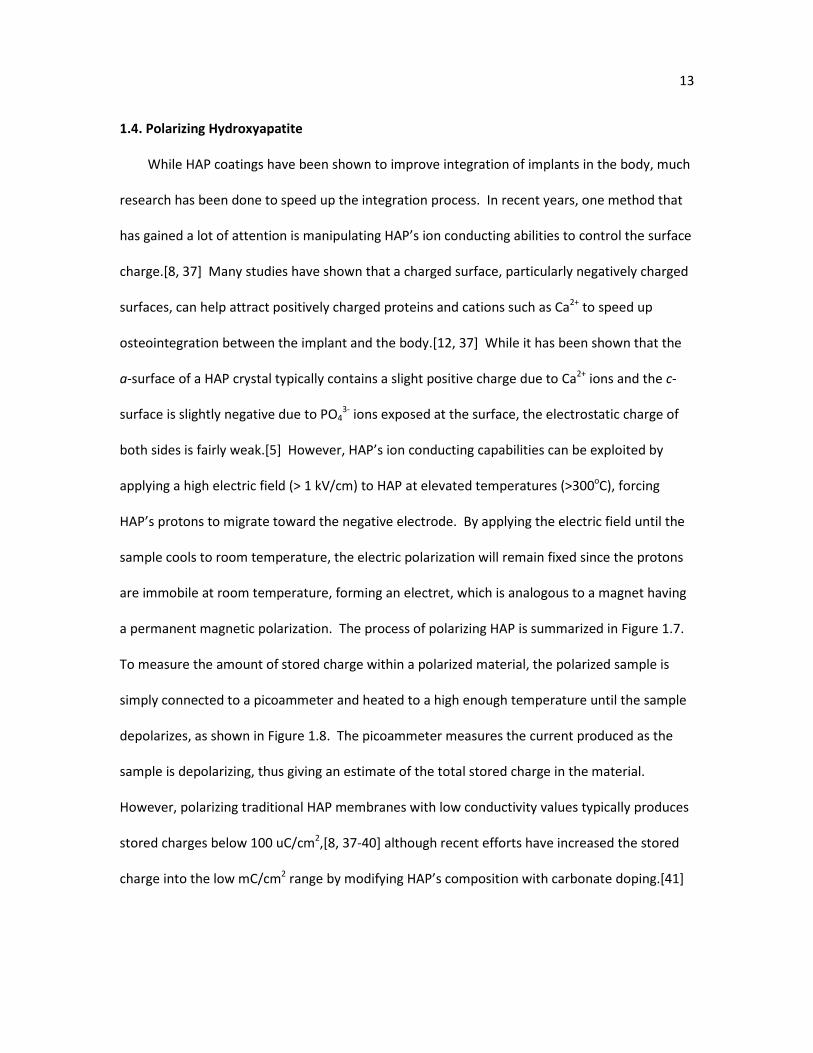
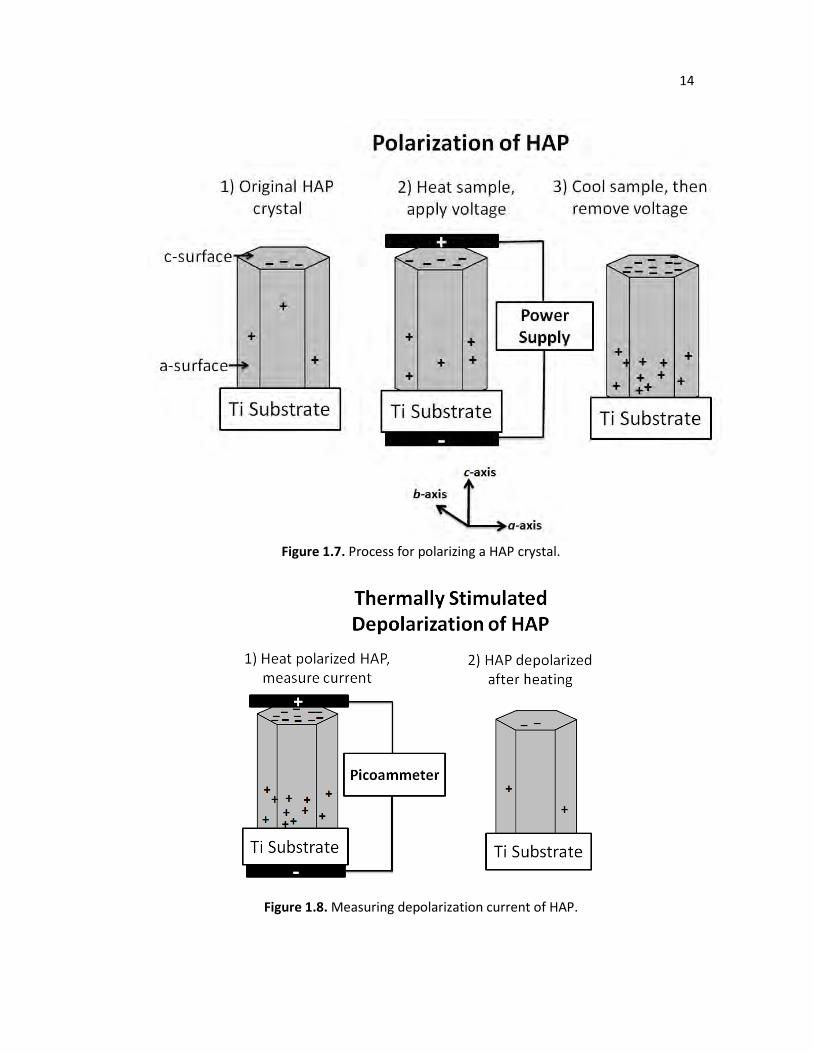
To measure the amount of stored charge within a polarized material, the polarized sample is
simply connected to a picoammeter and heated to a high enough temperature until the sample
depolarizes, as shown in Figure 1.8. The picoammeter measures the current produced as the
sample is depolarizing, thus giving an estimate of the total stored charge in the material.
However, polarizing traditional HAP membranes with low conductivity values typically produces
stored charges below 100 uC/cm2,[8, 37-40] although recent efforts have increased the stored
charge into the low mC/cm2 range by modifying HAP’s composition with carbonate doping.[41]
14
Figure 1.7. Process for polarizing a HAP crystal.
Figure 1.8. Measuring depolarization current of HAP.
15
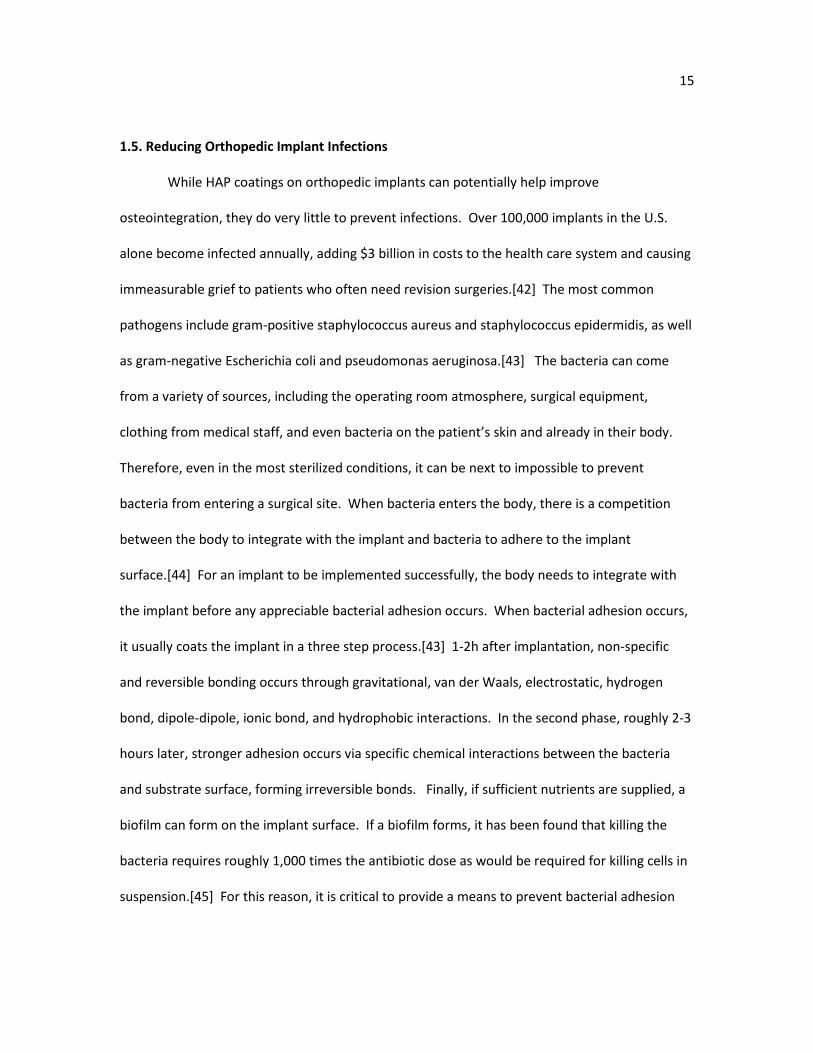
1.5. Reducing Orthopedic Implant Infections
While HAP coatings on orthopedic implants can potentially help improve
osteointegration, they do very little to prevent infections. Over 100,000 implants in the U.S.
alone become infected annually, adding $3 billion in costs to the health care system and causing
immeasurable grief to patients who often need revision surgeries.[42] The most common
pathogens include gram-positive staphylococcus aureus and staphylococcus epidermidis, as well
as gram-negative Escherichia coli and pseudomonas aeruginosa.[43] The bacteria can come
from a variety of sources, including the operating room atmosphere, surgical equipment,
clothing from medical staff, and even bacteria on the patient’s skin and already in their body.
Therefore, even in the most sterilized conditions, it can be next to impossible to prevent
bacteria from entering a surgical site. When bacteria enters the body, there is a competition
between the body to integrate with the implant and bacteria to adhere to the implant
surface.[44] For an implant to be implemented successfully, the body needs to integrate with
the implant before any appreciable bacterial adhesion occurs. When bacterial adhesion occurs,
it usually coats the implant in a three step process.[43] 1-2h after implantation, non-specific
and reversible bonding occurs through gravitational, van der Waals, electrostatic, hydrogen
bond, dipole-dipole, ionic bond, and hydrophobic interactions. In the second phase, roughly 2-3
hours later, stronger adhesion occurs via specific chemical interactions between the bacteria
and substrate surface, forming irreversible bonds. Finally, if sufficient nutrients are supplied, a
biofilm can form on the implant surface. If a biofilm forms, it has been found that killing the
bacteria requires roughly 1,000 times the antibiotic dose as would be required for killing cells in
suspension.[45] For this reason, it is critical to provide a means to prevent bacterial adhesion
16
and to stop bacteria growth. In this thesis, HAP samples coated with silver nanoparticles was
investigated as a means to prevent bacterial growth and adhesion. Silver ions have long been
known to contain antimicrobial properties, interfering with the bacteria’s metabolic functions
and replication.[30, 46, 47]
1.6. Research Objectives
This thesis investigates a novel technique for synthesizing highly oriented and grain
boundary-free HAP crystals on metal substrates. The impact of doping fluoride, yttrium, and
ytterbium on various properties such as morphology, composition, crystallinity, thermal
stability, stored charge, and conductivity were investigated using a variety of characterization
techniques such as scanning electron microscopy (SEM), energy-dispersive X-ray spectroscopy
(EDX), X-ray diffraction (XRD), electrochemical impedance spectroscopy (EIS), and thermally
stimulated depolarization current (TSDC) measurements. Applications for these membranes
were demonstrated by synthesizing and testing a fuel cell using the HAP membrane as a fuel cell
electrolyte. A new technique of depositing silver nanoparticles on HAP membranes was also
investigated for their potential as an antimicrobial orthopedic coating.
1.7. Thesis Outline
Chapters 2, 3, and 4 all use an electrochemical-hydrothermal synthesis method for
depositing highly c-axis oriented HAP membranes onto metal substrates. Electrochemical
deposition produces a seed layer of HAP onto the metallic substrate, while hydrothermal
synthesis grows the seed layer into a thicker and denser crystal film. The hydrothermal step is
also used to dope HAP with a variety of ions. Chapter 2 looks into the impact that fluoride
17
doping has on the thermal stability of the HAP membranes. Samples were also doped with
yttrium and co-doped with yttrium and fluoride. The differences between doped and undoped
samples were analyzed using XRD and SEM. Chapter 3 explores the stored charge in yttrium-
fluoride co-doped membranes. Samples were prepared using two different seeding steps, one
an electrochemical deposition, the other by letting a suspension of HAP nanoparticles form a
thin film on the substrate, followed by a hydrothermal growth. The stored charge of the films
was characterized using the TSDC method. Since the films were not polarized, a mechanism for
their large stored charge was proposed. Chapter 4 investigates the impact of ytterbium doping
on the crystal film’s structure, morphology, and composition. Fuel cells were fabricated and
tested using a ytterbium and ytterbium-fluoride co-doped membrane coated onto a palladium
substrate. Finally, chapter 5 describes a new technique to reduce silver nanoparticles onto
electrochemically deposited HAP crystals. The samples were characterized using SEM and XRD,
their bioactivity was evaluated by placing the samples into a simulated body fluid, and
preliminary experiments were done to investigate their antimicrobial properties.
18
References
1. Tanka, Y., et al., Ionic conduction mechanism in Ca-deficient hydroxyapatite whiskers.
Materials Science and Engineering, 2009. 161: p. 115-119.
2. Gittings, J., et al., Electrical characterization of hydroxyapatite-based bioceramics. Acta
Biomaterialia, 2009. 5: p. 743-754.
3. Palazzo, B., et al., Biomimetic hydroxyapatite–drug nanocrystals as potential bone
substitutes with antitumor drug delivery properties. Advanced Functional Materials, 2007.
17(2180-2188).
4. Kim, S., et al., The characteristics of a hydroxyapatite-chitosan-PMMA bone cement.
Biomaterials, 2004. 25: p. 5715-5723.
5. Kawasaki, T., Hydroxyapatite as a liquid chromatographic packing. Journal of
Chromatography, 1991. 544: p. 147-184.
6. Owada, H., et al., Humidity-Sensitivity of Yttrium Substituted Apatite Ceramics. Solid
State Ionics, 1989. 35: p. 401-404.
7. Horiuchi, N., et al., Proton conduction related electrical dipole and space charge
polarization in hydroxyapatite. Journal of Applied Physics, 2012. 112: p. 1-6.
8. Nakamura, S., H. Takeda, and K. Yamashita, Proton transport polarization and
depolarization of hydroxyapatite ceramics. Journal of Applied Physics, 2001. 89: p. 5386-5391.
9. Yamashita, K., K. Kitagaki, and T. Umegaki, Thermal Instability and Proton Conductivity of
Ceramic Hydroxyapatite at High Temperatures. J. Am. Ceram. Soc., 1995. 78: p. 1191-97.
10. Wei, X. and M.Z. Yates, Yttrium-doped hydroxyapatite membranes with high proton
conductivity. Chemistry of Materials, 2012. 24: p. 1738-1743.
11. Yamashita, K., et al., Protonic conduction in yttrium-substituted hydroxyapatite ceramics
and their applicability to H2-O2 fuel cell. Solid State Ionics, 1990. 40/41: p. 918-921.
12. Tanaka, Y., et al., Fast oxide ion conduction due to carbonate substitution in
hydroxyapatite. Journal of American Ceramic Society, 2010. 93: p. 3577-3579.
13. Wei, X., et al., Carbonated hydroxyapatite coatings with aligned crystal domains. Crystal
Growth & Design, 2012. 12: p. 3474-3480.
14. Samia, N., et al., Effect of fluorine on the thermal stability of the magnesium-substituted
hydroxyapatite. Annales De Chimie-Science Des Materiaux, 2011. 36: p. 159-176.
19
15. Liu, W., et al., Gentamicin-loaded strontium-containing hydroxyapatite bioactive bone
cement—An efficient bioactive antibiotic drug delivery system. Journal of Biomedical Materials
Research B: Applied Biomaterials, 2010. 95B: p. 397-406.
16. C. Ergun, et al., Hydroxylapatite with substituted magnesium, zinc, cadmium, and
yttrium. I. Structure and microstructure. Journal of Biomedical Materials Research, 2001. 59: p.
305-311.
17. Eslami, H., M. Solati-Hashjin, and M. Tahriri, Effect of fluorine ion addition on structural,
thermal, mechanical, solubility and biocompatibility characteristics of hydroxyapatite
nanopowders. Advances in Applied Ceramics, 2010. 109: p. 200-212.
18. Hammari, L.E., et al., Chrystallinity and Fluorine Substitution Effects on the Proton
Conductivity of Porous Hydroxyapatites. J. Solid State Chemistry, 2004. 177: p. 134-138.
19. Laghzizil, A., et al., Comparison of Electrical Properties between Fluoroapatite and
Hydroxyapatite Materials. Journal of Solid State Chemistry, 2001. 156: p. 57-60.
20. Chen, Y. and X. Miao, Thermal and chemical stability of fluorohydroxyapatite ceramics
with different fluorine contents. Biomaterials, 2005. 26: p. 1205-1210.
21. Bianco, A., et al., F-substituted hydroxyapatite nanopowders: Thermal stability, sintering
behaviour and mechanical properties. Ceramics International, 2010. 36: p. 313-322.
22. Zakaria, S., et al., Nanophase hydroxyapatite as a biomaterial in advanced hard tissue
engineering: A review. Tissue Eng. Part B Rev., 2013.
23. Sun, L., et al., Material fundamentals and clinical performance of plasma-sprayed
hydroxyapatite coatings: A review. Journal of Biomedical Materials Research, 2001. 58: p. 570-
592.
24. Yang, Y., k. Kim, and J. Ong, A review on calcium phosphate coatings produced using a
sputtering process—an alternative to plasma spraying. Biomaterials, 2005. 26: p. 327-337.
25. Liu, D., K. Savino, and M.Z. Yates, Coating of hydroxyapatite films on metal substrates by
seeded hydrothermal deposition. Surface and Coatings Technology, 2011. 205: p. 3975-3986.
26. Liu, D., K. Savino, and M.Z. Yates, Microstructural engineering of hydroxyapatite
membranes to enhance proton conductivity. Advanced Functional Materials, 2009. 19: p. 3941-
3947.
20
27. Kuo, M. and S. Yen, The process of electrochemical deposited hydroxyapatite coatings on
biomedical titanium at room temperature. Materials Science and Engineering C, 2002. 20: p.
153-160.
28. S.Ban and S. Maruno, Hydrothermal-electrochemical deposition of hydroxyapatite.
Journal of Biomedical Materials Research, 1998. 42: p. 387-395.
29. Wang, J., et al., Fluoridated hydroxyapatite coatings on titanium obtained by
electrochemical deposition. Acta Biomaterialia, 2009. 5: p. 1798-1807.
30. Bir, F., et al., Electrochemical depositions of fluorohydroxyapatite doped by Cu2+, Zn2+,
Ag+ on stainless steel substrates. Applied Surface Science, 2012. 258: p. 7021-7030.
31. Chen, J., H. Juang, and M. Hon, Calcium phosphate coating on titanium substrate by a
modified electrocrystallization process. Journal of Materials Science Materials in Medicine, 1998.
9: p. 297-300.
32. Neira, I., et al., An effective morphology control of hydroxyapatite crystals via
hydrothermal synthesis. Crystal Growth and Design, 2009. 9: p. 466-474.
33. Barbir, F., PEM Fuel Cells: Theory and Practice, ed. R. Dorf2005: Elsevier Academic Press.
34. Ito, N., et al., Electrochemical analysis of hydrogen membrane fuel cells. Journal of
Power Sources, 2008. 185: p. 922-926.
35. Ito, N., et al., New intermediate temperature fuel cell with ultra-thin proton conductor
electrolyte. Journal of Power Sources, 2005. 152: p. 200-203.
36. Kwon, O. and G. Choi, Electrical conductivity of thick film YSZ. Solid State Ionics, 2006.
177: p. 3057-3062.
37. Tanaka, Y., et al., Polarization and microstructural effects of ceramic hydroxyapatite
electrets. Journal of Applied Physics, 2010. 107: p. 1-10.
38. Wolf-Brandstetter, C., et al., The impact of heat treatment on interactions of contact-
poled biphasic calcium phosphates with proteins and cells. Acta Biomaterialia, 2012. 8: p. 3468-
3477.
39. Kumar, D., et al., Polarization of hydroxyapatite: Influence on osteoblast cell
proliferation. Acta Biomaterialia, 2010. 6: p. 1549-1554.
40. Bodhak, S., S. Bose, and A. Bandyopadhyay, Bone cell–material interactions on metal-ion
doped polarized hydroxyapatite. Materials Science and Engineering C, 2011. 31: p. 755-761.
21
41. Nagai, A., et al., Electric polarization and mechanism of B-type carbonated apatite
ceramics. Journal of Biomedical Materials Research Part A, 2011. 99A: p. 116-124.
42. Darouiche, R., Treatment of infections associated with surgical implants. New England
Journal of Medicine, 2004. 350: p. 1422-1429.
43. Hetrick, E. and M. Schoenfisch, Reducing implant-related infections: active release
strategies. Chemical Society Reviews, 2006. 35: p. 780-789.
44. Gristina, A., Biomaterial-centered infection: microbial adhesion versus tissue integration.
Science, 1987. 237: p. 1588-1595.
45. Smith, A., Biofilms and antibiotic therapy: Is there a role for combating bacterial
resistance by the use of novel drug delivery systems? Advanced Drug Delivery Reviews, 2005. 57:
p. 1539-1550.
46. Lu, X., et al., Nano-Ag-loaded hydroxyapatite coatings on titanium surfaces by
electrochemical deposition. J. R. Soc. Interface, 2011. 8: p. 529-539.
47. Rai, M., A. Yadav, and A. Gade, Silver nanoparticles as a new generation of
antimicrobials. Biotechnology Advances, 2009. 27: p. 76-83.
22
Chapter 2
Improved Thermal Stability of Novel Hydroxyapatite Membranes via Fluoride Doping
2.1. Introduction
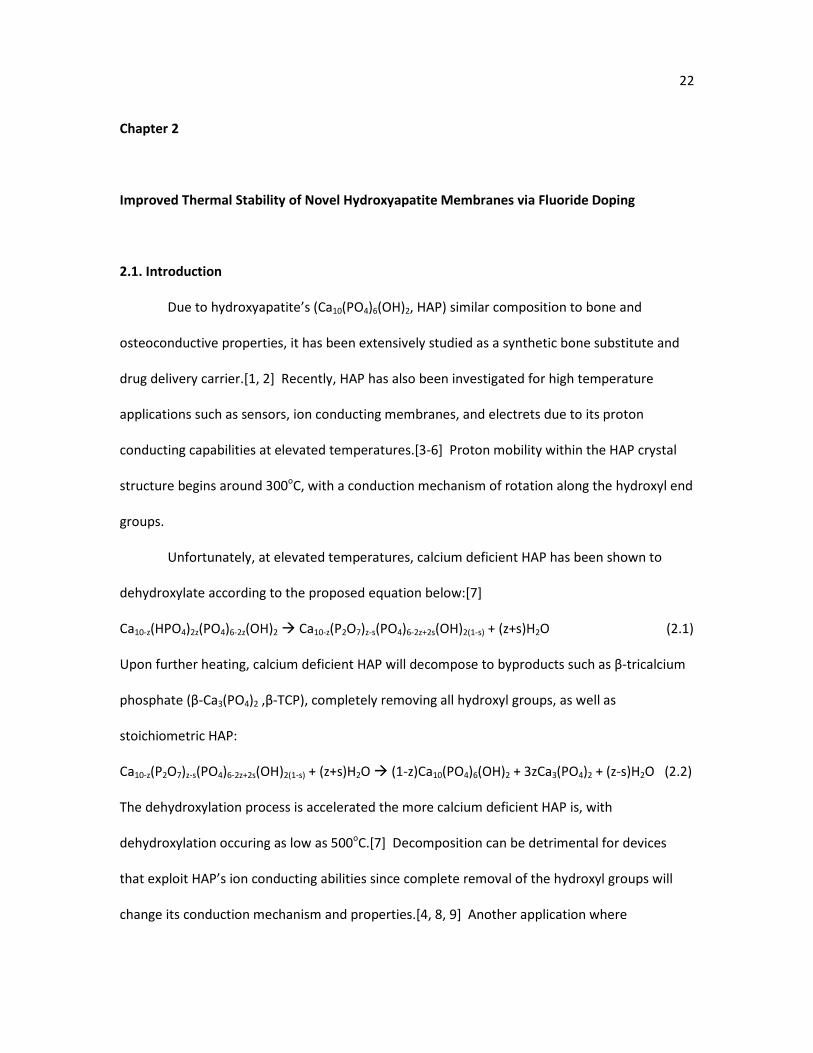
Due to hydroxyapatite’s (Ca10(PO4)6(OH)2, HAP) similar composition to bone and
osteoconductive properties, it has been extensively studied as a synthetic bone substitute and
drug delivery carrier.[1, 2] Recently, HAP has also been investigated for high temperature
applications such as sensors, ion conducting membranes, and electrets due to its proton
conducting capabilities at elevated temperatures.[3-6] Proton mobility within the HAP crystal
structure begins around 300oC, with a conduction mechanism of rotation along the hydroxyl end
groups.
Unfortunately, at elevated temperatures, calcium deficient HAP has been shown to
dehydroxylate according to the proposed equation below:[7]
Ca10-z(HPO4)2z(PO4)6-2z(OH)2 Ca10-z(P2O7)z-s(PO4)6-2z+2s(OH)2(1-s) + (z+s)H2O (2.1)
Upon further heating, calcium deficient HAP will decompose to byproducts such as β-tricalcium
phosphate (β-Ca3(PO4)2 ,β-TCP), completely removing all hydroxyl groups, as well as
stoichiometric HAP:
Ca10-z(P2O7)z-s(PO4)6-2z+2s(OH)2(1-s) + (z+s)H2O (1-z)Ca10(PO4)6(OH)2 + 3zCa3(PO4)2 + (z-s)H2O (2.2)
The dehydroxylation process is accelerated the more calcium deficient HAP is, with
dehydroxylation occuring as low as 500oC.[7] Decomposition can be detrimental for devices
that exploit HAP’s ion conducting abilities since complete removal of the hydroxyl groups will
change its conduction mechanism and properties.[4, 8, 9] Another application where
23
dehydroxylation can be problematic is when HAP coatings are being sintered onto orthopedic
implants since the decomposition byproducts can dissolve in vivo faster than pure HAP.[10]
To improve HAP’s thermal stability, many groups have shown the benefit of substituting
the hydroxyl end groups with fluoride due to fluoride’s higher affinity for protons and its ability
to create a more ordered HAP crystal structure.[10-12] This enhanced thermal stability makes
fluorinated hydroxyapatite (FHAP) more resistant to decomposition at elevated temperatures.
This study shows that incorporating fluoride into a novel electrochemical-hydrothermal
synthesis method can improve the film’s thermal stability at elevated temperatures compared
to unfluorinated samples. To further demonstrate that dehydroxylation is the mechanism that
leads to HAP’s decomposition, unfluorinated samples were heated in a steam atmosphere to
show that introducing steam can shift the decomposition equations toward the original HAP.
Finally, the ability to co-dope samples was demonstrated since multiple dopants such as yttrium,
magnesium, and carbonate are often incorporated into HAP to modify its properties.[12-15] For
this study, yttrium-fluoride co-doped HAP films (YFHAP) were synthesized and shown to have
enhanced thermal stability. Samples only doped with yttrium (YHAP) were synthesized as a
comparison and showed poor thermal stability at elevated temperatures.
2.2. Experimental
Materials
Analytical grade Ca(NO3)2·4H2O (99.0% purity) and Y(NO3)3·6H2O (99.9% purity) were
purchased from Alfa Aesar. (NH4)2HPO4 (>99.0% purity) was purchased from EMD. K2HPO4
(99.99% purity), CaCl2·2H2O (99+% purity), NaCl (≥99.0% purity), tris(hydroxymethyl)-
aminomethane (tris) (99.8+% purity), and disodium ethylenediaminetetraacetate dihydrate
24
(Na2EDTA·2H2O) (ACS reagent, 99.0-101.0% purity) were all obtained from Sigma- Aldrich. NH4F
(ACS reagent, 98% purity) was purchased from Aldrich Chemical Company, Inc. 36.5-38.0%
hydrochloric acid and 28.0-30.0% pure ammonium hydroxide were purchased from Mallinckrodt
Chemicals. Detergent powder was purchased from Alconox. Titanium(Ti) substrates (12.5 mm x
12.5 mm and 0.89 mm thick) and platinum foil (25 mm x 25 mm and 0.127 mm thick) were
purchased from Alfa Aesar. Deionized water was used for all solutions.
Electrochemical deposition of HAP seeds
Titanium substrates were polished with SiC paper (800 grit) to provide surface
roughness. The substrates were then washed with Alconox detergent powder, rinsed with tap
water, attached to a silver wire by tightly wrapping the wire through a premade hole in the
substrate, sonicated in an ethanol/acetone (volume ratio = 50/50) solvent for 30 minutes, and
then rinsed with deionized water.
An electrolyte solution was prepared containing 138 mM NaCl, 50 mM tris, 1.25 mM
CaCl2, and 0.828 mM K2HPO4 in 125 mL deionized water per substrate. The solution was
buffered to pH 7.2 using hydrochloric acid. The electrolyte solution was then heated to 95°C.
The substrate and a platinum plate were held parallel to each other with a fixed distance of
separation of 10 mm. The substrate and platinum plate were connected to the negative and
positive outlets of a direct current power supply (Instek GPS-3030D), respectively, and
immersed in the electrolyte solution. The electrochemical reaction was carried out for 5
minutes at 12.5 mA/cm2 (area relative to the platinum plate), then rinsed off with deionized
water and dried in air.
Hydrothermal growth of HAP
25
The hydrothermal solution consisted of 0.115 M Na2EDTA·2H2O that was stirred into 30
mL of deionized water per sample at 80oC until it was completely dissolved. 0.1 M
Ca(NO3)2·4H2O was then added, followed by 0.06 M (NH4)2HPO4. Hydroxyapatite (HAP) samples
contained no other dopants. For yttrium doped hydroxyapatite (YHAP), 0.01 M Y(NO3)3·6H2O
was added after Ca(NO3)2·4H2O. For fluoride doped hydroxyapatite (FHAP), 0.02 M NH4F was
added after (NH4)2HPO4. For yttrium and fluoride co-doped hydroxyapatite (YFHAP), the
solution contained both Y(NO3)3·6H2O and NH4F. The pH of each solution was raised to 10.0
with ammonium hydroxide and then stirred for about 10 minutes.
The electrolyte solution was then transferred to a Teflon-lined stainless steel acid
digestion autoclave (Parr Item No. 4744, 45 mL internal volume), until filled with approximately
60% solution. The seeded substrate was submersed in the solution with the seed layer facing
down and tilted ~45 degrees relative to the bottom of the autoclave. The autoclave was heated
for 10 hours at 200°C and autogenous pressure. After heating the autoclave was cooled to room
temperature in a fume hood, then the sample was taken out, rinsed with deionized water
several times, and dried in air.
Heat treatment
For each heat treatment temperature, a sample was placed into a tube furnace for 3
hours at the set point temperature of 600, 700, 800, 900, or 1000oC. The ramp rate for heating
and cooling was 2oC/minute with the heating beginning and ending at room temperature. For
samples heated in steam, a peristaltic pump (Gilson, Minipuls 3) delivered a steady supply of
water at a flow rate of 7 mL/minute through the alumina tube samples were in. The pump was
turned on when the temperature of the oven reached 200oC, then turned off again when it
cooled back down to 200oC.
26
Product characterization
Crystal morphology was examined using a scanning electron microscope (SEM, Zeiss-
Auriga) with an accelerating voltage of 3 kV. The composition of HAP membranes was
determined by EDX (Energy-dispersive X-ray spectroscopy, EDAX). Three spots on each sample
were probed at 15 kV and the values were averaged and standard deviations were calculated.
The crystal structure of HAP was determined by X-ray diffraction (XRD) (Philips PW3020) with Cu
K1 radiation (λ=1.540560 Ǻ) from 20-40o with a step rate of 0.02 degrees/second. Phase
identification was made by comparison with the Joint Committee on Powder Diffraction
Standards (JCPDS) files. Relative intensities were calculated using X’Pert Data Viewer software.
2.3. Results and discussion
Figure 2.1 shows a typical seed layer after the electrochemical deposition. The height of
the seed layer is roughly 500-800 nm, while the width of each crystal is about 20-25 nm. The
seed layer provides nucleation sites for further crystal growth during the hydrothermal
synthesis. After the hydrothermal growth, EDX was used to characterize the samples’
compositions as shown in Table 2.1. Yttrium atomic% (at%) was confirmed using an electron
microprobe since the yttrium and phosphorous peaks are very close . Electron microprobe
results agreed well with EDX (results not shown). EDX clearly confirmed the presence of
fluoride, yttrium, and yttrium and fluoride in FHAP, YHAP, and YFHAP, respectively. The calcium
to phosphorous (Ca:P) ratio was also determined since HAP’s thermal stability is influenced by
how close the ratio is to stoichiometric, or 1.67. For samples with yttrium substitution, the
amount of yttrium was considered when calculating the Ca:P ratio because yttrium substitutes
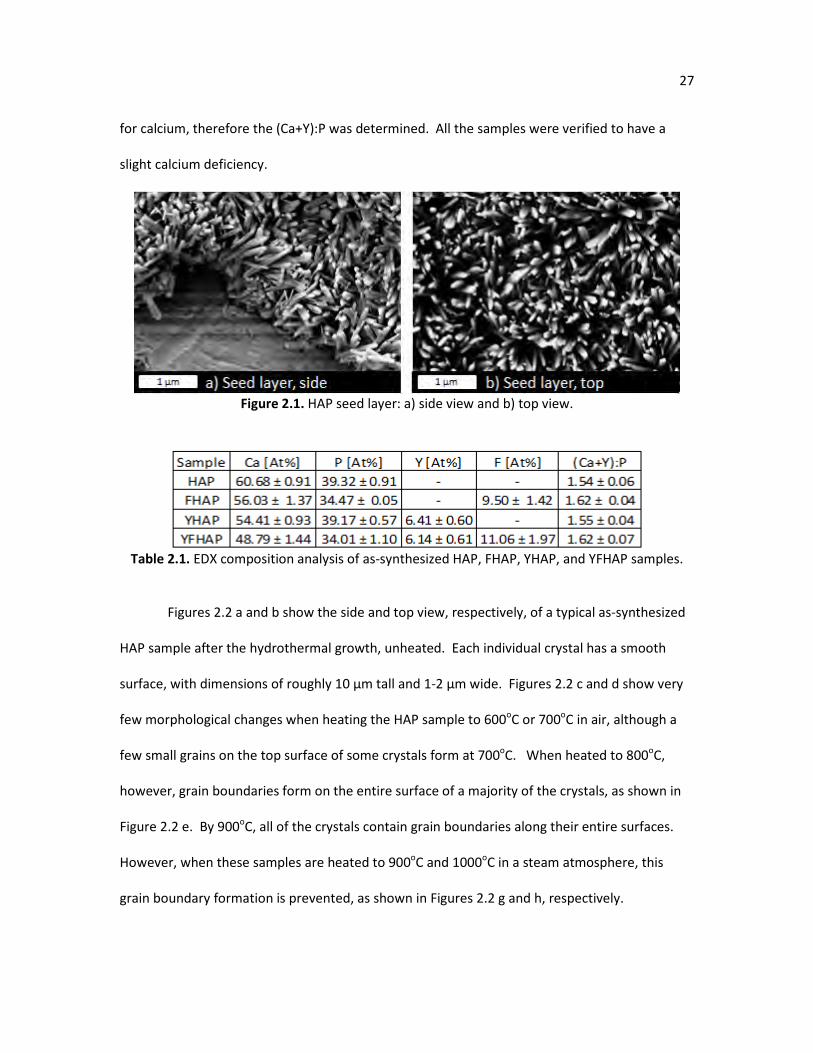
27
for calcium, therefore the (Ca+Y):P was determined. All the samples were verified to have a
slight calcium deficiency.
Figure 2.1. HAP seed layer: a) side view and b) top view.
Table 2.1. EDX composition analysis of as-synthesized HAP, FHAP, YHAP, and YFHAP samples.
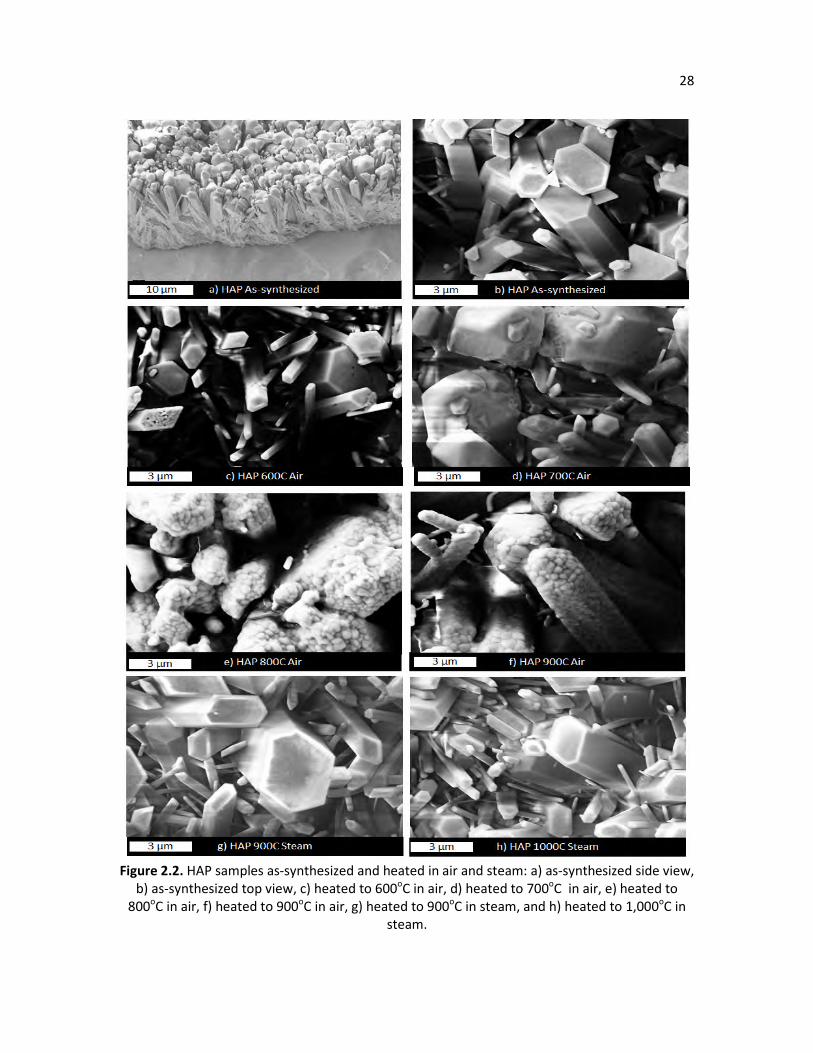
Figures 2.2 a and b show the side and top view, respectively, of a typical as-synthesized
HAP sample after the hydrothermal growth, unheated. Each individual crystal has a smooth
surface, with dimensions of roughly 10 µm tall and 1-2 µm wide. Figures 2.2 c and d show very
few morphological changes when heating the HAP sample to 600oC or 700oC in air, although a
few small grains on the top surface of some crystals form at 700oC. When heated to 800oC,
however, grain boundaries form on the entire surface of a majority of the crystals, as shown in
Figure 2.2 e. By 900oC, all of the crystals contain grain boundaries along their entire surfaces.
However, when these samples are heated to 900oC and 1000oC in a steam atmosphere, this
grain boundary formation is prevented, as shown in Figures 2.2 g and h, respectively.
28
Figure 2.2. HAP samples as-synthesized and heated in air and steam: a) as-synthesized side view,
b) as-synthesized top view, c) heated to 600oC in air, d) heated to 700oC in air, e) heated to 800oC in air, f) heated to 900oC in air, g) heated to 900oC in steam, and h) heated to 1,000oC in
steam.
29
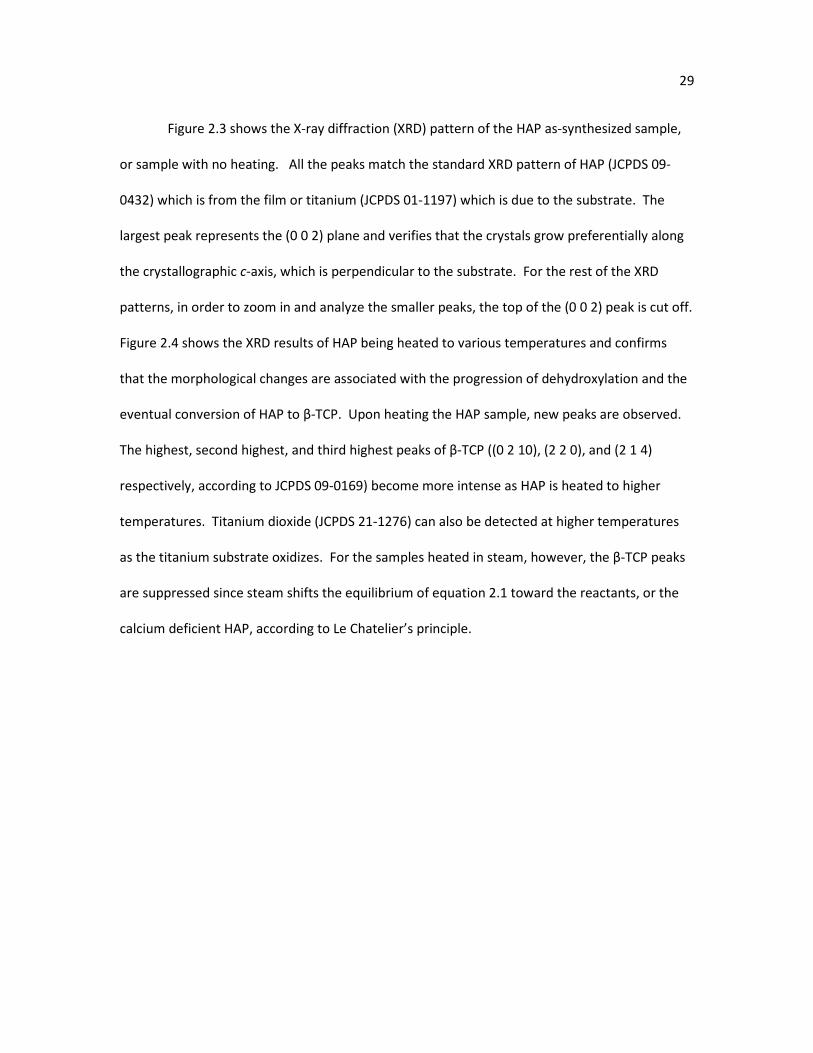
Figure 2.3 shows the X-ray diffraction (XRD) pattern of the HAP as-synthesized sample,
or sample with no heating. All the peaks match the standard XRD pattern of HAP (JCPDS 09-
0432) which is from the film or titanium (JCPDS 01-1197) which is due to the substrate. The
largest peak represents the (0 0 2) plane and verifies that the crystals grow preferentially along
the crystallographic c-axis, which is perpendicular to the substrate. For the rest of the XRD
patterns, in order to zoom in and analyze the smaller peaks, the top of the (0 0 2) peak is cut off.
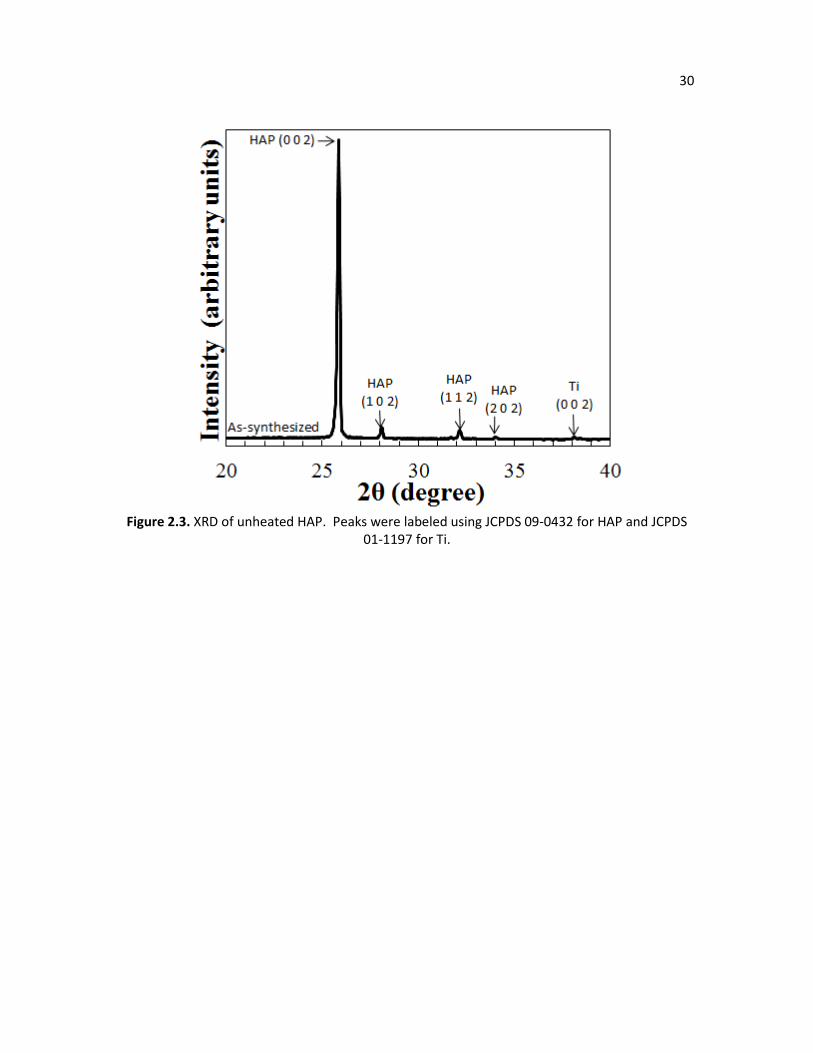
Figure 2.4 shows the XRD results of HAP being heated to various temperatures and confirms
that the morphological changes are associated with the progression of dehydroxylation and the
eventual conversion of HAP to β-TCP. Upon heating the HAP sample, new peaks are observed.
The highest, second highest, and third highest peaks of β-TCP ((0 2 10), (2 2 0), and (2 1 4)
respectively, according to JCPDS 09-0169) become more intense as HAP is heated to higher
temperatures. Titanium dioxide (JCPDS 21-1276) can also be detected at higher temperatures
as the titanium substrate oxidizes. For the samples heated in steam, however, the β-TCP peaks
are suppressed since steam shifts the equilibrium of equation 2.1 toward the reactants, or the
calcium deficient HAP, according to Le Chatelier’s principle.
30
Figure 2.3. XRD of unheated HAP. Peaks were labeled using JCPDS 09-0432 for HAP and JCPDS
01-1197 for Ti.
31
Figure 2.4. XRD of HAP samples as-synthesized, heated to 900oC in steam, heated to 1,000oC in
steam, heated to 600oC in air, heated to 700oC in air, heated to 800oC in air, and heated to 900oC in air. Peaks were labeled using JCPDS 09-0432 for HAP, JCPDS 09-0169 for β-TCP, JCPDS 01-
1197 for Ti, and JCPDS 21-1276 for TiO2.
Figure 2.5 shows SEM images of FHAP samples as-synthesized and being heated from
700-900oC in air. The crystals maintain the same morphology after every heating process
investigated, showing an enhanced thermal stability for fluorinated samples. Figure 2.6 shows
the XRD pattern of the FHAP samples being heated. None of the β-TCP peaks are detected upon
heating, confirming the hypothesis that fluoride’s high affinity for protons and its ability to
create a more ordered structure can prevent dehydroxylation.
32
Figure 2.5. FHAP samples as-synthesized and heated in air: a) as-synthesized side view, b) as-
synthesized top view, c) heated to 700oC in air, d) heated to 800oC in air, and e) heated to 900oC in air
33
Figure 2.6. XRD of FHAP samples as-synthesized, heated to 700oC in air, heated to 800oC in air,
and heated to 900oC in air. Peaks were labeled using JCPDS 09-0432 for HAP, JCPDS 09-0169 for β-TCP, JCPDS 01-1197 for Ti, and JCPDS 21-1276 for TiO2.
Figure 2.7 shows SEM images of YHAP samples as-synthesized and after being heated to
600-900oC in air. The crystal morphology begins to show signs of changes at 600oC, and above
700oC multiple grain boundaries form on most crystals. Figure 2.8 shows the XRD pattern of
these samples, with enhanced peaks for β-TCP arising upon heating. Therefore, yttrium
substitution alone does not prevent dehydroxylation, as expected.
34
Figure 2.7. YHAP samples as-synthesized and heated in air: a) as-synthesized side view, b) as-synthesized top view, c) heated to 600oC in air, d) heated to 700oC in air, e) heated to 800oC in
air, and f) heated to 900oC in air.
35
Figure 2.8. XRD of YHAP samples as-synthesized, heated to 600oC in air, heated to 700oC in air, heated to 800oC in air, and heated to 900oC in air. Peaks were labeled using JCPDS 09-0432 for
HAP, JCPDS 09-0169 for β-TCP, JCPDS 01-1197 for Ti, and JCPDS 21-1276 for TiO2.
Figure 2.9 shows SEM images of YFHAP samples as-synthesized and being heated to 800
and 900oC in air. The crystals maintain the same morphology after heating at both
temperatures. The XRD pattern in Figure 2.10 shows that none of the major β-TCP peaks form,
which demonstrates the ability of fluoride to maintain thermal stability with other dopants.
Therefore, a variety of elements can potentially be doped with fluoride to modify the crystal
properties, yet with an enhanced thermal stability. It should be noted that the high peak
intensity for TiO2 is observed at 900oC due to the fact that the YFHAP samples are roughly half as
thick as the HAP, FHAP, and YHAP samples, making TiO2 easier to detect on YFHAP samples that
are heated.
36
Figure 2.9. YFHAP samples as-synthesized and heated in air: a) as-synthesized side view, b) as-
synthesized top view, c) heated to 800oC in air, and d) heated to 900oC in air.
37
Figure 2.10. XRD of YFHAP samples as-synthesized, heated to 800oC in air, and heated to 900oC
in air. Peaks were labeled using JCPDS 09-0432 for HAP, JCPDS 09-0169 for β-TCP, JCPDS 01-1197 for Ti, and JCPDS 21-1276 for TiO2.
Table 2.3 is a quantitative comparison of the amount of β-TCP in HAP and YHAP at
various temperatures from X-ray diffraction using the equation for relative intensity (R.I.):
(. . ) = !@(#$%#),($$#),'($%())*!@(##$) +100 2.3
The integral intensity is the area under the specified β-TCP peak; either (0 2 10), (2 2 0), or (2 1
4), or the HAP (0 0 2) peak. The HAP and YHAP samples heated in air clearly have increased
amounts of β-TCP as temperature is increased, while the FHAP, YFHAP, and HAP samples heated
in steam had no quantifiable amounts of β-TCP.
38
Table 2.2. Relative intensities of β-TCP formation. Relative intensities were calculated using the ratio of the integral intensity of the (0 2 10), (2 2 0), or (2 1 4) peak of β-TCP with respect to the
integral intensity of the (0 0 2) HAP peak.
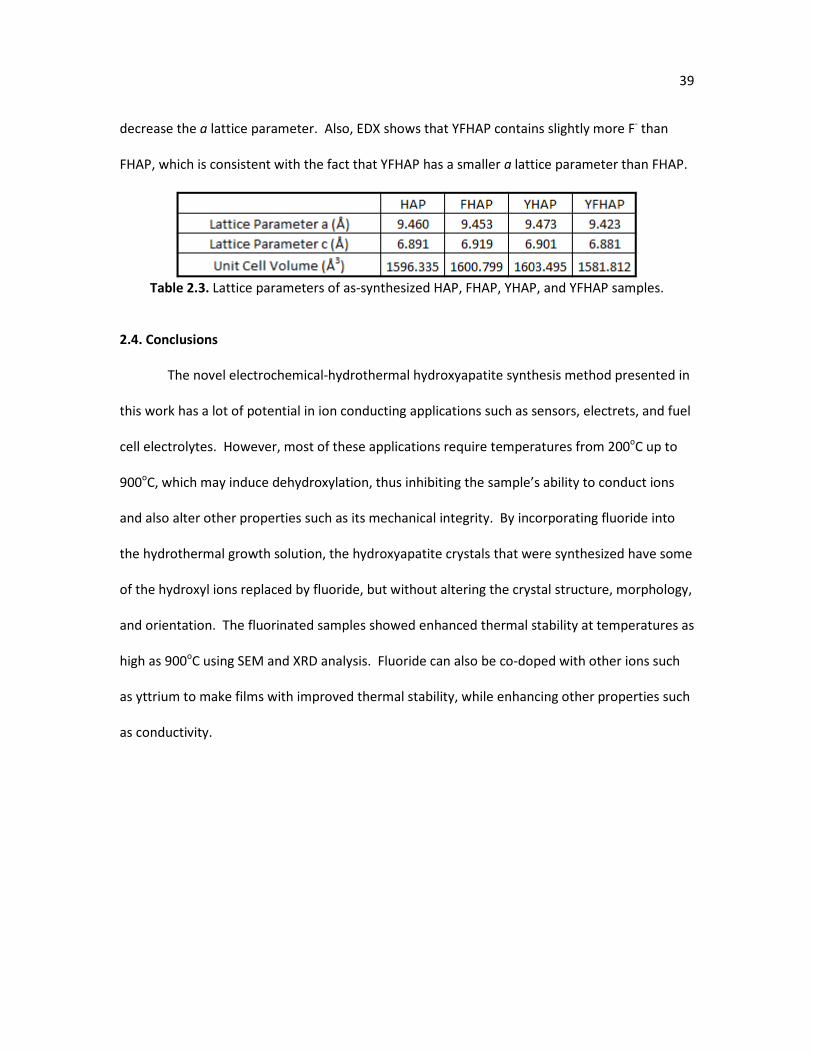
The XRD patterns were also used to calculate the a and c lattice parameters for each as-
synthesized sample after the hydrothermal growth. The c lattice parameter was calculated from
the (0 0 2) peak using the hexagonal close-packed (HCP) unit cell relationship given in equation
2.4 below:
%./ =
(0
1/21323// + + /
5/ 2.4
where d is the d-spacing, or distance between adjacent planes in the set of Miller indices (h k l),
and a and c represent the a and c lattice parameters, respectively. Once the c lattice parameter
was known, the a lattice parameter could be determined from the (1 0 2) peak and using
equation 2.4. The volume (V) of the hexagonal unit cell was calculated using equation 2.5:
V = 2.589a2c 2.5
Lattice parameters and unit cell volumes of all the as-synthesized samples are given in Table 2.2.
The samples have similar lattice parameters to standard HAP (JCPDS 9-0432), where a = 9.418
and c = 6.884. Evis et al. has shown that doping Y+3 and F- in HAP does not dramatically impact
the lattice parameters, with increasing F- content only slightly decreasing the a lattice
parameter.[16] The results in Table 2.3 also show that F- substitution does indeed slightly
39
decrease the a lattice parameter. Also, EDX shows that YFHAP contains slightly more F- than
FHAP, which is consistent with the fact that YFHAP has a smaller a lattice parameter than FHAP.
Table 2.3. Lattice parameters of as-synthesized HAP, FHAP, YHAP, and YFHAP samples.
2.4. Conclusions
The novel electrochemical-hydrothermal hydroxyapatite synthesis method presented in
this work has a lot of potential in ion conducting applications such as sensors, electrets, and fuel
cell electrolytes. However, most of these applications require temperatures from 200oC up to
900oC, which may induce dehydroxylation, thus inhibiting the sample’s ability to conduct ions
and also alter other properties such as its mechanical integrity. By incorporating fluoride into
the hydrothermal growth solution, the hydroxyapatite crystals that were synthesized have some
of the hydroxyl ions replaced by fluoride, but without altering the crystal structure, morphology,
and orientation. The fluorinated samples showed enhanced thermal stability at temperatures as
high as 900oC using SEM and XRD analysis. Fluoride can also be co-doped with other ions such
as yttrium to make films with improved thermal stability, while enhancing other properties such
as conductivity.
40
References
1. Koutsopoulos, S., Synthesis and characterization of hydroxyapatite crystals: A review
study on the analytical methods. Journal of Biomedical Materials Research, 2002. 62: p. 600-612.
2. S.Ban and S. Maruno, Hydrothermal-electrochemical deposition of hydroxyapatite.
Journal of Biomedical Materials Research, 1998. 42: p. 387-395. 3. Andres-Verges, M., et al., A new route for the synthesis of calcium-deficient
hydroxyapatites with low Ca/P ratio: Both spectroscopic and electric characterization. Journal of Materials Research, 2000. 15: p. 2526-2533.
4. Nakamura, S., H. Takeda, and K. Yamashita, Proton transport polarization and
depolarization of hydroxyapatite ceramics. Journal of Applied Physics, 2001. 89: p. 5386-5391.
5. Tanka, Y., et al., Ionic conduction mechanism in Ca-deficient hydroxyapatite whiskers.
Materials Science and Engineering, 2009. 161: p. 115-119. 6. Tanaka, Y., et al., Polarization and microstructural effects of ceramic hydroxyapatite
electrets. Journal of Applied Physics, 2010. 107: p. 1-10. 7. S.Raynaud, et al., Calcium phosphate apatites with variable Ca/P atomic ratio I.
Synthesis, characterisation and thermal stability of powders. Biomaterials, 2002. 23: p. 1065-1072.
8. Maiti, G. and F. Freund, Influence of Fluorine Substitution on the Proton Conductivity of
Hydroxyapatite. J. Chem. Soc., Dalton Trans., 1981: p. 949-955. 9. Yamashita, K., K. Kitagaki, and T. Umegaki, Thermal Instability and Proton Conductivity of
Ceramic Hydroxyapatite at High Temperatures. J. Am. Ceram. Soc., 1995. 78([5]): p. 1191-97.
10. Chen, Y. and X. Miao, Thermal and chemical stability of fluorohydroxyapatite ceramics
with different fluorine contents. Biomaterials, 2005. 26: p. 1205-1210. 11. Eslami, H., M. Solati-Hashjin, and M. Tahriri, Effect of fluorine ion addition on structural,
thermal, mechanical, solubility and biocompatibility characteristics of hydroxyapatite
nanopowders. Advances in Applied Ceramics, 2010. 109: p. 200-212. 12. Nasr, S., et al., Effect of fluorine on the thermal stability of the magnesium-substituted
hydroxyapatite. Annales De Chimie-Science Des Materiaux, 2011. 36: p. 159-176.
41
13. Owada, H., et al., Humidity-Sensitivity of Yttrium Substituted Apatite Ceramics. Solid State Ionics, 1989. 35: p. 401-404.
14. Owada, H., K. Yamashita, and T. Kanazawa, High-temperature stability of hydroxyl ions in
yttrium-substituted oxyhydroxyapatites. Journal of Materials Science Letters, 1990. 9: p. 26-28.
15. Tanaka, Y., et al., Fast oxide ion conduction due to carbonate substitution in
hydroxyapatite. Journal of American Ceramic Society, 2010. 93: p. 3577-3579.
16. Basar, B., et al., Improvements in microstructural, mechanical, and biocompatibility
properties of nano-sized hydroxyapatites doped with yttrium and fluoride. Ceramics International, 2010. 36: p. 1633-1643.
42
Chapter 3
Stored Charge Analysis of Yttrium-fluoride Co-doped Hydroxyapatite Membranes
3.1. Introduction
Hydroxyapatite (HAP) is a highly studied material in the orthopedics community as an
implant coating and bone filler due to its similar composition to bone and its osteoconductive
properties.[1-8] Recently, there has been a lot of interest to improve HAP’s osteoconductive
properties by negatively polarizing HAP’s surface with a high electric field (>1 kV/cm) at elevated
temperatures (T > 300oC).[9-16] Negatively charged HAP surfaces have been shown to improve
osteoblast adhesion and stimulate new apatite formation since the negative surface attracts
positively charged proteins and calcium ions via electrostatic attraction,[10, 12, 17, 18],
although a recent study has shown that a significant factor in cell adhesion and growth may be
due to any heat treatment that removes surface carbon contamination.[19] Regardless of the
uncertainty over polarization’s impact on cell growth and adhesion, the ability to polarize HAP
films is well documented.[10, 11, 13, 14, 19] Figure 3.1a shows the atomic environment around
the OH- ion chains, which are parallel to the c-axis and contain Ca2+ triangles surrounding them.
An unpolarized HAP sample will have H+ randomly occupy the upper or lower site of O2- to form
the OH- group, as shown in Figure 3.1b.[11] With a high enough electric field (> 1 kV/cm) at
elevated temperatures ( > 211oC), H+ begins to rotate to either the upper or lower site on O2-,
aligning in the direction of the electric field as shown in Figure 3.1c.[11] Eventually, H+ ions can
migrate to a neighboring O2- that has a H+ vacancy, thus allowing for long range H+ conduction,
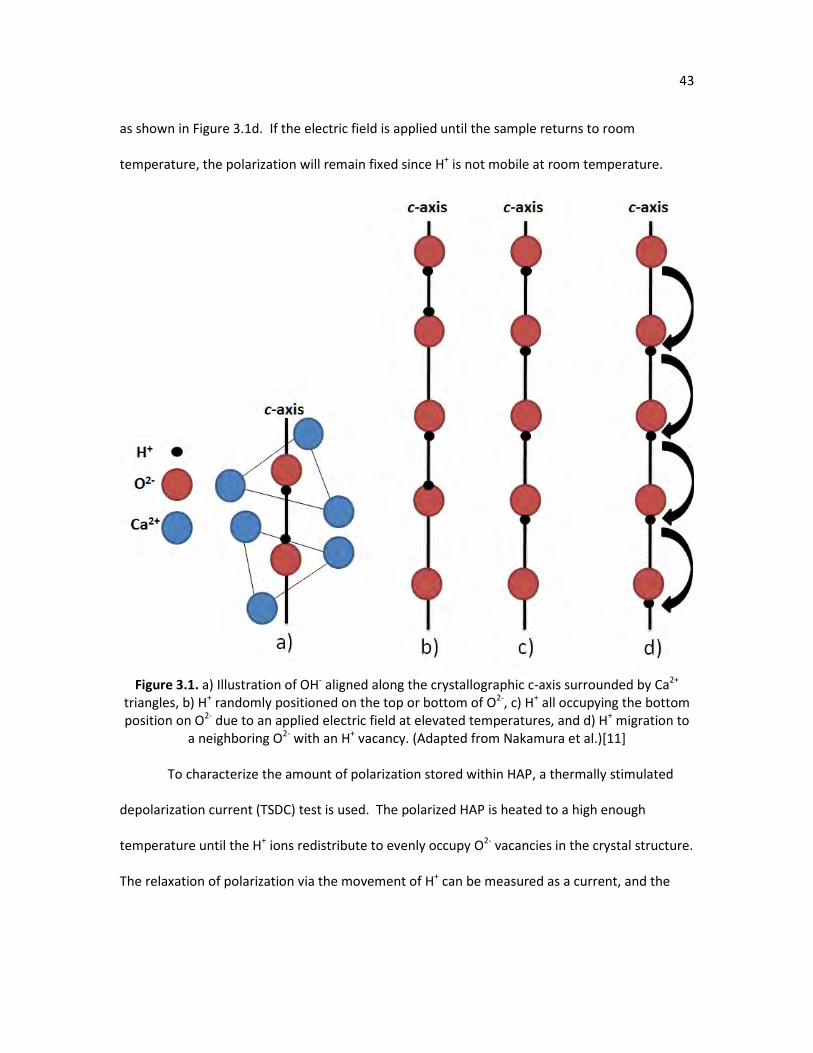
43
as shown in Figure 3.1d. If the electric field is applied until the sample returns to room
temperature, the polarization will remain fixed since H+ is not mobile at room temperature.
Figure 3.1. a) Illustration of OH- aligned along the crystallographic c-axis surrounded by Ca2+
triangles, b) H+ randomly positioned on the top or bottom of O2-, c) H+ all occupying the bottom position on O2- due to an applied electric field at elevated temperatures, and d) H+ migration to
a neighboring O2- with an H+ vacancy. (Adapted from Nakamura et al.)[11]
To characterize the amount of polarization stored within HAP, a thermally stimulated
depolarization current (TSDC) test is used. The polarized HAP is heated to a high enough
temperature until the H+ ions redistribute to evenly occupy O2- vacancies in the crystal structure.
The relaxation of polarization via the movement of H+ can be measured as a current, and the
44
total stored charge can be calculated by integrating the area under the current curve as a
function of temperature.
This section will present TSDC results of yttrium-fluoride co-doped hydroxyapatite
(YFHAP) membranes prepared using a two-step process. First, HAP was seeded onto titanium
substrates by either electrochemical deposition or drying a suspension of HAP nanocrystals onto
the substrate. Then, the HAP seeded substrates were subjected to a hydrothermal growth step
in which they were also co-doped with Y3+ and F-. YFHAP was chosen because previous work has
shown that Y3+ and F- in the hydrothermal solution can produce dense films that have
preferential orientation along the crystallographic c-axis. Second, Y3+ doped HAP has been
shown to produce extra O2- vacancies in the crystal structure in order to maintain charge
neutrality, producing HAP with the chemical formula Ca10‑XYX(PO4)6(OH)2‑XOX.[20, 21] These
extra O2- vacancies have been shown to improve H+ conductivity in HAP.[22] The TSDC results of
this section are unique since the samples were shown to have a very large stored charge
without any polarization step. Currently, there are no known HAP samples that have a
measurable stored charge using TSDC analysis without previous polarization by an external
electric field. Second, not only do the unpolarized samples contain a measured stored charge,
but the value is around one order of magnitude higher than the highest stored charge of 4.3
mC/cm2 recorded for polarized carbonated HAP.[13] The large stored charge is speculated to
come from a composition gradient along YFHAP’s crystal length.
3.2. Experimental
Materials
Titanium(Ti) substrates (12.5 mm x 12.5 mm and 0.89 mm thick), platinum foil (25 mm x
25 mm and 0.127 mm thick), analytical grade Ca(NO3)2·4H2O (99.0% purity), and Y(NO3)3·6H2O
45
(99.9% purity) were purchased from Alfa Aesar. (NH4)2HPO4 (>99.0% purity) was purchased
from EMD. K2HPO4 (99.99% purity), CaCl2·2H2O (99+% purity), NaCl (≥99.0% purity),
tris(hydroxymethyl)- aminomethane (tris) (99.8+% purity), and disodium
ethylenediaminetetraacetate dihydrate (Na2EDTA·2H2O) (ACS reagent, 99.0-101.0% purity) were
all obtained from Sigma- Aldrich. NH4F (ACS reagent, 98% purity) was purchased from Aldrich
Chemical Company, Inc. 36.5-38.0% hydrochloric acid and 28.0-30.0% pure ammonium
hydroxide were purchased from Mallinckrodt Chemicals. Detergent powder was purchased
from Alconox. Plasma sprayed HAP samples were provided by APS Materials, Inc, Dayton, OH.
Nanohydroxyapatite (0.4 wt%) dispersed in water was provided by Transparent Materials,
Rochester, NY. Deionized water was used for all solutions.
Electrochemical deposition of HAP seeds (EdepSeed)
Titanium substrates were gently polished with SiC paper (800 grit) to provide surface
roughness. The substrates were then thoroughly washed with Alconox detergent powder,
rinsed with tap water, attached to a silver wire by tightly wrapping the wire through a premade
hole in the substrate, sonicated in an ethanol/acetone (volume ratio = 50/50) solvent for 30
minutes, and then rinsed with deionized water. An electrolyte solution was prepared containing
138 mM NaCl, 50 mM tris, 1.25 mM CaCl2, and 0.828 mM K2HPO4 in 125 mL deionized water per
substrate. The solution was buffered to pH 7.2 using hydrochloric acid. The electrolyte solution
was then heated to 95°C. The substrate and a platinum plate were held parallel to each other
with a fixed distance of separation of 10 mm. The substrate and platinum plate were connected
to the negative and positive outlets of a direct current power supply (Instek GPS-3030D),
respectively, and immersed in the electrolyte solution. The electrochemical reaction was carried
46
out for 5 minutes at 12.5 mA/cm2 (area relative to the platinum plate), then rinsed off with
deionized water and dried in air.
Deposition of nanohydroxyapatite seed layer (NanoSeed)
A suspension with 0.4 wt% nanohydroxyapatite crystals dispersed in water was provided
by Transparent Materials, Rochester, NY. 50 µl of solution was deposited onto the titanium
substrate. The solution was allowed to dry in a fume hood for at least three hours.
Hydrothermal growth of YFHAP
The hydrothermal solution was prepared by first stirring 0.115M Na2EDTA·2H2O into 30
mL of deionized water per sample until it was completely dissolved. 0.1 M Ca(NO3)2 was then
added, followed by 0.06 M (NH4)2HPO4, 0.01M Y(NO3)3,and 0.02M NH4F. The solution pH was
raised to 10.0 with ammonium hydroxide and then stirred for about 10 minutes. The electrolyte
solution was then transferred to a Teflon-lined stainless steel acid digestion autoclave (Parr Item
No. 4744, 45 mL internal volume), until filled with approximately 60% solution. The seeded
substrate was submersed in the solution with the seed layer facing down and tilted ~45 degrees
relative to the bottom of the autoclave. The autoclave was heated for 15 hours at 200°C and
autogenous pressure. After heating, the autoclave was cooled to room temperature in a fume
hood. The sample was then taken out, rinsed with deionized water several times, and dried in
air.
Thermally stimulated depolarization current (TSDC) measurement
After the hydrothermal deposition, the back sides of the samples were scraped to
remove excess deposition of apatite in order to expose the titanium. Samples then underwent a
mild heat treatment to 300oC for 1 hour with a heating rate of 5oC/minute in order to remove
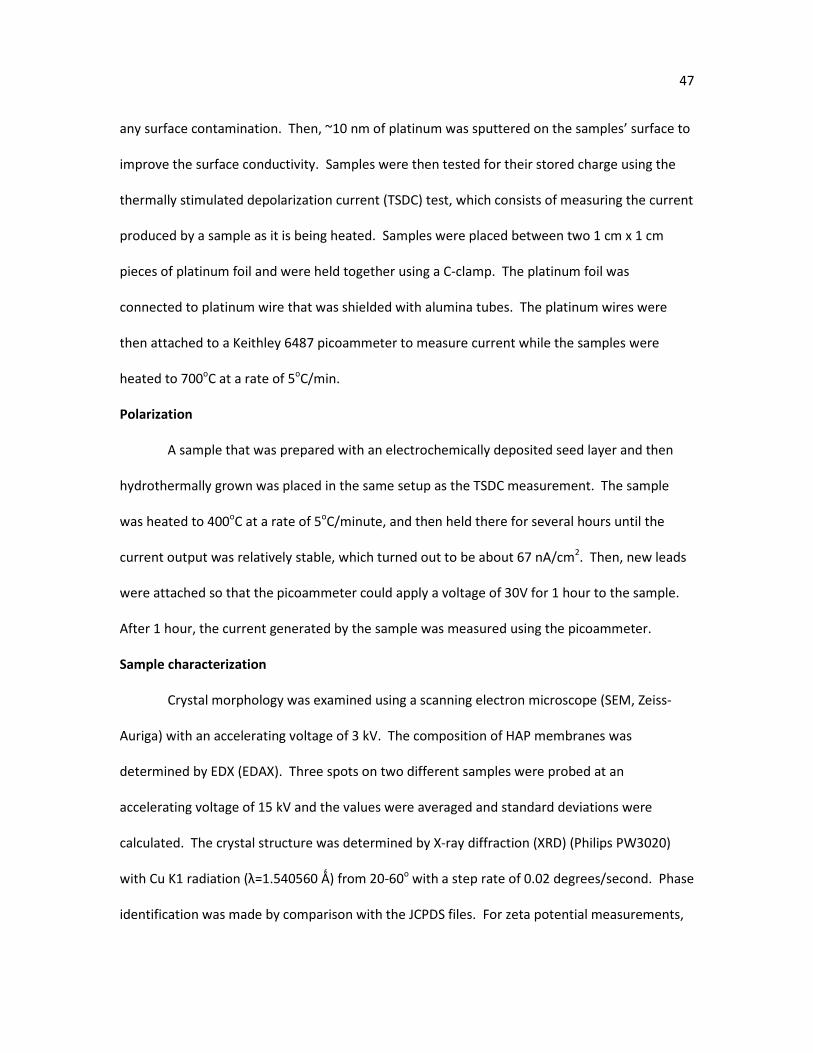
47
any surface contamination. Then, ~10 nm of platinum was sputtered on the samples’ surface to
improve the surface conductivity. Samples were then tested for their stored charge using the
thermally stimulated depolarization current (TSDC) test, which consists of measuring the current
produced by a sample as it is being heated. Samples were placed between two 1 cm x 1 cm
pieces of platinum foil and were held together using a C-clamp. The platinum foil was
connected to platinum wire that was shielded with alumina tubes. The platinum wires were
then attached to a Keithley 6487 picoammeter to measure current while the samples were
heated to 700oC at a rate of 5oC/min.
Polarization
A sample that was prepared with an electrochemically deposited seed layer and then
hydrothermally grown was placed in the same setup as the TSDC measurement. The sample
was heated to 400oC at a rate of 5oC/minute, and then held there for several hours until the
current output was relatively stable, which turned out to be about 67 nA/cm2. Then, new leads
were attached so that the picoammeter could apply a voltage of 30V for 1 hour to the sample.
After 1 hour, the current generated by the sample was measured using the picoammeter.
Sample characterization
Crystal morphology was examined using a scanning electron microscope (SEM, Zeiss-
Auriga) with an accelerating voltage of 3 kV. The composition of HAP membranes was
determined by EDX (EDAX). Three spots on two different samples were probed at an
accelerating voltage of 15 kV and the values were averaged and standard deviations were
calculated. The crystal structure was determined by X-ray diffraction (XRD) (Philips PW3020)
with Cu K1 radiation (λ=1.540560 Ǻ) from 20-60o with a step rate of 0.02 degrees/second. Phase
identification was made by comparison with the JCPDS files. For zeta potential measurements,
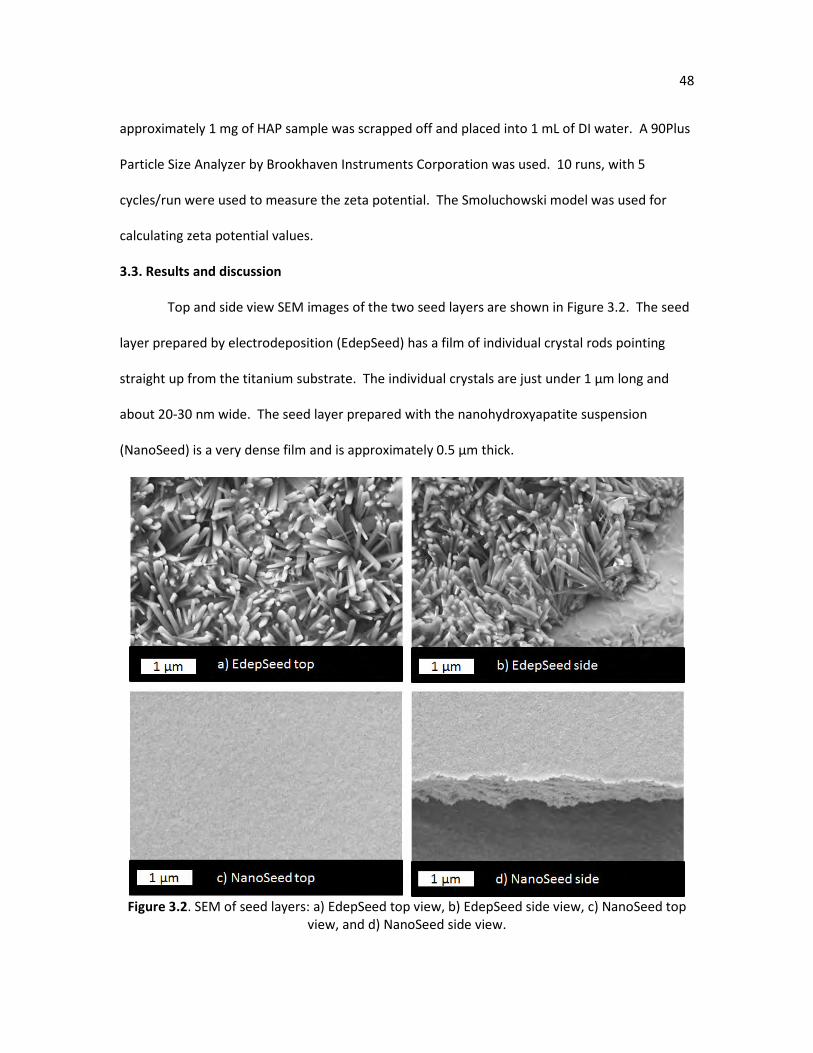
48
approximately 1 mg of HAP sample was scrapped off and placed into 1 mL of DI water. A 90Plus
Particle Size Analyzer by Brookhaven Instruments Corporation was used. 10 runs, with 5
cycles/run were used to measure the zeta potential. The Smoluchowski model was used for
calculating zeta potential values.
3.3. Results and discussion
Top and side view SEM images of the two seed layers are shown in Figure 3.2. The seed
layer prepared by electrodeposition (EdepSeed) has a film of individual crystal rods pointing
straight up from the titanium substrate. The individual crystals are just under 1 µm long and
about 20-30 nm wide. The seed layer prepared with the nanohydroxyapatite suspension
(NanoSeed) is a very dense film and is approximately 0.5 µm thick.
Figure 3.2. SEM of seed layers: a) EdepSeed top view, b) EdepSeed side view, c) NanoSeed top
view, and d) NanoSeed side view.
49
Figure 3.3 shows SEM images of the seed layers after the hydrothermal growth. The
EdepSeed layer after hydrothermal growth (EdepYFHAP) is a very dense film of crystals that are
tightly packed. The side view shows that densely packed single crystals make up the film
thickness. Similar results occur for the NanoSeed layer after a hydrothermal growth
(NanoYFHAP), but the crystals are not quite as dense and the film is slightly thinner. Figure 3.3
also compares the HAP deposited via plasma spraying (PlasmaHAP), which was provided by APS
Materials, Inc, Dayton, OH. PlasmaHAP mostly consists of closely packed spherical HAP particles
that form a film roughly 30 µm thick.
50
Figure 3.3. SEM of YFHAP samples after hydrothermal growth and PlasmaHAP: a) EdepYFHAP
top view, b) EdepYFHAP side view, c) NanoYFHAP top view, d) NanoYFHAP side view, e) PlasmaHAP top view, and f) PlasmaHAP side view.
Figure 3.4 shows the XRD results for all the samples. The seed layer prepared by
electrodchemical deposition (EdepSeed) has some preferential orientation along the c-axis, as
demonstrated by the fact that the (0 0 2) peak is slightly higher than the next highest peak of (2
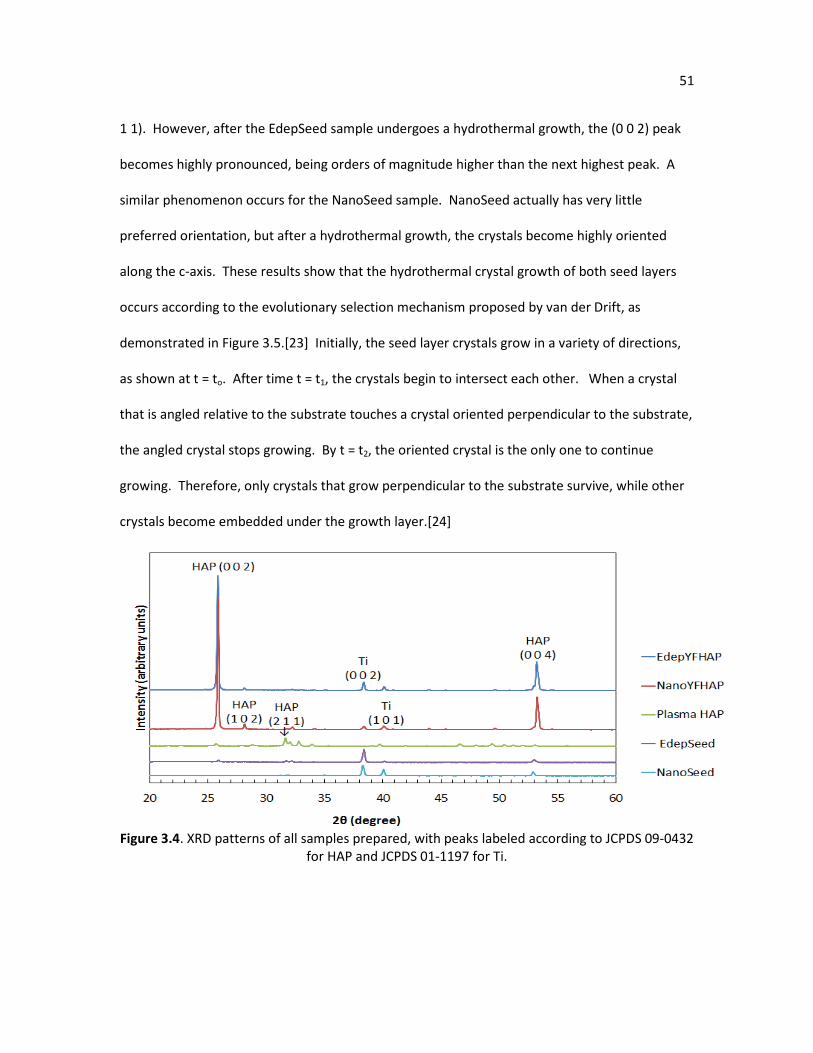
51
1 1). However, after the EdepSeed sample undergoes a hydrothermal growth, the (0 0 2) peak
becomes highly pronounced, being orders of magnitude higher than the next highest peak. A
similar phenomenon occurs for the NanoSeed sample. NanoSeed actually has very little
preferred orientation, but after a hydrothermal growth, the crystals become highly oriented
along the c-axis. These results show that the hydrothermal crystal growth of both seed layers
occurs according to the evolutionary selection mechanism proposed by van der Drift, as
demonstrated in Figure 3.5.[23] Initially, the seed layer crystals grow in a variety of directions,
as shown at t = to. After time t = t1, the crystals begin to intersect each other. When a crystal
that is angled relative to the substrate touches a crystal oriented perpendicular to the substrate,
the angled crystal stops growing. By t = t2, the oriented crystal is the only one to continue
growing. Therefore, only crystals that grow perpendicular to the substrate survive, while other
crystals become embedded under the growth layer.[24]
Figure 3.4. XRD patterns of all samples prepared, with peaks labeled according to JCPDS 09-0432
for HAP and JCPDS 01-1197 for Ti.
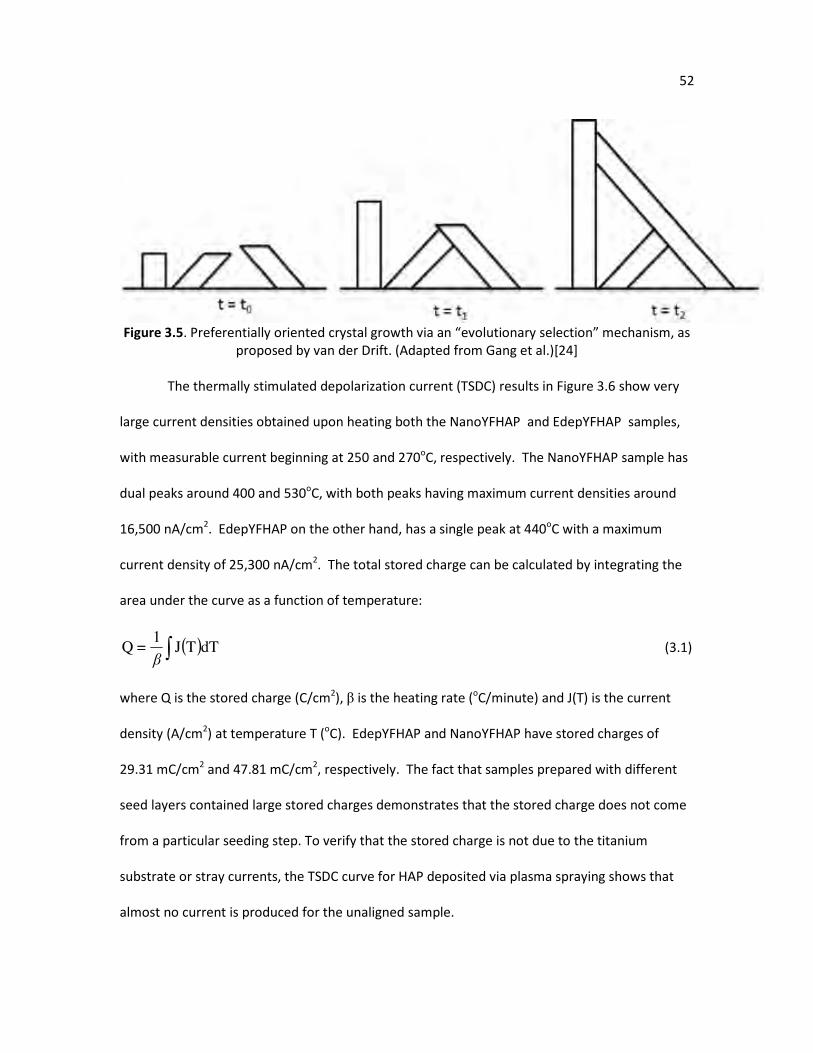
52
Figure 3.5. Preferentially oriented crystal growth via an “evolutionary selection” mechanism, as
proposed by van der Drift. (Adapted from Gang et al.)[24]
The thermally stimulated depolarization current (TSDC) results in Figure 3.6 show very
large current densities obtained upon heating both the NanoYFHAP and EdepYFHAP samples,
with measurable current beginning at 250 and 270oC, respectively. The NanoYFHAP sample has
dual peaks around 400 and 530oC, with both peaks having maximum current densities around
16,500 nA/cm2. EdepYFHAP on the other hand, has a single peak at 440oC with a maximum
current density of 25,300 nA/cm2. The total stored charge can be calculated by integrating the
area under the curve as a function of temperature:
( )dTTJ1
Q ∫β= (3.1)
where Q is the stored charge (C/cm2), β is the heating rate (oC/minute) and J(T) is the current
density (A/cm2) at temperature T (oC). EdepYFHAP and NanoYFHAP have stored charges of
29.31 mC/cm2 and 47.81 mC/cm2, respectively. The fact that samples prepared with different
seed layers contained large stored charges demonstrates that the stored charge does not come
from a particular seeding step. To verify that the stored charge is not due to the titanium
substrate or stray currents, the TSDC curve for HAP deposited via plasma spraying shows that
almost no current is produced for the unaligned sample.
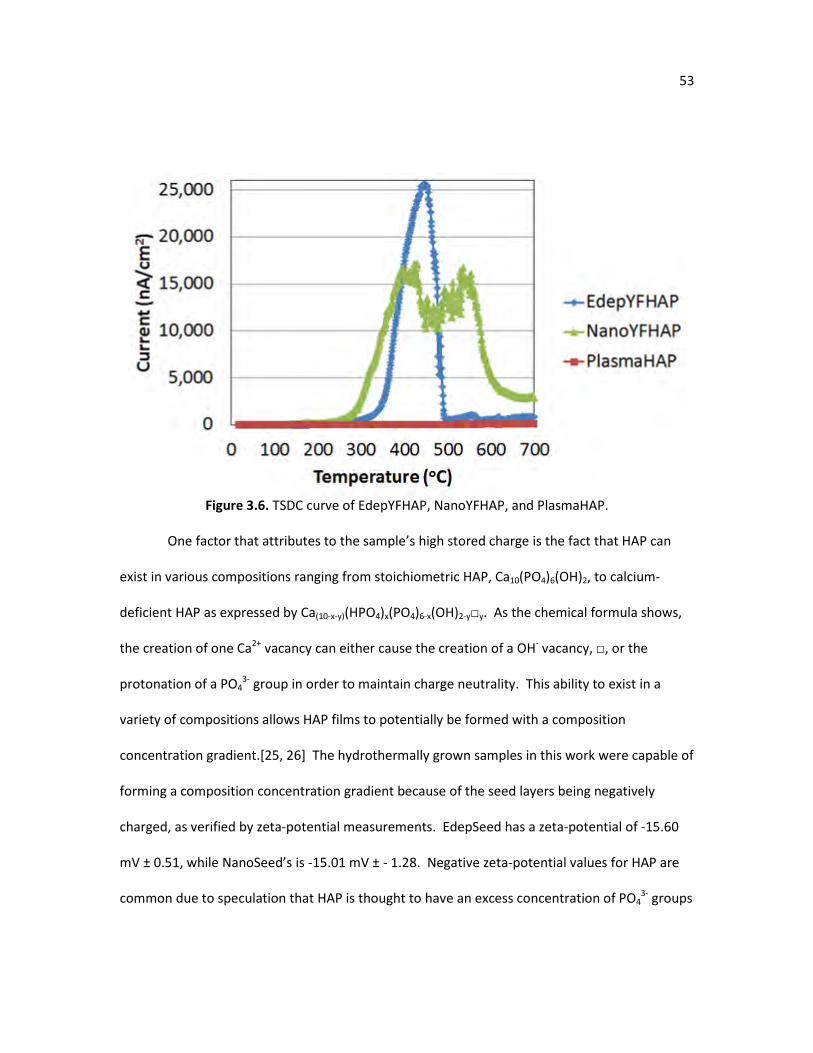
53
Figure 3.6. TSDC curve of EdepYFHAP, NanoYFHAP, and PlasmaHAP.
One factor that attributes to the sample’s high stored charge is the fact that HAP can
exist in various compositions ranging from stoichiometric HAP, Ca10(PO4)6(OH)2, to calcium-
deficient HAP as expressed by Ca(10-x-y)(HPO4)x(PO4)6-x(OH)2-yy. As the chemical formula shows,
the creation of one Ca2+ vacancy can either cause the creation of a OH- vacancy, , or the
protonation of a PO43- group in order to maintain charge neutrality. This ability to exist in a
variety of compositions allows HAP films to potentially be formed with a composition
concentration gradient.[25, 26] The hydrothermally grown samples in this work were capable of
forming a composition concentration gradient because of the seed layers being negatively
charged, as verified by zeta-potential measurements. EdepSeed has a zeta-potential of -15.60
mV ± 0.51, while NanoSeed’s is -15.01 mV ± - 1.28. Negative zeta-potential values for HAP are
common due to speculation that HAP is thought to have an excess concentration of PO43- groups
54
at its surface.[25-27] When the negative seed layers are placed into the hydrothermal solution,
they first interact with the positive Ca2+ ions, forming a Ca2+ rich apatite layer, as depicted in
Figure 3.7. After the Ca2+ rich layer forms, it will interact with the negative phosphate ions in
solution, forming a Ca2+ deficient apatite layer. Eventually, the HAP crystals reach an
equilibrium composition.[25, 26] A potential profile of the composition change within the
hydrothermally grown YFHAP crystals is shown in Figure 3.8. The variation of HPO42- along the
hydrothermally grown YFHAP crystal length provides a change of H+ concentration within the
crystal structure. Upon heating these samples during the TSDC test, the H+ from HPO42- become
mobile and are redistributed to O2- vacancies to form OH- groups. In fact, it has been
demonstrated that for nonstoichiometric HAP, H+ generated from HPO42- predominantly migrate
rather than H+ from OH- below 400oC.[9, 28] This H+ migration is the current being measured as
the YFHAP films are being heated during the TSDC test. Therefore, the hydrothermally grown
YFHAP samples have a built in stored charge due to the variation of composition along their
crystal length. Another piece of evidence that demonstrates there is a concentration gradient of
H+ within the YFHAP crystals is that if the electrodes of the picoammeter are reversed during
TSDC testing, the sign of the current always becomes negative. This demonstrates that the
concentration gradient of H+ always occurs in the same direction of the YFHAP crystals.
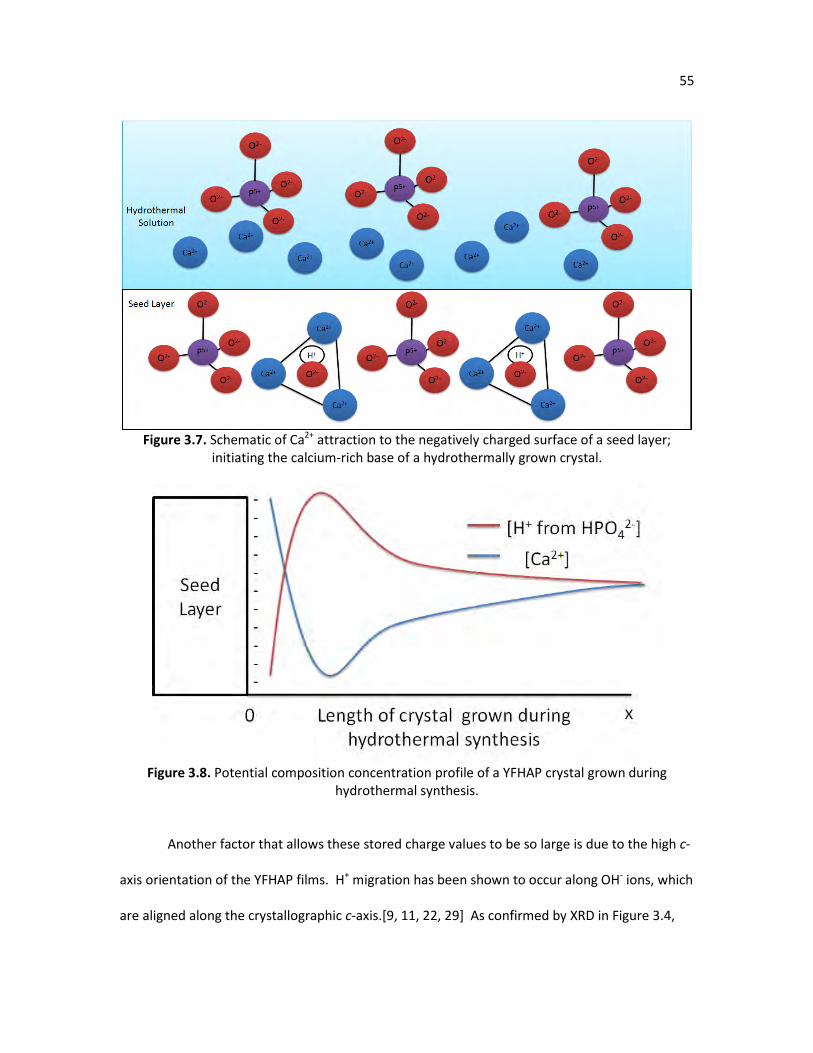
55
Figure 3.7. Schematic of Ca2+ attraction to the negatively charged surface of a seed layer;
initiating the calcium-rich base of a hydrothermally grown crystal.
Figure 3.8. Potential composition concentration profile of a YFHAP crystal grown during
hydrothermal synthesis.
Another factor that allows these stored charge values to be so large is due to the high c-
axis orientation of the YFHAP films. H+ migration has been shown to occur along OH- ions, which
are aligned along the crystallographic c-axis.[9, 11, 22, 29] As confirmed by XRD in Figure 3.4,
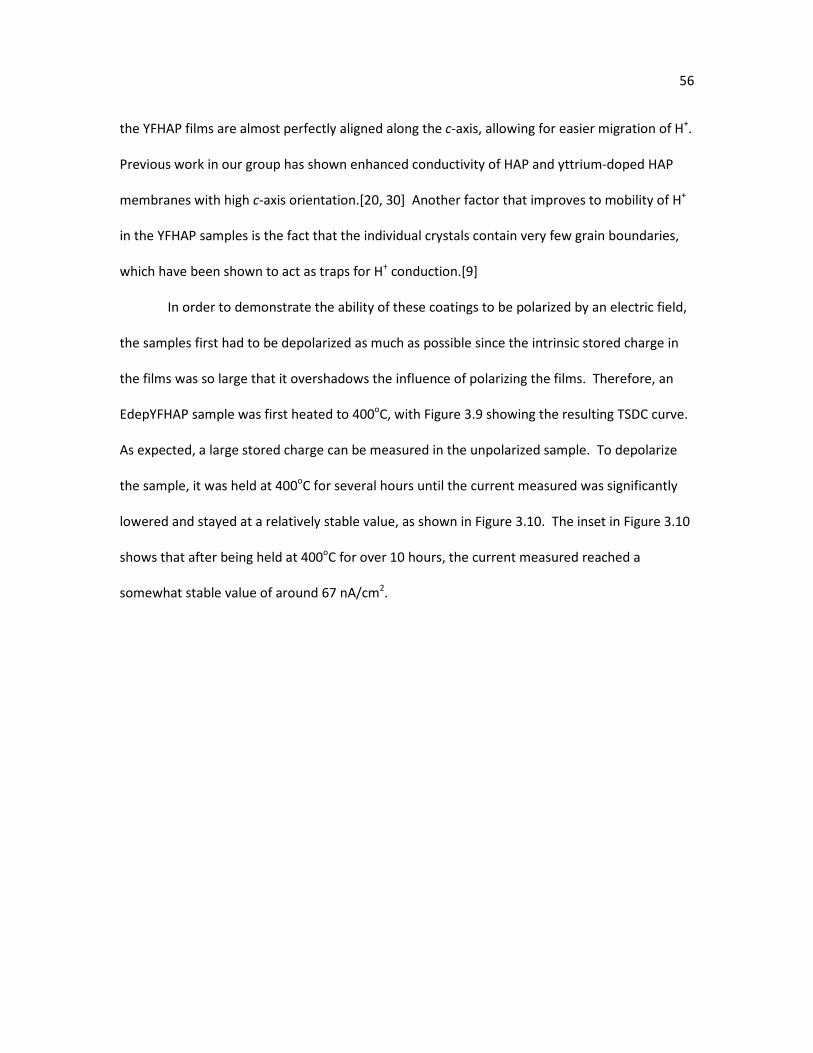
56
the YFHAP films are almost perfectly aligned along the c-axis, allowing for easier migration of H+.
Previous work in our group has shown enhanced conductivity of HAP and yttrium-doped HAP
membranes with high c-axis orientation.[20, 30] Another factor that improves to mobility of H+
in the YFHAP samples is the fact that the individual crystals contain very few grain boundaries,
which have been shown to act as traps for H+ conduction.[9]
In order to demonstrate the ability of these coatings to be polarized by an electric field,
the samples first had to be depolarized as much as possible since the intrinsic stored charge in
the films was so large that it overshadows the influence of polarizing the films. Therefore, an
EdepYFHAP sample was first heated to 400oC, with Figure 3.9 showing the resulting TSDC curve.
As expected, a large stored charge can be measured in the unpolarized sample. To depolarize
the sample, it was held at 400oC for several hours until the current measured was significantly
lowered and stayed at a relatively stable value, as shown in Figure 3.10. The inset in Figure 3.10
shows that after being held at 400oC for over 10 hours, the current measured reached a
somewhat stable value of around 67 nA/cm2.
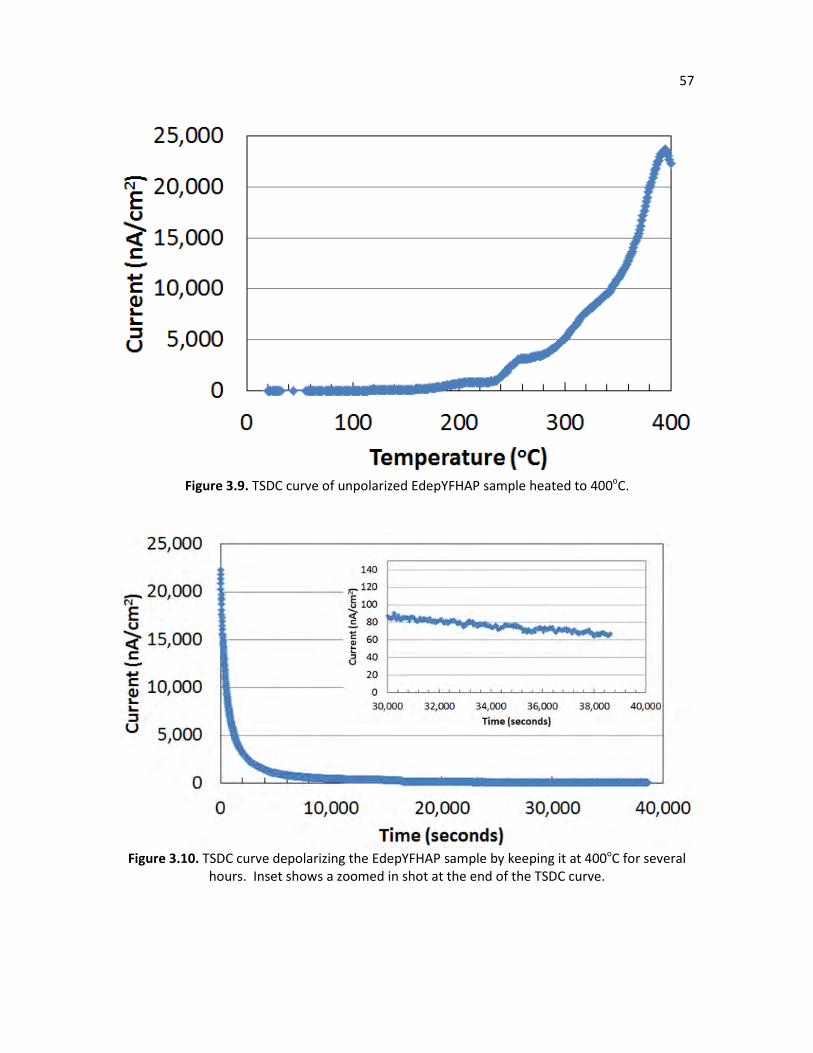
57
Figure 3.9. TSDC curve of unpolarized EdepYFHAP sample heated to 400oC.
Figure 3.10. TSDC curve depolarizing the EdepYFHAP sample by keeping it at 400oC for several
hours. Inset shows a zoomed in shot at the end of the TSDC curve.
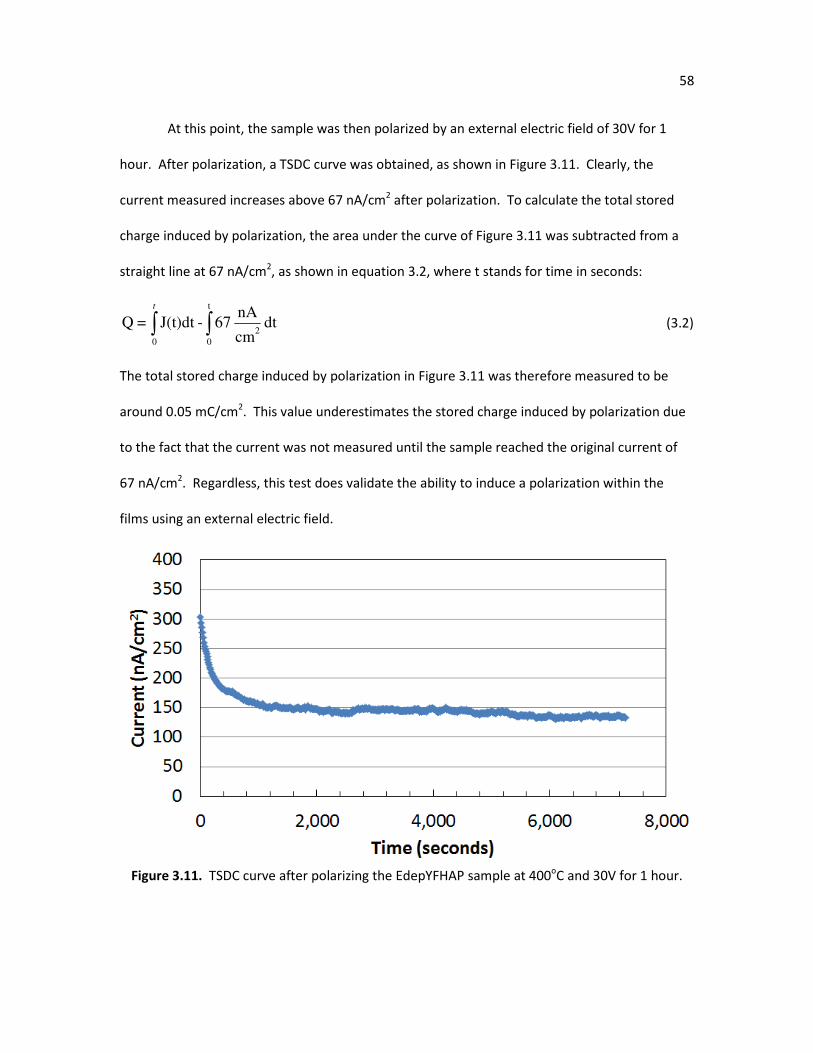
58
At this point, the sample was then polarized by an external electric field of 30V for 1
hour. After polarization, a TSDC curve was obtained, as shown in Figure 3.11. Clearly, the
current measured increases above 67 nA/cm2 after polarization. To calculate the total stored
charge induced by polarization, the area under the curve of Figure 3.11 was subtracted from a
straight line at 67 nA/cm2, as shown in equation 3.2, where t stands for time in seconds:
∫ ∫t
=
0
t
0
2dt
cm
nA 67-J(t)dtQ (3.2)
The total stored charge induced by polarization in Figure 3.11 was therefore measured to be
around 0.05 mC/cm2. This value underestimates the stored charge induced by polarization due
to the fact that the current was not measured until the sample reached the original current of
67 nA/cm2. Regardless, this test does validate the ability to induce a polarization within the
films using an external electric field.
Figure 3.11. TSDC curve after polarizing the EdepYFHAP sample at 400oC and 30V for 1 hour.
59
3.4. Conclusions
Two different HAP seed layers were hydrothermally grown to produce YFHAP films that
contained large stored charge values according to TSDC experiments. The fact that two
different seed layer processes were used shows that the stored charge is not the result of a
particular seeding process. Also, the fact that plasma deposited HAP does not have any stored
charge verifies that the large currents were not from the titanium substrate or stray currents
from the setup. Rather, the stored charge is built into the YFHAP crystals due to a composition
concentration gradient along the crystal length. Due to variations of HPO42- in the crystal
structure, there is a variation of H+ throughout the sample. Upon heating, the H+ becomes
redistributed by migrating to O2- vacancies and forming OH-. The fact that the YFHAP crystals
are highly c-axis oriented and contain few grain boundaries along their crystal length facilitates
the redistribution of H+, leading to the large stored charge values.
60
References
1. Zakaria, S., et al., Nanophase hydroxyapatite as a biomaterial in advanced hard tissue engineering: A review. Tissue Eng. Part B Rev., 2013.
2. Palazzo, B., et al., Biomimetic hydroxyapatite–drug nanocrystals as potential bone substitutes with antitumor drug delivery properties. Advanced Functional Materials, 2007.
17(2180-2188).
3. Schnieders, J., et al., Controlled release of gentamicin from calcium phosphate-
poly(lactic acid-co-glycolic acid) composite bone cement. Biomaterials, 2006. 27: p. 4239-4249.
4. Kar, A., K. Raja, and M. Misra, Electrodeposition of hydroxyapatite onto nanotubular TiO2 for implant applications. Surface and Coatings Technology, 2006. 2001: p. 3723-3731.
5. Yang, Y., k. Kim, and J. Ong, A review on calcium phosphate coatings produced using a
sputtering process—an alternative to plasma spraying. Biomaterials, 2005. 26: p. 327-337.
6. Stigter, M., K.d. Groot, and P. Layrolle, Incorporation of tobramycin into biomimetic
hydroxyapatite coating on titanium. Biomaterials, 2002. 23: p. 4143-4153.
7. Kuo, M. and S. Yen, The process of electrochemical deposited hydroxyapatite coatings on biomedical titanium at room temperature. Materials Science and Engineering C, 2002. 20: p.
153-160.
8. Koutsopoulos, S., Synthesis and characterization of hydroxyapatite crystals: A review study on the analytical methods. Journal of Biomedical Materials Research, 2002. 62: p. 600-612.
9. Tanaka, Y., et al., Polarization and microstructural effects of ceramic hydroxyapatite
electrets. Journal of Applied Physics, 2010. 107: p. 1-10.
10. Kumar, D., et al., Polarization of hydroxyapatite: Influence on osteoblast cell
proliferation. Acta Biomaterialia, 2010. 6: p. 1549-1554.
11. Nakamura, S., H. Takeda, and K. Yamashita, Proton transport polarization and
depolarization of hydroxyapatite ceramics. Journal of Applied Physics, 2001. 89: p. 5386-5391.
12. Yamashita, K., N. Oikawa, and T. Umegaki, Acceleration and deceleration of bone-like crystal growth on ceramic hydroxyapatite by electric poling. Chem. Mater., 1996. 8: p. 2697-
2700.
13. Nagai, A., et al., Electric polarization and mechanism of B-type carbonated apatite
ceramics. Journal of Biomedical Materials Research Part A, 2011. 99A: p. 116-124.
61
14. Bodhak, S., S. Bose, and A. Bandyopadhyay, Role of surface charge and wettability on early stage mineralization and bone cell–materials interactions of polarized hydroxyapatite. Acta Biomaterialia, 2009. 5: p. 2178-2188.
15. Itoh, S., et al., Enhanced bone ingrowth into hydroxyapatite with interconnected pores
by Electrical Polarization. Biomaterials, 2006. 27: p. 5572-5579.
16. Ueshima, M., S. Nakamura, and K. Yamashita, Huge, millicoulomb charge storage in ceramic hydroxyapatite by bimodal electric polarization. Advanced Materials, 2002. 14: p. 591-595.
17. Kobayashi, T., S. Nakamura, and K. Yamashita, Enhanced osteobonding by negative surface charges of electrically polarized hydroxyapatite. Journal of Biomedical Materials
Research Part A, 2001. 57: p. 477-484.
18. Ohgaki, M., et al., Manipulation of selective cell adhesion and growth by surface charges of electrically polarized hydroxyapatite. Journal of Biomedical Materials Research Part A, 2001. 57: p. 366-373.
19. Wolf-Brandstetter, C., et al., The impact of heat treatment on interactions of contact-poled biphasic calcium phosphates with proteins and cells. Acta Biomaterialia, 2012. 8: p. 3468-
3477.
20. Wei, X. and M.Z. Yates, Yttrium-doped hydroxyapatite membranes with high proton conductivity. Chemistry of Materials, 2012. 24: p. 1738-1743.
21. Owada, H., K. Yamashita, and T. Kanazawa, High-temperature stability of hydroxyl ions in yttrium-substituted oxyhydroxyapatites. Journal of Materials Science Letters, 1990. 9: p. 26-
28.
22. Yamashita, K., et al., Protonic conduction in yttrium-substituted hydroxyapatite ceramics and their applicability to H2-O2 fuel cell. Solid State Ionics, 1990. 40/41: p. 918-921.
23. Drift, A.v.d., Evolutionary selection, a principle governing growth orientation in vapor-
deposited layers. Phil. Res. Rep., 1967. 22: p. 267-288.
24. Gang, L., et al., Growth mechanism of a preferentially oriented mordenite membrane.
Journal of Zhejiang University SCIENCE, 2005. 5: p. 369-372.
25. Kim, H., et al., Process and kinetics of bonelike apatite formation on sintered hydroxyapatite in a simulated body fluid. Biomaterials, 2005. 26: p. 4366-4373.
62
26. Brown, P. and R. Martin, An analysis of hydroxyapatite surface layer formation. Journal
of Physical Chemistry B., 1999. 103: p. 1671-1675.
27. Vandiver, J., et al., Nanoscale variation in surface charge of synthetic hydroxyapatite detected by chemically and spatially specific high-resolution force spectroscopy. Biomaterials,
2005. 26(271-283).
28. Tanka, Y., et al., Ionic conduction mechanism in Ca-deficient hydroxyapatite whiskers.
Materials Science and Engineering, 2009. 161: p. 115-119.
29. Yamashita, K., K. Kitagaki, and T. Umegaki, Thermal Instability and Proton Conductivity of Ceramic Hydroxyapatite at High Temperatures. J. Am. Ceram. Soc., 1995. 78: p. 1191-97.
30. Liu, D., K. Savino, and M.Z. Yates, Microstructural engineering of hydroxyapatite membranes to enhance proton conductivity. Advanced Functional Materials, 2009. 19: p. 3941-
3947.
63
Chapter 4
Characterization of Ytterbium and Ytterbium-fluoride Doped Hydroxyapatite Membranes for
Ion Conducting Applications
4.1. Introduction
While hydroxyapatite (HAP, Ca10(PO4)6(OH)2) has been highly studied as a bioceramic
due to its biocompatibility and osteoconductive properties, recent research has focused on
using HAP in new applications such as catalyst supports, gas sensors, ionic exchangers, electrets,
and fuel cell electrolytes due to its ionic conducting abilities.[1-8] HAP belongs to the hexagonal
P63/m space group, with OH- ions forming one-dimensional chains parallel to the c-axis in the
center of Ca2+ triangles.[9] HAP has been shown to be a proton conductor at elevated
temperatures, with the conduction mechanism being proposed to be protons rotating along the
c-axis of the OH- groups.[10] Thermally stimulated depolarization current (TSDC) measurements
indicate that the onset of proton mobility can be as low as 200oC.[4] With proton mobility
occurring at this low of a temperature, HAP has the potential to be an electrolyte for an
intermediate temperature (400-700oC) fuel cell. Intermediate temperature fuel cells have
advantages over traditional low temperature (T < 100oC) fuel cells such as polymer electrolyte
membranes because they do not require expensive rare metal catalysts for the electrodes. High
temperature (T > 800oC) fuel cell electrolytes such as yttria-stabilized zirconia (YSZ) are
problematic because they often require expensive high temperature resistant auxiliary
components, plus the high temperatures often cause mechanical issues such as cracking over
the long term.[11] While intermediate temperatures are ideal for a fuel cell, the ionic
64
conductivity of current intermediate temperature fuel cell electrolytes is too low or they are
chemically unstable for practical applications.[12] While HAP can conduct protons in the
intermediate temperature range, the proton conductivity of a typical HAP pellet sintered in air is
much lower (10-6 S/cm) than the O2- conductivity of current state of the art high temperature
electrolytes such as YSZ (10-2 S/cm at 700oC).[13, 14]
To further enhance HAP’s ionic conductivity, our group has developed a novel method
that deposits c-axis oriented HAP membranes onto metal substrates.[3, 15] The first step is an
electrochemical deposition that seeds the metal surface with submicron HAP crystals. The seed
layer acts as a nucleation site for crystal growth during the second step, which is a hydrothermal
process that increases the size, density, and c-axis orientation of the HAP membrane. The fact
that the crystals are grown preferentially along the c-axis and the individual crystals have very
few grain boundaries means that the protons have a direct path for conduction. These
properties produce proton conductivity values of ~10-4 S/cm at 700oC on palladium
substrates.[3] Not only is the conductivity improved, but the area specific resistance is greatly
reduced compared to sintered pellets of hydroxyapatite because of the 2-3 orders of magnitude
reduction in the HAP membrane thickness. Even with these improvements, the conductivity is
still too low for practical applications as an intermediate temperature fuel cell electrolyte.
Another method to enhance conductivity is to partially dope the HAP crystals with
various cations or anions. Ca2+ can be substituted with monovalent, bivalent, or trivalent cations
such as Na+, Mg2+, and Y3+ respectively, PO43- is typically replaced with a bivalent anion such as
CO32-, and OH- has been exchanged with monovalent anions such as F-.[1, 16-18] When yttrium
is substituted, an apatite with the chemical formula Ca10-xYx(PO4)6(OH)2-xOx is created.[6, 7, 19-
21] Y3+ substitution for Ca2+ converts some OH- groups to O2- in order to maintain charge
65
neutrality. It was shown that as yttrium substitution increases up to x = 0.65, conductivity
increases to a maximum value of ~10-4 S/cm at 800oC. However, when x > 0.65, the apatite
transitions from a pure proton conductor, to a mixed proton/O2- ion conductor, and eventually
to a pure O2- ion conductor, with the conductivity falling to ~10-7 S/cm at 800oC. Previous work
in our group has shown that with yttrium substitution, conductivity values approaching 10-2
S/cm at 700oC can be obtained.[22] Carbonate substitution has also been shown to improve
conductivity, giving values approaching 10-3 S/cm at 700oC.[1] As with yttrium substitution, a
similar conversion to O2- ion conduction is observed with increased carbonate substitution.
One drawback to using hydroxyapatite for high temperature ion conducting applications
is their potential for dehydroxylation. Nonstoichiometric hydroxyapatite can begin
dehydroxylation as low as 500oC.[13] Since the proton conduction mechanism is dependent on
OH- ions, conductivity decreases as dehydroxylation occurs. Conductivity values can decrease by
103 S/cm after only 24 hours for HAP pellets and films that have become dehydroxylated.[13]
To prevent dehydroxylation, fluoride substitution has been shown to improve the thermal
stability of HAP.[23] Proton conduction was even shown to increase with the addition of up to
50% F- substitution, but decreased with higher levels of substitution due to the strong
electronegativity of F- and their affinity for protons.[8]
While a variety of elements have been doped into the HAP crystal structure to influence
biological, mechanical, and ionic properties, very little is known about how elements from the
lanthanide series impact the crystal growth and structure of hydroxyapatite membranes.
Doping with elements from the lanthanide series may be of interest since they are trivalent
cations. As mentioned with yttrium, trivalent cations can convert OH- to O2-, and potentially
improve HAP’s conductivity. Therefore, preliminary experiments in this work were done to
66
introduce various elements from the lanthanide series into the HAP crystal structure using a
novel electrochemical-hydrothermal technique. Since it was desired to test conductivity and
fuel cell performance measurements on the doped HAP films, it was necessary to produce highly
dense films in order to prevent hydrogen gas crossover during measurements. It was found that
ytterbium (Yb3+) doped HAP (YbHAP) was the most suitable dopant to form a fully dense and
smooth membrane. The effect of Yb3+ concentration on the crystal morphology, crystal
structure, and composition was further evaluated. Also, a co-doped ytterbium-fluoride HAP
(YbFHAP) sample was synthesized and characterized since fluorinated HAP has been shown to
have enhanced thermal stability at elevated temperatures, which is critical during conductivity
and fuel cell testing.
To test the conductivity and fuel cell performance of the YbHAP and YbFHAP
membranes, it was necessary to deposit the coating on a substrate that could act as a support
structure for the membrane, while also being the anode for hydrogen oxidation. Previous work
has shown that palladium can serve as a hydrogen membrane at elevated temperatures.[12, 24]
When exposed to palladium at temperatures above 300oC, hydrogen will dissociate into protons
and electrons, with the protons traveling through the palladium. In this work, a thin palladium
film (~10-20 µm) was electrolessly deposited onto one side of a porous stainless steel
substrate.[25] The porous stainless steel provides mechanical support for the thin palladium
film, as compared to using palladium foil that could support itself (80-100 µm). The decreased
thickness of palladium reduces the resistance of protons traveling through the palladium
membrane. The reduced thickness also minimizes the amount of palladium used, which lowers
cost. After the YbHAP and YbFHAP electrolyte was then deposited onto the palladium anode, a
cathode catalyst paste of La0.6Sr0.4Co0.2Fe0.8O3-x (LSCF) (~40 µm) was brush coated on top of the
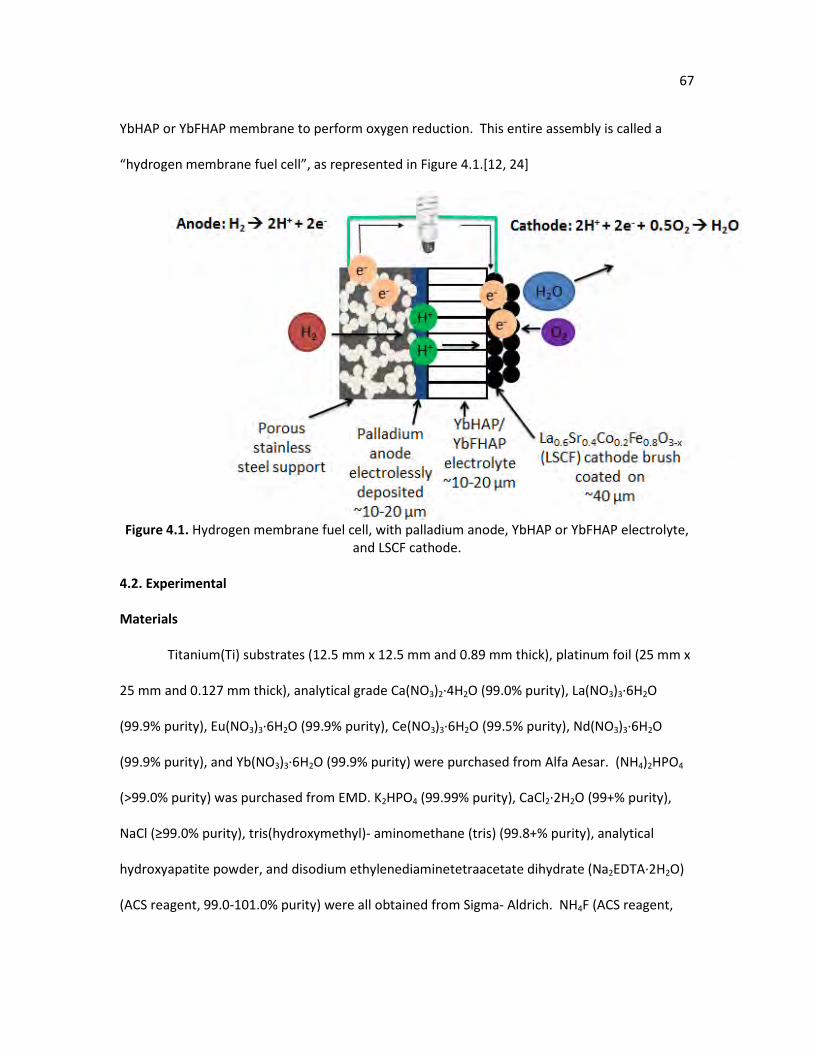
67
YbHAP or YbFHAP membrane to perform oxygen reduction. This entire assembly is called a
“hydrogen membrane fuel cell”, as represented in Figure 4.1.[12, 24]
Figure 4.1. Hydrogen membrane fuel cell, with palladium anode, YbHAP or YbFHAP electrolyte,
and LSCF cathode.
4.2. Experimental
Materials
Titanium(Ti) substrates (12.5 mm x 12.5 mm and 0.89 mm thick), platinum foil (25 mm x
25 mm and 0.127 mm thick), analytical grade Ca(NO3)2·4H2O (99.0% purity), La(NO3)3·6H2O
(99.9% purity), Eu(NO3)3·6H2O (99.9% purity), Ce(NO3)3·6H2O (99.5% purity), Nd(NO3)3·6H2O
(99.9% purity), and Yb(NO3)3·6H2O (99.9% purity) were purchased from Alfa Aesar. (NH4)2HPO4
(>99.0% purity) was purchased from EMD. K2HPO4 (99.99% purity), CaCl2·2H2O (99+% purity),
NaCl (≥99.0% purity), tris(hydroxymethyl)- aminomethane (tris) (99.8+% purity), analytical
hydroxyapatite powder, and disodium ethylenediaminetetraacetate dihydrate (Na2EDTA·2H2O)
(ACS reagent, 99.0-101.0% purity) were all obtained from Sigma- Aldrich. NH4F (ACS reagent,
68
98% purity) was purchased from Aldrich Chemical Company, Inc. La0.6Sr0.4Co0.2Fe0.8O3-x (LSCF)
paste was obtained from NexTech Materials. Platinum paint came from SPI Supplies. 36.5-
38.0% hydrochloric acid and 28.0-30.0% pure ammonium hydroxide were purchased from
Mallinckrodt Chemicals. Detergent powder was purchased from Alconox. Sintered porous
stainless steel discs (0.5 µm pore size, 19.05 mm diameter, 1.59 mm thick) were obtained from
Mott Corporation. Deionized water was used for all solutions.
Preparation of palladium on porous stainless steel (PSS)
Samples prepared for conductivity and fuel cell testing were deposited onto a PSS
substrate that was coated with a thin layer of palladium using a reported electroless deposition
process.[25] The PSS substrate was first cleaned with an alkaline solution that consisted of of 5
g Na3PO4, 16.25 g Na2CO3, 11.26 g NaOH, and 1.25 g Alconox powder in 250 mL of DI water. The
substrate was sonicated for 1h in a water bath at 60oC. Then the substrates were removed,
rinsed off with tap water, and sonicated in DI water for another hour. The sample was then
sonicated for 15 minutes in isopropanol and allowed to dry by placing samples in an oven for 30
minutes at 140oC. Finally, the substrate was placed in 1M HCl for 10 minutes, followed by
sonicating in DI water for 10 minutes.
Two beakers were then prepared for the surface activation. Beaker one contained 1 g/L
SnCl2*2H20 and 1 ml/L concentrated HCl in DI water, while beaker two contained 0.1 g PdCl2 and
1 ml concentrated HCl in 100 ml DI water. Both solutions were stirred until the chemicals fully
dissolved. Then the cleaned PSS substrates were immersed in beaker one for 5 minutes at room
temperature, rinsed with DI water, then immersed in beaker two for 4 minutes at room
temperature. The samples were rinsed with 0.01M HCl, then rinsed with DI water, and placed
back in beaker one for 5 minutes. This process was repeated five more times until a uniform,
69
brownish gray surface appeared. The samples were then dried for 2 hour at 140oC. One of the
activated sides was lightly scraped off using a box cutter blade since the palladium only needs to
be deposited on one side.
A plating solution was then prepared with 4 g/L Pd(NH3)4Cl2*H2O, 198 ml/L NH4OH
(28%), 40.1 g/L Na2EDTA, and 6 ml/L of 1M H2NNH2, giving a pH ~7.4. Samples were attached
with silver wire through the hole in the substrate so that the sides with the scraped off
activation layer were touching. The samples were placed in a volume of plating solution
according to the ratio Vsolution/Splating area ~3.5 cm3/cm2 for 90-120 minutes at 60oC, then rinsed
with 60oC water. The substrates were then placed in fresh plating solution for another 90-120
minutes. This process was repeated (usually 5-6 times) until a dense palladium layer of about 20
µm was formed.
The substrates were then annealed at a temperature of 640oC for 2 hours using a ramp
rate of 5oC/minute. Hydrogen was applied when the sample reached 300oC at a rate of
200cc/minute, then turned off before the sample cooled down to 300oC to avoid palladium
embrittlement.
Electrochemical deposition of HAP seeds
Samples for XRD and EDX characterization were deposited on titanium substrates, while
samples prepared for conductivity and fuel cell performance were deposited onto PSS-Pd. PSS-
Pd and titanium substrates were gently polished with SiC paper (800 grit) to provide surface
roughness. The substrates were then thoroughly washed with Alconox detergent powder,
rinsed with tap water, attached to a silver wire by tightly wrapping the wire through a premade
hole in the substrate, sonicated in an ethanol/acetone (volume ratio = 50/50) solvent for 30
minutes, and then rinsed with deionized water. An electrolyte solution was prepared containing
70
138 mM NaCl, 50 mM tris, 1.25 mM CaCl2, and 0.828 mM K2HPO4 in 125 mL deionized water per
substrate. The solution was buffered to pH 7.2 using hydrochloric acid. The electrolyte solution
was then heated to 95°C. The substrate and a platinum plate were held parallel to each other
with a fixed distance of separation of 10 mm. The substrate and platinum plate were connected
to the negative and positive outlets of a direct current power supply (Instek GPS-3030D),
respectively, and immersed in the electrolyte solution. The electrochemical reaction was carried
out for 5 minutes at 12.5 mA/cm2 (area relative to the platinum plate), then rinsed off with
deionized water and dried in air.
Hydrothermal growth
The hydrothermal solution was prepared by first stirring Na2EDTA·2H2O into 30 mL of
deionized water per sample until it was completely dissolved. The concentration of
Na2EDTA·2H2O was dependent on the concentrations of Ca2+ and Yb3+ (or La3+, Ce3+, Nd3+, and
Eu3+) in the solution according to the equation [EDTA] = [Ca2+] + 1.5[Yb3+]. 0.1 M Ca(NO3)2·4H2O
was then added, followed by 0.06 M (NH4)2HPO4. For La3+, Eu3+, Ce3+, and Nd3+ samples, 0.01M
La(NO3)3·6H2O, Eu(NO3)3·6H2O, Ce(NO3)3·6H2O, and Nd(NO3)3·6H2O of was added to the
hydrothermal solution, respectively. For Yb3+ doped HAP, Yb(NO3)3·6H2O was added in amounts
ranging from 0.05M to 0.03M (YbHAP(0.005M) to YbHAP(0.03M)) for composition and XRD
analysis. A co-doped ytterbium-fluoride sample (YbFHAP) was also prepared, which contained
0.01M Yb(NO3)3·6H2O and 0.02M NH4F. A fluorinated sample (FHAP) was prepared with the
same composition as YbFHAP, except without the ytterbium. A YbFHAP sample was prepared
on PSS-Pd for conductivity and fuel cell performance tests, as well as a YbHAP(0.01M) sample.
The pH of each solution was raised to 10.0 with ammonium hydroxide and then stirred for about
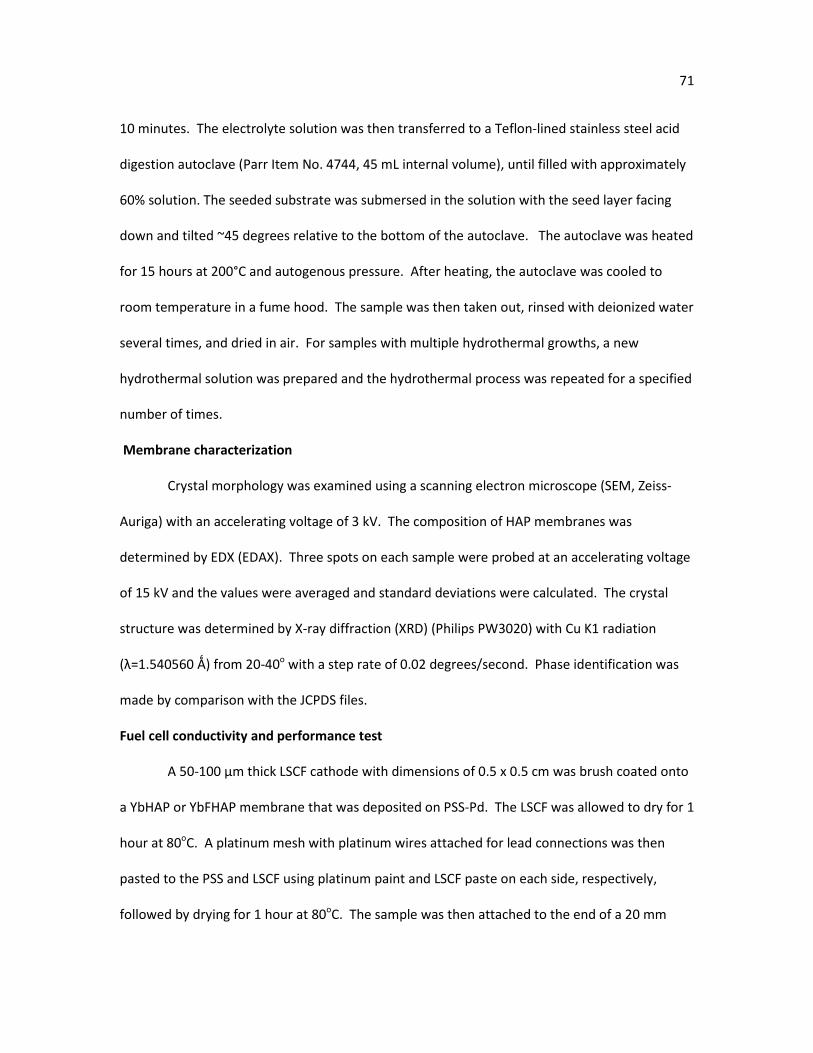
71
10 minutes. The electrolyte solution was then transferred to a Teflon-lined stainless steel acid
digestion autoclave (Parr Item No. 4744, 45 mL internal volume), until filled with approximately
60% solution. The seeded substrate was submersed in the solution with the seed layer facing
down and tilted ~45 degrees relative to the bottom of the autoclave. The autoclave was heated
for 15 hours at 200°C and autogenous pressure. After heating, the autoclave was cooled to
room temperature in a fume hood. The sample was then taken out, rinsed with deionized water
several times, and dried in air. For samples with multiple hydrothermal growths, a new
hydrothermal solution was prepared and the hydrothermal process was repeated for a specified
number of times.
Membrane characterization
Crystal morphology was examined using a scanning electron microscope (SEM, Zeiss-
Auriga) with an accelerating voltage of 3 kV. The composition of HAP membranes was
determined by EDX (EDAX). Three spots on each sample were probed at an accelerating voltage
of 15 kV and the values were averaged and standard deviations were calculated. The crystal
structure was determined by X-ray diffraction (XRD) (Philips PW3020) with Cu K1 radiation
(λ=1.540560 Ǻ) from 20-40o with a step rate of 0.02 degrees/second. Phase identification was
made by comparison with the JCPDS files.
Fuel cell conductivity and performance test
A 50-100 µm thick LSCF cathode with dimensions of 0.5 x 0.5 cm was brush coated onto
a YbHAP or YbFHAP membrane that was deposited on PSS-Pd. The LSCF was allowed to dry for 1
hour at 80oC. A platinum mesh with platinum wires attached for lead connections was then
pasted to the PSS and LSCF using platinum paint and LSCF paste on each side, respectively,
followed by drying for 1 hour at 80oC. The sample was then attached to the end of a 20 mm
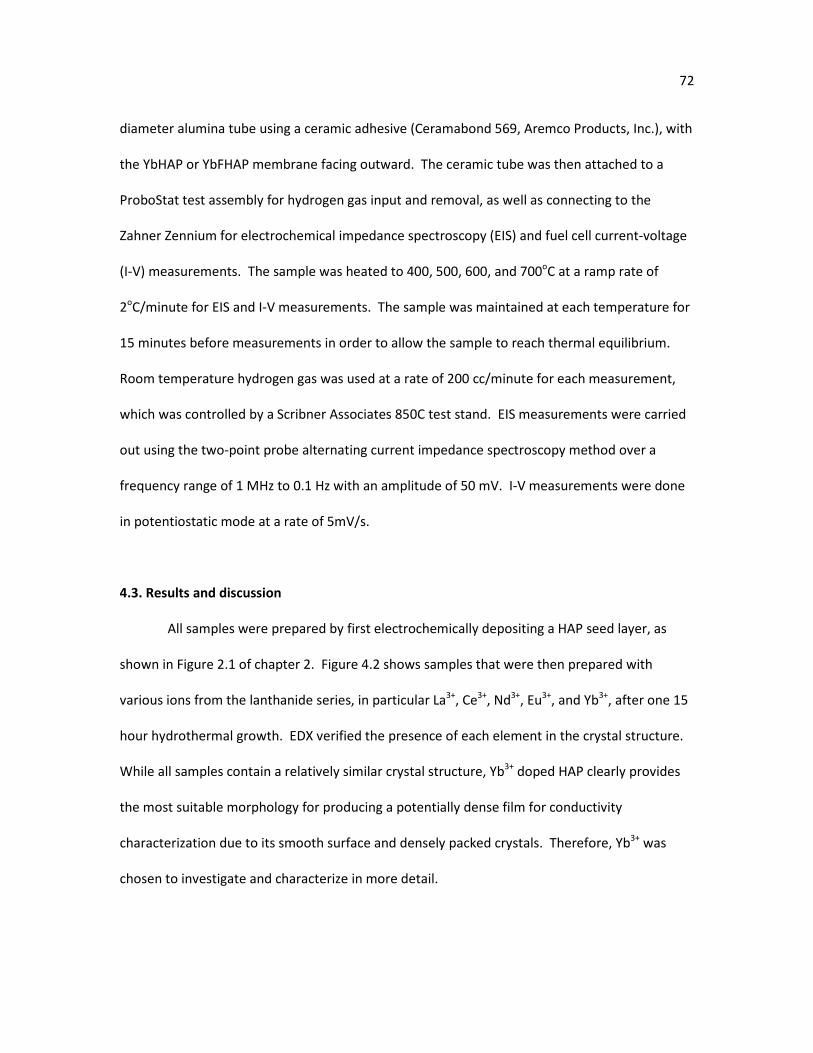
72
diameter alumina tube using a ceramic adhesive (Ceramabond 569, Aremco Products, Inc.), with
the YbHAP or YbFHAP membrane facing outward. The ceramic tube was then attached to a
ProboStat test assembly for hydrogen gas input and removal, as well as connecting to the
Zahner Zennium for electrochemical impedance spectroscopy (EIS) and fuel cell current-voltage
(I-V) measurements. The sample was heated to 400, 500, 600, and 700oC at a ramp rate of
2oC/minute for EIS and I-V measurements. The sample was maintained at each temperature for
15 minutes before measurements in order to allow the sample to reach thermal equilibrium.
Room temperature hydrogen gas was used at a rate of 200 cc/minute for each measurement,
which was controlled by a Scribner Associates 850C test stand. EIS measurements were carried
out using the two-point probe alternating current impedance spectroscopy method over a
frequency range of 1 MHz to 0.1 Hz with an amplitude of 50 mV. I-V measurements were done
in potentiostatic mode at a rate of 5mV/s.
4.3. Results and discussion
All samples were prepared by first electrochemically depositing a HAP seed layer, as
shown in Figure 2.1 of chapter 2. Figure 4.2 shows samples that were then prepared with
various ions from the lanthanide series, in particular La3+, Ce3+, Nd3+, Eu3+, and Yb3+, after one 15
hour hydrothermal growth. EDX verified the presence of each element in the crystal structure.
While all samples contain a relatively similar crystal structure, Yb3+ doped HAP clearly provides
the most suitable morphology for producing a potentially dense film for conductivity
characterization due to its smooth surface and densely packed crystals. Therefore, Yb3+ was
chosen to investigate and characterize in more detail.
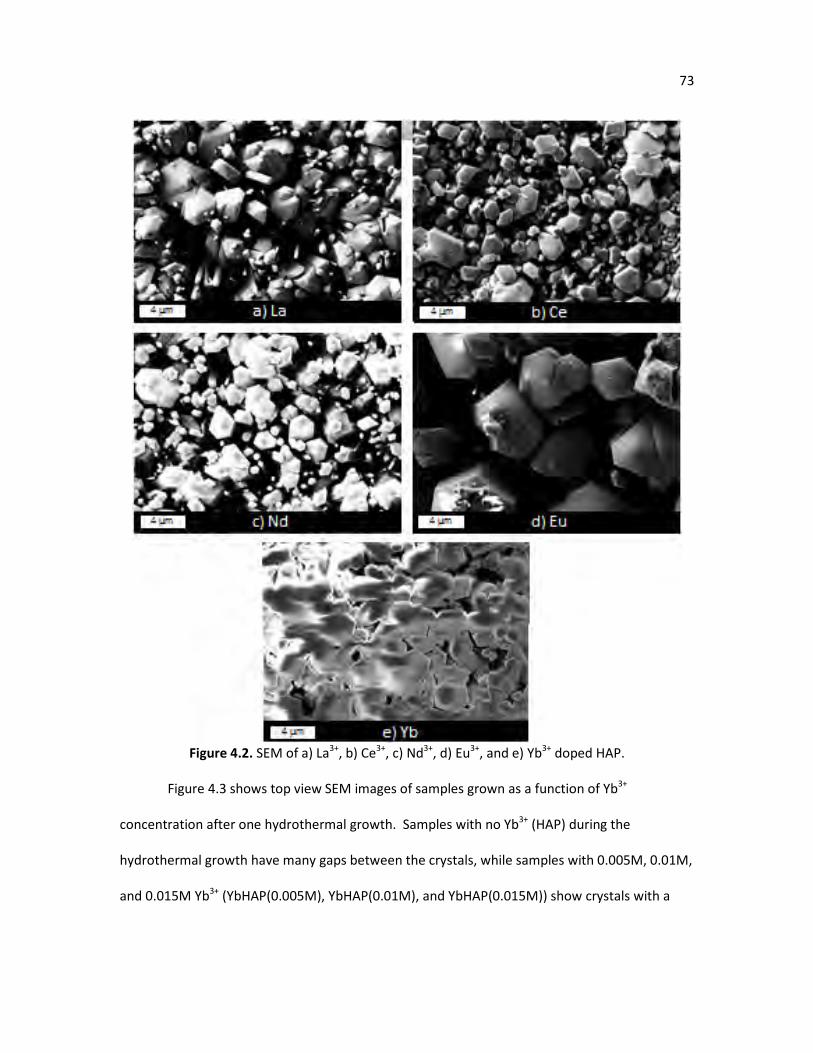
73
Figure 4.2. SEM of a) La3+, b) Ce3+, c) Nd3+, d) Eu3+, and e) Yb3+ doped HAP.
Figure 4.3 shows top view SEM images of samples grown as a function of Yb3+
concentration after one hydrothermal growth. Samples with no Yb3+ (HAP) during the
hydrothermal growth have many gaps between the crystals, while samples with 0.005M, 0.01M,
and 0.015M Yb3+ (YbHAP(0.005M), YbHAP(0.01M), and YbHAP(0.015M)) show crystals with a
74
smooth surface and are densely packed. The YbHAP(0.02M) sample shows that the crystals
begin to have more gaps between them, while the YbHAP(0.03M) sample seems to change from
a hexaganol surface to pyramidal, with many gaps at the surface.
To understand the morphological changes as Yb3+ concentration increases, composition
analysis was done using EDX and the results are shown in Table 4.1. The ratio of Ca2+ to Yb3+
actually incorporated into the crystals (CaEDX/YbEDX) almost matches the ratio of Ca2+ to Yb3+ in
the hydrothermal solution (CaHydrothermal/YbHydrothermal) for YbHAP(0.005M) and YbHAP(0.01M).
For YbHAP(0.015M) and YbHAP(0.02M), even though 50% and 100% more Yb3+ was
incorporated into the hydrothermal solution compared to YbHAP(0.01M), respectively, only
slightly more Yb3+ was incorporated into the crystal structure. However, a dramatic increase of
Yb3+ incorporated into the crystals occurs for YbHAP(0.03M). This dramatic change of
composition correlates to the morphological changes that occur for YbHAP(0.03M) in Figure 4.3
f.
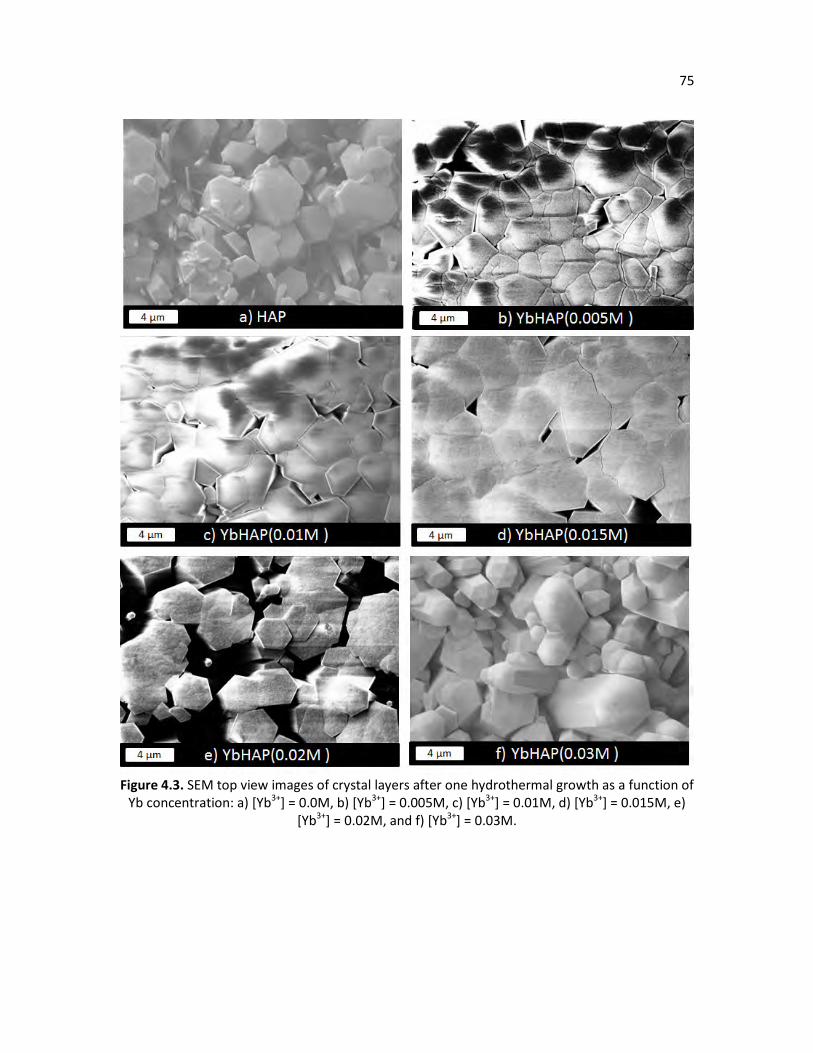
75
Figure 4.3. SEM top view images of crystal layers after one hydrothermal growth as a function of
Yb concentration: a) [Yb3+] = 0.0M, b) [Yb3+] = 0.005M, c) [Yb3+] = 0.01M, d) [Yb3+] = 0.015M, e) [Yb3+] = 0.02M, and f) [Yb3+] = 0.03M.
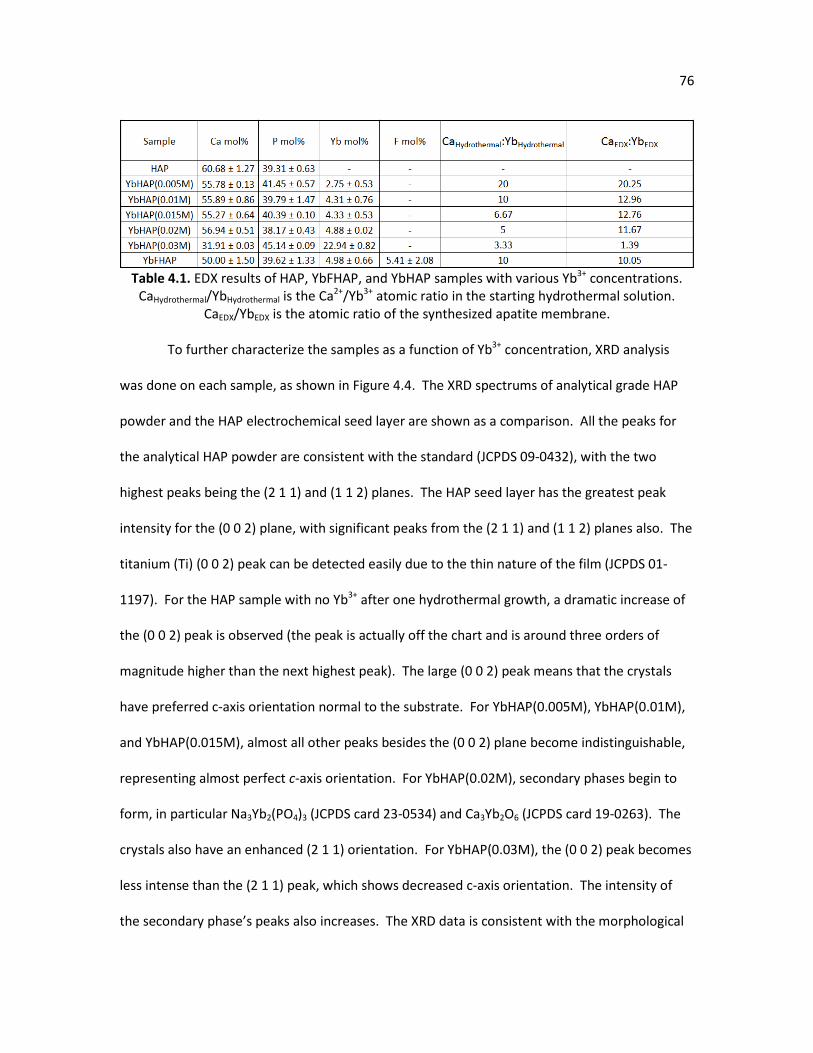
76
Table 4.1. EDX results of HAP, YbFHAP, and YbHAP samples with various Yb3+ concentrations.
CaHydrothermal/YbHydrothermal is the Ca2+/Yb3+ atomic ratio in the starting hydrothermal solution. CaEDX/YbEDX is the atomic ratio of the synthesized apatite membrane.
To further characterize the samples as a function of Yb3+ concentration, XRD analysis
was done on each sample, as shown in Figure 4.4. The XRD spectrums of analytical grade HAP
powder and the HAP electrochemical seed layer are shown as a comparison. All the peaks for
the analytical HAP powder are consistent with the standard (JCPDS 09-0432), with the two
highest peaks being the (2 1 1) and (1 1 2) planes. The HAP seed layer has the greatest peak
intensity for the (0 0 2) plane, with significant peaks from the (2 1 1) and (1 1 2) planes also. The
titanium (Ti) (0 0 2) peak can be detected easily due to the thin nature of the film (JCPDS 01-
1197). For the HAP sample with no Yb3+ after one hydrothermal growth, a dramatic increase of
the (0 0 2) peak is observed (the peak is actually off the chart and is around three orders of
magnitude higher than the next highest peak). The large (0 0 2) peak means that the crystals
have preferred c-axis orientation normal to the substrate. For YbHAP(0.005M), YbHAP(0.01M),
and YbHAP(0.015M), almost all other peaks besides the (0 0 2) plane become indistinguishable,
representing almost perfect c-axis orientation. For YbHAP(0.02M), secondary phases begin to
form, in particular Na3Yb2(PO4)3 (JCPDS card 23-0534) and Ca3Yb2O6 (JCPDS card 19-0263). The
crystals also have an enhanced (2 1 1) orientation. For YbHAP(0.03M), the (0 0 2) peak becomes
less intense than the (2 1 1) peak, which shows decreased c-axis orientation. The intensity of
the secondary phase’s peaks also increases. The XRD data is consistent with the morphological
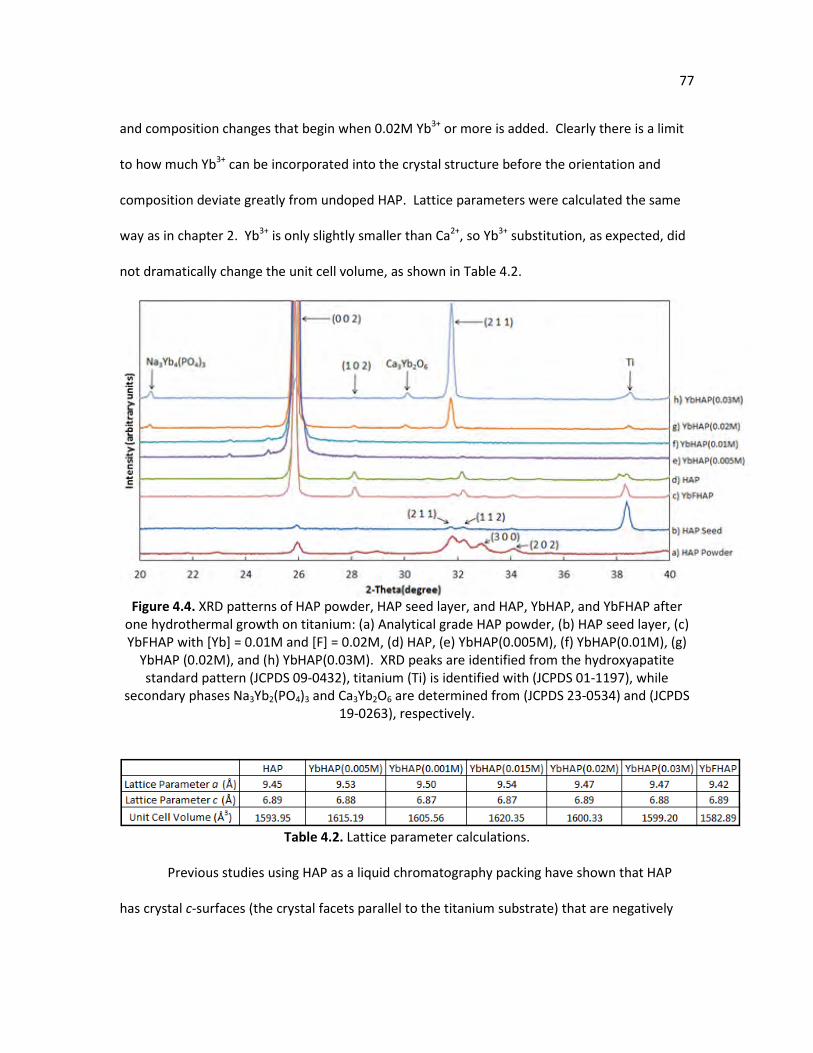
77
and composition changes that begin when 0.02M Yb3+ or more is added. Clearly there is a limit
to how much Yb3+ can be incorporated into the crystal structure before the orientation and
composition deviate greatly from undoped HAP. Lattice parameters were calculated the same
way as in chapter 2. Yb3+ is only slightly smaller than Ca2+, so Yb3+ substitution, as expected, did
not dramatically change the unit cell volume, as shown in Table 4.2.
Figure 4.4. XRD patterns of HAP powder, HAP seed layer, and HAP, YbHAP, and YbFHAP after
one hydrothermal growth on titanium: (a) Analytical grade HAP powder, (b) HAP seed layer, (c) YbFHAP with [Yb] = 0.01M and [F] = 0.02M, (d) HAP, (e) YbHAP(0.005M), (f) YbHAP(0.01M), (g)
YbHAP (0.02M), and (h) YbHAP(0.03M). XRD peaks are identified from the hydroxyapatite standard pattern (JCPDS 09-0432), titanium (Ti) is identified with (JCPDS 01-1197), while
secondary phases Na3Yb2(PO4)3 and Ca3Yb2O6 are determined from (JCPDS 23-0534) and (JCPDS 19-0263), respectively.
Table 4.2. Lattice parameter calculations.
Previous studies using HAP as a liquid chromatography packing have shown that HAP
has crystal c-surfaces (the crystal facets parallel to the titanium substrate) that are negatively
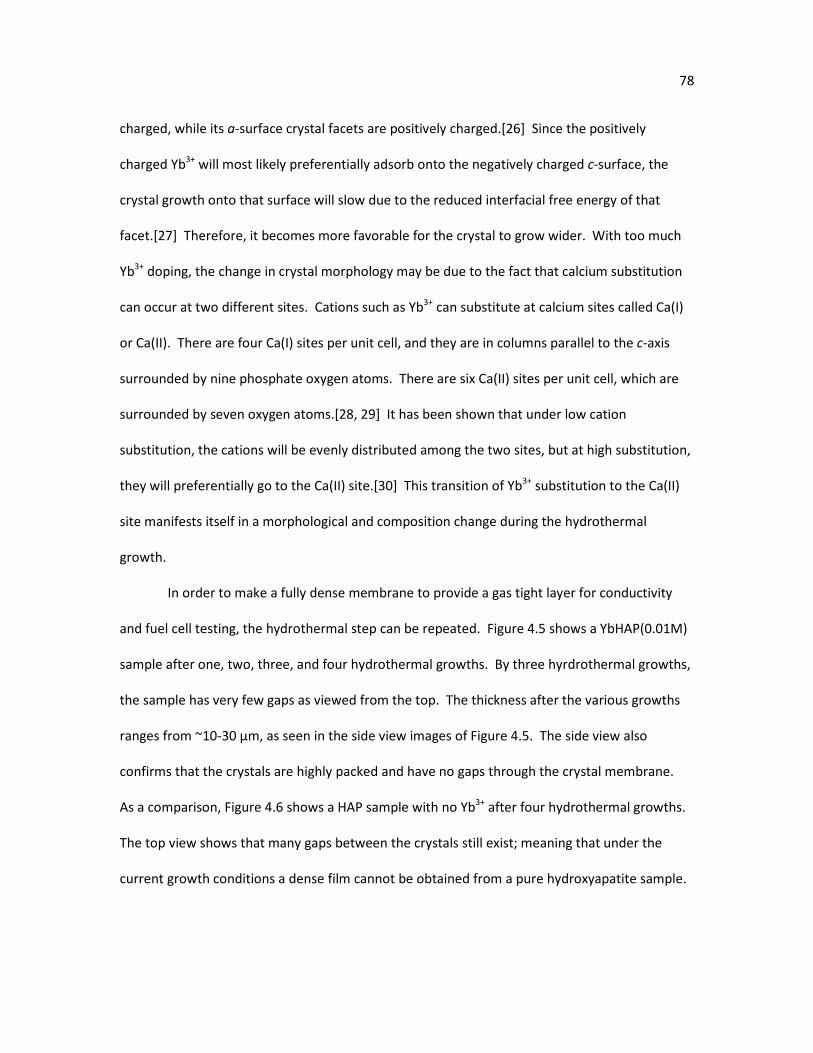
78
charged, while its a-surface crystal facets are positively charged.[26] Since the positively
charged Yb3+ will most likely preferentially adsorb onto the negatively charged c-surface, the
crystal growth onto that surface will slow due to the reduced interfacial free energy of that
facet.[27] Therefore, it becomes more favorable for the crystal to grow wider. With too much
Yb3+ doping, the change in crystal morphology may be due to the fact that calcium substitution
can occur at two different sites. Cations such as Yb3+ can substitute at calcium sites called Ca(I)
or Ca(II). There are four Ca(I) sites per unit cell, and they are in columns parallel to the c-axis
surrounded by nine phosphate oxygen atoms. There are six Ca(II) sites per unit cell, which are
surrounded by seven oxygen atoms.[28, 29] It has been shown that under low cation
substitution, the cations will be evenly distributed among the two sites, but at high substitution,
they will preferentially go to the Ca(II) site.[30] This transition of Yb3+ substitution to the Ca(II)
site manifests itself in a morphological and composition change during the hydrothermal
growth.
In order to make a fully dense membrane to provide a gas tight layer for conductivity
and fuel cell testing, the hydrothermal step can be repeated. Figure 4.5 shows a YbHAP(0.01M)
sample after one, two, three, and four hydrothermal growths. By three hyrdrothermal growths,
the sample has very few gaps as viewed from the top. The thickness after the various growths
ranges from ~10-30 µm, as seen in the side view images of Figure 4.5. The side view also
confirms that the crystals are highly packed and have no gaps through the crystal membrane.
As a comparison, Figure 4.6 shows a HAP sample with no Yb3+ after four hydrothermal growths.
The top view shows that many gaps between the crystals still exist; meaning that under the
current growth conditions a dense film cannot be obtained from a pure hydroxyapatite sample.
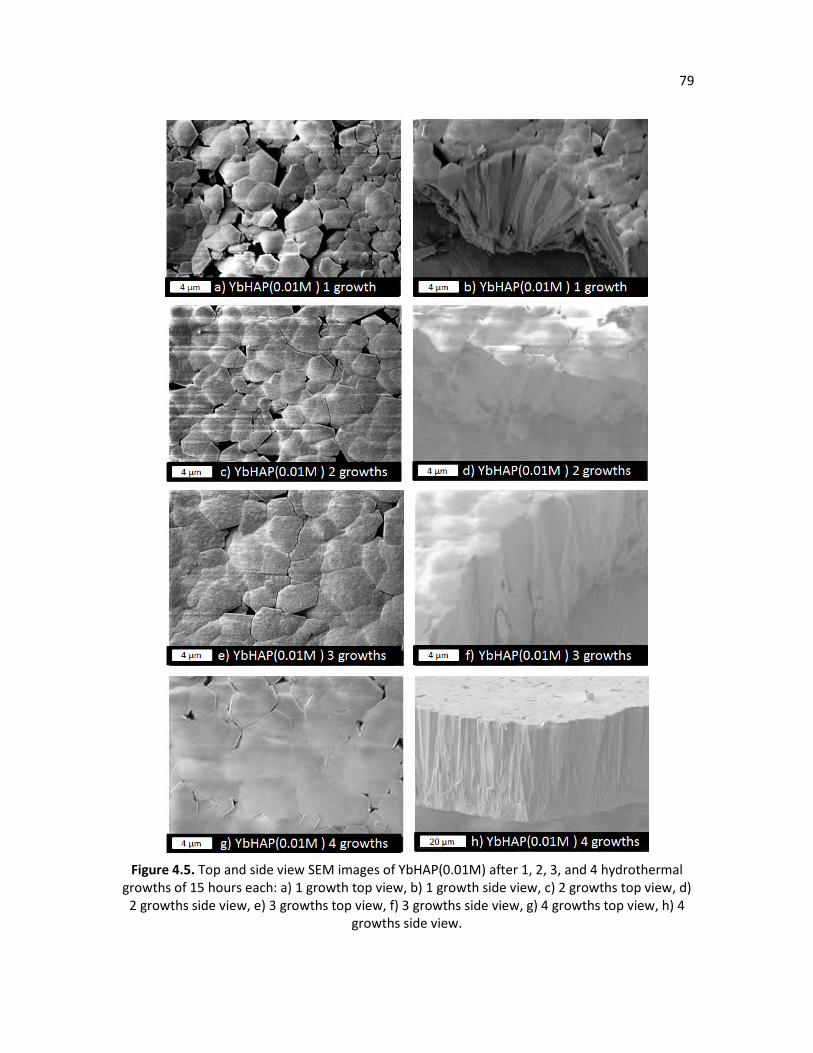
79
Figure 4.5. Top and side view SEM images of YbHAP(0.01M) after 1, 2, 3, and 4 hydrothermal
growths of 15 hours each: a) 1 growth top view, b) 1 growth side view, c) 2 growths top view, d) 2 growths side view, e) 3 growths top view, f) 3 growths side view, g) 4 growths top view, h) 4
growths side view.
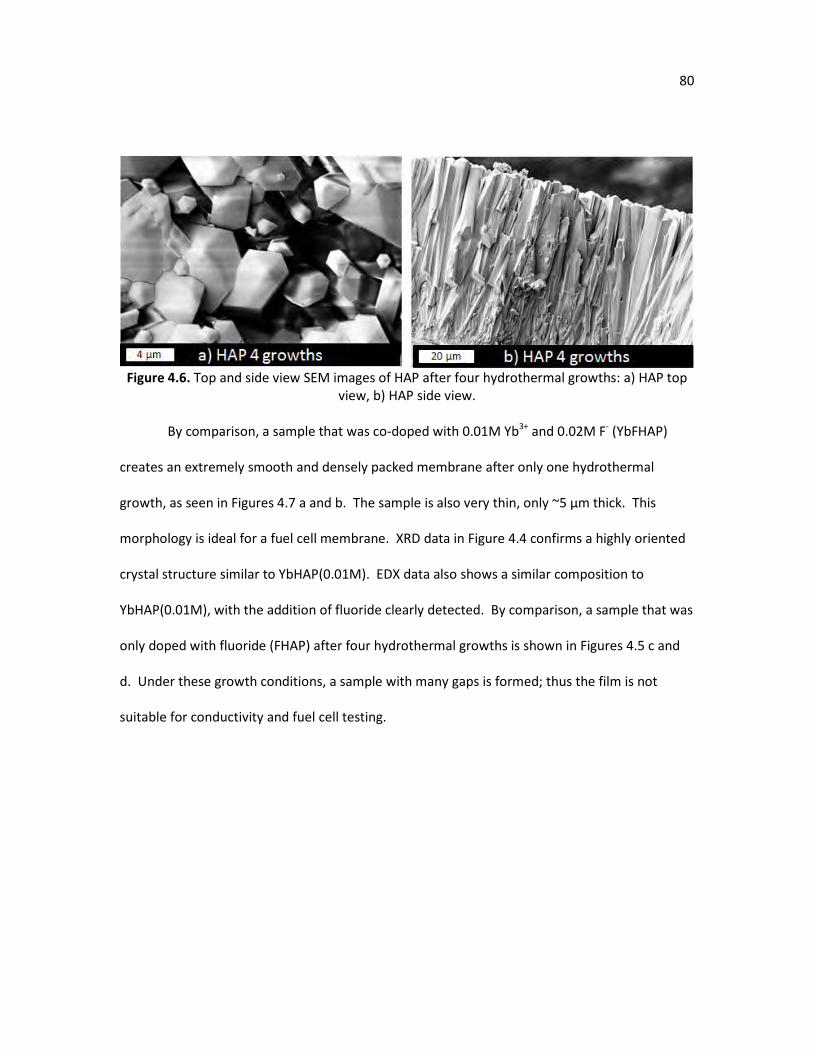
80
Figure 4.6. Top and side view SEM images of HAP after four hydrothermal growths: a) HAP top
view, b) HAP side view.
By comparison, a sample that was co-doped with 0.01M Yb3+ and 0.02M F- (YbFHAP)
creates an extremely smooth and densely packed membrane after only one hydrothermal
growth, as seen in Figures 4.7 a and b. The sample is also very thin, only ~5 µm thick. This
morphology is ideal for a fuel cell membrane. XRD data in Figure 4.4 confirms a highly oriented
crystal structure similar to YbHAP(0.01M). EDX data also shows a similar composition to
YbHAP(0.01M), with the addition of fluoride clearly detected. By comparison, a sample that was
only doped with fluoride (FHAP) after four hydrothermal growths is shown in Figures 4.5 c and
d. Under these growth conditions, a sample with many gaps is formed; thus the film is not
suitable for conductivity and fuel cell testing.
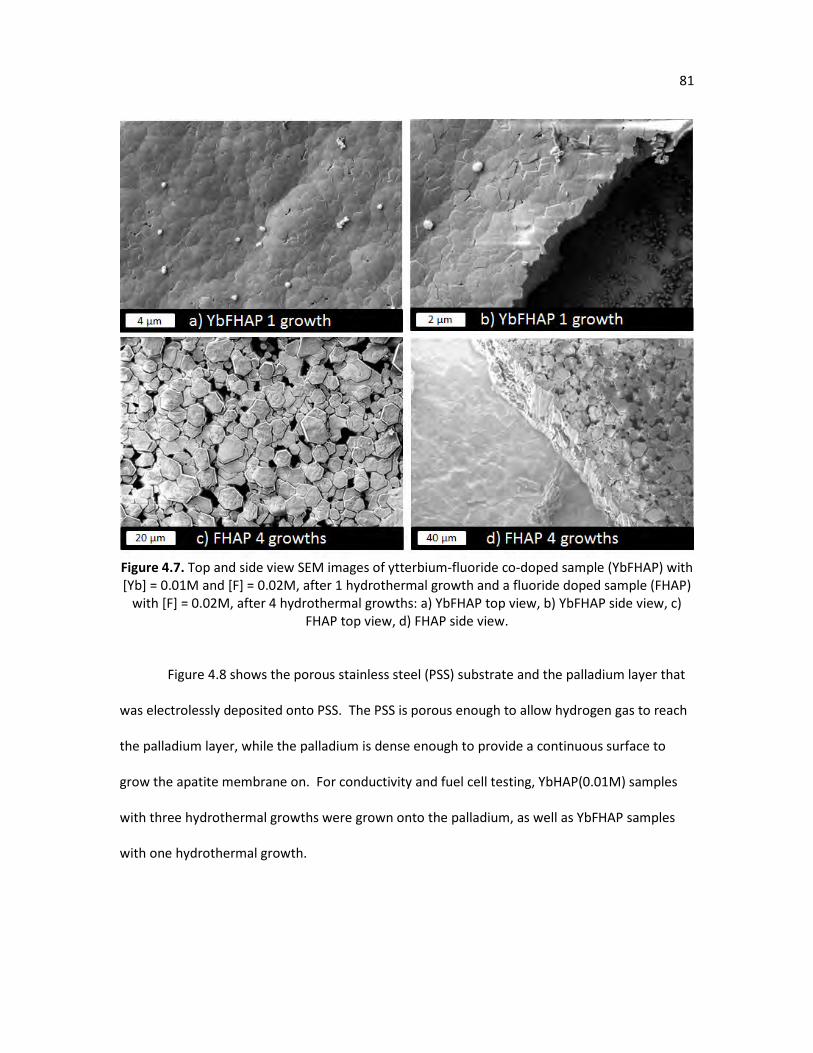
81
Figure 4.7. Top and side view SEM images of ytterbium-fluoride co-doped sample (YbFHAP) with [Yb] = 0.01M and [F] = 0.02M, after 1 hydrothermal growth and a fluoride doped sample (FHAP)
with [F] = 0.02M, after 4 hydrothermal growths: a) YbFHAP top view, b) YbFHAP side view, c) FHAP top view, d) FHAP side view.
Figure 4.8 shows the porous stainless steel (PSS) substrate and the palladium layer that
was electrolessly deposited onto PSS. The PSS is porous enough to allow hydrogen gas to reach
the palladium layer, while the palladium is dense enough to provide a continuous surface to
grow the apatite membrane on. For conductivity and fuel cell testing, YbHAP(0.01M) samples
with three hydrothermal growths were grown onto the palladium, as well as YbFHAP samples
with one hydrothermal growth.
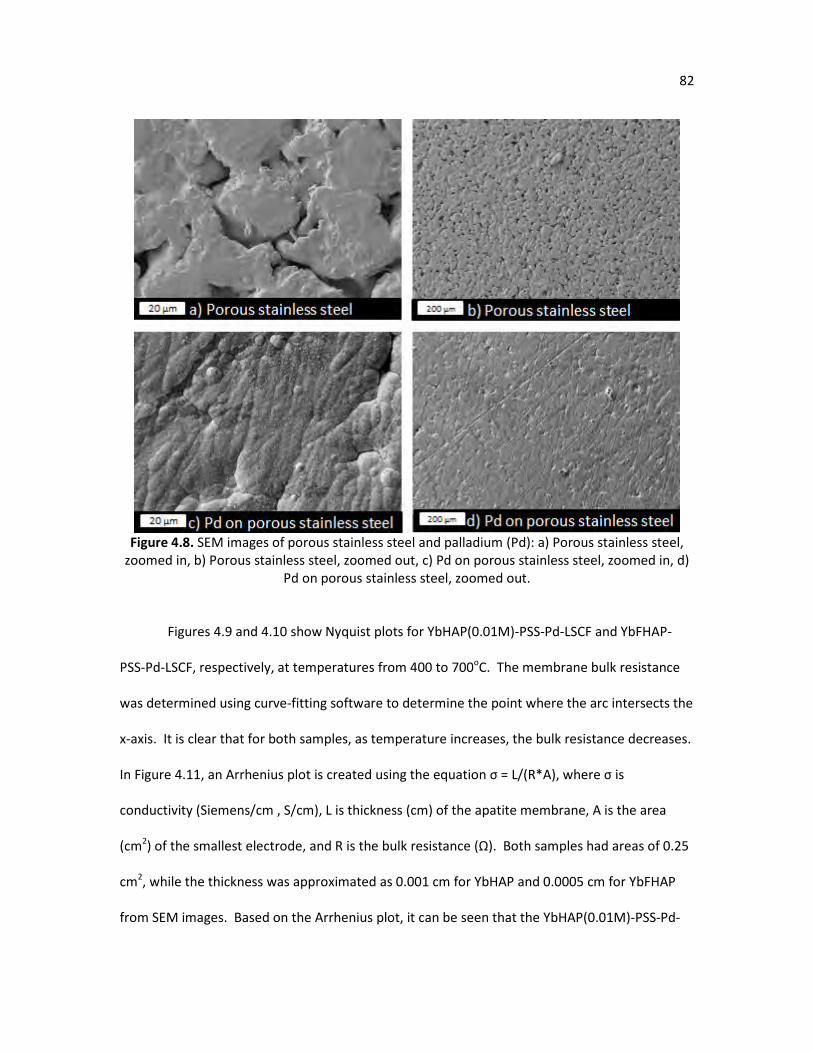
82
Figure 4.8. SEM images of porous stainless steel and palladium (Pd): a) Porous stainless steel,
zoomed in, b) Porous stainless steel, zoomed out, c) Pd on porous stainless steel, zoomed in, d) Pd on porous stainless steel, zoomed out.
Figures 4.9 and 4.10 show Nyquist plots for YbHAP(0.01M)-PSS-Pd-LSCF and YbFHAP-
PSS-Pd-LSCF, respectively, at temperatures from 400 to 700oC. The membrane bulk resistance
was determined using curve-fitting software to determine the point where the arc intersects the
x-axis. It is clear that for both samples, as temperature increases, the bulk resistance decreases.
In Figure 4.11, an Arrhenius plot is created using the equation σ = L/(R*A), where σ is
conductivity (Siemens/cm , S/cm), L is thickness (cm) of the apatite membrane, A is the area
(cm2) of the smallest electrode, and R is the bulk resistance (Ω). Both samples had areas of 0.25
cm2, while the thickness was approximated as 0.001 cm for YbHAP and 0.0005 cm for YbFHAP
from SEM images. Based on the Arrhenius plot, it can be seen that the YbHAP(0.01M)-PSS-Pd-
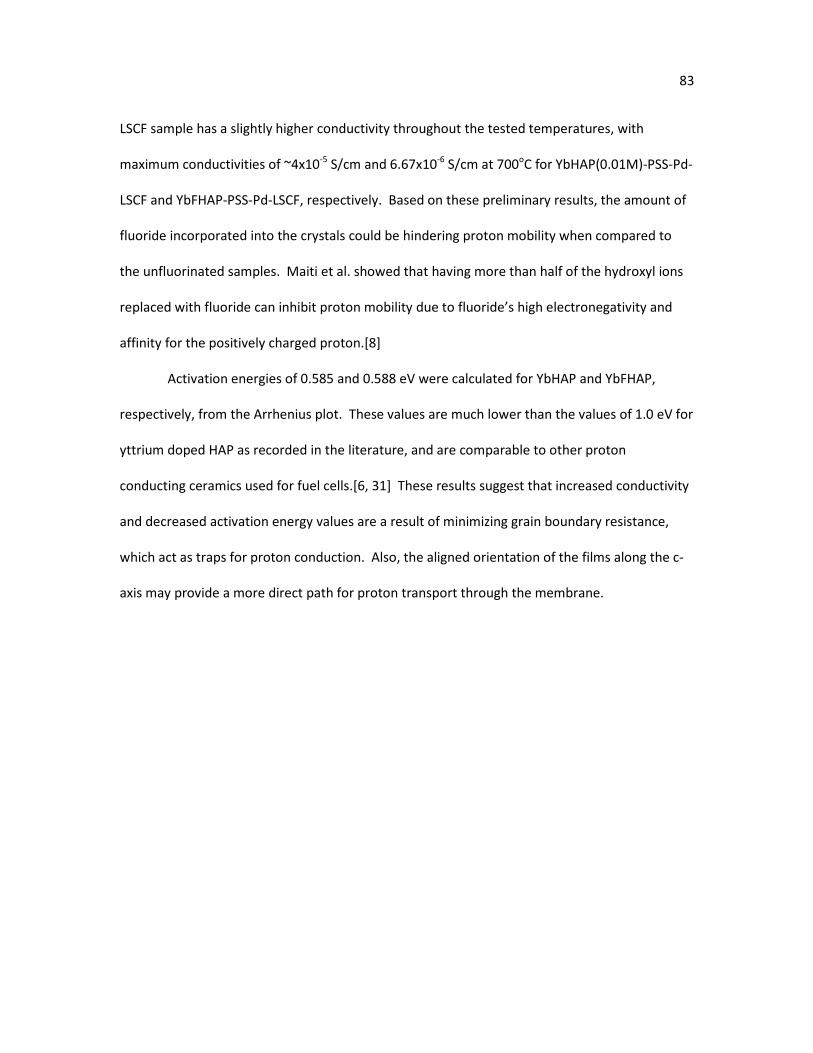
83
LSCF sample has a slightly higher conductivity throughout the tested temperatures, with
maximum conductivities of ~4x10⁻⁵ S/cm and 6.67x10⁻⁶ S/cm at 700oC for YbHAP(0.01M)-PSS-Pd-
LSCF and YbFHAP-PSS-Pd-LSCF, respectively. Based on these preliminary results, the amount of
fluoride incorporated into the crystals could be hindering proton mobility when compared to
the unfluorinated samples. Maiti et al. showed that having more than half of the hydroxyl ions
replaced with fluoride can inhibit proton mobility due to fluoride’s high electronegativity and
affinity for the positively charged proton.[8]
Activation energies of 0.585 and 0.588 eV were calculated for YbHAP and YbFHAP,
respectively, from the Arrhenius plot. These values are much lower than the values of 1.0 eV for
yttrium doped HAP as recorded in the literature, and are comparable to other proton
conducting ceramics used for fuel cells.[6, 31] These results suggest that increased conductivity
and decreased activation energy values are a result of minimizing grain boundary resistance,
which act as traps for proton conduction. Also, the aligned orientation of the films along the c-
axis may provide a more direct path for proton transport through the membrane.
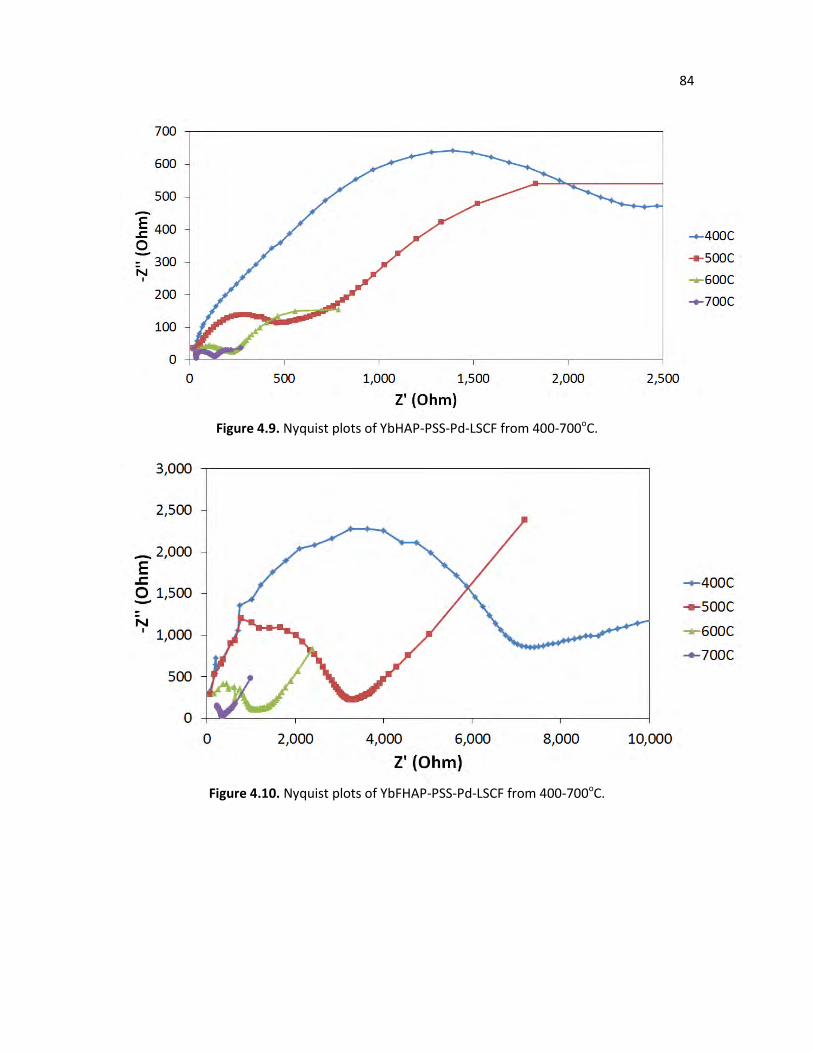
84
Figure 4.9. Nyquist plots of YbHAP-PSS-Pd-LSCF from 400-700oC.
Figure 4.10. Nyquist plots of YbFHAP-PSS-Pd-LSCF from 400-700oC.
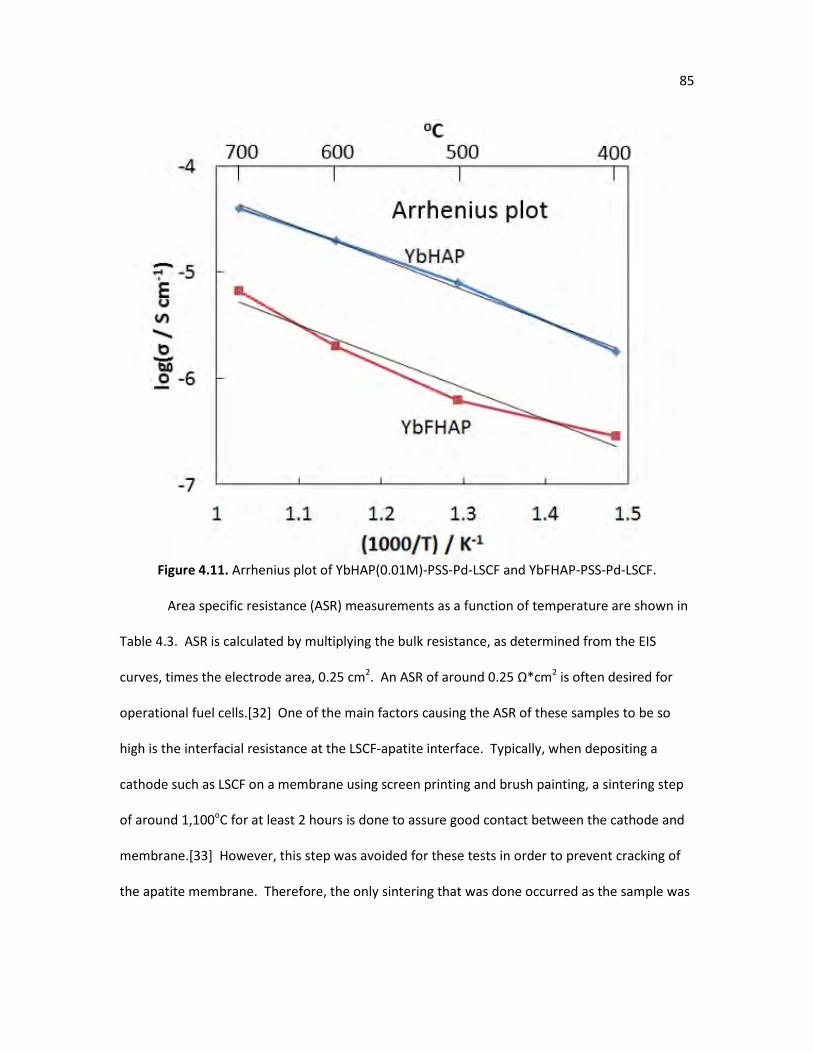
85
Figure 4.11. Arrhenius plot of YbHAP(0.01M)-PSS-Pd-LSCF and YbFHAP-PSS-Pd-LSCF.
Area specific resistance (ASR) measurements as a function of temperature are shown in
Table 4.3. ASR is calculated by multiplying the bulk resistance, as determined from the EIS
curves, times the electrode area, 0.25 cm2. An ASR of around 0.25 Ω*cm2 is often desired for
operational fuel cells.[32] One of the main factors causing the ASR of these samples to be so
high is the interfacial resistance at the LSCF-apatite interface. Typically, when depositing a
cathode such as LSCF on a membrane using screen printing and brush painting, a sintering step
of around 1,100oC for at least 2 hours is done to assure good contact between the cathode and
membrane.[33] However, this step was avoided for these tests in order to prevent cracking of
the apatite membrane. Therefore, the only sintering that was done occurred as the sample was
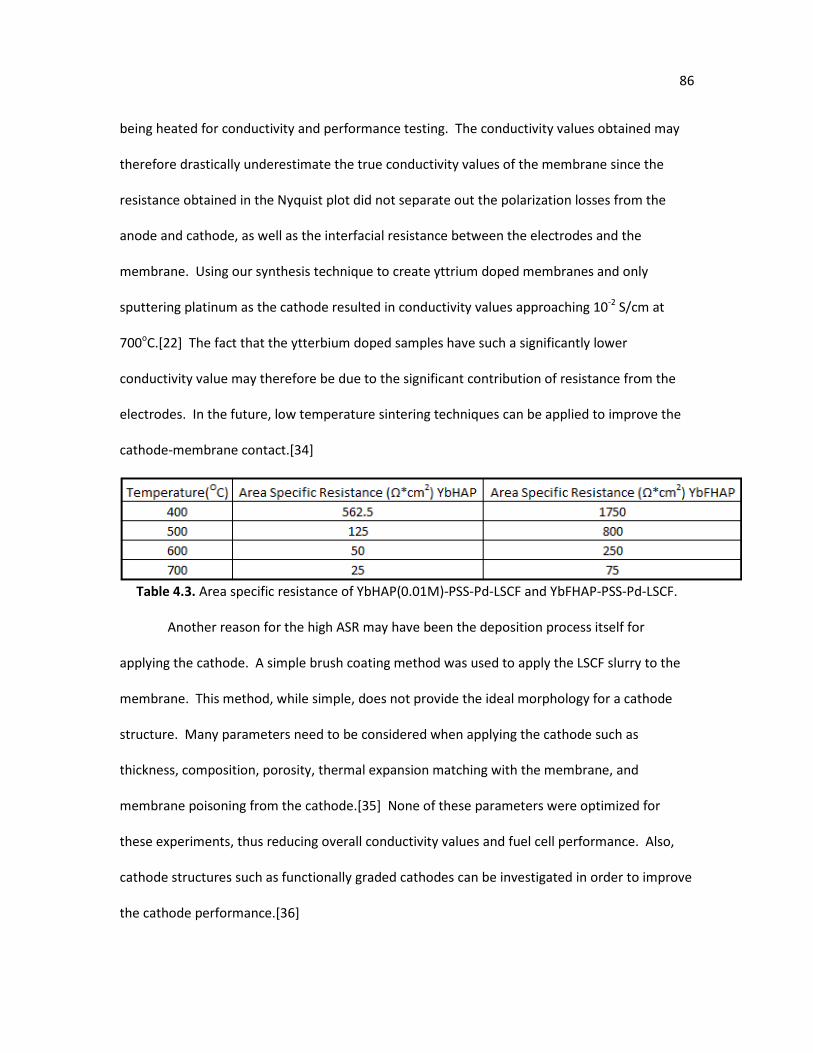
86
being heated for conductivity and performance testing. The conductivity values obtained may
therefore drastically underestimate the true conductivity values of the membrane since the
resistance obtained in the Nyquist plot did not separate out the polarization losses from the
anode and cathode, as well as the interfacial resistance between the electrodes and the
membrane. Using our synthesis technique to create yttrium doped membranes and only
sputtering platinum as the cathode resulted in conductivity values approaching 10-2 S/cm at
700oC.[22] The fact that the ytterbium doped samples have such a significantly lower
conductivity value may therefore be due to the significant contribution of resistance from the
electrodes. In the future, low temperature sintering techniques can be applied to improve the
cathode-membrane contact.[34]
Table 4.3. Area specific resistance of YbHAP(0.01M)-PSS-Pd-LSCF and YbFHAP-PSS-Pd-LSCF.
Another reason for the high ASR may have been the deposition process itself for
applying the cathode. A simple brush coating method was used to apply the LSCF slurry to the
membrane. This method, while simple, does not provide the ideal morphology for a cathode
structure. Many parameters need to be considered when applying the cathode such as
thickness, composition, porosity, thermal expansion matching with the membrane, and
membrane poisoning from the cathode.[35] None of these parameters were optimized for
these experiments, thus reducing overall conductivity values and fuel cell performance. Also,
cathode structures such as functionally graded cathodes can be investigated in order to improve
the cathode performance.[36]
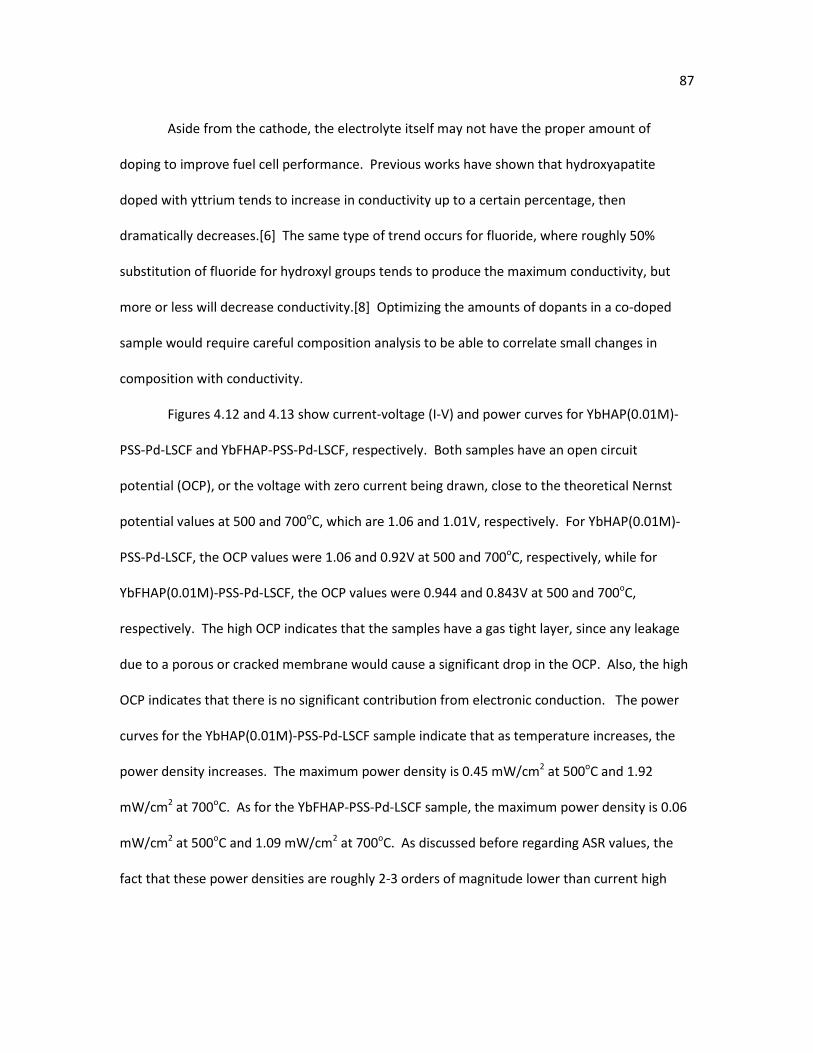
87
Aside from the cathode, the electrolyte itself may not have the proper amount of
doping to improve fuel cell performance. Previous works have shown that hydroxyapatite
doped with yttrium tends to increase in conductivity up to a certain percentage, then
dramatically decreases.[6] The same type of trend occurs for fluoride, where roughly 50%
substitution of fluoride for hydroxyl groups tends to produce the maximum conductivity, but
more or less will decrease conductivity.[8] Optimizing the amounts of dopants in a co-doped
sample would require careful composition analysis to be able to correlate small changes in
composition with conductivity.
Figures 4.12 and 4.13 show current-voltage (I-V) and power curves for YbHAP(0.01M)-
PSS-Pd-LSCF and YbFHAP-PSS-Pd-LSCF, respectively. Both samples have an open circuit
potential (OCP), or the voltage with zero current being drawn, close to the theoretical Nernst
potential values at 500 and 700oC, which are 1.06 and 1.01V, respectively. For YbHAP(0.01M)-
PSS-Pd-LSCF, the OCP values were 1.06 and 0.92V at 500 and 700oC, respectively, while for
YbFHAP(0.01M)-PSS-Pd-LSCF, the OCP values were 0.944 and 0.843V at 500 and 700oC,
respectively. The high OCP indicates that the samples have a gas tight layer, since any leakage
due to a porous or cracked membrane would cause a significant drop in the OCP. Also, the high
OCP indicates that there is no significant contribution from electronic conduction. The power
curves for the YbHAP(0.01M)-PSS-Pd-LSCF sample indicate that as temperature increases, the
power density increases. The maximum power density is 0.45 mW/cm2 at 500oC and 1.92
mW/cm2 at 700oC. As for the YbFHAP-PSS-Pd-LSCF sample, the maximum power density is 0.06
mW/cm2 at 500oC and 1.09 mW/cm2 at 700oC. As discussed before regarding ASR values, the
fact that these power densities are roughly 2-3 orders of magnitude lower than current high
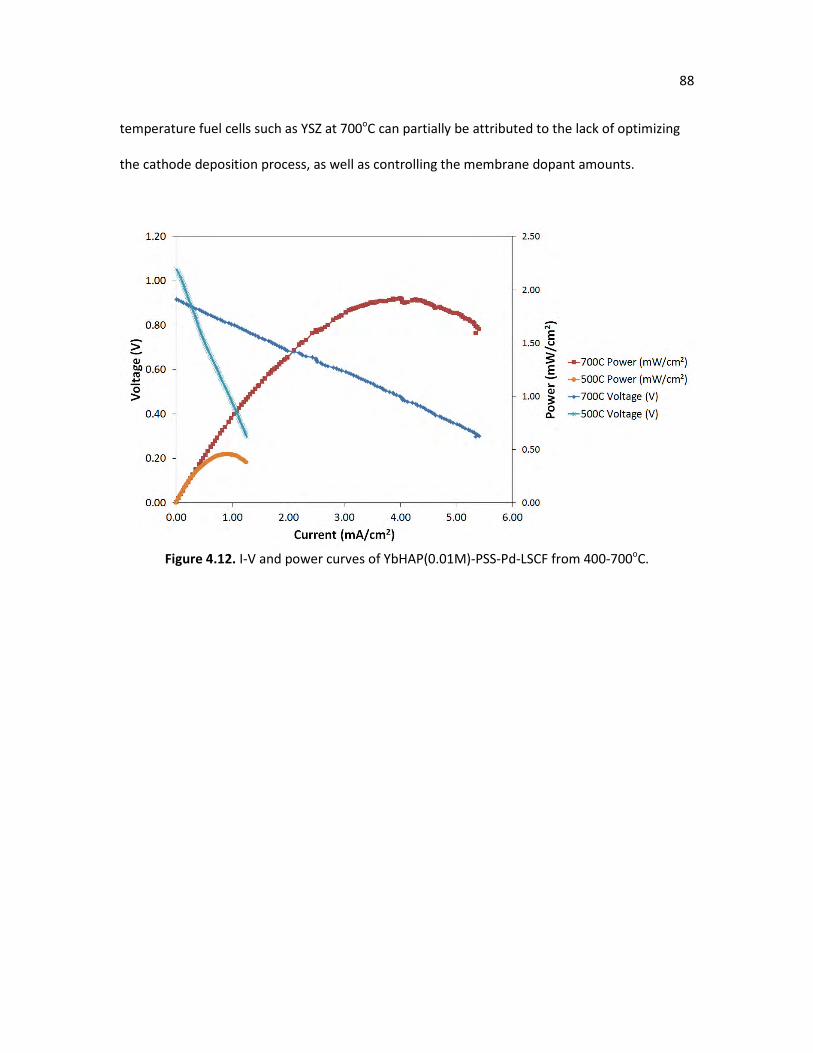
88
temperature fuel cells such as YSZ at 700oC can partially be attributed to the lack of optimizing
the cathode deposition process, as well as controlling the membrane dopant amounts.
Figure 4.12. I-V and power curves of YbHAP(0.01M)-PSS-Pd-LSCF from 400-700oC.
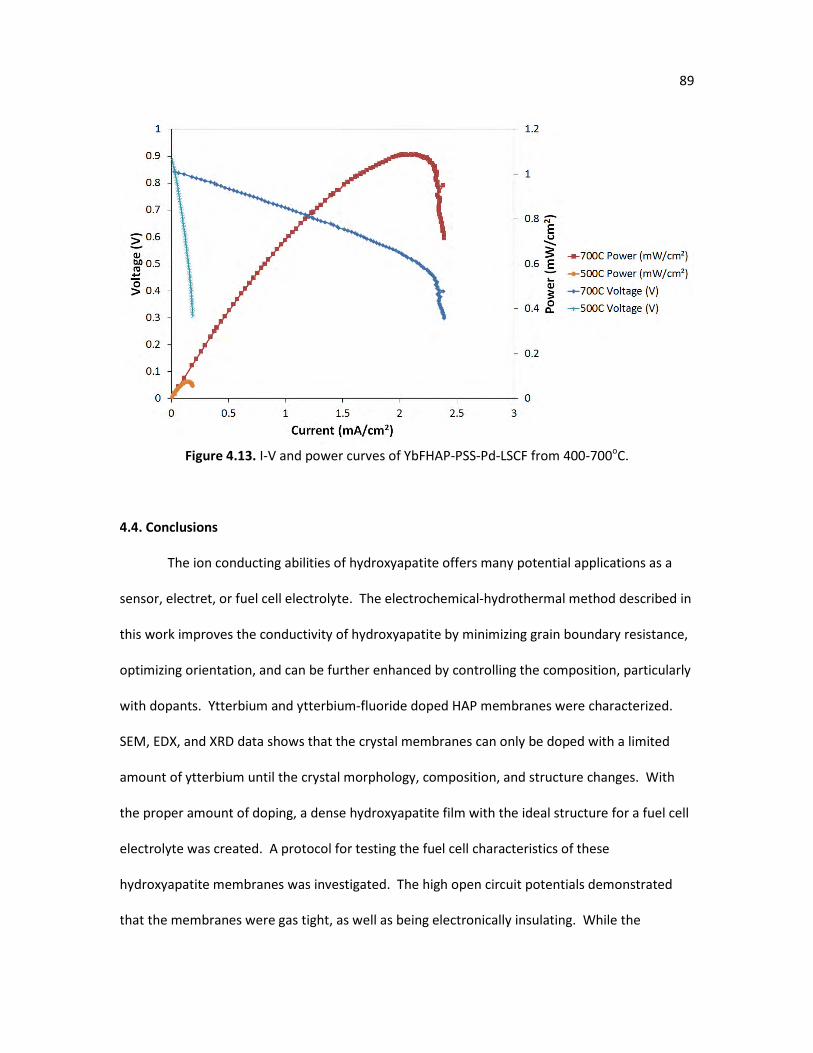
89
Figure 4.13. I-V and power curves of YbFHAP-PSS-Pd-LSCF from 400-700oC.
4.4. Conclusions
The ion conducting abilities of hydroxyapatite offers many potential applications as a
sensor, electret, or fuel cell electrolyte. The electrochemical-hydrothermal method described in
this work improves the conductivity of hydroxyapatite by minimizing grain boundary resistance,
optimizing orientation, and can be further enhanced by controlling the composition, particularly
with dopants. Ytterbium and ytterbium-fluoride doped HAP membranes were characterized.
SEM, EDX, and XRD data shows that the crystal membranes can only be doped with a limited
amount of ytterbium until the crystal morphology, composition, and structure changes. With
the proper amount of doping, a dense hydroxyapatite film with the ideal structure for a fuel cell
electrolyte was created. A protocol for testing the fuel cell characteristics of these
hydroxyapatite membranes was investigated. The high open circuit potentials demonstrated
that the membranes were gas tight, as well as being electronically insulating. While the

90
conductivity and performance results were lower than traditional fuel cell electrolytes, there are
many areas for improvement, particularly in applying and optimizing the cathode structure.
91
References
1. Tanaka, Y., et al., Fast oxide ion conduction due to carbonate substitution in
hydroxyapatite. Journal of American Ceramic Society, 2010. 93: p. 3577-3579.
2. Tanaka, Y., et al., Polarization and microstructural effects of ceramic hydroxyapatite
electrets. Journal of Applied Physics, 2010. 107: p. 1-10.
3. Liu, D., K. Savino, and M.Z. Yates, Microstructural engineering of hydroxyapatite
membranes to enhance proton conductivity. Advanced Functional Materials, 2009. 19: p. 3941-
3947.
4. Nakamura, S., H. Takeda, and K. Yamashita, Proton transport polarization and
depolarization of hydroxyapatite ceramics. Journal of Applied Physics, 2001. 89: p. 5386-5391.
5. Laghzizil, A., et al., Comparison of Electrical Properties between Fluoroapatite and
Hydroxyapatite Materials. Journal of Solid State Chemistry, 2001. 156: p. 57-60.
6. Yamashita, K., et al., Protonic conduction in yttrium-substituted hydroxyapatite ceramics
and their applicability to H2-O2 fuel cell. Solid State Ionics, 1990. 40/41: p. 918-921.
7. Owada, H., et al., Humidity-Sensitivity of Yttrium Substituted Apatite Ceramics. Solid State Ionics, 1989. 35: p. 401-404.
8. Maiti, G. and F. Freund, Influence of Fluorine Substitution on the Proton Conductivity of
Hydroxyapatite. J. Chem. Soc., Dalton Trans., 1981: p. 949-955.
9. Horiuchi, N., et al., Proton conduction related electrical dipole and space charge
polarization in hydroxyapatite. Journal of Applied Physics, 2012. 112: p. 1-6.
10. Gittings, J., et al., Electrical characterization of hydroxyapatite-based bioceramics. Acta Biomaterialia, 2009. 5: p. 743-754.
11. Steele, B. and A. Heinzel, Materials for fuel-cell technologies. Nature, 2001. 414: p. 345-
352.
12. Ito, N., et al., New intermediate temperature fuel cell with ultra-thin proton conductor
electrolyte. Journal of Power Sources, 2005. 152: p. 200-203.
13. Yamashita, K., K. Kitagaki, and T. Umegaki, Thermal Instability and Proton Conductivity of
Ceramic Hydroxyapatite at High Temperatures. J. Am. Ceram. Soc., 1995. 78: p. 1191-97.
14. Kwon, O. and G. Choi, Electrical conductivity of thick film YSZ. Solid State Ionics, 2006. 177: p. 3057-3062.
92
15. Liu, D., K. Savino, and M.Z. Yates, Coating of hydroxyapatite films on metal substrates by
seeded hydrothermal deposition. Surface and Coatings Technology, 2011. 205: p. 3975-3986.
16. Wei, X., et al., Carbonated hydroxyapatite coatings with aligned crystal domains. Crystal Growth & Design, 2012. 12: p. 3474-3480.
17. Hammari, L.E., et al., Chrystallinity and Fluorine Substitution Effects on the Proton
Conductivity of Porous Hydroxyapatites. J. Solid State Chemistry, 2004. 177: p. 134-138.
18. C. Ergun, et al., Hydroxylapatite with substituted magnesium, zinc, cadmium, and
yttrium. I. Structure and microstructure. Journal of Biomedical Materials Research, 2001. 59: p. 305-311.
19. Yamashita, K., et al., Effects of sintering ambient H2O vapour on the protonic conduction
properties of ceramic hydroxyapatite. Journal of Materials Science Letters, 1990. 9: p. 4-6.
20. Owada, H., K. Yamashita, and T. Kanazawa, High-temperature stability of hydroxyl ions in
yttrium-substituted oxyhydroxyapatites. Journal of Materials Science Letters, 1990. 9: p. 26-28.
21. Yamashita, K., et al., Trivalent-Cation Substituted Calcium Oxyhydroxyapatite. J. Am.
Ceram. Soc., 1986. 69(8): p. 590-94.
22. Wei, X. and M.Z. Yates, Yttrium-doped hydroxyapatite membranes with high proton
conductivity. Chemistry of Materials, 2012. 24: p. 1738-1743.
23. Chen, Y. and X. Miao, Thermal and chemical stability of fluorohydroxyapatite ceramics
with different fluorine contents. Biomaterials, 2004. 26: p. 1205-1210.
24. Ito, N., et al., Electrochemical analysis of hydrogen membrane fuel cells. Journal of
Power Sources, 2008. 185: p. 922-926.
25. Mardilovich, P., et al., Defect-free palladium membranes on porous stainless-steel
support. AIChE Journal, 1998. 44: p. 310-322.
26. Kawasaki, T., Hydroxyapatite as a liquid chromatographic packing. Journal of
Chromatography, 1991. 544: p. 147-184.
27. Murphy, C., Nanocubes and nanoboxes. Science, 2002. 298: p. 2139-2141.
28. Wei, X., et al., Fully dense yttrium-substituted hydroxyapatite coatings with aligned
crystal domains. Crystal Growth & Design, 2012. 12: p. 217-223.
93
29. Feki, H., J. Savariault, and A. Salah, Structure refinements by the Rietveld method of
partially substituted hydroxyapatite: Ca9Na0.5(PO4 )4.5(CO3)1.5(OH)2. J. Alloys and Compounds, 1999. 287: p. 114-120.
30. Laghzizil, A., et al., Mixed ionic conductivities in sodium fluoroapatites. Solid State Ionics,
1993. 67: p. 137-143.
31. Kreuer, K., Proton-conducting oxides. Annu. Rev. Mater. Res., 2003. 33: p. 333-359.
32. Barbir, F., PEM Fuel Cells: Theory and Practice, ed. R. Dorf. 2005: Elsevier Academic
Press.
33. Horita, T., et al., Oxygen reduction mechanism at porous La1-xSrxCoO3-d
cathodes/La0.8Sr0.2Ga0.8Mg0.2O2.8 electrolyte interface for solid oxide fuel cells. Electrochimica
Acta, 2001 46: p. 1837-1845.
34. Simner, S., et al., Enhanced low temperature sintering of (Sr, Cu)-doped lanthanum
ferrite SOFC cathodes. Solid State Ionics, 2004. 175: p. 79-81.
35. Dusastre, V. and J. Kilner, Optimisation of composite cathodes for intermediate
temperature SOFC applications. Solid State Ionics, 1999. 126: p. 163-174.
36. Hart, N., et al., Functionally graded composite cathodes for solid oxide fuel cells. Journal of Power Sources, 2002. 106: p. 42-50.
94
Chapter 5
Electrochemical Reduction of Silver Nanoparticles onto Hydroxyapatite Films
5.1. Introduction
The orthopedic implant market in 2012 was valued at just over $30.5 billion, with over
2.6 million orthopedic implants inserted annually in the United States alone.[1, 2]. Implants are
typically composed of titanium or titanium alloys due to its biocompatability, but much work has
been done to enhance the integration process by coating implant surfaces with hydroxyapatite
(HAP, Ca5(PO4)3OH).[3-6] HAP’s similar composition to bone provides a bioactive surface to
form better tissue ingrowth between the patient’s body and the orthopedic implant, helping to
speed up the recovery process and prevent future prosthetic loosening.[7, 8] However, titanium
or hydroxyapatite coated implants do very little in regards to preventing infections. Over
100,000 implants are infected each year in the United States alone, with medical costs
exceeding $3 billion to treat these infections.[9] Even in the most sterile surgical environments,
bacteria from the surgical equipment, clothing from medical staff, or a patient’s own skin can
still adhere to an implant.[10] Infected implants can be devastating to a patient and may even
require a secondary surgery to clean or replace the implant.[11] In worst case scenarios,
infected implants can lead to amputation or even lethal sepsis. Therefore, there is a high
urgency to not just treat infections, but prevent them from occurring in the first place. If
bacteria adhesion occurs and a bacteria biofilm forms on an implant before tissue regeneration
95
occurs, the biofilm can be ten to one thousand times more resistant to antimicrobial agents
than free-floating bacteria.[12]
While systemic antibiotic delivery can help prevent infections, the large dosage of drugs
used increases the likelihood of a patient suffering negative side effects.[13] Also, continual
administration of antibiotics may cause antibiotic-resistant bacteria to form.[14, 15] Therefore,
much research has been done to apply antibiotics locally to the surgical site. Not only can local
drug delivery reduce the amount of antibiotic administered, it is also more likely to prevent an
infection due to its close proximity to the surgical site. To locally administer drugs, many
surgeons have used bone cements made of polymethylmethacrylate (PMMA) that are loaded
with antibiotics.[16, 17] However, PMMA does nothing to help stimulate osteointegration of
the implant with the body and may even need to be removed in a subsequent surgery.[18, 19]
Many groups have also tried to load drugs into HAP coated titanium implants.[20-22] However,
the amount of antibiotic loaded and the release profile usually relies on a bulk diffusion
mechanism or surface roughness characteristics, limiting the parameters to enhance the
amount of loading and extend the release time of antibiotics, particularly for smaller
antibiotics.[21, 22] Electrostatically charged hydrogels have been synthesized in an effort to
extend the drug release, but they have very little benefit in terms of helping the implant
integrate into the body.[23]
Silver ions have long been known to have antimicrobial properties, while having minimal
toxicity to human cells at concentrations below 10mg/l.[10, 24, 25] Silver ions are effective
against a broad range of pathogens such as P. aeruginosa, E. coli, S. epidermidis, and S. aureus,
and these bacteria have been shown to not form a resistance to silver ions.[10, 26] Ionized
silver has been shown to disrupt the function and structure of bacteria cell membranes, leading
96
to cell distortion and death. Also, silver ions disrupt critical cell metabolic proteins and enzymes
by binding to thiol groups, as well as bind to DNA and RNA to interfere with replication.[24, 26-
28]
In this section, a novel and simple method for synthesizing a bioactive HAP coating with
antimicrobial silver nanoparticles is presented (AgHAP). The initial HAP layer was deposited
onto a titanium substrate using an electrochemical method. By shortening the electrochemical
deposition time, a uniform and thin film of HAP crystals was formed. Then, an electrolyte
solution containing silver ions and salt was used to electrochemically reduce silver nanoparticles
directly onto the HAP crystals. The HAP and AgHAP films were characterized and tested for
antimicrobial capabilities.
5.2. Experimental
Materials
Titanium(Ti) substrates (12.5 mm x 12.5 mm and 0.89 mm thick), platinum foil (25 mm x
25 mm and 0.127 mm thick), AgNO3, MgCl2·6H2O (99.0-102% purity) and NaHCO3 (99.7-100.3%
purity) were purchased from Alfa Aesar. K2HPO4 (99.99% purity), K2HPO4·3H2O (99% purity),
CaCl2·2H2O (99+% purity), NaCl (≥99.0% purity), tris(hydroxymethyl)- aminomethane (tris)
(99.8+% purity), and tryptic soy broth were all obtained from Sigma- Aldrich. CaCl2 (99.5%
purity) and Na2SO4 (100.1% purity) was purchased from J.T. Baker. KCl (99.7% purity), 36.5-
38.0% hydrochloric acid, and 28.0-30.0% pure ammonium hydroxide were purchased from
Mallinckrodt Chemicals. Detergent powder was purchased from Alconox. Deionized (DI) water
was used for all solutions.
Electrochemical deposition of HAP seeds
97
Titanium substrates were gently polished with SiC paper (800 grit) to provide surface
roughness. The substrates were then thoroughly washed with Alconox detergent powder,
rinsed with tap water, attached to a silver wire by tightly wrapping the wire through a premade
hole in the substrate, sonicated in an ethanol/acetone (volume ratio = 50/50) solvent for 30
minutes, and then rinsed with deionized water. An electrolyte solution was prepared containing
138 mM NaCl, 50 mM tris, 1.25 mM CaCl2, and 0.828 mM K2HPO4 in 125 mL deionized water per
substrate. The solution was buffered to pH 7.2 using hydrochloric acid. The electrolyte solution
was then heated to 95°C. The substrate and a platinum plate were held parallel to each other
with a fixed distance of separation of 10 mm. The substrate and platinum plate were connected
to the negative and positive electrodes of a direct current power supply (Instek GPS-3030D),
respectively, and immersed in the electrolyte solution. The electrochemical reaction was carried
out for 5 minutes at 12.5 mA/cm2 (area relative to the platinum plate), then rinsed off with
deionized water and dried in air.
Electrochemical reduction of Ag nanoparticles
For each sample coated with Ag nanoparticles, an 80 mL solution containing 1.25 mM
Ag(NO3) and 1.25 mM NaCl was prepared. The electrolyte solution was then heated to 95°C.
The HAP coated substrate and a platinum plate were held parallel to each other with a fixed
distance of separation of 10 mm. The substrate and platinum plate were connected to the
negative and positive electrodes of a direct current power supply, respectively, and immersed in
the electrolyte solution. The electrochemical reaction was carried out for 90 seconds at 12.5
mA/cm2 (area relative to the platinum plate), then rinsed off with deionized water and dried in
air.
Bacteria growth testing
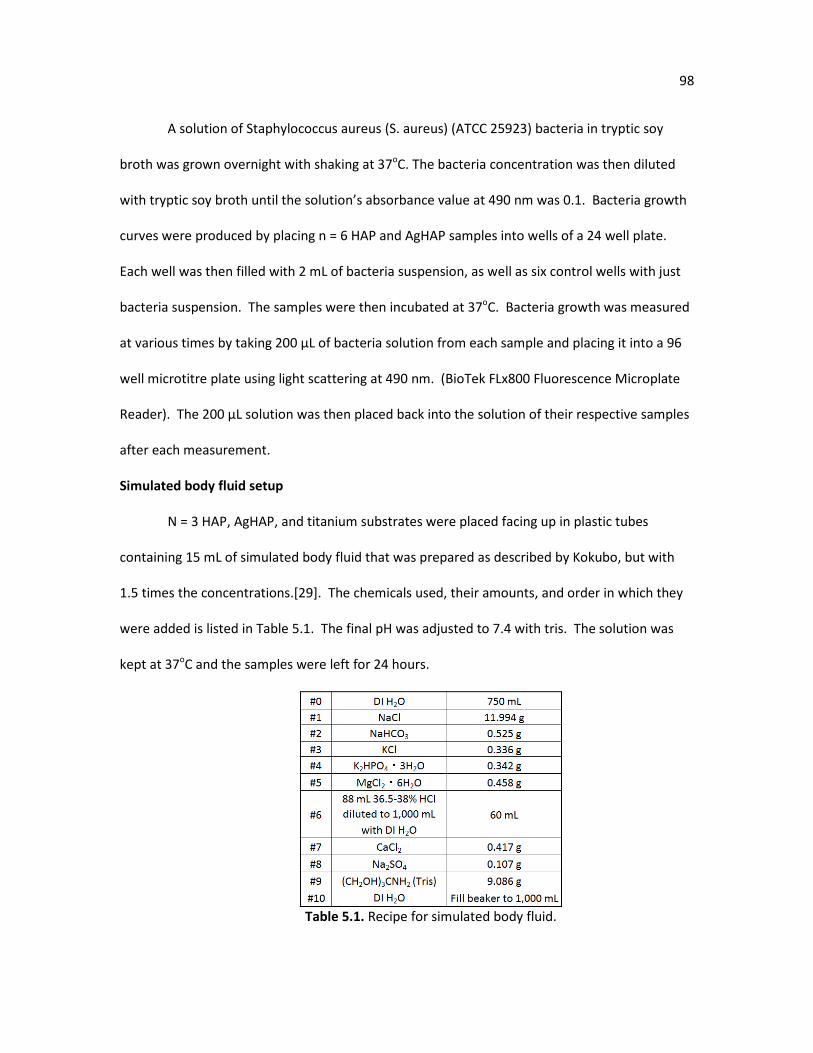
98
A solution of Staphylococcus aureus (S. aureus) (ATCC 25923) bacteria in tryptic soy
broth was grown overnight with shaking at 37oC. The bacteria concentration was then diluted
with tryptic soy broth until the solution’s absorbance value at 490 nm was 0.1. Bacteria growth
curves were produced by placing n = 6 HAP and AgHAP samples into wells of a 24 well plate.
Each well was then filled with 2 mL of bacteria suspension, as well as six control wells with just
bacteria suspension. The samples were then incubated at 37oC. Bacteria growth was measured
at various times by taking 200 μL of bacteria solution from each sample and placing it into a 96
well microtitre plate using light scattering at 490 nm. (BioTek FLx800 Fluorescence Microplate
Reader). The 200 μL solution was then placed back into the solution of their respective samples
after each measurement.
Simulated body fluid setup
N = 3 HAP, AgHAP, and titanium substrates were placed facing up in plastic tubes
containing 15 mL of simulated body fluid that was prepared as described by Kokubo, but with
1.5 times the concentrations.[29]. The chemicals used, their amounts, and order in which they
were added is listed in Table 5.1. The final pH was adjusted to 7.4 with tris. The solution was
kept at 37oC and the samples were left for 24 hours.
Table 5.1. Recipe for simulated body fluid.
99
Sample characterization
Crystal morphology was examined using a scanning electron microscope (SEM, Zeiss-
Auriga) with an accelerating voltage of 3 kV. The composition of HAP membranes was
determined by EDX (EDAX). Three spots on two different samples were probed at an
accelerating voltage of 15 kV and the values were averaged and standard deviations were
calculated. The crystal structure was determined by X-ray diffraction (XRD) (Philips PW3020)
with Cu K1 radiation (λ=1.540560 Ǻ) from 20-60o with a step rate of 0.02 degrees/second. Phase
identification was made by comparison with the JCPDS files. For zeta potential measurements,
approximately 1 mg of HAP sample was scrapped off and placed into 1 mL of DI water. A 90Plus
Particle Size Analyzer by Brookhaven Instruments Corporation was used. 10 runs, with 5
cycles/run were used to measure the zeta potential. The Smoluchowski model was used for
calculating zeta potential values.
5.3. Results and discussion
Figure 5.1 shows SEM images of the HAP and AgHAP samples. Individual HAP crystals
are ~ 800 nm long and ~30 nm wide. For AgHAP, the Ag nanoparticles are evenly distributed
over the entire HAP coating and along each individual HAP crystal. The size of the Ag
nanoparticles varies from 5 to 50 nm. The variation in nanoparticle size can potentially be
advantageous to control the release of Ag+ since the rate of ion release is proportional to
particle surface area.[30] A range of particle sizes can insure that there will be some Ag+
released quickly from the smaller particles, while the larger particles will release Ag+ more
slowly. Also, according to the Kelvin equation, particles in the nano-size range have a higher
solubility limit than the bulk, allowing for a higher amount of Ag+ delivered if desired.[31]
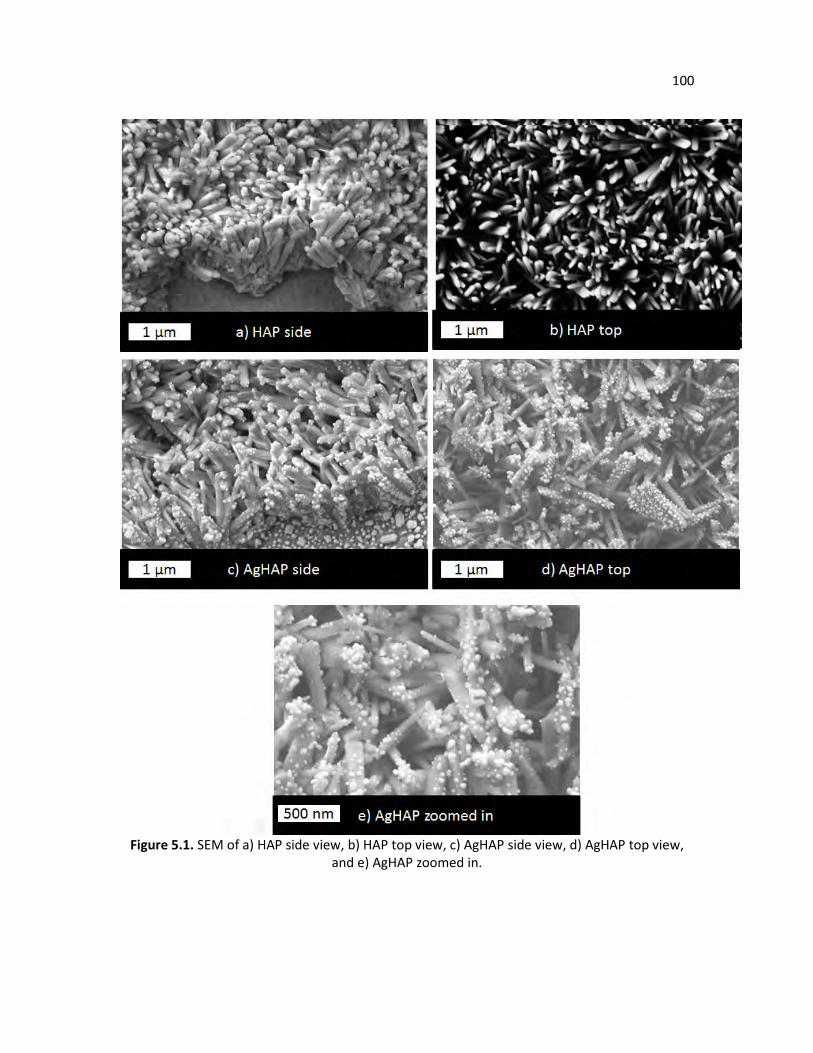
100
Figure 5.1. SEM of a) HAP side view, b) HAP top view, c) AgHAP side view, d) AgHAP top view,
and e) AgHAP zoomed in.
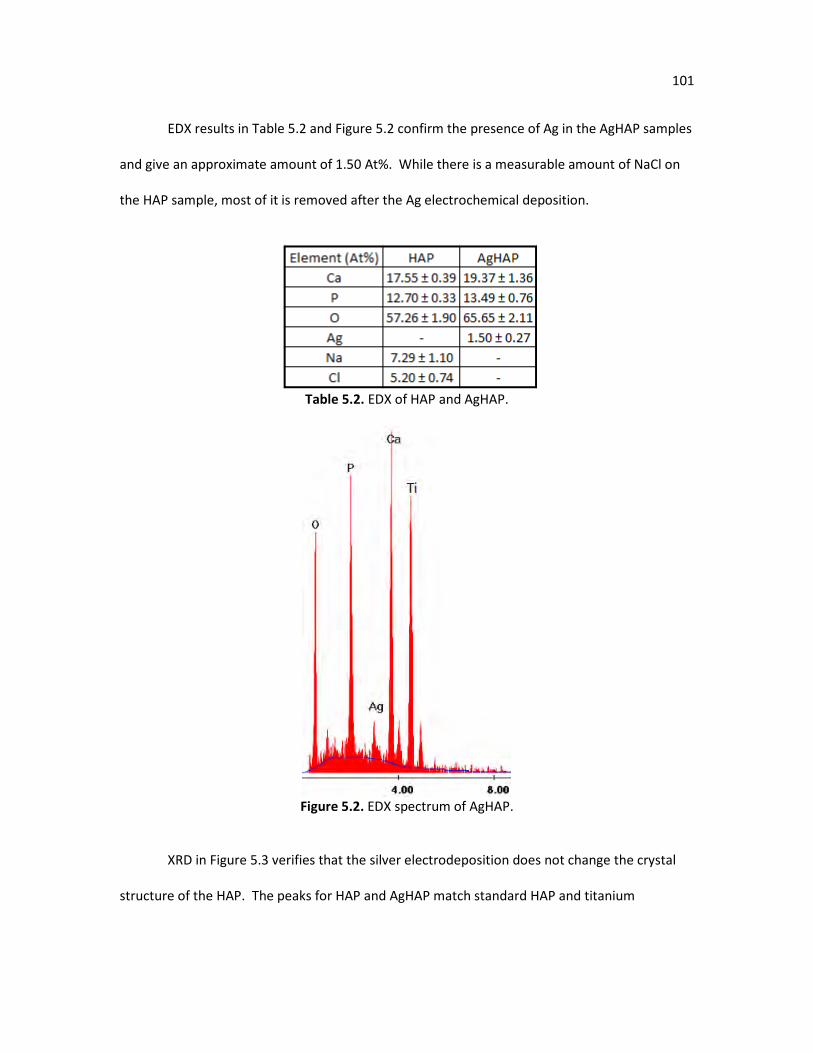
101
EDX results in Table 5.2 and Figure 5.2 confirm the presence of Ag in the AgHAP samples
and give an approximate amount of 1.50 At%. While there is a measurable amount of NaCl on
the HAP sample, most of it is removed after the Ag electrochemical deposition.
Table 5.2. EDX of HAP and AgHAP.
Figure 5.2. EDX spectrum of AgHAP.
XRD in Figure 5.3 verifies that the silver electrodeposition does not change the crystal
structure of the HAP. The peaks for HAP and AgHAP match standard HAP and titanium
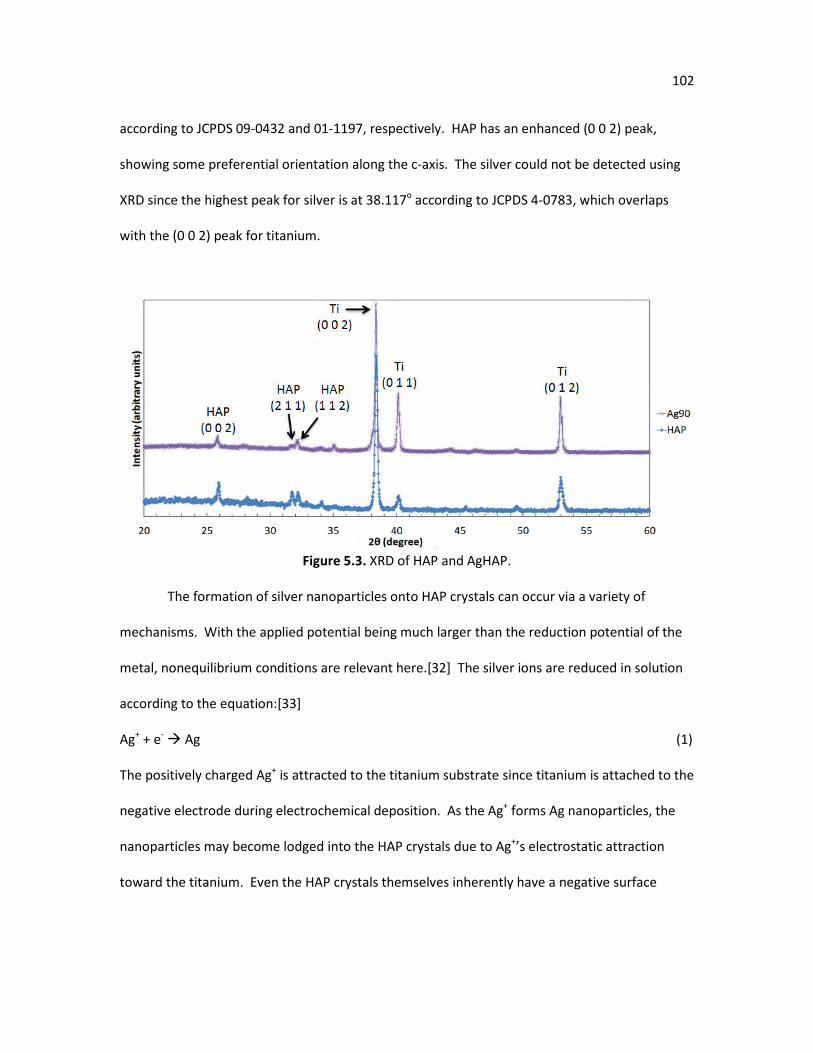
102
according to JCPDS 09-0432 and 01-1197, respectively. HAP has an enhanced (0 0 2) peak,
showing some preferential orientation along the c-axis. The silver could not be detected using
XRD since the highest peak for silver is at 38.117o according to JCPDS 4-0783, which overlaps
with the (0 0 2) peak for titanium.
Figure 5.3. XRD of HAP and AgHAP.
The formation of silver nanoparticles onto HAP crystals can occur via a variety of
mechanisms. With the applied potential being much larger than the reduction potential of the
metal, nonequilibrium conditions are relevant here.[32] The silver ions are reduced in solution
according to the equation:[33]
Ag+ + e- Ag (1)
The positively charged Ag+ is attracted to the titanium substrate since titanium is attached to the
negative electrode during electrochemical deposition. As the Ag+ forms Ag nanoparticles, the
nanoparticles may become lodged into the HAP crystals due to Ag+’s electrostatic attraction
toward the titanium. Even the HAP crystals themselves inherently have a negative surface
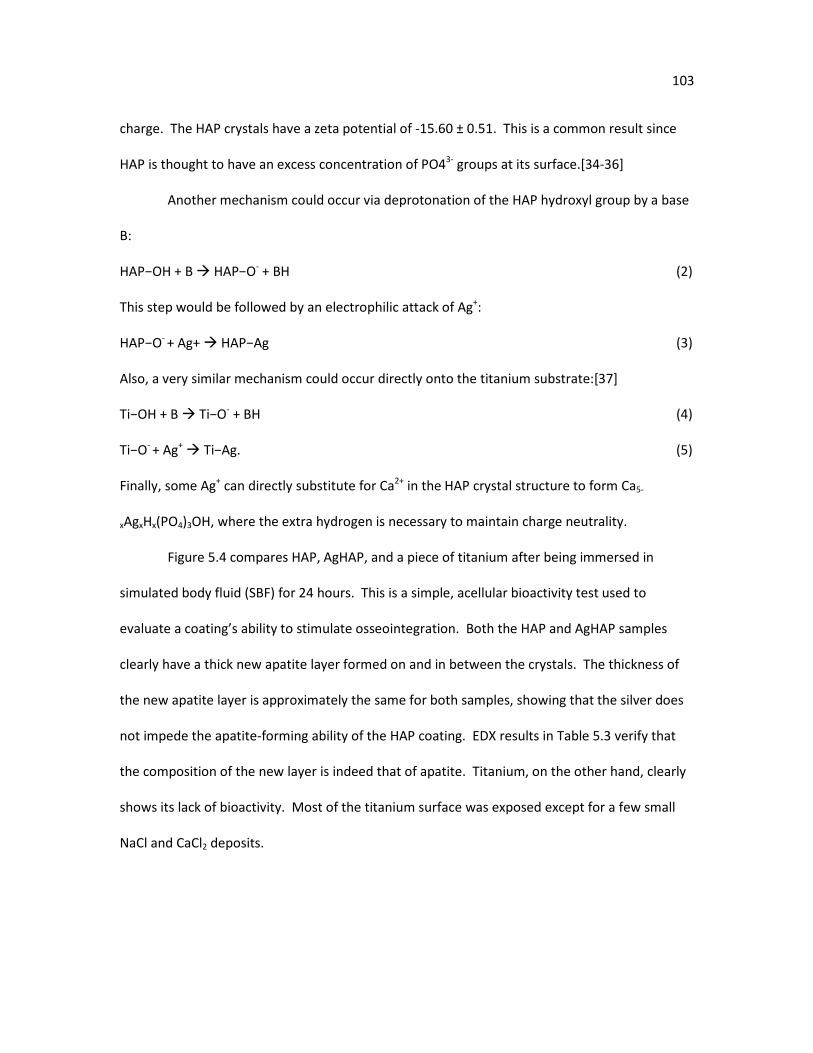
103
charge. The HAP crystals have a zeta potential of -15.60 ± 0.51. This is a common result since
HAP is thought to have an excess concentration of PO43- groups at its surface.[34-36]
Another mechanism could occur via deprotonation of the HAP hydroxyl group by a base
B:
HAP−OH + B HAP−O- + BH (2)
This step would be followed by an electrophilic attack of Ag+:
HAP−O- + Ag+ HAP−Ag (3)
Also, a very similar mechanism could occur directly onto the titanium substrate:[37]
Ti−OH + B Ti−O- + BH (4)
Ti−O- + Ag+ Ti−Ag. (5)
Finally, some Ag+ can directly substitute for Ca2+ in the HAP crystal structure to form Ca5-
xAgxHx(PO4)3OH, where the extra hydrogen is necessary to maintain charge neutrality.
Figure 5.4 compares HAP, AgHAP, and a piece of titanium after being immersed in
simulated body fluid (SBF) for 24 hours. This is a simple, acellular bioactivity test used to
evaluate a coating’s ability to stimulate osseointegration. Both the HAP and AgHAP samples
clearly have a thick new apatite layer formed on and in between the crystals. The thickness of
the new apatite layer is approximately the same for both samples, showing that the silver does
not impede the apatite-forming ability of the HAP coating. EDX results in Table 5.3 verify that
the composition of the new layer is indeed that of apatite. Titanium, on the other hand, clearly
shows its lack of bioactivity. Most of the titanium surface was exposed except for a few small
NaCl and CaCl2 deposits.

104
Figure 5.4. SEM of new HAP growth after being immersed in SBF for 24 hours, a) HAP after SBF immersion, b) AgHAP after SBF immersion, c) representative top view of samples in images a
and b, and d) Ti after SBF immersion.
Table 5.3. EDX of new apatite layer after immersion in SBF for HAP, AgHAP, and Ti.
Figure 5.5 shows the growth profile of S. aureus bacteria and when it is exposed to the
HAP and AgHAP samples. There is a clear distinction between the two samples, showing the
ability of the silver ions released from the AgHAP samples to retard bacteria growth. Based on
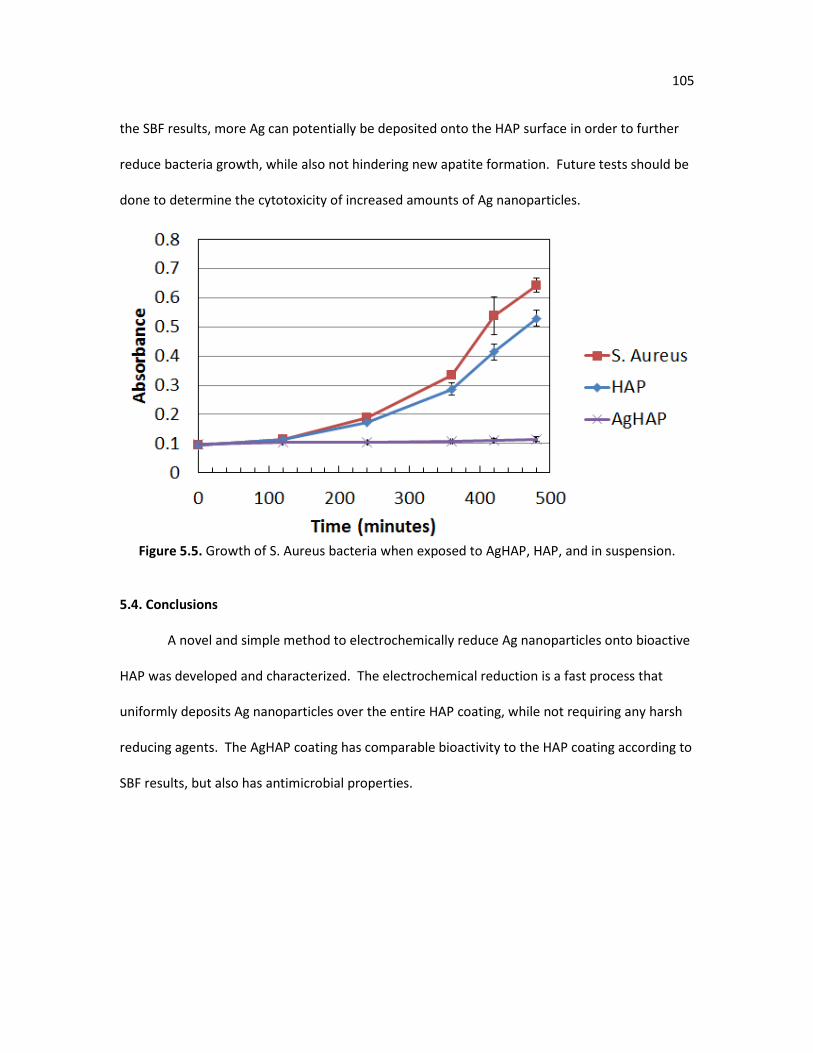
105
the SBF results, more Ag can potentially be deposited onto the HAP surface in order to further
reduce bacteria growth, while also not hindering new apatite formation. Future tests should be
done to determine the cytotoxicity of increased amounts of Ag nanoparticles.
Figure 5.5. Growth of S. Aureus bacteria when exposed to AgHAP, HAP, and in suspension.
5.4. Conclusions
A novel and simple method to electrochemically reduce Ag nanoparticles onto bioactive
HAP was developed and characterized. The electrochemical reduction is a fast process that
uniformly deposits Ag nanoparticles over the entire HAP coating, while not requiring any harsh
reducing agents. The AgHAP coating has comparable bioactivity to the HAP coating according to
SBF results, but also has antimicrobial properties.
106
References
1. Hetrick, E. and M. Schoenfisch, Reducing implant-related infections: active release
strategies. Chemical Society Reviews, 2006. 35: p. 780-789.
2. Orthopedic Implants A Global Market Overview. 2011.
3. S.Ban and S. Maruno, Hydrothermal-electrochemical deposition of hydroxyapatite. Journal of Biomedical Materials Research, 1998. 42: p. 387-395.
4. C. Ergun, et al., Hydroxylapatite with substituted magnesium, zinc, cadmium, and
yttrium. I. Structure and microstructure. Journal of Biomedical Materials Research, 2001. 59: p.
305-311.
5. Suchanek, W. and M. Yoshimura, Processing and properties of hydroxyapatite-based
biomaterials for use as hard tissue replacement implants. Journal of Materials Research, 1998.
13: p. 94-117.
6. Zakaria, S., et al., Nanophase hydroxyapatite as a biomaterial in advanced hard tissue
engineering: A review. Tissue Eng. Part B Rev., 2013.
7. Kuo, M. and S. Yen, The process of electrochemical deposited hydroxyapatite coatings on
biomedical titanium at room temperature. Materials Science and Engineering C, 2002. 20: p.
153-160.
8. Kar, A., K. Raja, and M. Misra, Electrodeposition of hydroxyapatite onto nanotubular
TiO2 for implant applications. Surface and Coatings Technology, 2006. 2001: p. 3723-3731.
9. Darouiche, R., Treatment of infections associated with surgical implants. New England Journal of Medicine, 2004. 350: p. 1422-1429.
10. Simchi, A., et al., Recent progress in inorganic and composite coatings with bactericidal
capability for orthopedic applications. Nanomedicine, 2011. 7: p. 22-39.
11. Gristina, A., Biomaterial-centered infection: microbial adhesion versus tissue integration.
Science, 1987. 237: p. 1588-1595.
12. Davis, D., Understanding biofilm resistance to antibacterial agents. Nature Reviews Drug
Discovery, 2003. 2: p. 114-122.
13. Beringer, P., A. Wong-Berringer, and J. Rho, Economic aspects of antibacterial adverse
effects. PharmacoEconomics, 1998. 13: p. 35-49.
107
14. Neut, D., et al., Residual gentamicin-release from antibiotic-loaded
polymethylmethacrylate beads after 5 years of implantation. Biomaterials, 2003. 24: p. 1829-1831.
15. Eiff, C.V., et al., Development of gentamicin resistant small colony variants of S. aureus
after implantation of gentamicin chains in osteomyelitis as a possible cause of recurrence. Z
Orthop Ihre Grenzgeb, 1998. 136: p. 268-271.
16. Brauer, S.H.G. and G. Dickson, A characterization of polymethylmethacrylate bone
cement. Journal of Bone Joint Surgery, 1975. 55A: p. 380-391.
17. Wahlig, H., et al., Experimental and pharmacokinetic studies with gentamicin PMMA
beads. Zentralbl Chir, 1979. 104: p. 923-933.
18. Kim, S., et al., The characteristics of a hydroxyapatite-chitosan-PMMA bone cement.
Biomaterials, 2004. 25: p. 5715-5723.
19. Schnieders, J., et al., Controlled release of gentamicin from calcium phosphate-
poly(lactic acid-co-glycolic acid) composite bone cement. Biomaterials, 2006. 27: p. 4239-4249.
20. Stigter, M., et al., Incorporation of different antibiotics into carbonated hydroxyapatite
coatings on titanium implants, release and antibiotic efficacy. Journal of Controlled Release,
2004. 99: p. 127-137.
21. Stigter, M., K.d. Groot, and P. Layrolle, Incorporation of tobramycin into biomimetic
hydroxyapatite coating on titanium. Biomaterials, 2002. 23: p. 4143-4153.
22. Liu, W., et al., Gentamicin-loaded strontium-containing hydroxyapatite bioactive bone
cement—An efficient bioactive antibiotic drug delivery system. Journal of Biomedical Materials
Research B: Applied Biomaterials, 2010. 95B: p. 397-406.
23. Serizawa, T., D. Matsukuma, and M. Akashi, Loading and release of charged dyes using
ultrathin hydrogels. Langmuir, 2005. 21: p. 7739-7742.
24. Chen, W., et al., In vitro anti-bacterial and biological properties of magnetron co-
sputtered silver-containing hydroxyapatite coating. Biomaterials, 2006. 27: p. 5512-5517.
25. Vik, H., et al., Neuropathy caused by silver adsorption from arthroplasty cement. Lancet,
1985. 1: p. 872.
26. Rai, M., A. Yadav, and A. Gade, Silver nanoparticles as a new generation of
antimicrobials. Biotechnology Advances, 2009. 27: p. 76-83.
108
27. Campoccia, D., L. Montanaro, and C. Arciola, A review of biomaterials technologies for
infection-resistant surfaces. Biomaterials, 2013. 34: p. 8533-8554.
28. Liu, X., et al., Synthesis of silver-incorporated hydroxyapatite nanocomposites for
antimicrobial implant coatings. Applied Surface Science, 2013. 273: p. 748-757.
29. Kokubo, T., et al., Solutions able to reproduce in vivo surface-structure changes in
bioactive glass-ceramic A-W. J. Biomed. Mater. Res, 1990. 24: p. 721-734.
30. Ionita, D., et al., Merit and demerit effects of silver nanoparticles in the bioperformance
of an electrodeposited hydroxyapatite: nanosilver composite coating. J. Nanopart. Res., 2012. 14: p. 1152-1162.
31. Muller, R., C. Jacobs, and O. Kayser, Nanosuspensions as particulate drug formulations in
therapy. Rationale for development and what we can expect for the future. Advanced Drug
Delivery Reviews, 2001. 47: p. 3-19.
32. Kaniyankandy, S., et al., Electrodeposition of silver nanodendrites. Nanotechnology,
2007. 18: p. 1-6.
33. Lu, X., et al., Nano-Ag-loaded hydroxyapatite coatings on titanium surfaces by
electrochemical deposition. J. R. Soc. Interface, 2011. 8: p. 529-539.
34. Kim, H., et al., Process and kinetics of bonelike apatite formation on sintered
hydroxyapatite in a simulated body fluid. Biomaterials, 2005. 26: p. 4366-4373.
35. Vandiver, J., et al., Nanoscale variation in surface charge of synthetic hydroxyapatite
detected by chemically and spatially specific high-resolution force spectroscopy. Biomaterials, 2005. 26(271-283).
36. Brown, P. and R. Martin, An analysis of hydroxyapatite surface layer formation. Journal
of Physical Chemistry B., 1999. 103: p. 1671-1675.
37. Santillan, M., N. Quaranta, and A. Boccaccini, Titania and titania-silver nanocomposite
coatings grown by electrophoretic deposition from aqueous suspensions. Surface & Coatings Technology, 2010. 205: p. 2562-2571.
109
Chapter 6
Conclusions and Future Work
6.1. Conclusions
This thesis investigated a novel synthesis technique to deposit a highly oriented, crystalline film
of hydroxyapatite onto various metal substrates. Various properties of the coating were characterized
and the coatings were synthesized with many applications in mind such as a fuel cell electrolyte and an
orthopedic coating with antimicrobial properties. A summary of the main conclusions from these
studies are as follows:
(a) The thermal stability of novel hydroxyapatite membranes was investigated in order to determine
their feasibility in high temperature applications. It was found that substituting fluoride into the crystal
structure prevented the hydroxyapatite coating from decomposing into other calcium phosphate phases
such as β-TCP at temperatures up to at least 900oC, whereas unfluorinated samples began
decomposition around 600oC. A yttrium-fluoride co-doped sample demonstrated the potential to
further modify properties of the film by adding additional dopants, while also maintaining a high
thermal stability. The co-doped films also produced a highly dense and thin film after only one
hydrothermal growth, which may be beneficial for applications requiring a dense film such as a fuel cell
electrolyte. Finally, a steam atmosphere was also shown to retard thermal decomposition since it shifts
the decomposition equation to favor hydroxyapatite.
(b) Much research has been done studying the influence of polarizing hydroxyapatite, particularly with a
negative surface charge, in order to improve osteointegration. In this thesis, yttrium-fluoride co-doped
hydroxyapatite membranes on titanium were prepared using a hydrothermal growth and two different
110
seeding steps. Both samples had a very large stored charge according to thermally stimulated
depolarization current measurements, even without polarization. The large stored charge is speculated
to come from a composition concentration gradient within the sample. Also, the c-axis orientation of
the crystals relative to the substrate and the fact that they had no grain boundaries along the crystal
allowed the current measured from the samples to be high.
(c) SEM, EDX, and XRD analysis characterized hydroxyapatite films doped with various amounts of
ytterbium. The results showed that there is a range of ytterbium that can be incorporated into the
crystal structure until a phase change occurs. Once the phase change occurs, the membrane loses its
unique crystal orientation and morphology. Ytterbium and ytterbium-fluoride co-doped hydroxyapatite
membranes were then tested as fuel cell electrolytes. The results showed that the membranes were
ionically conductive, electronically insulating, and gas tight. While the conductivity and power output of
the fuel cells were low compared to state of the art fuel cell electrolytes, much can be done to improve
performance such as optimizing the cathode composition and deposition process, as well as controlling
the amount of dopant used.
(d) A hydroxyapatite film that was electrochemically deposited onto titanium was uniformly coated with
silver nanoparticles using a second electrochemical deposition step. The process for reducing silver
nanoparticles on hydroxyapatite is fast, simple, and can be done on a variety of substrate shapes. The
apatite coating with and without silver nanoparticles were shown to have comparable apatite forming
abilities in a simulated body fluid, while the silver coated samples have a superior capability to slow
down bacteria growth.
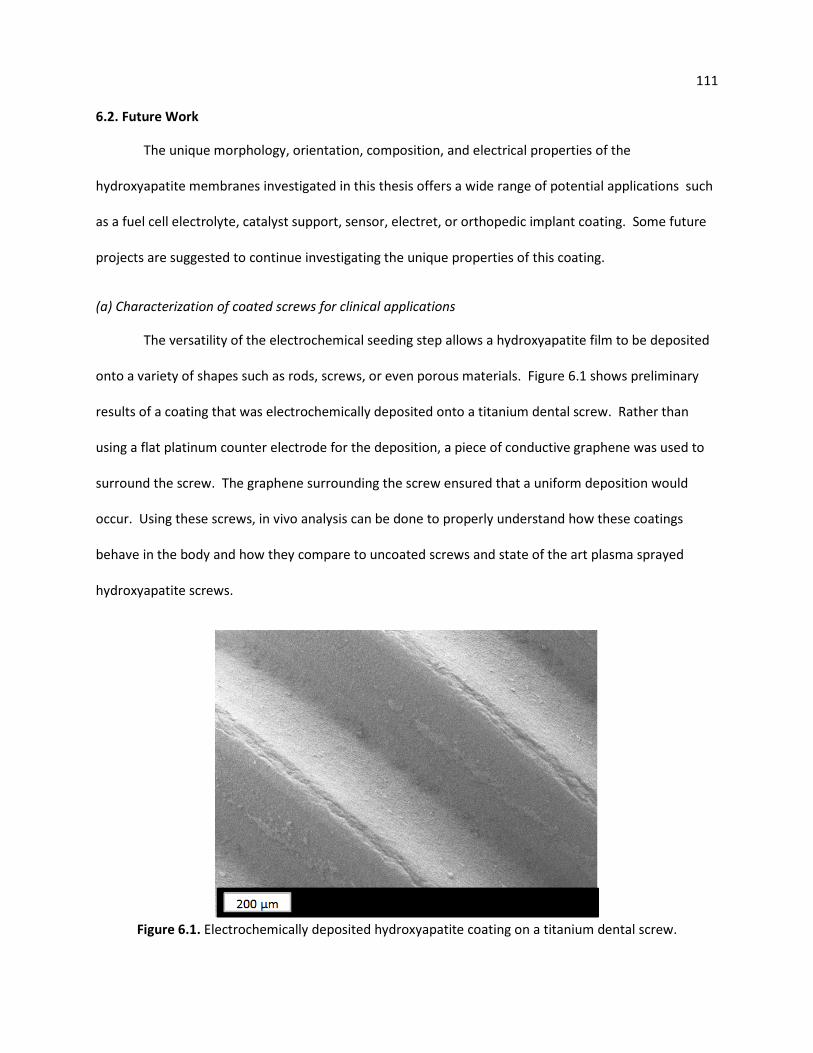
111
6.2. Future Work
The unique morphology, orientation, composition, and electrical properties of the
hydroxyapatite membranes investigated in this thesis offers a wide range of potential applications such
as a fuel cell electrolyte, catalyst support, sensor, electret, or orthopedic implant coating. Some future
projects are suggested to continue investigating the unique properties of this coating.
(a) Characterization of coated screws for clinical applications
The versatility of the electrochemical seeding step allows a hydroxyapatite film to be deposited
onto a variety of shapes such as rods, screws, or even porous materials. Figure 6.1 shows preliminary
results of a coating that was electrochemically deposited onto a titanium dental screw. Rather than
using a flat platinum counter electrode for the deposition, a piece of conductive graphene was used to
surround the screw. The graphene surrounding the screw ensured that a uniform deposition would
occur. Using these screws, in vivo analysis can be done to properly understand how these coatings
behave in the body and how they compare to uncoated screws and state of the art plasma sprayed
hydroxyapatite screws.
Figure 6.1. Electrochemically deposited hydroxyapatite coating on a titanium dental screw.
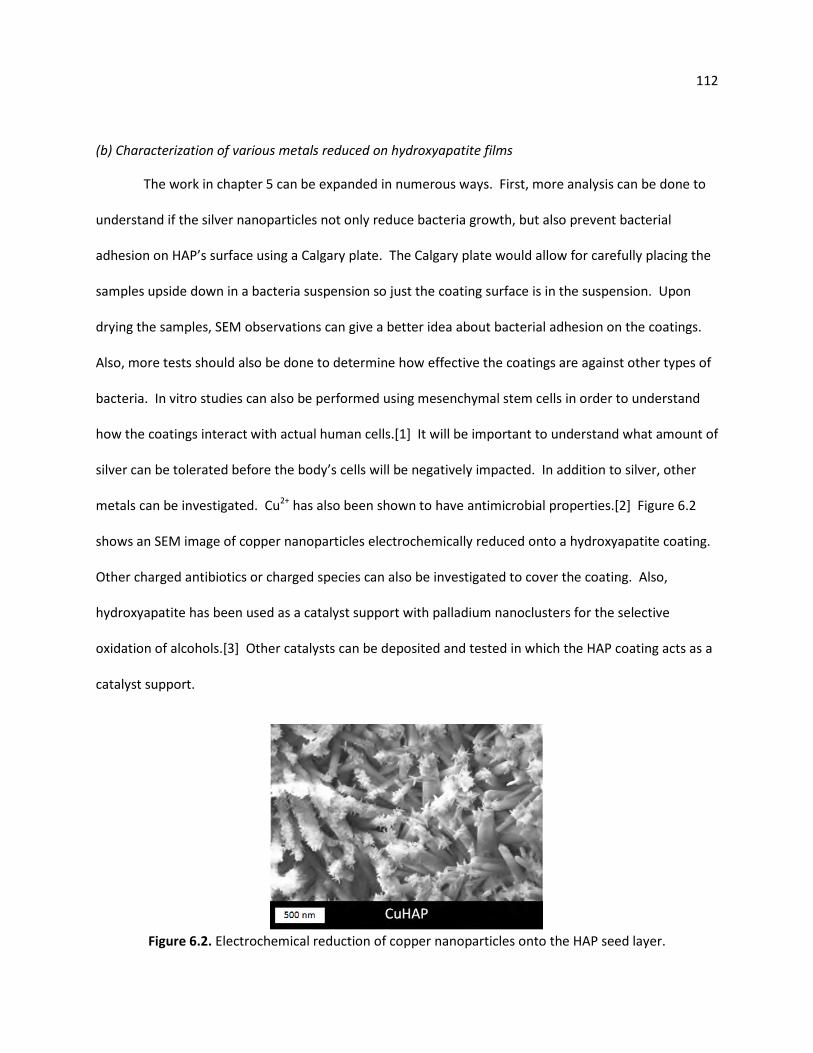
112
(b) Characterization of various metals reduced on hydroxyapatite films
The work in chapter 5 can be expanded in numerous ways. First, more analysis can be done to
understand if the silver nanoparticles not only reduce bacteria growth, but also prevent bacterial
adhesion on HAP’s surface using a Calgary plate. The Calgary plate would allow for carefully placing the
samples upside down in a bacteria suspension so just the coating surface is in the suspension. Upon
drying the samples, SEM observations can give a better idea about bacterial adhesion on the coatings.
Also, more tests should also be done to determine how effective the coatings are against other types of
bacteria. In vitro studies can also be performed using mesenchymal stem cells in order to understand
how the coatings interact with actual human cells.[1] It will be important to understand what amount of
silver can be tolerated before the body’s cells will be negatively impacted. In addition to silver, other
metals can be investigated. Cu2+
has also been shown to have antimicrobial properties.[2] Figure 6.2
shows an SEM image of copper nanoparticles electrochemically reduced onto a hydroxyapatite coating.
Other charged antibiotics or charged species can also be investigated to cover the coating. Also,
hydroxyapatite has been used as a catalyst support with palladium nanoclusters for the selective
oxidation of alcohols.[3] Other catalysts can be deposited and tested in which the HAP coating acts as a
catalyst support.
Figure 6.2. Electrochemical reduction of copper nanoparticles onto the HAP seed layer.

113
References
1. Bodhak, S., S. Bose, and A. Bandyopadhyay, Bone cell–material interactions on metal-ion doped
polarized hydroxyapatite. Materials Science and Engineering C, 2011. 31: p. 755-761.
2. Bir, F., et al., Electrochemical depositions of fluorohydroxyapatite doped by Cu2+, Zn2+, Ag+ on
stainless steel substrates. Applied Surface Science, 2012. 258: p. 7021-7030.
3. Mori, K., et al., Hydroxyapatite-supported palladium nanoclusters: A highly active heterogeneous
catalyst for selective oxidation of alcohols by use of molecular oxygen. J. Am. Chem. Soc., 2004. 126: p.
10657-10666.