Microstructural controls on the ure-dependent press permeability … · 2017-02-27 · condition...
59
The University of Manchester Research Microstructural controls on the pressure-dependent permeability of Whitby Mudstone DOI: 10.1144/SP454.15 Document Version Accepted author manuscript Link to publication record in Manchester Research Explorer Citation for published version (APA): Mckernan, R., Mecklenburgh, J., Rutter, E., & Taylor, K. (2017). Microstructural controls on the pressure- dependent permeability of Whitby Mudstone. Geological Society Special Publication, 454. https://doi.org/10.1144/SP454.15 Published in: Geological Society Special Publication Citing this paper Please note that where the full-text provided on Manchester Research Explorer is the Author Accepted Manuscript or Proof version this may differ from the final Published version. If citing, it is advised that you check and use the publisher's definitive version. General rights Copyright and moral rights for the publications made accessible in the Research Explorer are retained by the authors and/or other copyright owners and it is a condition of accessing publications that users recognise and abide by the legal requirements associated with these rights. Takedown policy If you believe that this document breaches copyright please refer to the University of Manchester’s Takedown Procedures [http://man.ac.uk/04Y6Bo] or contact [email protected] providing relevant details, so we can investigate your claim. Download date:17. Mar. 2020
Transcript of Microstructural controls on the ure-dependent press permeability … · 2017-02-27 · condition...

The University of Manchester Research
Microstructural controls on the pressure-dependentpermeability of Whitby MudstoneDOI:10.1144/SP454.15
Document VersionAccepted author manuscript
Link to publication record in Manchester Research Explorer
Citation for published version (APA):Mckernan, R., Mecklenburgh, J., Rutter, E., & Taylor, K. (2017). Microstructural controls on the pressure-dependent permeability of Whitby Mudstone. Geological Society Special Publication, 454.https://doi.org/10.1144/SP454.15
Published in:Geological Society Special Publication
Citing this paperPlease note that where the full-text provided on Manchester Research Explorer is the Author Accepted Manuscriptor Proof version this may differ from the final Published version. If citing, it is advised that you check and use thepublisher's definitive version.
General rightsCopyright and moral rights for the publications made accessible in the Research Explorer are retained by theauthors and/or other copyright owners and it is a condition of accessing publications that users recognise andabide by the legal requirements associated with these rights.
Takedown policyIf you believe that this document breaches copyright please refer to the University of Manchester’s TakedownProcedures [http://man.ac.uk/04Y6Bo] or contact [email protected] providingrelevant details, so we can investigate your claim.
Download date:17. Mar. 2020

Microstructural controls on the pressure-dependent permeability of Whitby Mudstone Rosanne Mckernan1, Julian Mecklenburgh*, Ernie Rutter and Kevin Taylor
School of Earth and Environmental Sciences, The University of Manchester, Oxford Road,
Manchester, M13 9PL, U.K.
1: Now at Shell International Ltd. 40 Bank Street, London, E14 5NR, UK
*corresponding author: [email protected]
Abstract A combination of permeability and ultrasonic velocity measurements allied with image
analysis is used to distinguish the primary microstructural controls on effective-pressure
dependent permeability. Permeabilities of cylindrical samples of Whitby Mudstone were
measured using the oscillating pore pressure method at confining pressures ranging between
30-95 MPa and pore pressures ranging between 1-80 MPa. The permeability-effective
pressure relationship is empirically described using a modified effective pressure law in terms
of confining pressure, pore pressure and a Klinkenberg effect. Measured permeability ranges
between 3×10-21 m2 and 2 ×10-19 m2 (3 and 200 nd), and decreases by ~1 order of magnitude
across the applied effective pressure range. Permeability is shown to be less sensitive to
changes in pore pressure than changes in confining pressure, yielding permeability effective
pressure coefficients (𝜒𝜒) between 0.42 and 0.97. Based on a pore-conductivity model which
considers the measured changes in acoustic wave velocity and pore volume with pressure, the
observed loss of permeability with increasing effective pressure is attributed dominantly to
the progressive closure of bedding-parallel, crack-like pores associated with grain boundaries.
Despite only constituting a fraction of the total porosity, these pores form an interconnected
network that significantly enhances permeability at low effective pressures.
The pre-publication reference is: Mckernan, R., Mecklenburgh, J., Rutter, E. H. and Taylor
K.G. (2017) . Microstructural controls on the pressure-dependent permeability of Whitby
mudstone. In (E. Rutter, J. Mecklenburgh & K. Taylor, eds) Geomechanical and
Petrophysical Properties of Mudrocks, Geological Society of London Special Publication
454, doi:.org/10.1144/SP454 (In Press).

Keywords: mudstone, permeability, effective pressure, shale gas
Supplementary Material: A CSV file containing all experimental conditions and a
tabulation of results is available at …
Measuring the fluid-transport properties of rock samples under stress is essential to
understanding and predicting the migration of fluids within the subsurface. Mudstones
constitute 60-70 % of the sedimentary rocks within the Earth's crust (Blatt 1992), and an
understanding of their physical rock properties is required for many geo-engineering
applications including geo-hazard studies (e.g. faults and landslides), basin-evolution studies,
hydrocarbon exploration, deposition of landfill, nuclear waste disposal and CO2 storage.
Progress in understanding fluid transport properties of mudstones is currently hindered by a
scarcity of published experimental data. However, the ongoing expansion of the hydrocarbon
industry into low-permeability unconventional resources is driving the demand for research
and development in this field. Even when hydraulic fracture treatment is used to enhance
production, flow of hydrocarbons into the fractures will be controlled ultimately by the
microporous, low permeability matrix. Furthermore, during reservoir production pore-fluid
pressure is progressively reduced, which acts to increase the in-situ Terzaghi effective
pressure (defined as overburden pressure minus pore pressure), thereby decreasing
permeability. The evolution of permeability of the matrix therefore determines the prediction
of long-term production, which must take into account the effects of flow regime, multi-
phase flow, sorption effects, permeability anisotropy and, most importantly, the pressure-
dependence of permeability.
Laboratory measurements of permeability of intact mudstone samples performed under
reservoir conditions has yielded values between 10-22 m2 and 10-12 m2 (0.1 nD and 1 D) for
flow both parallel and normal to layering (Morrow et al. 1984; Katsube et al. 1991; Coyner et
al. 1993; Schlömer & Krooss 1997; Dewhurst et al. 1998; Faulkner & Rutter 2000; Kwon et
al. 2001; Hildenbrand et al. 2004; Kwon et al. 2004; Yang & Aplin 2007; Metwally &
Sondergeld 2011; Chalmers et al. 2012; Clarkson et al. 2012a; Ghanizadeh et al. 2014a;
Ghanizadeh et al. 2014b; Heller et al. 2014; Morrow et al. 2014). Where quantified, the
relationship between permeability and effective pressure may be empirically described by
either an exponential function (Katsube et al. 1991; Schlömer & Krooss 1997; Chalmers et

al. 2012; Ghanizadeh et al. 2014b) or a power law function (Katsube et al. 1991; Kwon et al.
2001; Metwally & Sondergeld 2011). It has also been demonstrated that for the permeability
of clay-bearing rocks, the assumption that effective pressure is simply the difference between
confining pressure and pore pressure is not generally valid, as the permeability may be either
more or less sensitive to pore pressure than the confining pressure (Kwon et al. 2001; Heller
et al. 2014; Letham & Bustin 2016). For a clay-bearing sandstone, permeability was found to
be up to seven times more sensitive to pore pressure than to confining pressure (Zoback &
Byerlee 1975; Walls & Nur 1979) whereas for a variety of shales, Heller et al. (2014) found
permeability to be more sensitive to confining pressure than to pore pressure. For the
purpose of modelling production from gas reservoirs it is especially important to take into
account effect on permeability of both the pore pressure and the confining pressure, because
it is the pore pressure that declines as gas is extracted during production.
This investigation uses direct measurements of permeability, pore compressibility and
ultrasonic velocity on intact core plugs to identify the factors controlling the transport of fluid
through mudstones at the matrix scale, and to discover how these controls are affected by
changes in effective pressure. Within the rock matrix these properties are controlled
primarily by pore geometry and connectivity, therefore as pore characteristics alter with
changes in lithostatic (confining) pressure and pore fluid pressure, so too will the efficiency
of fluid transport. Refining understanding of these fundamental properties of mudstones will
improve the accuracy not only of unconventional-reservoir production models, but of any
calculations of in-situ stresses, pore fluid pressure variations and burial history within
sedimentary basins.
Background Permeability, 𝑘𝑘𝑖𝑖𝑖𝑖 (m2), is a measure of the ease of flow of a fluid of viscosity 𝜇𝜇 (Pa s) through
a porous medium for an anisotropic material that can be represented as a 3x3 matrix and is
empirically described by Darcy’s law (equation 1):
𝐽𝐽𝑖𝑖𝑖𝑖 = −𝑘𝑘𝑖𝑖𝑖𝑖𝜇𝜇
∇𝑃𝑃 (1)
where 𝐽𝐽𝑖𝑖𝑖𝑖 (m s-1) is the matrix of fluid fluxes (volume of fluid crossing an area of 1 m2 per
second), and ∇𝑃𝑃 is the 3D pressure gradient (Pa m-1). The SI unit of permeability is m2, but
in the hydrocarbon industry it is most commonly expressed in Darcys, where 1.0 D = 0.987

×10-12 m2. Equation 1 is a differential equation which has to be integrated over pressure to
obtain a solution that can be used in any specific situation. For example, a 1 dimensional
flow along a sample of length L of compressible gas means that the flow rate is not constant
along the flow path because the gas expands as it moves down the pressure gradient. Thus
equation 1 becomes:
𝐽𝐽 =𝑘𝑘𝜇𝜇
(𝑃𝑃12 − 𝑃𝑃22)2𝐿𝐿𝑃𝑃2
(2)
where P1 and P2 are the upstream and downstream pressures respectively. Conventional
reservoir rocks typically have a permeability on the order of 10-13 m2 (100 mD) (Mavko et al.
2009), whereas the permeability of a mudstone commonly lies between 10-18 - 10-21 m2 (1
μD - 1 nD).
Although Darcy flow is the dominant mechanism of fluid transport within the pores of
conventional reservoir rocks, gas transport in mudstones and other tight rocks with sub-μm-
scale pore throats will be affected, at low pore pressures, by gas slippage phenomena that
may cause deviations from Darcy's law (e.g. Klinkenberg 1941). The Knudsen number is
the ratio of the molecular mean free path length of the gas molecules, 𝜆𝜆 (m), to the
characteristic length of the porous medium (in this case the mean pore width). This
dimensionless number is indicative of the flow regime occurring in the porous medium.
Darcy-type laminar flow occurs when the Knudsen number is small i.e. when gas pressures
are high (mean free path small) and pore widths are large. At low gas pressures and small
pore widths Knudsen flow becomes dominant and the gas slippage effect occurs due to the
increased probability of molecule - pore wall interactions compared to the probability of
molecule-molecule interactions. Thus gas molecules flow more easily than under the no-slip
condition and apparent permeability calculated using Darcy's formula would become
increased. To account for any such gas slippage contribution, Klinkenberg (1941) combined
Darcy's law with the Hagen-Poiseuille law for flow through a pipe showing that when
slippage does enhance gas flow, the relationship between apparent (measured) permeability
(𝑘𝑘𝑎𝑎) and ‘true’ permeability (𝑘𝑘∞) (i.e. permeability when gas slippage effects are negligible,
such as for liquids or flow at high gas pressures) is
𝑘𝑘𝑎𝑎 = 𝑘𝑘∞ �1 +4𝑚𝑚 𝜆𝜆𝑐𝑐
� (3)

where 𝑚𝑚 is a proportionality constant and 𝑐𝑐 is the capillary radius (m). Because mean free
path is inversely proportional to mean pore gas pressure (𝑃𝑃𝑝𝑝), equation 3 can be written as
𝑘𝑘𝑎𝑎 = 𝑘𝑘∞ �1 +𝐾𝐾𝑏𝑏𝑃𝑃𝑝𝑝� (4)
where 𝐾𝐾𝑏𝑏 is the slippage factor (or Klinkenberg parameter), reflecting the extent to which
permeability is affected by slippage as a function of pore pressure Pp. When modelling
production from gas reservoirs, the flow enhancement through the gas slippage effect can
become important during the final stages of production when pressures as low as 1 MPa may
be reached (Clarkson et al. 2012b).
Pressure-dependent permeability
Variations in physical rock properties (e.g. strength, elasticity, acoustic wave velocity and
permeability) with applied pressure are usually described as a function of effective stress 𝜎𝜎𝑖𝑖𝑖𝑖eff,
defined by Terzaghi (1923) as the difference between the total stress (𝜎𝜎𝑖𝑖𝑖𝑖) and the hydrostatic
pore fluid pressure (𝑃𝑃𝑝𝑝 𝛿𝛿𝑖𝑖𝑖𝑖), where 𝛿𝛿𝑖𝑖𝑖𝑖 is the Kronecker delta. Terzaghi's effective pressure
law does not account for different sensitivities of the measured property to changes in pore
pressure and confining pressure, therefore it is often modified by including a coefficient that
adjusts the effectiveness of the pore pressure on the total pressure and was first introduced by
Biot (1941) to explain poroelasticity
𝜎𝜎𝑖𝑖𝑖𝑖eff = 𝜎𝜎𝑖𝑖𝑖𝑖 − 𝜒𝜒𝑃𝑃𝑝𝑝𝛿𝛿𝑖𝑖𝑖𝑖
The value of the effective-pressure coefficient 𝜒𝜒 may be different for different physical
properties. Nur & Byerlee (1971) used the permeability effective pressure coefficient 𝜒𝜒 to
account for different sensitivities of volumetric strain to pore pressure and confining pressure.
The permeability effective pressure coefficient, 𝜒𝜒, has been measured on granite (Coyner
1984; Morrow et al. 1984; Bernabé 1986; Bernabe 1987), sandstone (Zoback & Byerlee
1975; Walls & Nur 1979) and mudstone (Kwon et al. 2001; Heller et al. 2014). For granite,
𝜒𝜒 tended to 1 with pressure cycling (Bernabé 1988); for clay-bearing sandstones Zoback &
Byerlee (1975) and Walls & Nur (1979) measured values of 𝜒𝜒 between 1 and 7.1. For a
variety of mudstones Heller et al. (2014) measured values of 𝜒𝜒 between 0.15 and 0.85, whilst
Kwon et al. (2001) measured values of 𝜒𝜒 close to 1. To explain 𝜒𝜒 > 1 it is common to
invoke a “clay-pore model” (Zoback & Byerlee 1975; Seeburger & Nur 1984; Kwon et al.

2001; Al-Wardy & Zimmerman 2004) whereby the pores between a framework of rigid
grains are lined by more compliant phases such as clays or kerogens, or partially saturated
with liquid. With increased pore pressure, the compliant minerals are compressed and as a
result pore diameter (and thus permeability) is increased. Complementary to this, Berryman
(1992) showed that theoretically for 𝜒𝜒 to exceed unity a rock had to consist of more than one
phase with differing compressibilities, while the measurements by Walls & Nur (1979)
showed 𝜒𝜒 to increase above 1 with increasing clay fraction in sandstones (Al-Wardy &
Zimmerman 2004). For 𝜒𝜒 < 1 the pore pressure is less effective at opening the pore throats
than the confining pressure is at closing them.
Sample preparation and description Samples from the Grey Shale member of the Whitby Mudstone Formation were collected
from two locations in the intertidal zone on a wave cut platform at Runswick Bay, Yorkshire,
UK (UK grid location NZ 815 154), shown in Figure 1. Cores 25 mm in diameter were taken
from blocks from both locations in orientations both parallel and perpendicular to bedding,
ranging in length between 25 mm and 35 mm (Table 1). Length and diameter of each sample
was measured to an accuracy of 0.01 mm and weighed to a precision of 0.001 g, before and
after being oven dried at 60 °C until the mass measured remained constant. At this
temperature the structures of organic particles or expandable clays remain unaltered (Bush et
al. 1970). After permeability testing, a polished thin section of each sample was prepared
perpendicular to the sample axis and analysed for composition and texture using both
transmitted light and scanning electron (SEM) microscopes. Optical photomicrographs
representing the texture of each sample were processed in ImageJ (Schneider et al. 2012), to
determine the silt content. Element maps of compositionally representative areas were
measured using energy dispersive X-Ray spectroscopy in the SEM, showing the relative
distribution of particular elements present, and from this mineralogy could be inferred. The
element maps were processed in ImageJ and layered to create maps showing the
mineralogical constitution of each sample (Figure 2d).
Sample description
The Whitby Mudstone Formation forms part of the Lias group, a thick succession of
siliciclastic mudstones deposited in the Cleveland basin during the early Jurassic period
(Rawson & Wright 1995). The high illite content in the Whitby Mudstone (90% of clay
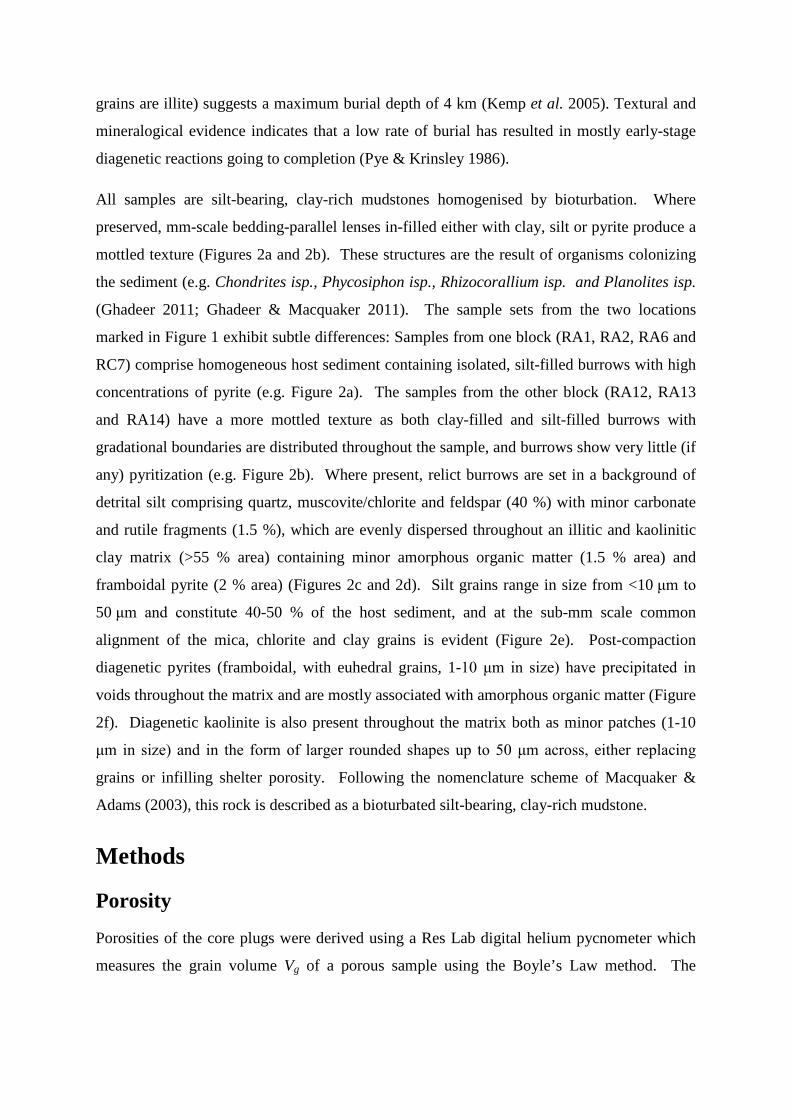
grains are illite) suggests a maximum burial depth of 4 km (Kemp et al. 2005). Textural and
mineralogical evidence indicates that a low rate of burial has resulted in mostly early-stage
diagenetic reactions going to completion (Pye & Krinsley 1986).
All samples are silt-bearing, clay-rich mudstones homogenised by bioturbation. Where
preserved, mm-scale bedding-parallel lenses in-filled either with clay, silt or pyrite produce a
mottled texture (Figures 2a and 2b). These structures are the result of organisms colonizing
the sediment (e.g. Chondrites isp., Phycosiphon isp., Rhizocorallium isp. and Planolites isp.
(Ghadeer 2011; Ghadeer & Macquaker 2011). The sample sets from the two locations
marked in Figure 1 exhibit subtle differences: Samples from one block (RA1, RA2, RA6 and
RC7) comprise homogeneous host sediment containing isolated, silt-filled burrows with high
concentrations of pyrite (e.g. Figure 2a). The samples from the other block (RA12, RA13
and RA14) have a more mottled texture as both clay-filled and silt-filled burrows with
gradational boundaries are distributed throughout the sample, and burrows show very little (if
any) pyritization (e.g. Figure 2b). Where present, relict burrows are set in a background of
detrital silt comprising quartz, muscovite/chlorite and feldspar (40 %) with minor carbonate
and rutile fragments (1.5 %), which are evenly dispersed throughout an illitic and kaolinitic
clay matrix (>55 % area) containing minor amorphous organic matter (1.5 % area) and
framboidal pyrite (2 % area) (Figures 2c and 2d). Silt grains range in size from <10 μm to
50 μm and constitute 40-50 % of the host sediment, and at the sub-mm scale common
alignment of the mica, chlorite and clay grains is evident (Figure 2e). Post-compaction
diagenetic pyrites (framboidal, with euhedral grains, 1-10 μm in size) have precipitated in
voids throughout the matrix and are mostly associated with amorphous organic matter (Figure
2f). Diagenetic kaolinite is also present throughout the matrix both as minor patches (1-10
μm in size) and in the form of larger rounded shapes up to 50 μm across, either replacing
grains or infilling shelter porosity. Following the nomenclature scheme of Macquaker &
Adams (2003), this rock is described as a bioturbated silt-bearing, clay-rich mudstone.
Methods
Porosity
Porosities of the core plugs were derived using a Res Lab digital helium pycnometer which
measures the grain volume Vg of a porous sample using the Boyle’s Law method. The

porosity is then calculated from the bulk volume Vb (from calliper measurements) and grain
volume of the sample.
𝜙𝜙 =𝑉𝑉𝑏𝑏 − 𝑉𝑉𝑔𝑔𝑉𝑉𝑏𝑏
The fine grain size of mudstones means that because their pore networks consist of highly
tortuous pathways with narrow pore throats, during the measurement procedure, adequate
time was always allowed for helium to penetrate the entire pore volume of the sample. A
final pressure reading was only taken once the pressure had stabilised to a constant value.
The measured porosity for each sample is given in Table 1.
Permeability
The permeabilities of seven Whitby Mudstone samples were measured using either the
oscillating-pore pressure method (Kranz et al. 1990; Fischer 1992; Bernabé et al. 2006; Song
& Renner 2007) or the transient pulse-decay method developed initially by Brace et al.
(1968). The oscillating pore pressure method has the advantage of being relatively
insensitive to leakages and temperature fluctuations and for reducing experimental
timescales. However, the pulse-decay method is more suitable when (i) permeability is
extremely low (<10-20 m2) for which impractically long oscillation periods would be required,
(ii) when permeability is being measured at low pore pressures (<10 MPa) and the high
compressibility of the gas can make it difficult to control a pressure oscillation, or (iii) if
there is a capillary entry pressure arising from partial saturation of the pore space with a
liquid in which case the measured permeability would be the relative permeability.
Pore pressure oscillation technique The oscillation method was first utilised for rocks by Kranz et al. (1990) and Fischer (1992),
although it was initially proposed by Turner (1958), and uses a fixed-frequency, sinusoidally-
oscillating pore pressure signal applied at one end of the sample. The resultant (downstream)
signal maintains the same period as the upstream signal, but is amplitude-attenuated and
phase-shifted (Figure 3).
Bernabé et al. (2006) re-analysed the oscillating pore pressure method and defined two
independent dimensionless material parameters; 𝜂𝜂 (dimensionless permeability) and 𝜉𝜉
(dimensionless storativity ratio) which are functions of permeability (𝑘𝑘 m2) and specimen
storativity (𝛽𝛽 Pa-1) respectively and are defined:

𝜂𝜂 =𝑆𝑆𝑆𝑆𝑘𝑘𝜋𝜋𝐿𝐿𝜇𝜇𝛽𝛽𝐷𝐷
(5)
𝜉𝜉 =𝑆𝑆𝐿𝐿𝛽𝛽𝛽𝛽𝐷𝐷
(6)
where 𝑆𝑆 is the sample cross-sectional area (m2), 𝑆𝑆 is the oscillation period (s), 𝐿𝐿 the sample
length (m), 𝛽𝛽 the sample storativity (Pa-1), 𝛽𝛽𝐷𝐷 the downstream reservoir storage (m3 Pa-1), 𝑘𝑘
the sample permeability (m2) and 𝜇𝜇 the fluid viscosity (Pa s). Bernabé et al. (2006) improved
upon the solutions presented by Kranz et al. (1990) and Fischer (1992) by defining 𝜉𝜉 and 𝜂𝜂
such that each would be dependent on only one material parameter of the rock, thus allowing
them to be assessed as independent material properties. In terms of 𝜉𝜉 and 𝜂𝜂 the solution to
the diffusion equation is
𝐴𝐴𝐴𝐴−𝑖𝑖𝑖𝑖 = �1 + 𝑖𝑖�𝜉𝜉𝜂𝜂
sinh �(1 + 𝑖𝑖)�𝜉𝜉𝜂𝜂� + cosh �(1 + 𝑖𝑖)�
𝜉𝜉𝜂𝜂��
−1
(7)
Solving equation 7 to find 𝐴𝐴 and 𝜃𝜃 using a range of valid values of 𝜂𝜂 and 𝜉𝜉 defines the region
in which physically meaningful values of 𝐴𝐴 and 𝜃𝜃 can be found (Figure 4). The region is
limited by the lines 𝜉𝜉 = 0 and 𝜉𝜉 → ∞, therefore any (𝐴𝐴,𝜃𝜃) points that fall outside are, in
principle, not possible (Bernabé et al. 2006). Sample storativity (𝛽𝛽) is directly proportional
to porosity (𝜙𝜙) and is given by
𝛽𝛽 = 𝜙𝜙�𝐶𝐶𝑓𝑓 + 𝐶𝐶𝑝𝑝� (8)
where 𝐶𝐶𝑓𝑓 is the pore fluid compressibility and 𝐶𝐶𝑝𝑝 is the compressibility of the porosity in
response to changes in pore pressure at constant confining pressure. As 𝐶𝐶𝑓𝑓 ≫ 𝐶𝐶𝑝𝑝 the 𝐶𝐶𝑓𝑓𝜙𝜙
term will dominate. Thus iso-𝜉𝜉 paths are nominally lines of constant porosity for a given
value of downstream storage volume provided the compressibility of the pore fluid and the
pores remain constant, there are no adsorption-desorption effects and the sample behaves
isotropically.
Permeability data for sample RA14 are plotted in Figure 4, showing that as permeability
(proportional to 𝜂𝜂) decreases with increasing confining pressure, the data points migrate

downwards along a path of near-constant 𝜉𝜉. Maintaining a constant 𝜉𝜉 track implies no
substantial change in porosity over the range of effective pressures used. The permeability is
found by solving equation 7 iteratively for both 𝜂𝜂 and 𝜉𝜉. This was done using a numerical
equation solver. Initial values of 𝜉𝜉 and 𝜂𝜂 were obtained from a look-up table containing the
values plotted in Figure 4. The algorithm then sought the values of 𝜉𝜉 and 𝜂𝜂 that
simultaneously solve the modulus and argument of equation 7 which are equal to amplitude
ratio 𝐴𝐴 and phase shift 𝜃𝜃 respectively:
𝐴𝐴 = ��1 + 𝑖𝑖�𝜉𝜉𝜂𝜂
sinh �(1 + 𝑖𝑖)�𝜉𝜉𝜂𝜂� + cosh �(1 + 𝑖𝑖)�
𝜉𝜉𝜂𝜂��
−1
� (9)
𝜃𝜃 = arg ��1 + 𝑖𝑖�𝜉𝜉𝜂𝜂
sinh �(1 + 𝑖𝑖)�𝜉𝜉𝜂𝜂� + cosh �(1 + 𝑖𝑖)�
𝜉𝜉𝜂𝜂��
−1
� (10)
The sample storativity calculated using 𝜉𝜉 from the oscillation technique may be lower than
the total storativity of the sample, calculated from porosity (𝜙𝜙) and the known
compressibility of the pore fluid using equation 8 (Fischer 1992). This is because the
storativity measured by the oscillating pore pressure technique will only include the part of
the porosity accessed in the transport of gas. This is demonstrated for sample RA14 where
the storativity (𝛽𝛽) was calculated from equation 8 for sample RA14 using the measured
helium porosity and assuming the compressibility of the pores (𝐶𝐶𝑝𝑝) to be negligible. This
value differs significantly from storativity obtained from the analysis of the pore-pressure
oscillations (Figure 4), implying that the total pore volume measured using the helium
pycnometer is not the same as the volume of pores that contribute to the permeability, i.e. the
fluid being transmitted through the rock sample during an experiment does not necessarily
access the total pore volume.
Pulse-decay technique The transient pulse-decay technique involves imposing an instantaneous pore pressure change
at one end of a sample. The pulse is dissipated by propagation of pore fluid along the sample
length. The differential pressure (Δ𝑃𝑃) between upstream and downstream reservoirs
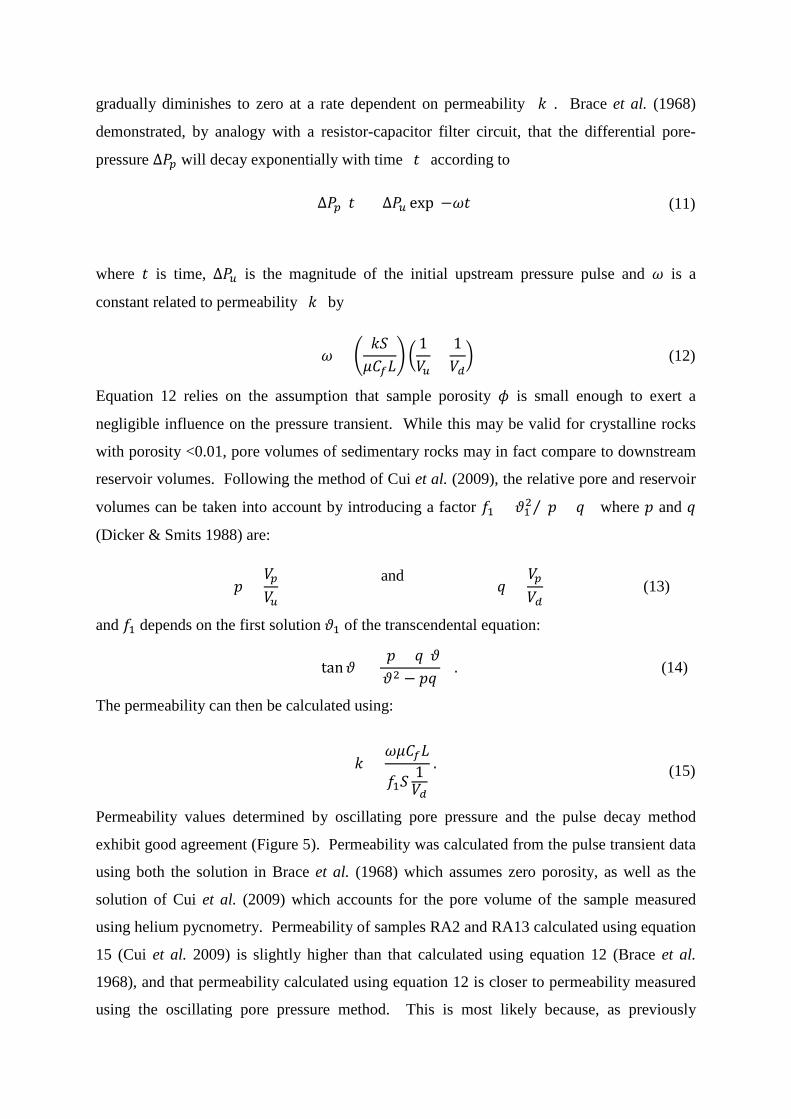
gradually diminishes to zero at a rate dependent on permeability (𝑘𝑘). Brace et al. (1968)
demonstrated, by analogy with a resistor-capacitor filter circuit, that the differential pore-
pressure Δ𝑃𝑃𝑝𝑝 will decay exponentially with time (𝑡𝑡) according to
Δ𝑃𝑃𝑝𝑝(𝑡𝑡) = Δ𝑃𝑃𝑢𝑢 exp(−𝜔𝜔𝑡𝑡) (11)
where 𝑡𝑡 is time, Δ𝑃𝑃𝑢𝑢 is the magnitude of the initial upstream pressure pulse and 𝜔𝜔 is a
constant related to permeability (𝑘𝑘) by
𝜔𝜔 = �𝑘𝑘𝑆𝑆𝜇𝜇𝐶𝐶𝑓𝑓𝐿𝐿
� �1𝑉𝑉𝑢𝑢
+1𝑉𝑉𝑑𝑑� (12)
Equation 12 relies on the assumption that sample porosity 𝜙𝜙 is small enough to exert a
negligible influence on the pressure transient. While this may be valid for crystalline rocks
with porosity <0.01, pore volumes of sedimentary rocks may in fact compare to downstream
reservoir volumes. Following the method of Cui et al. (2009), the relative pore and reservoir
volumes can be taken into account by introducing a factor 𝑓𝑓1 = 𝜗𝜗12 (𝑝𝑝 + 𝑞𝑞⁄ ) where 𝑝𝑝 and 𝑞𝑞
(Dicker & Smits 1988) are:
𝑝𝑝 =𝑉𝑉𝑝𝑝𝑉𝑉𝑢𝑢
and
𝑞𝑞 =𝑉𝑉𝑝𝑝𝑉𝑉𝑑𝑑
(13)
and 𝑓𝑓1 depends on the first solution 𝜗𝜗1 of the transcendental equation:
tan𝜗𝜗 = (𝑝𝑝 + 𝑞𝑞)𝜗𝜗𝜗𝜗2 − 𝑝𝑝𝑞𝑞
. (14)
The permeability can then be calculated using:
Permeability values determined by oscillating pore pressure and the pulse decay method
exhibit good agreement (Figure 5). Permeability was calculated from the pulse transient data
using both the solution in Brace et al. (1968) which assumes zero porosity, as well as the
solution of Cui et al. (2009) which accounts for the pore volume of the sample measured
using helium pycnometry. Permeability of samples RA2 and RA13 calculated using equation
15 (Cui et al. 2009) is slightly higher than that calculated using equation 12 (Brace et al.
1968), and that permeability calculated using equation 12 is closer to permeability measured
using the oscillating pore pressure method. This is most likely because, as previously
𝑘𝑘 =𝜔𝜔𝜇𝜇𝐶𝐶𝑓𝑓𝐿𝐿
𝑓𝑓1𝑆𝑆1𝑉𝑉𝑑𝑑
. (15)

mentioned, the pore volume of the sample contributing to storativity (𝛽𝛽) that is measured
during the oscillating pore pressure method is significantly lower than the pore volume
measured using helium pycnometry. As a result, permeability calculated using equation 15
with helium porosity will overestimate permeability. For comparison, porosity was calculated
from the dimensionless storativity (𝜉𝜉) measured with the pore pressure oscillation technique,
using equation 6. Black crosses in Figure 5 show permeability calculated using equation 15
with porosity set as that calculated from dimensionless storativity (𝜉𝜉).
Experimental setup For all permeability measurements, 25 mm diameter samples were connected at each end to
an upstream and a downstream reservoir with sintered stainless steel porous discs used to
ensure uniform pore fluid pressure distribution at each end of the sample. In case weak-
mineral smearing (carbon or clays, Rutter et al. 2013) had occurred during the end-squaring
process, radial scratches were also made at each end of the sample to ensure pore fluid could
enter the pore space in the rock. Samples were jacketed in heat-shrink tubing and the
assembly was placed into a pressure vessel capable of maintaining pressures up to 400 MPa
(Figure 6). The sample assembly was hydrostatically loaded by pressurizing a synthetic oil
using a compressed-air driven pump, and the confining pressure was measured using a
Honeywell 400 MPa pressure transducer accurate to within 0.5 MPa. Measurements were all
made at a controlled ambient temperature of 21°C and with each pressure change, time was
allowed for adiabatic heating or cooling effects to subside before measurements were taken.
The pore fluid used in all experiments was argon, at pore pressures ranging between 1 MPa
and 70 MPa. Over most of this pore pressure range, the effect of changes in gas adsorption
on the measured permeability is expected to be negligible because firstly, the Whitby
Mudstone samples contain very little organic carbon and second, mineral or organic particle
surfaces that may adsorb gas will be fully saturated at pore pressures greater than ~16 MPa
(Zhang et al. 2012). Viscosity of argon was calculated for a given pore pressure and
temperature using the formulation given in Younglove & Hanley (1986). The
compressibility of argon was calculated for a given temperature and pore pressure from the
compressibility factor z calculated from fits from equation of state data of Gosman et al.
(1969). The behaviour of the gas is almost ideal up to 25 MPa, beyond which the
compressibility progressively decreases. The upstream and downstream pore pressures were
measured using separate HBM 500 MPa pressure transducers with a resolution of 0.01 MPa,
and the upstream pore pressure was controlled using a volumometer driven by a servo-

controlled motor (Figure 6). To achieve the highest data resolution possible, the volumes of
both upstream and downstream reservoirs were kept to a minimum and the plumbing was
insulated to minimise temperature fluctuations. The volumes of the upstream and
downstream reservoirs were determined under the conditions of a typical experiment with a
steel plug in place of the sample. The upstream volume was determined by measuring the
piston displacement needed to impose a small pore pressure change, from which the volume
can be calculated using Boyle’s law. The downstream volume was calculated by measuring
the volume required to keep the pressure constant when opening the downstream volume at
zero pressure to the upstream, giving downstream volumes of 721±13 mm3 and an upstream
volume (excluding the volumometer) of 4249±13 mm3. During pore pressure oscillation
experiments the downstream volume was either enlarged (for high permeability samples) or
reduced (for low permeability samples) to optimise the downstream signal for processing.
The downstream volume used for each test is given in the supplementary data.
Experimental procedure During initial pressurization, pore pressure (𝑃𝑃𝑝𝑝) and confining pressure (𝑃𝑃𝑐𝑐) were always
raised in increments to avoid effective pressure (𝑃𝑃𝑒𝑒𝑓𝑓𝑓𝑓) rising above the desired initial value
(usually 10 MPa). Sample permeability was measured under total confining pressures
ranging between 35-95 MPa, at pore pressures between 0.7 - 80 MPa. After each pressure
step the pore pressure volumometer was monitored until it reached a stable value, implying
that the sample had equilibrated to the change in the pressure conditions.
To perform a pore pressure oscillation experiment, the upstream and downstream reservoirs
were isolated from each other apart from through the sample, and a sinusoidal pore pressure
wave was applied to the upstream end. The downstream pore pressure oscillations settle
gradually to a steady amplitude and phase shift (Figure 3). Cycle periods were ranged from
100 to 10 000 seconds and driving wave amplitudes ranged from 0.5 to 1.5 MPa - always less
than 10 % of the background (average) pore pressure. Once the downstream signal provided
a detectable response (we find that gains between 0.01 and 0.3 give the best results) and
steady state was reached, the experiment was run for a minimum of 10 to 20 cycles. These
cycles were then processed using the FFT algorithm in MATLAB® (Matlab 2013) to extract
the amplitude and phase of the upstream and downstream signals from which amplitude ratio
(𝐴𝐴) and phase-lag (𝜃𝜃) were calculated. Equation 7 was then solved to find dimensionless

parameters 𝜂𝜂 and 𝜉𝜉 from which permeability and storativity were calculated using equations 5
and 6.
To perform a transient pulse-decay experiment, time was initially allowed for pore pressure
to equilibrate across the sample. At time 𝑡𝑡0, upstream pore pressure 𝑃𝑃𝑢𝑢 was increased by a
small amount (<5-10 % pore pressure) in order not to incur much change to the viscosity and
compressibility of the fluid and to the value of the effective pressure. During the experiment
the upstream pore pressure was held at a constant value using the servo-controlled
volumometer, thereby creating an apparently infinite upstream volume (Zoback & Byerlee
1975). Maintaining a constant upstream pressure both eliminates the possibility of a leak or
other sources of pressure variation in the upstream reservoir affecting the results, whilst
eliminating the upstream volume from the permeability calculation. The pore pressures were
recorded until the downstream pore pressure equalled the upstream pore pressure. The
difference between the constant upstream and time-varying downstream pore pressure (𝛥𝛥𝑃𝑃)
versus time was fitted to equation 11 to obtain the gradient 𝜔𝜔, which was then used to
calculate permeability 𝑘𝑘 using equations 12 and 15.
Uncertainty Measurement uncertainties in permeability were determined by propagation of errors
(Bevington & Robinson 1992), using the standard deviation in repeated measurements of
variables. Standard deviations of measured variables include 0.059 mm in length
measurements, 0.009 MPa in pore pressure measurements and 13.52 mm3 in downstream
volume. The fractional error in dimensionless permeability 𝜂𝜂 was calculated using the
technique described by Bernabé et al. (2006) and is generally very low (<0.04), increasing
where amplitude ratios lie below 0.01 or above 0.65. This leads to a fractional error in
permeability of ~0.03 when amplitude ratios are within an optimal range between 0.65 and
0.01.
Uncertainty in permeability determined using the pulse decay technique was also estimated
using propagation of errors. Using the standard deviation of the error in the fit of 𝛥𝛥𝑃𝑃 over
time 𝑡𝑡 to equation 11 (less than 1%) along with standard deviations in measured variables,
permeability can be determined with an error of ±1 to 3 %. Any remaining variabilities are
attributed to rock sample characteristics, such as hysteresis arising from pressure cycling.

Pore compressibility
Pore compressibilities of two samples were determined from measurements of pore volume
changes with confining pressure. To detect pore volume changes, the upstream pore pressure
control system was set to maintain constant pressure. Changes in pore volume due to
externally applied changes in confining pressure were then compensated by movement of the
volumometer piston as gas was expelled from or drawn into the pore spaces. Piston
displacement was measured until gas flow ceased using a linear variable differential
transformer (LVDT) and used to calculate volume displacement to within ±0.7 mm3 accuracy
during confining pressure steps. The response in terms of gas flow to each increment in
effective pressure is slow owing to the low porosity and permeability of the rock and the
small pressure increments induced, therefore the precision of such measurements can be poor
for mudstones. Volume change (Δ𝑉𝑉) due to change in effective pressure (Δ𝑃𝑃) is given by
Δ𝑉𝑉 = 𝐶𝐶p Δ𝑃𝑃 𝑉𝑉p, where 𝐶𝐶p is pore compressibility and 𝑉𝑉p is original pore volume (Walsh
1965b; Zimmerman et al. 1986). Between steps of loading and unloading samples for
permeability measurements, pore volume strain was recorded and plotted against pressure.
Pore compressibility was obtained from the gradient of a fit to the pressure-volumetric strain
data.
Acoustic Wave Velocities
Ultrasonic P-wave velocities were measured as a function of confining pressure on two
Whitby Mudstone samples using the method described by Birch (1960). One specimen was
oriented for wave propagation parallel to layering (RA17) and the other normal to layering
(RC8). Both samples were cut into cylindrical cores 25 mm in diameter and ~35 mm in
length and dried in an oven at 60°C. To improve coupling between sample and transducers,
a minimal amount of ultrasonic gel was applied between the sample and the pistons. The
same samples were then jacketed in heat-shrink tubing for high pressure measurements
without pore pressure at room temperature. Velocity measurements were taken at
atmospheric pressure and after increments of <3 MPa confining pressure during three cycles
of loading and unloading from 0.7 MPa to 103 MPa.
Experimental uncertainty in measured velocities was estimated by error propagation using the
standard deviations of multiple length measurements (0.059 mm) and multiple arrivals of a
transmitted signal at the same pressure conditions (14.17 ns), giving a standard deviation of

±0.25 %. Corrections for both the time-of-flight in the specimen end pieces and the change
in length of both the sample and the parts of the apparatus between the acoustic transducers
with applied confining pressure were made during the velocity calculation.
Results
Permeability
All seven samples were subjected to the same initial pressure cycling routine, whereby
confining pressure was increased and decreased (cycled) over the full confining pressure
range until variation of permeability with effective pressure was reproducible (Figures 7 and
8 and supplementary data file). All samples exhibited the same permeability-effective
pressure behaviour at a constant value of pore pressure, whereby increasing effective pressure
for the first time causes a non-recoverable reduction in permeability of up to two orders of
magnitude, after which the permeability-effective pressure relationship settles to a
reproducible pattern (Figure 7 and 8). The permanence of this observed initial permeability
reduction was tested by completely depressurizing one sample after it had been pressure
cycled. The depressurization did not fully restore permeability to its original value, implying
that permanent physical changes occurred during the initial stage of pressure cycling. All the
permeability data for the seven samples range between 3 ×10-21 m2 and 2 ×10-19 m2 (3 and
188 nd).
Pressure cycling The effect of pressure history on permeability was investigated by cycling sample RA14 over
three different pressure ranges (Figure 8). A large and permanent loss of permeability was
observed with each increase in the maximum effective pressure applied, suggesting that the
extent of permanent permeability loss is dependent on pressure history. The constant
gradients of the log permeability versus effective pressure for each increment of applied
maximum effective pressure suggest the elastic sensitivity of permeability to effective
pressure is independent of maximum applied pressure (Figure 8). For each pressure range,
the sensitivity of permeability to changes in effective pressure brought about by changing
pore pressure at constant confining pressure was approximately the same as when the same
effective pressure change was brought about by changing the confining pressure at constant
pore pressure (Figure 8 and supplementary data file). All samples also exhibit an incremental

loss of permeability of <1 % with each subsequent pressure cycle. This effect is most
prominent in samples RA6 (plotted in Figure 7) and RA1.
Permeability anisotropy Permeability of Whitby Mudstone normal to layering was measured and is substantially
lower than permeability parallel to layering (Figure 7). Samples oriented parallel to layering
showed a much greater permanent loss of permeability with the initial pressure cycle,
decreasing by up to 2.5 orders of magnitude compared to a decrease of one order of
magnitude for the sample oriented normal to layering. Permeability anisotropy is commonly
defined as the ratio of permeability parallel to layering, to permeability perpendicular to
layering. For the Whitby Mudstone this corresponds to a permeability anisotropy factor of
~60.
Dependence of permeability on effective pressure The sensitivity of permeability to Terzaghi effective confining pressure was measured on all
seven samples at a constant pore pressure of 25 MPa. The data define the permeability-
effective pressure relationship, fitted here to an exponential law of the form
𝑘𝑘 = 𝑘𝑘0 exp(𝛾𝛾 𝑃𝑃eff) (16)
where 𝑘𝑘0 is the permeability at zero effective pressure (𝑃𝑃eff) and 𝛾𝛾 is a coefficient. All seven
samples show values of 𝛾𝛾 ≈ −0.03 MPa-1, with the exception of sample RA12 which showed
a considerably lower sensitivity of permeability to effective pressure (𝛾𝛾 ≈ −0.009 MPa-1 see
Table 2). Whilst a simple description of the permeability-effective pressure relationship,
either an exponential function (equation 16) or a power-law of the form
𝑘𝑘 = 𝑘𝑘0 �1 −𝑃𝑃eff𝐹𝐹�𝑛𝑛
(17)
(where n and F are constants), is desirable for application to geological fluid flow models, an
exponential function is more commonly used to fit experimental data (Kwon et al. 2001;
Bustin et al. 2008; Cui et al. 2009; Heller et al. 2014). This is despite most theoretical
relationships between permeability and effective pressure being power-laws (e.g. Shi &
Durucan 2016). Shi & Durucan (2016) show that the difference between exponential
functions such as equation 16 and power-laws such as equation 17 is very small over the
range of effective pressures used in experimental studies, and they provide a set of
transformation equations from exponential fit parameters to parameters for the models of
Gangi (1978). Although permeability at zero effective pressure cannot be measured reliably

in the laboratory, it can be achieved in the subsurface (e.g. in the orientation of the minimum
horizontal stress, 𝜎𝜎Hmin ) when pore fluid pressure approaches 𝜎𝜎Hmin. Despite the fact that,
for example, sample RA6 (Figure 7) would be better described by a power-law fit, the quality
of the fits to both exponential and power-law functions for the dataset overall shows little
difference.
The sensitivity of permeability to pore pressure at constant confining pressure was measured
on three samples (Figure 8). During the second and third cycles, pore pressure changes were
repeated, showing that the sensitivity of permeability to pore pressure is reproducible. Using
multiple linear regression analysis of the change in the natural logarithm of permeability with
both confining pressure and pore pressure to find the effective pressure coefficient 𝜒𝜒 and the
overall pressure coefficient 𝛾𝛾, the data for each pressure range were fitted to a modified
effective pressure law (Figure 9) of the form
𝑘𝑘 = 𝑘𝑘0 exp�𝛾𝛾�𝑃𝑃𝑐𝑐 − 𝜒𝜒𝑃𝑃𝑝𝑝��. (18)
When permeability is more sensitive to changes in pore pressure than changes in confining
pressure 𝜒𝜒 > 1, and conversely when it is less sensitive to pore pressure than confining
pressure 𝜒𝜒 < 1. Values of 𝜒𝜒 obtained in this study are all less than 1 (Table 2).
The Klinkenberg effect Permeability was measured over a range of confining pressures between 35 and 95 MPa, and
pore pressures between 0.5 and 60 MPa. Data with pore pressures (>25 MPa) were then fitted
to equation 18. All the data were then normalised by the results of this fit and are shown in
Figure 10, revealing a notable deviation away from the fit for pore pressures <10 MPa.
Permeability becomes enhanced at low pore pressures and this is attributed to the
Klinkenberg effect. Figure 10 illustrates the magnitude of deviations from the high pore
pressure permeability trend, described by a Klinkenberg parameter 𝐾𝐾𝑏𝑏 (equation 4) of ~2
MPa. The curve 𝑘𝑘 = 𝑘𝑘0�1 + �𝐾𝐾𝑏𝑏 𝑃𝑃𝑝𝑝⁄ �� is plotted in Figure 10, which clearly shows that gas
slippage effects are restricted to pore pressures lower than 10 MPa and therefore do not affect
the results of the present experiments that were carried out at higher gas pressures. To
describe fully the dependence of permeability on effective pressure, an additional term was
therefore applied to equation 18 to account for slip at low pore pressures:
𝑘𝑘 = 𝑘𝑘0 exp(𝛾𝛾[𝑃𝑃𝑐𝑐 − 𝜒𝜒𝑃𝑃𝑝𝑝]) �1 + 𝐾𝐾𝑏𝑏𝑃𝑃𝑝𝑝�. (19)

Acoustic wave velocities
Ultrasonic P-wave velocities parallel and perpendicular to layering were measured at
different confining pressures, during three separate pressure cycles up to 100 MPa (Figure
11a). During initial pressurization there is a rapid, nonlinear rise in velocity up to confining
pressure of 20 MPa, followed by a slower, nearly linear rise across the remainder of the
pressure range. The low pressure nonlinearity is most pronounced for wave propagation
normal to layering. With unloading, 𝑉𝑉𝑝𝑝 perpendicular to layering follows a similar pattern to
the loading curve, but displays velocity hysteresis, with velocity decreasing more slowly with
pressure in successive cycles. In the second pressure cycle, with wave propagation direction
normal to layering, the up-pressure curve exhibited a 4.5 % increase in velocity. However,
the unloading curve remained unchanged. This behaviour was also observed by Burke &
Fountain (1990) in samples of marble.
In the third loading cycle on the shale, velocity decreased slightly compared to the second
cycle but remained higher than that of the first cycle, suggesting a permanent increase in
velocity had taken place during the first loading cycle. There is a clear anisotropy between
measurements parallel and perpendicular to layering, consistent with the rock being
transversely isotropic with the symmetry axis perpendicular to the layering as is seen in many
shales and other foliated rocks (Sayers 2005). The compressional wave velocity parallel to
the layering is 29 % faster than perpendicular to the layering at 100 MPa confining pressure.
The velocity that is asymptotically approached at high pressure is given in Table 3 and the
associated components of the Voigt stiffness matrix have been calculated from these
velocities. These are compared to elastic moduli calculated using a Voigt-Reuss-Hill (VRH)
average of the all the concentrations of all minerals in the rock and assuming no
crystallographic preferred orientation, shown in Table 4. Also shown in Table 4 are the
elastic properties of a rock with a solid component with the same elastic properties as those
calculated from the VRH average with 6 % porosity, with both spherical pores and oblate
ellipsoids with different aspect ratios using a self-consistent approach proposed by Berryman
(1995) as set out in Mavko et al. (2009).
Crack porosity and aspect-ratio distribution Changes in elastic moduli with pressure (calculated from ultrasonic data) can be used to infer
the crack porosity 𝜙𝜙𝑐𝑐 and aspect ratio distribution 𝜓𝜓(𝛼𝛼) of the network of cracks in the rock
that close progressively over the applied pressure range. According to Walsh (1965a), large

initial changes in elastic moduli with pressure are mostly due to progressive closure of
microcracks - a process which increases rock stiffness much more than the effect on rock
density. These changes in elastic moduli with pressure result in a non-linearity in the stress-
strain curve for a particular loading geometry which can be modelled by assuming two or
three-dimensional elliptical voids distributed throughout an infinite, solid rock (Jaeger et al.
2009). The hydrostatic pressure required to close an elliptical crack depends upon the elastic
properties of the solid matrix and the initial aspect ratio of the crack, 𝛼𝛼0. For a three-
dimensional penny-shaped crack in an isotropic medium, the closing pressure 𝑃𝑃close is related
to initial aspect ratio 𝛼𝛼0, the Poisson's ratio (𝜈𝜈m) and the Young’s modulus (𝐸𝐸m) of the solid
matrix by
𝑃𝑃close =𝐸𝐸m𝜋𝜋𝛼𝛼0
4(1 − 𝜈𝜈m2 )
(20)
(Jaeger et al. 2009). Closure pressure increases with increasing aspect ratio, hence longer,
thinner cracks (low aspect ratio) close more easily than equant pores. For a solid matrix m of
given Young’s modulus (𝐸𝐸𝑚𝑚), the distribution of crack aspect ratios will determine the rate
of crack closure with pressure, therefore it is expressed in the derivative of the stress-strain
curve. Before the distribution of crack aspect ratios 𝜓𝜓(𝛼𝛼) can be extracted, the proportion of
the rock volume occupied by the crack network must be determined. This is known as the
crack density Γ, a dimensionless parameter defined as Γ = 𝑛𝑛𝑐𝑐3 𝑉𝑉𝑏𝑏⁄ where 𝑛𝑛 is the number of
oblate cracks with semimajor axis 𝑐𝑐 and 𝑉𝑉𝑏𝑏 is the total bulk volume of the sample (Jaeger et
al. 2009).
Assuming that the porosity consists of thin, oblate ellipsoids lying parallel to bedding in an
otherwise isotropic matrix, the material becomes transversely isotropic with respect to elastic
properties. This is apart from any contribution to elastic anisotropy that might arise from
preferred mineral orientations or mineral layering. This crack density can be calculated from
only the compressional wave velocity parallel and perpendicular to the layering using the
model of Cheng (1993), without having to determine the set of all five independent elastic
constants required to characterize fully a transversely isotropic material (see Appendix).
Figure 11 shows the measured velocities and those predicted from the model of Cheng (1993)
for the crack densities given in Figure 11b. The model predicts well the change in the
velocity perpendicular to the layering, but underestimates the rate of change in velocity
parallel to the layering. This difference is most likely due to the fact that perfect alignment of
the flat pores with the bedding plane was inferred from the contrasting pressure sensitivity of
velocity in the two orientations, however there is likely to be some small angular spread of
the pore orientations which would result in the observed slightly enhanced effect on the
velocity parallel to layering. Also, for simplicity (and lacking the appropriate data), we have
assumed the rock matrix to be isotropic, so that all the anisotropy measured is due to the
oriented pores. The values chosen for the isotropic matrix bulk and shear moduli were
selected from the values shown in Table 3, calculated for different aspect ratio pores using
the self-consistent approach. The values that agree with our measured velocities are for pores
of aspect ratio 0.07. This aspect-ratio should be approximately equal to the aspect ratio of the
majority of the porosity in the rock.
The crack density parameter Γ refers to the density of cracks that are open at any given
pressure, and is plotted as a function of confining pressure in Figure 11b. During all of the
three separate loading cycles there is a steep decrease in crack density at confining pressures
less than 20 MPa, followed by much slower decline between 20 MPa and 90 MPa, suggesting
that much of the crack closure takes place within the first 20 MPa of loading. The initially
lower aspect ratio (thinner) cracks would be expected to close at lower pressures, hence it is
inferred that there must be a distribution of crack aspect ratios present. The predicted
magnitude of crack density at any given pressure is dependent on the model used (Jaeger et
al. 2009) and the approach described below provides only a first order estimate.
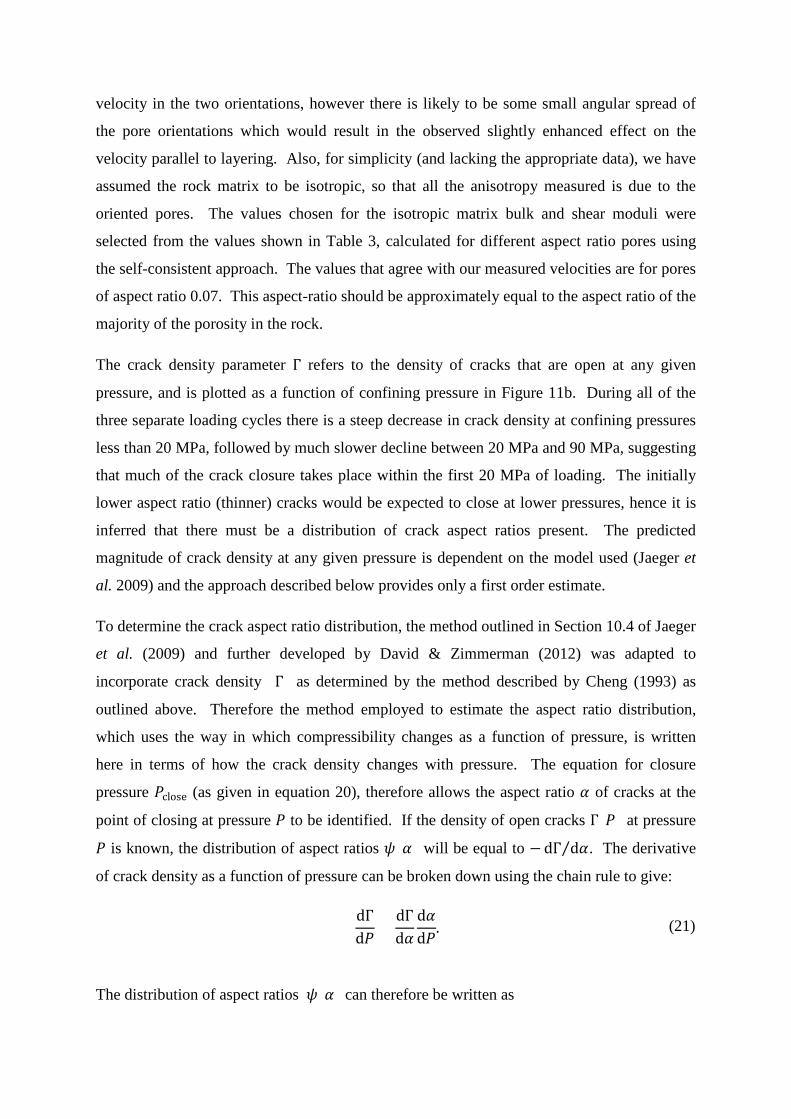
To determine the crack aspect ratio distribution, the method outlined in Section 10.4 of Jaeger
et al. (2009) and further developed by David & Zimmerman (2012) was adapted to
incorporate crack density (Γ) as determined by the method described by Cheng (1993) as
outlined above. Therefore the method employed to estimate the aspect ratio distribution,
which uses the way in which compressibility changes as a function of pressure, is written
here in terms of how the crack density changes with pressure. The equation for closure
pressure 𝑃𝑃close (as given in equation 20), therefore allows the aspect ratio 𝛼𝛼 of cracks at the
point of closing at pressure 𝑃𝑃 to be identified. If the density of open cracks Γ(𝑃𝑃) at pressure
𝑃𝑃 is known, the distribution of aspect ratios 𝜓𝜓(𝛼𝛼) will be equal to −dΓ d𝛼𝛼⁄ . The derivative
of crack density as a function of pressure can be broken down using the chain rule to give:
dΓd𝑃𝑃
=dΓd𝛼𝛼
d𝛼𝛼d𝑃𝑃
. (21)
The distribution of aspect ratios 𝜓𝜓(𝛼𝛼) can therefore be written as

𝜓𝜓(𝛼𝛼) = −dΓd𝛼𝛼
=− dΓ
d𝑃𝑃d𝛼𝛼d𝑃𝑃
(22)
d𝛼𝛼 d𝑃𝑃⁄ from equation 20 then gives
d𝛼𝛼d𝑃𝑃
=4(1 − 𝜐𝜐𝑚𝑚2 )𝐸𝐸𝑚𝑚𝜋𝜋
(23)
so that
𝜓𝜓(𝛼𝛼) =−𝐸𝐸𝑚𝑚𝜋𝜋
4(1 − 𝜐𝜐𝑚𝑚2 )dΓd𝑃𝑃
. (24)
To avoid large fluctuations in the computed aspect ratio distribution, exponential curves of
the form
were fitted to the crack density-pressure data and are shown in Figure 11b for three loading
cycles on sample RC8. Γ0 is the initial (zero pressure) crack density, and 𝑃𝑃� is a characteristic
crack-closing pressure related to aspect ratio 𝛼𝛼� by equation 20 The first derivative of the
crack density with respect to the pressure can now be written
dΓd𝑃𝑃
=−Γ0𝑃𝑃�
exp �−𝑃𝑃𝑃𝑃�� . (26)
Substituting equation 20 into 26 so that
dΓd𝑃𝑃
=−4(1 − 𝜐𝜐𝑚𝑚2 )Γ0
𝐸𝐸𝑚𝑚𝜋𝜋𝛼𝛼� exp �
−𝛼𝛼𝛼𝛼�� (27)
gives the distribution of aspect ratios 𝜓𝜓(𝛼𝛼) as
𝜓𝜓(𝛼𝛼) = 𝐸𝐸𝑚𝑚𝜋𝜋
4(1 − 𝜐𝜐𝑚𝑚2 )4(1 − 𝜐𝜐𝑚𝑚2 )Γ0
𝐸𝐸𝑚𝑚𝜋𝜋𝛼𝛼� exp �
−𝛼𝛼𝛼𝛼��
which simplifies to
Γ = Γ0 exp�−𝑃𝑃 𝑃𝑃�⁄ � (25)

𝜓𝜓(𝛼𝛼) =Γ0𝛼𝛼�
exp �−𝛼𝛼𝛼𝛼�� . (28)
Crack density is related to crack porosity 𝜙𝜙𝑐𝑐 by
𝜙𝜙𝑐𝑐 =4𝜋𝜋𝛼𝛼
3Γ . (29)
By assuming all the cracks in the rock are of the same radius, the distribution of crack
porosity 𝑧𝑧(𝛼𝛼) is given by:
𝑧𝑧(𝛼𝛼) =4𝜋𝜋𝛼𝛼
3𝜓𝜓(𝛼𝛼) = 4𝜋𝜋Γ0
𝛼𝛼𝛼𝛼�
exp �−𝛼𝛼𝛼𝛼�� (30)
The total crack porosity 𝜙𝜙𝑐𝑐 can then be found by integrating the above function:
𝜙𝜙𝑐𝑐 = � 4𝜋𝜋Γ0
𝛼𝛼𝛼𝛼�
exp �−𝛼𝛼𝛼𝛼��d𝛼𝛼
1
0
𝜙𝜙𝑐𝑐 = 4𝜋𝜋Γ0𝛼𝛼� − 4𝜋𝜋Γ0exp �−1𝛼𝛼�� (1 − 𝛼𝛼�)
(31)
Figure 11c shows the aspect ratio distributions calculated from the change in crack density
across different pressure ranges and for the three loading cycles on sample RC8. The modal
aspect ratios and crack porosities are provided in Table 5. The aspect ratio distributions are
similar to log-normal distributions with peaks on the order of 10-2, and crack porosity is
~0.01 if the data between 10 and 100 MPa are used. It should be noted that although the
absolute magnitude of the crack porosity is dependent upon the model used to calculate the
effect of cracks on the elastic properties, the differences between the models do not result in
orders of magnitude differences in crack porosity (Jaeger et al. 2009). These derived aspect
ratio distributions will be used in the pore conductivity model below.

Pore conductivity model
The measured pressure-dependent permeability of Whitby Mudstone was analysed further by
considering flow conduits of elliptical cross-section. In the model, the pressure-dependent
permeability is determined by three parameters: (i) the porosity of the conductive pore
network, (ii) the aspect ratios of the conductive pores, and (iii) the width of the conductive
pores.
First, following the approach of Seeburger & Nur (1984), the axial volume flow rate (𝑄𝑄)
along a long cylindrical pore channel with elliptical cross section of aspect ratio 𝛼𝛼 = 𝑏𝑏 𝑐𝑐⁄ ,
where 𝑏𝑏 is the half width and 𝑐𝑐 is the half length of the ellipse, is calculated as
𝑄𝑄 = Δ𝑃𝑃Δ𝑥𝑥
𝜋𝜋4𝜇𝜇
𝑏𝑏3𝑐𝑐3
𝑏𝑏2 + 𝑐𝑐2 (32)
(Lamb 1945). Applied pressure (𝑃𝑃eff) causes an elastic change in pore width (𝑏𝑏), thus flow
rate varies as a function of applied pressure as
𝑄𝑄(𝑃𝑃eff) = Δ𝑃𝑃Δ𝑥𝑥
𝜋𝜋4𝜇𝜇
𝑏𝑏03𝑐𝑐03
𝑏𝑏02 + 𝑐𝑐02�1 −
2𝑃𝑃eff 𝑐𝑐0(1 − 𝜐𝜐2)𝑏𝑏0𝐸𝐸
�3
(33)
where 𝑏𝑏0 and 𝑐𝑐0 are the lengths of the half-axes of the ellipse at the reference pressure.
Summing N such channels present in cross sectional area At the total fluid flux (𝐽𝐽) is given by
𝐽𝐽(𝑃𝑃eff) = 𝛥𝛥𝑃𝑃𝛥𝛥𝑥𝑥
1𝐴𝐴t
𝜋𝜋4𝜇𝜇
�𝑏𝑏𝑖𝑖3𝑐𝑐𝑖𝑖3
𝑏𝑏𝑖𝑖2 + 𝑐𝑐𝑖𝑖2�1 −
2𝑃𝑃eff 𝑐𝑐𝑖𝑖(1− 𝜐𝜐2)𝑏𝑏𝑖𝑖𝐸𝐸
�3𝑁𝑁
𝑖𝑖=1
(34)
which, when compared to Darcy's law (equation 1), yields the pressure-dependent
permeability 𝑘𝑘 of the conductive pore network:
𝑘𝑘(𝑃𝑃eff) = 𝜋𝜋
4𝐴𝐴t�
𝑏𝑏𝑖𝑖3𝑐𝑐𝑖𝑖3
𝑏𝑏𝑖𝑖2 + 𝑐𝑐𝑖𝑖2�1 −
2𝑃𝑃eff𝑐𝑐𝑖𝑖(1 − 𝜐𝜐2)𝑏𝑏𝑖𝑖𝐸𝐸
�3𝑁𝑁
𝑖𝑖=1
(35)
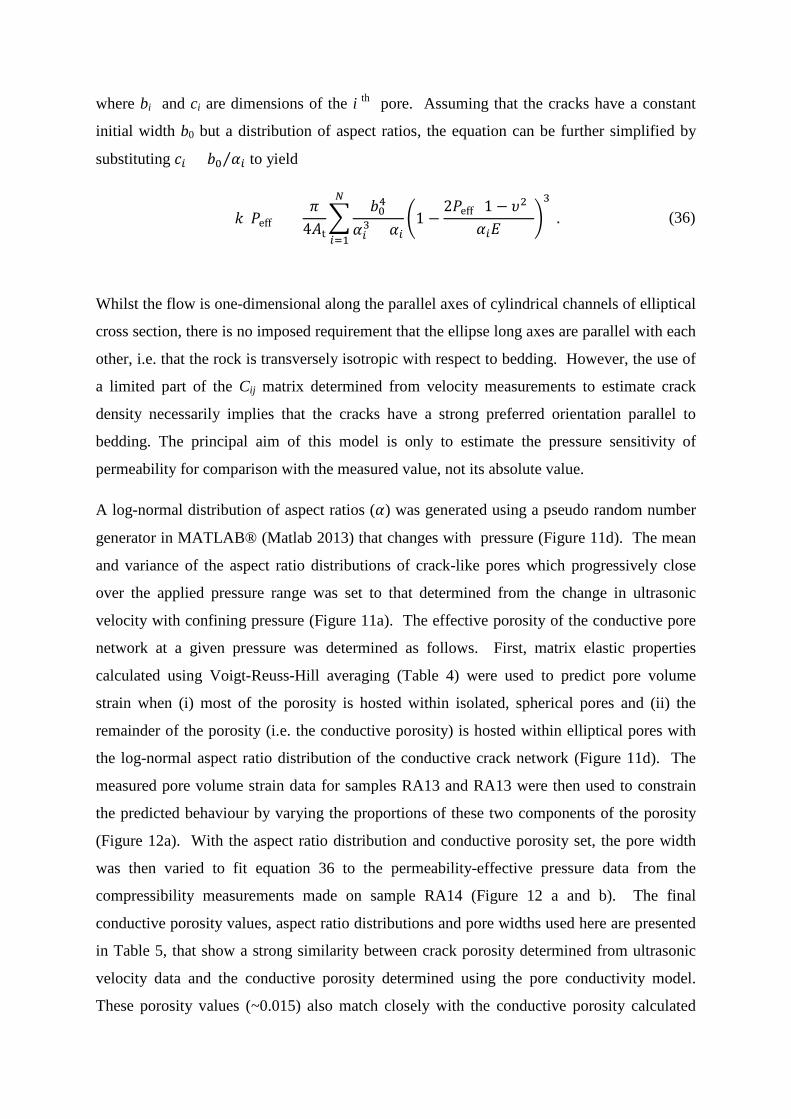
where bi and ci are dimensions of the i th pore. Assuming that the cracks have a constant
initial width b0 but a distribution of aspect ratios, the equation can be further simplified by
substituting 𝑐𝑐𝑖𝑖 = 𝑏𝑏0 𝛼𝛼𝑖𝑖⁄ to yield
𝑘𝑘(𝑃𝑃eff) = 𝜋𝜋
4𝐴𝐴t�
𝑏𝑏04
𝛼𝛼𝑖𝑖3 + 𝛼𝛼𝑖𝑖�1 −
2𝑃𝑃eff (1− 𝜐𝜐2)𝛼𝛼𝑖𝑖𝐸𝐸
�3
.𝑁𝑁
𝑖𝑖=1
(36)
Whilst the flow is one-dimensional along the parallel axes of cylindrical channels of elliptical
cross section, there is no imposed requirement that the ellipse long axes are parallel with each
other, i.e. that the rock is transversely isotropic with respect to bedding. However, the use of
a limited part of the Cij matrix determined from velocity measurements to estimate crack
density necessarily implies that the cracks have a strong preferred orientation parallel to
bedding. The principal aim of this model is only to estimate the pressure sensitivity of
permeability for comparison with the measured value, not its absolute value.
A log-normal distribution of aspect ratios (𝛼𝛼) was generated using a pseudo random number
generator in MATLAB® (Matlab 2013) that changes with pressure (Figure 11d). The mean
and variance of the aspect ratio distributions of crack-like pores which progressively close
over the applied pressure range was set to that determined from the change in ultrasonic
velocity with confining pressure (Figure 11a). The effective porosity of the conductive pore
network at a given pressure was determined as follows. First, matrix elastic properties
calculated using Voigt-Reuss-Hill averaging (Table 4) were used to predict pore volume
strain when (i) most of the porosity is hosted within isolated, spherical pores and (ii) the
remainder of the porosity (i.e. the conductive porosity) is hosted within elliptical pores with
the log-normal aspect ratio distribution of the conductive crack network (Figure 11d). The
measured pore volume strain data for samples RA13 and RA13 were then used to constrain
the predicted behaviour by varying the proportions of these two components of the porosity
(Figure 12a). With the aspect ratio distribution and conductive porosity set, the pore width
was then varied to fit equation 36 to the permeability-effective pressure data from the
compressibility measurements made on sample RA14 (Figure 12 a and b). The final
conductive porosity values, aspect ratio distributions and pore widths used here are presented
in Table 5, that show a strong similarity between crack porosity determined from ultrasonic
velocity data and the conductive porosity determined using the pore conductivity model.
These porosity values (~0.015) also match closely with the conductive porosity calculated

from storativity (𝛽𝛽) measured on sample RA14 using the oscillating pore pressure technique
(~0.02). The estimated conductive porosity is significantly less than the total porosity
determined by helium pycnometry, thus empirically observed correlations between total
porosity and permeability in mudstones are not generally likely to be meaningful, except
insofar as conductive porosity may display some proportionality to total porosity.
The permeability model explored above is based on the narrowing and progressive closure of
elliptical cross-section cylindrical conduits with applied pressure. The model does not take
into consideration the fact that in a natural sample, if a crack becomes closed not only will
that channel be removed from the flow network, but also any channels that it was connected
to may also no longer be able to transmit fluid. This reduced connectivity will increase the
tortuosity of the pathways to fluid flow, thus decreasing permeability further.
Discussion
Permeability
The results of permeability measurements on seven Whitby Mudstone samples are
summarised in Table 2 and are within the range previously reported for other mudstones
(Morrow et al. 1984; Katsube et al. 1991; Coyner et al. 1993; Schlömer & Krooss 1997;
Dewhurst et al. 1998; Kwon et al. 2001; Hildenbrand et al. 2004; Kwon et al. 2004; Yang &
Aplin 2007; Metwally & Sondergeld 2011; Chalmers et al. 2012; Clarkson et al. 2012a;
Ghanizadeh et al. 2014a; Ghanizadeh et al. 2014b; Heller et al. 2014; Morrow et al. 2014).
All the samples tested showed the same permeability-effective pressure behaviour whereby
initial pressurization causes an irreversible loss of permeability, after which a reproducible,
non-linear pattern of permeability reduction with increasing effective pressure was observed.
The dependence of permeability on effective pressure is simply but reasonably well described
by an exponential relationship (equation 19) which incorporates the sensitivity of
permeability to both confining pressure and pore pressure and accounts for the gas slippage
effects detected at low pore pressures (<10 MPa).
Microstructural controls on permeability The permeability of the Whitby Mudstone samples ranges between 3×10-21 m2 and
2×10-19 m2 (3 and 188 nD). Of the six samples oriented for flow parallel to layering, three
have a permeability at a given pressure one order of magnitude higher than the others. This
difference positively correlates with differences in silt content of the samples. The

differences in permeability could also be explained by variations in bioturbation intensity
observed at the mm-scale: The three higher permeability samples (RA1, RA2 and RA6)
exhibit a more homogeneous host sediment containing isolated silt-filled burrows bearing
high concentrations of pyrite (Figure 2a). Where packages of coarser grained sediment occur
within a low permeability substrate, they have been shown to increase permeability
(Pemberton & Gingras 2005). The texture of the lower permeability samples (RA12, RA13
and RA14) is more mottled as both clay-filled and silt-filled burrows with gradational
boundaries are distributed throughout the sample, and burrows show very little (if any)
pyritization. These characteristics suggest that those samples have been subject to a higher
degree of bioturbation, which can degrade the sorting characteristics of sediment hence
leading to reduced permeability. There is some indication that the permeability variations
correlate weakly with total porosity, although in the six samples measured the total porosity
only varied between 7.2 and 8.7 %, whilst the permeability varied tenfold. If all the values of
k0 from the empirical fits given in Table 2 are fitted to a power-law where 𝑘𝑘 = 𝐶𝐶𝜙𝜙𝑛𝑛 a value
of 𝑛𝑛~15 is obtained.
The permeability of Whitby Mudstone parallel to layering is ~60 times higher than the
permeability normal to layering. Permeability anisotropy has been previously reported in
clay and mica-bearing rocks such as mudstones and fault rocks (Dewhurst et al. 1996;
Faulkner & Rutter 1998; Yang & Aplin 1998; Clennell et al. 1999; Kwon et al. 2004; Yang
& Aplin 2007) and is most likely due to the transversely isotropic mineralogic layering, grain
shape and crystallographic preferred orientation fabric created during deposition, burial and
diagenesis, or by mechanical shearing. Initial layering of silt rich and clay rich layers is
produced during deposition and modified by bioturbation. This primary anisotropy is
intensified with compaction, whereby detrital phyllosilicates mechanically rotate or
recrystallize normal to the axial load (Clennell et al. 1999; Aplin et al. 2006; Day-Stirrat et
al. 2008), deformable polygranular lithoclasts become flattened and initial pore spaces are
flattened or removed. As well as reducing porosity and permeability, this change in particle
orientation decreases flow path tortuosity parallel to the particle alignment direction and
increases flow path tortuosity normal to the particle alignment (Arch & Maltman 1990). The
degree of anisotropy that results from this process in mudstones is strongly dependent on the
ratio of quartz to clay content (Day-Stirrat et al. 2010). The non-platy habit of quartz grains
means they do not develop a strong shape preferred orientation, but instead act as a
supportive framework (where contiguous), sheltering areas of the clay matrix from effective

pressure. Levels of anisotropy greater than 4 cannot be explained only by compaction
induced fabrics, they must additionally be influenced by material heterogeneities (layering or
banding) related to deposition (Yang & Aplin 2007) and diagenesis leading to the formation
of layering-parallel crack-like pores. In the Whitby Mudstone, both elongate mineral grains,
granular clusters and microcracks show preferential alignment (Figure 2e) although the
original depositional fabric has been mostly destroyed by bioturbation, leaving little evidence
of primary lithological layering. Relict burrows, however, are oriented parallel to the
bedding plane, hence where they are connected they may form a high-permeability network
parallel to bedding.
Comparison with pore images Permeability has been shown, both by the occurrence of gas slippage at pore pressures
<10 MPa and by the pore conductivity modelling (equation 36), to be controlled by bedding-
parallel flat pores of nanometer-scale widths as inferred from seismic velocity measurements.
Pores at the nm-scale were not imaged as part of this investigation, but some pore types in
mudstones are universally found (Kwon et al. 2004; Schieber et al. 2010; Loucks et al. 2012)
and can therefore be inferred from these other studies to exist also in Whitby Mudstone. The
nanometre- to micrometre-scale matrix porosity in mudstones can be divided into three types:
Interparticle pores, intraparticle pores and organic matter pores (intraparticle pores within
organic matter) (Loucks et al. 2012). Kwon et al. (2004) suggested that low aspect ratio,
crack-like pores associated with clay grain boundaries act as fluid conduits at low effective
pressures, but at high effective pressures they are closed and permeability is controlled by
less compliant, higher aspect ratio pores associated with terminations between mineral grain
vertices. The latter are best developed in pressure shadows next to larger, more compaction-
resistant grains such as quartz, feldspar and pyrite, and they are well documented in a variety
of mudstones by Schieber et al. (2010). Figure 2e shows an example of this textural feature
in the Whitby Mudstone. It is likely these pores act as storage pores, only enhancing
permeability where they form part of a connected network. Schieber et al. (2010) showed
that phyllosilicate framework pores are the most ubiquitous type in all samples, and within
mudstones with low TOC (total organic carbon) a large proportion are open and likely to be
connected. Using a combination of X-ray computed tomography and serial block face
scanning electron microscopy, Ma et al. (2016) produced 3D images of pore networks
comprising intra-organic pores, organic interface pores, intraparticle pores and inter-mineral
pores at resolutions between 7.7 μm and 7 nm. Pores were found to have a bimodal size

distribution with peaks at 0.2 μm and 0.04 μm, and at scales >20 nm pores show no apparent
connectivity. Permeability was therefore attributed to fluid transport through the connected
matrix of organic matter and clay minerals via pores which are below the imaging scale. The
present study, however, implies that a substantial part of the conduction-controlling porosity
may lie at length scales near or even below the limit of what has been previously resolved in
imaging studies.
The pore network within the Whitby Mudstone inferred from measurements of velocity, pore
volume strain and permeability could be explained by the characteristic pores types described
by Kwon et al. (2001), Schieber (2011), Loucks et al. (2012) and Ma et al. (2016), and is
illustrated schematically in Figure 13. The stiffer, blind-ending storage pores constitute most
of the porosity and are most likely associated with terminations between clay and silt grains,
pressure shadows around silt grains and relict burrows with coarse-grained infills. The
inferred bedding-parallel, crack-like, fluid conducting pores constitute ~ 1 4⁄ of the total
porosity, are connected in the plane of bedding, and tend to be associated with weakly
bonded grain boundaries.
Sensitivity of permeability to confining pressure The observed irreversible reduction of permeability upon initial pressurization is attributed to
inelastic closure of secondary microcracks that may have formed during depressurization,
and/or sample preparation. This characteristic of permeability behaviour was reported by
several authors for clay bearing rocks (Katsube & Coyner 1994; Dewhurst et al. 1998;
Faulkner & Rutter 1998; Kwon et al. 2004), demonstrating that pressure cycling recovers
depressurization (expansion) damage and returns the permeability-effective pressure
behaviour to its state at the depth corresponding to the maximum pressure applied.
Measurements at different effective pressure ranges (Figure 8) demonstrate that the extent of
recovery is dependent upon the maximum pressure applied to the sample. This implies that
the permeability of argillaceous units within sedimentary basins may depend on burial history
(including pore pressure evolution) as well as current loading conditions (Kwon et al. 2004),
i.e. they can become under-, over- or normally-consolidated. For example, erosion and
unloading of mudstones will decrease effective pressure, but permeability may not rebound to
earlier, higher values, leaving the rock in an overconsolidated state.
After pressure cycling, the sensitivity of permeability to externally applied confining pressure
is described by 𝛾𝛾 in equation 19, which ranges between -0.02 and -0.04 MPa-1 for all the
samples tested here with the exception of RA12 which has a 𝛾𝛾 value of 0.009 MPa-1. The
value of 𝛾𝛾 reflects the elastic response of the interconnected pore network to hydrostatic
pressure change. Depending on their elastic properties, flow channels can narrow or become
pinched closed with increasing pressure and the rate at which this occurs controls the rate of
permeability loss. A high rate of permeability loss (high 𝛾𝛾) can be attributed to the narrowing
or removal of the more compressible pores from the fluid conducting network. Although 𝛾𝛾
has not been found to differ greatly between the Whitby Mudstone samples, it can be
expected to vary with mineralogy of different rock types (particularly clay content (Chalmers
et al. 2012; Ghanizadeh et al. 2014a; Ghanizadeh et al. 2014b; Ghanizadeh et al. 2015) and
microstructure.
Sensitivity of permeability to pore pressure For all samples of Whitby Mudstone tested, permeability showed a higher sensitivity to
confining pressure than to equivalent changes in pore pressure, yielding values of 𝜒𝜒 < 1
(0.42 to 0.97, Table 2) and is consistent with theoretical values of 𝜒𝜒 for poroelasticity (Biot
1941) and to other measurements on shale (Heller et al. 2014). Kwon et al. (2001) showed
that for a model of a clay-rich mudstone where clays form a connected, load-supporting
matrix, pore dimensions will be similarly affected by confining pressure and pore pressure,
thus 𝜒𝜒 is expected to be close to unity. In 2D microscope images Whitby Mudstone samples
appear to be clay-matrix supported (Figure 2c), with isolated silt grains, which could explain
values of 𝜒𝜒 close to 1. The variability in 𝜒𝜒 measured here may reflect differences in the
connectivity of silt grains that lie out of the plane of a thin-section.
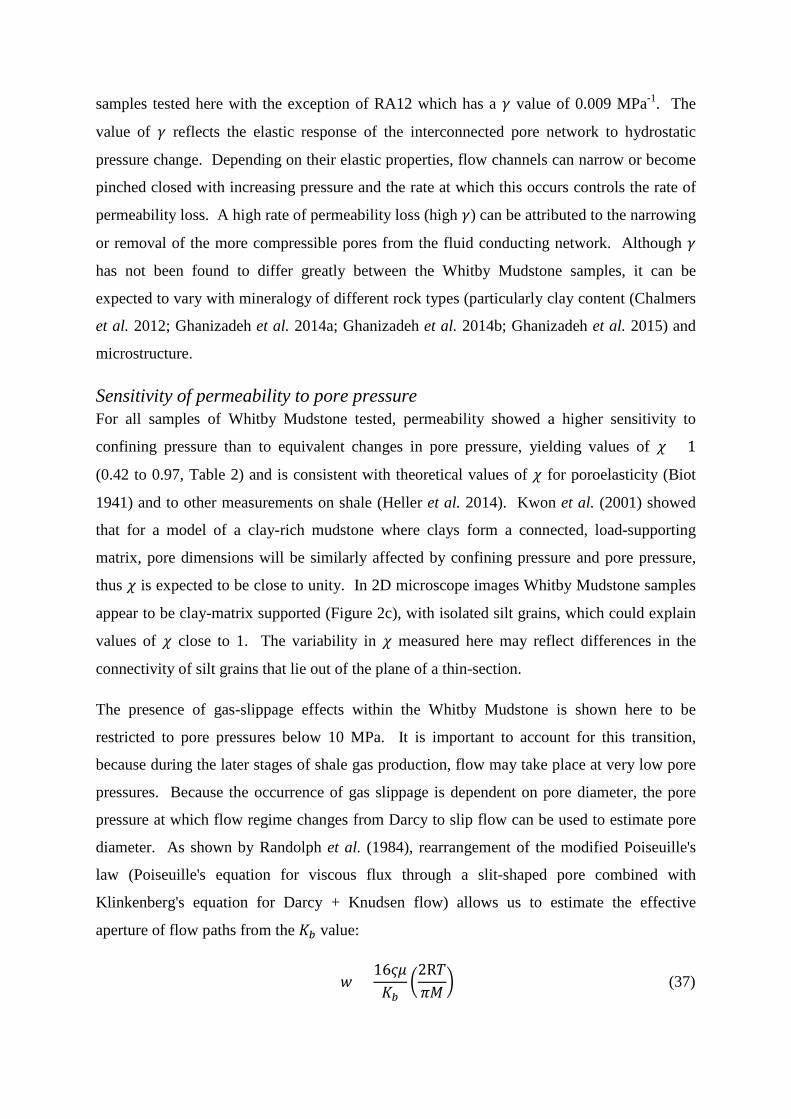
The presence of gas-slippage effects within the Whitby Mudstone is shown here to be
restricted to pore pressures below 10 MPa. It is important to account for this transition,
because during the later stages of shale gas production, flow may take place at very low pore
pressures. Because the occurrence of gas slippage is dependent on pore diameter, the pore
pressure at which flow regime changes from Darcy to slip flow can be used to estimate pore
diameter. As shown by Randolph et al. (1984), rearrangement of the modified Poiseuille's
law (Poiseuille's equation for viscous flux through a slit-shaped pore combined with
Klinkenberg's equation for Darcy + Knudsen flow) allows us to estimate the effective
aperture of flow paths from the 𝐾𝐾𝑏𝑏 value:
𝑤𝑤 =16𝜍𝜍𝜇𝜇𝐾𝐾𝑏𝑏
�2R𝑆𝑆𝜋𝜋𝜋𝜋
� (37)

where 𝑤𝑤 is slit width (m), 𝜍𝜍 is an empirical constant (approximately unity), 𝜇𝜇 is gas viscosity
(Pa s), R is the gas constant, 𝑆𝑆 is temperature (K), 𝜋𝜋 is molar mass (kg) and 𝐾𝐾𝑏𝑏 is the
Klinkenberg parameter (Pa). For sample RA2 of Whitby Mudstone, this gives an average slit
width of 41 nm, which is 10 times higher than that estimated by fitting the pore conductivity
model to the permeability data for sample RA14 (Table 5).
Acoustic wave velocity
Sensitivity of ultrasonic velocity to effective pressure was measured on core plugs of Whitby
Mudstone with their cylinder axes oriented normal and parallel to layering. The data show an
increase of ultrasonic velocity with confining pressure as well as hysteretic loading/
unloading behaviour. A permanent increase in velocity after the first pressure cycle was also
observed for the normal to layering orientation, which is inferred to correspond to the
permanent decrease in permeability that occurs during the initial pressure cycle.
Velocity hysteresis Seismic velocity hysteresis has previously been attributed to several processes, including
irreversible partial or full closure of microcracks (Birch 1960), irreversible compaction of
pore spaces especially in rocks with a highly compressible clay matrix (Jones & Wang 1981)
and smoothing of ductile asperities on crack surfaces, thereby increasing contact surface area
(Ji et al. 2007). From the observed hysteretic velocity behaviour, it can be said firstly that
crack surfaces pushed into contact during loading do not re-open at the same rate during
unloading, possibly due to friction between crack surfaces. Secondly, some of the crack
surfaces that were pushed into contact during the initial loading cycle remain permanently
closed. This could be due to molecular adhesion plasticity of crack surfaces, wearing of
asperities causing an increase in surface area and thus friction, and/or grain rearrangement.
Pore network
The nature of the pore network controlling pressure-dependent permeability was analysed
further by modelling based on the pressure-dependent conductivity of elliptical cross section
cylindrical pore channels. The parameters used in the model, namely conductive porosity,
aspect ratio distribution and pore width distribution, were estimated from pore volume-strain
data, ultrasonic velocity data and permeability-effective pressure data respectively. These
values are presented in Table 5. Using the aspect ratio distribution of the crack network
determined from ultrasonic velocity data, the porosity of this crack network was also
extracted using equation 36 and matches closely with the conductive porosity obtained from
the pore conductivity model (~0.015, Table 5). Furthermore, the storativity (𝛽𝛽) measured
with the pore pressure oscillation technique was used to calculate the conductive porosity,
giving a value for sample RA14 of 0.023. These results all suggest that the conductive
porosity in the Whitby Mudstone is only a small fraction of the total porosity of 0.08.
The sensitivity of permeability to effective pressure is a result of changes forced upon the
geometry and connectivity of the conductive pore network. It has been shown that by
modelling these pores as a distribution of parallel, narrow channels of elliptical cross-section
that progressively close with applied stress, changes in measured elastic moduli of the rock
with pressure can be used to describe their geometry using a distribution of aspect ratios
which is similar to a log-normal distribution. The rate at which permeability decreases with
hydrostatic pressure is dependent on the mean and variance of this distribution, because lower
aspect ratio pores close more easily with applied pressure, thereby reducing the width and
connectivity of the conductive pore network. Measurements of total pore volume strain
indicate that the greater fraction of the porosity, which does not contribute to fluid transport,
is hosted within pores which are much less sensitive to pressure and are therefore interpreted
as having much higher aspect ratios, close to 1 (i.e. spherical pores). The modal value of the
pore width distribution obtained from fitting equation 36 to permeability data is very low
(~0.6 nm) compared with the pore width obtained from the Klinkenberg parameter, which is
around 41 nm. This difference is most likely due to the fact that the simple, straight pore
geometry assumed for this conductivity model is not unique. It does not account for
tortuosity of the fluid pathways and variations in channel geometry along the flow paths, but
instead compensates for observed low permeability by predicting narrower fluid pathways.
Based on these observations it is proposed that most of the pore volume is hosted within high
aspect ratio ‘storage’ pores which would show very little pressure sensitivity of permeability
and do not contribute to, or control fluid transport. There is no simple relationship expected
between permeability and total porosity. Permeability is controlled by a linked network of
crack-like flow channels with low aspect ratios. These connective cracks progressively close
elastically under pressure, increasing flow path tortuosity and reducing permeability of
Whitby Mudstone by up to one order of magnitude over the pressure range explored. By
high effective pressures (>60 MPa), flow becomes restricted to be within a network of poorly

connected, higher aspect ratio, stiffer pores, hence the progressively-decreasing sensitivity of
permeability to pressure and increasing values of elastic stiffness.
Application to reservoir models When building a well-test interpretation model, it is common to assume that permeability
remains constant with changes in effective pressure, because laboratory-determined
coefficients to describe pressure-dependent permeability, measured as demonstrated herein,
are usually not available. While this assumption may be reasonable for conventional
reservoirs where pore throat diameters are large and relatively insensitive to changes in
pressure, for unconventional reservoirs where pore throat diameters are sub-micron in size,
changes in effective pressure can have much greater implications for fluid transport. As
reservoir production takes place, gas pressure drawdown increases the in-situ effective
pressure and a decrease in permeability ensues. If the rock is more sensitive to pore pressure
than to confining pressure changes, as may be the case for some mudstones, then
permeability will decrease even more with pore pressure drawdown than predicted by a
simple Terzaghi effective pressure law (𝑃𝑃𝑒𝑒𝑓𝑓𝑓𝑓 = 𝑃𝑃𝑐𝑐 − 𝑃𝑃𝑝𝑝) (Terzaghi 1923). To demonstrate
this effect, (Mckernan et al. 2014) used a reservoir simulation model (GASSIM, Lee &
Wattenbarger 1996) to compare production rate estimates from a reservoir with pressure-
insensitive permeability with those from a reservoir with pressure sensitivity of permeability
defined by equation 16. The results show that at low bottom-hole pressures, when pressure
sensitivity of permeability is taken into account, the production rate decreases more rapidly
and during the later stages of production it is almost half that predicted using pressure-
independent permeability. Mckernan et al. (2014) only used Terzaghi effective pressure but
the inclusion of the effective pressure coefficient 𝜒𝜒 will not have a major effect unless it
departs substantially from unity. Assumption of pressure-independent permeability also
severely reduces the estimate of original gas in place. If unconventional reservoir models
used to interpret well-tests do not take into account pressure-sensitivity then erroneous
inferences will be made of permeability, gas in place and expected productivity.
Conclusions Measured permeability of dried Whitby Mudstone ranges between 7 ×10-21 m2 to 2 ×10-19 m2
(7 nd to 188 nd) and is within the range of previously measured values for clay-rich rocks.
Initial pressurization causes an irreversible loss of permeability of up to 1.5 orders of
magnitude, after which a reproducible, non-linear pattern of permeability reduction with
increasing effective pressure is observed. This demonstrates the absolute need for pressure
cycling to be applied to recover the sample to its state at depth before representative in-situ
permeability can be usefully measured. Pressure cycling to different maximum effective
pressures showed that the extent of recovery is dependent upon amount of pressure applied to
the sample, implying that the permeability of mudstones depends on burial history as well as
current loading conditions. Whitby Mudstone showed a higher sensitivity of permeability to
confining pressure than to pore pressure, yielding permeability effective pressure coefficients
𝜒𝜒 < 1 (0.42 to 0.97). Gas slippage effects are shown to be restricted to pore pressures
below 10 MPa hence do not affect the permeability measurements over the greater part of the
pore and confining pressure ranges studied.
After pressure cycling, the dependence of Whitby Mudstone permeability on effective
pressure is satisfactorily described for engineering purposes by an exponential relationship
which incorporates the sensitivity of permeability to both confining pressure and pore
pressure and accounts for the gas slippage effects detected at pore pressures <10 MPa. If
analysis of well test results does not take into account the sensitivity of permeability to both
confining pressure and pore pressure, then substantial overestimations of projected gas flow
rate and original gas in place could made.
The magnitude of permeability is affected by the degree of bioturbation. Where burrows
form coarse grained packages in a fine grained matrix, permeability will be enhanced; when
bioturbation homogenises the sediment, destroying layering and pre-existing burrows,
permeability will be decreased. Permeability and its pressure sensitivity is also expected to be
influenced by partial saturation with liquids, although this aspect of behaviour was not
investigated in the present study.
Permeability anisotropy is marked in the Whitby Mudstone (𝑘𝑘𝑝𝑝𝑎𝑎𝑝𝑝𝑎𝑎𝑝𝑝𝑝𝑝𝑒𝑒𝑝𝑝 = 60 × 𝑘𝑘𝑛𝑛𝑛𝑛𝑝𝑝𝑚𝑚𝑎𝑎𝑝𝑝) and
is attributed to both the bedding-parallel preferred orientation of elongate mineral clusters and
cracks along grain boundaries, as well as the presence of high permeability laminae and relict
(flattened) burrows which increase permeability along the layering.
Based on changes in crack density, permeability and bulk volume with effective pressure, it is
inferred that in the Whitby Mudstone most of the pore volume is hosted within high aspect
ratio storage pores that control bulk compressibility but have little effect on permeability. At
low effective pressures, permeability is controlled by a network of long, thin crack-like pores
with aspect ratios 10 to 100 times smaller. These connective cracks progressively close with

pressure, reducing permeability of Whitby Mudstone by up to one order of magnitude over
the range of reservoir pressures. At higher effective pressures, fluid is progressively
restricted to flowing through the less well connected network of higher aspect ratio, stiffer
pores. As the shape of these pores is less sensitive to pressure, so too becomes the
permeability. Assuming that in mudstones permeability is enhanced by a network of crack-
like pores that progressively close under pressure, measured changes in elastic moduli with
pressure can potentially be used as a tool for predicting the sensitivity of permeability to
effective pressure.
Acknowledgements
This work was supported by a UK NERC CASE research studentship to RM, with Shell as
CASE partners, and by UK NERC grant NE/M001458/1. Ronny Hofman and Calum
Macaulay from Shell are thanked for supporting this project. We thank experimental officer
Stephen May for equipment maintenance and specimen fabrication. Dr Kate Brodie is
thanked for help collecting and processing the SEM data. Joerg Renner and Alexandra
Amann-Hildenbrand are thanked for their detailed reviews that led to considerable
improvement to the quality of this paper. We would also like to thank editor Rick Law for
his patience in dealing with this manuscript.
Nomenclature 𝐽𝐽𝑖𝑖𝑖𝑖 , 𝐽𝐽 Fluid flux (ms-1).
𝑘𝑘𝑖𝑖𝑖𝑖, 𝑘𝑘 Permeability (m2).
𝜇𝜇 Fluid viscosity (Pa s).
∇𝑃𝑃 Pressure gradient (Pa m-1).
𝑃𝑃1 Upstream pore pressure (Pa).
𝑃𝑃2 Downstream pore pressure (Pa).
𝐿𝐿 Sample length (m).
𝑘𝑘𝑎𝑎 Apparent permeability (m2).
𝑘𝑘∞ True permeability (m2).
𝑚𝑚 Dimensionless constant in the gas slippage equation.
𝜆𝜆 Mean free path of a gas (m).
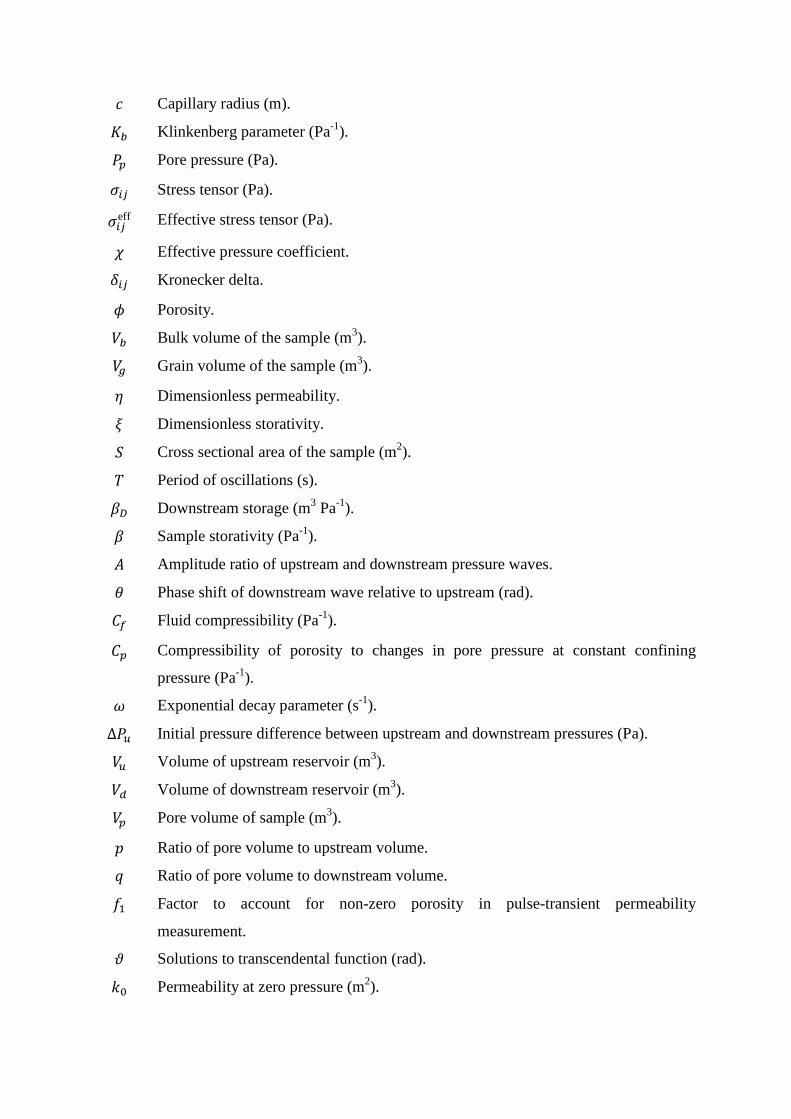
𝑐𝑐 Capillary radius (m).
𝐾𝐾𝑏𝑏 Klinkenberg parameter (Pa-1).
𝑃𝑃𝑝𝑝 Pore pressure (Pa).
𝜎𝜎𝑖𝑖𝑖𝑖 Stress tensor (Pa).
𝜎𝜎𝑖𝑖𝑖𝑖eff Effective stress tensor (Pa).
𝜒𝜒 Effective pressure coefficient.
𝛿𝛿𝑖𝑖𝑖𝑖 Kronecker delta.
𝜙𝜙 Porosity.
𝑉𝑉𝑏𝑏 Bulk volume of the sample (m3).
𝑉𝑉𝑔𝑔 Grain volume of the sample (m3).
𝜂𝜂 Dimensionless permeability.
𝜉𝜉 Dimensionless storativity.
𝑆𝑆 Cross sectional area of the sample (m2).
𝑆𝑆 Period of oscillations (s).
𝛽𝛽𝐷𝐷 Downstream storage (m3 Pa-1).
𝛽𝛽 Sample storativity (Pa-1).
𝐴𝐴 Amplitude ratio of upstream and downstream pressure waves.
𝜃𝜃 Phase shift of downstream wave relative to upstream (rad).
𝐶𝐶𝑓𝑓 Fluid compressibility (Pa-1).
𝐶𝐶𝑝𝑝 Compressibility of porosity to changes in pore pressure at constant confining
pressure (Pa-1).
𝜔𝜔 Exponential decay parameter (s-1).
Δ𝑃𝑃𝑢𝑢 Initial pressure difference between upstream and downstream pressures (Pa).
𝑉𝑉𝑢𝑢 Volume of upstream reservoir (m3).
𝑉𝑉𝑑𝑑 Volume of downstream reservoir (m3).
𝑉𝑉𝑝𝑝 Pore volume of sample (m3).
𝑝𝑝 Ratio of pore volume to upstream volume.
𝑞𝑞 Ratio of pore volume to downstream volume.
𝑓𝑓1 Factor to account for non-zero porosity in pulse-transient permeability
measurement.
𝜗𝜗 Solutions to transcendental function (rad).
𝑘𝑘0 Permeability at zero pressure (m2).

𝛾𝛾 Empirical coefficient that describes pressure dependence of permeability (Pa-1).
𝑃𝑃eff Effective pressure (Pa).
𝑛𝑛 Effective pressure exponent.
𝐹𝐹 Empirical constant for power-law (Pa).
𝑃𝑃close Pressure required to close an elliptical pore (Pa).
𝐸𝐸𝑚𝑚 ,𝐸𝐸 Young’s modulus (Pa).
𝛼𝛼0 Aspect ratio of pore (short / long).
𝑣𝑣𝑚𝑚 , 𝑣𝑣 Poisson’s ratio.
Γ Crack density.
𝜓𝜓 Probability distribution function of aspect ratios.
Γ0 Crack density at zero pressure.
𝛼𝛼� Characteristic pore aspect ratio.
𝑃𝑃� Characteristic crack closure pressure (Pa).
𝜙𝜙𝑐𝑐 Crack porosity.
𝑧𝑧 Probability distribution function of crack porosity.
𝑄𝑄 Volumetric flow rate (m3 s-1).
𝑥𝑥 Flow path length (m).
𝑐𝑐0 , 𝑐𝑐𝑖𝑖 Long axis of elliptical shaped pores. Subscripts indicate zero pressure and ith pore
channel respectively.
𝑏𝑏0 , 𝑏𝑏𝑖𝑖 Short axis of elliptical shaped pores. Subscripts indicate zero pressure and ith pore
channel respectively.
𝐴𝐴𝑡𝑡 Total cross sectional area.
𝑖𝑖 The index of the ith pore channel.
𝑁𝑁 Total number of pore channels.
𝑤𝑤 Pore channel width calculated from Klinkenberg parameter (m).
𝜍𝜍 Empirical constant.
R Gas constant (J mol-1 K-1).
𝑆𝑆 Absolute temperature (K).
𝜋𝜋 Molar Mass (kg).
𝐶𝐶𝑖𝑖𝑖𝑖0 Voigt elastic stiffness matrix of uncracked rock (Pa).
𝐶𝐶𝑖𝑖𝑖𝑖∗ Voigt elastic stiffness matrix of cracked rock (Pa).
𝐶𝐶𝑖𝑖𝑖𝑖1 ,𝐶𝐶𝑖𝑖𝑖𝑖2 First and second order terms in expansion crack density dependent elasticity.

𝑎𝑎𝑖𝑖𝑖𝑖, 𝑏𝑏𝑖𝑖𝑖𝑖 Terms in Cheng (1993) equations.
𝑈𝑈1,2,3 Terms in Cheng (1993) equations.
𝜋𝜋 Term in Cheng (1993) equations.
𝜅𝜅 Term in Cheng (1993) equations.
𝜆𝜆 Lamé elastic constant (Pa).
𝜇𝜇, 𝜇𝜇′ Shear modulus of matrix and weak phase respectively (Pa).
𝐾𝐾,𝐾𝐾′ Bulk modulus of matrix and weak phase respectively (Pa).
𝑉𝑉𝑝𝑝 Compressional wave velocity (ms-1).
𝑉𝑉𝑠𝑠 Shear wave velocity (ms-1).

References Al-Wardy, W. & Zimmerman, R.W. 2004. Effective stress law for the permeability of clay-
rich sandstones. Journal of Geophysical Research: Solid Earth, 109, B04203, doi: 10.1029/2003JB002836.
Aplin, A.C., Matenaar, I.F., McCarty, D.K. & van Der Pluijm, B.A. 2006. Influence of mechanical compaction and clay mineral diagenesis on the microfabric and pore-scale properties of deep-water Gulf of Mexico mudstones. Clays and Clay Minerals, 54, 500-514.
Arch, J. & Maltman, A. 1990. Anisotropic permeability and tortuosity in deformed wet sediments. Journal of Geophysical Research: Solid Earth, 95, 9035-9045.
Bernabe, Y. 1987. The effective pressure law for permeability during pore pressure and confining pressure cycling of several crystalline rocks. Journal of Geophysical Research: Solid Earth, 92, 649-657, doi: 10.1029/JB092iB01p00649.
Bernabé, Y. 1986. The effective pressure law for permeability in Chelmsford granite and Barre granite. International Journal of Rock Mechanics and Mining Sciences & Geomechanics Abstracts, 23, 267-275.
Bernabé, Y. 1988. Comparison of the effective pressure law for permeability and resistivity formation factor in Chelmsford granite. Pure and Applied Geophysics, 127, 607-625.
Bernabé, Y., Mok, U. & Evans, B. 2006. A note on the oscillating flow method for measuring rock permeability. International Journal of Rock Mechanics and Mining Sciences, 43, 311-316.
Berryman, J.G. 1992. Effective stress for transport properties of inhomogeneous porous rock. Journal of Geophysical Research: Solid Earth, 97, 17409-17424, doi: 10.1029/92JB01593.
Berryman, J.G. 1995. Mixture theories for rock properties. In: Ahrens, T.J. (ed.) Rock physics and phase relations: a handbook of physical constants. American Geophysical Union, Washington, DC, 205-228.
Bevington, P.R. & Robinson, D.K. 1992. Data reduction and error analysis for the physical sciences. McGraw-Hill, New York.
Biot, M.A. 1941. General theory of three-dimensional consolidation. Journal of applied physics, 12, 155-164.
Birch, F. 1960. The velocity of compressional waves in rocks to 10 kilobars: 1. Journal of Geophysical Research, 65, 1083-1102.
Blatt, H. 1992. Sedimentary petrology. 2nd ed. Freeman, New York. Brace, W.F., Walsh, J.B. & Frangos, W.T. 1968. Permeability of granite under high pressure.
Journal of Geophysical Research, 73, 2225-2236. Burke, M.M. & Fountain, D.M. 1990. Seismic properties of rocks from an exposure of
extended continental crust: New laboratory measurements from the Ivrea Zone. Tectonophysics, 182, 119-146.
Bush, D.C., Jenkins, R.E. & others. 1970. Proper hydration of clays for rock property determinations. Journal of Petroleum Technology, 22, 800-804.
Bustin, R.M., Bustin, A.M.M., Cui, A., Ross, D., Pathi, V.M. & others. 2008. Impact of shale properties on pore structure and storage characteristics. SPE shale gas production conference.
Chalmers, G.R.L., Ross, D.J.K. & Bustin, R.M. 2012. Geological controls on matrix permeability of Devonian Gas Shales in the Horn River and Liard basins, northeastern British Columbia, Canada. International Journal of Coal Geology, 103, 120-131.
Cheng, C.H. 1993. Crack models for a transversely isotropic medium. Journal of Geophysical Research: Solid Earth, 98, 675-684, doi: 10.1029/92JB02118.

Clarkson, C.R., Jensen, J.L., Pedersen, P.K. & Freeman, M. 2012a. Innovative methods for flow-unit and pore-structure analyses in a tight siltstone and shale gas reservoir. AAPG Bulletin, 96, 355-374.
Clarkson, C.R., Nobakht, M., Kaviani, D. & Ertekin, T. 2012b. Production Analysis of Tight-Gas and Shale-Gas Reservoirs Using the Dynamic-Slippage Concept. doi: 10.2118/144317-PA.
Clennell, M.B., Dewhurst, D.N., Brown, K.M. & Westbrook, G.K. 1999. Permeability anisotropy of consolidated clays. Geological Society, London, Special Publications, 158, 79-96.
Coyner, K., Katsube, T.J., Best, M.E. & Williamson, M. 1993. Gas and water permeability of tight shales from the venture gas field, offshore Nova Scotia. Papers - Geological Survey of Canada, 129-129.
Coyner, K.B. 1984. Effects of stress, pore pressure, and pore fluids on bulk strain, velocity, and permeability in rocks. PhD, Massachusetts Institute of Technology.
Cui, X., Bustin, A.M.M. & Bustin, R.M. 2009. Measurements of gas permeability and diffusivity of tight reservoir rocks: different approaches and their applications. Geofluids, 9, 208-223.
David, E.C. & Zimmerman, R.W. 2012. Pore structure model for elastic wave velocities in fluid-saturated sandstones. Journal of Geophysical Research: Solid Earth, 117, B07210, doi: 10.1029/2012JB009195.
Day-Stirrat, R.J., Aplin, A.C., rodo, J. & Van der Pluijm, B.A. 2008. Diagenetic reorientation of phyllosilicate minerals in Paleogene mudstones of the Podhale Basin, southern Poland. Clays and Clay Minerals, 56, 100-111.
Day-Stirrat, R.J., Dutton, S.P., Milliken, K.L., Loucks, R.G., Aplin, A.C., Hillier, S. & Van Der Pluijm, B.A. 2010. Fabric anisotropy induced by primary depositional variations in the silt: clay ratio in two fine-grained slope fan complexes: Texas Gulf Coast and northern North Sea. Sedimentary Geology, 226, 42-53.
Dewhurst, D.N., Aplin, A.C., Sarda, J.-P. & Yang, Y. 1998. Compaction-driven evolution of porosity and permeability in natural mudstones: An experimental study. Journal of Geophysical Research: Solid Earth, 103, 651-661.
Dewhurst, D.N., Brown, K.M., Clennell, M.B. & Westbrook, G.K. 1996. A comparison of the fabric and permeability anisotropy of consolidated and sheared silty clay. Engineering Geology, 42, 253-267.
Dicker, A.I. & Smits, R.M. 1988. A Practical Approach for Determining Permeability From Laboratory Pressure-Pulse Decay Measurements. Society of Petroleum Engineers, 285-292.
Faulkner, D.R. & Rutter, E.H. 1998. The gas permeability of clay-bearing fault gouge at 20° C. Geological Society, London, Special Publications, 147, 147-156.
Faulkner, D.R. & Rutter, E.H. 2000. Comparisons of water and argon permeability in natural clay-bearing fault gouge under high pressure at 20° C. Journal of Geophysical Research: Solid Earth, 105, 16415-16426.
Fischer, G.J. 1992. The determination of permeability and storage capacity: Pore pressure oscillation method. In: Evans, B. & Wong, T.f. (eds.) Fault mechanics and transport properties of rocks. New York: Academic Press, 187-212.
Gangi, A.F. 1978. Variation of whole and fractured porous rock permeability with confining pressure. International Journal of Rock Mechanics and Mining Sciences & Geomechanics Abstracts, 15, 249-257, doi: http://dx.doi.org/10.1016/0148-9062(78)90957-9.
Ghadeer, S. 2011. An investigation of the sediment dispersal operating to control lithofacies variability and organic carbon preservation in an ancient mud-dominated succession:

a case study of the Lower Jurassic mudstone dominated succession exposed in the Cleveland Basin (North Yorkshire). PhD, University of Manchester.
Ghadeer, S.G. & Macquaker, J.H.S. 2011. Sediment transport processes in an ancient mud-dominated succession: a comparison of processes operating in marine offshore settings and anoxic basinal environments. Journal of the Geological Society, 168, 1121-1132.
Ghanizadeh, A., Amann-Hildenbrand, A., Gasparik, M., Gensterblum, Y., Krooss, B.M. & Littke, R. 2014a. Experimental study of fluid transport processes in the matrix system of the European organic-rich shales: II. Posidonia Shale (Lower Toarcian, northern Germany). International Journal of Coal Geology, 123, 20-33.
Ghanizadeh, A., Bhowmik, S., Haeri-Ardakani, O., Sanei, H. & Clarkson, C.R. 2015. A comparison of shale permeability coefficients derived using multiple non-steady-state measurement techniques: Examples from the Duvernay Formation, Alberta (Canada). Fuel, 140, 371-387.
Ghanizadeh, A., Gasparik, M., Amann-Hildenbrand, A., Gensterblum, Y. & Krooss, B.M. 2014b. Experimental study of fluid transport processes in the matrix system of the European organic-rich shales: I. Scandinavian Alum Shale. Marine and Petroleum Geology, 51, 79-99.
Gosman, A., McCarty, R.D. & Hust, J.G. 1969. Thermodynamic properties of argon from the triple point to 300 K at pressures to 1000 atmospheres. National Standard Reference Data Series, National Bureau of Standards Report 27, U.S. Department of Commerce, Washington DC.
Heller, R., Vermylen, J. & Zoback, M. 2014. Experimental investigation of matrix permeability of gas shales. AAPG Bulletin, 98, 975-995.
Hildenbrand, A., Schlömer, S., Krooss, B.M. & Littke, R. 2004. Gas breakthrough experiments on pelitic rocks: comparative study with N2, CO2 and CH4. Geofluids, 4, 61-80, doi: 10.1111/j.1468-8123.2004.00073.x.
Hudson, J.A. 1980. Overall properties of a cracked solid. Mathematical Proceedings of the Cambridge Philosophical Society, 88, 371-384, doi: 10.1017/S0305004100057674.
Hudson, J.A. 1981. Wave speeds and attenuation of elastic waves in material containing cracks. Geophysical Journal of the Royal Astronomical Society, 64, 133-150, doi: 10.1111/j.1365-246X.1981.tb02662.x.
Jaeger, J.C., Cook, G.W. & Zimmerman, R. 2009. Fundamentals of rock mechanics. Blackwell, Oxford.
Ji, S., Wang, Q., Marcotte, D., Salisbury, M.H. & Xu, Z. 2007. P wave velocities, anisotropy and hysteresis in ultrahigh-pressure metamorphic rocks as a function of confining pressure. Journal of Geophysical Research: Solid Earth, 112, B09204, doi: 10.1029/2006JB004867.
Jones, L.E.A. & Wang, H.F. 1981. Ultrasonic velocities in Cretaceous shales from the Williston basin. Geophysics, 46, 288-297.
Katsube, T.J. & Coyner, K. 1994. Determination of permeability-compaction relationship from interpretation of permeability-stress data for shales from eastern and northern Canada. Geological Survey of Canada: Current Research, 1994-D, 169-178.
Katsube, T.J., Mudford, B.S. & Best, M.E. 1991. Petrophysical characteristics of shales from the Scotian shelf. Geophysics, 56, 1681-1689.
Kemp, S.J., Merriman, R.J. & Bouch, J.E. 2005. Clay mineral reaction progress--the maturity and burial history of the Lias Group of England and Wales. Clay minerals, 40, 43-61.
Klinkenberg, L.J. 1941. The Permeability Of Porous Media To Liquids And Gases. Drilling and Production Practice API, 200-213.
Kranz, R.L., Saltzman, J.S. & Blacic, J.D. 1990. Hydraulic diffusivity measurements on laboratory rock samples using an oscillating pore pressure method. International

Journal of Rock Mechanics and Mining Sciences & Geomechanics Abstracts, 27, 345-352, doi: http://dx.doi.org/10.1016/0148-9062(90)92709-N.
Kwon, O., Kronenberg, A.K., Gangi, A.F. & Johnson, B. 2001. Permeability of Wilcox shale and its effective pressure law. Journal of Geophysical Research: Solid Earth, 106, 19339-19353.
Kwon, O., Kronenberg, A.K., Gangi, A.F., Johnson, B. & Herbert, B.E. 2004. Permeability of illite-bearing shale: 1. Anisotropy and effects of clay content and loading. Journal of Geophysical Research: Solid Earth, 109, B10205, doi: 10.1029/2004JB003052.
Lamb, H. 1945. Hydrodynamics. 6th ed. Dover publications, New York. Lee, J. & Wattenbarger, R.A. 1996. Gas reservoir engineering. Society of Petroleum
Engineers. Letham, E.A. & Bustin, R.M. 2016. Klinkenberg gas slippage measurements as a means for
shale pore structure characterization. Geofluids, 16, 264-278, doi: 10.1111/gfl.12147. Loucks, R.G., Reed, R.M., Ruppel, S.C. & Hammes, U. 2012. Spectrum of pore types and
networks in mudrocks and a descriptive classification for matrix-related mudrock pores. AAPG Bulletin, 96, 1071-1098.
Ma, L., Taylor, K.G., Lee, P.D., Dobson, K.J., Dowey, P.J. & Courtois, L. 2016. Novel 3D centimetre-to nano-scale quantification of an organic-rich mudstone: The Carboniferous Bowland Shale, Northern England. Marine and Petroleum Geology, 72, 193-205.
Macquaker, J.H.S. & Adams, A.E. 2003. Maximizing information from fine-grained sedimentary rocks: an inclusive nomenclature for mudstones. Journal of Sedimentary Research, 73, 735-744.
Matlab. 2013. version 8.10.0 (R2013a). The MathWorks Inc. Mavko, G., Mukerji, T. & Dvorkin, J. 2009. The rock physics handbook : tools for seismic
analysis of porous media. 2nd ed. Cambridge University Press, Cambridge. Mckernan, R.E., Rutter, E.H., Mecklenburgh, J., Taylor, K.G. & Covey-Crump, S.J. 2014.
Influence of Effective Pressure on Mudstone Matrix Permeability: Implications for Shale Gas Production. SPE/EAGE European Unconventional Resources Conference and Exhibition. Society of Petroleum Engineers, Vienna, Austria, SPE-167762-MS.
Metwally, Y.M. & Sondergeld, C.H. 2011. Measuring low permeabilities of gas-sands and shales using a pressure transmission technique. International Journal of Rock Mechanics and Mining Sciences, 48, 1135-1144.
Morrow, C.A., Lockner, D.A., Moore, D.E. & Hickman, S. 2014. Deep permeability of the San Andreas fault from San Andreas fault observatory at depth (SAFOD) core samples. Journal of Structural Geology, 64, 99-114.
Morrow, C.A., Shi, L.Q. & Byerlee, J.D. 1984. Permeability of fault gouge under confining pressure and shear stress. Journal of Geophysical Research: Solid Earth, 89, 3193-3200.
Nur, A. & Byerlee, J.D. 1971. An exact effective stress law for elastic deformation of rock with fluids. Journal of Geophysical Research, 76, 6414-6419.
Pemberton, S.G. & Gingras, M.K. 2005. Classification and characterizations of biogenically enhanced permeability. AAPG Bulletin, 89, 1493-1517.
Pye, K. & Krinsley, D.H. 1986. Microfabric, mineralogy and early diagenetic history of the Whitby Mudstone Formation (Toarcian), Cleveland Basin, UK. Geological Magazine, 123, 191-203.
Randolph, P.L., Soeder, D.J. & Chowdiah, P. 1984. Porosity and Permeability of Tight Sands. SPE Unconventional Gas Recovery Symposium, SPE-12836-MS, doi: 10.2118/12836-MS.

Rawson, P.F. & Wright, J.K. 1995. Jurassic of the Cleveland Basin, North Yorkshire. Field geology of the British Jurassic: Geological Society of London, 173-208.
Rutter, E.H., Hackston, A.J., Yeatman, E., Brodie, K.H., Mecklenburgh, J. & May, S.E. 2013. Reduction of friction on geological faults by weak-phase smearing. Journal of Structural Geology, 51, 52-60.
Sayers, C.M. 2005. Seismic anisotropy of shales. Geophysical Prospecting, 53, 667-676, doi: 10.1111/j.1365-2478.2005.00495.x.
Schieber, J. 2011. Reverse engineering mother nature: Shale sedimentology from an experimental perspective. Sedimentary Geology, 238, 1-22.
Schieber, J., Southard, J.B. & Schimmelmann, A. 2010. Lenticular shale fabrics resulting from intermittent erosion of water-rich muds - interpreting the rock record in the light of recent flume experiments. Journal of Sedimentary Research, 80, 119-128.
Schlömer, S. & Krooss, B.M. 1997. Experimental characterisation of the hydrocarbon sealing efficiency of cap rocks. Marine and Petroleum Geology, 14, 565-580.
Schneider, C.A., Rasband, W.S. & Eliceiri, K.W. 2012. NIH Image to ImageJ: 25 years of image analysis. Nature methods, 9, 671-675.
Seeburger, D.A. & Nur, A. 1984. A pore space model for rock permeability and bulk modulus. Journal of Geophysical Research: Solid Earth, 89, 527-536.
Shi, J.-Q. & Durucan, S. 2016. Near-exponential relationship between effective stress and permeability of porous rocks revealed in Gangi's phenomenological models and application to gas shales. International Journal of Coal Geology, 154–155, 111-122, doi: http://dx.doi.org/10.1016/j.coal.2015.12.014.
Song, I. & Renner, J. 2007. Analysis of oscillatory fluid flow through rock samples. Geophysical Journal International, 170, 195-204, doi: 10.1111/j.1365-246X.2007.03339.x.
Terzaghi, K. 1923. Thoretical Soil Mechanics. John Wiley, New York. Turner, G.A. 1958. The flow-structure in packed beds: A theoretical investigation utilizing
frequency response. Chemical Engineering Science, 7, 156-165, doi: http://dx.doi.org/10.1016/0009-2509(58)80022-6.
Walls, J. & Nur, A. 1979. Pore pressure and confining pressure dependence of permeability in sandstone. Transactions of the 7th Formation Evaluation Symposium, 1-8.
Walsh, J.B. 1965a. The effect of cracks in rocks on Poisson's ratio. Journal of Geophysical Research, 70, 5249-5257.
Walsh, J.B. 1965b. The effect of cracks on the compressibility of rock. Journal of Geophysical Research, 70, 381-389.
Yang, Y. & Aplin, A.C. 1998. Influence of lithology and compaction on the pore size distribution and modelled permeability of some mudstones from the Norwegian margin. Marine and Petroleum Geology, 15, 163-175.
Yang, Y. & Aplin, A.C. 2007. Permeability and petrophysical properties of 30 natural mudstones. Journal of Geophysical Research: Solid Earth, 112, B03206, doi: 10.1029/2005JB004243.
Younglove, B.A. & Hanley, H.J.M. 1986. The Viscosity and Thermal Conductivity Coefficients of Gaseous and Liquid Argon. Journal of Physical and Chemical Reference Data, 15, 1323-1337, doi: doi:http://dx.doi.org/10.1063/1.555765.
Zhang, T., Ellis, G.S., Ruppel, S.C., Milliken, K. & Yang, R. 2012. Effect of organic-matter type and thermal maturity on methane adsorption in shale-gas systems. Organic Geochemistry, 47, 120-131, doi: http://dx.doi.org/10.1016/j.orggeochem.2012.03.012.
Zimmerman, R.W., Somerton, W.H. & King, M.S. 1986. Compressibility of porous rocks. Journal of Geophysical Research: Solid Earth, 91, 12765-12777, doi: 10.1029/JB091iB12p12765.

Zoback, M.D. & Byerlee, J.D. 1975. Permeability and effective stress: Geologic notes. AAPG Bulletin, 59, 154-158.

Tables Table 1. Sample dimensions and porosity.
Sample Length (m) Diameter (m) Porosity RA1 0.01919 0.02439 0.086 RA2 0.03133 0.02436 0.087 RA6 0.03127 0.02463 0.081 RA12 0.02723 0.02451 0.072 RA13 0.02723 0.02435 RA14 0.02521 0.02449 0.073 RC7 0.01694 0.02455 0.087
Table 2. Results from empirical fits to equation 18 with errors for fit parameters and overall
RMS error of the fit. The samples with no value for 𝜒𝜒 were tested at a constant pore
pressure of 25 MPa. In the remaining tests the pore pressure and confining pressure
were both varied.
Sample k0×10-21
(m2)
𝛿𝛿𝑘𝑘0×10-21
(m2)
𝛾𝛾
(MPa-1)
𝛿𝛿𝛾𝛾(MPa-1) 𝜒𝜒 𝛿𝛿𝜒𝜒 RMS error
log(k m2)
RA1 179 38 -0.031 0.005 0.199
RA2 180 32 -0.026 0.003 0.601 0.228 0.116
RA6 90.5 14.0 -0.037 0.004 0.168
RA12 26.4 3.8 -0.009 0.002 0.564 0.244 0.058
RA13 7.81 1.80 -0.021 0.004 0.973 0.322 0.107
RA14 7.86 0.96 -0.022 0.003 0.120
RA14
cycle 1
34.3 7.2 -0.030 0.004 0.964 0.194 0.039
RA14
cycle 2
11.0 1.3 -0.021 0.002 0.756 0.109 0.042
RA14
cycle 3
8.41 0.97 -0.021 0.002 0.422 0.097 0.064
RC7 2.39 0.28 -0.023 0.002 0.075

Table 3. Compressional wave velocity parallel to layering (V11) and perpendicular to
layering (V33) and calculated components of Voigt stiffness matrix (Cij) assuming transverse
isotropy with symmetry axis (x3) perpendicular to layering.
Cycle V11 (ms-1) V33 (ms-1) C11 (GPa) C33 (GPa)
1 4527.00 3498.00 51.23 30.59
2 4531.00 3525.00 51.32 31.06
3 3468.00 30.07
Table 4. Calculated matrix isotropic elastic properties. A Voigt-Reuss-Hill (VRH) average
of the solid phases assuming no lattice preferred orientation and phase proportions
measured from SEM and XRD and elastic properties of individual phases taken from
literature. Porosity is included using self-consistent (SC) approach of Berryman (1995)
following routines from Mavko et al. (2009) with VRH average of the solid phases as the
matrix properties. Vp is compressional wave velocity, C11 is a component of the stiffness
matrix, K is bulk modulus, 𝜇𝜇 is shear modulus, v is Poisson’s ratio and 𝛼𝛼 is the aspect ratio
of pores. The emboldened values are those used for the elastic properties of the matrix in the
pore network model.
Vp (ms-1) C11 (GPa) K (GPa) 𝜇𝜇 (GPa) v 𝛼𝛼
VRH solids 6041.04 91.24 51.47 29.83 0.26
SC 6% spherical porosity 5641.77 79.57 44.50 26.31 0.25
SC 6% elliptical porosity 4213.17 44.38 21.53 17.13 0.19 0.05
4611.76 53.17 26.74 19.83 0.20 0.07
4745.14 56.29 28.67 20.72 0.21 0.08
4852.28 58.86 30.30 21.42 0.21 0.09
4940.30 61.02 31.69 22.00 0.22 0.10
5361.23 71.86 39.00 24.64 0.24 0.20
5604.16 78.52 43.74 26.08 0.25 0.50
5636.38 79.42 44.39 26.27 0.25 0.75

Table 5. Results from the seismic velocity model and pore transport model, sample RA14.
Seismic Velocity Model Pore Transport Model Cycle Pressure
Range Crack Porosity 𝜙𝜙𝑐𝑐𝑝𝑝𝑎𝑎𝑐𝑐𝑐𝑐
Average Aspect Ratio 𝛼𝛼�
Standard Deviation of Aspect Ratio 𝜎𝜎𝛼𝛼
Transport Porosity
Pore widths b0 (nm)
1 0-20 0.0039 0.00266 0.9576 0.07 3.7 1 10-100 0.0086 0.00675 0.9576 0.025 2.2 2 10-100 0.0086 0.00759 0.9576 0.022 1.8 3 10-100 0.0089 0.00763 0.9576 0.022 1.8

Appendix Based on scattering theory, Hudson (1980, 1981) set out how the effective moduli for a
medium with ellipsoidal cracks can be calculated (see Mavko et al. 2009 page 194). This
formulation has the problem that at high crack densities the equations predict that elastic
moduli will increase with increasing crack density. This problem was corrected by Cheng
(1993) using a different formulation. Cheng (1993) showed that the effective elastic stiffness
𝐶𝐶𝑖𝑖𝑖𝑖∗ can be calculated more precisely using:
𝐶𝐶𝑖𝑖𝑖𝑖∗ = 𝐶𝐶𝑖𝑖𝑖𝑖01 − 𝑎𝑎𝑖𝑖𝑖𝑖Γ1 + 𝑏𝑏𝑖𝑖𝑖𝑖Γ
(A1)
where 𝐶𝐶𝑖𝑖𝑖𝑖0 is the 6 x 6 Voigt elastic stiffness matrix, Γ is the crack density and aij and bij are
given by:
𝑎𝑎𝑖𝑖𝑖𝑖 = −𝐶𝐶𝑖𝑖𝑖𝑖1
𝐶𝐶𝑖𝑖𝑖𝑖0Γ− 𝑏𝑏𝑖𝑖𝑖𝑖 ; 𝑏𝑏𝑖𝑖𝑖𝑖 = −
𝐶𝐶𝑖𝑖𝑖𝑖2
𝐶𝐶𝑖𝑖𝑖𝑖1 Γ . (A2)
For a parallel array of oblate, thin cracks with their crack normals all parallel to x3 the
resulting aggregate will be transversely isotropic with its symmetry axis also parallel to x3
(Note superscripts in equation A2 are not powers but are the first- and second-order terms).
The 𝐶𝐶𝑖𝑖𝑖𝑖1 and 𝐶𝐶𝑖𝑖𝑖𝑖2 important for a transversely isotropic rock are:
First-order terms Second–order terms
𝐶𝐶111 = −𝜆𝜆2
𝜇𝜇Γ𝑈𝑈3 𝐶𝐶112 =
𝑞𝑞15
𝜆𝜆2
(𝜆𝜆 + 2𝜇𝜇)(Γ𝑈𝑈3)2
𝐶𝐶131 = −𝜆𝜆(𝜆𝜆 + 2𝜇𝜇)
𝜇𝜇Γ𝑈𝑈3 𝐶𝐶132 =
𝑞𝑞15
λ(Γ𝑈𝑈3)2
𝐶𝐶331 = −(𝜆𝜆 + 2𝜇𝜇)2
𝜇𝜇Γ𝑈𝑈3 𝐶𝐶332 =
𝑞𝑞15
(𝜆𝜆 + 2𝜇𝜇)(Γ𝑈𝑈3)2
𝐶𝐶441 = −𝜇𝜇Γ𝑈𝑈1 𝐶𝐶332 =
215
𝜇𝜇(3𝜆𝜆 + 8𝜇𝜇)𝜆𝜆 + 2𝜇𝜇
(Γ𝑈𝑈3)2
𝐶𝐶661 = 0 𝐶𝐶662 = 0 where
𝑞𝑞 = 15𝜆𝜆2
𝜇𝜇2+ 28
𝜆𝜆𝜇𝜇
+ 28
Γ =𝑁𝑁𝑉𝑉𝑎𝑎3 =
3𝜙𝜙4𝜋𝜋𝛼𝛼
and for weak inclusions

𝑈𝑈1 =16(𝜆𝜆 + 2𝜇𝜇)3(2𝜆𝜆 + 4𝜇𝜇)
1(1 + 𝜋𝜋)
𝑈𝑈3 =4(𝜆𝜆 + 2𝜇𝜇)3(𝜆𝜆 + 𝜇𝜇)
1(1 + 𝜅𝜅)
where
𝜋𝜋 =4𝜇𝜇′𝜋𝜋𝛼𝛼𝜇𝜇
(𝜆𝜆 + 2𝜇𝜇)(3𝜆𝜆 + 4𝜇𝜇)
𝜅𝜅 =
(𝐾𝐾′ + 43 𝜇𝜇
′)𝜋𝜋𝛼𝛼𝜇𝜇
(𝜆𝜆 + 2𝜇𝜇)(𝜆𝜆 + 𝜇𝜇)
where K and K’ are the bulk moduli of matrix and the weak phase or fluid in the cracks
respectively and 𝜇𝜇 and 𝜇𝜇′ are the shear modulus of the matrix and the weak phase or fluid
respectively. As there is gas in the pores the values of M = 0 and 𝜅𝜅 will be very close to zero
as 𝜇𝜇′ = 0 and 𝐾𝐾′ ≪ 𝐾𝐾 so the equations for U1 and U3 simplify to the dry case.
𝑈𝑈1 =16(𝜆𝜆 + 2𝜇𝜇)3(2𝜆𝜆 + 4𝜇𝜇)
𝑈𝑈3 =4(𝜆𝜆 + 2𝜇𝜇)3(𝜆𝜆 + 𝜇𝜇)
Because the compressional wave velocity is measured parallel to the layering VP(90°) i.e.
parallel to x1 direction and the compressional wave velocity perpendicular to the layering
VP(0°) i.e. parallel to x3, two components of the full transversely anisotropic elasticity matrix,
C11 and C33 can be calculated:
𝐶𝐶11 = 𝜌𝜌𝑉𝑉𝑃𝑃2(90°) 𝐶𝐶33 = 𝜌𝜌𝑉𝑉𝑃𝑃2(0°) The equations above can be used to invert for the crack density assuming a bulk modulus and
shear modulus of the isotropic matrix. Because C33 has a stronger dependence on crack
density than C11 it tends to dominate the inversion for crack density. The accuracy of the
crack density determined is unaffected by only using V33 to invert for crack density. If five
independent velocity measurement are made VP(0°), VP(90°), VP(45°), VSH(0°) and VSH(90°)
the full transversely isotropic elasticity tensor can be determined and it should be potentially
be possible to invert for both crack density and average crack aspect ratio.

Figures
Figure 1. Geological map showing the sampling locations at Runswick bay, North Yorkshire.

Figure 2. Photomicrographs showing the composition and texture of the Whitby Mudstone.
(a) Thin-section image normal to bedding showing sample RA2. Burrows are in-filled with
diagenetic pyrite (black). (b) Thin-section image normal to bedding showing sample RA13.
Small burrows infilled with either clay or quartz silt are set in a bioturbated, clay-dominated
host sediment. Diagenetic pyrite is absent. (c) Scanning electron photomicrograph showing
silt grains comprising quartz (q), albite (a), muscovite/chlorite (m) set in a matrix dominated
by illite (i) and kaolinite (k) with minor amorphous organic matter and pyrite (p). (d)
Mineral map of the area in (a). c is carbonate and (o) is organic matter. (e) Scanning
electron photomicrograph showing preferred orientation of clay matrix and of microcracks
(arrows) and porosity protected from compaction by clusters of silt grains (circled yellow).
(f) Scanning electron photomicrograph showing porosity within euhedral pyrite aggregates.

Figure 3. Example of upstream and downstream signals for experiment RA14 at confining
pressure 75 MPa and pore pressure 25 MPa. Period of the upstream wave is 2000 s and the
amplitude 1 MPa. The downstream pore pressure typically exhibits transient behaviour
before settling to steady state.
Figure 4. Solution space showing the region in which physically meaningful values of 𝐴𝐴 and
𝜃𝜃 can be found, delimited by the iso- 𝜉𝜉 lines 𝜉𝜉 = 0 and 𝜉𝜉 → ∞. Storativity ratio (𝜉𝜉) is
proportional to porosity, thus iso-𝜉𝜉 paths are approximately lines of constant porosity.
Permeability data for sample RA14 is plotted as open circles. As permeability (proportional
to 𝜂𝜂) decreases with increasing confining pressure, the data points migrate downwards
roughly following the same iso-𝜉𝜉 path. The dashed line indicates the dimensionless storativity
ratio 𝜉𝜉 calculated using equation 6 when storativity (𝛽𝛽) is calculated from the measured
helium porosity using equation 8.

Figure 5. Comparison of permeabilities measured using the oscillating pore pressure method
(Bernabé et al. 2006), with the transient pulse decay method (Brace et al. 1968) applied
immediately afterwards. Transient pulse decay measurements were processed using both
equation 12 (Brace et al. 1968) (grey circles) and equation 15 (Cui et al. 2009) which takes
porosity into account. When using equation 15, porosity was set as either derived from
helium pyncnometry (He 𝜙𝜙) (open circles) or porosity calculated from equation 8 when
storativity 𝛽𝛽 is calculated from equation 6 using the dimensionless storativity ratio 𝜉𝜉
determined from the pore pressure oscillation measurement (black crosses).
Figure 6. Schematic diagram of experimental setup used for permeability experiments.

Figure 7. a. Permeability plotted as a function of effective pressure at a constant pore
pressure showing the evolution of during pressure cycling. b. Permeability plotted as a
function of effective pressure at a constant pore pressure of 25 MPa for two bedding-parallel
and one bedding-normal core plugs of Whitby Mudstone, after an initial application of
effective pressure up to 70 MPa, during which a permanent decrease of almost 2 orders of
magnitude occurred. Measurement uncertainty is less than symbol size. Fitted lines describe
exponential decrease of permeability with effective pressure.
Figure 8. Permeability as a function of effective pressure measured at both constant pore
pressure (dashed line and open symbols) and constant confining pressure (solid line and
closed symbols) across three different pressure ranges in sample RA14 cored parallel to
bedding. Permeability decreases permanently with each increment of pressure (labelled

cycle 1, cycle 2, cycle 3), resulting in a cumulative permeability decrease of almost 2 orders
of magnitude over the full 70 MPa pressure range. This is followed by reproducible elastic
behaviour for pressure cycles up to the previously highest pressure attained. Slopes for
constant pore pressure and constant confining pressure data are approximately the same.
Figure 9. Comparison of permeability data for sample RA14 (coloured circles) with
permeability predicted using equation 18 (coloured lines). a and b respectively use total
confining pressure and pore pressure for the pressure axis. When the bounding line Pp = Pc
has a positive slope 𝜒𝜒 > 1; when the slope is zero, 𝜒𝜒 = 1, and when the slope is negative,
𝜒𝜒 < 1.

Figure 10. Measured permeability data normalised to that predicted by best fit to high pore
pressure data (𝑘𝑘𝑚𝑚𝑒𝑒𝑎𝑎𝑠𝑠𝑢𝑢𝑝𝑝𝑒𝑒𝑑𝑑/𝑘𝑘𝑝𝑝𝑝𝑝𝑒𝑒𝑑𝑑𝑖𝑖𝑐𝑐𝑡𝑡𝑒𝑒𝑑𝑑) where kpredicted is given by equation 19 plotted against
pore pressure. The plot illustrates the magnitude of deviations from the original permeability
trend and shows that the upper pore pressure limit for gas slippage effects is 10 MPa. This is
described by a Klinkenberg parameter 𝐾𝐾𝑏𝑏 (equation 4) of 2 MPa. The continuous fitted curve
is equation 19.
Figure 11. (a) Ultrasonic compressional wave velocity measurements on Whitby Mudstone
for core samples oriented with axes both parallel normal to layering for three pressure cycles

(only up-pressure part of each cycle shown). For wave propagation normal to layering
velocities increase between each cycle during loading paths. Solid lines are fits to velocities
calculated from crack densities obtained using the approach of (Cheng 1993).
Correspondence is good for the layering-normal orientation but there is deviation at lower
pressures for the layering-parallel orientation. Black dashed line is theoretical velocity of a
crack free isotropic rock. (b) Crack densities versus pressure calculated from velocity data
for successive pressure cycles using the approach of (Cheng 1993) and detailed in appendix.
Data are fitted to equation 25 (solid lines) over the pressure ranges (in MPa) shown in
legend. (c) Aspect ratio distribution of cracks closing with applied effective pressure,
determined using equation 30. Modal aspect ratios are shown in Table 5 together with the
standard deviations calculated assuming distributions can be approximated as log-normal.
(d) Zero pressure log-normal distributions of aspect ratio generated using a pseudo random
number generator for use in the pore conductivity model (equation 30). The aspect ratio
distribution is based on values obtained from change in crack density with pressure. The
lowest aspect ratio cracks close as pressure is increased and are removed from the pore
conductivity model causing the cut off of low aspect ratios at higher pressures.
Figure 12. (a) Pore volume strain versus effective pressure experimental data for samples
RA13 and RA14 (combined) of Whitby Mudstone. Lines show predicted curves of total pore
volume strain when most of the porosity is hosted within isolated, spherical pores and the
remainder of the porosity is hosted within elliptical pores with the log-normal aspect ratio
distribution of the conductive crack network (Figure 11d). The different cycles and the low
pressure and high pressure curves for cycle 1 refer to the different aspect ratio distributions
(Figure 11c) calculated from how crack density changes with pressure (Figure 11b). The fit
was optimised by varying the proportions of conductive porosity to total porosity. The

stiffness of the rock increases with pressure as cracks are progressively closed (fits are
upward-convex), although the general linear trend of the experimental data corresponds to a
bulk compressibility of approximately 8 GPa. (b) Permeability calculated as a function of
effective pressure using equation 36. Data are for sample RA14 (this is the same data as
shown in Figure 8 and also the later cycles are shown in Figure 7). Fit parameters are given
in Table 5. The aspect ratio distribution calculated for pressures below 20 MPa for cycle 1
(Figures 11c and 11d) fits well with the permeability data for initial pressurization. The
permeability calculated from the aspect ratio distributions calculated for the later cycles also
fit well with data for the later cycles of pressurization.
Figure 13. Schematic illustration of the structure of the pore network in the Whitby Mudstone
inferred from measurements of velocity, bulk compressibility and permeability. Higher aspect
ratio pores (𝛼𝛼 = 0.75) constitute most of the pore volume (𝜙𝜙 = 0.06), but act mostly as
storage pores. High aspect ratio cracks (𝛼𝛼 = 0.015 and 𝜙𝜙 = 0.02) form an out-of-plane
connected, fluid-conducting network which progressively closes down with increasing
pressure, reducing permeability.