
Microstructural and Hardness Evaluation of Ni4Mo Alloy ...
311
University of Tennessee, Knoxville University of Tennessee, Knoxville TRACE: Tennessee Research and Creative TRACE: Tennessee Research and Creative Exchange Exchange Masters Theses Graduate School 8-1996 Microstructural and Hardness Evaluation of Ni4Mo Alloy with Microstructural and Hardness Evaluation of Ni4Mo Alloy with Aluminum Additions Aluminum Additions Ye-Lin Shen University of Tennessee - Knoxville Follow this and additional works at: https://trace.tennessee.edu/utk_gradthes Recommended Citation Recommended Citation Shen, Ye-Lin, "Microstructural and Hardness Evaluation of Ni4Mo Alloy with Aluminum Additions. " Master's Thesis, University of Tennessee, 1996. https://trace.tennessee.edu/utk_gradthes/3243 This Thesis is brought to you for free and open access by the Graduate School at TRACE: Tennessee Research and Creative Exchange. It has been accepted for inclusion in Masters Theses by an authorized administrator of TRACE: Tennessee Research and Creative Exchange. For more information, please contact [email protected].
Transcript of Microstructural and Hardness Evaluation of Ni4Mo Alloy ...

University of Tennessee, Knoxville University of Tennessee, Knoxville
TRACE: Tennessee Research and Creative TRACE: Tennessee Research and Creative
Exchange Exchange
Masters Theses Graduate School
8-1996
Microstructural and Hardness Evaluation of Ni4Mo Alloy with Microstructural and Hardness Evaluation of Ni4Mo Alloy with
Aluminum Additions Aluminum Additions
Ye-Lin Shen University of Tennessee - Knoxville
Follow this and additional works at: https://trace.tennessee.edu/utk_gradthes
Recommended Citation Recommended Citation Shen, Ye-Lin, "Microstructural and Hardness Evaluation of Ni4Mo Alloy with Aluminum Additions. " Master's Thesis, University of Tennessee, 1996. https://trace.tennessee.edu/utk_gradthes/3243
This Thesis is brought to you for free and open access by the Graduate School at TRACE: Tennessee Research and Creative Exchange. It has been accepted for inclusion in Masters Theses by an authorized administrator of TRACE: Tennessee Research and Creative Exchange. For more information, please contact [email protected].

To the Graduate Council:
I am submitting herewith a thesis written by Ye-Lin Shen entitled "Microstructural and Hardness
Evaluation of Ni4Mo Alloy with Aluminum Additions." I have examined the final electronic copy
of this thesis for form and content and recommend that it be accepted in partial fulfillment of
the requirements for the degree of Master of Science, with a major in Materials Science and
Engineering.
Charlie R. Brooks, Major Professor
We have read this thesis and recommend its acceptance:
Ben F. Oliver, R. A. Buchanan
Accepted for the Council:
Carolyn R. Hodges
Vice Provost and Dean of the Graduate School
(Original signatures are on file with official student records.)

To the Graduate Council:
I am submitting herewith a thesis written by Ye-Lin Shen entitled "Microstructural and Hardness Evaluation of Ni4Mo Alloy with Aluminum Additions." I have examined the final copy of this thesis for form and content and recommend that it be accepted in partial fulfillment of the requirements for the degree of Master of Science, with a major in Metallurgical Engineering.
We have read this thesis and recommend its acceptance:
�:/-�
CharlieR. Brooks, Major Professor
Accepted for the council:
Associate Vice Chancellor and Dean of the Graduate School
Microstructural and Hardness Evaluation of
Ni4Mo Alloy with Aluminum Additions
A Thesis
Presented for the
Master of Science
Degree
University of Tennessee, Knoxville
Ye-Lin Shen
August 1996
DEDICATION
This thesis is dedicated to the following family members,
my husband, Cong Yue Qiao
my son, Jonathan Y. Qiao
My parents, and my parents in-laws
without their love, support and patience, it would not have been possible.
11

ACKNOWLEDGMENTS
The author would like to express her greatest appreciation to her major advisor,
Dr. Charlie R. Brooks, for his advice, inspiration, encouragement, guidance, and support
throughout this investigation. The work could not have been accomplished without his
continued support. The author also like to express her deep appreciation to Dr. Ben F.
Oliver and Dr. Raymond A. Buchanan for their continued advice, support and
encouragement during the course of the work. The author gratefully acknowledges Dr.
Eugene E. Stansbury for his interest in the topic and many good discussions.
The author wishes to acknowledge Dr. Edward A. Kenik and Dr. Neal D. Evans
for their support and assistance during the TEM examination experiments and much
excellent advise. The support through the SHaRE program operated at Oak Ridge
National Laboratory, which provides the research facilities and makes it possible to
obtain many unique results through this study, is appreciated.
The author also like to thank all the staff members of the Materials Science and
Engineering Department and Chemical Engineering Department for their encouragement
and assistance whenever the author needed help.
Last, but not the least, the author appreciates the assistance obtained from her
colleague graduate students for their help during experimental work namely, Mr. Tim
Newport, Mr. Michael Strauss, Dr. Ping Li, and Mr. Robert Perrier.
Ill

ABSTRACT
The Ni-20 at.% Mo alloy, here referred to as Ni�o. is a single phase face
centered cubic structure (a) above 868°C; below this temperature it becomes long-range
ordered (�). The conversion of a to � (ordering reaction) on cooling or by other heat
treatment causes a marked increase (e.g., doubling) in the hardness and yield strength.
However, extreme embrittlement also occurs. A major purpose of the present study was
to see if the addition of moderate amount of aluminum would prevent the embrittlement
yet retain the strengthening during ordering. Aluminum was chosen because if might
allow the alloys to retain the good corrosion resistance ofNi�o.
The alloys studied were the base Ni4Mo alloy and Ni4Mo with addition of2, 5, 7,
and 9 at.% aluminum. All samples were small arc melted buttons. They were solution
heat treated at 1280°C for 50 hours in quartz tubes filled with argon, then quenched by
breaking the tube under water. Samples were then aged at 600, 650, 700, 750, 850, and
950°C for up to 100 hours. Microhardness was measured and ductility was examined by
bending thin slices. The microstructures were evaluated using optical, scanning electron
and transmission electron microscopy. Corrosion resistance was evaluated using cyclic
anodic polarization and polarization resistance testing.
A major finding was that aluminum increased considerably the hardness for all
aging treatment and for all alloys (a maximum of about 650 HV after aging the 5, 7, and 9
at.% AI alloys for 100 hours at 700°C), but did not prevent embrittlement. However, in
the solution heat treated condition the hardness of the 9 at.% AI alloy ( 440 HV) was
approximately double that of the Ni4Mo alloy (220 HV), and good ductility was retained.
IV
Ni�o and 7 at.% A1 alloys possesses good corrosion resistance in 14% hydrochloric
solution with air condition.
The specific results are summarized in the list below.
Hardness Measurements
1. For the same heat treatments (with minor exceptions), the hardness of the 2 at.%
AI alloy was the same as the base Ni4Mo alloy.
2. The hardness increased with increasing Aluminum contents from S, 7, and 9 at.%
aluminum for all heat treatments.
3 . Th e maximum hardness (about 6SO HV Vickers) was attained in the S, 7 and 9
at.% AI alloys after aging for 100 hours at 700°C.
4. Upon aging at 7S0°C, the hardness for all alloy increased significantly
(approximately doubled) after 10 hours, then increased about another 20% upon
aging for SO hours, then remained the same after SO hours ( I 00 hours total).
Microstructural Examination
1. The binary Ni�o alloy was SRO a in the as-quenched condition, prior to aging.
For all the aging treatment, the a was converted to a domain structure of long
range order 13. For some treatments, there was grain boundary migration, with
accompanying domain growth. In come regions, the migration was accompanied
by the precipitation of"(, showing that the composition of the base alloy was
slightly to the Mo-rich side of the stoichiometric Ni4Mo.
2. The optical light microscopy observation indicated that the aluminum alloys were
single phase in the as-quenched condition. However, transmission electron
microscopy revealed that the short-range order a was retained. Apparently
v

aluminum enhances the kinetics of the decomposition of a, and the quenched
structures consisted of a very fine domain structure of the nonequilibrium phases
DOn and NhMo. This was the starting structure for the aging treatment of all
the alloys.
3. The identification of the microstructures and the phases in them is based on the
optical light, scanning electron and transmission electron microscopy
observations. The results are summarized in Table 4-1 3 .
(a) Aging at 750°C for 10, 50 and 100 Hours
The 2 at.% AI alloy progressed from a fine domain structure of SRO a+ DOn to a fine domain structure of� plus the nonequilibrium phases
D022 and Ni2Mo.
The 5 at.% AI alloy progressed from a fine domain structure of the
nonequilibrium DOn phase to the formation of a lamellar structure ofy
andy' forming from the grain boundaries. The DOn matrix changed to a
fine domain structure of D022 and Ni2Mo.
The 7 and 9 at.% AI alloys progressed from an initial structure of fine
domains of the nonequilibrium phases D022 and Ni2Mo to a lath structure
ofy and"( growing from the grain boundaries. The remaining matrix
formed a fine tweed structure of NhMo and D022 phases.
VI

(b) Aging for I 00 Hours at 600, 650, 700, 750, 850 and 950°C
At 650°C, the Ni�o alloy consisted of a matrix of fine J3 domains. There
was some discontinuous precipitation of-y associated with grain boundary
migration. At 750°C the structure was all fine domains of J}. The
precipitation of 'Y distributed in matrix.
The 2 at.% AI alloy showed little change in the structure until 750°C,
where fine domains of 13 formed in the 0022 + Ni2Mo matrix. Some o particles appeared. At 850°C, the matrix was fine domains of the 0022
structure, and a lath structure began to form from the grain boundaries. At
950°C, the matrix was SRO a..
The 5 at.% AI alloy consisted of only a fine domain structure ofOOn
phase. At 650°C, the matrix consisted of fine domains of0022 and
Ni2Mo, and a lamellar structure of-y and 1 began to form from the grain
boundaries. At 700°C and 750°C, the entire structure was lamellar. At
850°C and 950°C, the needle-like structure of 'Y formed and particles of o distributed along grain boundaries.
The 7 at.% AI alloy, after aging at 600 and 650°C, had a structure similar
to that of the 5 at.% AI alloy. At 750°C, the matrix consisted of the fine
domains of the NhMo and 0022 phases, and a lamellar 'Y + 1 structure
had formed from the grain boundaries. At 850°C and 950°C,
microstructure is same as that of the 5 at % AI alloy.
VII

The 9 at.% AI alloy was only aged at 600, 700 and 750°C. At 600°C and
700°C, the matrix was a fine domain structure of D022 and Ni2Mo
phases. There were some o laths present and some pure Mo particles. At
750°C, the matrix was a fine domain structure of D022 and Ni2Mo. A
lamellar structure ofy+ "( had formed from the grain boundaries. Some
Mo rich particles was found along grain boundaries.
Fractographic Evaluation
I . In the solution heat treated at 1250°C and aging at 950°C conditions, alloys were
ductile.
2. Based on the bend tests, all alloys were brittle in the aged at 750°C for I 00
hours. In the matrix, fracture occurred along the high angle, former a boundaries.
In the alloys in which the lamellar structure had formed from the grain boundaries,
cracking occurred along the location of the original a boundaries. In the 7 and 9
at.% AI alloys, some cracks crossed through the lamellar structure. In the lamellar
structure, cracking occurred mainly by interphase interface separation, but there
was some cleavage across the phases.
Corrosion Resistance Evaluation
1 . In general, the corrosion rate of all alloys was in the acceptable range based on a
calculated surface loss rate.
2. The corrosion rate ofNi4Mo and 7 at.% AI alloys was in a range of 5-20 mils per
year which is considered good corrosion resistance. The corrosion rate of 2, 5 and
9 at.% AI alloys was in a range of20-50 mils per year which is considered fair
corrosion resistance.
VIII

3 . Aluminum can influence the phase transformation and also changed the corrosion
rate in Ni-Mo-Al alloy.

TABLE OF CONTENTS
CHAPTER PAGE
I . IN'TRODUCTION. . . . . . . . . . . . . ... ..... ............ ....... .... .............. .......... .... ..... .......... I
2. LITERATURE REVIEW .. . . . . . . . . . . . ... . . . . . . . . .... . . . . . . . ... . . . . . . ... . . . . . . .. . . . . . . . .. . . . ... . . . . . . . 4
2. I Hastelloy Alloy Systems. . . . . . . . . . . . . . . . . . . . . . . . . . . . . . . . . . . . . . . . . . . . . . . . . . . . . . . . . . . . . . . . . 4
2.2 Nickel-Molybdenum Alloys. . . . . . . . . . . . . . . . . . . . . . . . . . . . . . . . . . . . . . . . . . . . . . . . . . . . . . . . . . . . 7
2.3 Physical and Mechanical Properties ofNi-Mo Alloys . . . . . . . . . . . . . . . . . . . . 9
2.4 Ordered and Disordered Structure in Ni-20 at.% Mo Alloys . . . . . . . . . . 26
2 .5 The Effect of Alloy Elements in Ni-Base Alloys . . . . . . . . . . . . . . . . . . . . . . . . . . . . . 28
2.6 Heat Treatment. ........................ . . . . . . . ................... .............................. 3 1
2.7 Microstructural Evaluation . . . . . . . . . . . . . . . . . . . . . . . . . . . . . . . . . . . . . . . . . . . . . . . . . . . . . . . . . . . . . . . 33
2.8 X-Ray and Electron Diffraction. . . . . . . . . . . . . . . . . . . . . . . . . . . . . . . . . . . . . . . . . . . . . . . . . . . . . . . 35
2.9 Corrosion Resistance Evaluation . . . . ... . . . . . . . . . . . . . . . . . . . . . . . . . . . . . ... . . . . .. . .. ... . . . 38
3 . MATERIALS AND EXPERIME NTAL PROCEDURES . .. . . . . . . . . .. . . . . . . . . . . . . 4 1
3 . 1 Chemical Composition. . . . . . . . . . . . . . . . . . . . . . . . . . . . . . . . . . . . . . . . . . . . . . . . . . . . . . . . . . . . . . . . . . . . . 4 1
3 .2 Materials Fabrication . . . . . . . . . . . . . . . . . . . . . . . . . . . . . . . . . . . . . . . . . . . . . . . . . . . . . . . . . . . . . . . . . . . . . . . . 42
3 .3 Heat Treatment. . . . . . . . . . . . . . . . . . . . . . . . . . . . . . . . . . . . . . . . . . . . . . . . . . . . . . . . . . . . . . . . . . . . . . . . . . . . . . . . . 44
3 .4 Microhardness Measurement. . . . . . . . . . . . . . . . . . . . . . . . . . . . . . . . . . . . . . . . . . . . . . . . . . . . . . . . . . . 44
3 .5 Optical Light Microscopic (OLM) Evaluation . . .. . . . . . . . . . . ... . . . . . ... . . . . . . . 46
3.6 Scanning Electron Microscopy (SEM) and Energy Disperse
Spectrometer (EDS) Investigation . . . . . . . . . . . . . . . . . . . . . . . . . . . . . . . . . . . . . . . . 47
3 .7 Fractographic Study Using SEM and EDS . . . . . . . . . . . . . . . . . . . . . . . . . . . . . . . . . . . . . . 47
3 . 8 Transmission Electron Microscopy (TEM}. . .. . . . .. . . .. . . . . . . . . . . . .. . . . . . . .. . . 48
3 .9 Corrosion Resistance Evaluation . . . . . . . . . . . .. . .. . . . . .. . . . . . . . . . . .. . .. . . . . . . . . . . . . . .. . . 52
4. RESULTS AND DISCUSSION . . . . . . . . . . . . . . . . . . . . . . . . . . . . . . . ... . . . . . . .. . . . . . . . . . . . . . . . . .. . . . . . . . 58
4 . 1 Hardness Measurements. . . . . . . . . . . . . . . . . . . . . . . . . . . . . . . . . . . . . . . . . . . . . . . . . . . . . . . . . . . . . . . . . . 58
4.2 Optical Light Microscopic (OLM) Microstructural
Evaluation in Ni.JMo and Ni-Mo-Al Alloys.. . . . . . . . . . . . . . . . . . . . . . . 68
X
4.3 Scanning Electron Microscopy (SEM) Microstructural
Evaluation. . . . . . . . . . . . . . . . . . . . . . . . . . . . . . . . . . . . . . . . . . . . . . . . . . . . . . . . . . . . . . . . . . . . . . . . . . . . . 1 12
4.4 Fracture Surface Topology Investigation. . . . . . . . . . . . . . . . . . . . . . . . . . . . . . . . . . . . . . . . . 164
4.5 Transmission Electron Microscopy (TEM) Microstructure
and Electron Diffraction Pattern Analysis. . . . . . . . . . . . ... . . . . . . . . . . . . 1 83
4.6 Corrosion Resistance Evaluation . . . . . . . . . . . . . . . . . . . . . . . . . . . . . . . . . . . . . . . . . . . . . . . . . . . . . . 249
5 . CONCLUSIONS AND RECOMMENDATIONS . . . . . . . . . . . . . . . . . . . . . . . . . . . . . . . . . . . . . 263
5 . 1 Conclusion . . . . . . . . . . . . . . . . . . . . . . . . . . . . . . . . . . . . . . . . . . . . . . . . . . . . . . . . . . . . . . . . . . . . . . . . . . . . . . . . . . . . . . . . 263
5.2 Recommendations . .... . . . . . . . . .. . . . . . . . . . . . . . . . . . . . . . . . . . . . . . . . . . . . . . . . . . . . . .............. .. .. 265
REFERE NCES. . . . . . . . . . . . . . . . . . . . . . . . . . . . . . . . . . . . . . . . . . . . . . . . . . . . . . . . . . . . . . . . . . . . . . . . . . . . . . . . . . . . . . . . . . . . . 266
VITA ... ....... .............................................................................. .................... 275
Xl

LIST OF TABLES
Table 2-1 . Nominal chemical compositions (wt.%) of some typical nickel-base alloys (8].. . . . . . . . . . . . . . . . . . . . . . . . . . . . . . . . .. . . . . . . . . . . . . . . . . . . . . . . . . . . . . . . . . . . . . . 6
Table 3-1 . Chemical composition (at.%/wt.%) of the Ni4Mo alloy studied . . . . . . . . . . . . . . . . . . . . . . . . . . . . . . . . . . . . . . . . . . . . . . . . . . . . . . . . . . . . . . . . . . . .. . . . . . . . . . . . . . . . . . . . . . . . . . 4 1
Table 3-2. Composition of laboratory Ni-Mo-Al alloys (at.%/wt.%) . . . . . . . . . . . . . 42
Table 3-3 . Heat treatment conditions employed . . . . . . . . . . . . . . . . . . . . . . . . . . .. . . . . . . . . . . . . . . . . . . 45
Table 3-4. Etching solution for OLM microstructural study . . . . . . . . . . . . . . . . . . . . . . . . . . . 46
Table 3-5. Chemical composition (wt.%) of the Hastelloy B2 alloy studied . . . . . . . . . . . . . . . . . . . . . . . . . . . . . . . . . . . . . . . . . . . . . . . . . . . . . . . . . . . . . . . . . . . . . . . . . . . . . . . . . . . . . . . . . . . . . 50
Table 3-6. Jet polishing solution 1 . . . . . . . . . . . . . . . . . . . . . . . . . . . . . . . . . . . . . . . . . . . . . . . . . . . . . . . . . . . . . . . . . . . . 5 1
Table 3-7. Jet polishing solution 2 . .. .. . . . . . . . .. . . . . .. . . . . . . . . . . . . . . . . . . . . . . . . . . . . . . . . . . . . . . . . . . .. . . . . 5 1
Table 4-1 . Microstructure feature as reviewed by OLM examination in alloys in all aging conditions ... . . . . . . . . . . . . . . . . . . . . . . . . . . . . . . . . . . . . . . . . . . . . . . . . . . . . . . . . . 1 14
Table 4-2. SEM examination of phase transformation of alloys in all aging conditions . . . . . . . . . . . . . . . . . . . . . . . . . . . . . . . . . . . . . . . . . . . . . . . . . . . . . . . . . . . . . . . . . . . . . . . . . . . 165
Table 4-3 . The microstructure ofNi-Mo-Al alloys after solution treated ( 1250°C, 50 hours) and water quenched . . . . . . . . . . . . . . . . . . . . . . . . . . . . . . . . . . . . . . . . . 1 97
Table 4-4. The microstructure ofNi-Mo-Al alloys aged at 600°C ................................. ...................... ......................... ............... 202
Table 4-5 . The microstructure ofNi-Mo-Al alloys aged at 650°C . . . . . . . . . . . . . . . . . . . . . . . . . . . . . . . . . . . . . . . . . . . . . . . . . . . . . . . . . . . . . . . . . . . . . . . . . . . . . . . . . . . . . . . . . . . . . . . 207
Table 4-6. The microstructure ofNi-Mo-Al alloys aged at 750°C for 10 hours . . . . . . . . . . . . . . . . . . . . . . . . . . . . . . . . . . . . . . . . . . . . . . . . . . . . . . . . . . . . . . . . . . . . . . . . . . 209
Table 4-7. The microstructure ofNi-Mo-Al alloys aged at 750°C for SO hours . . . . . . . . . . . . . . . . . . . . . . . . . . . . . . . . . . . . . . . . . . . . . . . . . . . . . . . . . . . . . . . . . . . . . . . . . . 2 16
X11

Table 4-8. Chemical composition of the lamellar structures in Figure 4-130 . . . . . . . . . . . . . . . . . . . . . . . . . . . . . . . . . . . . . . . . . . . . . . . . . . . . . . . . . . . . . . . . . . . . . . . . . . . . . . . . . . . . . 2 18
Table 4-9. The microstructure ofNi-Mo-Al alloys aged at 750°C for 100 hours . . . . . . . . . . . . . . . . . . . . . . . . . . . . . . . . . . . . . . . . . . . . . . . . . . . . . . . . . . . . . . . . . . . . . . . . 226
Table 4-10. The microstructure ofNi-Mo-Al alloys aged at 850°C hours . . . . . . . . . . . . . . . . . . . . . . . . . . . . . . . . . . . . . . . . . . . . . . . . . . . . . . . . . . . . . . . . . . . . . . . . . . . . . . . . . . . . . . 228
Table 4-1 1 . Chemical composition of precipitates . . . . . . . . . . . . . . . . . . . . . . . . . . . . . . . . . . . . . . . . . . . . . 230
Table 4-12. The microstructure ofNi-Mo-Al alloys aged at 9S0°C . . . . ... ...... .... ......... .............................. . . . . .......... ....... . . ................. 233
Table 4-13 . Summary examination of phase transformation in alloys . . . . . . . . . . . . . . . . 234
Table 4-14. Microstructural feature in Hastelloy B2 alloys . . . . . . . . . . . . . . . . . . . . . . . . . . . . . . . 249
Table 4-15 . Anodic polarization parameter measurement in Ni�o alloy . . . . . . . . 252
Table 4-16. Summary of polarization resistance results (average values based on 2 to 4 independent tests for each alloy) . . . . . . . . . . . . . . . . . . . . . . . . . . 262
Xlll

LIST OF FIGURES
Figure 2-1 . Ni-Mo phase diagram and phases [2, 14]. . . . . . . . . . . . . . . . . ... . . . . . . . . . . . . . . .. . . . . . 8
Figure 2-2. Specific heat ofNi-20 at.% Mo, slowly cooled and quenched from 950°C [17] . . . . . . . . . . . .. . . .. . . . . . .. . . . . . . . . .. . . . . . . . . . . . . . . . . .. ... . . . .. . . . 10
Figure 2-3 . Electrical resistivity-temperature relationship for 1- at. ,.o o m ree tntt1a con ttlons 1 8 ... . . . . . . . . . . . . . . . . . .. . . .. . . . . .. . 1 1 Ni 20 o.t M . th . . . 1 d" . [ ]
Figure 2-4. Thermal expansion of 6.4, 1 1 .9, and 20 at.% Mo alloys [2].... . . . . . . . . 13
Figure 2-5. Effect ofMo content on yield strength of a-phase alloys [2]. . . . . . . . . 1 3
Figure 2-6. The effect of aging temperature and time on the 0.2% yield strength ofHastelloy B2 alloy [20] . . . . . . . . . . . . ... . . . . . . . . .. . .. . . . . . . . . . . . . . 14
Figure 2-7. The effect of aging temperature and time on the tensile elongation ofHastelloy B2 alloy [20]. . . . . . . . . . . . ... . . . . . . . . . . . . . . . . . . . . . . . . . . . . . . . 14
Figure 2-8. The effect of aging time and temperature on hardness for two different initial a grain sizes ofHastelloy B2 alloy [22] . . . . . . . . . . 16
Figure 2-9. Tensile properties of solution annealed Hastelloy B alloy as a function of temperature [23] . . . . . . . . . . . . . . . . . . . . . . . . . . . . . . . . . . . . . . . . . . . . . . . . . . . . . . . . . . 1 7
Figure 2-1 0. Tensile properties (at 25°C) of Hastelloy B Alloy as a function of aging time and temperature [23] . . . . . . . . . . . . . . . . . . . . . . . . . . . . . . . . . . . . . 1 8
Figure 2-1 1 . (a) The amount of recrystallization versus aging time for 43% cold worked material, (b) Arrhenius plot based on the time SO% recrystallization from the curves in (a) [24]. . . . . . . . . . . . . . . 20
Figure 2-12. The effect of the amount of cold work on the hardness of a in the Ni-20 at.% Mo alloy [25] . . . . . . . . . . . . . . . . . . . . . . . . . . . . . . . . .. .. . . . . . . . . . . . . . . . 21
Figure 2-1 3 . The effect of aging time at 850°C on the hardness of the Ni-20 at.% Mo alloy initially in the cold worked a condition [25]. ......... . ... . . . ......... . . .. ... . . .. . . . . .. . . . . . . . . . . .. .. . . . . . . . ....... . . . ... . . . 2 1
XlV

Figure 2-14. The effect of aging time at 850°C on the hardness of the Ni-20 at.% Mo alloy initially in the cold worked a condition [25] . . . . . . . . . . . . . . . . . . . . . . . . . . . . . . . . . . . . . . . . . . . . . . . . . . . . . . . . . . . . . . . . . . . . . . . . . . . . . . . . 22
Figure 2-1 5 . The effect of aging time at 775°C on the hardness of the Ni-20 at.% Mo alloy initially in the cold worked a condition [25].. . . . . . . . . . . . . . . . . . . . . . . . . . . . . . . . . . . . . . . . . . . . . . . . . . . . . . . . . . . . . . . . . . . . . . . . . . . . . . . 22
Figure 2-16. The effect of aging time at 700°C on the hardness of the Ni-20 at.% Mo alloy initially in the cold worked a condition [25] . . . . . . . . . . . . . . . . . . . . . . . . . . . . . . . . . . . .. . . .. . . . . . . . . . . . . . . . . . . . . . . . . . . . . . . . . . . . . . . . 23
Figure 2-1 7. Summary of the structure changes which occur during aging cold worked a at 850°C (27]. . . . . . . . . . . . . . . . . . . . . . . . . . . . . . . . . . . . . . . . . . . . . . . . . . . 25
Figure 2-1 8. Summary of the structure changes which occur during aging cold worked a at 700°C [27] . . . . . . . . . . . . . . . . . . . . . . . . . . . . . . . . . . . . . . . . . . . . . . . . . . . 25
Figure 2-19. Crystal structure of � phase (Ni4Mo) [2]. . . . . . . . . . . . . . . . .. . . . . . . . . . . . . . . . . . . . . . . 27
Figure 2-20. �lattice with relationship between FCC a-lattice and bet ordered lattice; positions ofMo atoms in adjacent planes indicated by x [2]. . . . . . . . . . . . .. . . . . . . . .. .. . . . . . . . .. . . . . . . . . . .. . . . . . . . . . . . . . . . . . . . . . . . . . . . . . . . . . 29
Figure 2-2 1 . Effect of ordering in Ni4Mo on room temperature tensile ductility: (a) dependence of ductility on exposure time at 700°C for alloys free of boron and (b) effect ofboron content on the ductility of alloy ordered to Ni4Mo alloy.£33]. . . . . . . . . . . . . . . . . . . . . 32
Figure 2-22. Isothermal time-temperature-transfonnation diagram for ordering reaction in Ni-20 at.% Mo [2] . . . . . . . . . . . . . . . . . . . . . . . . . . . . . . . . . . . . . . . . . . . . 34
Figure 2-23 . Ordered phase in N4Mo alloy [ 18] . . . . . . . . . . . . . . . . . . . . . . . . . . . . . . . . . . . . . . . . . . . . . . . . . 36
Figure 2-24. [00 1 ] electron diffraction pattern fonn a Ni-20 at.% Mo alloy [47]. ....................... .. . . .... . . . ............... . . . ........ ....... ............... 37
Figure 2-25. Comparative behavior of several nickel-base alloys in pure H2S04 [ 49] . . . . . . . . . . . . . . . . . . . . . . . . . . . . . . . . . . . . . . . . . . . . . . . . . . . . . . . . . . . . . . . . . . . . . . . . . . . . . . . 39
Figure 2-26. Comparative isocorrosion plots of various nickel-base alloys in hydrochloric solution [ 49]. . . . . . . . . . . . . . . . . . . . . . . . . . . . . . . . . . . . . . . . . . . . . . . . . 40
XV

Figure 3-1 . Samples sealed i n a quartz tube and ready for a heat treatment.. . . . . . 43
Figure 3-2. (a) Schematic diagram of the three-point bending-fixture used to initiate cracking, (b) The real bending-fixture . . . . . . . . . . . . . . . . . . . . . . . 49
Figure 3-3 . (a) The specimen was deformed into the U shape with a designed fixture, (b) Schematic diagram of the U-bend
ki . .
test wor ng ctrcutt . . . . . . . . . . . . . . . . . . . . . . . . . . . . . . . . . . . . . . . . . . . . . . . . . . . . . . . . . . . . . . . . . . . . . . . . . . . 55
Figure 3-4. (a) Schematic diagram of electrochemical polarization cell, (b) Schematic diagram of the electrochemical polarization working circuit.. . . . . . . . . . . . . . . . . . . . . . . . . . . . . . . . . . . . . . . . . . . . . . . . . . . . . . . . . . . . . . . . . . . . . . . . . . . . . ... . 57
Figure 4-1 . The hardness as a function of aluminum content in as-cast condition, aged at 650°C and 750°C without solution heat treatment and homogenization treatment at 1250°C . . . . . . . . . . . . . . . . . . . . . . . . 60
Figure 4-2. The hardness as a function of aging at 650°C and 750°C for 100 hours in the as-cast condition (without homogenization treatment) and solution heat treatment at 1250°C for 50 hours with different aluminum content. . . . . . . . . . . . . . . . . . . . . . . . . . . . . . . . . . . . . . . . . . . . . . . . . . . . . . 6 1
Figure 4-3. The hardness as a function of aluminum content at different aging temperature for 100 hours (solution heat treated at 1280°C for 50 hours), and solution heat treated at 1250°C for 50 hours .......................................................................... .............. .... 63
Figure 4-4. The hardness as a function of aluminum content aged at 750°C for different times . . ..... . . . . . . . . . . . . .. . . . . .. .. . . . . . . . . . .. . . ... .. . . . . . . . . . . . . . .... . . 64
Figure 4-5. Hardness as a function of aging temperature for 1 00 hours in samples with different aluminum contents. . . . . . . . . . . . . . . . . . . . . . . . . 66
Figure 4-6. Hardness as a function of aging time at 750°C with different aluminum contents. . . . . . . . . . . . . . . . . . . . . . . . . . . . . . . . . . . . . . . . . . . . . . . . . . . . . . . . . . . . . 67
Figure 4-7. OLM microstructure ofNi4Mo alloy (as-received condition) aged at 750°C for 100 hours showing � recrystallization and � phase . . . . . . . . . . . . . . . . . . . . . . . . . . . . . . . . . . . . . . . . . . . . . . . . . . . . . . . . . . . . 70
Figure 4-8. OLM microstructure of 2 at.% AI alloy in as-cast condition (no homogenization) aged at 750°C for 100 hours showing dendritic structure at low magnification. . . . . . . . . . . . . . . . . . . . . . . . . . . . . . . . . . . . . . . . . . 70
XV1

Figure 4-9. OLM microstructure of 9 at.% AI alloy in as-cast condition (no homogenization) aged at 750°C for 100 hours showing dendirtic structure at low magnification . . . . . . . . . . . . . . . . . . . . . . . . . . . . . . . . . . . . . . . . . . . 7 1
Figure 4-10. OLM microstructure of2 at.% AI alloy in as-cast condition (no homogenization) aged at 750°C for 100 hours showing coarse lamellar structure . . . . . . . . . . . . . . . . . . . . . . . . . . . . . . . . . . . . . . . . . . . . . . . . . . . . . . . . . . . . . . . . . . . . . . . . . . . . . 7 1
Figure 4-1 1 . OLM microstructure of 5 at.% AI alloy in as-cast condition (no homogenization) aged at 750°C for 100 hours showing dark and bright regions. . . . . . . . . . . . . . . . . . . . . . . . . . . . . . . . . . . . . . . . . . . . . . . . . . . . . . . . . . . . . . . . . . . . . . 72
Figure 4-12. OLM microstructure of 7 at.% AI alloy in as-cast condition (no homogenization) aged at 750°C for 100 hours showing dark and bright regions. . . . . . . . . . . . . . . . . . . . . . . . . . . . . . . . . . . . . . . . . . . . . . . . . . . . . . . . . . . . . . . . . . . . . . 72
Figure 4-13 . OLM microstructure of 9 at.% AI alloy in as-cast condition (no homogenization) aged at 750°C for 100 hours showing lamellar structure, dark and bright regions . . . . . . . . . . . . . . . . . . . . . . . . . . . . . . . . . . . . . . . . 73
Figure 4-14. OLM microstructure ofNi�o alloy at as-received condition (hot forged) single a phase with annealing twins . . . . . . . . . . . . . 73
Figure 4-15 . OLM microstructure ofNi4Mo alloy homogenized at 1250°C for 50 hours showing single a phase with annealing twins .......... ........................ . ....................... ....... . . .... . ...... .......... . .. ...... 75
Figure 4-16. Ni-Mo-Al ternary alloy phase diagram at 1260°C [65]. . . . . . . . . . . . . . . . . . . 76
Figure 4-1 7. OLM microstructure of2 at.% AI alloy homogenized at 1250°C for 50 hours showing single a phase with annealing twins . . . . . . . . . . . . . . . . . . . . . . . . . . . . . . . . . . . . . . . . . . . . . . . . . . . . . . . . . . . . . . . . . . . . . . . . . . . . . . . . . . . . . . . . . . . . . . . . . 77
Figure 4-1 8. OLM microstructure of 5 at.% AI alloy homogenized at 1250°C for 50 hours showing single a phase with annealing twins . . . . . . . . . . . . . . . . . . . . . . . . . . . . . . . . . . . . . . . . . . . . . . . . . . . . . . . . . . . . . . . . . . . . . . . . . . . . . . . . . . . . . . . . . . . . . . . . 77
Figure 4-19. OLM microstructure of 7 at.% AI alloy homogenized at 1250°C for 50 hours showing single a. phase with annealing twins . . . . . . . . . . . . . . . . . . . . . . . . . . . . . . . . . . . . . . . . . . . . . . . . . . . . . . . . . . . . . . . . . . .. . . . . . . . . . . . . . . . . . . . . . . . . . . . . . 78
XVII

Figure 4-20. OLM microstructure of 9 at.% AI alloy homogenized at 1250°C for SO hours showing particles along
. b d . d . . gram oun anes an m matnx. . . . . . . . . . . . . . . . . . . . . . . . . . . . . . . . . . . . . . . . . . . . . . . . . . . . . . . . . . 78
Figure 4-21 . OLM microstructure of2 at.% AI alloy aged at 600 °C for 100 hours showing single a phase . . . . . . . . . . . . . . . . . .. . . . . . . . . . . . . . . . . . . . . . . . . . . . . . . . . . 80
Figure 4-22. OLM microstructure of 5 at.% AI alloy aged at 600 °C for 1 00 hours showing single a phase . . . . . . . . . . . . . . . . . . . . . . . . . . . . . . . . . . . . . . . . . . . . . . . . . . . 80
Figure 4-23. OLM microstructure of 7 at.% AI alloy aged at 600°C for 100 hours showing grain boundary migration and secondary phase starting to form along the grain boundaries, (a) 200X, (b) 400 X . . . . . . . . . . . . . . . . . . . . . . . . . . . . . . . . . . . . . . . . . . . . . . . . . . . . . . . . . . . . . . . . . . . . . . . . . . . . . . . . . . . . . . . . . . 8 1
Figure 4-24. OLM microstructure of 9 at.% AI alloy aged at 600°C for 100 hours showing lamellar structure, particles and grain boundaries migration, (a) 400X, (b) 1 OOOX. . . . . . . . . . . . . . . . . . . . . . . . . . . . . . . . . . . . . . 82
Figure 4-25. OLM microstructure ofNi4Mo alloy aged at 650°C for 1 00 hours showing � domain phase formation along the primary grain boundaries. . . . . . . . . . . . . . . . . . . . . . . . . . . . . . . . . . . . . . . . . . . . . . . . . . . . . . . . . . . . . . . . . . 85
Figure 4-26. OLM microstructure of 2 at.% AI alloy aged at 650°C for 1 00 hours showing shingle phase with intergranular cracking. . . . . . . . . . 85
Figure 4-27. OLM microstructure of 5 at.% AI alloy aged at 650°C for 1 00 hours showing lamellar structure with intergranular cracking. . . . . . . . . . . .. . . . . . . . . . . . .. . . .. . . . . . . . . . . . . . . . . . . . . . . . . . . . . . . . . . . . . . . . . . . . . . . . . . . . . . . . . . . . . . . . 86
Figure 4-28. OLM microstructure of 7 at.% AI alloy aged at 650°C for 100 hours showing grain boundary migration with secondary phases nucleated along the grain boundaries and grains. . . . . . . . . . . . . . . . . . . 86
Figure 4-29. Ni-Mo-Al ternary alloy phase diagram at 700°C [65]. . . . . . . . . . . . . . . . . . . . . 88
Figure 4-30. OLM microstructure of2 at.% AI alloy aged at 700°C for 1 00 hours showing single phase with intergranular cracking. . . . . . . . . . . . 89
Figure 4-3 1 . OLM microstructure of 5 at.% AI alloy aged at 700°C for 100 hours showing lamellar structure. . . . . . . . . . . . . . . . . . . . . . . . . . .. . . . . . . . . . . . . . . . . . . . 89
XVIII

Figure 4-32. OLM microstructure of 7 at.% AI alloy aged at 700°C for 100 hours showing phase transformation along grain boundaries . . . . . . . . . . . . . . . . . . . . . . . . . . . . . . . . . . . . . . . . . . . . . . . . . . . . . . . . . . . . . . . . . . . . . . . . . . . . . . . . . . . . . . . . . 90
Figure 4-33. OLM microstructure of9 at.% AI alloy aged at 700°C for 100 hours showing (a) particles precipitation, (b) lamellar structure with particles . . . . . . . . . . . . . . . . . . . . . . . . . . . . . . . . . . . . . . . . . . . . . . . . . . . . . . . . . . . . . . . . . . . . . 91
Figure 4-34. OLM microstructure ofNi4Mo alloy aged at 750°C for 1 0 hours showing Widmanstatten pattern � phase. . . . . . . . . . . . . . . . . . . . . . . . . . 93
Figure 4-35. OLM microstructure of 2 at.% AI alloy aged at 750°C for 1 0 hours showing single <X phase. . . . . . . . . . . . . . . . . . . . . . . . . . . . . . . . . . . . . . . . . . . . . . . . . . . . . . 93
Figure 4-36. OLM microstructure of 5 at.% AI alloy aged at 750°C for 10 hours showing lamellar structure with intergranular cracking . . . . . . . . . . 94
Figure 4-37. OLM microstructure of 7 at.% AI alloy aged at 750°C for 1 0 hours showing grain boundary migration and phase transformation along the grain boundaries . . . . . . . . . . . . . . . . . . . . . . . . . . . . . . . . . . ... . . . 94
Figure 4-38. OLM microstructure ofNi4Mo alloy aged at 750°C for 50 hours showing Widmanstatten pattern � and grain boundary migration. . . . . . . . . . . . . . . . . . . . . . . . . . . . . . . . . . . . . . . . . . . . . . . . . . . . . . . . . . . . . . . . . . . . . . . . . . . . . . . . . . . . . . . . . . . 95
Figure 4-39. OLM microstructure of2 at.% AI alloy aged at 750°C for 50 hours showing phase transformation along the grain boundaries. . . . . . . . . . . . . . . . . . . . . . . . . . . . . . . . . . . . . . . . . . . . . . . . . . . . . . . . . . . . . . . . . . . . . . . . . . . . . . . . . . . . . . . . . 97
Figure 4-40. OLM microstructure of 5 at.% AI alloy aged at 750°C for 50 hours showing lamellar structure. . . . . . . . . . . . . . . . . . . . . . . . . . . . . . . . . . . . . . . . . . . . . . . . . 97
Figure 4-41 . OLM microstructure of 7 at.% AI alloy aged at 750°C for 50 hours showing lamellar structure formation along the grain boundaries. . . . . . . . . . . . . . . . . . . . . . . . . . . . . . . . . . . . . . . . . . . . . . . . . . . . . . . . . . . . . . . . . . . . . . . . . . 98
Figure 4-42. OLM microstructure ofNi4Mo alloy aged at 750°C for 100 hours showing (a) widmanstatten pattern � phase and coarse � associated with grain boundary migration, (b) coarse � along grain boundaries, (c) Widmanstatten pattern
� phase . . . . . . . . . . . . . . . . . . . . . . . . . . . . . . . . . . . . . . . . . . . . . . . . . . . . . . . . . . . . . . . . . . . . . . . . . . . . . . . . . . . . . . . . . . . . . 98
XIX

Figure 4-43. OLM microstructure of 2 at.% AI alloy aged at 750°C for 100 hours showing (a) single phase with annealing twins, (b) high magnification of secondary phases formation . . . . . . . . . . . . . . . . . . . . 100
Figure 4-44. OLM microstructure of 5 at.% AI alloy aged at 750°C for 100 hours showing (a) lamellar structure, (b) coarsening lamellar structure formed along grain boundaries. . . . . . . . . . . . . . . . . . . . . . . . . . . . . . 1 02
Figure 4-45. OLM microstructure of 7 at. % AI alloy aged at 750°C for 1 00 hours showing (a) lamellar structure formation along grain boundaries, (b) coarse structure starting to form along grain boundaries. . . . . . . . . . . . . . . . . . . . . . . . . . . . . . . . . . . . . . . . . . . . . . . . . . . . . . . . . . . . . . . . . . . . . . . . . . . . . . . . 1 03
Figure 4-46. OLM microstructure of 9 at.% AI alloy aged at 750°C for 100 hours showing (a) lamellar structure nucleating inside of grains, (b) high magnification oflamellar structure and particles along grain boundaries. . . . . . . . . . . . . . . . . . . . . . . . . . . . . . . . . . . . . . . . . . . . . . . . . . . . . . 104
Figure 4-47 Ni-Mo-AI ternary alloy phase diagram at 800°C [65]. . . . . . . .. . . . . . . . . . . . . 1 05
Figure 4-48. OLM microstructure of 2 at.% AI alloy aged at 850°C for 1 00 hours showing (a) striation line along the grain boundaries, (b) coarse lamellar structure and fine striation structure. . . . . . . . . . . . . . . . . . . . . . . . . . . . . . . . . . . . . . . . . . . . . . . . . . . . . . . . . . . . . . . . . . . . . . . . . . . . . . . . . . . . . . . . . . . . 1 07
Figure 4-49. OLM microstructure of 5 at.% AI alloy aged at 850°C for 1 00 hours showing needle-like structure. . . . . . . . . . . . . . . . . . . . . . . . . . . . . . . . . . . . . . . . . . 1 08
Figure 4-50. OLM microstructure of 7 at.% AI alloy aged at 850°C for 100 hours showing needle-like structure. . . . . . . . . . . . . . . . . . . . . . . . . . . . . . . . . . . . . . . . . . I 08
Figure 4-5 1 . Ni-Mo-AI ternary alloy phase diagram at 950°C [65] . . . . . . . . . . . . . . . . . . . . . 109
Figure 4-52. OLM microstructure of 2 at.% AI alloy aged at 950°C for 100 hours showing single phase and particles along grain boundaries. . . . . . . . . . . . . . . . . . . . . . . . . . . . . . . . . . . . . . . . . . . . . . . . . . . . . . . . . . . . . . . . . . . . . . . . . . . . . . . . . . . . . . . . . 1 1 0
Figure 4-53. OLM microstructure of 5 at.% AI alloy aged at 950°C for 1 00 hours showing needle-like structure and particles along the grain boundaries, (a) 400X (b) lOOOX. . . . . . . . . . . . . . . . . . . . . . . . . . . . . . . . . . . . . . . . 1 1 1

Figure 4-54 OLM microstructure of 7 at.% AI alloy aging at 950°C for 100 hours showing needle-like precipitates and particles along the grain boundaries, (a) 400X (b) 1 OOOX... . . . . . ... . . . . . . . . . . . .. . .. . . . . 1 13
Figure 4-55. (a) SEM microstructure (BSE) in Ni4Mo alloy in hot forged condition showing single a phase with particles, (b) EDS analysis from A point for matrix. The ratio ofNi to Mo is 1 .9, (c) EDS analysis from B point for black particles, (d) EDS analysis from C point for black particles (bright particles in SE) . . . . . . . . . . . . . . . . . . . . . . . . . . . . . . . . . . . . . . . . . . . . . . . . . . . . . . . . . . . . . . . . . . . . . . . . . . . . . . . . . 1 1 7
Figure 4-56. (a) SEM microstructure (BSE) ofN4Mo alloy aged at 800°C for 10 minutes showing 8 phase particles and J3 phase, (b) EDS analysis from A point for bright particles .. .. . ........ . .. .. . . ... .. . ... . . . 1 19
Figure 4-57. (a) SEM microstructure (SE) ofNi4Mo alloy (hot forged) aged at 750°C for 100 hours showing J3 phase J3 phase recrystallization, (b) EDS analysis from A point (particles), (c) J3 domains .. . . . .. ... . . . . . . . .. . . .. . . . ... . . .. . . . ... . . .... ....... . . . . ..... . .. ... . . . ... . . . . .. . ... . 121
Figure 4-58. (a) SEM microstructure (SE) of2 at.% AI alloy in as-cast condition (without homogenization) aged at 750°C for 100 hours showing two phase structure (see arrow), (b) EDS analysis from bright particles, (c) EDS analysis from matrix . .... . . . .. . . . . . .... . . ... . . . . ... . ... . . .. ... .... . ... . . . . . ........... . . . .. . ... .. . .. ...... . . . ... . . . . 122
Figure 4-59. SEM microstructure (BSE) of 5 at.% AI alloy in as-cast condition (without homogenization) aged at 750°C for 100 hours showing precipitates, lamellar structure and single a phase, (a) low magnification, (b) high magnification, (c) EDS analysis form single phase, (d) EDS analysis from bright area ..................... .... . . ..... . .... . . . ...... . . .... . . . .... . . .. . . . ....... . . . . . . .. . . . . . ..... . . . .. . . . . 124
Figure 4-60. SEM microstructure (SE) of 7 at.% AI alloy in as-cast condition (without homogenization) aged at 750°C for 1 00 hours showing, (a) lamellar structure (arrow B) with flower-like structure (arrow A), (b) lamellar structure, (c) EDS analysis from flower-like structure, (d) EDS analysis from lamellar structure. . . . . . . . . . . . . . . . . . . . . . . . . . . . . . . . . . . . . . . . . . . . . . . . . . . . . . . . . . . . . . . . . . . . . . . . . . . . . . 127
XXI

Figure 4-6 1 . (a) SEM microstructure (SE) of 9 at.% AI alloy i n as-cast condition (without homogenization) aged at 750°C for 100 hours showing lamellar structure with bright precipitates, (b) EDS analysis from bright precipitates, (c) EDS analysis from coarse structure . . . .... . . . . ... . . .. . . . . . . . . . .. . ... ... . . . .... .. .. .. . ... . . . .. . . . ... . . . ... ..... . . ... . 1 29
Figure 4-62. (a) SEM microstructure (SE) of9 at.% AI alloy solution treated at 1250°C for 50 hours showing Mo-rich precipitates along grain boundaries and in matrix, (b) EDS analysis from particles, (c) EDS analysis from matrix .. . . . ... . . . . . ... . . . . ... . .. . . . .. . . . . . . . . . .. . . 1 30
Figure 4-63. SEM microstructure (SE) of7 at.% AI alloy aged at 600°C for 100 hours showing (a) grain boundaries migration and secondary phase formation along grain boundaries, (b) high magnification of grain boundary migration and secondary phase formation along grain boundaries, (c) EDS analysis from matrix, (d) EDS analysis from striation line . . . ... . . . . . . . . . 1 33
Figure 4-64. SEM microstructure (SE) of9 at.% AI alloy solution treated at 1280°C for 50 hours and aged at 600°C for 100 hours showing (a) lamellar structure with precipitates, (b) high mignificationlamellar structure, (c) EDS analysis from particles, (d) EDS analysis from striation line of lamellar structure, (e) EDS analysis from dark lamellar structure. . . . . . . . . . . . . . . . . . . . . . . . . . . . . . . . . . . . . . . . . . . . . . . . 135
Figure 4-65. (a) SEM microstructure (BSE) ofNi4Mo alloy solution treated at 1280°C for 50 hours and aged at 650°C for 1 00 hours showing 13 domain phase along the grain boundaries, (b) EDS analysis from particles in domain region, (c) EDS analysis from matrix, (d) EDS analysis from beside particles . ... . . . . . . 139
Figure 4-66. SEM microstructure (SE) of7 at.% AI alloy solution treated at 1280°C for 50 hours and aged at 650°C for 100 hours showing (a) secondary phase formation along grain boundaries, (b) high magnification lamellar structure. . . . . . . . . . . . . . . . . . . . . . . 141
Figure 4-6 7. SEM microstructure (SE) of9 at.% AI alloy solution treated at 1280°C for 50 hours and aged at 600°C for 1 00 hours showing (a) high magnification of lamellar structure, (b) and (c) high magnification of coarse lamellar structure and fine lamellar structure. . . . . . . . . . . . . . . . . . . . . . . . . . . . . . . . . . . . . . . . . . . . . . . . . . . . . . . . . . . . . . . . . . . . . . . . . . . . . . 142
XXlJ.

Figure 4-68. SEM microstructure (SE) ofNi4Mo alloy solution treated at 1280°C for 50 hours and aged at 750°C for 100 hours showing grain boundary migration . . . . . . . . . . . . . . . . . . . . . . . . . . . . . . . . . . . . . . . . . . 145
Figure 4-69. SEM microstructure (SE) ofNi4Mo alloy solution treated at 1280°C for 50 hours and at 750°C for 100 hours showing (a) p Widmanstatten pattern and � domains along migrated grain boundaries, (b) high magnification of � phase. . . . . . . . . . . . . . . . . . . . . . . . . . . . . . . . . 146
Figure 4-70. SEM microstructure (SE) of2 at.% AI alloy solution treated at 1280°C for 50 hours and aged at 750°C for 50 hours showing (a) coarsen grain boundaries, (b) precipitates in matrix. . . . . . . . . . . . . . . . . . . . . . . . . . . . . . . . . . . . . . . . . . . . . . . . . . . . . . . . . . . . . . . . . . . . . . . . 147
Figure 4-7 1 . (a) SEM microstructure (SE) of 2 at.% AI alloy solution treated at 1280°C for 50 hours and aged at 750°C for 1 00 hours showing precipitates in matrix, (b) EDS analysis from particles along grain boundaries. . . . . . . . . . . . . . . . . . . . . . . . . . . . . . . . . . . . . . . . . . . . . . . 148
Figure 4-72. SEM microstructure (SE) of 5 at.% AI alloy solution treated at 1280°C for 50 hours and aged at 750°C for 100 hours showing (a) coarse grain boundaries and lamellar structure, (b) high magnification of coarse grain boundary structure. . . . . . . . . . . . . . . . . . . . . . . . . . . . . . . . . . . . . . . . . . . . . . . . . . . . . . . . . . . . . . . . . . . . . . . . . . . . . . . . . . . . . . . . . . . . 149
Figure 4-73. SEM microstructure (SE) of 7 at.% AI alloy solution treated at 1280°C for 50 hours and aged at 750°C for 100 hours showing lamellar structure. . . . . . . . . . . . . . . . . . . . . . . . . . . . . . . . . . . . . . . . . . . . . . . . . . . . . . 1 5 1
Figure 4-74. SEM microstructure (SE) of2 at.% AI alloy solution treated at 1280°C for 50 hours and aged at 850°C for I 00 hours showing (a) striation lines and particles, (b) particles across the striation lines, (c) EDS analysis from the particles, (d) coarse lamellar structure.. .. . . . . . . . . . . . . . . . . . . . . . . . . . . . . . . . . . . . . . . . . . . . . . . . . . . . . . . . . . . . . . . . 1 5 1
Figure 4-75. SEM microstructure (SE) of 5 at.% AI alloy solution treated at 1280°C for 50 hours and aged at 850°C for 100 hours showing (a) needle-like structure, (b) high magnification of needle-like structure, (c) EDS analysis from the lath, (d) EDS analysis from the matrix, (e) EDS analysis from the particles along grain boundaries. . . . . . . . . . . . . . . . . . . . . . . . . . . 1 53
XXlll

Figure 4-76. SEM microstructure of 7 at.% AI alloy solution treated at 1280°C for 50 hours and aged at 850°C for 1 00 hours showing coarse grain boundary particles and needle-like structure. . . . . . . . . . . . . . . . . . . . . . . . . . . . . . . . . . . . . . . . . . . . . . . . . . . . . . . . . . . . . . . . . . . . . . . . . . 1 57
Figure 4-77. (a) SEM microstructure of2 at.% AI alloy solution treated at 1280°C for 50 hours and aged at 950°C for 1 00 hours showing particles along grain boundaries, (b) EDS analysis from particles along grain boundaries in 2 at.% AI alloy .......................................... ..................... ................................... 157
Figure 4-78. (a) SEM microstructure (SE) of 5 at.% AI alloy solution treated at I280°C for 50 hours and aged at 950°C for 100 hours showing particles along grain boundaries and needle-like structure, (b) EDS analysis from particles along grain boundaries. . . . . . . . . . . . . . . . . . . . . . . . . . . . . . . . . . . . . . . . . . . . . . . . . . . . . . . . . . . . . . . . . . . . . . . . . . . . . . . . 158
Figure 4-79. SEM microstructure of 7 at.% AI alloy solution treated at 1280°C for SO hours and aged at 950°C for 100 hours showing (a) particles and needle-like structure, (b) coarse grain boundary particles and needle-like structure, (c) EDS analysis from particles along the grain boundaries, (d) EDS analysis from matrix. . . . . . . . . . . . . . . . . . . . . . . . . . . . . . . ... . . . . . . . . . . . . . . . . . . . . . . . . . 1 59
Figure 4-80. (a) SEM microstructure (BSE) of7 at.% AI alloy solution treated at 1280°C and aged at 950°C for 100 hours showing sample in the as-polished condition, (b) EDS analysis from darken area, (c) EDS analysis from matrix, (d) EDS analysis from bright particles. . . . . . . . . . . . . . . . . . . . . . . . . . . . . ... . . . . . . . . . . . . . . . . . . . . . . . . . . . 161
Figure 4-8 1 . lntergranular cracking ofNi�o alloy aged at 750°C for 1 00 hours. . . . . . . . . . . . . . . . . . . . . . . . . . . . . . . . . . . . . . . . . . . . . . . . . . . . . . . . . . . . . . . . . . . . . . . . . . ... . . . . . . . . . . . . . 1 68
Figure 4-82. Interface cracking between coarsened (3 phase and
Widmanstatten pattern (3 structure in Ni4Mo alloy aged at
750°C for 100 hours. The arrow indicated the 'Y phase . . . . . . . . . . . . . . . . . . . 1 68
Figure 4-83 . EDS analysis from the bright lath in coarsened (3 region in Ni4Mo alloy.... . . . . . . . . . . . . . . . . . . . . . . . . . . . . . . . . . . . . . . . . . . . . . . . . . . . . . . . . . . . . . . . . .. . . . . . . . . . . . . . . . 169
XXIV

Figure 4-84. The cleavage morphology at grain boundaries between coarsened P and Widmanstatten pattern P structure in Ni4Mo alloy . . . . . . . . . . . . . . . . . . . . . . . . . . . . . . . . . . . . . . . . . . . . . . . . . . . . . . . . . . . . . . . . . . . . . . . . . . . . . . . . . . . . . 169
Figure 4-85. Molybdenum segregated along grain boundaries in Ni4Mo alloy . . . . . 170
Figure 4-86. Intergranular cracking in 2 at.% AJ alloy aged at 750°C for I 00 hours. . . . . . . . . . . . . . . . . . . . . . . . . . . . . . . . . . . . . . . . . . . . . . . . . . . . . . . . . . . . . . . . . . . . . . . . . . . . . . . . . . . . . . . . . . I72
Figure 4-87. Fracture morphology of 2 at.% AI alloy aged at 750°C for 100 hours.. . . . . . . . . . . . . . . . . . . . . . . . . . . . . . . . . . . . . . . . . . . . . . . . . . . . . . . . . . . . . . . . . . . . . . . . . . . . . . . . . . . . . . . . . 172
Figure 4-88. EDS analysis from particles in 2 at.% A1 alloy . . . . . . . . . . . . . . . . . . . . . . . . . . . . . . . . 1 73
Figure 4-89. Intergranular dimple morphology in 2 at.% AI alloy aged at 750°C for 100 hours. . ... . ... . . . . ... . . . . . . .. . . . . . . . . . . . . . . . . . . . . . . . . . .. . . . . . . . . . . . . . . . . . . . . . . 1 73
Figure 4-90. Intergranular cracking in 5 at.% AI alloy aged at 750°C for 100 hours. . . . . ... . ... . . . .. . . .. . . . . . . . . . . . . . . . . . . . . . . . . . . ... . . . . .. . . . . . . . . . . . . . . . . . 174
Figure 4-91 . The fracture surface of 5 at.% AI alloy aged at 750°C for 100 hours . . . . . . . . . . . . . . . . . . . . . . . . . . . . . . . . . . . . . . . . . . . . . . . . . . . . . ... . . . . . . . . . . . . . . . . . . . . . . . . . . . . . . . . . . 174
Figure 4-92. Secondary cracking along the lamellar plates and interface between lamellar structure and coarsened structure. . . . . . . . . . . . . . . . . . . . . . . . . 175
Figure 4-93 . The fracture surface of 5 at.% AI alloy aged at 750°C for I 00 hours. . . . . . . . . . . . . . . . . . . . . . . . . . . . . . . . . . . . . . . . . . . . . . . . . . . . . . . . . . . ... . . . . . . . . . . . . . . . . . . . . . . . . . . . . 175
Figure 4-94. The fracture surface of 5 at.% AI alloy aged at 750°C for I 00 hours in high magnification. . . . . ... . . . .. ... . . . . . . . . . . . . . . . . . . . . . . . . .. . .. . . . . . . . . . . . 1 76
Figure 4-95. Intergranular and transgranular cracking in 7 at.% AI alloy aged at 750°C for 100 hours. . . . . . . . . . . . . . . . . . . . . . . . . . . .... . . . . . . . . . . . . . . . . . . . . . . . . . . . . . . 178
Figure 4-96. Transgranular cracking along the lamellar plates and interface between lamellar structure and a matrix in 7 at.% AI alloy... . . . . . . . . . . . . . . ...... ... . . . . . . . . . ... . . . . . . . . . . . . . . . . . . . . . . . . . . .. . . . . . . . . . . . ... . . .. . . . . . . . . . 178
Figure 4-97. Intergranular cracking along the coarse structure and grain boundaries in 7 at.% AI alloy. . . . . . . . . . . . . . . . . . .. .. . . . . . . . . . . . . . .. . . . . . . . . . . . . . . . . . . . . . . 179
Figure 4-98. Dimple fracture morphology in a matrix in 7 at.% AI alloy. . . . . . . . . . . . 179
XXV

Figure 4-99. (a) Intergranular cracking in 9 at.% AI alloy aged at 750°C for 100 hours, (b) Transgranular cracking in 9 at.% AI alloy aged at 7S0°C for 100 hours . . . . . . . . . . . . . . . . . . . . . . . . . . . . . . . . . . . . . . . . . . . . . . . . . . . . . . . . . . . . . 1 80
Figure 4-100. The fracture morphology (SE) of9 at.% AI alloy aged at 7S0°C for I 00 hours. . . . . . . . . . . . . . . . . . . . . . . . . . . . . . . . . . . . . . . . . . . . . . . . . . . . . . . . . . . . . . . . . . . . . . . . . 18 1
Figure 4-10 1 . Backscattered electron image of9 at.% AI alloy aged at 750°C for 100 hours . . . . . . . . . . . . . . . . . . . . . . . . . . . .. . .. . . . . . . . . . . . . . . . . . . . . . . . . . . . . . . . . . . . . . . . . . 1 8 1
Figure 4-102. ED S analysis from bright area showing Mo-rich plates in 9 at.% AI alloy. . . . . . . . . . . . . . . . . . . . . . . . . .. . . . . . . . . . . . . . . . . . . . . . .. . . . . . . . . . . . . . . . . . 1 82
Figure 4-103. EDS analysis from darken area showing Ni-rich plates in 9 at.% AI alloy . . . . . . . . . . . . . . . . . . . . . . . . . . . . . . . . . . . . . . . . . . . . . . . . . . . . . . . . . . . . . . . . . . . 1 82
Figure 4-104. (a) Schematic diagram of the [001] zone axis electron diffraction pattern for a, �. D022, NbMo, and y structure,
(b) Schematic electron diffraction ofy structure . . . . . . . . . . . . . . . . . . . . . . . . . . . . . . . 1 8S
Figure 4-1 0S. Schematic diagram of [1 12] zone axis electron diffraction pattern for a, �. D022. Ni2Mo, and y structure. . . . . . . . . . . . . . . . . . . . . . . . . . . . . 1 87
Figure 4-1 06. Schematic diffraction patterns showing the location of maxima for the fcc fundamental lattice and the �· DOn,
NhMo and y' superlattices, (a) [001] zone, (b) [ 1 1 2] zone . . . . . . . . . . . . . 1 88
Figure 4-107. TEM microstructure ofNi4Mo alloy solution treated at 1 250°C for SO hours, (a) SRO a phase with dislocations pile-ups at grain boundary, (b) corresponding different pattern at [001 ] zone, (c) [1 12] zone. . . . . . . . . . . . . . . . . . . . . . . . . . . . . . . . . . . . . . . . . . . . . . . 1 90
Figure 4-1 08. TEM microstructure 2 at.% AI alloy solution treated at 1 250°C for SO hours, (a) D022 precipitates in SRO a phase matrix, and dislocation pile-ups at grain boundary and stacking faults, (b) corresponding the [001] zone diffraction pattern. . . . . . . . . . . . . . . . . . . . . . . . . . . . . . . . . . . . . . . . . . . . . . . . . . . . . . . . . . . . . . . . . . . . . . . . . . . . . . . . . . . . . . . . . . . . . 1 9 1
Figure 4-109. TEM microstructure of2 at.% AI alloy solution treatment at 1250°C for 20 minutes, (a) [1 12] zone diffraction pattern showing SRO a. superlattice spots, (b) and (c) SRO a phase and dense dislocation. . . . . . . . . . . . . . . . . . . . . . . . . . . . . . . . . . . . . . . . . . . . . . . . . . . . . . . . . . . . . . . . . . . . . . . . 1 92
XXVI

Figure 4-1 10. TEM microstructure of S at.% AI alloy solution treated at 1250°C for 50 hours, (a) ( 1 12] zone diffraction pattern showing D022 superlattice spots, (b) corresponding microstructure and stacking faults. . . . . . . . . . . . . . . . . . . . . . . . . . . . . . . . . . . . . . . . . . . . . . . . . . . . 1 94
Figure 4-1 1 1 . TEM microstructure of 7 at.% AI alloy solution treated at 1250°C for SO hours, (a) and (b) (00 1] and [ 1 12] zone diffraction pattern showing D022 and NhMo superlattice spots, (c) corresponding microstructure of [ 1 12]zone showing uniform D022 and NhMo phases. . . . . . . . . . . . . . . . . . . . . . . . . . . . . . . . . . . . . 195
Figure 4-1 12. TEM microstructure of 9 at.% AI alloy solution treated at 1250°C for 50 hours, (a) [ 1 12] zone diffraction pattern showing D022 and NhMo superlattice spots, (b) corresponding microstructure, (c) particles and stacking faults in matrix.. . . . . . . . . . . . . . . . . . . . . . . . . . . . . . . . . . . . . . . . . . . . . . . . . . . . . . . . . . . . . . . . . . . 196
Figure 4-1 13 . TEM microstructure of 2 at.% AI alloy aged at 600°C for 1 00 hours, (a) (001 ] zone diffraction pattern showing SRO a.,
LRO fi and DOn superlattice spots, (b) [ 1 12] zone diffraction pattern showing SRO a., Ji and DOn superlattice spots, (c) corresponding microstructure of [ 1 12] zone diffraction pattern. . . . . . . . . . . . . . . . . . . . . . . . . . . . . . . . . . . . . . . . . . . . . . . . . . . . . . . . . . . . . . . . . . . . 1 98
Figure 4-1 14. TEM microstructure of 5 at.% AI alloy aged at 600°C for 1 00 hours, (a) DOn phase, (b) corresponding (001 ] zone diffraction pattern . . . . . . . . . . . . . . . . . . . . . . . . . . . . . . . . . . . . . . . . . . . . . . . . . . . . . . . . . . . . . . . . . . . . . . . . . . . . . 200
Figure 4-1 1 S. TEM microstructure of 7 at.% AI alloy aged at 600°C for 100 hours, (a) [ 1 12] zone diffraction pattern showing D022 and NhMo superlattice spots, (b) corresponding microstructure of D022 and NhMo phase. . . . . . . . . . . . . . . . . . . . . . . . . . . . . . . . . . . . . . 200
Figure 4-1 16. TEM microstructure of 9 at.% AI alloy aged at 600°C for 100 hours, (a) microstructure ofD022 and Ni2Mo phase, (b) corresponding [ 1 1 2] zone diffraction pattern. . . . . . . . . . . . . . . . . . . . . . . . . . . . . 20 I
Figure 4-1 17. TEM microstructure of Ni4Mo alloy aged at 650°C for 1 00 hours, (a) [ 1 12] zone diffraction pattern showing Ji superlattice spots, (b) corresponding microstructure of � phase . . . . . . . . . . . . . . . . . . . . . . . . . . . . . . . . . . . . . . . . . . . . . . . . . . . . . . . . . . . . . . . . . . . . . . . . . . . . . . . . . . . . . . . . . . . . . . . . . 203
XXVII

Figure 4-1 1 8. TEM microstructure of 2 at.% AI alloy aged at 650°C for I 00 hours, (a) microstructure of D022 and NhMo phase, (b) corresponding [321] zone diffraction pattern. . . . . . . . . . . . . . . . . . . . . . . . . . . . . 203
Figure 4-1 19. TEM microstructure of 5 at.% AI alloy aged at 650°C for 100 hours, (a) [1 12] zone diffraction pattern showing strong intensity DOn and weak intensity Ni2Mo, (b) corresponding microstructure ofD022 and Ni2Mo phases, (c) lamellar structure. . . . . . . . . . . . . . . . . . . . . . . . . . . . . . . . . . . . . . . . . . . . . . . . . . . . . . . . . . . . . . . . . . . . . . . . . . . . . . . . . . . . . . . . . . . . 205
Figure 4-120. TEM microstructure of 7 at.% AI alloy aged at 650°C for 100 hours, (a) [001] zone diffraction pattern showing D022 and Ni2Mo superlattice spots, (b) corresponding microstructure ofD022 and Ni2Mo phases, (c) lamellar structure, (d) diffraction pattern at c region. . . . . . . . . . . . . . . . . . . . . . . . . . . . . . . . . . . . . 206
Figure 4-12 1 . TEM microstructure ofNi4Mo alloy aged at 750°C for 1 0 hours, (a) [001] diffraction pattern showing � superlattice
spots, (b) � domains stacking faults . . . . . . . . . . . . . . . . . . . . . . . . . . . . . . . . . . . . . . . . . . . . . . . . . 208
Figure 4-122. TEM microstructure of 2 at.% AI alloy aged at 750°C for 10 hours, (a) [001 ] zone diffraction pattern showing SRO a superlattice spots, (b) SRO a phase. . . . . . . . . . . . . . . . . . . . . . . . . . . . . . . . . . . . . . . . . . . . . . . . 209
Figure 4-123 . TEM microstructure of 5 at.% AI alloy aged at 750°C for 10 hours, (a) lamellar structure, (b) diffraction pattern [ 100]y'/[01 1 ]rcc. (c) schematic diffraction pattern [ IOO]'y //(01 1]rcc . . . . . . . . . . . . . . . . . . . . . . . . . . . . . . . . . . . . . . . . . . . . . . . . . . . . . . . . . . . . . . . . . . . . . . . . . . . . . . . . . 2 10
Figure 4-124. TEM microstructure ofNi4Mo alloy aged at 750°C for SO hours, (a) � phase and stacking faults, (b) [001 ] zone
diffraction pattern showing � superlattice spots. . . . . . . . . . . . . . . . . . . . . . . . . . . . . 2 1 1
Figure 4-125. TEM microstructure of 2 at.% AI alloy aged at 750°C for 50 hours, (a) stacking faults and precipitates, (b) [ 1 1 1 ] diffraction pattern showing D022 superlattice spots. . . . . . . . . . . . . . . . . . . . 213
Figure 4-126. TEM microstructure of 5 at.% AI alloy aged at 750°C for 50 hours, (a) and (b) lamellar structure, (c) stacking faults and precipitates. . . . . . . . . . . . . . . . . . . . . . . . . . . . . . . . . . . . . . . . . . . . . . . . . . . . . . . . . . . . . . . . . . . . . . . . . . . . . . . . . . . . . . . 2 14
XXVlll

Figure 4-127. TEM microstructure of 7 at.% AI alloy aged at 750°C for 50 hours, (a) [ 1 12] zone diffraction pattern showing D022 and NhMo superlattice spots, (b) microstructure of D022 and Ni2Mo phase . . . . . . . . . . . . . . . . . . . . . . . . . . . . . . . . . . . . . . . . . . . . . . . . . . . . . . . . . . . . . . . . . . . . . . . . . . . . . 2 1 5
Figure 4-128. TEM microstructure ofNi4Mo alloy aged at 750°C for 100 hours, (a) microstructure of � and Ni2Mo phases, (b) ( 1 12] zone diffraction pattern showing � and NhMo superlattice spots . . . . . . . . . . . . . . . . . . . . . . . . . . . . . . . . . . . . . . . . . . . . . . . . . . . . . . . . . . . . . . . . . . . . . . . . . . . . . 2 1 8
Figure 4-129. TEM microstructure of2 at.% AI alloy aged at 750°C for 100 hours, (a) [ 1 12] zone diffraction pattern showing �. DOn and NhMo superlattice spots, (b) microstructure of 1}, D022 and Ni2Mo phase . . . . . . . . . . . . . . . . . . . . . . . . . . . . . . . . . . . . . . . . . . . . . . . . . . . . . . . . . . . . . . . . . . . 2 17
Figure 4-130. TEM microstructure of 5 at.% AI alloy aged at 750°C for I 00 hours, (a) lamellar structure ofy and y' phases, (b) corresponding diffraction pattern, (c) schematic diffraction pattern, (d) lamellar structure, (e) Ni-rich particles, EDS analysis from lamellar structure (t) A, (g) B, (h) C, (I) 0, G) E, (k) F . . . . . . . . . . . 2 19
Figure 4-13 1 . TEM microstructure of 7 at.% AI alloy aged at 750°C for 100 hours, (a) tweed structure, (b) lamellar structure, (c) [OOI]diffraction pattern showing strong intensity Ni2Mo and y' and weak intensity 0022 superlattice spots . . . . . . . . . . . . . . . . . . . . . . . . . 223
Figure 4-132. TEM microstructure of 9 at.% AI alloy aged at 750°C for 1 00 hours, (a) [ I l l ] diffraction pattern showing 0022 superlattice spots, (b) corresponding microstructure of tweed structure, (c) lamellar structure, (d) [001] diffraction pattern, (t) EDS analysis from the lamellar structure and matrix . . . . . . . . . . . . . . . . . . . . . . . . . . . . . . . . . . . . . . . . . . . . . . . . . . . . . . . . . . . . . . . . . . . . . . . . . . . . . . . . . . . . . . . . . . . . . . . . 224
Figure 4-133. TEM microstructure of2 at.% AI alloy aged at 850°C for 1 00 hours, (a) microstructure of D022, (b) [ 1 12] diffraction pattern showing D022 superlattice spots, (c) dislocations, (d) lamellar structure. . . . . . . . . . . . . . . . . . . . . . . . . . . . . . . . . . . . . . . . . . . . . . . . . . . . . . . . . . . . . . . . . . . . . . . . 227
Figure 4-134. TEM microstructure of 5 at.% AI alloy aged at 850°C for 100 hours, (a) and (b) different shape precipitates and d. I n· ' I t . 't t 229 1s oca on p1 e-ups a prec1p1 a es . . . . . . . . . . . . . . . . . . . . . . . . . . . . . . . . . . . . . . . . . . . . . . . . . .
XXIX

Figure 4-135. TEM microstructure of 5 at.% Al alloy aged at 950°C for 100 hours, (a) lath shape precipitates and dislocation pile-ups at precipitates, (b) [ 1 12] zone diffraction pattern . . . . . . . . . . . . . 23 1
Figure 4-136. TEM microstructure of 7 at.% AI alloy aged at 950°C for 100 hours, (a) and (b) precipitates and dislocations, (c) EDS analysis from matrix (A), (d) from precipitates (B, C), (e) from precipitates (D) . . . . . . . . . . . . . . . . . . . . . . . . . . . . . . . . . . . . . . . . . . . . . . . . . . . . . . . . . . . . . . . . . . 23 1
Figure 4-137. [001] zone diffraction pattern showing intermediate stage of SRO a phase transformation to LRO 13 phase in Hastelloy B2 alloy aged at 550°C for 200 hours . . . . . . . . . . . . . . . . . . . . . . . . . . . . . . . . . . . . . . . . . . . . . . 237
Figure 4-138. TEM microstructure ofHastelloy B2 alloy aged at 550°C for 800 hours, (a) secondary phase precipitates in matrix, (b) corresponding [ 1 12] zone diffraction pattern showing the 13 and 0022 superlattice position . . . . . . . . . . . . . . . . . . . . . . . . . . . . . . . . . . . . . . . . . . . . . . . . . . . . . 237
Figure 4-139. TEM microstructure ofHastelloy B2 alloy aged at 550°C for 1 200 hours, (a) and (b) [00 1 ] and [ 1 1 2] zone diffraction patterns showing D022 and b superlattice spots, (c) corresponding microstructure for [ 1 1 2] zone diffraction pattern showing early stage of striation of plates of 0022 phase . . . . . . . . . . . . . . . . . . . . . . . . . . . . . . . . . . . . . . . . . . . . . . . . . . . . . . . . . . . . . . . . . . . . . . . . . . . . . . . . . . . . . . . . . . . . . . . . . 238
Figure 4-140. TEM microstructure ofHastelloy B2 alloy aged at 650°C for 200 hours, (a) [ 1 1 2] zone diffraction pattern showing D022 and 13 superlattice spots, ( b) corresponding
microstructure showing 0022 phase precipitates in 13 phase matrix . . . . . . . . . . . . . . . . . . . . . . . . . . . . . . . . . . . . . . . . . . . . . . . . . . . . . . . . . . . . . . . . . . . . . . . . . . . . . . . . . . . . . . . . . . . . . . . . 239
Figure 4- 14 1 . TEM microstructure ofHastelloy B2 alloy aged at 650°C for 800 hours, (a) [001] zone diffraction pattern showing diffuse intensity maxima at 0022 and 13 superlattice spots, (b) corresponding microstructure showing D022 phase precipitates in 13 phase matrix, (c) in some regions, the early stage of 0022 phase striation formation. .. . . . . . . . . . . . . . . . . . . . . . . . . . . . . . . . . . . . . . . . . . . . . . . . . . . . . . . . . . . . . . . . . . . . . . . . . . . . . . . . . . . . . . . . 241

Figure 4-142. TEM microstructure ofHastelloy B2 alloy aged at 60°C for 1200 hours, (a) and (b) (00 1] and [ 1 12] zone diffraction patterns showing diffuse intensity maxima at DOn and � superlattice spots, (c) corresponding microstructure at [ 1 12] zone diffraction pattern showing fine D022 and � phases mixture. . . . . . . . . . . . . . . . . . . . . . . . . . . . . . . . . . . . . . . . . . . . . . . . . . . . . . . 242
Figure 4-143. TEM microstructure of Hastelloy B2 alloy aged at 750°C for 200 hours, (a) the lath of DOn phase form in matrix, (b) corresponding ( 1 12] zone diffraction pattern showing D022 and � phases . . . . . . . . . . . . . . . . . . . . . . . . . . . . . . . . . . . . . . . . . . . . . . . . . . . . . . . . . . . . . . . . . . . . . . . . . . . 243
Figure 4-144. TEM microstructure ofHastelloy B2 alloy aged at 750°C for 400 hours, (a) SRO a phase recrystallization at grain boundaries and stacking faults, (b) corresponding [1 12] zone diffraction pattern at recrystallization region showing diffuse intensity at { 1 1/2 0} positions.. . . . . . . . . . . . . . . . . . . . . . . . . . . . . . . . . . . . . . . . . . . 243
Figure 4-145. TEM microstructure ofHastelloy B2 alloy aged at 750°C for 800 hours, (a) [ I l l ] zone diffraction pattern showing DOn superlattice spots, (b) and (c) coarsened microstructure made of lathe and diamond-shape particles. . . . . . . . . . . . . . . . . . . . . . . . . . . . . . . . . . . . . . 244
Figure 4-146. TEM microstructure of Hastelloy B2 alloy aged at 750°C for 1200 hours, (a) lamellar structure formed along grain boundaries, (b) corresponding diffraction pattern. . . . . . . . . . . . . . . . . . . . . . . . . . . . 245
Figure 4-147. TEM microstructure of Hastelloy B2 alloy aged at 850°C for 200 hours, showing dense dislocations . . . . . . . . . . . . . . . . . . . . . . . . . . . . . . . . . . . . . . . . . . . . . 247
Figure 4-148. TEM microstructure of Hastelloy B2 alloy aged at 850°C for 400 hours, (a) select area diffraction pattern at [001 ] zone showing diffuse intensity maxima at { 1 1/2 0} positions, (b) corresponding microstructure showing the SRO a phase formation. . . . . . . . . . . . . . . . . . . . . . . . . . . . . . . . . . . . . . . . . . . . . . . . . . . . . . . . . . . . . . . . . . . . . . . . . . . . . . . . . . . . . . . . . . 247
Figure 4-149. TEM microstructure ofHastelloy B2 alloy aged 850°C for 400 hours, (a) coarse lamellar structure, (B) [001] zone select area diffraction pattern showing the SRO a superlattice spots. . . . . . . . . . . . . . . . . . . . . . . . . . . . . . . . . . . . . . . . . . . . . . . . . . . . . . . . . . . . . . . . . . . . . . . . . . . . . 248

Figure 4-1 50. TEM microstructure ofHastelloy B2 alloy aged at 850°C for 1200 hours, (a) [001 ] zone diffraction pattern showing diffuse intensity maxima at SRO a superlattice spots, (b) corresponding microstructure showing SRO a phase and dislocation pile-ups grain boundary . . . . . . . . . . . . . . . . . . . . . . . . . . . . . . . . 248
Figure 4-15 1 . OLM microstructure ofNi.;Mo alloy showing result of ASTM A262 Practice A. . . . . . . . . . . . . . . . . . . . . . . . . . . . . . . . . . . . . . . . . . . . . . . . . . . . . . . . . . . . . . . . . . . 25 1
Figure 4-1 52. Potentiodynamic anodic polarization curve in Ni4Mo alloy . . . . . . . . . . . . 25 1
Figure 4-1 53. SEM microstructure ofNi.;Mo alloy showing intergranular cracking in U-bend test. . . . . . . . . . . . . . . . . . . . . . . . . . . . . . . . . . . . . . . . . . . . . . . . . . . . . . . . . . . . . . . . . . . . . 253
Figure 4-1 54. Schematic diagram of cyclic polarization curve. . . . . . . . . . . . . . . . . . . . . . . . . . . . . . . . 255
Figure 4-1 55. Cyclic polarization behavior ofNi4Mo alloy in 14% hydrochloric solution upon aging at 750°C for 100 hours . . . . . . . . . . . . . . . 256
Figure 4-1 56. Cyclic polarization behavior of2 at.% AI alloy in 1 4% hydrochloric solution upon aging at 750°C for 1 00 hours . . . . . . . . . . . . . . . 257
Figure 4-1 57. Cyclic polarization behavior of 5 at.% AI alloy in 14% hydrochloric solution upon aging at 750°C for 1 00 hours . . . . . . . . . . . . . . . 258
Figure 4-1 58. Cyclic polarization behavior of7 at.% AI alloy in 14% hydrochloric solution upon aging at 750°C for 1 00 hours . . . . . . . . . . . . . . . 259
Figure 4-1 59. Cyclic polarization behavior of9 at.% AI alloy in 14% hydrochloric solution upon aging at 750°C for 1 00 hours . . . . . . . . . . . . . . . 260
XXXll

CHAPTER I
INTRODUCTION
Nickel-base alloys are one of the most complex and the most widely used group
for our present-day society. They can withstand a wide variety of severe operating
conditions involving corrosion environments, high temperature, high stress, and/or the
combinations of these conditions, and have special, important mechanical and
metallurgical characteristics. nickel-base alloys are used in instruments and control
equipment to measure and regulate electrical characteristics because of their high electrical
resistance. Nickel-base alloys also are used up to the highest homologous temperature of
any common alloy systems. They currently are used in aircraft engines, space vehicles,
nuclear power systems, chemical and petrochemical industries, pollution control
equipment and heat-treating equipment because of their significant corrosion resistance
and excellent elevated temperature properties [1] .
Pure nickel is ductile and tough and it possesses a face-centered cubic crystal
structure up to its melting point. Nickel and many of its alloys are readily fabricated by
conventional methods and offer freedom from the ductile to brittle transformation
behavior of most body-centered cubic and non-cubic metals. Nickel can accommodate
large amounts of alloying elements, such as Cr, AI, Mo, Ti, Fe, B, Cu and V in solid
solution. However, for the developed nickel-base alloys, emphases have been placed on
the applications that require corrosion-resistance, heat-resistance, low-expansion and high
electrical resistance.
1

Some alloying elements are added purposely in nickel-base alloys for obtaining
special required physical and/or mechanical properties. However, some unexpected
intermetallic phases may appear in modified alloy systems during materials fabrication or
heat treatment. Specifically in Ni-Mo alloys, the intermetallic phases Ni�o (j3), Ni)Mo
(y)/0022, and NiMo (8) can form, and the phase transformations associated with the
formation of these phases generates spectacular microstructures and property changes.
These phase transformations vary the material's corrosion resistance and mechanical
properties. Alloying elements can alter the phase transformation behavior and the
properties. Further study of the Ni-Mo alloys will lead to a better understanding of
principles important to all nickel-base alloy systems [2] .
Hastelloy B2 alloy was developed base on Ni�o alloy, which contains 29 wt.%
molybdenum and 71 wt.% nickel, offered the best resistance to hot hydrochloric acid
environments among the nickel-base alloys. The existing metallurgical issue ofN14Mo
alloy is that the material becomes brittle upon heating in the 600-800°C temperature range
or upon slow cooling from this temperature range. This process is associated with the
transformation of a to 13 phase, which takes place through a disorder-order phase
transformation.
The disorder-order transformation only involves a redistribution of atoms among
the atomic locations from a random arrangement to a more regular arrangement, whereby
designated sites are occupied predominantly by one kind of atom. In general, there is a
critical disorder-order transformation temperature Tc. Above the disorder-order
transformation temperature, long-range order disappears� when the temperature is
lowered through the critical point, long-range order is reestablished.
Ni4Mo alloy exists as a face-centered cubic (FCC) solid solution above 868°C, but
transforms by a long-range ordering reaction when it is equilibrated below this
2
temperature. The ordered intermetallic phase (� phase) is the major reaction product.
The transformation has been studied by transmission electron microscopy, scanning
electron microscopy, optical microscopy and x-ray diffraction in Ni�o alloy with
quenched, aging and cold worked conditions.
The intermetallic phase (� phase) is a long-range ordered structure and Ni�o
alloy becomes brittle when the � phase forms. The brittleness may result from strong
resistance to the motion of dislocations leading to intergranular fracture being favored [3].
Therefore, suppressing the disorder-order (a to �) transformation is important to
maintain good mechanical properties during service and for required heat treatments
during material fabrication.
Aluminum offers the potential for addition to alloys for high temperature
structural applications due to good corrosion resistance combined with oxidation
resistance at a high temperature. Thus, additions of aluminum contents with 2 at.%, 5
at.%, 7 at.% and 9 at.% were proposed for the modifications ofNi4Mo alloy in order to
determine if aluminum can prevent the embrittlement. In addition, aluminum is also used
in a minor amount in NiMo alloy for the purpose of deoxidization, controlling carbon
and nitrogen, to prevent the ordered intermetallic phase � forming, and to improve high
temperature corrosion resistance.
It is believed that this study will benefit not only the fundamental understanding
of the nickel-base alloy systems and provide a data base for the alloy development, but
also the investigation may lead to a practical importance of property improvement of
available Ni4Mo alloy.
3

CHAPTER 2
LITERATURE REVIEW
2. 1 Hastelloy Alloy Systems
Conventional Hastelloy alloys belong to the nickel-base alloy systems. Hastelloy
alloys can be classified into two groups based upon their applications. One group is high
performance, corrosion-resistance alloys including alloys B-2, C-4, C-22, C-276, G-3,
G30, H-9M, N and F. The other group is high-performance, heat-resistance alloys
including alloys X, S and W. Hastelloy alloys of the corrosion resistance group are often
used in the chemical and petroleum industries for manufacturing containment vessels and
pipes while the heat resistance alloy group can be used for high temperature corrosion
resistance applications.
The physical metallurgy ofHastelloy alloys is complex, subtle and sophisticated.
Hastelloy B2 alloy, for example, is an improved wrought version ofHastelloy B alloy.
Hastelloy B2 alloy, a Ni-Mo alloy, has the same excellent corrosion resistance as
Hastelloy B alloy, but with improved resistance to knife-line attack adjacent to the weld
metal and to heat-affected zone attack at some distance from a weld. The lower carbon
content of Hastelloy B2 alloy provides better resistance to the formation of grain
boundary carbide precipitates in the weld heat-affected zone, thus making it suitable for
most chemical process applications in the as-welded condition [ 4-6] . Hastelloy B2 alloy
also has an excellent resistance to pitting and stress-corrosion cracking. However,
Hastelloy B2 alloy can develop decreased ductility when it is cooled too slowly or
reheated, either treatment leading to long-range ordering (formation of � phase).
4

Hastelloy C alloy contains nominally 16 wt.% Cr and 16 wt.% Mo, and form
intermetallic phases within the temperature 700-1 050°C. Two types of precipitates,
Ni,Mo6 and �C. often form in Hastelloy C alloy, but are not of great concern from a
weldability viewpoint. The intermetallic phase Ni,Mo6 was found to form primarily at
grain boundaries either as a continuous or discontinuous chain-type structure. In
Hastelloy C-276 alloy, 4 wt.% W is added along with a controlled carbon and silicon
content. Hastelloy C-276 alloy resists the formation of grain boundary precipitates in the
heat-affected zones of welds, and it frequently is suitable in the as-welded condition for
chemical process equipment [7] . However, Hastelloy C-276 alloy does not reduce
intermetallic Ni,Mo6 precipitation, which is rich in molybdenum and creates adjacent
areas of alloy depletion that can be selectively attacked [8- 1 0] .
Hastelloy S alloy, a Ni-Cr-Mo alloy, is a high-temperature alloy with a unique
combination of properties. It has excellent thermal stability, low thermal expansion and
excellent oxidation resistance up to 2000°F (1 093°C). In addition, the alloy has good
high-temperature and thermal fatigue strengths. Hastelloy S alloy retains its strength and
ductility after aging at temperatures of 800 to 1600°F ( 427 to 871 °C) ( 1 1 ).
Hastelloy W alloy, a Ni-Cr-Mo alloy with an increased Mo and a decreased Cr
content compared to Hastelloy S alloy, is a solid-solution-strengthened alloy and was
developed primarily for the welding of dissimilar alloys. The principal alloying elements
in alloy tungsten are molybdenum and chromium. It is available as straight cut length wire
for gas-tungsten-arc welding, layer-wound wire for gas-metal-arc welding, and coated
electrodes for shielded-metal-arc welding [12] . The nominal chemical composition (wt.%)
of the above described alloys is documented in Table 1 .
5

0\
Table 1 . Nominal chemical compositions (wt.%) of some typical nickel-base alloys.
Cr Ni Co
Hastelloy B LO max. bal 2.5 max.
Hastelloy B2 1 .0 max. bal -
Hastelloy 16.0 65.0 -
C-4
Hastelloy 14.5- 16.5 bal 2.5
C-276
Hastel loy 2 1 .0-23 .5 hal 5.0
G-3
Hastelloy 29.5 43.0 -
G-30
Hastelloy W 5.0 63.0 2.5 max.
Hastelloy S 14.5-17.0 bal 2.0
..
Mo
28.0
28.0
15.5
15 .0-
17.0
6.0-8.0
5.5
24.0
14.0-
16.5 ---- - ---
Fe
5.0
2.0 max.
3 .0 max.
4.0-7.0
19.5
1 5.0
6.0
3.0
c w
0.05 max. -
0.0 1 -
0.0 1 -
0.0 1 3 .0-4.5
0.0 1 5 1 .5 max.
0.03 2.5
0. 12 max. -
0.02 max. -
SOURCE: Metals Handbook, 9th Edition, Vol 13, ASM Metals Park, Ohio, 1 992.
Cu AI
- -
- -
- -
- -
1 .5-2.5 -
2.0- -
- -
0.35 0. 1 0-0.50
-·-- -- - - ---- --
Si
1 .0
0. 1
0.08
0.08
1 .0
0.08
1 .0
0.2-0.75
·--- ----
2.2 Nickel-Molybdenum Alloy
For the Ni-Mo binary alloy, the intermetallic phases N4Mo (J3-phase}, Ni]Mo
(y-phase), unstable NhMo, and NiMo (o-phase) can form with modest exposure in the
temperature range 600-800°C. Formation of these intermetallic phases can render Ni-Mo
alloys brittle [2 and 13] . The amount of molybdenum in nickel is one of the factors
leading to embrittlement ofNi-Mo alloys. Figure 1 [2 and 14] presents the Ni-Mo phase
diagram. When stoichiometric ratio of nickel to molybdenum is at or very close to 1 :4,
the short-range ordered phase (a phase) transforms to the long-range ordered phase (J3
phase) on cooling. On heating, intermetallic phases J3 and y decompose by a peritectoid
reaction, and the intermetallic phase o decomposes by a peritectic reaction.
In the Ni-20 at.% Mo alloy, the SRO a phase to LRO J3 phase transformation has
been studied extensively because formation of the J3 phase from a phase increases the
strength but renders the alloy brittle. Fracture occurs on the former high angle a
boundaries. Guthrie and Stansbury ( 15] conducted an x-ray diffraction investigation of
Ni-Mo alloys and observed lines attributable to a phase and J3 phase in a diffraction
pattern of 19.99 at.% Mo alloy and J3 lines and faint y lines in a 20.77 at.% Mo alloy, and
placed the J3 region between 20-20. 5 at.% Mo. Casselton and Hume-Rothery [ 16]
investigated the equilibrium diagram of the Ni-Mo alloy system by a combination of
thermal, microscope and x-ray methods. The result is the same as that of Guthrie and
Stansbury. Many investigators believe that the intermetallic J3 phase encompasses the
stoichiometric Ni4Mo. The solubility of molybdenum in a is one of the important
factors affecting the transformation of long-range ordered phase J3 from short-range
ordered phase a. Thus, alloys developed for corrosion resistance in the a-phase should
be used at temperatures which place them in the a-field at equilibrium or at temperatures
7

Figure 2-1 .
(Ni) Ni,Mo Ni,Mo NiMo (1\to)
Mcta�table phasg
Ni2Mo Ni,Mo Ni1Mo Ni ,,Mos
(a) AI 1317 •c. (b) AI 1 362 "C
u 2.... 1600 Ql .... ::l 0 .. Cl) 1400 0. E �
1200
0
Composition, wt'!I> Mo
ll to 38(a) 29.0 JS·.J
63.9 to 65.7 911.9 to IOO(b)
20 40
Peerson SJIIIbO)
cF4 t/ 10 oP8
oP 1 12 c/2
o/6 t/8
ti iO. cF4
60
H. Okamoto, 1 991
80
Spocc croup
FmJm /4/m
Pmnn P21 2 1 21
/mJm
14/mmm
100 c n e m icol composition {o l.-"lo Mo)
Ni-Mo phase diagram and phases.
SOURCE: (a) ASM Handbook, Alloy Phase Diagrams, 1 0 Edition, Vol. 3, ASM Metals Park, Ohio, 1992. (b) C.R. Brooks, J.E. Spruiell, and E.E. Stansbury, Physical Metallurgy of Nickel-Molybdenum Alloys, International Metals Reviews, 29:210-248 ( 1984).
8

low enough for no � phase to form within the design life of the component [2].
2.3 Physical and Mechanical Properties of Ni-Mo Alloys
2.3 . 1 Physical Properties
The physical properties are different for the long-range ordered (LRO) state and
the short-range ordered (SRO) state in Ni-Mo alloys. They are affected by the
temperature, heat treatment and cold working condition as well as chemical composition.
The specific heat ofNi-20 at.% Mo alloy that was slowly cooled and quenched from
950°C was reported by Norem [ 17]. The result for an initial LRO state and an initial
SRO state is shown in Figure 2. On heating the LRO state, the specific heat increases
gradually to about 800°C, and then rapidly increases up to 868°C, the transformation
temperature as the � phase transforms to the a phase. This peak corresponds to an
enthalpy change of approximately 2900 J-mol-1 • On heating from the quenched condition
(SRO state), thermal energy is released in two stages, one having a maximum rate near
600°C and the other near 725°C, as the a phase transformation to the � phase occurs.
Then, the specific heat increases as the � phase transforms to the a phase.
The electrical resistivity with temperature relationship for a Ni-20 at.% Mo alloy
in three initial conditions (annealed, cooled at 60 Kmin-1, and quenched from 950°C and
swaged to 75% reduction in area) is represented in Figure 3 [1 8). At 25°C, the electrical
resistivity is the lowest for an initial condition of annealed and is highest for an initial
condition of cooled 60 Kmin-1 • When the initial condition is annealed, the electrical
resistivity increases with increase of temperature; when the initial condition is cooled 60
Kmin-1 or quenched then swaged 75% reduction in area, the electrical resistivity decreases
with increase of temperature in the range 650-825°C, then increases with increase of
9
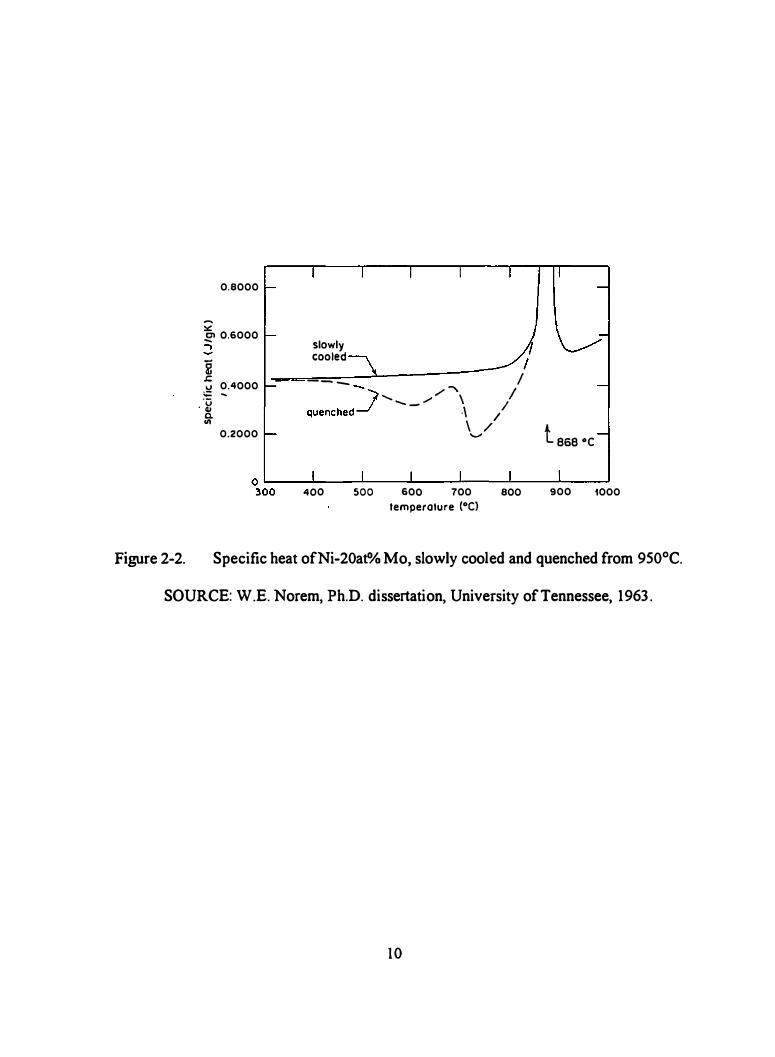
Figure 2-2.
0.8000
-. ::.:: C'l 0.6000 -
-,
� J: .� 0.4000 - -
. ·� c. ell
0.2000
slowly cooled 1 I
-- - I -- , ........ _ ,...... ....- -\ I
quenched_/ - ·\ I \ /1
........
400 500 600 700 800 temperature (°C)
t 868 oc
900 1000
Specific heat ofNi-20at"/o Mo, slowly cooled and quenched from 950°C.
SOURCE: W.E. Norem, Ph.D. dissertation, University ofTennessee, 1963 .
10

l 5 5
l 4 5
1 3 5
l 2 5 E u
� 3- 1 1 5
., � 0 5 ·;;; C) ..
-� 9 5 ..
u <11 Qj 8 5
7 5
6 5
2
ini t ial condi t ion
annealed
2 c ooled 60 K min-1 3 que nche d , t h e n swa g e d 7 5 %
reduction in oreo
lase oc
5 5 �--�----�--��--�----�--�----�----�--�--�
Figure 2-3.
0 100 200 300 400 500 600 700 800 9 00 1000 t emoero l ure (°C}
Electrical resistivity-temperature relationship for Ni 20 at.% Mo alloy in three initial conditions.
SOURCE: T.S. Lei, Ph.D. Dissertation, University of Tennessee, 1 979.
1 1

temperature. Lei [ 1 8] reported that during the disorder-order transformation the electrical
resistivity decreases while the hardness increases and SRO decreases at about 600°C.
Brauwers et al . ( 19] stated that the electrical resistivity increases when the temperature
rises up to the critical order-disorder transformation temperature for general ordered
alloys. Therefore, temperature, heat treatment and cold working condition affect the
electrical resistivity.
The thermal expansion from 25 to I 000°C was measured in Ni-Mo alloys. The
result i s shown in Figure 4. The curve for 20 at.% Mo alloy shows a smaller slope in the
long-range ordered state than in the short-range ordered state. An isothermal expansion
accompanying the transformation ofLRO to SRO near 870°C is followed by expansion in
the SRO range essentially coincident with that observed for the alloys with lower
molybdenum contents [2].
2 .3 .2 Strength Properties
The addition of molybdenum to nickel in the a-phase significantly increases the
strength (see Figure 5) and hardness [2]. This effect can be attributed to the influence of
molybdenum on the stacking-fault energy, to the formation of SRO, and to the elastic
strain resulting from the presence of the larger molybdenum atom.
The ordered intermetallic � (LRO) phase and deformation considerably affect the
strength in Ni-20 at.% Mo alloy. Brooks et al . [20-22] investigated the effect of aging
time on the tensile and yield strengths, the fracture elongation and microhardness of
Hastelloy B2 alloy aged at different temperatures. The results are illustrated in
Figures 6 and 7. Aging for up to 1200 hours from 550°C and 850°C increased the
strength significantly (20]. Upon aging at 750°C, the strength passed through a maximum
then decreased. In the solution annealed condition, the ductility was approximately 60%,
1 2

Figure 2-4.
Figure 2-5.
l( 1 0-3
... ...... .... <l c-0 ·;;; c 0 � >< C>
1 4
\ 2
1 0
8
6
4
2
0 100 200 300 400 500 600
tempera ture (°C}
Thermal expansion of 6.4, 1 1 .9 and 20 at.% Mo alloys.
500 �-------------r------------�
400
0 Snyder81 e PellouK and Grant e2
! 200 � N d
100
0o�-------------
10�------------
2�
0 molybdenum content (at.- "lo}
Effect of Mo content on yield strength of a-phase alloys.
SOURCE: C.R. Brooks, J.E. Spruiell, and E.E. Stansbury, "Physical Metallurgy ofNickel-Molybdenum Alloys," International Metals Reviews, 29:210-248 (1984). (for Figure 2-4 and 2-5)
13

100,000 - 600 0 0.. 3
"'0 Qi
80,000
60,000
40,000 ·;:.. 200
20,000
0 �L-�������������� 0 0 500 1 000 1500
aging lime {hr) Figure 2-6. The effect of aging temperature and time on the 0.2% yield strength of
Hastelloy B2 alloy.
c: .g c 1:7' c
GO �--=-----�--------�--------�
850 °C
� 20
O l_�====c===5E���x�_j 0 500 1000 1500
aging lime (hr)
Figure 2-7. The effect of aging temperature and time on the tensile elongation of Hastelloy B2 alloy.
SOURCE: C.R. Brooks and Y.M. Wang, Tensile Properties and Fractography of Aged Hastelloy B2 (550-850°C for up to 1200H), Materials Characterization 25: 1 85-1 97 (1990). (for Figure 2-6 and 2-7)
14
but after aging at 550°C and 850°C for 400 hours or more, the ductility was less than 5%.
Upon aging at 750°C, ductility was less than 5% for aging 200 hours or more, even
though the strength decreased.
The effect of grain size effect on hardness at all aging temperature and time is
shown in Figure 8 [22]. For both initial grain sizes of 50 mm and 800 mm, the results of
hardness are essentially the same. Aging at a higher temperature, 850°C, causes a
measurable hardening, and aging at the lower temperature, 550°C, causes the hardness to
approximately double in 1 ,200 hours. Upon aging at 650°C, the hardness increases
appreciably, and for the 800 mm grain size material, it began to decrease after aging 1 ,200
hours, whereas for the 50 mm grain size material it was also slightly increased. At 750°C,
both materials had a maximum hardness after aging 400 hours, then decreased appreciably
[22].
Roan and Brooks [23] studied the dependency of the tensile properties of
Hastelloy B alloy on test temperature with a solution annealed condition and the results
are illustrated in Figure 9. The influence of aging time at several different temperatures on
the tensile properties ofHastelloy B alloy is shown in Figure 10. The elongation sharply
decreases at about 700°C, and corresponds to a change in the fracture mode from
transgranular to intergranular above 700°C. However, the cause of the phenomenon is not
clear. Roan and Brooks [23] reported that the type of precipitate present can be
correlated with the mechanical properties. The feather-like precipitate causes the
strengthening. Aging can make the retained a. phase transform to the ordered J3 phase.
The rate of ordering is a maximum at about 750°C.
In Hastelloy B2 alloy, the phase transformations affect its strength, elongation,
and hardness and phase transformations are quite sensitive to the molybdenum content
and the amount of chromium and iron. The phase transformation involves the exchange of
15
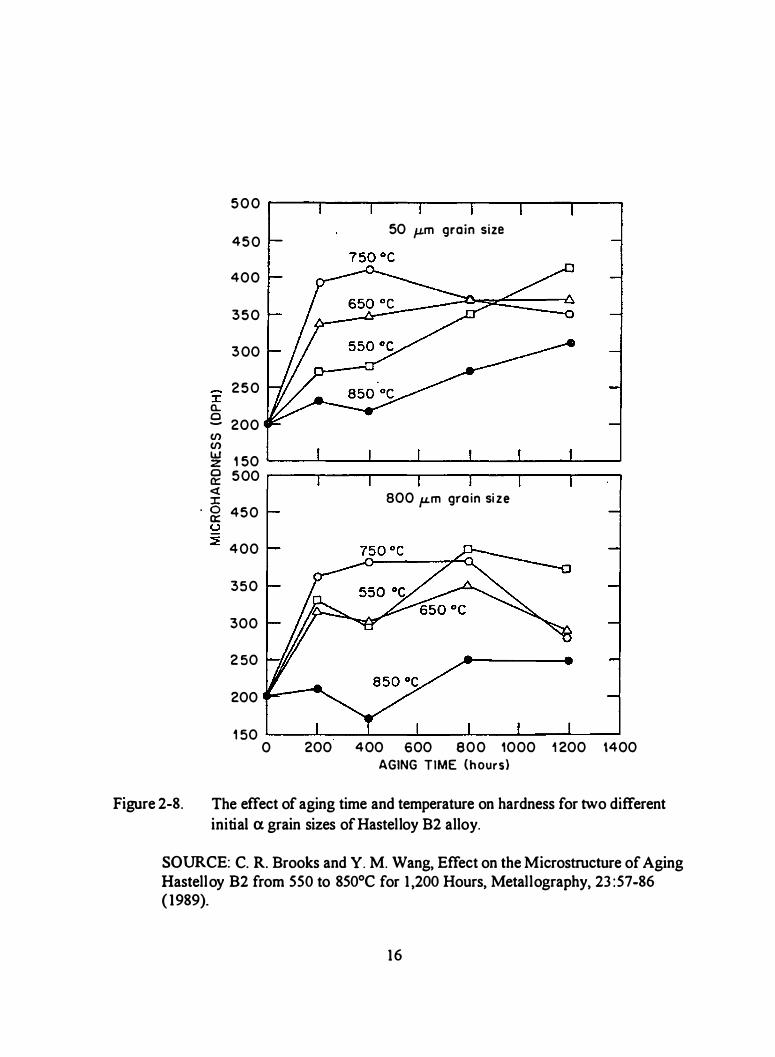
J: a.. 0 -
(/) (/) w z 0 a::: � J:
· 0 a::: u :::!:
5 0 0
4 5 0
400
3 5 0
3 00
2 5 0
200
1 50 500
450
4 00
350
300
2 50
200
1 50 0
50 J.Lm grain size
800 fLm gro in si ze
200 400 600 800 1000 1 200 1400 AGING TIME (h ours)
Figure 2-8. The effect of aging time and temperature on hardness for two different initial a grain sizes ofHastelloy B2 alloy.
SOURCE: C. R. Brooks and Y. M. Wang, Effect on the Microstructure of Aging Hastelloy B2 from 550 to 850°C for 1 ,200 Hours, Metallography, 23 :57-86 ( 1989).
16

Figure 2-9.
I 106 I 10) 1000 ��--�----------�----------------� 140
�--���-r--�-+--+-�--�--��� t30 --��------------�-4
t20 1 1 0 t �-+--+-���--��--��--�----�� 100 � 90 � ________ ...:..... ____ ..::J eo �
� ---�--.;...---;.---.::� 70 !: c: • c .. snctm4
___:, __ ....:.,... ____ -=1 60 ,5! S • Wtts.on and a�rc.f\f at�) $0 !! � 300 x Coouson9, Patrocrco ond Monty' __ .:...,_ ____ -l 4o E 5
200 1---.•-F-_•e
':""se_n_• _'n_•e_s'_'9_••-·on--�'�....!...----_;_--..!:-__;---=l 30 �
:oo i--....!...--r--+--+-�--�--��--��--�� 20 t O • 0o�....!...�2o�o�����oo��-��--��&���--�.o�oo���:zoo· 0
( oJ
tOO o�-'---::2-:-:oo=-----4:-::0�0----6,.;o""'o----.,..ao'""'o,..--.:......-l. Temperotute. •c
(b)
70 r---;-1 ---;-1----:--l --:-1 ----:--1 ....,..., ----,1-i -i -, -,-! � 6o r-�--��--��--L-�--�-L--�. --�� : : I I I I I ! ' i
t :: · � ! : : : 'ID'_..:.._: _: �i --4 e x i I ! : i. x l i ; f 30 I I I l ' j -i- x .;.1 __ _;_ .. ------l '-'
• Ctushctm 4 I I X ' 1 : • :
20 f- X Ctousonq, PC1toorcc end Monly' -- . _ _;x=.�--i------l • Pte,tnt lthtCSIJ9QII:;):'\ , 1 • 1 1
10 1-----ii:----:-i ---;..1 ___!,_i ----=---: .....;i- � -�.;,..__:_1 ____:_: -l 0 o���2±o�o�--��o:-::o--��6c��--��&���o ��,o�o�o__; __ �l2oo Tem!)er01ute. •c
(c) Tensile properties of solution annealed Hastelloy B alloy as a function of temperature.
SOURCE: D.F. Roan and C.R. Brooks, The Effect of Aging on the Mechanical Properties of a Nickel-Molybdenum-Iron Alloy (Hastelloy B), Metallurgical Transactions, 6A: 1 892- 183 1 (1975).
1 7

\80 &. 1200 1--+---f----r---+-:---+----;;-,:;;:;;;:;;::1 ·� � t t OO \--+---+-� �""!"""------"'! 160 �
c c: "' e 140 Vi
� � � � � ��������-�--�-�-� 120 � � � 0 700 �-�---f--+---+--�-�--9 100 �-. .§ X C lousang, Pol no rca
' and Monly6 al 705 •c j
5 600 5 80
500o�-������-����-�,2�070�1�400 Aging Time, hr .
. � . � 1000 r---r--,--,--�--.---r--o 14o
130
� eoo r--�-�--�����.-�--� 120 ·� 1 1 0 _: � 700 100 &.!!
N N � � Q
80 � <> 70 � 60 Ui 50 ::2 "' 40 > 30 20
I00 �-2�0�0��4�0�0-�6�070-�8�00��1�00�0��,�20�0��17400 Time, hr
60 �-�-�--�-�--.--�--. X Clou:oin9 , Po!riorca and Manly6 01 705 •c
I I I
Agan9 Time, lu.
Figure 2-10. Tensile properties (at 25°C) ofHastelloy B as function of aging time and temperature.
SOURCE: D.F. Roan and C.R. Brooks, The Effect of Aging on the Mechanical Properties of a Nickel-Molybdenum-Iron Alloy (Hastelloy B), Metallurgical Transaction 6A: l 829-183 1 (1975).
18
nickel and molybdenum atoms on the parent lattice and the ordered phase � retains a
crystallographic relation with the parent a phase. Hastelloy B2 alloy shows common
characteristics of the phase transformations that occur in the Ni-Mo binary alloy. Thus,
aging allows the formation of � phase with accompanying strengthening as well as
embrittlement.
2.3 .3 Effect of Aging Cold Worked a on Hardness
The disordered phase a can be retained by quenching. The kinetics of the
disorder-order (a to �) transformation has allowed an examination of the interaction of
recrystallization and ordering. Cao and Brooks [24) researched cold worked a upon aging
to produce the ordered structure. They found that the cold worked a phase transformed
to � phase which inherited the deformation structure of the a phase, and then the cold
worked � recrystallized. The amount of recrystallization was a function of time and
temperature. Recrystallization of the a structure was about 100 times slower than in the
ordered � structure (see Figure 1 1 ).
Sanganeria and Brooks [25] investigated the effect of different aging temperatures
and aging times on microhardness of the cold worked a phase. The results of their study
are shown in Figures 12-1 6. The hardness ofHastelloy B2 alloy in the disordered a condition increased from about 200 DPH to 500 DPH after cold work by swaging (Figure
1 2). The cold worked specimens upon aging became long-range ordered (�) below 868°C.
Aging at 850°C resulted in recrystallization of the a phase, with a reduction in hardness,
then the formation of the ordered �. with the hardness increasing to about 550 DPH
(Figure 1 3). Aging at 885°C, the hardness in the cold worked a condition decreased
because of recrystallization of the a phase (see Figure 14). Aging at 700 and 775°C
(Figures 1 5 and 1 6) resulted in the transformation of the cold worked a to cold worked,
1 9

100
-Cit 80 920 C -"CS 885 C � aso c � 60 825 C � BOO C u a 775 C ! 40 700 C -c :I c e 20 co
0 1 0 ° 1 0 1 1 o 2 1 0 3 1 o· 1 0 . 1
annealing time (min.)
8
6
it 4 0 e
.5 2
0
·2 0.8 0.9 1 .0 1 . ,
1 /T • t o o o
Figure 2-1 1 . (a) The amount of recrystallization versus aging time for 43% cold worked material. (b) Arrhenius plot based on the time 50% recrystallization from the curves in (a). (The activation energies derived from the slopes for
recrystallization from the disordered a structure and from the ordered J3 structure).
SOURCE: Siqi Cao and C.R. Brooks, Recrystallization of the Disordered and Ordered Structure in Ni-20 at.% Mo Alloy, Microstructural Science, 2 1 :277-288 ( 1994).
20

600
500 .... :::r::: a. e. 400
en en w z 300 0 a: -t :::r::: 200
1 00 0 2 0 4 0 6 0 8 0 1 00
REDUCTION IN AREA (%)
Figure 2-12. The effect of the amount of cold work (% reduction in area by swaging) on the hardness of a in the Ni-20 at.% Mo alloy.
600 AGING TEMP. 8SO C
= a.
500 e. en en w z 0 a: 400 HARDNESS IN < :::r::: ASCCilD WOAI<ED
CXlNDI1'XJN D 43% RA 0 68% RA .. S00.4 RA
300 . 0 1 . 1 1 0 1 00 1 000
TIME (min)
Figure 2-13 . The effect of aging time at 850°C on the hardness of the Ni-20 at.% Mo
alloy initially in the cold worked a condition.
SOURCE: M. Sanganeia and C.R. Brooks, The Effect of Cold Working on the Ordering Reaction in Ni4Mo, Microstructural Science, 1 8:237-253, Editors T.A. Place, J.D. Braun, W.E. White and G.F. Vander Voort, ASM International, Materials Park, OH (1990). (for Figure 2-12 and 2-13)
21

-:1: D. Q -
(I) (I) w z Q a: c( :1:
500
400 HARDNESS IN AS-COlD WORKED CONDI'OON
. 1
AGING TEMP. 885 C
a 43% RA o SSO!o RA & 80% RA
1 0 1 00
Figure 2-14. The effect of aging time at 885°C on the hardness of the Ni-20 at.%. Mo
alloy initially in the cold worked a condition.
750 (a) AGING TEMP. ns C a 43% RA
0 68% RA £ " SO'l'o RA a. 650 e. en en w z 0 a: 550 < ::z:
HARDNESS IN � AS-CXX..DWaoo:D commoN
450 . 1 1 0 1 00 1 000 1 0000
TIME (min)
Figure 2-1 5. The effect of aging time at 775°C on the hardness of the Ni-20 at.% Mo
alloy initially in the cold worked a condition.
SOURCE: M. Sanganeria and C.R. Brooks, The Effect of Cold Working on the Ordering Reaction in Ni4Mo, Microstructural Science, 1 8 :237-253, Editors T.A. Place, J.D. Braun, W.E. White and G.F. Vander Voort, ASM International, Materials Park, OH ( 1990). (for Figure 2-14 and 2-1 5)
22

Figure 2-16. The effect of aging time at 700°C on the hardness of the Ni-20 at.% Mo
alloy initially in the cold worked a condition.
SOURCE: M. Sanganeria and C.R. Brooked, The Effect of Cold Working on the Ordering Reaction in Ni�o, Microstructural Science, 1 8:237-253, Editors T.A. Place, J.D. Braun, W.E. White and G.F. Vander Voort, ASM International, Materials Park, OH (1990). (for Figure 2-1 6)
23

ordered �. with the hardness approaching 700 DPH, followed by recrystallization of the
� phase, with an associated decrease in hardness.
Ling et al. [26] studied the ordering transformation in an initially disordered and
the cold-worked Ni-20 at.% Mo alloy. They investigated that by comparing changes in
the hardness, the ordering transformation in an initially disordered and then cold-worked
Ni-20 at.% Mo compared to an initially as-quenched Ni-20 at.% Mo alloy during
progressive ordering. After same aging temperature and time, the maximum hardness in a
cold-worked and ordered Ni4Mo (� phase) is attained faster than that for a phase as
quenched sample. The � domains in the cold-worked sample were apparently much finer
than these formed from the quenched sample. In both the cold-worked and as-quenched
alloys a recrystallization process was observed.
The energy introduced by cold-working is one of major driving forces for the
recrystallization process. Brooks and Cao [27] obtained a group of curves of
microhardness as a function of aging time at 850°C and 700°C and their results agreed
with those obtained by Sanganeria and Brooks [25] . The appearance of recrystallization
in the cold worked a. phase prior to ordering at 850°C is attributed to the low disorder-
order energy change compared with the stored energy of cold work. At 700°C, the
disorder-order energy change is higher than the stored energy, and the deformed c:x phase
is converted to deformed � phase, then recrystallization occurs. The reduction in
hardness at long aging times is attributed to an increase in the long-range ordered � domain
size. However, some deformed structure still remains at this point. The recrystallization
process is heterogeneous due to the heterogeneity of the deformation structure.
Brooks and Cao [27] summarized schematically the microhardness change with aging time
during cold working at 850°C and 700°C (Figures 17 and 1 8). At 850°C (see Figure 17),
the nucleation of recrystallized grains of a phase is associated with decrease of hardness.
24

I' a.. 0
Deformed a
500 1'-------
400
1 1 23 K (850°C)
300 1 0 1
Aging
f Recrystallization not complete
1 0 2 1 03 1 0 4 1 0 5
Time (sec) Figure 2-17. Summary of the structure changes which occur during aging cold worked a
at 850°C.
£' a.. 0 600
500
400
Aging Time (sec)
Figure 2-1 8. Summary of the structure changes which occur during aging cold worked a at 700°C.
SOURCE: C.R. Brooks and S. Cao, The Development of the Ordered Structure from Cold Worked Disordered Alpha in Ni4Mo, Philosophical Magazine A, 65:327-353 (1992). (for Figure 2-17 and 2-1 8)
25

When the recrystallized region becomes ordered, there is an increasing hardness associated
with this ordering. As � domains structure forms and coarsens with aging time, the
hardness begins to decrease. Upon aging 700°C (see Figure 1 8), the deformed a phase
quickly begins to form the ordered � phase, with a rise in hardness. When recrystallized
� grains appear in deformed � which is ordered � phase, they continue to nucleate and
grow to consume the deformed � structure. As the � domains increase in size, the
hardness begins to decrease. However, the recrystallization response, whether occurring
in the disordered a phase or the ordered � phase, has the expected dependence on
temperature and amount of cold work.
2.4 Ordered and Disordered Structures in Ni-20 at. o/o Mo Alloy
Ordering reactions have been observed in many solid solutions, usually occurring
on cooling, resulting in long-range ordered or short-range ordered states. In the LRO state
specific atomic species occupy a specific set of lattice sites. The solubility of nickel in
molybdenum is limited, but Mo is readily soluble in nickel . There are three intermetallic
(ordered) compounds which occur at or near stoichiometry: Ni4Mo {�), Ni3Mo (y), and
NiMo (o) (Figure 1). On heating, � and Y decompose by a peritectoid reaction, and o decomposes by a peritectic reaction. Above 868°C the Ni-20 at.% Mo alloy exists face
centered cubic (FCC) terminal solid solution called the a-phase (short-range ordered
state). Below this temperature, the structure is body-centered tetragonal �-phase
(long-range ordered state) [28]. The atomic arrangement of molybdenum and nickel atoms
in � is shown in Figure 19. The � structure consists of the molybdenum atoms
occupying the (420) planes of the parent FCC lattice and nickel atoms occupying all other
sites. A schematic diagram of �-lattice with relationship between FCC a-lattice and bet
26

o • 5.732 .A
0 Ni • Mo
Figure 2-19. Crystal structure of b phase (Ni4Mo).
c • 3.571 Z.
SOURCE: C.R. Brooks, J.E. Spruiell, and E.E. Stansbury, Physical Metallurgy of Nickel-Molybdenum Alloys, International Metals Reviews, 29:2 10-248 ( 1 984).
27

ordered lattice i s shown in Figure 20. Thus, the transformation can occur just by nickel
and molybdenum atoms locating properly on the parent a lattice [2]. Spruiell and
Stansbury [28] studied the crystal structures of the Ni- 10.7 at.% Mo and Ni-20 at.% Mo
alloys using x-ray diffuse scattering measurement of quenched, and quenched and aged Ni-
20 at.% Mo alloy. The a phase is not a random solid solution, but exhibits short range
order (SRO). The SRO state is characterized by a diffuse peak at { 1 , 1/2,0} in reciprocal
space, which does not coincide with the fundamental FCC spots nor the 115 { 420} LRO
spots.
The long-range ordered � phase forms by randomly nucleations in the short-range
ordered a matrix and growth. After impingement, long-range ordered � domains coalesce
towards a configuration characterized by perpendicular twin plates. This rearranged
domains structure i s composed of a number of colonies [29].
2.5 The Effect of Alloy Elements in Ni-Base Alloys
The major alloying elements significantly affect the nickel-base alloys in their
properties. Lecomte-Beckers [30] pointed out that the microstructure in nickel-base
superalloys was found to depend greatly on aluminum and titanium contents. During
solidification, the liquid metal in front of solid-liquid interface is enriched in titanium and
molybdenum, whereas the dendrite cores are richer in cobalt. Kiriyenko et al. [3 1 ] stated
that titanium, tungsten, zirconium, vanadium and niobium are stronger carbide formers
than molybdenum. These alloying elements are used to improve the anticorrosion
properties ofNi-Mo alloys in the temperature range near 1300°C, by transforming the
carbon present in the alloy to a carbide phase without denuding the matrix of
molybdenum. At 700-800°C the influence of these elements is obviously not due to
28

0 Ni Atoms e Mo Atoms
(100) PLANE
Figure 2-20. (}-lattice with relationship between FCC a-lattice and bet ordered lattice; positions ofMo atoms in adjacent planes indicated by x.
SOURCE: C.R. Brooks, I.E. Spruiell, and E.E Stansbury, Physical Metallurgy of Nickel-Molybdenum Alloys, International Metals Reviews, 29:210-248 ( 1984).
29

carbide formation but other processes. Between 600 and 800°C ordering processes occur
in Ni-Mo alloy systems, and these process mainly govern the corrosion properties. It is
natural to suggest that the role of these elements in altering corrosion properties must be
due to the effect on the processes of ordering.
However, additions of copper provide an improvement in the resistance of nickel
to nonoxidizing acids and chromium added to Ni-Mo alloys improves resistance to
oxidizing media [32]. Chromium also improves the resistance to high temperature
oxidation and to attack by hot sulfur-bearing gases [7, 33]. Vasudevan and Stansbury [34]
stated that addition of chromium is seen to have significant effects on Ni�o alloys for
both short-range and long-range order. The degree of short-range ordering in as-quenched
alloys decreases with an increase of chromium content, the formation oflong-range order
Ni4Mo is deterred with addition of chromium (3 .84 wt.% Cr), and the retention of SRO
state is independent of cooling rate. Iron increases the solubility of carbon in nickel and
improves resistance to high-temperature carbonizing environments. Alloying with
molybdenum is essential for corrosion resistance in reducing media and for resistance to
localized corrosion attack. The solubility of molybdenum in a phase is of importance
from a practical viewpoint because the precipitation of � phase from a phase can lead to
embrittlement. Thus, alloys developed for corrosion resistance in the a phase should be
used at temperatures which place them in the a field at equilibrium within the design life
of the component [2]. Molybdenum in nickel-base alloys markedly improves the pitting
and crevice corrosion resistance [35, 36] . Tungsten behaves similarly to molybdenum in
providing improved resistance to nonoxidizing acids and to localized corrosion [7].
Cobalt, like iron, increases the solubility of carbon in nickel-base alloys, and increases the
resistance to carbonization [8]. Boron added to a Ni-27 wt.% Mo alloy caused the tensile
ductility to increase from about 5 to 30 pet and changed the fracture mode from
30
predominantly intergranular into predominantly transgranular (Figure 2 1 ) [37]. When
more than 1 0 at.% boron is added to Ni-Mo alloys (20-30 at.% Mo}, they have high
tensile strength and high hot hardness. These properties are derived from fine boride
dispersions with good high temperature stability and the presence of ordered phases in a
fine grained matrix [38]. Niobium and tantalum are added as stabilizing elements to tie up
carbon and prevent intergranular corrosion attack due to grain-boundary carbide
precipitation, but they reduce the tendency of nickel alloys toward hot cracking during
welding [7, 39] . Aluminum and titanium are often used in minor amounts for the purpose
of deoxidation or to tie up carbon. These elements enable the formulation of age
hardenable high-strength alloys for low and elevated temperature service. Aluminum can
also be used to promote the formation of a tightly adherent alumina scale at high
temperature that resists attack by oxidation, carbonization and chlorination [ 40] . The
residual element sulphur at the migrated boundaries ofNi-20 at.% Mo alloy would be
accumulation of sulphur from the bulk lattice as the boundary moves. At the aging
temperature, the rate of sulphur diffusion was sufficiently high to allow it to maintain
segregation to migrating boundaries. Thus, the residual element sulphur is segregated in
the ordered Ni4Mo alloy and maintained at the moving boundaries [ 4 1 , 42].
2.6 Heat Treatment
The physical metallurgy ofNi-Mo alloys was reviewed in detail by Brooks et al.
[2]. Rapid cooling Hastelloy B2 alloy from 900°C to 25°C will prevent the formation of
� phase from a phase, and then the � phase can be formed by aging below 868°C.
Stansbury [43] stated that classical ordering phase transformations typically occur by
nucleation and growth leading to C-type time-temperature-transformation curves. The
3 1

"" 70 � 60 � 0 50 "' c ... 40 c 0 ... � 30 Ill 00 c 0 ..... lol Cll 10 ...
... Ill c Cl Eo<
40
� 30 0 "'
g 20 .... ... Ill g' 0 .... lol Ill ...
.... Ill c
• Ni-27Mo • Ni-29 . 1Mo
Exposure Time (Hours ) (a)
• •
f! 0 �----�--��--��----L-----� 0 0 .010 0.015 0. 020 0 .025 0.030 Boron Con�en� (wt pc� l
(b)
Figure 2-2 1 . Effect of ordering in Ni4Mo on room temperature tensile ductility: (a) dependence of ductility on exposure time at 700°C for alloys free of boron and (b) effect of boron content on the ductility of alloys ordered to Ni4Mo (exposed 24 h at 700°C prior to testing).
SOURCE: H.M. Tawancy, Ductility ofNi- Ni4Mo Alloys by Boron Additions, Metallurgical Transactions A, 22:3067-3071 ( 1991).
32

transformation by a typical C-shaped curve is shown in Figure 22. It is clear that the
transfonnation kinetics of a phase to � phase is very slow below 600°C. In the
temperature range of750°-868°C, the SRO to LRO transfonnation occurs by nucleation
and growth ofLRO domains in a SRO matrix [43] . The � phase can be fanned in the a crystal by proper rearrangement of the atoms on the FCC lattice in local regions, and then
the growth of these ordered regions by the interface movement.
Hastelloy B2 alloy displays some of the characteristics ofNi-20 at.% Mo binary
alloy. The structure of the binary alloy is a face-centered cubic solid solution (a) above
868°C, and below this temperature the Hastelloy B2 alloy is composed of the compound,
Ni4Mo (� phase). The ordering reaction can be suppressed by cooling rapidly from the a phase region, but the � phase fonns rapidly upon holding in a temperature range of 600-
8500C. The ordering reaction causes remarkable strengthening. The quantity of SRO a and LRO J3 is a function of temperature and time. Brooks et al. [20] reported that in the
Hastelloy B2 binary alloy, the strengthening which occurs during aging is accompanied by
embrittlement with fracture occurring along the fanner a. high angle boundaries. Tillack
[44] stated that the addition of aluminum and certain other alloying elements to nickel and
nickel-base alloys produces an appreciable response to age hardening. The effect is
dependent on both chemical composition and aging temperature. The precipitation of
submicroscopic particles throughout the grains results in a significant increase in hardness
and strength.
2. 7 Microstructural Evaluation
It is important to study the microstructure evolution process in Ni-Mo alloys
because it controls the mechanical properties. A number of investigations [22, 4 1 , 42, 43,
33
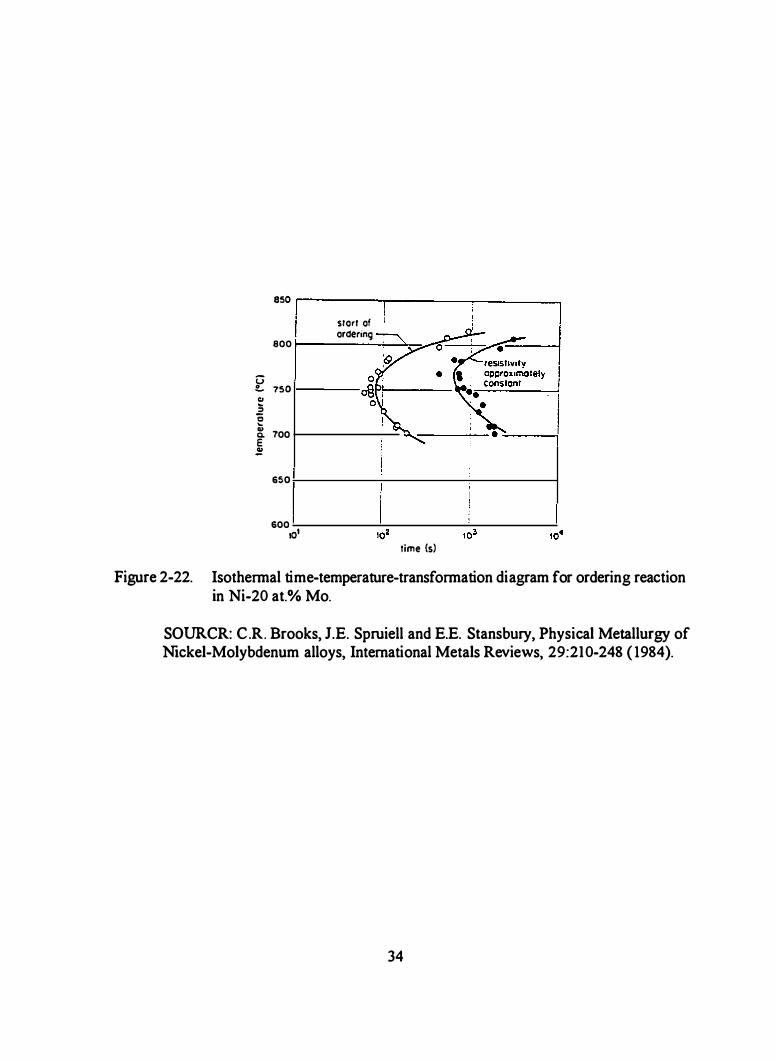
••• I srarl af arderong 800
G !... 750 � ::;) 0 .... � 700 E �
6SO
600 ro' lime {s)
Figure 2-22. Isothermal time-temperature-transformation diagram for ordering reaction in Ni-20 at.% Mo.
SOURCR: C .R. Brooks, J.E. Spruiell and E.E. Stansbury, Physical Metallurgy of Nickel-Molybdenum alloys, International Metals Reviews, 29:210-248 ( 1984).
34

44, 47] have been carried out metallographic examination of the Ni4Mo system. Optical
and electron microscopes were employed to e�aluate the microstructures. Lei [ 18]
observed the LRO state (J3 phase) domains and SRO state (a. phase) regions in Ni-20
at.% Mo alloy after aging one hour at 850°C. A typical microstructural morphology is
shown the Widmanstatten pattern � phase formation (Figure 23) . Irani et al . [45] used
plane-polarized light to follow an ordering reaction ofNi-20 at.% Mo alloy. Brooks et al .
[42] conducted a microstructural examination ofHastelloy B2 alloy which was aged from
550 to 850°C for 200, 400, 800 and 1200 hours by using optical and scanning electron
microscopes. They believed that the a. phase has, at least initially, transformed to the �
phase, as this is known to cause hardening. Therefore, both OLM and SEM can be
successfully used during the microstructural evaluation on Ni-Mo alloys.
2 .8 X-Rny and Electron Diffmction
X-ray and electron diffraction are the best methods for detecting SRO-LRO phase
transformation. Spruiell and Stansbury [28] used x-ray diffuse scattering measurements
to investigate the structure of SRO in Ni-Mo alloy . They found that the diffuse
scattering produced by SRO contained maxima located at the { 1 , 1 /2, 0} position in
reciprocal space. Using electron diffraction to investigate the SRO-LRO transformation
was frequently reported [6, 9, 27, 46, 48, 49]. Electron diffraction patterns from a Ni-20
at.% Mo alloy for order, disorder, and both order-disorder are exhibited in Figure 24 [ 48].
The TEM microstructure in Ni4Mo alloy was studied by many researchers [50 to 57] .
TEM microstructure and electron diffraction approaches can be efficiently employed to
define the SRO-LRO transformation.
35

Figure 2-23. Optical microstructure of � phase in Ni4Mo. Note etched Widmanstatten pattern characteristic of the ordered domain structure.
SOURCE: T.S. Lei, Ph.D. Dissertation, University of Tennessee ( 1979).
36

w ...J
Figure 24.
. . . . . . . · .· '@ ' - � ': · . . . � . . � -
•. . ..... : . • --·'. < ' '' < .:,.: ··.
.. .... ,• ·,, ' ' ' .• ::,._ , . . , ..... . . . . . , -
420 -4oo � 440
2oo� �24o 220
OOO tYtf' ......- ¥ -. 040 020 1 14(240) • Fundamental spots o Short-range order spots
' . . •
• •
• •
• . . : � .
• • • • -.- .. . ; .. . "
' ' ' . . •
. . .
. •
•
•
•
- .. cu -400� 440
···� ··· / 220
000 6<}' y :=-we )( - 020 1 /5(240) '16 040
• Fundamental spots • Long-range order spots
- 420 -400k X ;:ok: X :;4 440
2oo� 24o
ooo V.'1N � v -=-- 040 1 /5 (240) 1 /4(240)
• Fundamental spots o Short-range order spots • Long-range order spots
w w w [001] electron diffraction patterns from a Ni-20 at.% Mo alloy a) disordered a showing SRO spots only arrow; b) ordered b showing LRO spots only arrow; c) pattern showing the LRO and SRO spots at an intermediate step in the disorder to order process.
SOURCE: S. Cao. C.R. Brooks and L. Allard. An in situ Transmission Electron Microscopy Study of Ordering in a splat Cooled Ni-20 at.% Mo alloy, Materials Characterization. 34:87-95, (1 995).

2.9. Corrosion Resistance
Nickel offers very useful corrosion resistance itself and it is an excellent base on
which to develop specialized alloys. The atomic size of nickel and nearly a complete 3d
electron shell enable nickel to receive large amounts of alloying addition. When
molybdenum is added in nickel, an alloy has been developed for service in environments
of nonoxidizing solutions of HCl, H3P04, HF and H2S04. It is well known that sulfuric
and hydrochloric acid are two of the most aggressive environments in the chemical
industry. Hastelloy B2 alloy in a dilute deaerated sulfuric acid solution exhibits a low
corrosion rate because the corrosion potential determined by the hydrogen reduction
reaction is low. Sridhar [58, 59] claimed that the Hastelloy B and B2 alloys can be used
to a higher temperature for all concentrations of acid. The high corrosion resistance of
Hastelloy B2 alloy is shown in Figure 25. Hastelloy B2 alloy shows the highest
resistance in HCI of all the Ni-base alloys. Thus this alloy is used in a variety of
processes involving hot HCl or nonoxidizing chloride salts hydrolyzing to produce HCI.
An illustration of corrosion behavior ofHastelloy B2 alloy is illustrated in Figure 26. [58,
59] . As indicated in Figure 26, Hastelloy B2 alloy shows two corrosion curves, one at
high temperature near the boiling point and the other at low temperature. The different
behavior is due to the variations of the oxygen content in the solution. At the higher
temperature, the oxygen solubility is lower and, therefore, the corrosion rate is lower.
38

� .; ;; ;;; o; � E .. ....
360
320
280
240
200
160
120
80
40
0 0
A I L
600
I v / 500
I Boiling poont cur�v/'
L I /z
_.,/ / � � -
--N2r.
b::= G·31G·30 \- 7"- -.... -- _.... --- - � \ C·276 C·22 ............ v Alto� � � !'.. -- /
Type � � 625' !--' r !'----t'----- t...--:::
200
100
10 20 30 40 so 60 70 80 90 100 Concenuatoon of H2SO •. %
Figure 2-25. Comparative behavior of several nickel-base alloys in pure H2S04. (The isocorrosion lines indicate a corrosion rate of 0.5 mm/yr.)
SOURCE: N. Sridhar, Behavior ofNickei-Base Alloys in Corrosive Environment in hydrochloric solution, Metals Handbook 9th Edition, Corrosion, 1 3 :643-647 ( 1989).
39
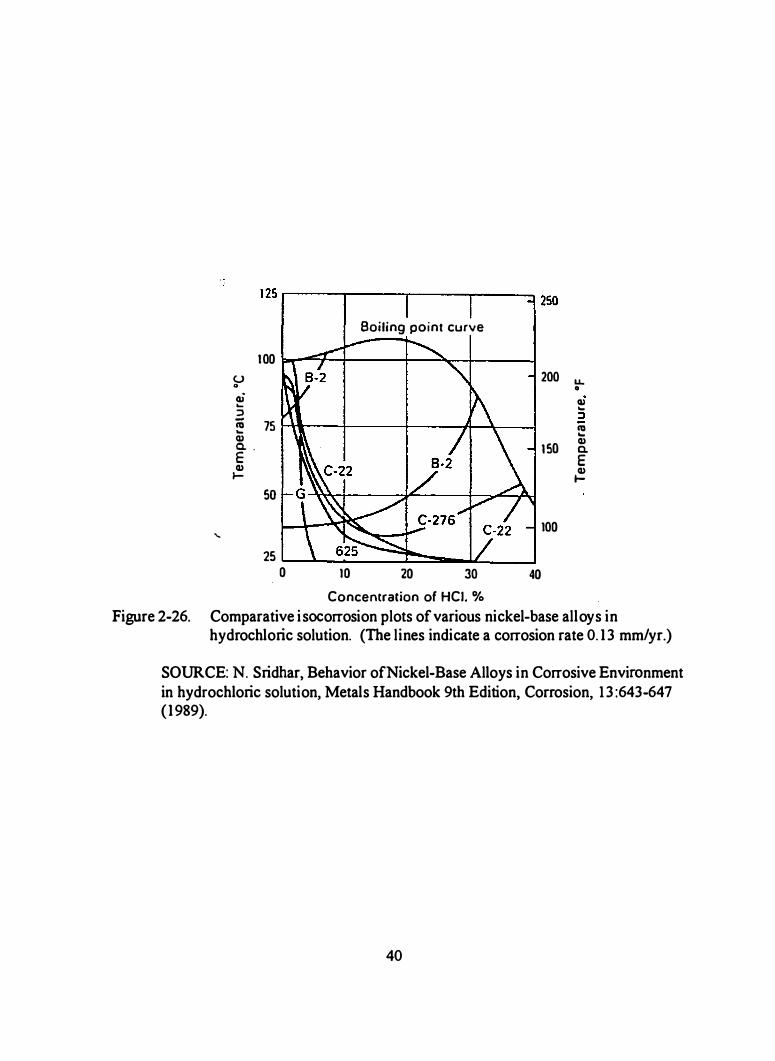
100 u 0
ai .... ::J - 75 tQ .... Q) Q. . E Q) 1-
so
......
25 0
Boiling point curve
10 20 30 40 Concentration of HCJ. %
200 LL
I SO
100
0 Q) .... ::J tQ .... Q) Q. E Q) 1-
Figure 2-26. Comparative isocorrosion plots of various nickel-base alloys in hydrochloric solution. (The lines indicate a corrosion rate 0. 1 3 mm/yr.)
SOURCE: N. Sridhar, Behavior ofNickel-Base Alloys in Corrosive Environment in hydrochloric solution, Metals Handbook 9th Edition, Corrosion, 1 3 :643-647 ( 1989).
40

CHAPTER 3
MATERIALS AND EXPERIMENTAL PROCEDURES
3 . 1 . Chemical Composition
The base material ofNi-Mo alloy was received in the form of a hot forged bar. Its
chemical composition is documented in Tables 3-1 .
Table 3-1 . Chemical composition (at.%/wt.%) of the Ni4Mo alloy studied.
Ni Mo AI 0
at.% wt.% at.% wt.% at.% wt.% at.% wt.%
80.0 70.5 20.0 29.5 <0.0003 <0.0 1 0.0001 0.003
Four groups of laboratory type Ni-Mo-AI alloys with AI levels of2, 5, 7, and 9
at.% (1 , 2, 3, and 4 wt.%) were made. They were fabricated by remelting pieces of the
N14Mo bar with pure aluminum additions using an arc-melting device in an argon
atmosphere. The alloy systems studied are designated Ni�o, 2 at.% AI, 5 at.% AI,
7 at.% AI, and 9 at.% AI alloys. The corresponding compositions are shown in Table 3-
2. The aluminum content is based on the weighed aluminum added to the Ni�o bars,
but the ingots were not chemically analyzed.
41

Table 3-2. Composition of laboratory Ni-Mo-Al alloys (at.%/wt.%).
Ni
at.%
2 at.% AI alloy_ 78
5 at.% AI alloy 76
7 at.% AI alloy_ 74
9 at.% AI alloy 73
3 .2. Materials Fabrication
wt.%
69.8
69. 1
68.4
67.7
Mo AI
ato/o wt.% at.% wt.%
20 29.2 2.0 1
19 28.9 5 .0 2
19 28.6 7.0 3
18 28.3 9.0 4
The alloys were produced in a conventional multi-hearth arc-casting furnace using
a nonconsumable tungsten electrode and a low partial pressure of argon atmosphere. The
samples were flipped 4 to 5 times and remelted during the process to ensure
homogeneity. For each group of the test samples, the amount of aluminum content of2,
S, 7 and 9 at.% ( 1 , 2, 3, and 4 at.%) was added to the base Ni4Mo alloy to make the
modified alloys. Then, all the samples in each group were capsulated in a quartz tube.
The tube was evacuated and then backfilled with high purity argon at a reduced pressure.
The argon pressure in the quartz tube was based upon a calculated value to accommodate
less than 0.3 atm pressure for the homogenization temperature left out and each group
samples were evacuated again on the tube sealed. The argon pressure in the quartz tube
was less than 0.5 atm at various aging temperatures. Figure 3-1 shows some samples in
the quartz tube.
42
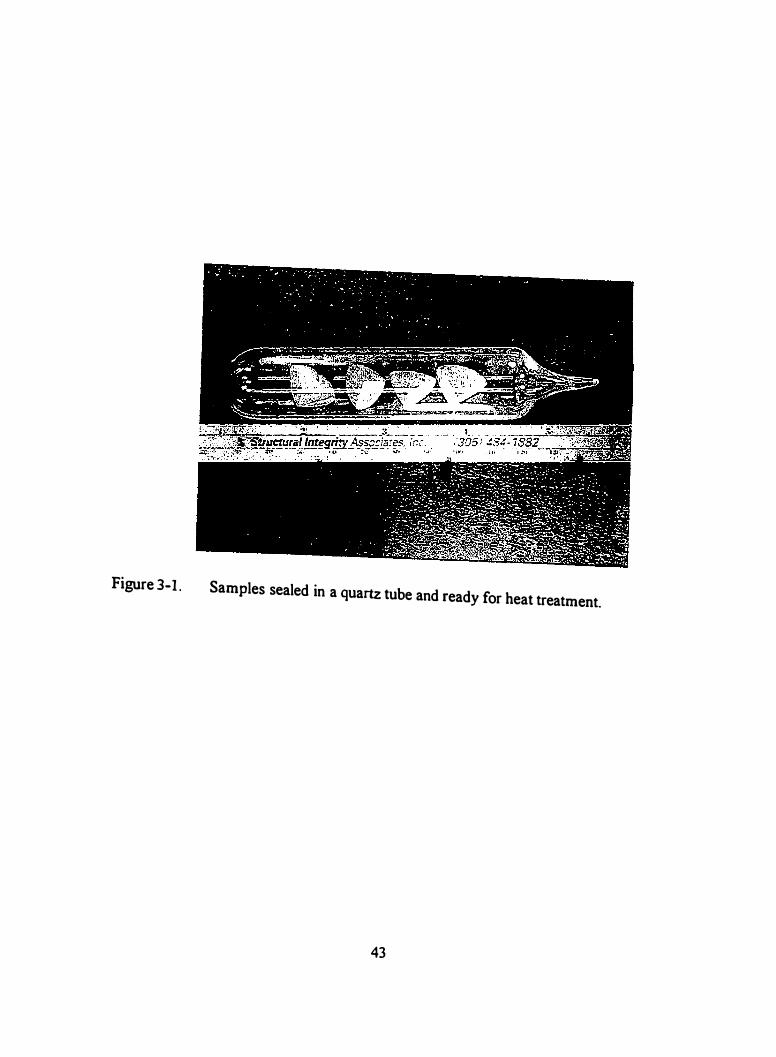
Figure 3-I . Samples sealed in a quartz tube and ready for heat treatment.
43

3 .3 . Heat Treatment
The heat treatments used in this study included homogenization heat treatment and
elevated temperature aging. Each quartz tube contained 3 to S (with different aluminum
contents) samples. The furnace temperature was checked randomly through out the period
of each of the heat treatments. The temperature variations were within ± S°C.
It was found that on aging at 6S0°C and 750°C for 1 00 hours without
homogenization treatment, the microstructure in the alloys still had the dendritic structural
appearance. Therefore, all the samples were homogenized in an argon atmosphere to reduce
the compositional gradients associated with solidification. The first homogenized parameter
was selected as 12S0°C for SO hours, but the microstructure of 9 at.% AI alloy showed
particles in the grain boundaries and matrix. However, according to Ni-Mo-Al ternary
phase diagram [65] at 1300°C and at 1260°C only a phase should be presented, so the
homogenization parameter was selected as 1280°C for SO hours followed by water
quenching by breaking the tube under water in order to obtain the single a phase by
arresting further phase transformation. Each group of samples was aged at 6�0°C, 650°C,
700°C, 750°C, 850°C, and 950°C for 100 hours. At the aging temperature of750°C, aging
times of 10, 50 and 100 hours were employed. After aging, the quartz tubes were broken
under water with a hammer. The heat treatment conditions are summarized in Table 3-3.
3 .4. Microhardness Measurement
A LEGO (Model M-400-G 1) Vickers micro hardness tester was used to conduct
the hardness measurements. A 500 gram load and I 5 second loading time were applied.
The standard Rockwell test blocks (65.3 HRC, 46.5 HRC and 36.3 HRC) were used for a
44

Table 3-3 . Heat treatment conditions employed
SHT
temperature (°C)
group I No
group 2 650
group 3 750
group 4 1250
group 5 1 280
.group 6 1280
group 7 1280
group 8 1280
group 9 1280
group 10 1280
group 1 1 1 280
group 12 1280
SHT: solution heat treatment
AHT: aging heat treatment
SHT
time (h)
No
100
100
50
50
50
50
50
50
50
50
50
45
AHT AHT
temperature (°C) time (h)
No No
- -
- -
- -
950 100
850 100
750 100
750 50
750 10
700 1 00
650 1 00
600 1 00

careful calibration prior to each group of the hardness measurements. For each of the
samples used, a minimum of five measurements were performed and an average hardness
value is reported. The variation was about ± 9 HV in the same location.
3 .5. Optical Light Microscopic (OLM) Evaluation
For microstructure examination, the samples were sectioned into two parts. One
part was used for metallographic examination and the other was used for preparing 1EM
samples. OLM metallographic samples were mounted in conductive bakelite and the
sectioned surface was used for the examination to avoid surface effects. All samples were
wet ground up to 600 grade using SiC paper and the final surface finishing was a 0.05 J.1.II1
Al203 slurry. Finally, the metallographic samples were chemically etched in the solution
in Table 3-4.
Table 3-4. Etching solution for OLM microstructural study.
HCl
1 50 ml lOO ml 25 g
During etching, the sample was swabbed for 3 to 10 seconds with a cotton ball at
room temperature. Then, the etched samples were washed with distilled water and
methanol then dried immediately. The etched surface was examined under an EPIPHOT
Tiv.lE Model metallurgical microscope at various magnifications and the typical images
were documented.
46
3 .6 Scanning Electron Microscopy (SEM) and Energy Disperse Spectrometer
(EDS) Investigation
A scanning electron microscope (SEM) equipped with an energy dispersive
spectrometer (EDS) possesses an unique capability to do microstructural analysis and
surface chemical analysis. The resolution of a SEM is significantly higher than an OLM,
thus detailed microstructural information can be gained by SEM examination. By using
backscattered electron imaging (BSE), Z-contrast (chemical contrast) can reveal elemental
distribution patterns in a sample. Therefore, the information of general chemical
distribution can be manifested qualitatively by employing Z-contrast technique. Both
secondary electron imaging (SE) and backscattered electron imaging (BSE) techniques
were used in order to obtain maximum information.
In this research, the detailed microstructures of the modified alloys were evaluated
using a Cambridge Stereoscan (Model 360) SEM equipped with a EDS analytical system
(Model 1 0,000 LINK).
3 .7. Fractographic Study Using SEM and EDS
Fractographic examination of bend-rupture samples was conducted utilizing
Cambridge Steroscan Model 360 SEM. Samples in three different heat treatment
conditions were chosen for fractographic examination. One condition was solution
treatment alone, for which the sample had been heated to 1 250°C, held at that
temperature for 50 hours, then water quenched. Two other conditions were solution
treatment ( 1280°C for 50 hours) plus an aging at 750°C and at 950°C for 1 00 hours
followed by water quenching. The cracking tendency of the materials as a function of
47

aluminum content was studied through the bend-rupture specimens. A schematic drawing
of the bending fixture used is shown in Figure 3-2. Two different bending radii, 1 0 mm
and 1 3 .5 mm, were applied.
The bending rupture sample was machined in a plate form with a dimension of
I x 25 x 28 mm. Prior to the bending process, one side of the larger surface of the plate
was metallographic alloy polished to 0.05 Jlm Al203 slurry and etched in order to study
the surface deformation and rupture phenomena. The sample was placed in the three
point bending fracture. The bending load was slowly applied until cracking was observed
by naked eye. The sample was examined under SEM to determine the crack propagation
direction relative to the microstructural features. The sample was further bent to advance
the cracks until it was completely fractured after preliminary SEM examination. The
fracture surface was examined again under SEM.
3 .8. Transmission Electron Microscopy (TEM)
In this section, detailed information is given about the order of materials and heat
treatment conditions used for TEM examination samples, preparation ofTEM
specimens, microstructural characterization, and constituents analysis.
3 .8 . 1 . Materials and Heat Treatments Applied for TEM Study
Two basic groups of materials were examined for TEM evaluation. The first
group was prepared from a quarter bottom of the arc-melted ingot of the Ni4Mo alloy and
the Ni-Mo-Al alloys. The TEM evaluation was undertaken for various heat treatments.
The second group of materials used for TEM evaluation was commercial Hastelloy B2
alloy without aluminum additions. The chemical composition of the Hastelloy B2 alloy
48

Figure 3-2.
(a)
A: Bending-fixture B : Bending block, radius I 0 mm C: Bending block, radius 13 .5 mm
(b)
(a). Schematic diagram of the three-point bending-fixture used to initiate cracking: (b). The real bending-fixture.
49

is in Table 3-5. The specimens were prepared in different aging conditions. The materials
received were 6.4 mm in diameter swaged rods that were solution-annealed for 100 hours
at 1 065°C followed by water quenching. The rods were then further swaged to a diameter
of 3 .2 mm and solution annealed for 2 hours at 1065°C followed by water quenching.
The solution heat treatments were carried out in an argon atmosphere. The samples were
sealed in quartz tubes under an argon atmosphere, and then heated at 550°C, 650°C,
750°C, and 850°C for 200, 400, 800, and 1200 hours.
Table 3-5. Chemical composition (wt.%) of the Hastelloy B2 alloy studied
Ni Cr Mo Fe Si Mn c p s
Bal. 0.97 27.62 0.82 0.02 0.26 <0. 1 0 0 .005 <0.002
3 .8.2. IEM Specimen Preparation
From the small arc-melted ingot samples (Ni4Mo alloy with aluminum additions},
about I mm thickness thin discs were sliced from the heat treated materials with a high speed, thin abrasive blade with copious water for cooling. The thin discs were ground
about 3 mm in diameter thinner plate. The thickness of these discs was wet ground at
600 grade using SiC paper by slow speed hand grinding, and reduced to an approximately
0.3 mm thickness.
For the Hastelloy B2 alloy, the disc specimens were cut from the aged rods at
about I mm thickness, then they were wet ground at 600 grade using SiC paper by slow
speed, hand grinding to approximately 0.3 mm in thickness.
The ready discs (about 0.3 mm in thickness) were further electrochemically
thinned at their center by using a Struers Tenupol type twin jet polishing apparatus,
50
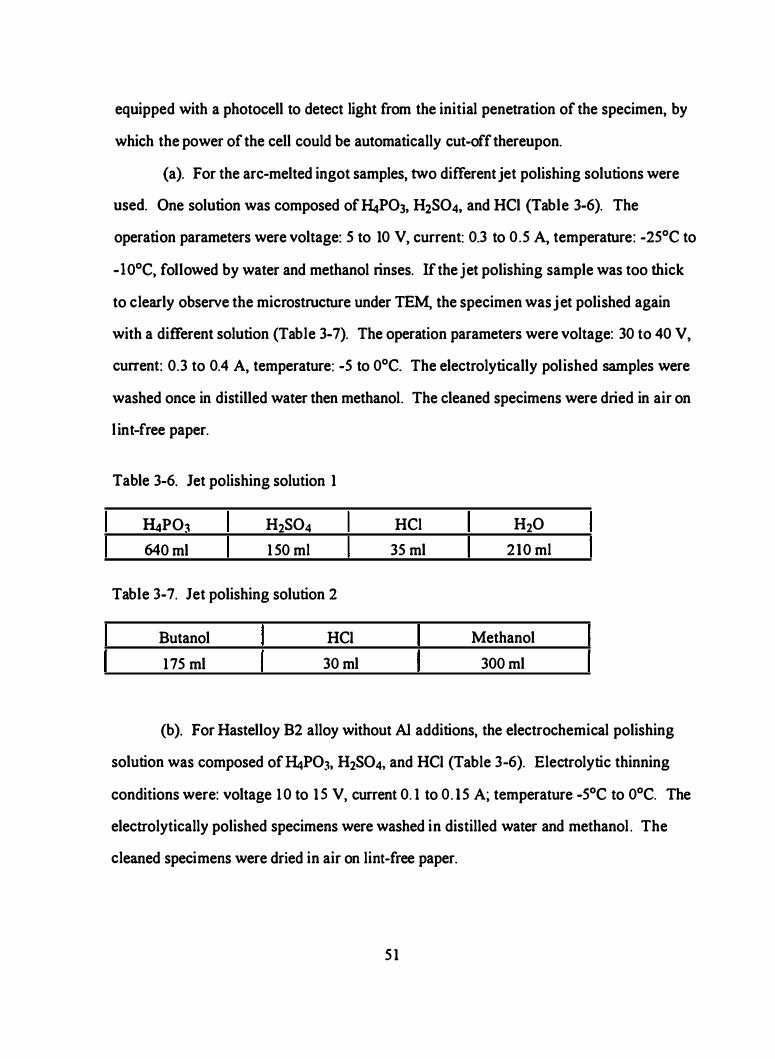
equipped with a photocell to detect light from the initial penetration of the specimen, by
which the power of the cell could be automatically cut-off thereupon.
(a). For the arc-melted ingot samples, two different jet polishing solutions were
used. One solution was composed of �P03, H2S04, and HCl (Table 3-6). The
operation parameters were voltage: 5 to 10 V, current: 0.3 to 0 .5 A, temperature: -25°C to
-l0°C, followed by water and methanol rinses. If the jet polishing sample was too thick
to clearly observe the microstructure under TEM, the specimen was jet polished again
with a different solution (Table 3-7). The operation parameters were voltage: 30 to 40 V,
current: 0.3 to 0.4 A, temperature: -5 to 0°C. The electrolytically polished samples were
washed once in distilled water then methanol. The cleaned specimens were dried in air on
l int-free paper.
Table 3-6. Jet polishing solution 1
�P03 H2S04 HCl H20
640 ml 1 50 ml 35 ml 210 ml
Table 3-7. Jet polishing solution 2
Butanol HCI Methanol
1 75 ml 30 ml 300 ml
(b). For Hastelloy B2 alloy without AI additions, the electrochemical polishing
solution was composed of�P03, H2S04, and HCI (Table 3-6). Electrolytic thinning
conditions were: voltage 1 0 to 1 S V, current 0. 1 to 0. 1 5 A; temperature -5°C to 0°C. The
electrolytically polished specimens were washed in distilled water and methanol . The
cleaned specimens were dried in air on lint-free paper.
5 1

In order to obtain the best prepared condition, an ion milling process was carried
out on the twin jet polished specimens. A Model 600 Dif and 600 TMP Duo MillTM
type ion milling apparatus was employed. Liquid nitrogen was used to maintain a
relatively low temperature for the specimen area. The ion milling conditions were voltage:
6V, beam angle: 12 to 1 5°, gun current: 0.5 to 0.7A, the time spent: 30 minutes.
3 .8.3. TEM Microstructural and EDS Analyses
The TEM thin disc samples were examined in a Phillips Model CM-12
transmission electron microscope at 120 KV. The microstructural features were
characterized by representative photomicrographs. The microstructure and
microconstituents were also characterized by electron diffraction patterns. Typical TEM
microstructure and electron diffraction patterns were obtained. A Model PV9900 energy
dispersive spectrometer was used for obtaining chemical X-ray analysis.
3 .9. Corrosion Resistance Evaluation
3 .9. 1 Investigation of the Corrosion Resistance ofNi4Mo Alloy -
A Ni4Mo alloy has useful resistance to a variety of corrosives. But the subject of
metallic corrosion is highly complex, involving consideration of the microstructural
features of the alloy. The various reactions may occur at the metal and environment
interface and depend on the chemical nature of the environment. Thus, the corrosion
resistance investigation on the Ni�o alloy was performed consisting of three
approaches described in the following sections.
52

a). ASTM A262 Practice A Examination
A262 Practice A test is used for acceptance of materials and also is used in
connection with other evaluation tests to provide a method for identifying samples which
are certain to be free of susceptibility to intergranular attack. After the A262 Practice A
test, the etched surface is examined with an optical light microscopy. The etched
structures are classified into the following types: step structure, dual structure, ditch
structure, end-grain pitting I, and end-grain pitting II. Only a ditch structure is not
acceptable.
The sample in the form of a hot forged bar was received for this test. The
microstructure showed a single ex phase and no 13 phase was observed. The sample of
surface area 10 X 10 mm was mounted in epoxy. It was wet ground to 600 grade using
SiC paper and the final surface finishing was 0.05 ).lm Al203 slurry. The solution for
A262 Practice A [60] was prepared by adding lOOg of reagent grade oxalic acid crystals to
900 ml of distilled water (1 0% oxalic acid), then stirring until all crystals were dissolved.
A A225BR2 D-C Amplifier and a V202AR2 D-C Voltammeter was employed for
the ASTM A262 test. After placing the specimen into the electrolyte ( 10% oxalic acid),
it was contacted as an anode and an AISI 304 austenitic stainless steel container was
employed as a cathode in the oxalic acid to form a circuit. A current density of 1 A/cm2
was employed for 1 .5 minutes. Then the sample was washed with distilled water
immediately after etching. The etched surface was examined under an optical light
microscope at 200X to document the corrosion results.
b). Potentiodynamic Anodic Polarization Testing
Potentiodynamic anodic polarization is the characterization of a metal specimen
by its current-potential relationship. The results can give information about polarization
53

of an active-passive alloy and also may be used to judge the corrosion resistance of alloy
and the corrosive strength of the solution.
An EG & G Model 273 Potentiostat with Softcorr Corrosion Measurement
Software was used for the potentiodynamic anodic polarization test. The specimen
surface was 1 0 X 1 0 mm with a final surface finish of0.05 1..1m Ah03 slurry. In
accordance with ASTM GS-87 [61], the solution was prepared with 1000 ml of LON
H2S04 reagent grade acid and distilled water ( 49g H2S04, I 000 ml H20). The apparatus
included a potentiostat, a working electrode (the specimen), a reference electrode
(saturated calomel), a counter electrode (platinum), a high input impedance voltmeter, and
a polarization cell . Reduction of oxygen level in the solution prior to immersion of the
test specimen was accomplished by bubbling nitrogen for 30 minutes. Then, the
specimen was moved into the test cel l . The open circuit specimen potential was recorded
until the potential was stable. In the potentiodymamic method, a potentiodynamic
potential sweep rate of 0.6 Vlh was utilized while recording the resultant current.
c). Modified ASTM G-30 U-Bend Test
The U-bend test can be used for evaluation of stress-corrosion cracking in metals.
It is useful for determining the relative susceptibility of a metal to intergranular stress
corrosion cracking.
The size of the simplified U-bend test specimen was 3 X 5 X 0.05 em. The
examined surface was wet ground by using 600 SiC paper prior to the final finishing of
0.05 1..1m Al203 slurry. The specimen was deformed in mainly plastic deformation into
the U-shape with a designed fixture (Figure 3-3a). The fixture was made of 304 stainless
steel. The bend specimen radius was 1 2 mm resulting in a total strain of s = T/2R = 0.021
(ASTM-G30) [62]. The testing was conducted using a DC power supply. The anode
54

Figure 3-3 .
U-bend test sample
(a)
+ ,..---�-----1 DC Power
S upply
(b)
(a) The specimen was defonned into the U shape with a designed fixture (b) Schematic diagram of the U-bend test working circuit.
55
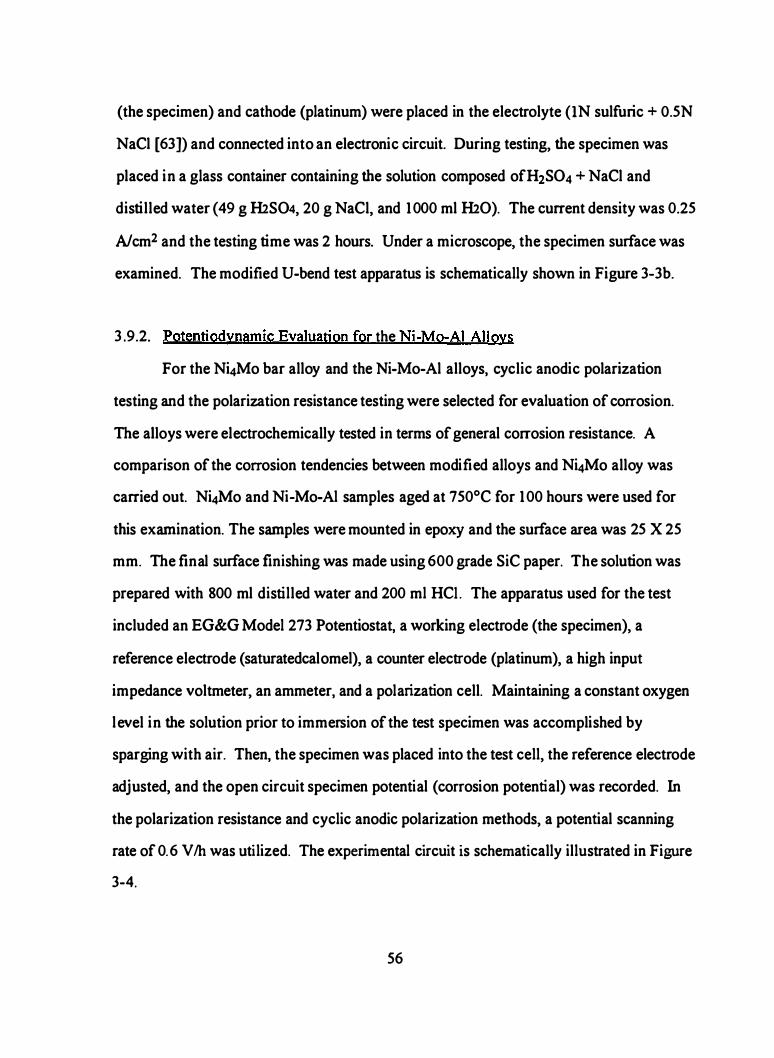
(the specimen) and cathode (platinum) were placed in the electrolyte (IN sulfuric + O.SN
NaCl [63]) and connected into an electronic circuit. During testing, the specimen was
placed in a glass container containing the solution composed of H2S04 + NaCl and
distilled water ( 49 g H2S04, 20 g NaCl, and 1 000 ml H20). The current density was 0.25
A/cm2 and the testing time was 2 hours. Under a microscope, the specimen surface was
examined. The modified U-bend test apparatus is schematically shown in Figure 3-3b.
3 .9.2. Potentiodynamic Evaluation for the Ni-Mo-Al Alloys
For the Ni4Mo bar alloy and the Ni-Mo-Al alloys, cyclic anodic polarization
testing and the polarization resistance testing were selected for evaluation of corrosion.
The alloys were electrochemically tested in terms of general corrosion resistance. A
comparison of the corrosion tendencies between modified alloys and Ni4Mo alloy was
carried out. Ni4Mo and Ni-Mo-Al samples aged at 750°C for 1 00 hours were used for
this examination. The samples were mounted in epoxy and the surface area was 25 X 25
mm. The final surface finishing was made using 600 grade SiC paper. The solution was
prepared with 800 ml distilled water and 200 ml HCI . The apparatus used for the test
included an EG&G Model 273 Potentiostat, a working electrode (the specimen), a
reference electrode (saturatedcalomel), a counter electrode (platinum), a high input
impedance voltmeter, an ammeter, and a polarization cell. Maintaining a constant oxygen
level in the solution prior to immersion of the test specimen was accomplished by
sparging with air. Then, the specimen was placed into the test cell, the reference electrode
adjusted, and the open circuit specimen potential (corrosion potential) was recorded. In
the polarization resistance and cyclic anodic polarization methods, a potential scanning
rate of 0.6 Vlh was utilized. The experimental circuit is schematically illustrated in Figure
3-4.
56

Figure 3-4.
-
. . ..
·:· .· .. . .
COUNTER
E! EQRODE
-·
SOLUTION
a
Poten liostal
W OB)(!�O E! fORODE
POLRBIZRT!ON C'"tL
b (a) Schematic diagram of electrochemical polarization cell; (b) Schematic diagram of the electrochemical polarization working circuit (V: voltammeter, A: amperemeter).
57

CHAPTER 4
RESULTS AND DISCUSSION
The results of hardness measurements, microstructural observations, fractographic
evaluation and corrosion resistance assessment are presented and discussed in this
chapter. The emphasis is on the effect of the AI additions to the base Ni4Mo alloy. By
far most of the research involved microstructural examination, especially transmission
electron microscopy, and the results concentrate on this part of the study.
4. 1 . Hardness Measurements
The hardness results are discussed for two separate groups of materials. The first
group of materials was not solution heat treated and therefore, in the sample with a low
temperature aging condition, clear evidence of the casting structure is exhibited. The
second group of materials was solution heat treated at 1 280°C for 50 hours followed by
water quenching, and a well homogenized solution-annealed microstructure is clearly
manifested. Materials in both groups showed a trend of hardness as a function of aging
parameters and aluminum content which will be further correlated to their microstructural
evolution. For each sample, more than five measurements were conducted and an average
hardness value is reported. The variation is ± 9 HV in the same phase.
58

4. 1 . 1 Hardness Measurements in the Alloys in the As-Cast Condition (without
Homogenization)
In this group, hardness measurement results are discussed in terms of aging
parameters (temperature and time) and amount of aluminum addition for the as-cast
condition. The relationship between hardness and aging condition and aluminum content
especially reflects the microstructural changes.
4. 1 . 1 . 1 Aluminum Content Effect
The effect of aluminum on the hardness is shown in Figure 4-1 . In the as-cast
condition, the hardness remained stable from 0 to 2 at.% aluminum and increased slightly
from 2 to 5 at.% aluminum. Then, on further increase of aluminum content from 5 to 7
at.%, the hardness increased dramatically. For all alminum additions, aging at 650°C
produced hardnesses about 100 to 200 HV above those of the as-cast condition, and aging
750°C increased the hardness another 100 to 200 HV increment. Homogenizing the as-cast
material for 50 hours at 1250°C gave the same hardness curve as the as-cast condition.
4. 1 . 1 .2 . Aging Parameter Effect
The hardness data are plotted against aging temperature in Figure 4-2. Also shown
i s the hardness in the as-cast condition and after a solution heat treatment of. 1250°C for 50
hours. There is a marked increase in hardness upon aging at 650°C, and then an additional
increase upon aging at 750°C. Note especially that the hardness of the 5 and 7 at.% AI
alloys has increased to around 600 to 650 HV. The solution heat treated hardness was
somewhat higher (about 100 HV) than that of the as-cast condition, but considerably lower
than the peak hardness attained upon aging at 750°C.
59
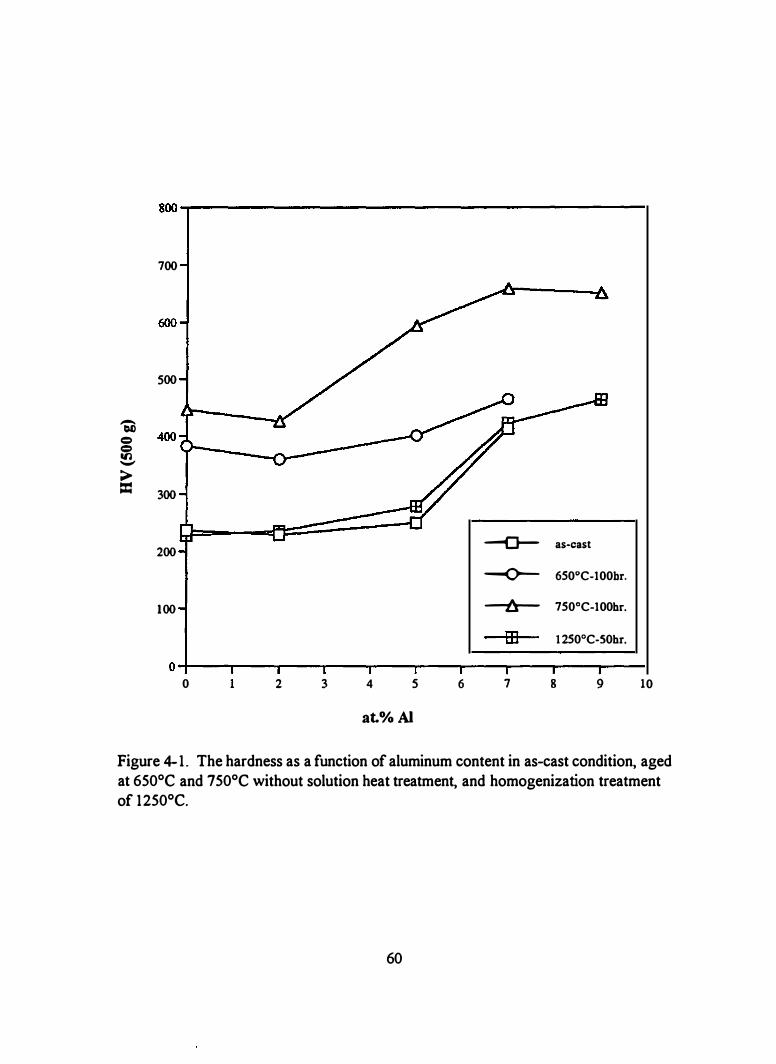
800�------------------------------------------------,
700
600
500
� = 400 � -> = 300
200 -a- as-cast
--o-- 650°C-100br.
1 00 --l::a- 750°C-100br.
EB 1 250°C-50br.
0 2 3 4 5 6 7 8 9 10
at.% AI
Figure 4-1 . The hardness as a function of aluminum content in as-cast condition, aged at 650°C and 750°C without solution heat treatment, and homogenization treatment of 1250°C.
60

800
-o- 0 at.% AI
700 e 2 at.% AI
----l:r- 5 at.% AI
600 * 7 at.% AI
500
400
300
200
as-cast condition
100
0 100 200 300 400 500 600 700 800 900 1000 1 100 1200 1300
temperature °C
Figure 4-2. The hardness as a function of aging at 650°C and 750°C for 100 hours in the as-cast condition (without homogenization treatment) and solution heat treated at 1 250°C for 50 hours with different aluminum content.
61

4. 1 .2. Hardness Measurement of the Solution Heat Treated Materials
In this group of materials, the solution heat treatment ( 1 280°C, 50 hours) was
performed prior to the aging study, thus, the microstructures in the alloys are significantly
homogenized compared to the first group of materials, which was not solution heat treated.
The hardness measurement data are analyzed as a function of aluminum content and aging
parameter.
4. 1 .2. 1 . (a) Aluminum Content Effect (different aging temperature for 100 hours)
The effect of aluminum content and aging temperature ( 100 hours) on the hardness
is shown in Figure 4-3 . The solution heat treatment was 50 hours at 1 280°C, but no
hardness data were available. However, data are shown for a solution heat treatment of 50
hours at 1 250°C, and subsequent microstructure analysis revealed no difference in the
solution heat treated structure. The hardness increases gradually and considerably with an
increase in aluminum content for the solution heat treated condition. This normally would
be attributed to solid solution strengthening, as the structure revealed by optical
microscopy appeared single phase (see Section 4.2). However, transmission electron
microscopy revealed that the ex. phase was not always retained on quenching, and this is
discussed later.
(b) Aluminum Content Effect (different aging time at 750°C)
Figure 4-4 gives the relationship of hardness and aluminum content upon aging at
750°C for different aging times. The hardness of solution heat treatment condition is also
presented. The hardness of 2 at.% AI alloy upon aging for 10 hours shows a lower value
than that of solution heat treatment condition. TEM shows the ex. phase in 2 at.% AI alloy
after aging for 10 hours. With increase of aluminum content from 2 to 5 a.%, the hardenss
62

';D = = Ill) -> =
800�----------------------------------------------�
500
400
950°C- 100brs
300 -o- 850°C-l OObrs
---l:r- 750°C-100hrs
200 EB 700°C- l OObrs
)I( 650°C-1 OOhrs
100
E9 600°C-100brs
--!]- 1250°C-50brs 0
0 1 2 3 4 5 6 7 8 9
at.% AI
Figure 4-3 . The hardness as a function of aluminum content at different aging temperatures for 1 00 hours (solution heat treated at 1280°C for 50 hours), and solution heat treated at 1250°C for 50 hours.
63
10

800�------------------------------------------------�
700
600
500
� c::> ; 400 �:::::::::=o--Q > =
300
200 --o-- 1 so•c- 1 OObrs
)I( 750°C-50brs
-o-- 7 so•c - 1 Ohrs solution heat treated at 1250°C
100
-l::r- 1 250°C-50brs
0 2 3 4 5 6 7 8 9
at.% AI
Figure 4-4. The hardness as a function of aluminum content for aging at 750°C for different times.
64
10

increases markly, but further increase of aluminum, the hardness decrased slightly. Upon
aging for 50 hours, the hardness in alloys is similar to that for aging for 100 hours.
4. 1 .2.2. (a) Aging Temperature Effect
The Ni4Mo alloy increases in hardness from about 220 to about 380 upon aging at
650°C and 750°C. For the 2 % AI alloy, the hardness is about the same for all aging
temperatures. The notable exception is a decrease of about 100 HV upon aging at 650°C.
There is marked increase in hardness upon the addition of5 at.% AI for all aging conditions.
With higher aluminum addition of7 and 9 at.%, the hardness is about constant upon aging
from 650°C to 850°C, but increases for aging at 600°C. The highest hardness is attained
upon aging at 700°C.
The hardness results are plotted in Figure 4-5 as a function of aging temperature.
The base Ni4Mo alloy shows a marked increase in hardness (from about 220 to about 380
HV}, attaining a maximum at 750°C. The 2 % AI alloy shows a similar response. The 5, 7
and 9 at.% AI alloys all attain about the same peak hardness of about 640 HV upon aging
100 hours at 700°C. The hardness result ofNi<tMo alloy is in agreement of the base
Ni�o alloy with the data of Snyder and Brooks [64].
(b) Aging Time Effect (at 750°C)
The alloys were aged at 750°C for 10, SO and 100 hours. The data is shown in
Figure 4-6. As a base line, the solution heat treated data are also shown. With the
exception of the 2 at.% AI alloy, aging for 10 hours decreased the hardness considerably,
and there was a further increase upon aging for 50 hours. However, aging for 1 00 hours
produced the same hardness as for 50 hours. The marked exception to the clear hardening
trend is the lack of hardening of the 2 at.% AI alloy upon aging for 10 hours. TEM shows
65
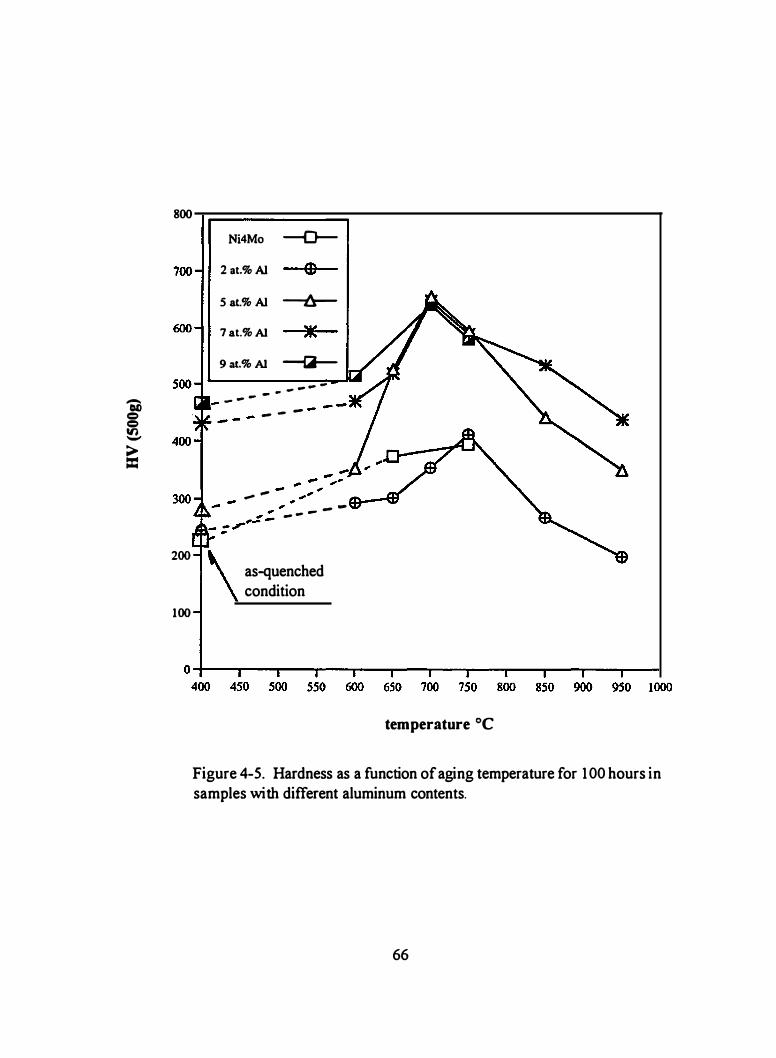
800
-00 = = V) -> =
200
100
Ni4Mo --o--2 at.% AI E9 S at.% AI -ts:-7 at.% AI )I( 9 at.% AI --lk-
- � -- - -
- - -- - -
- ----
, - -- - -
as-quenched condition
temperature oc
Figure 4-5. Hardness as a function of aging temperature for 100 hours in samples with different aluminum contents.
66
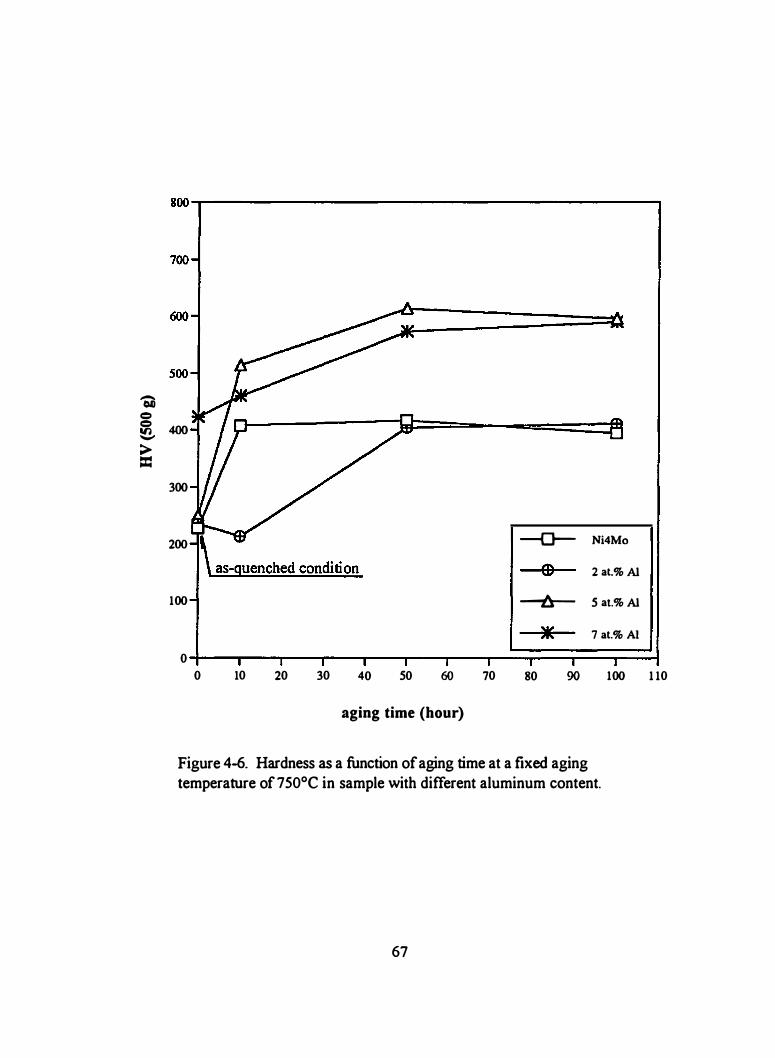
800�--------------------------------------------------,
'CD e e � 400 > =
300
200 -o- Ni4Mo
E9 2 at.% Al
100 --l:r-- 5 at.% Al
* 7 at.% AI
0
0 10 20 30 40 50 60 70 80 90 100
aging time (hour)
Figure 4-6. Hardness as a function of aging time at a fixed aging temperature of750°C in sample with different aluminum content.
67
1 10

the a phase in 2 at.% AI alloy upon aging for 10 hours and is discussed in section 4.5.
4-2. Optical Light Microscopic (OLM) Microstructural Evaluation in Ni4Mo and
Ni-Mo-AI Alloys
As shown in the above section, the hardness is a function of aging condition and
aluminum content in the alloys studied. To help understand the effect of aluminum
addition on hardness, in this section the results of OLM microstructural evaluation are
given. In order to properly interpret the microstructural features, the phase constitution
relationships and solidification behavior are also examined for the Ni-Mo-Al alloy
system. The step by step description and discussion of aging effect on microstructures in
the alloys studied are given in this section.
The low resolution of the OLM prevents determination of the fine structure and
OLM provides no direct chemical analysis of the phases formed. The results of the
examination using SEM and TEM are given in subsequent sections, where the basis of
identifying the microstructural features is described. In this section, which describes only
the OLM results, some of the labeling of the phases is based on the later work. For
example, the OLM microstructure may indicate only a single phase a, whereas TEM
reveals that it contains SRO a.. and the D022 structure.
4.2. 1 . Samples with an As-Cast Condition Plus Aged at 750°C for 1 00 Hours
As mentioned in the introduction, when the � phase forms from the a phase, the
domains produce a Widmanstatten etching pattern, which can be taken as proof that � has
formed. This pattern is found in the hot forged (without homogenization) Ni�o sample
68

after aging at 750°C for 100 hours (Figure 4-7). This transfonnation of the hot forged
structure to the � approximately doubled the hardness (see Figure 4- 1 ) . Note that there is
a mixture offonner a grain sizes, indicating uneven grain growth. Also note that the
etchant used did not reveal any dendritic segregation.
After aging at 750°C for 100 hours, the microstructures of the Ni-Mo-Al alloys
(as-cast condition) showed clear interdendritic solidification structure. Figures 4-8 and
4-9 show typical dendritic structure of the 2 and 9 at.% AI alloys at low magnification
(e.g. 1 OOX).
A higher magnification micrograph for the 2 at% AI alloy is presented in Figure
4-10. A lamellar structure (see arrow) started to fonn at selective locations (localized
molybdenum and/or aluminum rich or poor area). The 5 at.% AI alloy shows mixed
structures of dark and bright regions (Figure 4-1 1 ). The microstructure in 7 at.% AI alloy
contains both dark and bright regions (Figure 4-12). In the dark regions, a lamellar
structure was found (see arrow). The microstructure in 9 at.% AI alloy contained a
lamellar structure, bright and dark regions (Figure 4-13).
In the as-forged condition, the grain size of the Ni4Mo alloy was uniform (Figure
4-14). However, after aging for 100 hours at 750°C, a rather duplex grain size is present
(Figure 4-7) having an appearance of recrystallization. The origin of this effect was not
established. For this heat treatment, the structure will be completely � phase in this
binary alloy.
After aging for 1 00 hours at 750°C (without homogenization treatment}, the as-cast
dendritic structure can not be completely removed and/or homogenized. In the Ni4Mo
alloy, the hardness increased because the � phase fonned and recrystallization occurred. In
the Ni-Mo-AI alloys, the secondary phase fonned is due to the localized alloying element
segregation which favors the formation of secondary phases. As indicated in Figure 4-1 , the
69
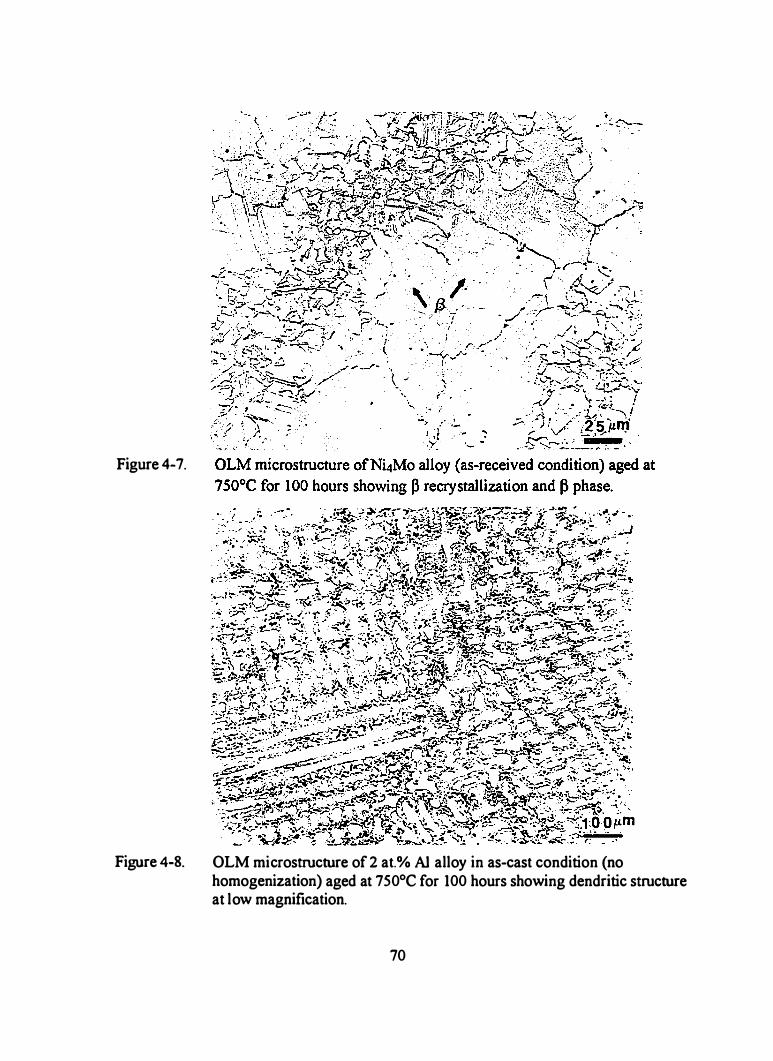
Figure 4-7.
Figure 4-8. OLM microstructure of 2 at.% AI alloy in as-cast condition (no homogenization) aged at 750°C for 100 hours showing dendritic structure at low magnification.
70

71
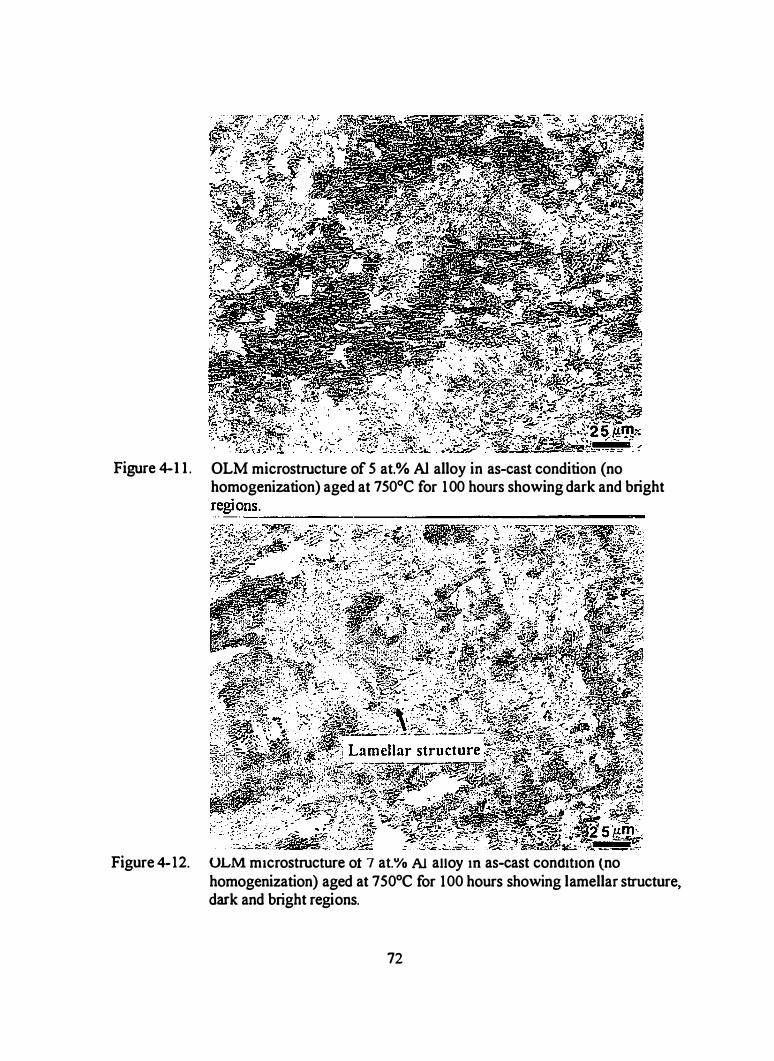
Figure 4-1 1 . OLM microstructure of 5 at.% AI alloy in as-cast condition (no homogenization) aged at 750°C for 100 hours showing dark and bright
Figure 4-12. ULM microstructure ot 7 at.% AJ alloy m as-cast cond1t1on lno homogenization) aged at 750°C for 100 hours showing lamellar structure. dark and bright regions.
72

Figure 4-13.
Figure 4-14.
.... =: .
. .�.-:�....;..::t� -;-·�-��f. ... : .. � :·. ;:;���-i:-�.·:�i#£ -- . . ��·'" · · i'
''·""·'''-'···���='c'<:�:.-· ���J,,;�[���; ?;,���t<��- 1 :�·�� OLM microstructure of9 at.% AI alloy in as-cast condition (no homogenization) aged at 750°C for 100 hours showing lamellar structure, dark and bright regions . . "I· . . : :·�/ - � � ." ._, _ ,�J " I ._: � 4�--DJ:? ��· . ��· - .'-.. \ . ' · ·\
j_ � -.. ' · . (;;" i . . . ,�:;!_[ '· i
• . • � I t \. ' / - • '
( - -: " / ��- · \ ·. r . �"---: � _ _,
I A . • - · . '· ·, . .....----: · · ·- jr / ·.:��/,:' I
-
. --. .
•
"--·-- .
' I I •
'"\'---, , 2 5 ,.tm· ·-.......,_ \ �
OLM microstructure ofNi4Mo alloy in as-received condition (hot forged) single a phase with annealing twins.
73
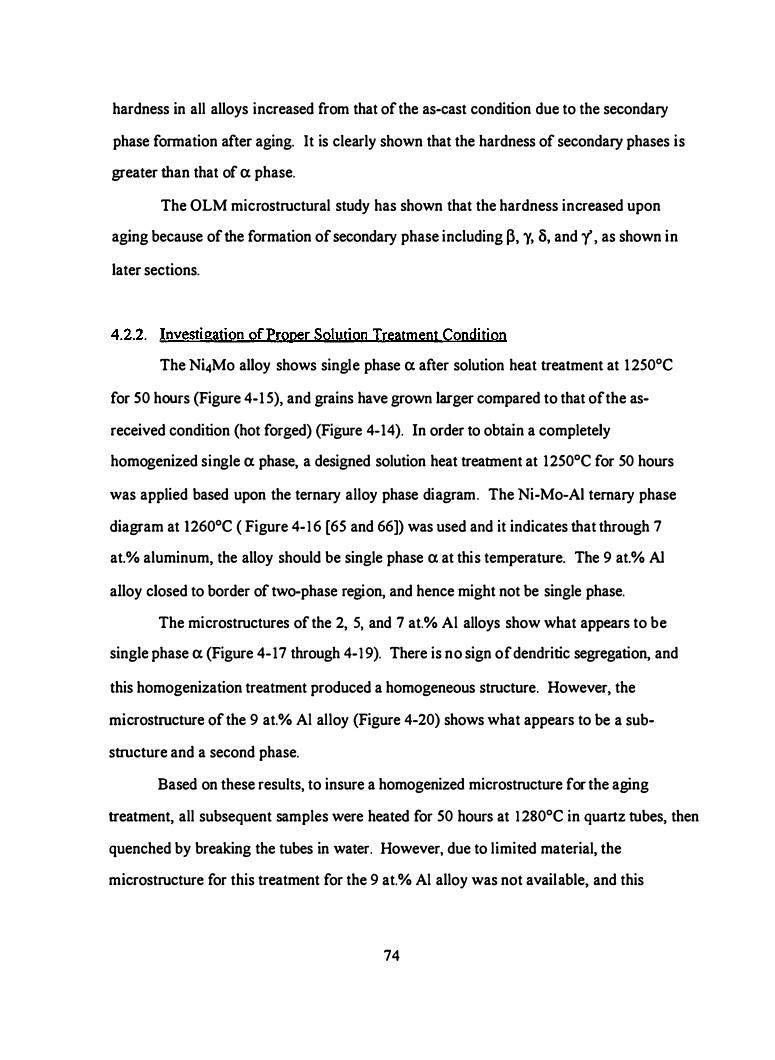
hardness in all alloys increased from that of the as-cast condition due to the secondary
phase formation after aging. It is clearly shown that the hardness of secondary phases is
greater than that of a phase.
The OLM microstructural study has shown that the hardness increased upon
aging because of the formation of secondary phase including J3, y, S, and "(, as shown in
later sections.
4.2.2. Investigation ofPrqper Solution Treatment Condition
The Ni4Mo alloy shows single phase a after solution heat treatment at 1 250°C
for SO hours (Figure 4-1 5), and grains have grown larger compared to that of the as
received condition (hot forged) (Figure 4-14). In order to obtain a completely
homogenized single a phase, a designed solution heat treatment at 1250°C for 50 hours
was applied based upon the ternary alloy phase diagram. The Ni-Mo-AI ternary phase
diagram at 1260°C ( Figure 4- 1 6 [ 65 and 66]) was used and it indicates that through 7
at.% aluminum, the alloy should be single phase a at this temperature. The 9 at.% AI
alloy closed to border of two-phase region, and hence might not be single phase.
The microstructures of the 2, S, and 7 at.% AI alloys show what appears to be
single phase a (Figure 4-17 through 4- 1 9). There is no sign of dendritic segregation, and
this homogenization treatment produced a homogeneous structure. However, the
microstructure of the 9 at.% AI alloy (Figure 4-20) shows what appears to be a sub
structure and a second phase.
Based on these results, to insure a homogenized microstructure for the aging
treatment, all subsequent samples were heated for 50 hours at 1 280°C in quartz tubes, then
quenched by breaking the tubes in water. However, due to limited material, the
microstructure for this treatment for the 9 at.% AI alloy was not available, and this
74

1 : · ' L ·� - --- ··
· .. "'-.. . . . · · ·
. . :-- · · <, \ � . \ · . .
\ . \
( .. � . , _ _ _ . . - . '
· . . · . . .. . .. : . -
.·
Figure 4-15. OLM microstructure ofNi4Mo alloy homogenized at 1 250°C for 50 hours showing single a phase with annealing twins.
75

a Mo 1260°C ( uss K )
AI 10 zo
b 60 '70 80
AlNb 00
Figure 4-16. Ni-Mo-Al ternary alloy phase diagram at 1260°C.
(Ni)
Ni
1 0
N i
Ref. P. Villars, A. Prince, and H. Okamoto, Handbook of Ternary Alloy Phase Diagrams, Vol. 4, pp. 4046-4066, ASM International, Materials Park, OH, 1995 .
76
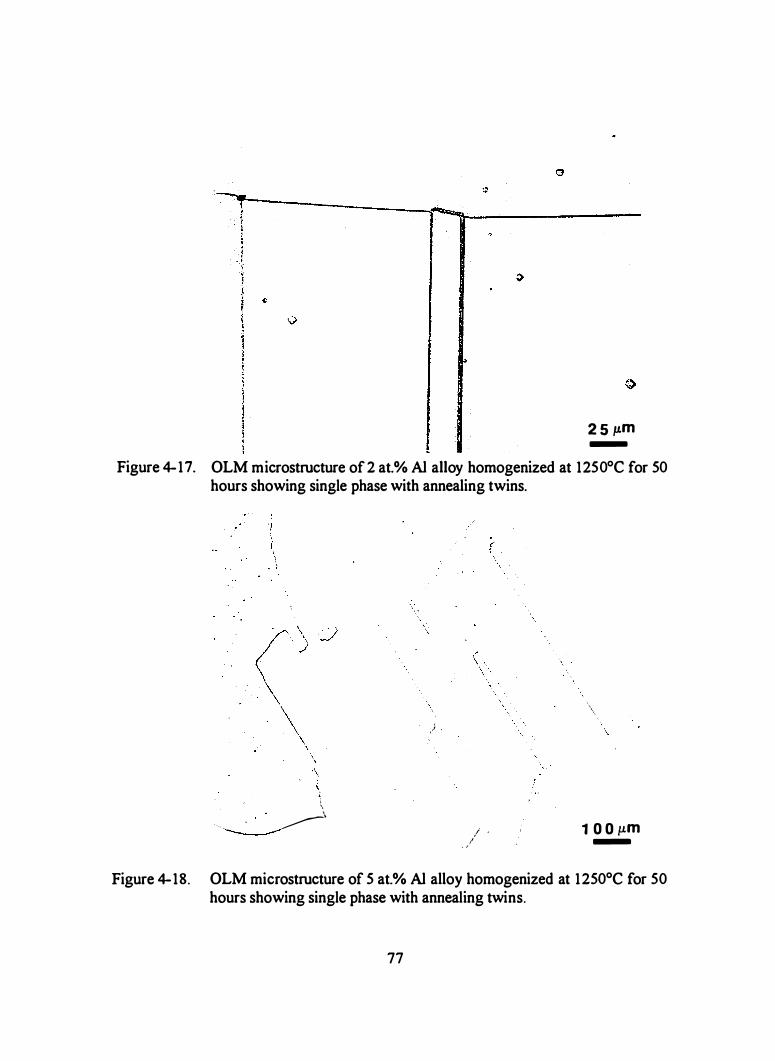
2 5 p.m -
Figure 4-17. OLM microstructure of 2 at.% AI alloy homogenized at 1250°C for 50 hours showing single phase with annealing twins.
\ ( . (
• .. �-------
) .
I . · '/
\ \
1 0 0 p.m -
Figure 4-18. OLM microstructure of 5 at.% AI alloy homogenized at 1250°C for 50 hours showing single phase with annealing twins.
77

0
./
' I
,'
. ·-·
2 5 J.tm -
Figure 4-19. OLM microstructure of 7 at.% AI alloy homogenized at 1 250°C for 50 hours showing single phase with annealing twins.
Figure 4-20. OLM microstructure in 9 at.% AI alloy homogenized at 1 250°C for 50 hours showing particles along grain boundaries and in matrix.
78

situation will be commented on later.
Figure 4-1 shows that for this homogenization treatment the hardness increased
considerably for aluminum additions of 7 and 9 at.%. This could be due to solid solution
strengthening, but the TEM results discussed later will show that the structure is not
single phase a, but ordered structures are presented.
4.2.3. OLM Microstructure ofNi-Mo-Al Alloys with a Solution Treated Plus Aged at
600°C for 1 00 Hours
The microstructures of the 2, 5, 7 and 9 at.% AI alloys are shown in Figures 4-21
to 4-24. A signle phase is exhibited in 2 and 5 at.% AI alloys (Figure 4-21 and 4-22) and
the 7 at.% AI alloy appears to be single phase a, but there is slight grain boundary
migration (Figure 4-23). There may be precipitation associated with this migration. In
the 9 at.% AI alloy (Figure 4-24), migration of the grain boundaries has occurred, a
lamellar structure has formed and some particles are present. Note that the lamellar
spacing (Figure 4-24b) is greater at the edge of the structure than in the center.
As shown in Figure 4-3, upon aging at 600°C for 100 hours the hardness of the
Ni4Mo alloy and the 2 and 5 at.% AI alloys remained about the same, or decreased
slightly, from the solution heat treated condition. This is consistent with the
microstructures which appear to have remained a phase. The hardness of the 7 at.% AI
alloy increased somewhat, but the main obvious microstructural change was slight grain
boundary migration, with an accompanying phase change. However, the amount of this
feature i s probably too slight to have effected this hardness change. The 9 at.% AI alloy
showed a very marked hardness increase, and this is clearly associated, at least partially,
with the presence of the lamellar structure. The relation of the microstructures and
hardness will be discussed in more detail in the TEM section.
79

i
\ \ \ \ \ -� / . · .
___-( '
' . l Figure 4-21 . OLM microstructure of2 at.% AI alloy aged at 600°C for 1 00 hours
showing single phase.
�' · '; I
I ! I \.
. ,
Figure 4-22. OLM microstructure of 5 at.% AI alloy aged at 600°C for I 00 hours showing single phase.
80

s o JLm -·-- '\. -
(a)
(b) Figure 4-23 . OLM microstructure of 7 at.% AI alloy aged at 600°C for 100 hours
showing grain boundary migration and secondary phase starting to form along the grain boundaries. (a) 200X (b) 400X.
8 1
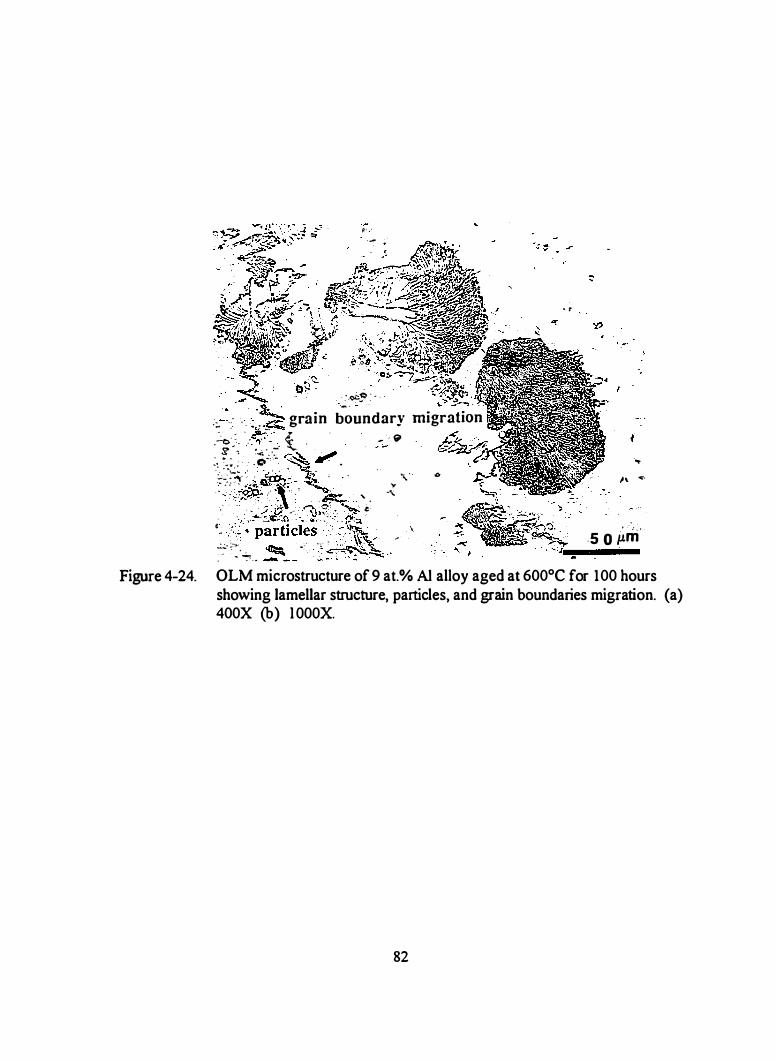
Figure 4-24.
, . . · - _ -
: . .,c� · - . - · -:. . . . . . grain boundary migration
-�: : _ - .. �-: . t . . . - - �
. �.-� . ���_.;' ·� .,... \?�· :..���- $. ' ·. .
. � �, · 6 · � :·:����· : 'I' 0 � ' · _, ' . . :·,.,.<.:· ·£?. .. - �·�a;;: . ·�. � � ' · . �'·�·-pa�ticie; · . ::-� _ � \ - -- �� - _,. "' . .... \),x :-:- - ·� . � - · .
� �� -·
• r
.....
;, ....
· ·· ; , ,._ -5 0 J.Lm
OLM microstructure of 9 at.% AI alloy aged at 600°C for 100 hours showing lamellar structure, particles, and grain boundaries migration. (a) 400X (b) I OOOX.
82

-e Q,) :s c ·.;: c 0 u
...,: N I "'':t e
. �� 6'o :� . . ' · -.. �
83
4.2.4. OLM Microstructure ofNi-Mo-Al Al1Qys with a Solution Treated Plus Aged
at 650°C for 100 Hours
In the Ni4Mo alloy, the microstructure appears to be single phase a, but there is
some slight grain boundary migration (Figure 4-25). Although a Widmanstatten structure
did not etch out, this treatment probably converted the a to a fine domain P structure, as
Figure 4-3 shows that the hardness has approximately doubled from this aging treatment
The boundary migration is probably accompanied by domain coarsening.
The 2 at.% AI alloy appears to be single phase a (Figure 4-26), and the hardness
decreased slightly (Figure 4-3). In this alloy there was grain boundary cracking, indicating
a decohesion of the high angle boundaries. This characteristic is common in the NL.Mo
alloy when the a converts to the ordered 13. which causes hardening but produces cracking
along the former a grain boundaries. However, Figure 4-3 shows that the hardness of the
2 at.% AI alloy has decreased slightly. The cracking is examined in more detail in the
section on fractography.
During aging the 5 at.% AI alloy, extensive lamellar structure formed along the
grain boundaries (Figure 4-27). There was also cracking along the location of the former a grain boundaries. At what stage this occurred is not known� that is, did these cracks form
prior or after the formation of the lamellar structure? Figure 4-3 shows that there is a
marked hardness increase.
In the 7 at.% AI alloy, there is a structure forming from the a grain boundaries,
and some formation inside the grains. The grain boundary migration is observed. The
matrix appears to be single phase (Figure 4-28). This alloy showed marked hardening
(Figure 4-3), but no cracking was observed.
84

,; . .
·. I I · . . i
l
/
---. 1 0 0 �m
-I
Figure 4-25. OLM microstructure ofNi4Mo alloy aged at 650°C for 100 hours showing � domain formation along the former a grain boundaries.
intergranular cracking
1 oo�m -
Figure 4-26. OLM microstructure of2 at.% AI alloy aged at 650°C for 100 hours showing single phase with intergranular cracking.
85

Figure 4-27. OLM microstructure of 5 at.% AI alloy aged at 650°C for 100 hours showing lamellar structure formation along grain boundaries with intergranular cracking.
� :.0 �
�<· �.1
_ seconda ry phase
Q 0
50 p.m Figure 4-28. OLM microstructure of 7 at.% AI alloy aged at 650°C for 100 hours
showing grain boundary migration with secondary phase nucleation along the grain boundaries and in the grains.
86

4.2.5 . OLM Microstructure ofNi-Mo-Al Alloys with a Solution Treated Plus Aged
at 700°C for 100 Hours
The phase diagram for the Ni-Mo-Al system at 700°C is shown in Figure 4-29
[65]. For each composition of the alloy, the equilibrium phases are noted. Although
aging for 100 hours may not establish equilibrium, the diagram gives a guideline of what
the microstructure may be.
The microstructure of the 2 at.% AI alloy (Figure 4-30) appears to be single
phase. At equilibrium this composition should be J3 and y phases. The precise structure
is established in the TEM section. Figure 4-3 shows that the hardness of this alloy did
not increase, but there is grain boundary cracking.
The 5 at.% AI alloy completely transformed to a lamellar structure (Figure 4-3 1 ).
The phase diagram predicts this alloy should be J3, y and i phases. As discussed in the
TEM section, this lamellar structure is composed ofy and y' . This structure caused the
greatest hardening of all the alloys and heat treatments (Figure 4-3).
The 7 at.% AI alloy formed a lamellar structure along the grain boundaries, but the
matrix appears to be single phase (Figure 4-32). The lamellar structure composes about
10% of the microstructure. Note that the hardness (Figure 4-3) is essentially the same
maximum as that for the 5 at.% AI alloy. This implies that the matrix is not a. The
structure is discussed in the TEM section.
The microstructure of the 9 at.% AI alloy is heterogeneous, and has the
appearance of retained dendritic segregation (Figure 4-33). In Figure 4-33a is an area
showing uneven distribution of particles. There are also regions in which a lamellar
structure has formed, but some regions appear to be untransformed a. There are also
discrete particles present (see arrows). It appears that the solution treatment of 1280°C
for 50 hours did not homogenize the 9 at.% AI alloy. The hardness of this alloy was also
87
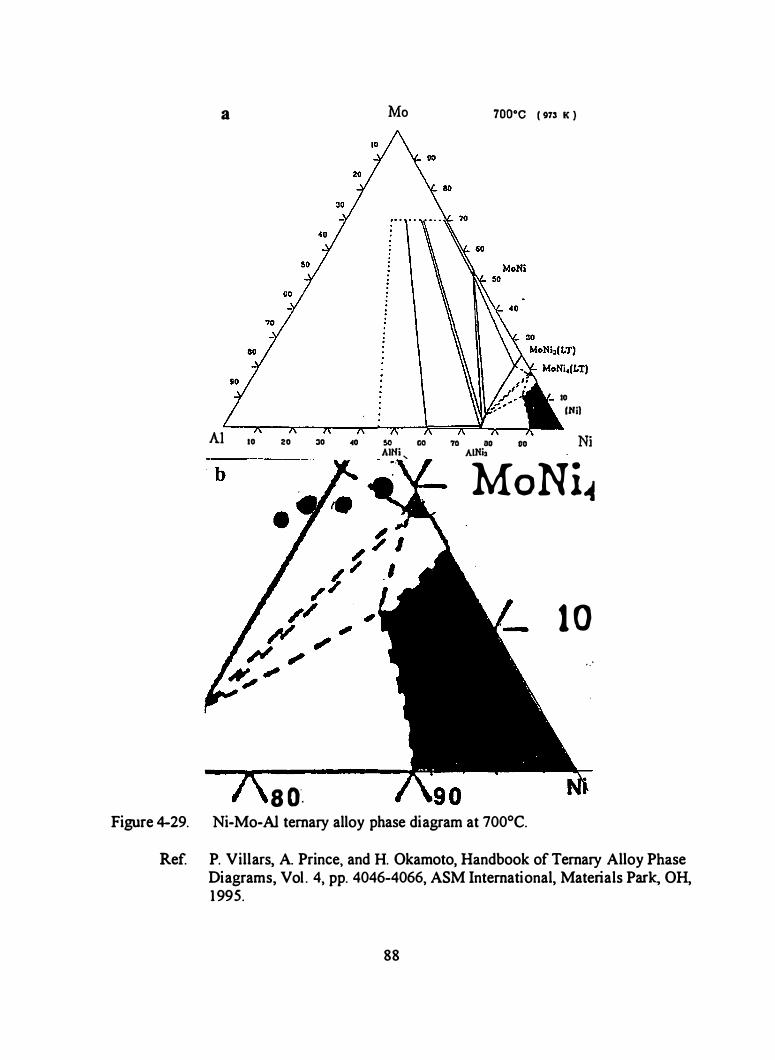
a
AI 10 20
s o·.
30
Mo
40 S,O GO AIMi ,
70 DO AIMi2
1oo•c 1 973 K >
80
10 (Nil
Ni
MoNi�
1 0 . . ·
Figure 4-29. Ni-Mo-Al ternary alloy phase diagram at 700°C.
Ref P. Villars, A. Prince, and H. Okamoto, Handbook of Ternary Alloy Phase Diagrams, Vol . 4, pp. 4046-4066, ASM International, Materials Park, OH, 1995.
88
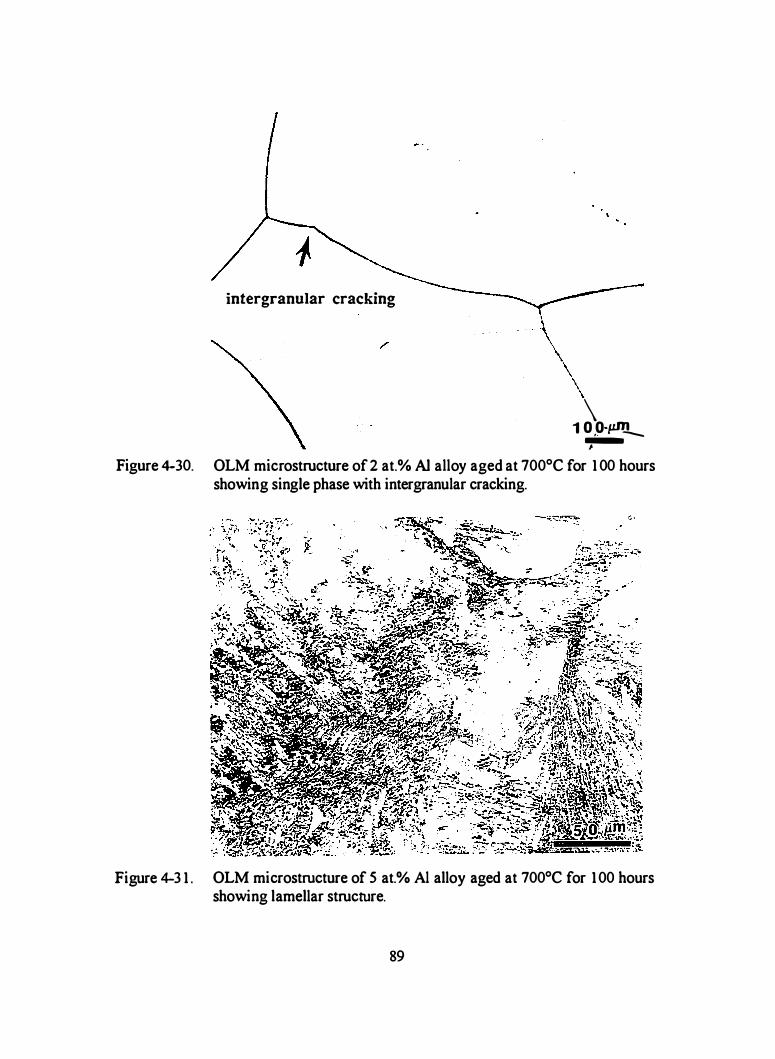
intergranular cracking
\ \ 1 0 ,0·1L"J--I
Figure 4-30. OLM microstructure of2 at.% AI alloy aged at 700°C for 1 00 hours showing single phase with intergranular cracking.
Figure 4-3 1 . OLM microstructure of 5 at.% AI alloy aged at 700°C for 1 00 hours showing lamellar structure.
89

\• \ 20 o ��i re t
Figure 4-32. OLM microstructure of 7 at.% Al alloy aged at 700°C for 1 00 hours showing phase transfonnation along grain boundaries.
90

Figure 4-33. OLM microstructure of9 at.% AI alloy aged at 700°C for 1 00 hours showing (a) particle precipitation, (b) lamellar structure and particles.
9 1
the maximum attained (Figure 4-3).
4.2.6. OLM Microstructure ofNi-Mo-AI Alloys with a Solution Treated Plus Aged
at 750°C for 1 0 Hours
Upon aging the Ni4Mo alloy for 10 hours at 750°C, slight grain boundary
migration is oserved and the Widmanstattern structure appeared (Figure 4-34),
characteristic of the presence of a fine � domain structure. The hardness approximately
doubled (Figure 4-4). The 2 at.% al alloy appears to be single phase (Figure 4-35). TEM
(discussed later) showed that this structure is <X, and this is consistent with the lack of
hardness change (Figure 4-6). Thus the 2 at.% AI alloy has retarded the formation of the
� phase. The 5 at.% AI alloy showed intergranular cracking and the formation of a
considerable amount of lamellar structure along the <X boundaries (Figure 4-36).
Considerable hardening occurred during the 10 hours aging (Figure 4-6). The 7 at.% AI
alloy showed some grain boundary migration accompanied by the formation of a lamellar
structure (Figure 4-37). Note that there is less of this structure in this 7 at.% AI alloy
than in the 5 at.% AI alloy, similar to that found upon aging at 700°C. This alloy only
showed a slight increase in hardness (Figure 4-6).
4.2.7. OLM Microstructure ofNi-Mo-Al Alloys with a Solution Treated Plus Aged
at 750°C for 50 Hours
The Ni4Mo alloy after aging for 50 hours at 750°C showed a prominent
Widmanstatten pattern (Figure 4-38), showing that the � phase is still present. The slight
boundary migration which occurred during 1 0 hours aging (see Figure 4-34) has
progressed, and is presumably associated with domain coarsening. The hardness is about
the same as that after 1 0 hours aging (Figure 4-4).
92

. � ! \ .. � · ·
\ \ '
j ( f
.t- /
' · · � ---· � \ \
\ 2 0 0 1-1m ·
Figure 4-34. OLM microstructure ofN�Mo alloy aged at 750°C for I 0 hours showing Widmanstattem pattern � phase.
s o .um
Figure 4-35. OLM microstructure of 2 at.% AI alloy aged at 750°C for 10 hours showing single a phase.
93

Figure 4-36. OLM microstructure of 5 at.% AI alloy aged at 750°C for 10 hours showing lamellar structure with intergranular cracking .
. ·
grain boundary migration
Figure 4-3 7. OLM microstructure of 7 at.% Al alloy aged at 750°C for 10 hours showing grain boundary migration and phase transformation along the grain boundaries.
94

Figure 4-38. OLM microstructure ofNi�o alloy aged at 750°C for 50 hours showing Widmanstatten pattern 13 and grain boundary migration.
95

The 2 at.% AI alloy appears to be mainly single phase, but there is a structure
growing from the grain boundaries (Figure 4-39). There is a marked increase in hardness
compared to that after aging 10 hours (Figure 4-4), indicating that the matrix is probably
not a phase. The structure is discussed in the TEM section. For the 5 at.% AI alloy, the
amount oflamellar structure has continued to increase to completely consume the matrix
(Figure 4-40). This alloy has the maximum hardness of all the alloys and heat treatments
(Figure 4-4). The 7 at.% AI alloy shows the lamellar structure forming from the grain
boundaries (Figure 4-41). A few regions of the formation of the lamellar structure within
the grains were found, but are not shown in Figure 4-41 .
With an increase of the aging time from I 0 hours to 50 hours at 750°C, the amount
of the lamellar structure increased in 5 at.% AI and 7 at.% AI alloys. In 2 at.% AI alloy, a
thin layer of secondary phase started to nucleate along the grain boundaries. The
i ntergranular cracking was found in both 2 at.% AI and 5 at.% AI alloys but not in 7 at.%
AI alloy. Thus, the cohesion of grain boundaries decreases in 2 at.% AI and 5 at.% AI
alloys under this aging condition but may be enhanced in 7 at.% AI alloy.
4.2.8 OLM Microstructure ofNi-Mo-Al Alloys with a Solution Treated Plus Aged
at 750°C for 100 Hours
The microstructure of the Ni4Mo alloy after aging at 750°C for 100 hours is
shown in Figure 4-42. The Widmanstatten pattern etches in a prominent fashion, and the
grain boundary migration associated with presumably coarsened � domains has
progressed further. The hardness is about the same as that after aging for only 10 hours
(Figure 4-4).
At low magnification, the microstructure of the 2 at.% AI alloy appears to be single
phase (Figure 4-43a). However, high magnification (Figure 4-43b) reveals precipitates
96

.• �-
secondary
._,.� · �� ..__
• 0
..
5 0 lim Figure 4-39. OLM microstructure of2 at.% AI alloy aged at 750° for 50 hours showing
phase transformation along the grain boundaries.
Figure 4-40. OLM microstructure of 5 at.% AI alloy aged at 750°C for 50 hours showing lamellar structure.
97

5 0 �tm .
98

I
5 0 JL1'i1
Figure 4-42. continue (b) and (c).
99

\ \
a
\ I \
b
\ \ \
.
I i
'\ .
--·· _..• '
./ / /
/. _1,__���2�0l!m
5 0 J.Lin/ Figure 4-43. OLM microstructure in 2 at.% AI alloy aged at 750°C for 100 hours
showing (a) single phase with annealing twins, (b) high magnification of secondary phase formation.
1 00
structure has formed along the grain boundaries and a denuded zone is produced
bounded by a band af fine precipitates. Precipitates are also present within the grains.
The 5 at.% AI alloy has converted almost entirely to a lamellar structure, which in regions
appears to be converting to a coarser lamellar structure (Figure 4-44). The 7 at.% AI alloy
shows a similar lamellar structure (Figure 4-45a), but less of it than in the 5 at.% AI alloy.
There is also lamellar structure forming from the grain boundaries and inside the grains.
There are also discrete particles along the grain boundaries (Figure 4-45b). Some of the
features of these alloys are discussed in more detail in the section on fractography. For
these alloys, the hardness is about the same as that for aging for 50 hours (Figure 4-4).
The 9 at.% AI alloy shows about 50% lamellar structure in the matrix (Firgure 4-46a}, and
also particles along the grain boundaries are observed (Figure 4-46b ).
After aging at 750°C for 1 00 hours, intergranular cracking was not found in the 2
at.% AI or 5 at.% AI alloys. Thus, it appears that with an increase of aging time, the
cohesion of grain boundaries increases, although the hardness of2 at.% AI and 5 at.% AI
alloys is the same as that of samples after aging for 50 hours at the same temperature
(Figure 4-4).
4.2.9. OLM Microstructure of Ni-Mo-AI Alloys with a Solytjon Treated Plys Aged
at 850°C for 100 Hoyrs
There is no Ni-Mo-Al phase diagram for 850°C, but as a guide to phase
equil ibrium the diagram shown in Figure 4-47 [65) for 800°C will be used. The
equilibrium phases for the aluminum alloys are noted on the diagram. In this phase
diagram, the o phase region is not shown, the Ni-Mo phase diagram (see Figure 2-1 )
shows the o phase region at 50 at.% molybdenum.
In the 2 at.% AI alloy, four different microstructural features are present
1 0 1

Figure 4-44. OLM microstructure of 5 at.% alloy aged at 750°C for 100 hours showing {a) lamellar structure, (b) coarse lamellar structure formed along grain boundaries.
1 02

Figure 4-45.
�- ' g;;•· &:: . . ·. ·; .. . .. · .
OLM microstructure of 7 at.% AI alloy aged at 750°C for I 00 hours showing (a) lamellar structure formed along grain boundaries, (b) coarse lamellar structure along grain boundaries.
103

Figure 4-46.
-·� . . .
·.·�·. ·: ·r;-. .. : . [�:���;"?., · .... ' .. . \ . ,._..; � ...
OLM microstructure of 9 at.% AI alloy aged at 750°C for 100 hours showing (a) lamellar structure nucleated in grains, (b) high magnification of lamellar structure and particles along the grain goundaries.
1 04

a Mo soo• c < 1orl K 1
b 10 I.
8 0
20 lO AI,Ni (0 50 AI,Ni, AJNi 00 70 80 AINi,
Figure 4-47. Ni-Mo-AI ternary alloy phase diagram at 800°C.
110 Ni
Ref P. Villars, A. Prince, and H. Okamoto, Handbook of Ternary Alloy Phase Diagrams. Vol . 4, pp. 4046-4066, ASM International. Materials Park, OH, 1995.
105

(Figure 4-48): (a) fine striation structure; (b) thin Windmanstatten plates; (c) coarse
lamellar structure; (d) the matrix. The 5 at.% AI alloy shows what appears to be a needle
like structure which is spheroidizing (Figure 4-49). The 7 at.% AI alloy shows a
somewhat similar but finer structure (Figure 4-50). These structures are identified later in
the section on SEM and TEM observations.
A similar thin plate structure was observed by Brooks and Wang [22] in the
commercial Hastelloy B2 alloy after aging at 850°C for 200 hours. Vasudevan [67] found
a similar structure in a Ni4Mo alloy containing 2.08 at.% Cr after aging at 850°C for 4500
hours. Williams [68] reported needle-like precipitates in a W and Ta modified Ni-Mo-AI
alloy after prolonged exposure in the range 870 to 980°C.
Mter aging for 1 00 hours at 850°C, the hardness increases with aluminum content
(Figure 4-3), although there are different microstructural features than those which formed
at lower temperatures. However, the hardness of the alloys has decreased considerably
from the peak values achieved near 700°C (Figure 4-5).
4.2. 1 0. OLM Microstructure ofNj-Mo-Al Alloys with a Solytjon Treated
Plus Aged at 950°C for I 00 Hours
As a guide to the equilibrium phases at 950°C, the ternary phase diagram is shown
in Figure 4-5 1 [65]. The phases are noted for the alloy studied.
Mter aging for 100 hours at 950°C, the 2 at.% AI alloy shows what appears to be
single phase a (Figure 4-52). Note in Figure 4-3 that the hardness is about the same as that
of the base Ni4Mo alloy. The 5 at.% AI alloy has transformed completely to fine
precipitates (Figure 4-53a). There are also particles along the grain boundary (Figure 4-
53b). These precipitates have increased the hardness considerably (Figure 4-3). The 7 at.%
AI alloy shows an even finer precipitates structure, and some particles along the grain
106

\
\ '
--- -� / \ , '
.·:
II\ I \ / . \ ) '
/ 1, I .} I
, :
I .
I
zoo ,tim
2 0 0 ,um Figure 4-48. OLM microstructure of 2 at.% AI alloy aged at 850°C for I 00 hours
showing (a) Widmanstatten structure, (b) coarse lamellar structure and fine striation structure.
107

Figure 4-49.
Figure 4-50.
. _._,
. . t
OLM microstructure of 5 at.% AI alloy aged at 850°C for I 00 hours showing needle-like structure.
OLM microstructure of 7 at% AI al loy aged at 850°C for 100 hours showing needle-like structure.
1 08
•,
. . ·
-. .

a
AI12Mo
AJ 10
b
- -
8 0
20 �0 40
(Mo)
AbNi AI�Ni2
Mo
50 eo 7o oo AINi AINi, - · · - 2(J-- .
9so•c c m' K 1
10
Ni Figure 4-5 1 . Ni-Mo-Al ternary alloy phase diagram at 950°C.
Ni
Ref. P. Villars, A. Prince, and H. Okamoto, Handbook of Ternary Alloy Phase Diagrams, Vol . 4, pp. 4046-4066, ASM International, Materials Park, 1995 .
109

I
· - · · ···· · ·- , ·--·--� .. �,· �
' : . · · · ;;-t. ' .
Figure 4-52. OLM microstructure of 2 at.% AI alloy aged at 950°C for 1 00 hours showing single phase and particles along grain boundaries.
1 10
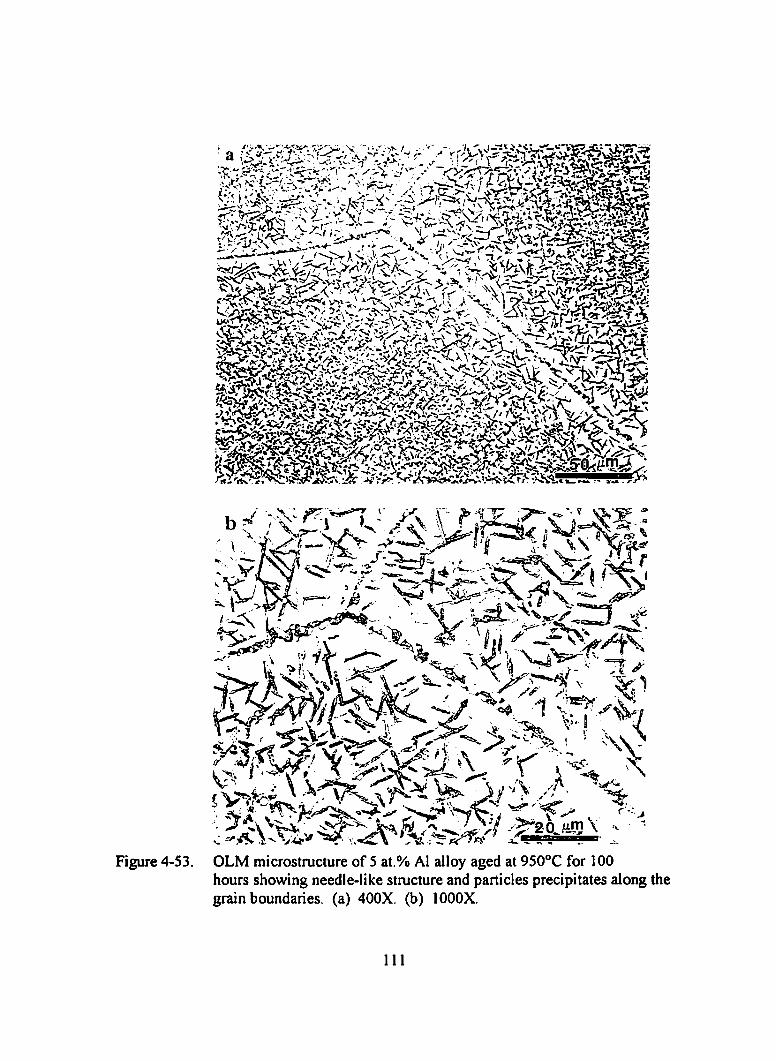
I l l

boundaries (Figure 4-54, a and b). This finer structure produced additional hardness over
that of the 5 at.% AI alloy (Figure 4-3).
4.2. 1 1 . SymmaJY of OLM Observations
The microstructural features observed by OLM are summarized in Table 4-1 .
Note that usually the phases present are not identified. This table will be upgraded to
identify the phases associated with the microstructural features following the examination
of the SEM and TEM results.
4.3 Scanning Electron Microscopy (SEM) Microstructural Evaluation
The OLM observations gave an overall picture of the phase transformations
which occurred during aging, but the resolution restriction of the OLM prevented
examination of the fine structural details. Also, there was no direct way to identify the
phases which formed. In this section, the SEM microstructural observations are
presented and analyzed. Of special use here is the qualitative chemical analysis of the
phases obtained by EDS, which give strong clues to the identification of the phases. In
some cases the phases are too fine for useful EDS analysis. Most of the SEM
microstructures were obtained with secondary electrons (SE), which is most appropriate
for high resolution imaging. However, some chemical discrimination can be obtained by
imaging with the back-scattered electron (BSE), so some microgroaphs obtained by this
imaging mode are presented. However, in the etched microstructure, topography changes
(e.g. at the edge of a hole) may produce a somewhat false indication of chemical difference
in BSE imaging.
1 1 2

Figure 4-54. OLM microstructure of7 at.% AI alloy aging at 950°C for 100 hours showing needle-like precipitates and particles along the grain boundaries. (a) 400X. (b) IOOOX.
" 1 1 3

Table 4- 1 . OLM examination of phase transformation of alloys in all aging condition.
Ni4Mo 2 at.% AI alloy 5 at.% AI alloy 7 at.% AI alloy 9 at.% AI alloy
1250°C, 50 hr. single phase with single phase with single phase with single phase with particles with
annealing twins annealing twins annealing twins annealing twins precipitates in
matrix
600°C, 100 hr. - single phase single phase secondary phase grain boundary
along grain migration, lamellar ·
boundaries with structure and
� grain boundary particles
miwation
650°C, 1 oo hr. grain boundary single phase, lamellar structure, grain boundary -
migration intergranular intergranular migration with I I cracking cracking secondary phase '
700°C, 1 oo hr. - single phase, lamellar structure lamellar structure, particles, lamellar : I intergraunlar grain boundary structure I I
cracking migration I

750°C, 1 0 hr. P phase single phase lamellar structure, lamellar structure, -
intergranular grain boundary
cracking migration
750°C, 50 hr. P phase single phase lamellar structure lamellar structure -
750°C, 100 hr. p phase secondary phase lamellar structure lamellar structure I
lamellar structure :
along grain
boundaries
850°C, 100 hr. - fine and coarsened needle-like needle-like -
--'-" striation structure, particles structure, particles
morphology and along grain along grain
coarse lamellar boundaries boundaries
structure
950°C, 1 00 hr. - single phase, needle-like needle-like -
particles along structure, particles structure, particles
grain boundaries along grain along grain
boundaries boundaries and in
matrix --

4.3 . 1 . SEM Microstructural Evaluation for Ni�Mo in the Hot Forged Condition and
After Aged at 800°C for 1 0 Minutes.
Figure 4-55a shows a BSE image of the Ni4Mo alloy in the as-received , bot
forged condition. In the predominately a matrix there are annealing twins, black particles
and holes where particles etched out. The EDS from these regions are shown in Figure
4-55, b, c and d. The black particles (at C) are rich in aluminum, and are presumed to be
Ah03 oxides. The black holes (at B), where particles were etched out, had a Ni-Mo
peak ratio of 2.8, whereas the matrix (at A) has a value of 1 .9. This indicates that the
particles in the black hole are probably the "( phase because the hole contains a low
molybdenum content. Note that the matrix did not develop a Widmanstatten pattern
upon etching which is characteristic of the presence of J3 domains, and hence it is assumed
that the material cooled sufficiently rapidly from the hot forging temperature to retain a phase. The presence of the "( phase indicates that the composition of the alloy was
slightly on the molybdenum-rich side of the exact Ni4Mo composition, placing the alloy
in the J3 + "( region of the phase diagram below the transformation temperature (see Ni
Mo phase diagram in Figure 2- 1 ).
After aging for 1 0 min. at 800°C, the Widmanstatten pattern etched out in the
matrix, showing that the a phase has decomposed to a J3 domain structure (Figure 4-56a).
There is some grain boundary migration, indicating domain coarsening. The EDS of the
particles at A is shown in Figure 4-56b. These particles are rich in molybdenum, with a
nickel to molybdenum ratio of 0.75. The high molybdenum content could indicate that
these particles are the o (NiMo) phase, but in this relatively pure Ni-Mo binary alloy this
phase should not appear (see Figure 2- 1 , Ni-Mo phase diagram). The o particles formed
because of the element segregation.
1 1 6

b
Mo
N AI M . 0 t I
.
Ni
H t)
Figure 4-55. (a) SEM microstructure (BSE) ofNi4Mo alloy (hot forged condition) showing single a phase with particles. (b) EDS analysis from A for matrix, the ratio ofNi to Mo is 1 .9, (c) EDS analysis from B for black particles, (d) EDS analysis from black particles (bright particles in SE).
1 1 7

c
f I
Al
Figure 4-55. continue (c) and (d).
N
d
1 1 8

b
Ni
Ni
Figure 4-56. (a) SEM microstructure (BSE) ofNi4Mo alloy aged at 800°C for 1 0 minutes showing o phase particles and � phase, (b) EDS analysis from A for bright particles.
1 19

4.3.2. SEM Microstructure of Nj-Mo-Al Alloys in As-Cast Condition <No
Homogenization Treatment> Aged at 750°C for 1 00 Hours
In the Ni4Mo alloy in the hot forged condition, the a phase transformed to �
phase with Widmanstatten plates and bright particles distributed in the matrix (Figure
4-57a) after aging at 750°C (without solution heat treatment). The Ni-Mo-AI alloys
which were aged at 750°C for 1 00 hours received no prior homogenization, but were aged
in the as-cast condition, and hence it should be remembered that a segregated structure is
being aged.
Figures 4-57, a and c show the microstructure of the Ni4Mo alloy. The
Widmanstatten pattern has etched out indicating that the structure consists of � domains.
There is a range of grain sizes present, indicating some recrystallization during aging (see
Figure 4-7). The EDS of the bright particle in Figure 4-75a (see arrow) is shown in Figure
4-57b. The nickel to molybdenum ratio is 0.5, indicating that this is the a phase.
The OLM observation of the microstructure for the 2 at.% AI alloy (Figure 4-10)
showed a structure forming from the grain boundaries, and was referred to as lamellar.
This identification was based on the SEM observations, as shown in Figure 4-58a. EDS
analysis of the matrix (B) is shown in Figure 4-58c, and that of the bright plates (A) in
Figure 4-58b. These plates are taken to be the a phase which formed in the elemental
segregated region because of on homogenization treatment. Sever micro and macro
segregation existed in the alloy. In molybdenum rich regions, significant amount of a
phase was formed whereas areas of less Mo were free of the a phase.
The microstructure of the 5 at.% AI alloy is shown in Figure 4-59, a and b . There
are regions which appear single phase and the rest is a lamellar structure. The single
phase regions did not develop a Widmanstatten pattern, indicating that these are still a phase, and the EDS of the single phase region (A) (Figure 4-59c) is consistent with these
120

Figure 4-57.
b
�I il u Ni �
1
(a) SEM microstructure (SE) ofNi4Mo alloy (hot forged) aged 750°C for
1 00 hours showing � phase and � recrystallization. (b) EDS analysis from
particles (see arrow). (c) � domains.
1 2 1

c . ___ ,_ .. _-... . . . .
Figure 4-57. continue (c).
Figure 4-58a. (a) SEM microstructure (SE) of 2 at.% AI alloy in as-cast condition (without homogenization) aged at 750°C for 1 00 hours showing two phase structures, (b) EDS analysis from bright particles, (c) EDS analysis from matrix.
1 22

123

Figure 4-59a. SEM microstructure of 5 at.% AI alloy in as-cast condition (without homogenization) aged at 750°C for 1 00 hours showing (a) (BSE) precipitates. lamellar structure, and a phase. (b) (SE) lamellar structure with a phase, (c) EDS analysis from single phase. (d) EDS analysis from bright particles.
1 24

Figure 4-59.
c
d
Mo �1 ���
�JJL�
Mo J I �
' M ��� �· } .. -���1!111:;��--.,,�-�-
continue (c) and (d).
125
Ni · I r. .. ' ! i ��� �·1 ':" l::t
Ni i � ;\ i ! "
" _,
' •
i ! j I
' . l

regions being a phase. The EDS analysis of the regions marked B in Figure 4-59d
indicates that these are o phase.
The 7 at.% AI alloy contained a considerable amount of a two phase structures
(Figure 4-60, a and b). There were regions of a lamellar structure (B in Figure 4-60a) and a
flower-like structure (A in Figure 4-60a). The EDS analyses from these two structure are
shown in Figure 4-60 c and d, and they are not the same, indicating that the two phases in
the two structures may not be identical . However, the individual phases are too fine for
meaningful EDS analysis. The identification of the phases is discussed in the TEM
section.
Figure 4-6 1 a shows the microstructure for the 9 at.% AI alloy. A clear dendritic
structure is sti ll present. EDS analyses from the two regions noted (A and B) are shown
in Figure 4-61 , b and c. There is marked segregation of nickel and molybdenum between
these two regions.
4.3 .3 . SEM Microstructure ofNj-Mo-AI Alloys Homogenized at 1 250°C for 50 Hours
The initial homogenization treatment was chosen as 1 250°C for 50 hours. The
microstructure of the Ni4Mo and the 2, 5, and 7 at.% AI alloys all appeared to be single
phase a. However, the exact structure for this condition is discussed in the TEM section.
For this homogenization treatment, there were particles in the grain boundaries and matrix
for the 9 at.% AI alloy, as shown in Figure 4-62a. EDS analyses from the particles and
the matrix are shown in Figure 4-62, b and c. The particles are very rich in molybdenum,
and are assumed to be pure molybdenum. The matrix is assumed to be a phase. These
two phases are consistent with the phase diagram (see Figure 4- 1 4).
Based on the inability to obtain a single phase for the 9 at.% AI alloy, the
homogenization temperature was increased to 1280°C and all subsequent aged samples
126

Figure 4-60. SEM microstructure (SE) of 7 at.% AI alloy in as-cast condition (without homogenization) aged at 750°C for 100 hours showing (a) lamellar structure with flower-like structure, (b) lamellar structure, (c) EDS analysis from flower-like structure, (d) EDS analysis from lamellar structure.
1 27

c
Figure 4-60. continue (c) and {d).
128
Ni I 'I ! .,
·�
ti

l b
I Mo !
;l Ni ::.
Figure 4-6 1 . (a) SEM microstructure (SE) of 9 at.% AI alloy i n as-cast condition (without homogenization) aged 750°C for I 00 hours showing lamellar structure with bright precipitates, (b) EDS analysis from bright area, (c) EDS analysis from coarse structure.
1 29

I C I I I
I
Mo
Figure 4-61 . continue (c).
Ni
tl
Figure 4-62. (a) SEM microstructure (SE) of 9 at.% AI alloy solution treated at 1 250°C for 50 hours showing molybdenum-rich particles along grain boundaries and matrix, (b) EDS analysis from particles, (c) EDS analysis from matrix.
130

b Mo
- �--�
c
Figure 4-62. continue (b) and (c).
13 1

were homogenized for 50 hours at this temperature.
4.3 .4. SEM Microstructure ofNi -Mo-AI Alloys Solution Treated and Aged at 600°C
for 1 00 hours
The Ni4Mo alloy and the 2 and 5 at.% AI alloys all appeared in OLM to be single
phase after aging for 1 00 hours at 600°C, so they were not examined with SEM.
However, their fine structure is discussed in the TEM section.
In the 7 at.% AI alloy, OLM revealed that there was some grain boundary
structure fonning (see Figure 4-23). This is shown in Figure 4-63a. The region at the
arrow is shown imaged with SE and BSE in Figure 4-63b. The striation line at B is bright
in BSE image, consistent with its high molybdenum content (Figure 4-63d), and this may
be the 8 phase. The matrix (at A) is relatively rich in nickel and probably has the
composition of the a phase (but see TEM section) (Figure 4-63c).
The 9 at.% AI alloy showed the fonnation of a lamellar structure (Figure 4-24), as
revealed in Figure 4-64, a and b. The small rounded particles (A) are pure molybdenum
(Figure 4-64c). In the lamellar structure, one lamellae is rich in molybdenum (Figure
4-64d) and the other i s rich in nickel (Figure 4-64e). These may be the y and 8 phases.
As indicated Figure 4-64a, the y and 8 phase formed a lamellar structure around pure
molybdenum particles.
4.3 .5 . SEM Microstructure ofNi-Mo-AI Alloys Solution Treated and Aged at 650°C
for 1 00 Hours
The OLM microstructure (Figure 4-25) of the Ni4Mo alloy showed that the a phase has transformed to a domain structure of � on aging at 650°C for 1 00 hours. There
was some grain boundary migration. which in stoichiometric Ni4Mo alloys is associated
1 32

· ,f• 1 .um
-
Figure 4-63 . SEM microstructure (SE) of 7 at.% AI alloy aged at 600°C for 1 00 hours showing (a) grain boundary migration and secondary phase formation along grain boundaries, (b) high magnification of secondary phase, (c) EDS analysis from matrix, (d) EDS analysis from striation line.
133

· c
d
Mo . i l !
Figure 4-63. continue (c) and (d).
1 34
Nl . I i I l
,, �B ' . .
· .. , ..
Ni . . :

10J.Lm -
Figure 4-64. SEM microstructure (SE) of 9 at.% AI alloy solution treated at 1 280°C for 50 hours and aged at 600 oc for 1 00 hours showing (a) lamellar structure with precipitates, (b) high magnification oflamellar structure, (c) EDS analysis from particles, (d) EDS analysis from bright striation line, (e) EDS analysis from dark striation line.
1 35

c
d
Mo · J ll
Figure 4-64. continue (c) and (d).
1 36
Ni
Ni
i i '
i
I i I i I

Figure 4-64.
. e
I I '' ! !I
continue (e).
Ni i i 1
I
137

with domain coarsening [5 1 , 72, 73, 76, 77] . Figure 4-65a shows a region ofboundary
migration, and there are two phases, lamellar structure present. EDS analyses from the
regions noted are in Figure 4-65, b to d. The fine plates or rods (A) are relatively rich in
molybdenum, and are taken to be the "( phase. The phase in between (C) (EDS in Figure
4-65d) is the same as the � matrix (B) (EDS in Figure 4-65c) and is taken to be �· Th':ls
the reaction at the grain boundary is discontinuous precipitation ofy from � associated
with the boundaries migration to produce a lamellar structure of � and "(. This indicates
that the composition of this binary Ni4Mo alloy was slightly on the molybdenum-rich
side of 20 at.% Mo, placing the alloy in this two phase region at equilibrium.
The 2 at.% AI alloy appeared to be single phase (see Figure 4-26). The 5 at.% AI
alloy had a lamellar structure forming from the grain boundaries (Figure 4-27). The 7 at.%
AI alloy showed the lamellar structure forming along the grain boundaries (Figure 4-66, a
and b). However, the structure is too fine for meaningful EDS analysis. The matrix
showed no Widmanstatten etching structure, so it has not transformed to � phase. The
structure of this alloy is described in more detail in the TEM section.
4.3 .6. SEM Microstructure ofNi-Mo-AI Alloys with a Solution Treated and Aged at
700°C for 1 00 Hours.
The 2 at.% AI alloy remained single phase after aging for 1 00 hours at 700°C
(Figure 4-30) (see the TEM section). In the 5 at.% AI alloy the single phase transformed
to a lamellar structure (Figure 4-3 1 ). In the 7 at.% AI alloy, the lamellar structure has
only partially formed. No SEM observations were made of these samples.
The 9 at.% AI alloy sample showed signs of residual dendritic segregation (Figure
4-33}, with a rather heterogeneous structure present. There was a fine lamellar structure,
which in areas was converting to a coarse lamellar structure (Figure 4-67a). However, in
1 38

b
Mo . l " !1 i ! I I h i . ' i : i
Figure 4-65. (a)SEM microstructure (BSE) of Ni4Mo solution treated at 1 280°C for 50 hours and aged at 650°C for 100 hours showing � domain phase along the grain boundaries in Ni4Mo alloy. (b) EDS analysis from particles in domain region. (c) EDS analysis from matrix. (d) EDS analysis from around particles region.
1 39

c
ii L
d
Figure 4-65. continue (c) and (d).
j'
140

. c .
• •• •·. '
5 ,urn
Figure 4-66. SEM microstructure of 7 at.% AI alloy solution treated at 1 280°C for 50 hours and aged at 650°C for 1 00 hours showing (a) secondary phase formation along the grain boundaries, (b) high magnification of lamellar structure.
1 4 1

Figure 4-67. SEM microstructure (SE) of9 at.% AI alloy solution treated at 1280°C for SO hours and aged at 700°C for 1 00 hours showing (a) coarsen lamellar structure, (b) and (c) high magnification of lamellar structure.
142

Figure 4-67. continue (c).
143

other areas it appears that the fine lamellar structure is consuming the coarse lamellar
structure (Figure 4-67, b and c).
4.3 .7. SEM Microstructure ofNi-Mo-Al Alloys a Solution Treated and Aged at 750°C
for l 0 50. and 1 00 Hoyrs
After aging for I 00 hours at 750°C, the Ni4Mo alloy shows grain boundary
migration (Figures 4-68 and 4-69a), and secondary phase formed in the p domain region.
Figure 4-69 showed a well-developed Widmanstatten pattern of p domains. In the region
marked A the boundary is moving to the right, but the domain pattern appears about the
same as in the matrix. In the up peregion marked B the boundary is moving to the left,
and a second phase is present. This is probably discontinuous precipitation of 'Y as found
in the Ni�o alloy on aging at 650°C (Figure 4-65a).
In the 2 at.% AI alloy, OLM indicated a single phase after aging for 1 0 hours, but
there appeared to be some fine structure along the grain boundaries (Figure 4-35). After
SO hours aging , a clear boundary structure had formed, and there were fine precipitates in
the matrix (Figure 4-39). Figure 4-70a shows the grain boundary structure, and Figure
4-70b shows the precipitates. Aging for 100 hours produced more of the precipitates
within the grains (Figure 4-43), as shown in Figure 4-71a. These particles are very fine
for useful EDS, but Figure 4-7 lb shows an analysis from the grain boundary particle
noted by the arrow in Figure 4-7 1a. It is rich in molybdenum. This is the unstable
Ni2Mo phase (see TEM section).
In the 5 at.% AI alloy, a lamellar structure started to form upon aging for 50 hours
and completely consumed the matrix after 1 00 hours. The structure formed is shown in
Figure 4-72. There appears to be grain boundary coarsening occurring. No EDS analyses
were obtained from this sample.
144

Figure 4-68. SEM microstructure (SE) of Ni4Mo alloy solution treated at 1280°C for 50 hours and aged at 750°C for 100 hours showing grain boundary migration and secondary phase formation.
145

Figure 4-69. SEM microstructure (SE) of Ni4Mo alloy solution treated at 1280°C for 50 hours and aged at 750°C for 100 hours showing (a) Widmanstatten pattern � with grain boundaries migration, (b) high magnification of
Widmanstatten pattern � phase.
1 46

Figure 4-70. SEM microstructure (SE) of 2 at.% AI alloy solution treated at 1280°C for 50 hours and aged at 750°C for 50 hours showing (a) coarsen structure along grain boundaries, (b) precipitates in matrix.
147

Mol
Figure 4-7 1 . (a) SEM microstructure (SE) of 2 at.% AI alloy solution treated at 1280°C for 50 hours and aged at 750°C for 100 hours showing precipitates in matrix, (b) EDS analysis from particles along grain boundaries.
148

Figure 4-72. SEM microstructure (SE) of 5 at.% AI alloy solution treated at 1280°C for 50 hours and aged at 750°C for 100 hours showing (a) coarsen structure along grain boundaries with lamellar structure, (b) high magnification of coarse grain boundary structure.
149

The 7 at.% AI alloy had considerable lamellar structure forming from the grain
boundaries after aging for 100 hours, and this is shown in Figure 4-73 . A similar lamellar
structure was present in the 9 at.% AI alloy after aging from 100 hours. These structures
are too fine for useful EDS analyses.
4.3 .8 . SEM Microstructure ofNi-Mo-AI Alloys with a Solution Treated and Aged at
850°C for 1 00 Hoyrs
The 2 at.% AI alloy, after aging for 100 hours at 850°C, showed in OLM three
types of structure: a fine structure of thin parallel plates, coarse parallel plates and a
lamellar structure (Figure 4-48). The structure of the fine plates is shown in Figure 4-74.
The plates appear to have nucleated closely together from a grain boundary and grown
along a common crystallographic plane into the matrix. In the region shown in Figure
4-74a, these plates have crossed another boundary (arrow), but have retained their
orientation. On this boundary are rounded particles (Figure 4-74b), and EDS of them is
shown in Figure 4-74c. They are molybdenum-rich and may be the B phase. Figure
4-74d shows a region in the 2 at.% AI alloy which has the lamellar structure. Note that
the sides of these plates are not parallel to the thin plates adjacent to them. No EDS
analysis was obtained from the lamellar structure.
Aging the 5 at.% AI alloy for 100 hours produced a structure of fine precipitates
(Figure 4-49). This is shown in Figure 4-75. The round particles (C) along the grain
boundary are molybdenum-rich (Figure 4-75e) and are taken to be B phase. The needles
which did not etch out (A in Figure 4-75b) had a nickel to molybdenum ratio of 1 .4
(Figure 4-75c }, and are taken to be the y phase. The matrix had a ratio of 2. 0, indicating
that it is the a phase (see TEM section).
The microstructure of the 7 at.% AI alloy (Figure 4-50) had converted to a finer
1 50

Figure 4-74. SEM microstructure (SE) of2 at.% AI alloy solution treated at 1280°C for SO hours and aged at 8S0°C for 100 hours showing (a) striation line structure. (b) the striation lines across particles, (c) EDS analysis from particles. (d) coarse lamellar structure.
l S I

I \ c i I
\ tAO I \ \ \ \ " � P ' \
\
\Sl
\ \ \ \
\
1 1 1 1 1 1 1 1 1 1 1 1 1 1 1 1 1 1 1 1 1 1 1 1 1 1 1 1 1 1 1 1 1 1 1 1 1 1 1 1 1 1 1 1 1 1 1 1 1 1 1 1 1 1 1 1 1 1 1 1 1 1 1 1 1 1 1 1 1 1 1 1 1 1

Figure 4-74. continue (d).
Figure 4-75. SEM microstructure (SE) of 5 at.% AI alloy solution treated at 1 280°C for 50 hours and aged at 850°C for 100 hours showing (a) needle-like structure, (b) high magnification of needle-like structure, (c) EDS analysis from lath, (d) EDS analysis from matrix. (e) EDS analysis from particles along grain boundaries.
1 53

c
I·! ! •
... l I .o
Figure 4-75. continue (b) and (c).
-�::= ==u-- ,
1 54

d
�· ' "
l e i I ! I i I i ! i
}! I I
t . !
Mq fi �1 � 11 L E.Ji� <·
Figure 4-75. continue (d) and (e).
155
.. 11
I' o\

precipitates structure than did the 5 at.% AI alloy. This i s shown in Figure 4-76. the
structure is assumed to be 5 and 'Y in a phase.
4.3 .9. SEM Microstructure ofNi-Mo-AI Alloys with a Solytion Treated and Aged at
950°C for 1 00 Hoyrs
The 2 at.% AI alloy showed no apparent transfonnation after aging for 1 00 hours
at 950°C except for an indication of precipitation along the grain boundaries (Figure 4-52).
This is shown in Figure 4-77a. The EDS analysis of the rounded grain boundary particles
i s shown in Figure 4-77b. These particles are Mo-rich and are taken to be the 5 phase.
The 5 at.% AI alloy had converted completely to a structure of fine precipitates
(Figure 4-53), and is shown in Figure 4-78a. EDS analysis (Figure 4-78b) from the grain
boundaries particles show that they are molybdenum-rich and are taken to be the 5 phase.
The 7 at.% AI alloy showed a similar but fine structure (Figure 4-54), as shown in Figure
4-79, a and b. The larger grain boundary particles (A) are rich in Mo (Figure 4-79c), and
are taken to be the 5 phase. An EDS analysis from the region (B) of the two phase matrix
is shown in Figure 4-79d, where it is seen to be nickel-rich. However, the other phase had
etched out so no EDS analysis should be obtained. To circumvent this problem, the same
sample was examined in the as-polished condition using BSE (Figure 4-80a). The dark
areas are not etched out. but are a phase lower in molybdenum than the lighter particles.
EDS analyses from the three regions noted are Figure 4-SOb, c and d. The dark particles
are very rich in nickel and contain a prominent amount of aluminum. Thus this phase is
taken to be the Ni3(AI. Mo) "(' phase. The matrix is richer in molybdenum., but still
nickel-rich, and is taken to be "( phase. The light particles is molybdenum rich and it is
taken to be the 5 phase.
1 56

Figure 4-76. SEM microstructure of 7 at.% AI alloy solution treated at 1280°C for 50 hours and aged at 850°C for 100 hours showing particles along grain boundaries and needle-like structure. ==�--------------------
Figure 4-77. (a) SEM microstructure (SE) of 2 at.% AI alloy solution treated at 1280°C for 50 hours and aged at 950°C for 100 hours showing particles along grain boundaries, (b) EDS analysis from particles along grain boundaries.
157

Figure 4-77.
j b '
I •
Mo ; I I· li II J�
continue (b).
!
·'
n u �I ; II:
' • .... r.�"'•• I
Figure 4-78. (a) SEM microstructure (SE) 5 at.% AI alloy solution treated at 1280°C for 50 hours and aged at 950°C for 1 00 hours showing particles along grain boundaries aand needle-like structure, (b) EDS analysis from particles along grain boundaries.
158

I i C
I Mo
Figure 4-78. continue (b).
Ni
ti
1 59

c
Figure 4-79. continue (b) and (c).
, Ni
160

d
... Mol
� � JS 'L-.JL ..
Figure 4-79. continue (d).
Figure 4-80. SEM microstructure (BSE) of 7 at.% AI alloy solution treated at 1280°C for SO hours and aged at 950°C for 100 hours showing sample in the aspolished condition. (b) EDS analysis from dark area. (c) EDS analysis from matrix. (d) EDS analysis from bright area.
16 1

b
Mo N AI i. !!': i A
• j!l �- ::·. : .«t · ����
c
·�· ;. J·:
Figure 4-80. continue (b) and (c).
1 62
Ni· , i
,,., ... "
' '

i I d I I
i I I ! I I ' ' I I I l ! '
! • ; ;.. !
Mo
Figure 4-80. continue (d).
I I I i I ' ! I I
I Ni I '
, , I � I
163

4.3 . 1 0. Summarv of SEM ObseJVations
The conclusions about the microstructure based on the SEM observation and EDS
analyses are summarized in Table 4-2. Note that this is an update of the information in
Table 4-1 which was based only on the OLM observations.
4.4. Fracture Surface Topology Investigation
The underlying motivation for this research was to search for alloying additions
which would allow strengthening by aging yet retain ductility . In the binary Ni�o base
alloy, and the commercial Hastelloy B2 alloy based on it, if the J3 phase forms, the alloy
becomes brittle, fracturing along the former a grain boundaries. This embrittlement
problem is also present if other phases form during aging.
In the general range of 750°C, the decomposition of a occurs most rapidly, and
1 00 hours is sufficient to impart embrittlement in the binary Ni4Mo alloy. Thus, the
fractographic examination was centered on the alloys which had been aged at 750°C for
100 hours.
Recall that the fractographic study involved metallographically polishing and
etching a small specimen, then placing it in a three-point bending apparatus to place the
etched surface in tension (see Section 3). The surface was bent until cracks initiated, then
they were bent further, and the same cracks examined to see along what microstructural
features they were advancing. With sufficient bending, the cracks opened up so that along
their edge the microstructural features and the fractographic features could be
simultaneously examined.
1 64

.... 0\ VI
Table 4-2. SEM examination of phase transfonnation of alloys in all aging condition
Ni4Mo 2 at.% AI alloy 5 at.% AI alloy
I 250°C, so hr. a phase single phase single phase
600°C, 100 hr. - single phase single phase
650°C, I 00 hr. y particles and � intergranular lamellar structure,
phase cracking intergranular
cracking and matrix
700°C, 100 hr. - single phase lamellar structure
750°C, 10 hr. - a phase lamellar structure
and matrix
7 at.% AI alloy 9 at.% AI alloy
single phase Mo-rich particles
and matrix
B phase nucleated Mo-rich particles,
along grain B and oly (?) phase
boundaries
lamellar structure -
nucleated along
grain boundaries
lamellar structure coarse lamellar
and matrix structure and fine
lamellar structure
lamellar structure -
and matrix

750°C, so hr. - coarsened structure lamellar structure lamellar structure -
along grain and matrix
boundaries and
precipitates in
matrix
750°C, 100 hr. � precipitates in lamellar structure lamellar structure lamellar structure
matrix and matrix and matrix
850°C, I 00 hr. - fine and coarse 8 particles along 8 particles along -
-
0\ 0\ lamellar structure grain boundaries grain boundaries
and Widmanstatten and needle-like 'Y and needle-like 'Y
structure phase in a. phase in a.
950°C, 100 hr. - Mo particles and a. 8 particles along 8 particles and 1
phase grain boundaries along grain
and needle-like 'Y boundaries and
phase in a. needle-like 'Y phase
and 8 particles in
matrix --

4.4. 1 . Fracrure Surface Examination ofNi�Mo Alloy
None of the alloys in the solution heat treated condition cracked during bending,
and all showed good ductility.
Figure 4-81 shows the surface of the Ni4Mo alloy sample, where several grain
boundaries have separated. It is important to note that inside each grain the struchlre is
made up of former ex high angle boundaries across which there is a crystallographic
mismatch and these former a. boundaries are the ones along which separation occurs. For
the heat treatment used, it was shown previously (see Figures 4-7, 4-57) that some
boundary migration has occurred. A region is shown in Figure 4-82, and here the "( phase
(see EDS in Figure 4-83) has formed by discontinuous precipitation associated with
boundary migration. It is along this high angle boundary that interface separation has
occurred.
Figure 4-84 shows another region of boundary migration, but no precipitation has
occurred. This is probably domain coarsening accompanying the boundary migration,
since the Widmanstatten pattern associated with the formation of a fine domain structure
does not extend into the migrated area. Clearly cracking has occurred along the migrated
high angle boundary.
Figure 4-85 shows a region of the fracture surface after the sample was broken
into two pieces. The microstructure is to the right, and the fracture surface to the left.
The fracture surface is rough, indicating that at this location fracture has occurred along a
migrated boundary. The discrete particles seen also indicate that this a region in which
the 'Y has formed, and that these particles are y. That is ,this region of the fracrure surface
is like the one shown in Figure 4-82.
167

1:4 o JL_rn ., �;ttL_.:_ _ -
Figure 4-81 . The intergranular cracking ofNLiMo alloy aged at 750°C for 1 00 hours.
Figure 4-82. Interface cracking between coarsened � structure and Widmanstatten pattern � structure in Ni4Mo alloy aged at 750°C for 100 hours. The
arrow indicated "( phase.
168

Figure 4-83.
Figure 4-84.
: ' [ �'
Mo
Nil
ill . . .
1 ii � i � t?t ��__.,i\.
The EDS analysis from the bright lath in coarsened J3 region in Ni4Mo alloy (see arrow in Figure 4-82).
The cleavage morphology at grain boundaries between coarsened J3 and Widmanstatten pattern � structure in Ni4Mo alloy.
169

Figure 4-85. Molybdenum particles segregated along grain boundaries in Ni4Mo alloy.
1 70

4.4.2. Fracture Surface Examination of2 at.% AI Alloy
The 2 at.% AI alloy contained some fine precipitates in the grains, and a thin band
of a denuded structure along the grain boundaries (Figures 4-43 and 4-70a). The grain
boundaries and matrix particles were identified as probably the o phase. Figure 4-86
shows extensive intergranular fracture along the grain boundaries. The matrix did not
show an etched Widmanstatten structure, so (3 was not present. Figure 4-87 shows a
region of the fracture surface. The particles (see arrow) are rich in molybdenum (see EDS
analysis in Figure 4-88), and are taken to be the o phase. There appear to be dimples
associated with these particles indicating some local ductility referred to Figure 4-89. The
exact topography of the fracture surface in between these dimples is not clear, but is not
particularly smooth.
4.4.3 . Fracture Surface Examination of 5 at.% AI Alloy
The microstructure of the 5 at.% AI alloy after aging for 1 00 hours at 750°C
consisted of a lamellar structure and a coarser globular structure along the grain boundaries
(Figure 4-72a). The surface of the bent sample is shown in Figure 4-90, where it is seen
that cracking has occurred along the original grain boundary regions. Figures 4-91 and
4-92 show the edge of the fractured surface, with the lamellar microstructure adjacent to
it. Fracture is occurring by interphase separation, and the crack advances by a series of
ledges between and across the phase (Figure 4-93). The fracture surface is shown at high
magnification in Figure 4-94, but the fracture surface is still not clear.
4.4.4. Fracture Surface Investigation of 7 at.% AI Alloy
After aging for 100 hours at 750°C, the microstructure of the 7 at.% AI alloy has
considerable lamellar structure along the grain boundaries (Figures 4-45 and 4-73). The
171

. intergranular cracking
•
I
. .
. . . ' . in\. . . _1 0:0 Jl --�· ..
Figure 4-86. Intergranular cracking in 2 at.% AI alloy aged at 750°C for 100 hours.
Figure 4-87. Fracture morphology of2 at.% AI alloy aged at 750°C for 100 hours.
172

'
Ni
I� "
Figure 4-88. The EDS analysis from particles in 2 at.% AI alloy (see arrow in Figure 4-87).
Figure 4-89. Intergranular dimple morphology of 2 at.% AI alloy aged at 750°C for 100 hours.
173

Figure 4-90. Intergranular cracking in 5 at.% AI alloy aged at 750°C for 100 hours .
. • ...:,·Ts�."';� .• 0�: .
. -- . 5 .urn, -· . . �,;;;
Figure 4-91 . The fracture surface of 5 at.% AI alloy aged at 750°C for 100 hours.
174

Figure 4-92. Secondary cracking along the lamellar plates and interface between lamellar structure and coarsened structure.
Figure 4-93. The fracture surface of 5 at.% AI alloy aged at 750°C for I 00 hours.
1 75

Figure 4-94. The fracture surface of 5 at.% AI alloy aged at 750°C for 1 00 hours.
176

bent surface is shown in Figure 4-95, where it is seen that cracking occurred in the region
of original grain boundaries, but there was also transgranular cracking. Figure 4-96 shows
that the cracks propagated by interphase separation and by cleavage across the phases.
Along the original grain boundaries in some regions there is a slightly coarse structure, and
fracture occurred by interphase separation in these regions (Figure 4-97). In the region of
the untransformed matrix, extensive slip was observed on the etched surface (Figure 4-96
and 4-98}, showing that these regions were ductile. Here the fracture surface appeared to
be dimpled.
4.4.5. Fracture Surface Investigation of9 at.% AI Alloy
The microstructure of the 9 at.% AI alloy showed a lamellar structure along the
grain boundaries and in the grains. Figure 4-99a shows the microstructure and it is seen
that cracking has occurred along the regions of the original grain boundaries. Cracking has
also occurred in the lamellar structure within the grains (Figure 4-99b). Figures 4-100 and
4-101 show the fracture surface. EDS analyses are given in Figure 4-1 02, and 4-103. The
light areas are mokybdenum-rich and dark areas nickel-rich. The bright area are probably
the B. The dark area could be the 'Y', as some aluminum is present. It is clear that fracture
has occurred by interphase separation.
4.4.6. Comments about Fractography and Fracture
It is clear that when 13 is present, the alloys are brittle with fracture occurring
along the high angle, former a boundaries, whether migrated or not. When a multi phase
structure forms, the alloys are brittle because of weak interphase bonding. Also the
inability of the ordered phases to slip make them intrinsically brittle.
177

,, · .
. :� . . . . . . .
•.
Figure 4-95. Intergranular and transgranular cracking in 7 at.% AI alloy aged at 750°C for 100 hours.
Figure 4-96. Transgranular cracking along the lamellar plates and interface between lamellar structure and matrix in 7 at.% AI alloy.
1 78

Figure 4-97 Intergranular cracking along the coarsen structure with grain boundaries in 7 at.% AI alloy.
Figure 4-98. Dimple fracture morphology in matrix in 7 at.% AI alloy.
179

Figure 4-99. (a) lntergranular cracking , (b) Transgranular cracking in 9 at.% AI alloy aged at 750°C for 100 hours.
1 80

Figure 4-100. The fracture morphology (SE) of9 at.% AI alloy aged at 750°C for 100 hours.
Figure 4-101 . Backscattered electron image of 9 at.% AI alloy aged at 750°C for 100 hours.
1 8 1

Ni " i: il .. !! l� i:i f;i r:
:t !�_: � . ���i�"-'----·
Figure 4-102. The EDS analysis from bright area, molybdenum-rich plates (see arrow A in Figure 4-101 ) .
1: "
Figure 4-103. The EDS analysis from dark area, nickel-rich plates (see arrow B in Figure 4-1 01).
1 82

4.5. Transmission Electron Microscope (TEM) Microstructure and Electron
Diffraction Pattern Analysis
In this section the TEM observation are presented and analyzed. The format in
the previous sections detailing the OLM and SEM observations is followed. In addition,
at the end of this chapter some observations of aged samples of the commercial alloy
Hastelloy B2 are also given.
The SEM observations described in the previous section allowed resolution of the
finer details than did the OLM observations. Also, the EDS analyses, even though
qualitative, provided clues to the identity of the phases. However, in many cases there
was sufficient uncertainty in interpreting the spectra to prevent rigorously establishing
what the phase was. Also in many cases the structure was too fine for meaningful EDS
analyses. To make positive identification, transmission electron microscopy was used
where electron diffraction patterns could be obtained and analyzed, and in some cases
quantitative EDS analysis could be obtained from the crystals. Thus not only could the
finer details be resolved, their crystal structure and chemistry could be determined, and
hence the phase identified.
In the Ni-Mo system, the high temperature equilibrium phase is a, a face-centered
cubic solid solution of molybdenum in nickel . However, the atom arrangements are not
random, but the structure has short-range order (SRO). There are three intermetallic
compounds: � (Ni4Mo); y (Ni3Mo); 0 (NiMo) (Figure 2- 1) . In addition, during the
decomposition of a upon aging, two metastable phases have been found: the compound
Ni2Mo (Pt2Mo prototype) and a compound with the D022 structure having Ni3Mo
stoichometry. In the nickel-rich Ni-Mo-AI alloys, all these phases may form. In
183

addition, pure molybdenum may be present, and in the more aluminum-rich alloys, the "('
(Ni3Al) may form where it will contain some molybdenum.
In this research, the identification of the phases by analyzing electron diffraction
pattern has relied on obtaining patterns of specific orientation for which the patterns are
already known for the phases. Especially convenient are the [001] and the [ 1 12] zone
patterns, and they are shown in Figures 4-104 and 4-105 . These patterns include
multiple domain orientations and double diffraction. Some of the combined patterns are
shown in Figure 4-106 [74, 75]. It was pointed out above that the a phase is SRO, which
is responsible for weak spots at the locations shown in Figure 4- 104 (a). All of these
crystal structures can be characterized be the relative location of the nickel and
molybdenum atoms on the face-centered cubic (FCC) lattice. Thus in the schematic
electron diffraction patterns these common spots are referred to as the fundamental spots.
Another important point to remember is that a limitation of TEM observations is
the very small area of the sample intrinsically being examined. In microstructures
containing a heterogeneous structure, such as a lamellar structure in a single phase matrix,
it may be difficult to prepare TEM samples which allow suitable thinning of all regions.
That is, it may be that only the single phase region thins. Thus for the mixed
microstructures which were examined in the OLM and SEM sections, it will be made clear
what region are being examined in TEM.
4.5 . 1 . TEM Microstructural Evaluation ofNi-Mo-AI Alloy After Solution Treated at
1 250°C
a) Ni4Mo Alloy
The TEM microstructure of the Ni4Mo alloy after solution heat treated at 1250°C
184

22o •
0 0
0
2oo •
0 0
220 •
0 0
0 • • •
o2o o ooo o o2o
• 0 0 0 0
0 0 •
220 200 (a)
• 220
220 2oo 220 • 0 • 0 •
0 0 0 0 0 0 0 0 0 0 0
• 020
0 0 0 0
• 0 000 0
• 020
0 0 0 0 0 0 0 0 0
0 0 • 0 • 0 • 220 200 220
(c)
220 2oo • 0 • 0 •
0 0 0 0 0
• 0 • 0 • o2o ooo 020 0 0 0 0 0
• 0 • 0 • 220 200 220
(e)
• 22o • •
o o 2oo o o 220 0 0
0 0 0 0 0 0
0 0 0 0 • • • o2o o o ooo o o 020
0 0 0 0 0 0 0 0
o o 0 0 • • 220 200
(b)
• 220
220 •
2oo •
220
0 0 0 0
0 0
0 0
•
• • 0,0 o2o ooo o o 0 0 0 0 0 0
• 200 (d)
0: fundamenatl sptos o: superlattice spots
• 220
(a): SRO <X phase equilibrium
(b): � phase (Ni,.Mo) equilibrium (c): D022 (Ni3Mo) non-equilibrium (d): Pt2Mo (NhMo) non-equil ibrium (e): LRO i (Ni3Al) equilibrium (f): LRO y (Ni3Mo) equilibrium
Figure 4-104. a) Schematic the [001 ] zone electron diffraction pattern for <X, �. D022. Ni2Mo, and y' structure, b) diffraction pattern for y phase.
185

000 OtO 020 000 010 020
Reciprocal lattice section of fully ordered Ni)Mo. a) (001 ), (100) and (01 0) sections;
Ref. E. Ruedl and S. Amelinckx, " The Substructure ofNi3Mo due to Ordering," Mat. Res. Bull., 4:361 -368 (1 969).
Figure 4-104. continue (b).
186

- -
- -- 1 1 1 1 3 1 3 11 1 1 1 1 3 1 3 1 1 • • • • • • 0 0 0 0
0 0 0 0 0 0 0 0 0 0 0 0 • 0 0 • 0 0 •
-� • -· 000 220 220 0 0 0
0 000 0 0 0 0 220 220 0 0 0 0 0 0 0 0 0 0 • 0 0 • • • • • 1 3 1 1 1 1 3 1 1 1 3 1 1 1 1 3 1 1
(a) (b)
-
3 1 1 1 1 1 1 3 1 3 1 1 1 1 1 1 3 1 • 0 • 0 • • 0 0 • 0 0 •
0 0 0 0 0 0 0 0
0 0 0 0
• 0 • 0 • -' 0 0 • 0 0 • 220 000 220 220 0 0 000 0 0 2 2 0
0 0 0 0 0 0 0 0 • 0 • 0 • -• 0 0 • 0 0 •
1 3 1 1 1 1 3 1 1 1 3 1 1 11 3 1 1 (c) (d)
0: fundamental spots
1 3 1 o: superlattice spots
3 1 1 1 1 1 (a): SRO a phase equilibrium • 0 • 0 • (b): p phase (Ni�o) equilibrium (c) : D022 (Ni3Mo) non-equil ibrium
• 0 • 0 • (d) : Pt2Mo (NhMo) non-equilibrium
22o 000 220 (e) : LRO 1 (Ni3Al) equilibrium
• 0 • 0 • 1 3 1 1 11 3 1 1
(e)
Figure 4- 1 05. Schematic the [ 1 1 2] zone axis electron diffraction pattern for a, p, D022,
Ni2Mo, and "(' structure.
1 87

• IS � 3IT ll.
A IS! flo
lSI ll.
• li3 � rio .t::. ll. E3 Ao
ES .A • � �
131
a
A
A
liS IS A OA L'SI .
lSI
li3 ll
.t::.L'SI ell
IS!
• 0 b. &'I X
• E3 � IS! • i"fi .t::. A 131
ll IS ISl et Ao li3 :.0. E3
A ll • IS A®A ES • 000 220
A IS liS A Ao ell IS E3
A A • L'SI @ liS • 1l1 31 1
t.c.c.
0022
D1a
Ni2Mo Ll2
Figure 4-106. Schematic diffraction patterns showing the location of maxima for the f.c.c.
fundamental lattice and the �, D022, Ni2Mo and y' superlattices. (a) [00 1 ] zone, (b) [ 1 1 2] zone.
Ref. Martin and Williams, Long Range Order in Ni3Mo Based Ternary Alloys-! Isothermal Aging Response, Acta Metall . , Vol . 32, 1984.
1 88

• 1S ® � • � ® fSS • 3IT L!. .fj. T1i � A 131
L!. lSI L'SI A il L'SI rss � ilo OA flo 6.'1 :6 lSI 1S �
L!. ll. � il • ss � lSI • lS A®A E! • :rio il A 000 220
A b.":! Is:! il � lSI &:9 A Ao OA OA &:9
ArsJ IS. lSI &9 A A A
• &:9 0 lSI • rsJ ® � • i31 1 11 31 1
• t.c.c .
0 0022
fl. D1a
lSI Ni2Mo )( Ll2
Figure 4-106. Schematic diffraction patterns showing the location of maxima for the f.c .c.
fundamental lattice and the �. D022, Ni2Mo and 1 superlattices. (a) [00 1 ] zone, (b) [ 1 1 2] zone.
Ref. Martin and Williams, Long Range Order in Ni3Mo Based Ternary Alloys-1 Isothennal Aging Response, Acta Metall . , Vol . 32, 1 984.
188

for 50 hours is presented in Figure 4-1 07a. There is a relatively high density of
dislocation pile-ups adjacent to the grain boundary. The electron diffraction patterns
(Figure 4-107, b and c) contains weak spots (arrow), which is characteristic of the SRO
structure as shown in the [001] zone (Figure 4-104a) and in the [ 1 1 2] zone diffraction
pattern in Figure 4-104b. Hence, a fully SRO a. phase was obtained after a solution
treatment and quenching from 1 250°C.
b) 2 at.% AI Alloy
Figure 4-I OSa shows the TEM microstructure in the 2 at.% AI alloy. The
microstructure shows a fine contrast structure, dislocations and intrinsic stacking faults.
However, the [00 1 ] zone electron diffraction pattern (Figure 4-1 08b) shows the intensity
maxima at SRO a. spots with faint intensity at 0022 position spots (Figure 4-104c).
Thus the quenched structure is not single phase a., but also contains the non-equilibrium
0022 phase. Thus there was concern that the cooling rate during quenching the sample
while breaking the quartz tube was not sufficient to retain only the a. phase. In order to
confirm that the 0022 phase formed during quenching, an unprotected (not encapsulated
in a quartz tube) sample of the 2 at.% AI alloy was heated in air to 1250°C for 20
minutes, than rapidly quenched directly in water. The diffraction pattern in Figure
4-1 09a shows only SRO a. spots; there is no evidence of the 0022 structure.
The important point here is that is some alloys the quenched structure, which is
the starting structure for the aging treatments, may contain both SRO a. and 0022 phase.
This could not be determined form the OLM and SEM observations, where the
microstructure appeared to be single phase a. and in some cases was referred to as such.
Hardness of 2 at.% AI alloy increased sl ightly compared to Ni4Mo alloy, that is,
the hardness of the 0022 and SRO a. structure is greater than that of SRO a. structure.
189

Figure 4-107. TEM microstructure ofNi4Mo alloy solution treated at 1250°C for 50 hours. a) SRO ex phase with dislocations pile-ups at grain boundary. b) corresponding [001 ] zone diffraction pattern, c) [ 1 1 2] zone.
1 90

Figure 4-108. TEM microstructure of 2 at.% AI alloy solution treated at 1250°C for 50 hours. a) D022 precipitates in SRO a phase matrix and dislocations pile-ups at grain boundary with stacking faults. b) corresponding [001 ] zone diffraction pattern.
19 1

Figure 4-109. TEM microstructure of 2 at.% AI alloy sol uti on treated at 1 250°C for 20 minutes. a) [ 1 1 2] zone diffraction pattern showing SRO a
superlattice spots. b) and c) SRO a phase and dense dislocations.
1 92

c) 5 at.% AI Alloy
In 5 at.% AI alloy, the [1 12] zone electron diffraction pattern shows intensity
maxima at { 1 112 0} , { 1 00} , and { 1 10} positions (Figure 4- 1 10a) of the D022 structure.
The SRO a spots overlaps the D022 spots in the [ 1 1 2] zone diffraction pattern. From
the [1 12] zone diffraction pattern, it is not clear that SRO a is present or not. However,
the DOn phase is present. The D022 phase formation may be due to slow cooling or the
aluminum enhanced the rate of formation of the D022 phase. The D022 domain structure
and intrinsic stacking faults is shown in Figure 4-1 10b.
d) 7 at.% AI Alloy
In the 7 at.% AI alloy, the (001] and [1 12] diffraction patterns (Figure 4-1 1 1 , a
and b) show spots for the D022 phase and the NhMo phase. There are no SRO a spots.
Thus upon quenching the a phase decomposed to a fine structure of these two phases
(Figure 4-1 1 1 c). The OLM and SEM microstructure showed what appeared to be only a
single phase. The hardness increased considerably in comparison to that of the SRO a.
phase in the Ni4Mo alloy and the 2 at.% AI alloy (Figure 4- 1 ).
e) 9 at.% AI Alloy
In the 9 at.% AI alloy, the [1 12] electron diffraction pattern (Figure 4-1 12a) had
spots at the Ni2Mo and D022 positions, but not SRO a. spots. Thus, the microstructure
(Figure 4- 1 12, b and c) consists of a fine mixture of domains of these two phases. Note
that the structure is coarse in the 9 at.% AI alloy than in the 7 at.% AI alloy (Figure
4-1 1 1 c), but the hardness was somewhat higher than for the 7 at.% AI alloy (Figure 4-1 ).
193

Figure 4-1 10. TEM microstructure of 5 at.% AI alloy solution treatment at 1 250°C for 50 hours. a) the [ 1 12] zone diffraction pattern showing D022 superlattice spots. b) corresponding microstructure and stacking faults.
194

. . ;- - :; : �.:·.-,�;� �: .... � � ... _ :'::i,s;,�:JiM%i, �· "·'-· .. _:·"'"= .. -;;>v;.ot"e&�
Figure 4- 1 1 1 . TEM microstructure of 7 at.% AI alloy solution treated at 1250°C for 50 hours. a) and b) [00 1 ] and [ 1 1 2] zone diffraction pattern showing D022 and Ni2Mo superlattice spots. c) corresponding microstructure of uniform D022 and NhMo phases at [ 1 1 2] zone_
1 95

Figure 4-1 12 . TEM microstructure of 9 at.% AI alloy solution treated at 1250°C for 50 hours. a) [ 1 12] zone diffraction pattern showing D022 and Ni2Mo superlattice spots, b) corresponding microstructure, c) particles and stacking faults in matrix.
196

t) Summary
The structure present after the solution heat treatment of 50 hours at 1250°C,
followed by water quenching (by breaking the quartz tubes), is summarized in Table 4-3 .
The evidence is that the restricted cooling upon breaking the quartz tube prevented the
retention of all SRO a. As the aluminum content increased, the kinetics of the
decomposition of SRO a to the 0022. and then a mixture of the 0022 and Ni2Mo
phases, was etchanced. Note that these domain structure are the precursor structure for
the aging treatments.
Figure 4-1 shows that the hardness of the Ni�o alloy and the 2 and 5 at.% A1
alloy are about the same. There is a marked increase in hardness upon the addition of 7
and 9 at.% AI, which coincides with the appearance of the fine domain structure
containing both the 0022 and the Ni2Mo phase, although the domain structure for the 9
at.% AI alloy is more coarse than that in the 5 at.% AI alloy.
Table 4-3 .
as-quenched
The microstructure ofNi-Mo-Al alloys after solution heat treated ( 1250°C, 50 hours) and water quenched
Ni4Mo 2 at.% AI 5 at.% AI 7 at.% AI 9 at.% AI
SRO a SRO a + SRO a ? + 0022 + 0022+
0022 0022 NizMo Ni2Mo
4.5.2. TEM Microstructural Evaluation of Ni-Mo-Al Alloys After Solution Treated
at 1 280°C and Aged at 600°C for 1 00 Hours
a) 2 at.% AI Alloy
Figures 4-1 13, a and b give the [001 ] and [ 1 1 2] zone electron diffraction patterns
which shows SRO a and p superlattice spots at a intermediate transformation step of
197

Figure 4-1 1 3 . TEM microstructure of 2 at.% AI al loy aging at 600°C for 1 00 hours. a) [00 1 ] zone diffraction pattern showing SRO a, LRO � and D022
superlattice spots, b) [ 1 12] zone diffraction pattern showing SRO a, LRO � and D022 super lattice spots, c) corresponding microstructure of the [ 1 12] zone diffraction pattern.
198

SRO a to LRO �- Also the D022 diffraction spots are present. The intensity of the
SRO reflections remains stronger than that ofD022 and �- Diffuse streaking in the
{ 4 2 0 } direction is seen to extend between � and D022 superlattice positions. Thus, the
microstructure corresponds to a fine structure of the a, � and D022 phases.
b) 5 at.% AI Alloy
Figure 4-1 14a shows the microstructure of 5 at.% AI alloy after aging for 100
hours at 600°C. There is a fine structure. Figure 4- 1 14b shows the [00 1 ] zone diffraction
pattern. There i s clear evidence of the presence of the D022 phase. No SRO a or � were
observed.
c) 7 at.% AI Alloy
In 7 at.% AI alloy, after aging at 600°C for 1 00 hours, the [1 12] zone diffraction
pattern shows intensity maxima at D022 and NhMo positions (Figure 4- 1 1 5a). The fine
microstructure contains two phases of D022 and Ni2Mo as shown in Figure 4-1 1 5b.
d) 9 at.% AI Alloy
After aging at 600°C for 100 hours, the microstructure in 9 at.% AI alloy formed a
fine structure (Figure 4- 1 16a). The [ 1 12] zone selected area diffraction pattern shows
D022 and Ni2Mo superlattice spots (Figure 4-1 16b). The 2, 5, and 7 at.% AI alloy had
no other phases than the fine structure revealed by TEM, as shown in the OLM in Figure
4-21 to 4-23 . However, the 9 at.% AI alloy had begun to form a lamellar structure (Figure
4-24) It is clear, though, that the local region of the TEM observations (Figure 4-1 16)
was in the matrix.
199

Figure 4-1 14. TEM microstructure of 5 at.% Al alloy aged at 600°C for 100 hours, a) D022 phase, b) corresponding [00 1 ] zone diffraction pattern.
Figure 4-1 1 5. TEM microstructure of 7 at.% AI alloy aged at 600°C for 1 00 hours, a) [ 1 12] zone diffraction pattern showing 0022 and NhMo superlattice spots, b) corresponding microstructure of 0022 and Ni2Mo phases.
200

Figure 4-1 16. TEM microstructure of 9 at.% AI alloy aged at 600°C for I 00 hours, a) microstructure of D022 and Ni2Mo phases, b) corresponding [ 1 1 2] zone diffraction pattern.
20 1

e) Summary
The structures present after aging at 600 °C for 100 hours are summarized in
Table 4-4. The 2 at.% AI alloy has begun to from the � phase, but both a and D022 are
still present. In the 5, 7, and 9 at.% AI alloys, the same structure is present as in the as
quenched condition. In all cases, the structure has not coarsened appreciably.
Table 4-4. The microstructure ofNi-Mo-AI alloys aged at 600°C.
Ni4Mo 2 at.% AI 5 at.% AI 7 at.% AI 9 at.% AI
as-quenched SRO a SRO a + SRO a ? + 0022 + D022 +
0022 0022 Ni2Mo NhMo
aged at 600°C - a + � + 0022 0022 + 0022 +
0022 Ni2Mo Ni2Mo
{matrix) {matrix)
4.5.3. TEM Microstructural Evaluation of Ni-Mo-Al Alloys After Solution Treated
at 1 280°C and Aged at 650°C for 1 00 Hours
a) Ni4Mo Alloy
The microstructure of the Ni4Mo alloy after aging at 650°C consisted entirely of
fine � domains (Figure 4-1 1 7). This structure is in general agreement with other research
on the binary alloy [76-80). A considerable hardness increase accompanied the formation
of the � structure (Figure 4-1 ).
b) 2 at.% AI Alloy
In OLM, the microstructure if the 2 at.% At alloy appeared single phase (Figure
4-26). Figure 4-1 1 8 shows a microstructure of fine domains, and the diffraction pattern
202

Figure 4-1 1 7. TEM microstructure ofNi4Mo alloy aged 650°C for 1 00 hours, a) [1 12] zone diffraction pattern showing � superlattice spots, b) corresponding
microstructure of � phase.
Figure 4-1 1 8. TEM microstructure of 2 at.% AI alloy aged at 650°C for 100 hours, a) diffraction pattern at the [321] zone, b) corresponding microstructure of D022 and a phases.
203

shows LRO spots. However, the pattern was not indexed. The hardness increased from
the as-quenched value (Figure 4-3).
c) 5 at.% AI Alloy
The 5 at.% AI alloy had formed a considerable amount of a lamellar structure
(Figure 4-27) in the matrix. Figure 4-1 19b shows a fine domain structure of the matrix,
and the electron diffraction pattern from this region shows 0022 and Ni2Mo (weak)
spots (see arrow). Figure 4-1 19c shows the microstructure of the lamellar structure, but
its identification is discussed later.
d) 7 at.% AI Alloy
The microstructure of the 7 at.% AI alloy showed mostly an apparent single
phase matrix, with some grain boundary lamellar structure (Figure 4-28). Figure 4-120b
shows that the matrix consists of fine domains, and the diffraction pattern identifies these
as the D022 and NhMo phases. Figure 4-120c shows the lamellar structure, and the
associated diffraction pattern is in Figure 4-120d. The identification of this lamellar
structure is discussed later.
e) Summary
Table 4-5 summarizes the structures after aging 650°C. In the 5 at.% AI alloy, in
the matrix the initial 0022 structure has formed some NhMo, and a lamellar structure
also formed. In the 7 at.% AI alloy, the matrix sti l l contained only the 0022 and Ni2Mo
phases, and a lamellar structure formed. The hardness is about the same for the 2 at.% AI
alloy, but increases considerably for the 5 and 7 at.% AI alloys (Figure 4-3), which
corresponds to the appearance of the lamellar structure.
204

Figure 4-1 19. TEM microstructure of 5 at.% AI alloy aged at 650°C for 100 hours, a) [ 1 1 2] zone diffraction pattern showing strong intensity D022. and weak intensity NhMo, b) corresponding microstructure of D022 and Ni2Mo phases, c) lamellar structure.
205

Figure 4-120. TEM microstructure of 7 at.% AI alloy aged 650°C for 100 hours, a) [001 ] zone diffraction pattern showing 0022 and Ni2Mo superlattice spots, b) corresponding microstructure of 0022 and NhMo phases, c) lamellar structure, d) the diffraction pattern at c) region.
206

Table 4-5. The microstructure ofNi-Mo-Al alloys aged at 650°C.
Ni4Mo 2 at.% AI 5 at.% AI 7 at.% AI 9 at.% AI
as-quenched SRO a SRO ex + SRO a ? + 0022 + 0022 +
0022 0022 Ni2Mo NbMo
aged at 650°C � SRO ex + 0022 + 0022 + -
0022 Ni2Mo Ni2Mo
(?) (matrix), (matrix),
lamellar lamellar
structure structure
4.5.4. TEM Microstructural Evaluation of Ni-Mo-AI Alloys After Solution Treated
at 1 280°C and Aged at 750°C for 1 0 Hours
a) Ni4Mo Alloy
After aging for 10 hours at 750°C, the Ni4Mo alloy transformed completely to a
structure of fine � domain (Figure 4- 121). No other phases were present. The hardness
approximately doubled (Figure 4-4) in comparison to the as-quenched condition.
b) 2 at.% AI Alloy
After aging for 1 0 hours at 750°C, the 2 at.% AI alloy showed a single phase
(Figure 4-35). It had a fine structure which appears to be domains (Figure 4-122b), but
the diffraction pattern (Figure 4- 1 22a) from this region showed only SRO a spots.
However, in the solution heat treatment condition, this alloy showed both a and the
0022 phase (Table 4-3). Aging for 10 hours did not appreciable change the hardness.
207

Figure 4-121 . TEM microstructure ofNi�o alloy aged at 750°C for 1 0 hours, a) [001] diffraction pattern showing � superlattice spots, b) � domain and stacking faults.
Figure 4-122. TEM microstructure of2 at.% AI alloy aged at 750°C for 10 hours, a) [00 1 ] zone diffraction pattern showing SRO a. superlattice spots, b) SRO
a. phase.
208

c) 5 at.% Al Alloy
The microstructure of the 5 at.% AI alloy after aging for 10 hours was mainly the
matrix with a lamellar structure forming along the grain boundaries (Figure 4-36). Figure
4-1 23a shows the lamellar structure. The diffraction pattern (Figure 4-1 23b) is indexed in
Figure 4-123c, showing that one set of lathes is the equilibrium y (Ni3Mo) phase. The
other is y' phase. This is discussed later. There was a marked increased in hardness after
aging for I 0 hours.
d) Summary
The microstructure after aging for 10 hours at 750°C are summarized in Table 4-6.
Table 4-6 The microstructure ofNi-Mo-Al alloys aged at 750°C for 1 0 hours.
Ni4Mo 2 at.% AI 5 at.% AI 7 at.% AI 9 at.% AI
as-quenched SRO a SRO a + SRO a ? + 0022 + 0022 +
0022 0022 Ni2Mo Ni2Mo
aged at 750°C 13 SRO a lamellar - -
for 1 0 hours structure (y
+ y')
4.5.5. IEM Microstructural Evaluation of Ni-Mo-Al Alloys After Solution Treated
at 1280°C and Aged at 750°C for 50 Hours
a) Ni4Mo Alloy
In the Ni4Mo alloy, after 50 hours at 750°C , the structure was 13 domains (Figure
4-124a), which had coarsened somewhat compared to 10 hours aging (Figure 4-1 21).
209

O FO:: • Ni3Mo (y)
Figure 4-123. TEM microstructure of 5 at.% A1 alloy aged at 750°C for 10 hours, a) lamellar structure, b) diffraction pattern [IOO]y II [O l l ]fcc, c) schematic diagram of diffraction pattern [ 1 OO}y//[01 1 ]fcc.
2 10

t · C wr · � , a �� :·
Figure 4-124. TEM microstructure in Ni4Mo alloy aged at 750°C for 50 hours, a) �
phase and stacking faults, b) [001] zone diffraction pattern showing � superlattice spots.
2 1 1

Striations which are probably stacking faults had formed, perhaps associated with stress
relief as the domains grew (8 1 ]. The weak spots also shown in Figure 4-124b were not
indexed.
b). 2 at.% AI Alloy
After aging for 50 hours, the 2 at.% AI alloy still showed primarily untransformed
matrix, with a small amount of a lamellar structure in the grain boundaries (Figure 4-39).
The matrix structure consisted of domains, with some stacking faults present (Figure
4-125a). The ( I l l ] zone diffraction pattern probably shows the 0022 structure. The
hardness was essentially the same as that after aging for 10 hours (Figure 4-4).
c) 5 at.% AI Alloy
The microstructure of the 5 at.% AI alloy after aging for 50 hours consisted
entirely of a lamellar structure (Figure 4-40). The lamellar structure is shown in Figure
4-126. No diffraction pattern is available. The hardness increased somewhat over that
for aging 10 hours.
d) 7 at.% AI Alloy
The microstructure of the 7 at.% Al alloy consisted of a considerable amount of a
lamellar structure formed along the grain boundaries and the matrix (Figure 4-41) . Figure
4-127b shows the fine structure of the matrix. It consists of fine domains of the 0022
and Ni2Mo phases (Figure 4- 127a).
e) Summary
The microstructure after aging for 50 hours at 750°C is summarized in Table 4-7.
2 12

Figure 4-125. TEM microstructure of2 at.% AI alloy aged at 750°C for 50 hours, a) stacking faults and precipitates, b) [ I l l ] zone diffraction pattern showing D022 superlattice spots.
2 1 3

Figure 4-126. TEM microstructure of 5 at.% AI alloy aged at 750°C for 50 hours, a) and b) lamellar structure, c) stacking faults and particles.
2 14

Figure 4-127. TEM microstructure of7 at.% AI alloy aged at 750°C for 50 hours, a) [ 1 1 2] zone diffraction pattern showing D022 and Ni2Mo superlattice spots, b) the microstructure of D022 and NbMo phases
215

Table 4-7 The microstructure ofNi-Mo-Al alloys aged at 750°C for 50 hours.
Ni4Mo 2 at.% AI 5 at.% AI 7 at.% AI 9 at.% AI
as-quenched SRO a SRO ex + SRO a ? + 0022 + 0022 +
0022 0022 Ni2Mo Ni2Mo
aged at 750°C � 0022 + ? lamellar 0022 + -
for 50 hours structure ('Y Ni2Mo
+ ')") (matrix)
4 .5 .6. TEM Microstructural Evaluation of Ni-Mo-AI Alloys After Solution Treated at
1 280°C and Aged at 750°C for 100 Hours
a) Ni4Mo Alloy
After aging for I 00 hours at 750°C, the � domains have coarsened somewhat
(Figure 4- 1 28b). The hardness was the same as that after aging 50 hours (Figure 4-4). In addition to the � spots, the electron diffraction pattern (Figure 4- 1 28a) showed weak
spots consistent with the presence of the metastable Ni2Mo phase. This phase may be
the dark area marked by the arrow. There were some weak unidentified spots.
b) 2 at.% Al Alloy
The 2 at.% Al alloy showed a rather uniform structure of fine precipitates in
OLM (Figure 4-43). The fine structure is shown in Figure 4-129b . The electron
diffraction pattern from this area shows that the structure consists of domains of �. 0022
and NhMo. The hardness is about the same as that after aging 50 hours (Figure 4-5).
2 1 6

Figure 4-128. TEM microstructure ofNi4Mo alloy aged at 750°C for 100 hours, a) the microstructure of J3 and NhMo phases, b) [ 1 12] zone diffraction pattern
showing J3 and NhMo superlattice spots.
Figure 4-129. TEM microstructure of2 at.% AI alloy aged at 750°C for 100 hours, a) ( 1 1 2] zone diffraction pattern showing J3, D022 and NhMo superlattice spots, b) the microstructure of J3, D022 and Ni2Mo phases.
2 1 7

c) 5 at.% AI Alloy
The 5 at.% AI alloy had transformed completely to a lamellar and somewhat
spheroidized structure after aging for 100 hours at 750°C (Figures 4-44 and 4-72). The
lamellar structure i s shown in Figure 4- 1 30a. The diffraction pattern form this area i s
shown in Figure 4- 1 30b. Most of the spots can be accounted for by the y phase. EDS
analyses from the area A, B, C and D are in Figure 4-130, fto i . Chemical composition
derived from these spectra are shown in Table 4-8.
Table 4-8. Chemical composition of lamellar structure in Figure 4-1 30
AI (K) Ni (K) Mo (K) __ghase
wt.% at.% wt.% at.% wt.% at.%
lath A 6.2 1 3 .3 78.3 77.3 1 5 .5 9.4 y' Ni3(Al,Mo)
lath B 1 .0 2.5 63 .5 72.7 35 .5 24.8 y Ni3Mo
lath C 5.6 1 2.0 82.4 80.8 12.0 7.2 y' Ni3(Al,Mo)
lath D 0.9 2.2 70.8 78.5 28.3 1 9.3 y NiJMo
lath E 5 .5 1 1 .8 78.4 78.3 1 6. 1 9.9 y' Ni3(Al,Mo)
lath F 0.3 0.7 69. 1 78. 1 30.6 2 1 .2 y NiJMo
The laths B and D have a very low aluminum content and have about the right nickel to
molybdenum ratio to be the Ni3Mo y phase. The prominent diffraction spots in Figure
4- 1 30b are consistent with the known pattern ofy shown in Figure 4-130a. Thus the
dark laths in Figure 4- 1 30a are the y phase. The bright laths A and C have a high
aluminum content, and the ratio of nickel to the sum of molybdenum and aluminum is
about right for the y' Ni3(Al,Mo) phase. The diffraction spots from the y' probably
coincide with some of those ofy, but also could account for the weak spots not accounted
2 1 8

c 2oo iii 022y 022 • • • •
• •
• • •
• •
• • •
0 RX:
• N13Mo (7)
Figure 4- 130. TEM microstructure of 5 at.% Al alloy aged at 750°C for 1 00 hours, a) lamellar structure of y and y' phases, b) corresponding diffraction pattern, c) schematic diagram of diffraction pattern, d) lamellar structure, d) Ni-rich particles.
2 19

NiLoc N i Loc N i l<cc
NiKoc
Al l<cc J MoLoc
f g Figure 4-130. EDS analysis result from lamellar structure, f) A, g) B, h) C, i) D, j) E,
k) F.
220

NiKoc
AlKoc MoLcc h
NiKcc
j Figure 4-130. continue (h), (i), (j) and (k).
22 1
('"L" NiLccl AlKoc
rL.
AlKoc
NiKoc
i
NiKcc
5. 00
k

for by the y. The particles in Figure 4-130e could be rods viewed on end. The chemical
composition derived from the EDS spectra (Figure 4-1 30, j and k) indicate that these two
particles are y and "( . The result is in general agreement with other researcher in ternary
alloys [82 to 87].
d) 7 at.% AI Alloy
After aging for 100 hours at 750°C, the 7 at.% AI alloy consisted of lamellar
structure which had formed along the grain boundaries and an untransformed matrix
(Figure 4-45). Some of the lamellar structure along grain boundary was changing to a
coarse lamellar structure. The matrix consisted of a very fine tweed structure (Figure
4-13 1a) which the electron diffraction pattern showed consists of the NhMo, 1 and
0022 phases. The lamellar structure is shown in Figure 4-13 lb, and according to the
analysis above for the 5 at.% al alloy, it consists of the y and y' phases. The hardness
after aging for 100 hours was about the same as the after 50 hours. (Figure 4-4).
d) 9 at.% AI Alloy
The 9 at.% AI alloy had transformed to about half a lamellar structure in the
matrix after aging for 100 hours at 750°C (Figure 4-46). The matrix had a tweed structure
(Figure 4-132b); the diffraction pattern from it is shown in Figure 4- 132a. It was not
indexed, so that structure is unknown. The EDS analyses from the laths A and B and
matrix C are shown in Figure 4-1 32, e to g. The laths are composed ofy and 1 phase.
However, the 7 at.% AI alloy had a similar tweed matrix structure (Figure 4-1 3 1a), and
the electron diffraction pattern indicated that the tweed structure consisted ofNhMo,
0022 and y' . The hardness of this alloy was about the as that of the 5 and 7 at.% AI
alloys (Figure 4-3).
222

Figure 4-1 3 1 . TEM microstructure of 7 at.% AI alloy aged at 750°C for 100 hours, a) tweed structure, b) lamellar structure, c) [001] zone diffraction pattern corresponding tweed microstructure showing strong intensity NhMo and y' and weak intensity D022 superlattice spots.
223

Figure 4-132. TEM microstructure of9 at.% AI alloy aged at 750°C for 100 hours, a) [1 1 1 ] zone diffraction pattern showing D022 superlattice spots, b) corresponding microstructure of tweed structure, c) lamellar structure, d) corresponding [00 1] zone diffraction pattern.
224

N i lcc a
i l<cc
A l Kcc Melee
ilcc b i Kcc
N i lcc i Kcc c
E
Figure 4-132. EDS analysis results from the lamellar structure and matrix.
225

e) Summary
The microstructure in Ni4Mo and Ni-Mo-Al alloys after aging for 1 00 hours at
750°C is summarized in Table 4-9.
Table 4-9. The microstructure ofNi-Mo-AI alloys aged at 750°C for 100 hours.
Ni4Mo 2 at.% AI 5 at.% AI 7 at.% AI 9 at.% AI
as-quenched SRO a SRO a + SRO a ? + D022 + D022 +
0022 0022 NbMo Ni2Mo
aged at � � + D022 + -y + y' Ni2Mo + Ni2Mo +
750°C for Ni2Mo (lamellar D022 D022
1 00 hours structure) (matrix), -y+ (matrix), -y+
y' (lamellar y' (lamellar
structure) structure)
4.5 .7. TEM Microstructural Evaluation in Ni-Mo-Al Allovs After Solution Treated at
1 280°C and Aged at 850°C for 1 00 Hours
a) 2 at.% AI Alloy
After aging at 850°C for I 00 hours, the 2 at.% AI alloy had a fine plate-like
structure, a lamellar structure and a striated structure forming from the grain boundaries
and in the grains (Figures 4-48 and 4-74). The diffraction pattern of the matrix indicates
that i t is the D022 phase (Figures 4- 133, a and b). Dislocations are observed (Figure
4-133c). One of the lamellar structure is shown in figure 4- 133d, but no diffraction
pattern was obtained. After aging 100 hours at 850°C, the hardness decreased somewhat
from the value after aging at 750°C 100 hours value (Figure 4-3).
226

a
7 1 4 nm
� • - F
� -� . : � . �
�·· � ���n • � � -- • •
9 0 9 nm Figure 4-133 . TEM microstructure of 2 at.% AI alloy aged at 850°C for 1 00 hours, a)
microstructure of D022. b) [ 1 1 2] zone diffraction pattern showing D022 superlattice spots, c) dislocation, d) lamellar structure.
227

b) 5 at.% AI Alloy
After aging for 1 00 hours at 850°C, the 5 at.% AI alloy consisted entirely of
needle-like precipitates (Figures 4-49 and 4-75). These are shown in Figure 4-134, and
they are surrounded by dislocation. No diffraction patterns were obtained. These
precipitates are the 0 and y phases. They will be discussed in 7 at.% AI alloy upon aging
at 950°C. The hardness was above that of the solution heat treated condition (Figure
4-3).
c) Summary
The microstructure in Ni-Mo-Al alloys after aging at 850°C for 100 hours is
summarized in Table 4-10.
Table 4-10. The microstructure ofNi-Mo-Al alloys aged at 850°C for 1 00 hours
Ni4Mo 2 at.% AI 5 at.% AI 7 at.% AI 9 at.% AI
as-quenched SRO o. SRO a + SRO a ? + 0022 + 0022 +
0022 0022 Ni2Mo Ni2Mo
aged at - 0022 "( + o, a - -
850°C for (matrix), lath (matrix)
100 hours structure
4.5 .8. TEM Microstrucmral Evaluation in Ni-Mo-AI Alloys After Solution Treated at
1 280°C and Aged at 950°C for 1 00 Hours
a) 5 at.% AI Alloy
The microstructure of the 5 at.% AI alloy after aging for 1 00 hours at 950°C
228

Figure 4- 1 34. TEM microstructure of 5 at.% AI alloy aged at 850°C for 100 hours, a) and b) different shape precipitates and dislocation pile-ups at precipitates.
229

contained needle-like precipitates and particles (Figures 4-53 and 4-78). The particles are
Sa and the corresponding diffraction pattern in Figure 4-135b. It is rather complex, and
was not indexed. This structure is discussed in 7 at.% AI alloy. The hardness of this
alloy was about the same as that for the solution heat treated condition (Figure 4-3).
b) 7 at.% AI Alloy
After aging for 1 00 hours at 950°C, the 7 at.% AI alloy also consisted of fine
precipitates (Figures 4-54 and 4-79), but much finer than in the 5 at.% AI alloy. These
are shown in Figure 4-1 36a. Note that there are dislocations around them. EDS analyses
were obtained from the particles shown, and the chemical analyses are shown in Table
4-1 1 .
Table 4-1 1 . Chemical composition of precipitates
location AI Ni M o phase
wt% at.% wt% at.% wt% at.%
Matrix (A) 2.4 5.6 69.2 75.4 28.4 1 9 (X
black {B) 0.4 1 . 1 36.7 48.3 62.9 50.6 8 (NiMo)
short rod (C) 0. 1 0.4 34.3 45.9 65 .6 53 .8 8 (NiMo)
lath (D) 2.6 6.4 59.6 67.5 37.8 26.2 'Y (Ni3Mo)
Based on these data, the precipitates are identified as 8 and 'Y· The matrix is taken to be
a. The hardness of this alloy had increased somewhat over that of the solution heat
treated value (Figure 4-3).
230

Figure 4-135 . TEM microstructure of 5 at.% AI alloy aged at 950°C for 1 00 hours, a) lath shape precipitates and dislocations pile-ups at precipitates, b) diffraction pattern.
Figure 4-136. TEM microstructure of 7 at.% AI al loy aged at 950°C for 100 hours, a) and b) precipitates and dislocations, c) EDS analysis result from at A, d) B, e) D.
23 1

NiKoc
MoLoc N i Koc
N i Koc
Figure 4-1 36. continue (d) and (e).
A
B
D
232

c) Summary
The microstructure in Ni-Mo-Al al loys after aging at 950°C for 100 hours is
summarized in Table 4-12.
Table 4-1 2. The microstructure ofNi-Mo-AI alloys aged at 950°C
Ni4Mo 2 at.% AI 5 at.% AI 7 at.% AI 9 at.% AI
as-quenched SRO a SRO a + SRO a ? + 0022 + 0022 +
0022 0022 Ni2Mo Ni2Mo
aged at - - y, a (matrix) y + o, a -
950°C for (matrix)
1 00 hours
4 .5 .9. Summary of the Phase Identification of the Ni-Mo-AI Alloys for All the Heat
Treatments
The phase identification of the Ni-Mo-Al alloys in all aging conditions based on
the SEM and especially the TEM results is summarized in Table 4-1 3 .
4 .5 . 1 0. IEM Microstructural Evaluation of Aged Hastel loy B2 Allo.y In addition to the detailed examination of the Ni-Mo-Al alloys, there was the
opportunity for TEM examination of some samples of the commercial alloy Hastelloy
B2. This alloy is based on Ni4Mo, but has additions of iron, cobalt, chromium, and
manganese which may amount to about 4 wt.%. Thus the alloy has some of the
transformation characteristics of the ternary Ni-Mo-Fe and Ni-Mo-Cr alloys. The SRO
a phase can be retained be sufficiently rapid cooling from the a region, and this structure
is ductile. Upon aging, the a transforms to �. which the well known accompanying
233

N w �
Table 4- 13 . Summary examination of phase transformation in alloys
Ni4MO 2 at.% AI alloy 5 at.% AI alloy
1250°C, 50 hr. SRO a SRO a + 0022 SRO <X ? +0022
600°C, 100 hr. - (X + � + 0022 0022
650°C, 100 hr. � (matrix), y (X + 0022 (?) 0022 + Ni2Mo
particles (matrix), y + y'
(lamellar structure)
750°C, 1 o hr. p SRO a 'Y + 1 ( lamellar
structure), 0022 +
NhMo (matrix)
750°C, 50 hr. p 0022 + ?, 0 y + "( ( lamellar
particles structure)
7 at.% AI alloy 9 at.% AI alloy
0022 + NhMo 0022 + Ni2Mo,
Mo-rich particles
0022 + NhMo 0022 + Ni2Mo
(matrix), 0 lath (matrix) Mo-rich
particles, o lath
0022 + Ni2Mo -
(matrix}, y + 1
(lamellar structure)
y+ 1 ( lamellar -
structure), 0022 + I NhMo (matrix)
0022 + Ni2Mo -
(matrix), y + "(
(lamellar structure)

N w VI
750°C, 1 oo hr.
850°C, 1 00 hr.
950°C, I oo hr.
� + Ni2Mo
-
-
� + 0022 + "( + "(' ( lamellar
NhMo, 8 particles structure)
0022 ( matrix), y lath, a. (matrix),
lath structure 8 particles
Mo-rich particles, "( lath, a (matrix),
SRO a (matrix) 8 particles
NhMo + 0022 Ni2Mo + 0022
(matrix), "( + "(' (matrix), "( + "('
(lamellar structure) (lamellar structure)
y lath, a (matrix), -
8 particles
"( lath, a (matrix). -
8 particles and 1 along the grain
boundaries

embrittlement. In Hastelloy B2 alloy, due to the alloying addition, other phases may
fonn which also induce embrittlement.
The chemical composition of the alloy is given in the Table 3-5 . The samples had
been solution heat treated for 2 hours at 1065°C in argon, then aged from 550°C to 850°C
for up to 1200 hours. The details of the fabrication and heat treatment are given by
Brooks and Wang (20, 22]. Using OLM and SEM, they characterized their
microstructures, detennined the hardness and tensile properties, and characterized the
fracture surfaces of the broken tensile samples.
4.5 . 1 1 . TEM Microstructural Evaluation of Haste1loy B2 Alloy upon Aging at
550°C
In the solution heat treated condition, the Hastelloy B2 alloy showed only SRO
a. In the binary Ni4Mo alloy, the transition of the [001 ] electron diffraction pattern as
the SRO a transforms to a domain structure of � is shown in Figure 2-24. After aging the
Hastelloy B2 alloy for 200 hours at 550°C, the diffraction pattern (Figure 4-137) shows
that the transition to � has begun. After 800°C hours, a fine domain structure is formed
(Figure 4-1 38a). The electron diffraction pattern shows � spots and weak spots of the
metastable 0022 phase. After 1200 hours, the structure has coarsened (Figure 4-139c).
The diffraction pattern still shows that both the � and D022 phases are present. This
result is in general agreement with other researchers [90, 9 1 ] .
4.5 . 1 2. TEM Microstructural Evaluation of Hastelloy B2 Alloy upon Aging at
650°C
Aging for 200 hours at 650°C produced a fine domain structure (Figure 4- 140b ).
The electron diffraction pattern (Figure 4-140a) shows strong � spots and the transition
236

Figure 4-137. [001 ] zone diffraction pattern showing intermediate stage of SRO a phase transformation to � phase in Hastelloy B2 alloy aged at 550°C for 200 hours.
Figure 4-138 . TEM microstructure ofHastelloy B2 alloy aged at 5 50°C for 800 hours, a) second phase precipitates in matrix, b) corresponding [ 1 1 2] zone diffraction pattern showing the � and D022 superlattice reflections.
237

Figure 4-139. TEM microstructure ofHastelloy B2 alloy aged at 5 50°C for 1200 hours, a) and b) [001 ] and [1 12] zone diffraction pattern showing reflection at 0022 and � superlattice positions, c) corresponding microstructure at [ 1 12] zone diffraction pattern showing early stage of striation of plates 0022 phase.
238

Figure 4-140. TEM microstructure of Hastelloy B2 alloy aged at 650°C for 200 hours, a) [ 1 1 2] zone diffraction pattern showing reflection at a and � superlattice spots, b) corresponding microstructure showing a. and � phases
239

appearance of the SRO presence in Figure 4- 137 is missing. The other spots are
consistant with the D022 phase, although some overlap with SRO ex. Aging for 400
hours, did not change the microstructure nor the diffraction pattern.
Aging for 800 hours produced a similar domain structure (Figure 4-141b). The
diffraction pattern (Figure 4-14 l a) showed only spots from � and weak D022 spots; no
SRO ex spots were present. The structure has begun to take on a lath-like appearance.
After aging for 1200 hours, the domains have coarsened and there is an indication
of an aligned structure (Figure 4-142c ). The electron diffraction patterns (Figure 4-142, a
and b) show that the microstructure is a mixture of � and D022·
4. 5 . 13 . TEM Microstructural Evaluation ofHasteltoy B2 Alloy upon Aging at
750°C
Aging at 750°C for 200 hours began to produce a lath-like structure as revealed by
OLM [22]. This is shown in Figure 4-143a. The diffraction pattern shows that this
structure contains 13 and the D022 phase.
After aging for 400 hours, some regions appeared to have recrystallized (Figure
4-144a). The diffraction pattern shows that only SRO ex is present, but it is not clear
why .
After aging for 800 hours, the structure i s markedly coarsened (Figures 4-145, b
and c). A [ 1 1 1] diffraction pattern shows superlattice spots. Note that in this
orientation, superlattice spots from � will not be present in a [ I l l ] zone diffraction
pattern. This pattern was not indexed so the phase were not identified.
Aging for 1200 hours formed a prominent lath-like lamellar structure in OLM
[22]. This is shown in Figure 4- 146a. The electron diffraction pattern in Figure 4-146b
shows superlattice spots, but it was indexed, so the phases were not identified.
240

Figure 4-141 . TEM microstructure ofHastelloy B2 alloy aged at 650°C for 800 hours. a) [00 1 ] zone diffraction pattern showing intensity maxima at D022 and � superlattice positions. b) corresponding microstructure showing D022 phase precipitates in � phase matrix. c) in some region. the early stage striation D022 phase formed.
24 1

Figure 4-142. TEM microstructure ofHastelloy B2 alloy aged at 650°C for 1200 hours, a) and b) [001 ) and [ 1 12] zone diffraction pattern showing diffuse intensity maxima at 0022 and f3 superlattice spots, c) corresponding microstructure at [ 1 12] zone showing fine 0022 and f3 phase mixture.
242

Figure 4-143 . TEM microstructure ofHastelloy B2 alloy aged at 750°C for 200 hours, a) a and � phases, b) corresponding [ 1 12] zone diffraction pattern showing
a and � phase.
Figure 4-144. TEM microstructure ofHastelloy B2 alloy aged at 750°C for 400 hours, a) SRO a phase recrystallization at grain boundaries and caused, b) corresponding [ 1 12] zone diffraction pattern at recrystallization region showing diffuse intensity at { 1 112 0} positions.
243

Figure 4-145. TEM microstructure ofHastelloy B2 alloy aged at 750°C for 800 hours, a) [ I l l ] zone diffraction pattern showing reflection at 0022 superlattice positions, b) and c) coarsening 0022 domain.
244

Figure 4-146. TEM microstructure ofHastelloy B2 alloy aged at 750°C for 1200 hours, a) lamellar structure form along the grain boundaries, b) corresponding diffraction pattern.
245

4.5. 14. TEM Microstructural Evaluation ofHastelloy B2 Alloy upon Aging at 850°C
OLM revealed that aging for 200 hours at 850°C produced a prominent lath-like
lamellar structure [22]. Only the matrix was observed in TEM microstructure (Figure
4-147). No diffraction pattern was obtained.
With increasing aging time to 400 hours, the amount of the lath-like structure
increased [22]. However, the matrix (Figure 4-148b) shows no clear domains, and the
diffraction pattern (Figure 4-148a) shows that the structure in only SRO a. After aging for 800 hours, the lath-like structure is shown in Figure 4-149a. The
diffraction pattern from the A area shows the only SRO a. No diffraction pattern form
the B area was obtained.
After aging for 1200 hours, OLM shows the lath-like structure [22]. Figure
4-1 50a shows the SRO diffraction pattern from the matrix region. The microstructure
shows only the matrix region.
4.5. 1 5. Summary of Structure Formed upon Aging Hastelloy B2 Alloy
Table 4-14 summarizes the phase transformation in Hastelloy B2 alloy upon aging
from 550°C to 850°C for up 1200 hours.
246

Figure 4-147. TEM microstructure ofHastelloy B2 alloy aged at 850°C for 200 hours, the dislocation loops.
Figure 4-148. TEM microstructure ofHastelloy B2 alloy aged at 850°C for 400 hours, a) selected area diffraction pattern at (001] zone showing intensity maxima at { 1 112 0} stops, b) corresponding microstructure showing the SRO a phase forms.
247

Figure 4-149. TEM microstructure ofHastelloy B2 alloy aged 850°C for 400 hours, a) the coursening lamellar structure, b) [001] zone selected area diffraction pattern showing the SRO a superlattice spots.
Figure 4-150. TEM microstructure ofHastelloy B2 alloy aged at 850°C for 1200 hours, a) [001 ] zone diffraction pattern showing diffuse intensity maxima at SRO a superlattice spots, b) corresponding microstructure showing SRO a phase and dislocation pile-ups at grain boundary.
248

Table 4-14 . Microstructure feature of Hastelloy B2 alloy
200 hours 400 hours
550°C SRO a. + � SRO a. + �
650°C � + D022 � + D022
750°C lath structure SRO a.
� + D022 recrystallizatio
n in a few
region
850°C - SRO a.
4. 7. Corrosion Resistance Evaluation
800 hours 1 200 hours
� + D022 � + D022
� + D022 � + D022
0022 + ? lamellar
structure
SRO a. + SRO a. (matrix)
lamellar
structure
As described in the literature review, Hastelloy alloy B2 has demonstrated an
unusual corrosion resistance to nonoxidizing solutions of several mineral acids, including
hydrochloric, sulfuric, and phosphoric acids at elevated temperature. It is well known
that aluminum alloys have good corrosion resistance in natural atmospheres [92]. The
influence of aluminum on the corrosion resistance to environments depends on the
presence of a thin, compact film of adherent aluminum oxide on the surface. The two
factors that mostly affect a material 's corrosion resistance are alloy composition and
fabrication practice. Any factors which can vary the microstructural stability can affect
the alloy corrosion resistance. The general corrosion behavior ofNi-Mo-AI alloys was
249

examined and the results are given here. Also some experimental results from Ni4Mo
alloy are included for comparison purposes.
4.7. 1 . Corrosion Resistance Evaluation ofNi�Mo Ailoy
Ni4Mo alloy possesses excellent corrosion resistance in a variety of nonoxidizing
acid conditions, especially in a hydrochloric environment. Therefore, the general
corrosion resistance and localized corrosion resistance ofNi�o alloy (as-received
condition) has been examined by ASTM A262 Practice A, potentiodynamic anodic
polarization and a modified U-bend test based on the design of the ASTM G-30 U-bend
test. After aging at 750°C for 100 hours, the Ni�o alloy was examined by cyclic anodic
polarization and polarization resistance tests.
(a) ASTM A262 Practice A Evaluation
After the ASTM A262 Practice A test, the oxalic electrolytic etched structure is
presented in Figure 4-1 5 1 . The microstructure in Ni4Mo alloy showed that a grain
boundaries appear. The nonacceptable ditch structure was not observed. It was clearly
shown that the Ni4Mo alloy passed the ASTM A262 practice A test.
(b) Potentiodynamic Anodic Polarization Test
According to ASTM standard 05-87 [61 ] and G-102 [92], the result from
potentiodynamic anodic polarization test for Ni4Mo alloy is shown in Tables 4-1 5 and
Figure 4-1 52. Figure 4-1 52 does not exhibit an anodic peak associated with the active to
passive transition. In general, the results obtained agree with the results reported by
Jones for Hastelloy B2 alloy conducted in deareated I N H2S04 [93] .
250

· . . ./
. � . . •
' -
-.
·-
/ · ·. �· ...
' ! •
. • .
•
Figure 4-15 1 . Microstructure in Ni4Mo alloy showing result of ASTM A 262 Practice A.
0,0 0.1 1.0 10.0 100 0 1000.0 10000.0 100000.0 Current Density (uA/cm')
Figure 4-152 Potentiodynamic anodic polarization curve in Ni4Mo alloy ( 1 N H2S04 solution in deareated condition).
25 1

Table 4-1 5 . Anodic Polarization Parameter Measurement in Ni4Mo Alloy
Ecorr lcorr CPR (mpy)
+166 mV 1 7.3 J.1A/cm2 7. 1
CPR = 0. 129 (M/n)icorr /9.22
(c) Modified U-Bend Test
In order to consider the influence of stress on the stress corrosion resistance, the
U-bend test was conducted (see section 3). Due to the limitation of available material, a
modified U-bend test was used. However, the modified test was sufficient to evaluate the
stress influence on intergranular corrosion attack. After the modified U-bend test (Figure
3-3), SEM topographic morphology of the tested surface is shown in Figure 4-1 53 .
lntergranular cracking was found in the sample.
After A262 Practice A, Potentiodynamic Anodic Polarization and Modified U
Bend test, the Ni4Mo alloy (as-received condition) showed an acceptable etch structure in
the A262 practice A test and did not exhibit an anodic peak associated with active to
passive transition in the potentiodynamic anodic polarization test, and showed relative
corrosion good resistance (7 mpy). However, there was a notable intergranular corrosion
attack tendency under the stressed condition.
4.7.2 . Corrosion Resistance Evaluation ofNi-Mo-Al Alloys
The Ni�o alloy and the Ni-Mo-Al alloys chosen for corrosion evaluation. All
samples were solution treated at 1280°C for 50 hours, water quenched, then aged at
750°C for 100 hours. The corrosion resistance was determined by using cyclic anodic
polarization and polarization resistance techniques from which general corrosion
resistance of samples examined can be extracted.
252

Figure 4-1 53. SEM microstructure in Ni4Mo alloy showing interganular cracking in Ubend test sample.
253

(a) Cyclic Polarization Evaluation ofNi-Mo-Al Alloys
A cyclic polarization scan can provide a qualitative view of pitting corrosion. The
concept of a typical cyclic anodic polarization curve is shown in Figure 4-1 54. It starts at
the open-circuit corrosion potential, Ecorr, then proceeds in the up-scan direction through
the passive range where the material is uniformly corroding at a very low rate. At a
localized-corrosion breakdown potential, Ea. the anodic current density increases
suddenly and dramatically, an indication of pitting corrosion [94]. Many types of
corrosion attack such as intergranular corrosion and crevice corrosion initiate at pits. The
cyclic anodic polarization curve can give information about pitting corrosion resistance. If
Ecoa is less than Eprot. there is no pitting corrosion; ifEcorr is greater than Epro1 and less
than Ea, new pits cannot initiate but old pits can still grow; IfEcoa is greater Ea, pitting
corrosion starts. Therefore, information about pitting behavior can be obtained from the
cyclic polarization curve. The general corrosion behavior of materials can be distinguished
through this approach.
The results of cyclic anodic polarization ofNi-Mo and Ni-Mo-Al alloys are
shown in Figures 4-1 5 5 to 4- 1 59. No passive film phenomenon was observed in all cyclic
curves. Only Figure 4-1 59 shows a little hystersis loop. The Ni4Mo and Ni-Mo-Al
alloys in 14% hydrochloric acid solution all showed uniform active corrosion. In general,
Ni-Mo-Al alloys showed a similar corrosion resistance to Ni4Mo alloy. No corrosion
pits were observed in the tested samples after cyclic polarization testing.
(b) Polarization Resistance for Ni-Mo-Al Alloys
After aging at 750°C for 100 hours, the Ni4Mo and Ni-Mo-Al alloys were
examined by polarization resistance testing. The average data based on 2 to 4
independent tests for each alloy are shown in Table 4-16. As indicated, the icoa value are
254

E s - - - · · · •• · · - · • • · · - · ·· · · - J . , P a s s i va t i on .11
o n u p - s c a n , .,., 'I - - - � I E p r o t , A · · - · ·-- - � - r- - - - - A , �· / !
/ " I : .. ....,. __ _ ..... : E c o rr t--..... -�. "=.-;;;i;+--- --- -
/I :
B .,., ...., . , . , : _ _ ,
/
E p r o t . B - - - - - - -�.;:.: � :-- Up-sca n '
Dow n- s c a n -------
LOG CURRENT DEN S I TY
Figure 4-1 54. Schematic diagram of cyclic polarization curve.
255

� en ui >
> e -
ca · --c � -0 Q.,
300
275 -
250 ·
225 -
200 ·
175 .
150 ·
125 -
100 - a a •
75 .
so -
25 -
0
1
a • • a
• • • a
I 10
a a .•
a a
aaa a
• •a
• a • • •
• • • a a • a • • • -• -a a a • a • • • • a • a
a
• a
• •
• •
a
I 100
I 1000
• current density (J.LA/cm"2)
10000
Figure 4-1 55. Cyclic polarization ofNi4Mo alloy in 14% hydrochloric solution after aging at 750°C for 100 hours.
256

-� rn u.i >
> e -
-a ·� = Q) 0 Q,
300
275 -
250 -
225 -
200 -
175 -
150 -
125 -
100 -
15 -•
so -
25 -
0
1 -.
10
• •
•
• •
• •
a • a • • ---a a • • • a • • • a • a • a • a • • • • • a • • • a • • • •
• •
• •
I 100
• •
• •
1000
current density (J..LA/cm"2)
10000
•
Figure 4-1 56. Cyclic polarization behavior of 2 at.% AI alloy in 14% hydrochloric solution after aging at 750°C for 100 hours.
257

-� til ui >
< e --CIS
· --c: Cl.) -0 c.
300
215 -
250 -
225 -
200 -
175 -
150 -
125 -
100- •
75 -
so-
25 -
0
•
I 10
•
• D
• •
• -•• • • • • • • • • •
D • D • •
I 100
• • •
D a • • •
• • • • D • • • • • • • • • D . • • •• -•
T 1000
current density (J.1A/cm"2) •
10000
Figure 4-1 57. Cyclic polarization behavior of 5 at.% AI alloy in 14% hydrochloric solution after aging at 750°C for 1 00 hours.
258

-� rn ui >
> e -
:3 -c Q,) -0 Q.
300
275 -
250 -
225 -
200 -
175 -
ISO -
125 -
100 -
75 - a
so -
25 -
0 I 10
a ,.a -
.. -
• • a D
• a a • a a
• • -a a a a a a a a a a a • a a a a a a a a a a a a • a a a D • • •
a
I 100
current density (JJ.A/cm"2)
I 1000 10000
•
Figure 4-158. Cyclic polarization behavior of 7 at.% AI alloy in 14% hydrochloric solution after aging at 750°C for 100 hours.
259

-� tl) ...,; >
> e -
Cii · --c:: � -0 Q..
300
275 -
250 -
225 -
200 -
175 -
150 -
125 -
100 - a
75 -
so -
25 -
0 I 10
a • a
• •
• a a
a a .
a a
•a
I 100
.. •
a
• • aa
• aa • a • a a a • • • • a • • • a a a a • a a a a a a a a a ••
I 1000 10000
current density (J.1A/cm"2) a
Figure 4-159. Cyclic polarization behavior of9 at.% AI alloy in 14% hydrochloric solution after aging at 750°C for 1 00 hours.
260

different for the Ni-Mo-Al alloys. The differences in corrosion resistance are associated
with the difference in as microstructures related to the aluminum content.
The microstructure in Ni4Mo alloy is a mixture of J3 and Ni2Mo phases and it
shows good corrosion resistance . The 2 at.% AI alloy is J3, Ni2Mo and 0022
mixture structure and shows fair corrosion resistance. The 5 at.% AI alloy is two phase
structure (lamellar structure) and its corrosion resistance is fair compared to the Ni�o
alloy. As indicated from previous sections, the 7 at.% AI alloy contains 0022 and
NhMo phases with an amount of lamellar structure along the grain boundaries. The 7
at.% AI alloy showed somewhat better corrosion resistance than 2 and 5 at.% AI alloy.
Nevertheless, this observation indicates that the lamellar structure may decrease the
corrosion resistance. It also should be noted that 7 at.% AI alloy showed a relatively
larger grain size (Figure 4-45) with fewer lamellar structure regions. Thus, greater
corrosion resistance is shown in 7 at.% AI alloy. Therefore, the materials possessing a
lamella structure usually showed a higher corrosion tendency compared to the single
phase materials for the same aging condition. The microstructure in 9 at.% AI alloy
showed 50% lamellar structure and 50% D022 and NhMo phases. The corrosion
resistance of 9 at.% AI alloy was slightly better than that of 5 at.% AI alloy .
However, the corrosion resistances for all samples showed only small differences.
A range of 5 to 20 mpy is considered good corrosion resistance and Ni4Mo and 7 at.% AI
alloys were within this range. A range of 20 to 50 mpy is considered fair corrosion
resistance and the other Ni-Mo-Al alloys fell in this range. The effect of aluminum did
not significantly influence the corrosion behavior for the Ni4Mo alloy. However, it is
noted that aluminum as an oxide-film-forming element has beneficial influence on
corrosion resistance, but aluminum also enhances the formation of the lamellar structure
which degrades the corrosion resistance (for example: the 5 at.% AI alloy).
26 1

Table 4-1 6 Summary ofPolarization Resistance Results (average values
based on 2 to 4 independent tests for each alloy)
Ecorr (mV lcorr (SHE)) (J.LA/cm"2)
Ni4Mo +52 40
2 at.% AI +66 70
5 at.% AI +75 1 12
7 at.% AI +86 54
9 at.% AI +69 93
corrosion rate = 0. 1 29 i (M I n) 0
i = current (J.l.Aicm2)
M= atomic weight
corrosion relative
rate (mpy) corrosion
resistance
16 good
27 fair
4 1 fair
19 good
33 fair
n = the number of equivalent exchanged ( Ni=2, Mo=3, AI =3)
microstruc-
ture
13 + Ni2Mo
j3+0022
+NhMo
'Y + y' Ni2Mo+
0022. y+y(10%)
Ni2Mo+
0022, rl (SO%)
D = density of the alloy (glcm3) (The density ofHastelloy B = 9.22 g/cm3 was
used)
f . 1 for alloy: equivalent weight = L Mx· n · I fi = mass fraction
Di = electrons exchanged
Mi = atomic weight
262

CHAPTER S
CONLUSIONS AND RECOMMENDATIONS
CONLUSIONS
I . The binary alloy contained only SRO a in the solution treated condition, but with
increased aluminum content the structure changed to a very fine domain mixture of
the non-equilibrium D022 and Ni2Mo phases. Apparently the addition of
aluminum to Ni<tMo enhances the kinetics of the decomposition of the SRO a during quenching from a solution heat treatment temperature.
2. In the solution heat treated condition, aluminum increased the hardness
considerably. The Ni<tMo alloy had a hardness of about 220HV while the 9 at.%
AI alloy had a value of about 460 HV. All the alloys in the solution heat treated
condition appeared to be ductile. Thus the addition of AI significantly increases
the hardness in the solution heat treated condition yet good ducti lity is retained.
This implies that these AI alloys could be heated into the a range (e.g., 1000°C)
then quenched, and a structure would be obtained which would have a hardness
significantly higher than the binary alloy yet have good ductility.
3 . After aging for 100 hours from 600 to 950°C, all alloys were harder than the
solution heat treated condition. Also, for a given aging treatment, the hardness
increased with aluminum content, or in some case remained about the same for
263

the higher aluminum alloys. The highest hardness was obtained after aging at
700°C, attaining a value of about 650 HV for the 5, 7 and 9 at.% AI alloys. Thus
to obtain maximum hardness upon aging for 100 hours (but see 4. below), the
aging temperature should be near 700°C.
4. upon aging for 1 0, 50 and 100 hours at 750°C for all alloys the hardness increased
significantly after 10 hours, then in 50 hours attained a value about twice that of
the solution heat treatment condition, then remained about the same after aging
1 00 hours. Thus an optimum aging time is somewhere between 1 0 and 50 hours
at this temperature.
5. However, in all the aged condition, the Ni4Mo alloy and all the aluminum alloys
were brittle. Thus, the addition of aluminum dose not prevent embrittlement
during aging.
6. The structure of the solution heat treated condition of the higher aluminum alloys
changed to a mixture of the intermetallic phases y and d and matrix of a fine
domain structure of the non-equilibrium D022 and Ni2Mo phases. In the 7 and 9
at.% AI alloys, the aluminum-rich Ni3(AI + Mo) y' phase formed as well as pure
molybdenum particles. The morphology of these phases varied, with some as
precipitates in the grain boundaries, some as a lamellar structure, and some as
relative fine precipitates. The hardness associated with aging is accused by the
formation of these complex microstructures. However, these brittle intermatallic
phases with a complex morphology is the cause of the accompanying
embrittlement.
264

7. The Ni�o and Ni-Mo-Al alloys show similar good corrosion resistance and no
pitting corrosion initiation. The aluminum can influence the microstructure
formation in Ni-Mo alloy upon aging. After 5 at.% AI was added in the Ni4Mo
alloy, the lamellar structure (y + y') formed and the corrosion resistance reduced
slightly. The fine domain ofD022 and Ni2Mo showed the corrosion resistance.
Thus, the corrosion resistance was found to be slightly dependent on aluminum
content.
RECOMMENDATIONS I . A detailed evaluation of the tensile mechanical properties of these alloys after
equilibrating in the a region (e.g., I hours at 1000°C and quenching) should be
conducted.
2. A careful examination of the effect of cooling rate from the a region on the
mechanical properties and structure should be undertaken. From a practical
standpoint, it is important to know what range can be tolerated without inducing
structural change on cooling which cause embrittlement.
3 . Stress corrosion cracking evaluation of the 7 and 9 at.% AI alloys should be
studied
265

REFERENCES
266

REFERENCES
1 . W. L . Mankins and S . Lamb, "Nickel and Nickel Alloys'\ ASM Handbook, l Oth Edition, Vol. 2, Properties and Selection: Nonferrous Alloys and Special-Purpose Materials, pp. 428-445 {1990).
2. C. R. Brooks, I. E. Spruiell, and E. E. Stansbury, "Physical Metallurgy of NickelMolybdenum Alloys", Metals Reviews, 29:210-248 ( 1984).
3 . C . T . Liu and J . 0 . Stiegler, "Ordered Intennetallics", ASM Handbook, l Oth Edition, Vol. 2, Properties and Selection: Nonferrous Alloys and Special-Purpose Materials, pp. 9 13-936 { 1990).
4. S. J. Matthews, " Selection of Nickel Base Corrosion-Resistant Alloys Containing Molybdenum," ASM Handbook, l Oth Edition Vol . 6, Welding, pp. 593-597 ( 1990).
5 . Hastelloy Alloy B2, The Technology Materials Division, Cabot Corporation, Kokomo, IN ( 1977).
6. S. Cao, C. R. Brooks and G. Whittaker, "The Structure of the Heat-Affected Zone in Welds of a Ni-29wt.% Mo Commercial Alloy (Hastelloy B2)", Materials Characterization, 33 :2 1 -32 ( 1994).
7. W. Z. Friend, Corrosion ofNickel and Nickel-Base Alloys, John Wiley and Sons Inc., New York {1980).
8. A. I. Asphahani, "Corrosion of Nickel-Base Alloys," Metals Handbooks 9th Edition, Vol . 13 , Corrosion, pp. 641-657 ( 1984).
9. M. Raghavan, B . I. Berkowitz and J. C. Scanlon, "Electron Microscopic Analysis of Heterogeneous Precipitates in Hastelloy C-276", Metallurgical Transaction A, 13A:979-984 ( 1982).
1 0. M. J. Cieslak, T. I. Headley and A. D. Roming, "The Welding Metallurgy of Hastelloy Alloy C-4, C-22 and C-276", Metallurgical Transactions, 1 7A:2035-2047 (1986).
1 1 . Hastelloy Alloy S, Technical lnfonnation, Haynes International, Inc., Kokomo, IN ( 1988).
267

1 2. Hastelloy Alloy W, Technical Information, Haynes International, Inc. Kokomo, IN (1989).
1 3 . H. M. Tawancy, "Identification of Eta-Carbide in a Commercial Ni-Mo Alloy (Hastelloy Alloy B2)," Journal of Materials Science, 1 6: 1 1 17-1 1 1 8 (198 1 ).
14. ASM Handbook, lOth Edition, Vol. 3, Alloy Phase Daigrams, Metals Park, Ohio ( 1992).
1 5 . P. V. Guthrie and E. E. Stansbury, "X-ray and Metallographic Study of the Nickel-rich Alloys of the Nickel-Molybdenum System IT', Report ORNL 3078, Oak Ridge National Laboratory, TN (1961).
16. R. E. W. Casselton and W. Hume-Rothery, "The Equilibrium Diagram of the System Molybdenum-Nickel", J. Less-Common Metals 7 :212-224 ( 1964).
17. W. E. Norem, Ph.D. Dissertation, University ofTennessee, 1963 .
1 8. T. S. Lei, Ph.D. Dissertation, University of Tennessee, 1979.
1 9. M. Brauwers, I. Giner, I. V. Rest and F. Brouers, "Influence of Long Range Order on Electrical Resistivity in Alloys", Solid State Communication 17:229-232 ( 1975).
20. C. R. Brooks and Y. M. Wang, "Tensile Properties and Fractograply of Aged Hastelloy B2 (550°C-850°C for up to 1200H)", Materials Characterization 25 : 1 85-197 ( 1990).
2 1 . W. E . Clayton and C . R. Brooks, "The Effect of Aging on the Tensile Mechanical Properties of High-Purity Binary Ni- 10, -20, and -30 wt Pet Cr Alloy", Metallurgical Transactions 2:53 1-535 (1971) .
22. C. R. Brooks and Y. M. Wang, "Effect on the Miocrostructure of Aging Hastelloy B2 from 550 to 850°C", Metallography 23 :57-86 ( 1989).
23 . D. F. Roan and C . R. Brooks, "The Effect of Aging on the Mechanical Properties of a Ni-Mo-Fe Alloy (Hastelloy B)", Metallurgical Transactions, 6A: 1 829-1831 ( 1975).
24. Siqi Cao and C. R. Brooks, "Recrystallization of the Disordered and Ordered Structure in Ni-20 at.% Mo Alloy", Microstructural Science, 2 1 :277-288 ( 1994).
268

25. M. Sanganeria and C. R. Brooks, "The Effect of Cold Working on the Ordering Reaction in Ni�o", Microstructural Science, 1 8:237-253, Editors, T. A. Place, J. D. Braun, W. E. White and G. F. Vander Voort, ASM International, Materials Park, OH, ( 1990).
26. Fu-Wen Ling, R. S. Irani and R. W. Cahn, "Ordering Kinetic of Cold-Worked N4Mo", Materials Science and Engineering 15 : 1 1 8 1- 1 1 86 ( 1974).
27. C. R. Brooks and S. Cao, "The Development of the Ordered Structure from Cold Worked Disordered Alpha in Ni�o", Philosophical Magazine A, 65:327-353 (1992).
28. J. E. Spruiell and E. E. Stansbury, "X-ray Study of Short-Range Order in Nickel Alloys Containing 1 0.7 and 20.0 at.% Molybdenum", J. Phys. Chern. Solids 26:8 1 1-822 (1965).
29. T. Saburi, E. Kanai and S. Nenno, "Domain Structure in NiMo Alloy", Journal of the Less-Common Metals, 37:59-70 (1974).
30. J. Lecomte-Beckers, "Study of Solidification Features of Nickel-Base Superalloys in Relation with Composition", Metallurgical Transactions, 19A:2333-2340 ( 1988).
3 1 . V. I. Kiriyenko, E. E. Poplavskaya and L. P . Potapov, "Influence of Alloying Elements on Ordering in Nickel-Molybdenum Alloys", Phys. Met. Metall . , 33 : 1 2360-1266 ( 1972).
32. H. H. Uhlig and R. W. Revie, Corrosion and Corrosion Control, John Wiley and Sons Inc. New York ( 1985).
33 . H. M. Tawancy, "Effect of Cr on the Ordering Behavior and Ductility of an NiNi4Mo Alloy", Metallurgical Transactions, 23A: 1 892- 1833 ( 1992).
34. K. Vasudevan and E. E. Stansbury, "Influence of Chromium on Ordering of Ni4Mo", Scripta Metallurgica, 19 : 1 101-1 106 (1985).
35 . J . Kolts, J.B . C. Wu and A. I . Asphahani, "Highly Alloyed Austenitic Materials for Corrosion Service", Met. Prog. 25-36 ( 1983).
36. J. A. Shields, Jr., "Surface Engineering of Refractory Metals and Alloys", ASM Handbook, lOth Edition, Vol . 5, Surface Engineering, pp. 856-862 ( 1990).
269

37. H. M. Tawancy, "Ductilization ofNi-Ni4Mo Alloys by Boron Additions", Metallurgical Transactions, 22A:3067 -3071 ( 1991 ).
38. S. K. Das, L. A Davis, J. R. Y. Wang, and D. Kapoor, "Ni-Mo-B Alloys: Metallic Glass to Ductile Crystalline Solid," Source unknown.
39. W. Betteridge and J. Heslop, The Nimonic Alloys, Crane, Russak and Company, New York ( 1974).
40. R. B. Herchenroeder, G. Y. Lai and K. V. Rao, "A New, Wrought, Heat Resistance Ni-Cr-Al-Fe-Y Alloy", J. Met., 35 : 1 6-22 ( 1983).
4 1 . A . Choudhury, H. P . Kao, C . R. Brooks and C. L. White, "Auger Analysis of the Fracture Surface of Ordered Ni4Mo", Scripta Metallurgica, 22: 1057-1062 (1988).
42. C. R. Brooks and M. Sanganeria, "Intergranular Fracture Along Migrated Boundaries in Ordered Ni4Mo", Scripta Metallurgica, 22: 1 683-1688 (1988).
43 . E. E. Stansbury, "Kinetics of the SRO-LRO Transformation in Ni4Mo, HighTemperature Ordered Intermetallic Alloys", High-Temperature Ordered lntermetallic Alloys, pp. 93-107, Editors, C. C. Koch, C. T. Liu and N. S. Stoloff, Mateial Research Society, Pittsburgh Pennsylvania ( 1 985).
44. H. H. Kao, "Dislocation Structure, Deformation Structure, Strengthening Mechanisms and Embrittlement Cause of Ordered Ni4Mo Alloy," Ph.D., Dissertation, University of Tennessee, (1986).
45. D. J. Tillack, J. M. Manning and J. R. Hensley, "Heat Treating ofNickel and Nickel Alloys", ASM Handbook lOth Edition, Vol. 4, Heat Treating, pp. 907-912 ( 1990).
46. R. S. Irani, Fu-wen Ling and R. W. Cahn, "Domain Structures and Hardening in Ordered Ni4Mo", Metallography 6: 141- 153 ( 1973).
47. E. Ruedl, P. Delavignette and S. Amelinda, "Electron Microscopic Study of the Defect Structure due to Ordering in the Alloy Ni4Mo", Mat. Res. Bull., 2: 1 045-1 054 ( 1967).
48. S. Cao, C. R. Brooks and L. Allard, "An in situ Transmission Electron Microscopy Study of Ordering in a Splat Cooled Ni 20 at.% Mo Alloy", Microstructure Characterization, 34:87-95 (1995).
270

49. E. V. Kozlov and V. M. Kushnarenko, "Crystallographic X-ray Analysis of the Order-Disorder Phase Transition in the Alloy NiMo", Phys. Met. Metall ., 46:80-85 ( 1978).
50. K. Vasudevan, H.P. Kao, C.R. Brooks and E.E. Stansbury, "Domain Coarsening by Grain Boundary Migration in Ordered Ni�o," Ed., G.W. Bailey, Proceedings of the 44th Annual Meeting of the Electron Microscopy Society of America, San Francisco Press, Inc. ( 1986).
5 1 . M . Sundararaman, S . Banerjee and H. Wollenberger, "Order-Disorder Transformations in Ni4Mo under Self lon Irradiation," Acta Metall. Mater. , 43 : 1 07- 1 19 ( 1995).
52. K. Vasudevan, H.P. Kao and C.R. Brooks, "Kinetics of Domain Growth in Ordered Ni4Mo," Metallurgical Transactions A, 19:941 -952 ( 1988).
53 . R. D. Ridder, G.V. Tendeloo and S . Amelincloc, "A Cluster Model for the Transition from the Short-Range Order to the Long Range Order State in F .c. c. Based Binary Systems and its Study by Means of Electron Diffraction," Acta Crystallographica, A32:216-224 (1976).
54. K. Vasudevan, E. E. Stansbury and C. R. Brooks, "Domain Coarsening at Grain Boundaries in Ordered Ni4Mo," Acta Metall . Mater., 40:2 1 13-2122 ( 1992).
55 . G. V. Tendeloo and S. Amelinckx, "Lattice Relaxation at Glide Antiphase Boundaries and Stacking Faults in Ni3Mo and Ni4Mo," phys. stat. sol . (a) 27:93-98 ( 1975).
56. H. M. Tawancy, "Formation on the D022-Type Superlattice during Long-Range Ordering to Ni4Mo in a Ni-Mo Alloy," Scripta Metallurgica, 1 8:343-346 (1984).
57. P. R. Okamoto and G. Thomas, "On Short Range Order and Micro-Domains in the Ni4Mo System," Acta Metallurgica, 19:825-841 (197 1 ).
58 . N. Sridhar, "Behavior of Nickel-base Alloy in Corrosion Enviroments", Metals Handbooks 9th Edition, Vol . 13, Corrosion, pp. 643-647 (1989).
59 . Hastelloy Alloy B-2, Haynes, Corrosion-resistant Alloy, Haynes, International Inc. ( 1987).
60. "ASTM A262 Practice A," Annual Book of ASTM Standards, Vol. 03. 02, ASTM, Philadelphia, PA (1994).
271

6 1 . "ASTM C5-87,,. Annual Book of ASTM Standards, Vol. 03 .02, ASTM,
Philadelphia, PA ( 1994).
62. "ASTM G-30,,. Annual Book of ASTM Standards, Vol. 03 .02, ASTM,
Philadelphia, PA ( 1994).
6.3 . Metals Handbook Ninth Edition, Vol . 1 3, Corrosion, ASM International, Metals Park, OH (1987).
64. W. B. Snyder and C. R. Brooks, pp.275, Editors by B.H. Kear, C.T. Sims, N.S . Stoloff, and J.H. Westbrook, Ordered Alloys, Baton Rouge, LA, Claitor's Publishing Division (1970).
65. P. Villars, A. Prince, and H. Okamoto, Handbook of Ternary Alloy Phase Diagrams, 4 :4046-4066, ASM International, Materials Park, OH ( 1995).
66. D. S. Miracle, K. A. Lark, V. Srinivasan, and H. A. Lipsitt, "Nickle-AluminumMolybdenum Phase Equilibria,
,. Metallurgical Transactions A, 1 5A:481-486 ( 1984).
67 K. V asudevan, "The Effect of 0-4 wt.% Chromium on Transformations of a Phase Ni-Mo-Cr Alloys with Nickle-Molybdenum Atom Ratio Equal to 4: 1 ,
,. M.S.
Thesis, University of Tennessee ( 1982).
68. K. A. Williams, D. S. Miracle and H. A. Lipsitt, "Partitioning and Precipitation of TCP Phase in Rapidly Solidified Alloys, Rapid Solidification Processing Principles and Technologies, II,
,. Ed. by R. Mehrabian, B.H. Kear and M. Cohen, Reston, Claitor's Publishing Division, Virginia ( 1980).
69. D. A. Porter and K. E. Easterling, "Phase Transformations in Metals and Alloys," Chapman and Hall, New York (1991).
70. M. Yamamoto, S. Nenno, M. Futamoto, and S. Nakamura, "Field-Ion Microscope Study of Early Stages of Ordering in Ni4Mo Alloy," Japanese Journal of Applied Physics, 1 1 :437-444 (1972).
7 1 . R. De Ridder, G. Van Tendeloo, and S. Amelinckx, "A Cluster Model for the Transition fron the Short-Range Order to the long-Range order state in F.c.c. Based Binary Systems and its Study by Means of Electron Diffraction," Acta Crystallographica, A32:216-224 ( 1976).
72. S. Banerjee, K. Urban and M. Wilkens, proc. Int. conf. Solid-Solid Phase Treansfonnations, A.I.M.E. Warrendale, pp. 3 1 1 , Pittsburgh, PA (1982).
272

73 . B. Chakravarti, E. A. Starke, C. J. Sparks, and R. 0. Williams, "Short Range Order and the Development of Long Range Order in Ni4Mo,, J. Phys. Chern. Solids, 35 : 13 1 7-1326 ( 1974).
74. P. L. Martin and J. C. Wiliams, "Long Range Order in NhMo Based Ternary Alloys-I. Isothermal Aging respones," Acta Metall , 32: 1681- 1693 {1984).
15. P. L. Martin and J. C. Wiliams, "Long Range Order in Ni3Mo Based Ternary Alloys-II. Coherent Phase Solvii," Acta Metall, 32: 1695-1702 ( 1984).
76. E. Ruedl, P. Delavignette, and S. Amelinckx, "Electron Diffraction and Electron Microscopic Study of Long- and Short-Range Order in Ni�o and of the Substructure Resulting from Ordering," phys. stat. sol . , 28:305-328 (I 968).
77. P. R. Okamoto and G. Thomas, "On Short Range Order and Micro-Domains in the Ni4Mo System," Acta Metallurgica, 19:825-84 1 ( 1971) .
78. M. Sundararaman, S. Banerjee and H. Wollenberger, "Order-Disorder Transformations in Ni4Mo underSelflon Irradiation," Acta Metall . Mater., 43 : 107- 1 19 (1995).
79. J. P. Chevalier and W.M. Stobbs, "Short-Range Order and the Disorder-Order Transformation in Stoichiometric Ni4Mo," Scripta Metallurgica, 22: 1 197-1217 ( 1979).
80. S. Branerjee, K. Urban, and M. Wilkens, "Order-Disorder Transformation in N�o under Electron Irradiation in A High-Voltage Electron Microscope," Acta Metall., 32:299-3 1 1 ( 1984).
8 1 . G. Thomas and M . J. Goringe, Transmission Electron Microscopy of Materials, John Wiley Sons, Inc., New York (1979).
82. G. Van Tendeloo, R. De Ridder, and S. Amelinckx, "The D022 Intermediate Phase in the Ni-Mo System," phys. stat. sol. (a), 27:457-468 (1 975).
83. G. Van Tendeloo, "Short Range Order Considerations and Development of Long Range Order in Different Ni-Mo Alloys," Materials Science and Engineeing, 26:209-220 (1976).
84. G. Van Tendeloo, J. Van Landuyt, P. Delavignette, and S. Amelinckx, "Compositional Change Associated with Periodic Antiphase Boundaries in the Intial Stages of Ordering in NiJMo," phys. stat. sol . (a), 25:697-707 (1974).
273

85. M. Fahrmann, P. Fratzl, 0. Paris, E. Fahrmann and W. C. Johnson, "Influence of Coherency Stress on Microstructural Evolution in Model Ni-Al-Mo Alloys," Acta Metall . Mater., 43 : 1007-1022 ( 1995).
86. K. A. Williams, D. B. Miracle and H. A. Lipsitt, "Partitioning and Precipitation of TCP Phases in Rapidly Solidfied Alloys," pp. 1 29-134, Rapid Solidification Processing Principles and Technologies, IT, Ed. by, R.Mehrabian, B.H. Kear, and M.Cohen, Baton Rouge, Claitor's Publishing Division ( 1980).
87. E. H. Aigeltinger, S. R. Bates, R. W. Gould, J. J. Hren and F. N. Rhines, "Phase Equilibria in Rapidly Solidified Nickel Rich Ni-Mo-Al Alloy," pp. 291-305, Rapid Solidification Processing Principles and Technologies, Ed. by, R. Mehrabian, B. H. Kear, and M. Cohen, Baton Rouge, Claitor's Publishing Division (1977).
88. K. Vasudevan, "Transmission Electron Microscopy Study of Phase Transformations in Ternary Ni4Mo-based Alloys Containing 0 to 4 Weight Percent Chromium," Ph.D Dissertation, The University of Tennessee ( 1986).
89. M. Yananoto, s .Nenno, T. Saburi, and Y. Mizutani, Trans. Japanese Inst. of Metals, 1 1 : 120-1 26 ( 1970).
90. A. G. Khachaturyan, "The Problem of Symmetry in Statistical Thermodynamics of Substitutional and Interstitial Ordered solid Solutions," phys. stat. sol . , (b), 6:9-37 ( 1973).
9 1 . N.S.Mishra and S . Ranganathan "Electron Microscopy and Diffraction of Ordering in a Ni-25 wt.% Mo Alloy," Materials Science and Engineering, A1 50:75-85 ( 1992).
92. J. E. Hatch, Aluminum Properties and Physical Metallurgy, American Society for Metals, Metals Park, Ohio, 1984.
93 . Dennya A. Jones, Principles and Prevention of Corrosion, New York, Macmillan Publishing Company, 1992.
94. R. A. Buchanan and J. G. Kim, "Chloride-Induced Localized Corrosion ofFe3AlType Iron Aluminides: Beneficial Effects of Cr and Mo Additions," High Temperature Ordered lntermetallic Alloys IV, Editors: L.A. Johnson, D.P. Pope, and J.O. Stiegler, Materials Research Society, Pittsburgh, Pennsylvania 1 99 1 .
274

VITA
Ye-Lin Shen was born on May 27. 1 960, in Taiyuan city, Shanxi province, China.
In June, 1978, she graduated from Jin Shan High School as the Salutatorian of her class.
In the July 1 978, she began her undergraduate study at Taiyuan University of
Technology with a major of Physical Metallurgy and Metallography at the Secondary
Mechanical Engineering (now Materials Science and Engineering) Department. She
received her Bachelor of Physical Metallurgy and Metallography in June 1982. In August
1982, she joined the R&D team at Shanxi Central Power Lab where she worked for more
than 5 years in the Metallogrphy Group. She was leader of young activity in Shanxi
Central Power Lab. In August 1994, she entered the master's program in Metallurgical
Engineering at the University of Tennessee, Knoxville. Her Master of Science degree was
received in August 1996. She is a member of ASM and TMS.
275


![The Solidification Behavior of AA2618 Aluminum Alloy and ......The fine dispersoid particles play a positive ... microstructural stability of the alloy under thermal exposure [1,2].](https://static.fdocuments.in/doc/165x107/6113b95879f16e7497432ae4/the-solidification-behavior-of-aa2618-aluminum-alloy-and-the-fine-dispersoid.jpg)