Microsoft Word - FINAL ISSUE VOL 2 NUM 4 SPRING 2010.pdf
263
The International Journal of Organizational Innovation Vol 2 Num 4 Spring 2010 1 THE INTERNATIONAL JOURNAL OF ORGANIZATIONAL INNOVATION VOLUME 2 NUMBER 4 SPRING 2010 TABLE OF CONTENTS PAGE: 2010 BOARD OF EDITORS 3 ARTICLES: GOVERNMENT ADMINISTRATION EFFICIENCY AND ECONOMIC 5 EFFICIENCY FOR 23 DISTRICTS IN TAIWAN Yu-Chuan Chen, Yung-Ho Chiu, Chin-Wei Huang, THE APPLICATION OF FUZZY LINGUISTIC SCALE ON INTERNET 35 QUESTIONNAIRE SURVEY Kuo-Ming Chu LINKAGE COMMUNITY BASED INNOVATION AND SPEED TO 49 MARKET: THE MEDIATING ROLE OF NEW PRODUCT DEVELOPMENT PROCESS Hui-Chun Chan QUALITY COST IMPROVEMENT MODELS CONSIDERING 61 FUZZY GOALS Ming-Chu Weng, Jui-Min Hsiao, Liang-Hsuan Chen INNOVATION CAPABILITY AND PERFORMANCE IN TAIWANESE 80 SCIENCE PARKS: EXPLORING THE MODERATING EFFECTS OF INDUSTRIAL CLUSTERS FABRIC Ming-Tien Tsai, Chung-Lin Tsai THE INFLUENCES OF THE FINANCIAL CRISIS ON THE 104 CONSUMPTION OF HAIRDRESSING IN TAIWAN Chien- Hua Wang
Transcript of Microsoft Word - FINAL ISSUE VOL 2 NUM 4 SPRING 2010.pdf

The International Journal of Organizational Innovation Vol 2 Num 4 Spring 2010
1
THE INTERNATIONAL JOURNAL OF
ORGANIZATIONAL INNOVATION
VOLUME 2 NUMBER 4 SPRING 2010
TABLE OF CONTENTS PAGE: 2010 BOARD OF EDITORS 3 ARTICLES: GOVERNMENT ADMINISTRATION EFFICIENCY AND ECONOMIC 5 EFFICIENCY FOR 23 DISTRICTS IN TAIWAN Yu-Chuan Chen, Yung-Ho Chiu, Chin-Wei Huang, THE APPLICATION OF FUZZY LINGUISTIC SCALE ON INTERNET 35 QUESTIONNAIRE SURVEY Kuo-Ming Chu LINKAGE COMMUNITY BASED INNOVATION AND SPEED TO 49 MARKET: THE MEDIATING ROLE OF NEW PRODUCT DEVELOPMENT PROCESS Hui-Chun Chan QUALITY COST IMPROVEMENT MODELS CONSIDERING 61 FUZZY GOALS Ming-Chu Weng, Jui-Min Hsiao, Liang-Hsuan Chen INNOVATION CAPABILITY AND PERFORMANCE IN TAIWANESE 80 SCIENCE PARKS: EXPLORING THE MODERATING EFFECTS OF INDUSTRIAL CLUSTERS FABRIC Ming-Tien Tsai, Chung-Lin Tsai THE INFLUENCES OF THE FINANCIAL CRISIS ON THE 104 CONSUMPTION OF HAIRDRESSING IN TAIWAN Chien- Hua Wang

The International Journal of Organizational Innovation Vol 2 Num 4 Spring 2010
2
BOARD COMPOSITION AND CORPORATE VALUE IN TAIWAN 126 HIGH-TECHNOLOGY FIRMS Derek TeShun Huang, Zhien Chia Liu RESEARCH AND DEVELOPMENT ON THE APPLICATION OF TRIZ 139 INNOVATIVE PRINCIPLES TO BALANCED SAILBOAT PATENT Mean-Shen Liu, Sheu-Der Wu, Wen-Che Hong A STUDY ON TAIWANESE ADULTS’COGNITION OF THE COLOR 160 COMBINATIONS OF HEALING TOYS An Sheng Lee, Jyun-Wei Wang MODERATION OF GENDER ON THE RELATIONSHIP BETWEEN 195 TASK CHARACTERISTICS AND PERFORMANCE Setyabudi Indartono, Chun-Hsi Vivian Chen AN EMPIRICAL STUDY ON THE IMPACT OF DIFFERENCES IN BED 223 AND BREAKFAST SERVICE QUALITY ATTRIBUTES ON CUSTOMERS’ REVISITING DESIRES Wu-Chung Wu, Chih-Yun Yang USING DATA MINING TO SOLVE FLOW SHOP 241 SCHEDULING PROBLEMS Chinyao Low, Shiang-Huei Kung, Chikong Huang ------------------------------------------------------------------------------------------------------------------ The International Journal of Organizational Innovation (ISSN 1943-1813) is a blind peer- reviewed journal published online quarterly by The International Association of Organizational Innovation (IAOI). To Contact the Editor, email: [email protected] For information regarding submissions to the journal, go to: http://ijoi.fp.expressacademic.org/ For more information on the Association, go to: http://www.iaoiusa.org The next Annual Conference of IAOI will be held in Bangkok, Thailand August 4 - 6, 2010. For more information regarding the conference, go to: http://www.iaoiusa.org/2010icoi/ ------------------------------------------------------------------------------------------------------------------

The International Journal of Organizational Innovation Vol 2 Num 4 Spring 2010
3
BOARD OF EDITORS 2010
Editor: Dr. Frederick L. Dembowski
President, IJOI [email protected]
Assistant Editors:
Dr. Julia Ballenger Stephen F. Austin State University
Dr. Hassan Basri,
National University of Malaysia
Dr. Hui Chun Chan Fortune Institute of Technology
Dr. Jen-Shiang Chen Far East University
Dr. Wen-Hwa Cheng
National Formosa University
Dr. Catherine C. Chiang Elon University, USA
Dr. Joseph Chou,
Fortune Institute of Technology
Dr. Barbara Cimatti University of Bologna, Italy
Dr. Jun Dang Xi'an International
Studies University
Associate Editor: Dr. Charles Shieh,
Chang Jung Christian University [email protected]
Dr. Pawan K. Dhiman Sant Longowal Institute of Engineering & Technology
Dr Andries J. du Plessis Unitec New Zealand
Dr. Dennis L. Foley
University of Newcastle
Dr. Fawei Geng Oxford University
Dr. Rayma L. Harchar
University of Louisiana at Lafayette
Dr. John W. Hunt Southern Illinois University
Edwardsville
Dr. Zach Kelehear, University of South Carolina
Dr. Thomas A. Kersten Roosevelt University
The International Journal of Organizational Innovation Vol 2 Num 4 Spring 2010
4
Assistant Editors, Continued:
Dr. Marcia L. Lamkin University of North Florida
Dr. Kenneth Lane
Southeastern Louisiana University
Dr. Michael Lane University of Illinois Springfield
Dr. Ying-Jye Lee
National Kaohsiung University of Applied Sciences
Dr. Ronald Leon
Cal Poly Pomona University
Dr. Ralph L. Marshall Eastern Illinois University
Dr. Al Maritz
Australian Graduate School of Entrepreneurship
Dr. Donna S. McCaw
Western Illinois University
Dr Earl F. Newby Virginia State University
Dr. Jeffrey Oescher Southeastern Louisiana University
Siti N. Othman
Universiti Utara Malaysia
Dr. Pattanapong Ariyasit Sripatum University
Dr Alan E. Simon
Concordia University Chicago
Dr. Sandra Stewart Stephen F. Austin State University
Dr. Janet Tareilo
Stephen F. Austin State University
Dr. Fuhui Tong Texas A&M University
Dr. Rajinder K. Uppal
Panjab University, Chandigarh
Dr. Tom Valesky, Florida Gulf Coast University
Dr. Jack Wang
Chang Jung Christian University
Dr. Jun Xu Southern Cross University
Dr. Shang-Pao Yeh I-Shou University
Dr. Nor'Aini Yusof
Universiti Sains Malaysia
Dr. Jian Zhang Dr. J. Consulting

The International Journal of Organizational Innovation Vol 2 Num 4 Spring 2010 5
Government Administration Efficiency and Economic Efficiency
For 23 Districts in Taiwan
Yu-Chuan Chen, Department of Finance,
Chihlee Institute of Technology. Taiwan [email protected].
Yung-Ho Chiu,
Business School, Soochow University. Taiwan echiu@ scu.edu.tw.
Chin-Wei Huang,
Soochow University, Taiwan [email protected].
Abstract
In this study, the Seiford and Zhu (2002) undesirable modeling is used to measure the
government and economic efficiencies of 23 counties or cities in Taiwan. We also carry on a
correlation analysis upon the government and economic efficiencies. The data sources for this
study consist of 23 counties or cities for the period from 2002 to 2005 as released by the Ministry
of Economic Affairs of the R.O.C.
Our empirical results from the DEA (Data Envelopment Analysis)approach are
summarized as follows: (1) The two most thriving region for economic activities are Taipei City
and Taipei County, while areas for low economic activities include Penghu County, Taitung
County, Chiayi County, and Tainan County. (2) Economic efficiency and government efficiency
have no apparent difference. Economic efficiency and government efficiency show gradual
annual declines. (3) Compared with various areas, Taipei City, Taichung City, Tainan City,
Chiayi City, Taitung County, Hualian County, and Penghu County always rank #1 in both
economic efficiency and government efficiency. (4) No matter for economic efficiency or

The International Journal of Organizational Innovation Vol 2 Num 4 Spring 2010 6
government efficiency, Taipei County, Taoyuan County, Hsinchu County, Changhua County,
Nantou County, Yunlin County, Kaohsiung County, Pintung County, and Kaohsiung County
rank at the worst level. (5) There is a positive relationship between economic efficiency and
government efficiency. This result is consistent with Chen and Lee (2005).
Key Words: Data Envelopment Analysis, BCC, Undesirable Modeling, Government
and Economic Efficiency
Introduction
The market mechanism of pure capitalism can produce the most desired commodities
through the most efficient techniques. As a result, the capitalist system relies on the market
mechanism to allocate resources within economies. However, if the market mechanism fails to
allocate resources efficiently (called market failure), then the government must take part in the
economic system operation to adjust the market failure, by providing policy formulation and
guidance for the economic system’s development. In other words, the household (that buys the
commodities) and firm (that produces the commodities) sectors make up the economic activity
foundation for the most efficient allocation of resources. The government must also provide legal
and social frameworks and maintain competition and the reallocation of resources. Therefore,
households, businesses, and the government have mutual effects in the economic system.
Theoretically, the better the administrative efficiency is that is provided by a government

The International Journal of Organizational Innovation Vol 2 Num 4 Spring 2010 7
department, the higher the efficiency is of an economic system that is created. With the
development of international and global financial markets, the current economic environment
faces severe challenges. A government plays a major role to influence its own economy’s
development under this environment. According to the 2007-2008 Global Competitiveness
Report, there are 12 pillars of competitiveness: Institutions, Macro-economy, Infrastructure,
Health and Primary Education, High Education and Training, Goods Market Efficiency, Labor
Market Efficiency, Financial Market Sophistication, Technological Readiness, Market Size,
Business Sophistication, and Innovation. In the first pillar, Institutions compose the framework
among households, firms, and governments that interact to create wealth in the economic system
and play an important role to achieve sustained economic growth and long-term prosperity. From
the annual Global Competitiveness Reports, except for Education, Financial market,
Technological, and Innovation, we know that economic efficiency and government efficiency
also are important ingredients in the Global Competitiveness index.
Taiwan’s 23 counties and cities in general currently have financial problems. In order to
solve these problems, the 23 counties and cities have adopted the enterprise managing concept to
promote government efficiency in order to improve their local business environment and
inhabitants’ life quality. Furthermore, they hope to attract firms to invest in local businesses so as

The International Journal of Organizational Innovation Vol 2 Num 4 Spring 2010 8
to promote local competition. Thus, the issues of government and economic efficiencies have
become more and more important.
The previous literature focuses mainly upon two major streams of research: (1) regional
economic efficiency and (2) government administration efficiency. Studies on regional economic
efficiency includes Charnes et al. (1989), Färe et al. (1994), Maudos et al.(2000), Martic and
Savic (2001), Afonso and Aubyn (2005), Timmer and Los (2005), Ma and Goo (2005), and
Mastromarco and Woitek (2006). Initially, the government is adopted as the input variable and
then is used to explain the efficiency scores. Instead of economic activity indicators, those who
take government expenditure as an input and infrastructure and the quality of life as outputs to
measure government administration efficiency are Hughes and Edwards (2000), Worthington
and Dollery (2002), Sun (2002), and Afonso and Fernandes (2006). From the above reviews we
see that most studies on government and economic efficiencies are discussed separately, but they
should be discussed together.
We also use the Seiford and Zhu (2002) DEA (Data Envelopment Analysis) undesirable
model to measure the government and economic efficiencies in order to improve performance.
Both desirable (good) and undesirable (bad) outputs and inputs may exist in a traditional DEA.
In the private sector, the production process may generate undesirable outputs like pollution or
waste under the estimation of economic efficiency, while the government sector may create

The International Journal of Organizational Innovation Vol 2 Num 4 Spring 2010 9
undesirable outputs like crime for the estimation of government efficiency. If we do not consider
the undesirable (bad) outputs, then it does not reflect the true government and economic
efficiency
In this paper we first resort to the DEA model on discussing government and economic
efficiencies together for the 23 districts in Taiwan and carry on a correlation analysis between
the two efficiencies. Second, we use the Seiford and Zhu (2002) DEA undesirable model to
measure the government and economic efficiencies in order to avoid over-evaluation and under-
evaluation without consider the undesirable (bad) outputs. The structure of this paper is listed as
follows: Introduction, Literature Review, Methodology and Data Resources, Empirical Results
and Conclusion.
Literature Review
The efficiency performance of the economic unit is always paid attention to by economic
and management domain. Many scholars focus on the manufacturing sector and evaluate
efficiency with firm-level data. Two typical approaches are exploited. The first approach is using
a statistical method to estimate efficiency as developed by Battese and Coelli (1992; 1995). The
other approach is using the linear programming approach to measure a firm’s efficiency within
the industry. Many scholars have recently extended the categories of studying in efficiency

The International Journal of Organizational Innovation Vol 2 Num 4 Spring 2010 10
between regions or countries. They take regions or countries into the decision making units
(DMU) and measure their efficiency.
Charnes et al. (1989) used DEA to evaluate the economic efficiency of 28 cities in China in
1983-1984. The indictors of input are the number of employees, wage, and fixed asset
investment, and the indictors of output are the gross output value of industry, profit, tax, and
retail sales. The results show that DEA could be used to identify technical inefficiencies and
related waste for each city’s economic activities in China.
Färe et al. (1994) took gross domestic product (GDP) as an output index, as well as capital
and employment as input indices, to analyze the efficiency of 17 countries in the OECD in 1978-
1988. The results present that U.S. productivity growth is slightly higher than the average of 17
OECD countries, which is due to technical change. The highest productivity growth index is
Japan.
Maudos et al. (2000) measured the efficiency of 17 autonomous regions in Spain over 30
years. The indictors of input are labor and capital, and the indictor of output is gross value added.
The results show that the rich countries have experienced the greatest growth in TFP
(particularly through greater technical progress), and technical change has worked against labor
productivity convergence, since it has always been greater in countries with higher labor
productivity.

The International Journal of Organizational Innovation Vol 2 Num 4 Spring 2010 11
Timmer and Los (2005) evaluated the economic efficiency of 40 countries around the
world. They took labor GDP production per unit as the input variable and labor capital per unit
as the output variable in 1975-1992. The results show that the change in the global production
frontier is localized at high levels of capital intensity and that the effect is stronger in agriculture
than in manufacturing.
Ma and Goo (2005) used capital and labor as input variables and revenue and profit as
output variables to assess the relative efficiency and total factor productivity (TFP) between the
53 High- and New-Technology Industry Development Zones (HNTIDZs) in China. The results
show that Xiamen, Chengdu, Huizhou, Wuxi, Shenzhen, Beijing, Shanghai, and Yangling
achieved technical efficiency. In comparison, the others were relatively inefficient and should
adjust according to input excesses and output deficits.
Under the category of macroeconomics, the government plays an important role in
economic growth and promotion of welfare. From the amount of regional economic efficiency
studies, how a government acts is also considered an important variable in efficiency
measurement.
Mastromarco and Woitek (2006) adopted the stochastic frontier approach (SFA) to estimate
the technical efficiency of 20 regions in Italia during 1970-1994. Except for labor and private
capital stock, infrastructure is also taken as an input component. The result shows that the higher

The International Journal of Organizational Innovation Vol 2 Num 4 Spring 2010 12
the percentage is of public capital stock divided by total capital stock, the more helpful it will be
to upgrade technical efficiency. Furthermore, some scholars take the quality indices of residents’
life and the scale of infrastructure instead of production and profit as the input variables when
they are estimating regional economic efficiency.
Martic and Savic (2001) estimated the efficiency of 30 regions in Serbia in 1979-1980 by
the CCR model. The four inputs include land, fixed assets, energy, and the quantity of
population, and the output takes up the quality indices of life, including the total number of
physicians, the total number of pupils in primary school, and the employed ratio. The results
show that 17 out of 30 regions are efficient, in which 5 regions are from Vojvodina and 12
regions are from central Serbia, while all regions from Kosovo and Metohia are inefficient.
Afonso and Aubyn (2005) compared the efficiency of education and medical treatment in
24 countries of the OECD by DEA application and free disposable hull (FDH) application. The
indicators of input are the numbers of teachers, doctors, nurses, and sickbeds. The indicators of
output are measured by the students’ performances of PISA, the average age, and the infant
survival rate. The results show that efficient outcomes across sectors and analytic methods seem
to cluster around a small number of core countries, (Japan, South Korea, and Sweden) even if for
different reasons. Instead of economic activities indicators, it takes government expenditure as an

The International Journal of Organizational Innovation Vol 2 Num 4 Spring 2010 13
input and infrastructure and the quality of life as outputs to measure government administration
efficiency in each locality.
Hughes and Edwards (2000) used the CCR and BCC models of DEA to evaluate the
efficiency of 73 Minnesota counties. The outputs are the total property value of the counties, and
the government expenditures of education, social services, transportation, public safety,
environmental protection, and administration. They considered the poverty rate, crime rate,
employment opportunities, water, and land area as input variables. The result indicates that the
dominant source of public sector inefficiency is an inappropriate scale of operations. It implies
that some counties’ jurisdictions are too large to serve the population efficiently, and that the size
and concentration of public power are also responsible in part for observed inefficiencies.
Worthington and Dollery (2002) employed the contextual and non-discretionary inputs
DEA to measure the relative efficiency of the 173 NEW local governments. The results show
that the number of councils assessed as perfectly efficiency.
Sun (2002) employed the output-oriented BCC model to measure the relative efficiency of
the 14 police administrators in Taipei city. The indicators of input include the expenditure of
police administrators, the numbers of police officers employed, the number of civilians
employed, and the equipment assets used by the police. The indicators of output include the
cases of violence, burglary, and crime as well as the ability to deal with traffic control and

The International Journal of Organizational Innovation Vol 2 Num 4 Spring 2010 14
emergency. The results show that differences in operating environment, such as resident
population and location factors, do not have a significant influence upon the efficiency of police
precincts.
Afonso and Fernandes (2006) discussed local government efficiency from the view of
administration servers, education, social activity, and environment protection. They used the
DEA-BCC model to measure the expenditure efficiency of 51 local governments of Portugal in
2001. The input uses the total expenditures of the local governments. The indictors of output
include the number of residents and schools, social services for elders, the amount of clean water
supplied, the cleaning and carrying of litter, and the amount of recycling. The results show that
the 51 municipalities could have achieved, on average, roughly the same level of local output
with about 41% fewer resources - i.e. local performance could be improved without necessarily
increasing municipal spending.
Through a look at the previous studies, we know that the scope of research in efficiency
extends from the analysis between firms or enterprises to countries or areas. The categories of
efficiency are economic efficiency and government efficiency. However, the relationship
between economic efficiency and government efficiency is still seldom discussed in past years
and now we turn to focus on this point of view.
Methodology and Data Resources

The International Journal of Organizational Innovation Vol 2 Num 4 Spring 2010 15
Methodology
Ever since Farrell (1957) proposed the concept of the frontier function to measure efficiency,
many scholars have used linear programming or the frontier function method to estimate
efficiency and productivity. Charnes et al. (1978) extended Farrell’s model to multiple inputs-
outputs pattern and employed mathematical programming to develop an efficient frontier and to
estimate the efficiency score. This approach is named “Data Envelopment Analysis (DEA)”. The
Charnes, Cooper, and Rhodes (CCR) efficiency concept is subject to the strong hypothesis of
constant returns to scale. Banker, Charnes, and Cooper (BCC) proposed a variable returns to
scale model. The BCC model can determine the returns to scale for each DMU. The BCC models
can be formulated as:
njz
z
ysyz
xsxzts
j
n
j
j
n
j
jj
n
j
jj
,,1,0
,1
,
..
:max
1
1
0
1
0
L=≥
=
=−
=+
∑
∑
∑
=
=
+
=
−
θ
θ
Here, θ is the score of the DMU, jy is the j-th output, jx is the j-th input, jz is the weight of the
j-th DMU, and s− and s
+ are the input slacks and the output slacks, respectively.

The International Journal of Organizational Innovation Vol 2 Num 4 Spring 2010 16
In the methodology we know that the traditional DEA (CCR or BCC) model relies on the
assumption that inputs have to be minimized and outputs have to be maximized. However, many
production processes may produce undesirable outputs, such as the number of defective
products, waste, and pollution. In other words, there exist desirable ( g
jy ) and undesirable ( b
jy )
outputs. Obviously, desirable outputs should be increased and undesirable outputs should be
decreased in order to improve efficiency. However, the undesirable outputs should be increased
rather than decreased in the traditional DEA assumption, but they do not conform to the
isotonicity characteristic results in the inaccurate efficiency estimates. Charnes et al. (1985)
treated the undesirable outputs as inputs so that the bad outputs can be reduced. Seiford and Zhu
(2002) believed that treating the undesirable outputs as inputs does not reflect the true production
process. Hence, Seiford and Zhu (2002) proposed an approach to treat undesirable input/outputs
in the VRS envelopment. This approach follows the “classification invariance’ concept in Ali
and Seiford (1990) to deal with the problem of undesirable outputs. Following the Seiford and
Zhu (2002) undesirable model, the matrix can be presented as follows:
−
=
−X
Y
Y
X
Yb
g
.
The terms gY and bY represent the corresponding desirable and undesirable outputs and X
represents the input. It is clear that we desire to increase the desirable outputs ( gY ) and to

The International Journal of Organizational Innovation Vol 2 Num 4 Spring 2010 17
decrease the undesirable outputs ( bY ) to improve efficiency. Thus, we multiply each undesirable
output by (-1) and then find a proper value w to convert negative data to positive
( 0>+−= wyyb
j
b
j ) data and maintain the invariant to the data. Employing the previous
notations, the model is:
njz
z
xxz
yyz
yyzts
j
n
j
j
n
j
jj
n
j
bb
jj
n
j
gg
jj
,,1,0
1
..
:max
1
1
0
1
0
1
0
L=≥
=
≤
≥
≥
∑
∑
∑
∑
=
=
=
=
θ
θ
θ
Here, θ is the score of the DMU, g
jy and b
jy correspondingly represent the j-th desirable and
undesirable outputs, jx is the j-th input, and jz is the weight of the j-th DMU.
Data Collection and the Chosen Outputs and Inputs
Data Collection
Taiwan is divided into 23 different districts and mainly into four regions named Northern,
Central, Southern, and Eastern. The Northern region has Taipei City, Keelung City, Hsinchu
City, Taipei County, Taoyuan County, Hsinchu County, and Ilan County, the Central region has
the 6 districts of Miaoli County, Taichung County, Chunghwa County, Nantou County, and

The International Journal of Organizational Innovation Vol 2 Num 4 Spring 2010 18
Yunlin County, the Southern region includes the 8 districts of Kaohsiung City, Tainan City,
Chiayi City, Chiayi County, Tainan County, Kaohsiung County, Pintung county, and Penghu
County, while the Eastern region includes the 2 counties of Hualien and Taitung. The data
sources for this study consist of 23 counties or cities for the period from 2002 to 2005 as released
by the Ministry of Economic Affairs of the R.O.C. The pertinent definitions of the variables, as
well as the original data and explanations of the data, are described in Table 1.
The Chosen Outputs and Inputs
A. Economic Efficiency
The major indicators used to measure Economic Efficiency include GDP (Fare et al 1995;
Martic and Savic, 2001; Timmer and Los, 2005), Industry output (Charnes et al, 1989), and its
side benefits (Maudos et al, 2000; Percoco, 2004). This research uses the sales income of each
registered company at the Ministry of Finance in each division as output variables (EY1). Due to
global warming and the rise of environmental protection, environmental pollution needs to be
considered when measuring the output of economic efficiency. Arcelus and Arocena (2005) used
the control of carbon dioxide amount as an output item, while Fare et al. (2004) took carbon
dioxide and three other green gases as undesirable output. The major indicators that Taiwan’s
region uses for air pollution include dust volume, sulfur dioxide, ozone, and thickness of RSP.
Sulfur dioxide and ozone are mainly produced during industry production by petroleum used in

The International Journal of Organizational Innovation Vol 2 Num 4 Spring 2010 19
power products, factory pots, and flare gas for auto and motor transportation. The more
economic development grows, the higher the pollution increases. This research uses the
thickness of sulfur dioxide and ozone detected in districts by the Environmental Protection
Administration by as pollution output (EY2) index and takes it as the undesirable output in scale.
Among the inputs of economic efficiency, assets and labor are the main indicators of
economic activities (Maudos et al, 2000; Martic and Savic, 2001; Percoco, 2004). This research
will implement the assets of the companies registered at the Ministry of Economic Affairs as the
asset input (EXI), while the labor input (EX2) is made up of statistics on 15 years old and above
income labor and the number of people and non-income indoor labor who work 15 hours or more
in every district gathered by the Directorate-General of Budget, Accounting, Statistics, Executive
Yuan. In addition, the dimension of the land might affect the road scale, population density, and
number of buildings, and they are identified as input variables in most research studies (Hughes
and Edwards, 2000; Martic and Savic, 2001; Ma and Goo, 2005). According to the land
dimension announced by the Ministry of Administration, the land dimension has adopted the
Urban Development Plan Region as its main land input variables (EX3), by considering the
incapability of commercial activity in mountains, rivers, and valleys.
B. Government Efficiency

The International Journal of Organizational Innovation Vol 2 Num 4 Spring 2010 20
On the evaluation on government efficiency, the research of Sun (2002), Hughes and
Edwards (2002), and Afonso and Fernandes (2006) took government expenses as the
government efficiency input indicator. This article herein is based on annual income sources
(which include incoming financial sources, federal subsidy, and loans) that are announced by the
Ministry of Statistics as the Government Efficiency index (GX1).
Public construction (Percoco, 2004; Afonso and Fernsndes, 2006) and citizens’ living
environment are the main output performances for government. The criteria to evaluate living
environment quality includes security (Sun, 2002), education, medication (Afonso and Aubyn,
2005), social welfare (Afonso and Fernandes, 2006), and so on. Not only does this index indicate
the regional habitation living quality, it also reflects the quality of its commercial environment.
This research uses the percentage of social welfare staff among total population in each district
to observe the government’s performance in practicing social works among total population
(GY1), 15 years old and above who receive a higher education rate (GY2) as education
performance, and the population of medical practicing staff to evaluate the resources of medical
support index.
To increase the convenience of civil activities, the urban plan usually sets up space for
public commendation, which is divided and based upon population, use of land, traffic
conditions, and potential future development to ensure a good urban life condition. Therefore,

The International Journal of Organizational Innovation Vol 2 Num 4 Spring 2010 21
using public commendation land dimension for over 10,000 people (GY4) shows the
government’s contribution in public commendation performance. The output index for public
security is evaluated by crimes committed, thefts, and violent crime detection rate (GY5), and
takes crime detection rate as the undesirable output.
Table 1. Variable Descriptions
Variables Term Description
Asset EX1 Current Companies’ Registered Assets (NT$ million)
Labor EX2 Working Population (Thousand)
Land EX3 Urban Plan Dimension
Economics Output
EY1 Sales Income (NT$ million)
Pollution EY2 Thickness of Sulfur Dioxide and Ozone (ppb) in Air
Government Output
GX1 Annual Output (NT$ million)
Social Work GY1 Social Welfare Workers Among Total Population (%)
Education GY2 Education Rate of 15 Year Olds & Above in Population (%)
Public Commendation
GY3 Land Dimension for Urban Plan on Public Space / 10,000 People (ha.)
Medical GY4 Population of Medical Staff Over All the Population (%)
Public Security GY5 Crime, Theft, Violent-Crime Detection Rate (%)
Table 2 lists various indicators for statistical description. In Table 2, we naturally find
the most thriving economic activities are in Taipei City and Taipei County. Here, assets, working
population, and commercial sales income all reach a very high rate, but the two with their high
density of commercial activities sacrifice the living space of their citizens. The low economic
activity areas include Penghu County and Taitung County. Due to their relatively lower

The International Journal of Organizational Innovation Vol 2 Num 4 Spring 2010 22
population, Chiayi County and Tainan County receive more social welfare or medical resources.
The less industrialized these areas are, the more the local government can promote tourism and
also create more recreational space for the local citizens.
Table 2. Descriptive Statistics of Variables in this Study (2002-2005)
EX1 EX2 EX3 EY1 EY2 GX1 GY1 GY2 GY3 GY4 GY5
2002 Mean 675,245 411 196 1,071,600 28 28,699 6 23 16 0.008 66
Std.Dev. 1,669,030 356 241 1,886,560 7 29,236 5 9 6 0.003 12
Max. 8,164,310 1,562 1,209 8,886,940 38 145,159 21 48 27 0.015 88
Min. 4,109 32 11 18,353 0 6,357 1 10 8 0.004 46
2003 Mean 702,040 416 196 1,188,800 29 32,008 7 25 16 0.008 68
Std.Dev. 1,731,190 360 241 2,123,020 7 31,966 5 9 6 0.003 11
Max. 8,454,980 1,578 1,209 10,015,800 39 149,100 19 48 27 0.015 85
Min. 4,127 33 10 17,956 0 6,898 1 11 8 0.004 50
2004 Mean 724,668 426 196 1,390,070 31 35,470 7 26 16 0.008 66
Std.Dev. 1,768,850 370 241 2,467,590 8 34,502 4 9 6 0.003 12
Max. 8,633,830 1,628 1,210 11,708,500 40 160,405 20 50 27 0.015 86
Min. 4,159 34 10 19,613 0 7,389 1 12 8 0.005 44
2005 Mean 753,297 432 196 1,491,190 30 35,858 7 27 16 0.009 66
Std.Dev. 1,827,660 377 241 2,747,980 7 34,873 4 9 6 0.003 13
Max. 8,921,530 1,664 1,210 13,126,300 38 158,151 16 52 27 0.016 87
Min. 4,010 34 10 21,784 0 6,841 1 13 8 0.005 48
Empirical Results
Efficiency Analysis
This research employs the computer program DEA Excel Solver to estimate Seiford and
Zhu’s (2002) undesirable models. Table 3 presents the results for years 2002-2005.

The International Journal of Organizational Innovation Vol 2 Num 4 Spring 2010 23
From Table 3, in 2002 the average economic efficiency value is 0.913 and the average
government efficiency value is 0.901. In 2003 the average economic efficiency value is 0.910
and the average government efficiency value is 0.913. In 2004 the average economic efficiency
value is 0.908 and the average government efficiency value is 0.905. In 2005 the average
economic efficiency value is 0.859 and the average government efficiency value is 0.889. The
measurement results yielded by economic efficiency and government efficiency have no
apparent difference. Furthermore, economic and government efficiencies show that they
gradually decline annually.
For economic efficiency, Taipei City, Taichung City, Tainan City, Chiayi City, Taitung
County, Hualian County, and Penghu County are always on the frontier of DEA. Taichung
County, Tainan County, Chiayi County, Yilan County, and Hsinchu City take second place.
Nantou County, Miaoli County, Kaohsiung City, Taipei County, and Taoyuan County rank the
worst level.
In government efficiency, the efficiency scores of Taipei City, Taichung City, Tainan City,
Chiayi City, Taitung County, Hualian County, and Penghu County are all 1 in the DEA
estimation, thus ranked #1. Keelung City places 11th in 2002 and 2003, but progresses the best in
government efficiency among all areas after 2004. Pintung County, Yunlin County, Kaohuiung
County, Taipei County, and Taoyuan County have the worst government efficiency of all areas.
The International Journal of Organizational Innovation Vol 2 Num 4 Spring 2010 24
Economic Efficiency and Government Efficiency Analysis
The Quadrant
In order to have a better understanding of the relationship between economic efficiency and
government efficiency for each county or city, we use the quadrant to graphically show the
position of each county or city.
We divide the quadrant with government efficiency as the vertical axis and economic
efficiency scores as the horizontal axis. In this research we plot the quadrant according to the
efficiency scores under Seiford and Zhu’s (2002) undesirable models. Thus, the vertical axis
offers the average government efficiency scores, which means the county or city located to the
right side of the vertical axis possesses a higher government efficiency on average in the county
or city. The horizontal axis presents the average economic efficiency scores, which means the
county or city located above the horizontal axis possesses a higher economic efficiency on
average in the county or city. Quadrant I represents higher economic efficiency and higher
government efficiency. Quadrant II represents higher economic efficiency and lower government
efficiency. Quadrant III represents lower economic efficiency and lower government efficiency.
Quadrant IV represents lower economic efficiency and higher government efficiency (see Figure
1).

The International Journal of Organizational Innovation Vol 2 Num 4 Spring 2010 25
Table 3. Economic Efficiency and Government Efficiency
2002 2003 2004 2005 Average
Econ. Eff. Gov. Eff. Econ. Eff. Gov. Eff. Econ. Eff. Gov. Eff. Econ. Eff. Gov. Eff. Econ. Eff. Gov. Eff.
Score R Score R Score R Score R Score R Score R Score R Score R Score R Score R
Taipei County 0.809 22 0.701 23 0.761 23 0.698 23 0.745 23 0.676 23 0.715 22 0.703 22 0.758 23 0.695 23
Yilan County 0.912 11 0.888 12 0.900 13 0.929 12 0.931 10 0.920 12 0.911 11 0.911 11 0.914 11 0.912 12
Taoyuan County 0.787 23 0.824 19 0.785 22 0.834 19 0.774 22 0.812 19 0.695 23 0.743 21 0.761 22 0.803 19
Hsinchu County 0.910 12 0.923 10 0.995 9 1.000 1 0.861 14 0.860 17 0.816 18 0.787 19 0.895 13 0.892 14
Miaoli County 0.822 20 0.875 15 0.805 21 0.922 14 0.838 20 1.000 1 0.838 16 0.955 10 0.826 21 0.938 10
Taichung County 0.943 10 0.975 9 0.935 11 0.975 9 0.896 12 0.859 18 0.848 15 0.846 16 0.906 12 0.914 11
Changhua County 0.867 14 0.853 16 0.854 16 0.884 16 0.842 18 0.871 15 0.849 14 0.878 12 0.853 16 0.871 16
Nantou County 0.835 19 0.836 17 0.830 19 0.913 15 0.837 21 0.893 13 0.814 20 0.827 17 0.829 20 0.867 17
Yunlin County 0.855 18 0.763 21 0.808 20 0.732 22 0.841 19 0.791 21 0.834 17 0.796 18 0.835 19 0.770 21
Chiayi County 0.960 9 0.884 13 0.946 10 0.924 13 0.964 9 0.938 11 0.966 9 0.857 14 0.959 9 0.901 13
Tainan County 1.000 1 0.881 14 1.000 1 0.871 17 0.999 8 0.876 14 0.972 8 0.870 13 0.993 8 0.875 15
Kaohsiung County 0.860 16 0.810 20 0.860 15 0.803 20 0.859 15 0.806 20 0.815 19 0.777 20 0.849 17 0.799 20
Pintung County 0.861 15 0.747 22 0.839 17 0.751 21 0.844 17 0.710 22 0.890 12 0.671 23 0.859 15 0.720 22
Taitung County 1.000 1 1.000 1 1.000 1 1.000 1 1.000 1 1.000 1 1.000 1 1.000 1 1.000 1 1.000 1
Hualien County 1.000 1 1.000 1 1.000 1 1.000 1 1.000 1 1.000 1 1.000 1 1.000 1 1.000 1 1.000 1
Penghu County 1.000 1 1.000 1 1.000 1 1.000 1 1.000 1 1.000 1 1.000 1 1.000 1 1.000 1 1.000 1
Keelung City 0.859 17 0.922 11 0.864 14 0.953 11 0.859 16 1.000 1 0.862 13 1.000 1 0.861 14 0.969 9
Hsinchu City 0.893 13 1.000 1 0.917 12 0.956 10 0.913 11 0.943 10 0.955 10 0.985 9 0.920 10 0.971 8
Taichung City 1.000 1 1.000 1 1.000 1 1.000 1 1.000 1 1.000 1 1.000 1 1.000 1 1.000 1 1.000 1
Chiayi City 1.000 1 1.000 1 1.000 1 1.000 1 1.000 1 1.000 1 1.000 1 1.000 1 1.000 1 1.000 1
Tainan City 1.000 1 1.000 1 1.000 1 1.000 1 1.000 1 1.000 1 1.000 1 1.000 1 1.000 1 1.000 1
Taipei City 1.000 1 1.000 1 1.000 1 1.000 1 1.000 1 1.000 1 1.000 1 1.000 1 1.000 1 1.000 1
Kaohsiung City 0.821 21 0.831 18 0.839 18 0.847 18 0.869 13 0.868 16 0.814 21 0.849 15 0.836 18 0.849 18
Mean 0.913 0.901 0.910 0.913 0.908 0.905 0.895 0.889 0.907 0.902
Std.Dev. 0.076 0.094 0.085 0.095 0.082 0.098 0.096 0.108 0.082 0.095
Maximum 1.000 1.000 1.000 1.000 1.000 1.000 1.000 1.000 1.000 1.000
Minimum 0.787 0.701 0.761 0.698 0.745 0.676 0.695 0.671 0.758 0.695

The International Journal of Organizational Innovation Vol 2 Num 4 Spring 2010 26
From Figure 2, we find that there are 8 counties or cities, 11 counties or cities, 10
counties or cities, and 9 counties or cities in Quadrant I in 2002, 2003, 2004, and 2005,
respectively. There are 2 counties or cities, 1 county or city, 1county or city, and 2 counties or
cities in Quadrant II in 2002, 2003, 2004, and 2005, respectively. There are 10 counties or cities,
7 counties or cities, 10 counties or cities, and 10 counties or cities in Quadrant III in 2002, 2003,
2004, and 2005, respectively. There are 1 county or city, 4 counties or cities, 2 counties or cities,
and 3 counties or cities in Quadrant III in 2002, 2003, 2004, and 2005, respectively.
The Distribution of 23 Counties or Cities
We choose those counties or cities which remained in the same quadrant for four years as
the representatives of Quadrants I, II, III, and IV (see Table 4).
ⅠⅠⅠⅠ
Economic
Efficiency
Government
Efficiency
ⅢⅢⅢⅢ ⅣⅣⅣⅣ
Figure 1. The quadrant
ⅡⅡⅡⅡ

The International Journal of Organizational Innovation Vol 2 Num 4 Spring 2010 27
Figure 2 Economic Efficiency and Government Efficiency
Distribution Map (2002-2005)
1. Quadrant I: These counties or cities are operating efficiently and have high economic
efficiency and high government efficiency compared to others. We see that most of the counties
or cities in this area are those with a mature commercial development or well-known as leaders
in the tourism industry. The representative counties or cities include Taipei City, Hsinchu City,
Taitung City, Chiayi City, Tainan City, Yilan County, Taitung County, Hualian County, and
Penghu County.
2. Quadrant II: These counties or cities have higher economic efficiency and lower
0.5000.6000.7000.8000.9001.0000.750 0.800 0.850 0.900 0.950 1.000
0.5000.6000.7000.8000.9001.0000.750 0.800 0.850 0.900 0.950 1.000
0.5000.6000.7000.8000.9001.0000.750 0.800 0.850 0.900 0.950 1.000
0.5000.6000.7000.8000.9001.0000.750 0.800 0.850 0.900 0.950 1.000
2003 2005
2002 2004

The International Journal of Organizational Innovation Vol 2 Num 4 Spring 2010 28
government efficiency. If they properly adjust government performance, then they may also
upgrade to compete with those counties or cities in Quadrant I. The representatives of Quadrant
II are Chiayi County and Tainan County.
3. Quadrant III: These counties or cities are operating inefficiently and have lower
economic efficiency and lower government efficiency. The representative counties or cities are
Taipei County, Taoyuan County, Hsinchu County, Changhua County, Nantou County, Yunlin
County, Kaohsiung County, Pintung County, and Kaohsiung city. These counties or cities should
adjust government management and change their operations to improve their performance.
4. Quadrant IV: These counties or cities have lower economic efficiency and higher
government efficiency. The representatives of Quadrant IV are Keelung City, Miaoli County, and
Taichung County.
From all of the above, we conclude that the counties or cities in Quadrant I perform the best
in each year while counties or cities in Quadrant III perform the poorest. The counties or cities in
Quadrants II and IV show not many differences between them in some years.
Correlation Between Economic Efficiency and Government Efficiency
It is crucial to test if there is a high correlation between economic efficiency and
government efficiency. Here, we adopt the Pearson Correlation Coefficients Test, and the results
are listed in Table 5. From Table 5, we can see that economic efficiency and government

The International Journal of Organizational Innovation Vol 2 Num 4 Spring 2010 29
Table 4. The Distribution of Economic Efficiency
and Government Efficiency in Quadrants
Higher Economic Efficiency Lower Economic Efficiency Taipei City Hsinchu City Keelung City
Taitung City Chiayi City Miaoli County
Taichung County
Higher Government Efficiency
Chiayi County Taipei County Yunlin County
Tainan County Taoyuan County Kaohsiung County
Hsinchu County Pintung County
Changhua County Kaohsiung City
Lower Government Efficiency
Nantou County
efficiency are highly correlated with each other. In 2002 the economic and government efficiency
correlation coefficients are 0.789. In 2003 the two efficiency correlation coefficients are 0.800. In
2004 the two efficiency correlation coefficients are 0.742. In 2005 the two efficiency correlation
coefficients are 0.763. Thus, there exists a significantly positive correlation between economic
efficiency and government efficiency. This result is consistent with the result in Chen and Lee
(2005).
Table 5. Pearson Correlation Coefficients
Econ. Eff.
2002 2003 2004 2005 Average
Gov. Eff. 2002 0.789 **
2003 0.800 **
2004 0.742 **
2005 0.763 **
Average 0.785 **
** Denotes statistically significant at 5% level

The International Journal of Organizational Innovation Vol 2 Num 4 Spring 2010 30
From the above analyses, we know that higher economic efficiency will be able to bring
about higher economical development, which simultaneously will be able to bring more sources
of wealth to the government and result in higher government efficiency. In other words,
government efficiency and economic efficiency complement one another and are able to create
areas that can be more prosperous.
Conclusion
Most studies in the existing literature have discussed government and economic
efficiencies separately, but they do not take them into account together. In this study we adopt
the Seiford and Zhu (2002) undesirable modeling to discuss government and economic
efficiencies together for 23 different districts in Taiwan and carry on the correlation analysis to
government and economic efficiencies. The conclusions of this paper are as follows.
1. The regions with the most thriving economic activities are Taipei City and Taipei County,
while low economic activity areas include Penghu County, Taitung County, Chiayi County, and
Tainan County.
2. Economic efficiency and government efficiency have no apparent difference. They also
show that economic and government efficiencies gradually decline annually
3. Taipei City, Hsinchu City, Taitung City, Chiayi City, Tainan City, Yilan County, Taitung
County, Hualian County, and Penghu country have high economic efficiency and high

The International Journal of Organizational Innovation Vol 2 Num 4 Spring 2010 31
government efficiency compared to others. Most of the counties or cities are those with mature
commercial development or well-known as leaders in tourism.
4. Taipei County, Taoyuan County, Hsinchu County, Changhua County, Nantou County, Yunlin
County, Kaohsiung County, Pintung County, and Kaohsiung city have lower economic efficiency
and lower government efficiency.
5. Chiayi County and Tainan County have higher economic efficiency and lower government
efficiency. Keelung City, Miaoli County, and Taichung County have lower economic efficiency
and higher government efficiency
6. There is a positive relationship between economic efficiency and government efficiency. Thus,
higher economic efficiency is able to bring higher economical development, resulting in higher
government efficiency. This result is consistent with Chen and Lee (2005).
References
Afonso, A. and M. S. Aubyn, (2005), “Non-Parament Approaches to Education and Health
Efficiency in OECD Countries,” Journal of Applied Economics, 8, 2, 227-246.
Afonso, A. and S. Fernandes, (2006), “Measuring Local Government Spending Efficiency:
Evidence for the Lisbon Region,” Regional Studies, 40, 1, 39-53.
Ali, A.I. and L.M. Seiford, (1990), “Translation Invariance in Data Envelopment Analysis,”
Operations Research Letters 9, 403-405.

The International Journal of Organizational Innovation Vol 2 Num 4 Spring 2010 32
Arcelus, F. J. and P. Arocena, (2005), “Productivity Differences across OECD Countries in the
Presence of Environmental Constraints,” Journal of the Operational Research Society,
56, 1352-1362.
Banker, R. D., A. C. Charnes, and W. W. Cooper, (1984), “Some Models for Estimating
Technical and Scale Inefficiencies in Data Envelopment Analysis,” Management Science,
30, 1078-1092.
Battese, G. E., and T. J. Coelli, (1992), “Frontier Production Functions, Technical Efficiency and
Panel Data: With Application to Paddy Farmers in India,” Journal of Productivity
Analysis, 3, 153-169.
Battese, G. E., and T. J. Coelli, (1995), “A Model for Technical Inefficiency Effects in a
Stochastic Frontier Production Function for Panel Data,” Empirical Economics, 20, 325-
32.
Charnes, A. C., W. W. Cooper, and E. L. Rhodes, (1978), “Measuring the Efficiency of Decision
Making Units,” European Journal of Operational Research, 2, 429-444.
Charnes, A. C., W. W. Cooper, and S. Li, (1989), “Using Data Envelopment Analysis to
Evaluate Efficiency in the Economic Performance of Chinese Cities,” Socio-Economic
Planning Sciences, 6, 325-344.
Chen, S. T. and C. C. Lee, (2005), “Government Size and Economic Growth in Taiwan: A
Threshold Regression Approach,” Journal of Policy Modeling, 27, 1051-1066.
Färe, R., S. Grosskopf, C. A. Lovell, and C. Pasurka, (1989), “Multilateral Productivity
Comparisons when Some Outputs are Undesirable: A Nonparametric Approach,” The
Review of Economics and Statistics, 71, 90-98.
Färe, R., S. Grosskopf, and M. Norris, (1994), “Productivity Growth, Technical Progress, and
Efficiency Change in Industrialized Countries,” The American Economic Review, 84, 1,
66-83.
Färe, R., S. Grosskopf, and F. Hernandez-Sancho, (2004), “Environmental Performance: An
Index Number Approach,” Resource and Energy Economics, 26, 343-352.
The International Journal of Organizational Innovation Vol 2 Num 4 Spring 2010 33
Farrell, M. J., “The Measurement of Productive Efficiency,” Journal of the Royal Statistical
Society, 120, 3, 253-290.
Golany, B. and Y. Roll, (1989), “An Application Procedure for DEA,” OMEGA, 17, 237-250.
Hailu, A. and T. S. Veeman, (2001), “Non-Parametric Productivity Analysis Undesirable
Outputs: An Application to the Canadian Pulp and Paper Industry,” American Journal of
Agricultural Economics, 83, 3, 605-616.
Hughes, P. A. and M. E. Edwards, (2000), “Leviathan vs. Lilliputian: A Data Envelopment
Analysis of Government Efficiency,” Journal of Regional Science, 40, 2, 649-669
Li, Y., (2005), “DEA Efficiency Measurement with Undesirable Outputs: An Application to
Taiwan’s Commercial Banks,” International Journal of Services Technology and
Management, 6, 6, 544-555.
Ma, Y. F. and Y. J. Goo, (2005), “Technical Efficiency and Productivity Change in China’s
High- and New-Technology Industry Development Zones,” Asian Business &
Management, 4, 331-355.
Martic, M. and G. Savic, (2001), “An Application of DEA for Comparative Analysis and
Ranking of Regions with Regards to Social-Economic Development,” European Journal
of Operational Research, 132, 343-356.
Mastromarco, C. and U. Woitek, (2006), “Public Infrastructure Investment and Efficiency in
Italian Regions,” Journal of Productivity Analysis, 25, 1, 57-65.
Maudos, J., J. M. Pastor, and L. Serrano, (2000), “Efficiency and Productive Specialization: An
Application to the Spanish Regions,” Regional Studies, 34, 9, 829-842.
Percoco, M., (2004), “Infrastructure and Economic Efficiency in Italian Regions,” Networks and
Economics, 4, 361-378.
Seiford, L. M. and J. Zhu, (2002), “Modeling Undesirable Factors in Efficiency Evaluation,”
European Journal of Operational Research, 142, 16-20.

The International Journal of Organizational Innovation Vol 2 Num 4 Spring 2010 34
Sun, S., (2002), “Measuring the Relative Efficiency of Police Precincts Using Data Envelopment
Analysis,” Socio-Economic Planning Sciences, 36, 51-71.
Timmer M. P. and B. Los, (2005), “Localized Innovation and Productivity Growth in Asia: An
Intertemporal DEA Approach,” Journal of Productivity Analysis, 23, 47-64.
Worthington, Andrew c. and Brian E. Dollery (2002), “Incorporating Contextual Information in
Public Sector Efficiency Analysis: a Comparative Study of NSW Local Government,”
Applied Economics, Vol 34, 453-464.
World Economic Forum, The Global Competitiveness Report 1996, Geneva, Switzerland 1996.

The International Journal of Organizational Innovation Vol 2 Num 4 Spring 2010 35
THE APPLICATION OF FUZZY LINGUISTIC SCALE ON INTERNET
QUESTIONNAIRE SURVEY
Kuo-Ming Chu
Cheng Shiu University, Taiwan
Abstract
The growing number of respondents with access to the internet introduces a new data collection alternative that is likely to become increasingly important in the future. The purpose of this paper is to develop the process of a fuzzy linguistic scale to solve the linguistic scale transformation problems generated by the traditional quantitative methods based on the Likert scale and semantic scale, and to reduce the difficulties of answering the fuzzy questionnaire. Therefore, the problem of dilution of measuring results due to the traditional linguistic value in which every scale interval is equal can be solved by using the fuzzy linguistic scale.
Keywords: Fuzzy Linguistic Scale, Linguistic modeling, Cognitive Sciences, Internet
Questionnaire.

The International Journal of Organizational Innovation Vol 2 Num 4 Spring 2010 36
Introduction
The questionnaire always plays a significant part in social science studies. While
promising, internet surveys also face a variety of challenges in security of confidential
information, and in mastery of new and rapidly changing technologies. It also is useful in
collecting and analyzing data and in making sure if the assumption is correct (Kim & Lee, 2009).
A questionnaire normally comes with statements or questions, but in all cases the subject is
responding to some specific purposes. A question or statement can be worded in many ways, and
the same is true for the response. One of the most popularly used responses is a combination of
statements and gradation of the statement in the form of scales such as the Likert scale. Every
item usually is stated in the form of a statement in which the respondents have to choose a
response from a scale of 1 to 5. To construct an ordinal scale standard, researchers, for their own
convenience, often adopt the Likert Scale (LS) and the semantic differential scale (SDS) on the
application of marketing research. However, in empirical studies, these two scales usually are
assumed as intervals. In most cases, it is quite difficult to describe adequately the human of a
nonlinear system by mathematical models, especially when the structure of the system is
unknown. Although LS and SDS have precision and applicability, there still are limitations. For
instance, a person’s real likes or dislikes could not always be expressed precisely, due to
complexity of human thinking logic under different situations. It also is hard to convey a
person’s linguistic expression clearly and concisely. On one hand, traditional quantitative
methods that try to express fuzzy linguistic terms in precise scale technically would generate
deviation easily in true meaning of linguistic terms to be conveyed. On the other hand, the
traditional quantitative method, which is based on the assumption of equal distance within a

The International Journal of Organizational Innovation Vol 2 Num 4 Spring 2010 37
measuring scale, often is ignored intentionally or unintentionally.
However, the studies conducted by Bradley, Katti, & Coons (1962) and Bradley (2006)
suggest that the distance within the measuring scale usually is not set equally. Studies conducted
by scholars domestically and internationally also show that an equal-distance scale unavoidably
produces an incorrect estimate of factors. The use of fuzzy set theory, proposed and developed
by Zadeh (1993), has given very good results modeling the qualitative aspects in linguistic terms.
Literature
Fuzzy Questionnaire Styles
In many social science studies, the purpose usually is to analyze concepts or attitudes of
human beings. In this type of study, answers provided are not strictly “true” or “false,” due to
some uncertainties of human behavior. Boolean Logic (Fuzzy Logic), on the contrary, takes into
account the complexity of human thinking and uncertainties of human behavior.
It would be best to display traits of the study by explicitly accurate values. But it is energy and
time consuming to evaluate accurate values. Researchers also should consider analysis cost.
Providing questionnaire takers with consecutive scale area will enable researchers to collect data
more easily. For instance, Wang et al. (2006), Westenberg et al. (2007) and Robalino et al.
(2007) apply the concept of Fuzzy membership function and Fuzzy statistics to construct
consecutive area questionnaires. Hwang (1993) and Abdullah et al. (2004) also offers method to
test fuzzy statistic and makes comparisons with traditional questionnaire designs. Matt et al.
(2003), and Cassone & Ben-Arieh (2005), by combining fuzzy theory, design various types of
fuzzy questionnaires and make comparisons with traditional questionnaires. On the application
side, Hwang (1993) applied fuzzy theory on math teaching process evaluations. Westenberg et
al. (2007) applied fuzzy theory in defining product investment combinations. Deng & Pei (2007)

The International Journal of Organizational Innovation Vol 2 Num 4 Spring 2010 38
used fuzzy theory to analyze service quality assessment. Lien & Chen (2005) applied fuzzy
linguistic scale approach and discrete choice theory for building the housing consumption choice
behavior model in a household. However, for the general public, it’s hard to draw lines to
express attitudes and opinions. As Zadeh (1993) said using values to accurately decide relating
and influential disciplines is not an easy task in many situations. A practical way is to establish a
reference system. For instance, traditional questionnaires request test takers to write down
“levels of attitude” on the scale to enable researchers to establish membership functions. This
way, however, will increase the level of complexity of data collecting and calculations. It is not
the most practical method in this aspect.
Fuzzy Linguistic Scale
To ask questionnaire takers to express their attitudes verbally is the easiest and the most
direct method. But, researchers must be able to transform verbal expressions into values to
expedite statistical analysis. In fuzzy theory studies, researchers often use fuzzy values to
measure linguistic terms. Chen and Hwang (1992) offer a method of applying fuzzy theory to
convert fuzzy numbers into crisp numbers.
This method effectively improves the shortages of traditional measuring tools. The
difficulties faced by questionnaire takers when filling out questionnaires is reduced because
fuzzy data can be expressed in linguistic terms. The only shortcoming is that the linguistic scale
is decided subjectively by Chen and Hwang. There are many studies based on Chen and
Hwang’s linguistic scale. But most researchers directly apply Chen and Hwang’s linguistic scale
and linguistic conversion values. Chen and Hwang did not provide a solid explanation of their
research process and scale construction; besides, the studied subjects are foreigners. Thus,
researchers should notice the difference in subject background, timing, and culture. Deviations

The International Journal of Organizational Innovation Vol 2 Num 4 Spring 2010 39
will occur when the method is applied directly without considering the difference. Based on the
above reasons, we provide a both practical and realistic fuzzy linguistic scale to construct
processes to eliminate the problems embedded in Chen and Hwang’s method.
The Process
In our research, we build a process of fuzzy linguistic scale according to unequal scale
intervals, different individuals, and disregard the inflated.
Step 1: Design a fuzzy linguistic scale questionnaire
Step 1.1 Decide the number of terms used
The verbal terms used in our scales are in the universe X={x1, x2, …,xm}; m is the number of
terms used.
Step 1.2 Decide the styles of linguistic combination
According to linguistic terms, there will be( )
2
1 mm ×−types of combination.
Step 2: Convey the scale questionnaire
Step 2.1 Analyzing the types of the questionnaire takers’ answers
After the answers of the key questionnaires are obtained, analyze the types of the scales
used by questionnaire takers according to overall scales shown. Design and distribute linguistic
questionnaires after the types of scales that contain minimum linguistic terms are obtained.
Step 2.2 Establish membership function belonged to individual test-taker
Define the linguistic terms variables (k) in questionnaires according to each individual’s (i)
answers. Also, in an interval scale (0-1), subjectively determine the scope of linguistic terms by
using triangle fuzzy number A=(c, a, b, d; w)LR. Suppose the membership function of A is

The International Journal of Organizational Innovation Vol 2 Num 4 Spring 2010 40
( )
≤≤−−
≤≤
≤≤−−
=
o ,0
,
,
, 。thers
dxbdbdxw
bxaw
axccacxw
x kiikikikik
kiik
kiikikikik
Aki
µ (1)
Since,
Step 3: Integrate various types of linguistic scales
Integrating various types of linguistic variables should be done after the questionnaire
taker’s linguistic terms variable k is transformed into ikA , for different questionnaire takers i
have different recognition and experience. Kacprzyk et al. (1992), Ishikawa et al. (1993) and Hsu
& Chen (1996) proposed the formula of Fuzzy Delphi method to aggregate group opinions. But
this paper considers the participants to be many, and moreover the linguistic cognition is
different, it therefore uses the mean value to carry on the opinion integration, avoiding various
linguistic cognition scopes as too dispersing. Suppose the membership function of A is kA =(ck,
ak, bk, dk)LR (4)
ck = ,1
n
cn
i
ik∑= (5)
n
a
a
n
i
ik
k
∑== 1 (6)
n
b
b
n
i
ik
k
∑== 1 (7)
n
d
d
n
i
ik
k
∑== 1 . (8)
kiikikikik axccacxwxL ≤≤−−= ,)(
ikikikikik dxbdbdxwxR ≤≤−−= ,)(
(2)
(3)
The International Journal of Organizational Innovation Vol 2 Num 4 Spring 2010 41
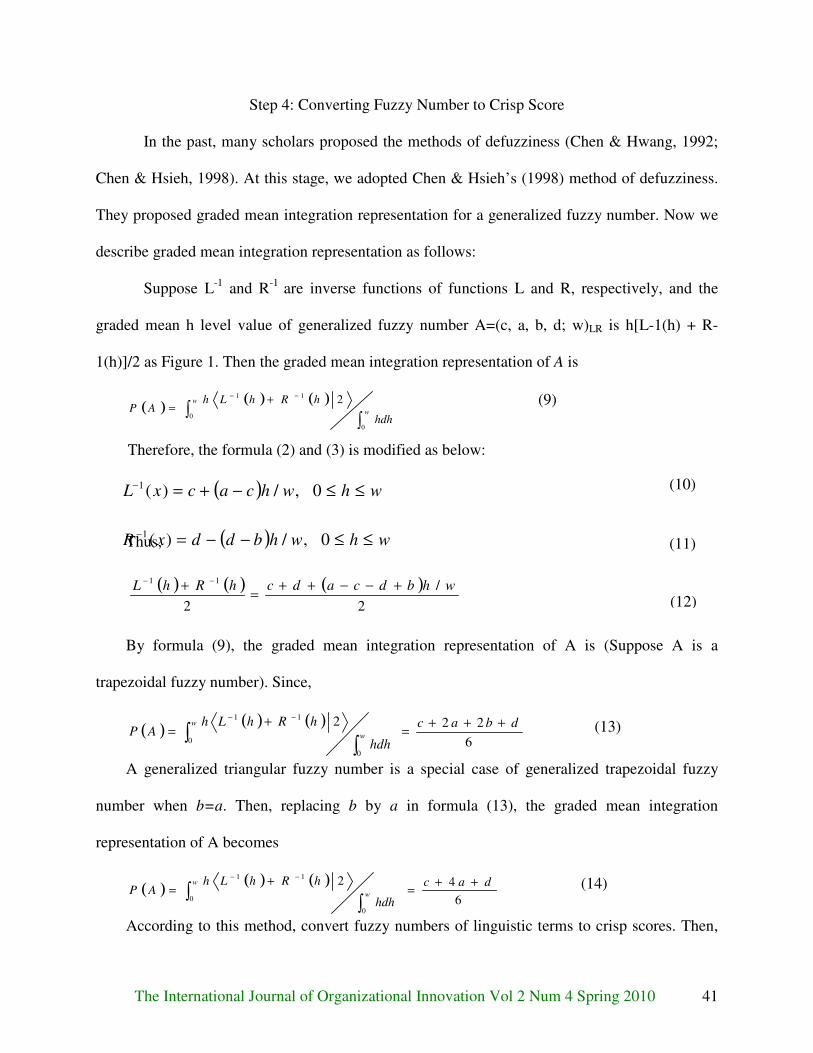
Step 4: Converting Fuzzy Number to Crisp Score
In the past, many scholars proposed the methods of defuzziness (Chen & Hwang, 1992;
Chen & Hsieh, 1998). At this stage, we adopted Chen & Hsieh’s (1998) method of defuzziness.
They proposed graded mean integration representation for a generalized fuzzy number. Now we
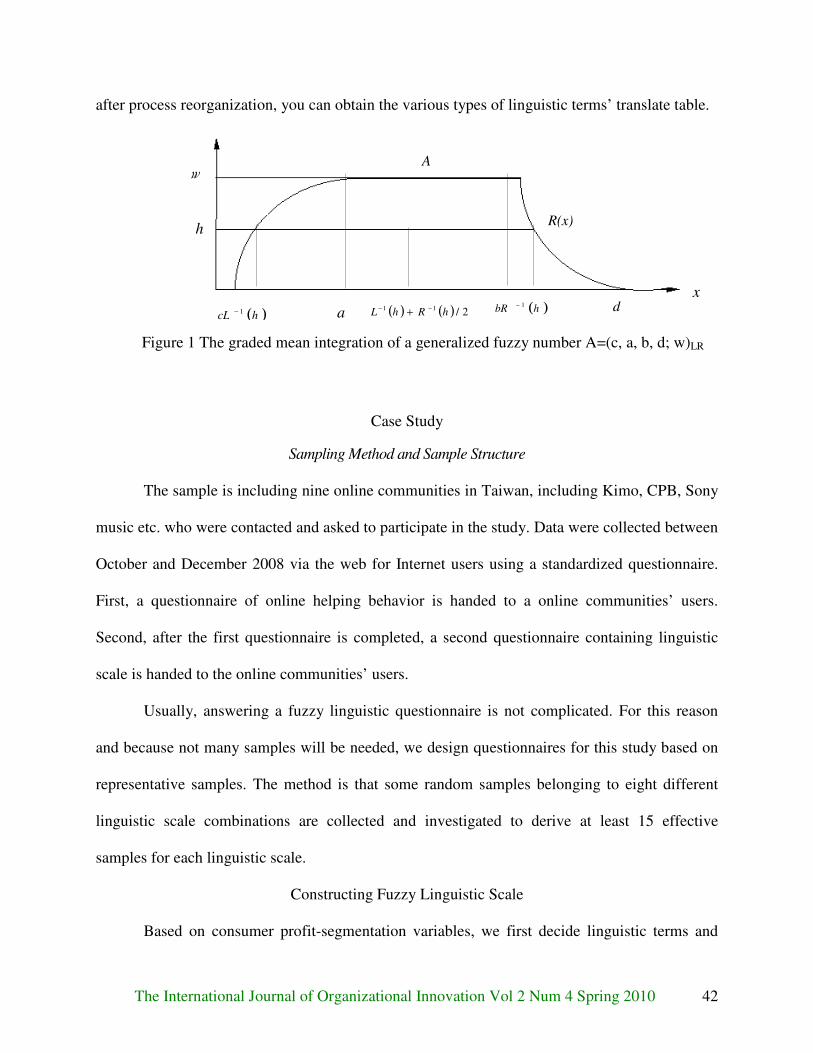
describe graded mean integration representation as follows:
Suppose L-1 and R-1 are inverse functions of functions L and R, respectively, and the
graded mean h level value of generalized fuzzy number A=(c, a, b, d; w)LR is h[L-1(h) + R-
1(h)]/2 as Figure 1. Then the graded mean integration representation of A is
( )( ) ( )
∫∫
−− +=
w
w
hdh
hRhLhAP
0
0
11 2 (9)
Therefore, the formula (2) and (3) is modified as below:
Thus,
By formula (9), the graded mean integration representation of A is (Suppose A is a
trapezoidal fuzzy number). Since,
( )( ) ( )
6
222
0
0
11dbac
hdh
hRhLhAP
w
w
+++=
+= ∫
∫
−−
(13)
A generalized triangular fuzzy number is a special case of generalized trapezoidal fuzzy
number when b=a. Then, replacing b by a in formula (13), the graded mean integration
representation of A becomes
( )( ) ( )
6
42
0
0
11dac
hdh
hRhLhAP
w
w
++=
+= ∫
∫
−−
(14)
According to this method, convert fuzzy numbers of linguistic terms to crisp scores. Then,
( ) ( ) ( )2
/
2
11whbdcadchRhL +−−++
=+ −−
(12)
( ) whwhcacxL ≤≤−+=− 0,/)(1
( ) whwhbddxR ≤≤−−=− 0,/)(1(11)
(10)
The International Journal of Organizational Innovation Vol 2 Num 4 Spring 2010 42
after process reorganization, you can obtain the various types of linguistic terms’ translate table.
Case Study
Sampling Method and Sample Structure
The sample is including nine online communities in Taiwan, including Kimo, CPB, Sony
music etc. who were contacted and asked to participate in the study. Data were collected between
October and December 2008 via the web for Internet users using a standardized questionnaire.
First, a questionnaire of online helping behavior is handed to a online communities’ users.
Second, after the first questionnaire is completed, a second questionnaire containing linguistic
scale is handed to the online communities’ users.
Usually, answering a fuzzy linguistic questionnaire is not complicated. For this reason
and because not many samples will be needed, we design questionnaires for this study based on
representative samples. The method is that some random samples belonging to eight different
linguistic scale combinations are collected and investigated to derive at least 15 effective
samples for each linguistic scale.
Constructing Fuzzy Linguistic Scale
Based on consumer profit-segmentation variables, we first decide linguistic terms and
( ) ( ) 2/11hRhL
−− + ( )hbR 1− ( )hcL
1−
x d a
w
h
A
R(x)
Figure 1 The graded mean integration of a generalized fuzzy number A=(c, a, b, d; w)LR

The International Journal of Organizational Innovation Vol 2 Num 4 Spring 2010 43
expressed as X = (strongly agree, agree, normal, disagree, strongly disagree) five linguistic terms.
Next, forsake single linguistic scale and design ten combinations of linguistic scales, shown as
Table 1.
Table 1 The combinations of fuzzy linguistic scale
Types I II III IV V VI VII VIII IX X
Strongly Agree Yes Yes Yes Yes
Agree Yes Yes Yes Yes Yes Yes Yes
Normal Yes Yes Yes Yes Yes Yes Yes Yes
Disagree Yes Yes Yes Yes Yes Yes Yes
Strongly Disagree Yes Yes Yes Yes
Eliminate five questionnaires considered invalid out of the 130 questionnaires collected.
Sort remaining 125 questionnaires into different types. Based on the combinations of fuzzy
Integrating Various Types of Linguistic Scales.
According to the above steps, we get the conversion scales as figure 2.
agree normal disagree Type V
0
0 . 1
0 . 2
0 . 3
0 . 4
0 . 5
0 . 6
0 . 7
0 . 8
0 . 9
1
0 0 . 1 0 . 2 0 . 3 0 . 4 0 . 5 0 . 6 0 . 7 0 . 8 0 . 9 1
0
0 . 1
0 . 2
0 . 3
0 . 4
0 . 5
0 . 6
0 . 7
0 . 8
0 . 9
1
0 0 . 1 0 . 2 0 . 3 0 . 4 0 . 5 0 . 6 0 . 7 0 . 8 0 . 9 1
normal strongly disagree disagree Type VI
0
0 . 1
0 . 2
0 . 3
0 . 4
0 . 5
0 . 6
0 . 7
0 . 8
0 . 9
1
0 0 . 1 0 . 2 0 . 3 0 . 4 0 . 5 0 . 6 0 . 7 0 . 8 0 . 9 1
0
0 . 1
0 . 2
0 . 3
0 . 4
0 . 5
0 . 6
0 . 7
0 . 8
0 . 9
1
0 0 . 1 0 . 2 0 . 3 0 . 4 0 . 5 0 . 6 0 . 7 0 . 8 0 . 9 1
normal agree
0
0 . 1
0 . 2
0 . 3
0 . 4
0 . 5
0 . 6
0 . 7
0 . 8
0 . 9
1
0 0 . 1 0 . 2 0 . 3 0 . 4 0 . 5 0 . 6 0 . 7 0 . 8 0 . 9 1
0
0 . 1
0 . 2
0 . 3
0 . 4
0 . 5
0 . 6
0 . 7
0 . 8
0 . 9
1
0 0 . 1 0 . 2 0 . 3 0 . 4 0 . 5 0 . 6 0 . 7 0 . 8 0 . 9 1
Type VIII Type IX
disagree
00 . 10 . 2
0 . 30 . 4
0 . 5
0 . 60 . 7
0 . 80 . 9
1
0 0 . 1 0 . 2 0 . 3 0 . 4 0 . 5 0 . 6 0 . 7 0 . 8 0 . 9 1
00 . 10 . 2
0 . 30 . 4
0 . 5
0 . 60 . 7
0 . 80 . 9
1
0 0 . 1 0 . 2 0 . 3 0 . 4 0 . 5 0 . 6 0 . 7 0 . 8 0 . 9 1
normal Type I strongly disagree disagree agree strongly agree
0
0 . 1
0 . 2
0 . 3
0 . 4
0 . 5
0 . 6
0 . 7
0 . 8
0 . 9
1
0 0 . 1 0 . 2 0 . 3 0 . 4 0 . 5 0 . 6 0 . 7 0 . 8 0 . 9 1
0
0 . 1
0 . 2
0 . 3
0 . 4
0 . 5
0 . 6
0 . 7
0 . 8
0 . 9
1
0 0 . 1 0 . 2 0 . 3 0 . 4 0 . 5 0 . 6 0 . 7 0 . 8 0 . 9 1
agree normal disagree strongly disagree Type III
0
0 . 1
0 . 2
0 . 3
0 . 4
0 . 5
0 . 6
0 . 7
0 . 8
0 . 9
1
0 0 . 1 0 . 2 0 . 3 0 . 4 0 . 5 0 . 6 0 . 7 0 . 8 0 . 9 1
0
0 . 1
0 . 2
0 . 3
0 . 4
0 . 5
0 . 6
0 . 7
0 . 8
0 . 9
1
0 0 . 1 0 . 2 0 . 3 0 . 4 0 . 5 0 . 6 0 . 7 0 . 8 0 . 9 1
normal agree strongly agree Type IV
0
0 . 1
0 . 2
0 . 3
0 . 4
0 . 5
0 . 6
0 . 7
0 . 8
0 . 9
1
0 0 . 1 0 . 2 0 . 3 0 . 4 0 . 5 0 . 6 0 . 7 0 . 8 0 . 9 1
0
0 . 1
0 . 2
0 . 3
0 . 4
0 . 5
0 . 6
0 . 7
0 . 8
0 . 9
1
0 0 . 1 0 . 2 0 . 3 0 . 4 0 . 5 0 . 6 0 . 7 0 . 8 0 . 9 1
normal disagree agree strongly agreeType II
0
0 . 1
0 . 2
0 . 3
0 . 4
0 . 5
0 . 6
0 . 7
0 . 8
0 . 9
1
0 0 . 1 0 . 2 0 . 3 0 . 4 0 . 5 0 . 6 0 . 7 0 . 8 0 . 9 1
0
0 . 1
0 . 2
0 . 3
0 . 4
0 . 5
0 . 6
0 . 7
0 . 8
0 . 9
1
0 0 . 1 0 . 2 0 . 3 0 . 4 0 . 5 0 . 6 0 . 7 0 . 8 0 . 9 1
Figure 2 Various types of linguistic scales (Type�-�)

The International Journal of Organizational Innovation Vol 2 Num 4 Spring 2010 44
individual logical thinking, effectively eliminating errors generated by a single conversion set.
linguistic scales, eliminate two types (VII and X) that no one used in our study. Design eight
different types of linguistic scale combinations. This method considers the difference in
Though there are only 12 and 13 questionnaires categorized into type V and IX, it is sufficient to
do linguistic scale analysis.
From Figure 2, the results are described as follows: First, thorough empirical
investigation obtained linguistic variables, various types of linguistic fuzzy numbers scale are
completely different, and presented the asymmetry. Namely, different linguistic types that the
fuzzy numbers present different values for the same linguistic terms. Second, from types 1 to 5,
we find that the general public tends to have consistent opinions regarding a linguistic term’s
more positive expression, namely, in “agree” and “very agree” on, participant's fuzzy number
chart width is narrow; namely, no matter whether the statement is the same, all had a close fuzzy
number graph. Finally, the fuzzy cognition of linguistic terms possesses “on the Double-sided
Property”. Namely, the fuzzy numbers of linguistic terms have an overlap phenomenon; for
example, the fuzzy numbers of “normal”, “agree,” and “strongly agree” possess the same
converting crisp scores under α-cuts=0.1 in type Converting Fuzzy Numbers to Crisp Scores
Then, according to the formula (13) and (14), convert each fuzzy number of Figure 1 to
crisp scores. From Table 2 and Figure 3, we quickly can obtain various type of linguistic terms’
crisp scores.
The question of equal distance of scales
From comparison in Table 2, it’s obvious that traditional questionnaires presuming equal
distance between scales assume everyone has same recognition levels when these levels are
transformed into scales such as “5, 4, 3, 2, 1.” However, our study indicates that not everyone
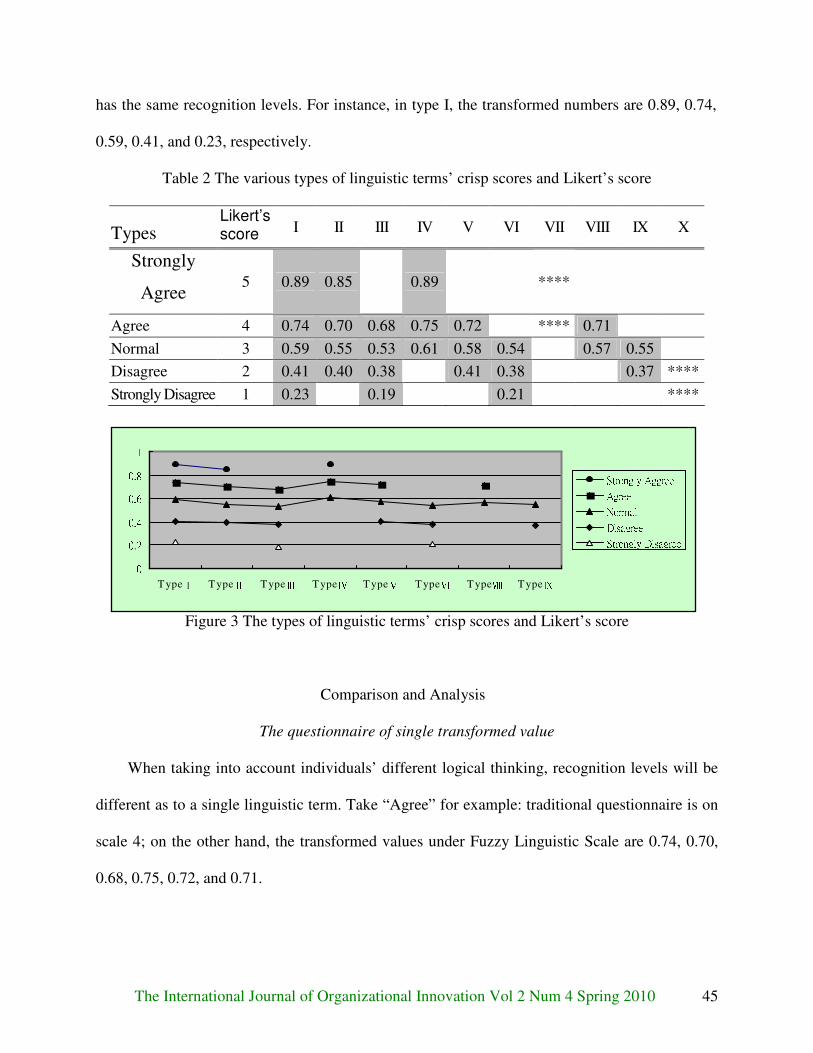
The International Journal of Organizational Innovation Vol 2 Num 4 Spring 2010 45
has the same recognition levels. For instance, in type I, the transformed numbers are 0.89, 0.74,
0.59, 0.41, and 0.23, respectively.
Table 2 The various types of linguistic terms’ crisp scores and Likert’s score
Types Likert’s score I II III IV V VI VII VIII IX X
Strongly
Agree 5 0.89 0.85 0.89 ****
Agree 4 0.74 0.70 0.68 0.75 0.72 **** 0.71
Normal 3 0.59 0.55 0.53 0.61 0.58 0.54 0.57 0.55
Disagree 2 0.41 0.40 0.38 0.41 0.38 0.37 ****
Strongly Disagree 1 0.23 0.19 0.21 ****
Figure 3 The types of linguistic terms’ crisp scores and Likert’s score
Comparison and Analysis
The questionnaire of single transformed value
When taking into account individuals’ different logical thinking, recognition levels will be
different as to a single linguistic term. Take “Agree” for example: traditional questionnaire is on
scale 4; on the other hand, the transformed values under Fuzzy Linguistic Scale are 0.74, 0.70,
0.68, 0.75, 0.72, and 0.71.
00.20.40.60.81TypeⅠ TypeⅡ TypeⅢ TypeⅣ TypeⅤ TypeⅥ TypeⅧ TypeⅨ
Strongly AggreeAgreeNormalDisagreeStrongly Disagree

The International Journal of Organizational Innovation Vol 2 Num 4 Spring 2010 46
Linguistic devaluation and inflation
Table 2 and Figure 3 show that we also have considered the phenomenon of linguistic
devaluation and inflation in human logical thinking. When using measurements containing lesser
scales, questionnaire takers tend to choose the “middle scale” and they would consider the width
of the scale when answering questionnaires. The phenomenon of linguistic devaluation and
inflation occurs frequently in the largest scale and the smallest scale sequentially.
The problem of dilution of measuring results
From Figure 3, the curve constituted by “average scale” values fluctuates most dynamically.
In traditional scales, assuming equal distance between scales, test takers tend to choose scales
closer to the middle one. Dilution of measuring results usually occurs. On the contrary, Fuzzy
Linguistic Scale is not equally distanced. It eliminates the problem presented by traditional
questionnaires by giving different linguistic terms and fuzzy values.
Conclusions
The Internet questionnaire method will become one of the major data collection methods in
the future research. According to this study, linguistic bias exists between the internet
questionnaire method and traditional method. We have the following conclusions for reference:
First, through a questionnaire, questionnaire takers are able to recognize the scope of linguistic
variables. The designed fuzzy linguistic conversion scale is able to solve the problem of
subjectively set membership function. The traditional type of questionnaire assumes distances
between scales are equal. Deviations will occur and the results obtained sometimes will be
diluted. Second, using this fuzzy linguistic conversion scale, we have taken into account the
problems of linguistic devaluation and inflation in human expression. This enables researchers
not only to deal with different recognition styles, but also to notice differences in individuals by

The International Journal of Organizational Innovation Vol 2 Num 4 Spring 2010 47
providing different linguistic variable combinations for research purposes. The phenomenon that
questionnaire takers tend to choose scales close to the middle will underestimate the variable
correlation and thus lead to improper decision making. Third, the result shows that the general
public tends to have a very close degree of recognition in answering questionnaires. There is
only a slight ramification in recognition among test takers. However, the closer the chosen scales
are to the middle, the fuzzier the linguistic terms are. Finally, however, the coverage of the
internet questionnaire method was different according to the participants’ characteristics. These
differences may have a negative affect on survey results by the characteristics of respondents.
Therefore, the accuracy of the internet questionnaire method should be further studied and also
should be utilized fuzzy linguistic scale for internet survey results.
References
Abdullah, M. L., Abdullah, W. S. W. & Tap, A. O. M. (2004). Fuzzy Sets In The Social Sciences: An Overview Of Related Researches, Jurnal Teknologi, 41, pp. 43-54.
Bradley, Ralph A. (2006). Applications of the Modified Triangle Test in Sensory Difference Trials, Journal of Food Science, 29(5), pp. 668 – 672.
Bradly, R. A., Katti, S. K., and I. J. Coons (1962). “Optimal Scaling for Ordered Categories,” Psychometrika, 27, pp. 355-374.
Cassone, D. & Ben-Arieh, D. (2005). Successive Proportional Additive Numeration Using Fuzzy Linguistic Labels (Fuzzy Linguistic SPAN), Fuzzy Optimization and Decision Making, 4(3), pp. 155-174.
Chen, S. H & Hsieh, C. H. (1998). “Graded Mean Integration Representation of Generalized Fuzzy Number,” 1998 Sixth National Conference on Fuzzy Theory and Applications (CD ROM), pp. 1-6.
Chen,S. J. & Hwang,C. L., (1992). Fuzzy Multiple Attribute Decision Making Method and application, A State-of-the-Art Survey, Springer - Verlag, New York.
Deng, Wei-Jaw & Pei, Wen (2007). The Impact Comparison of Likert Scale and Fuzzy Linguistic Scale on Service Quality Assessment. Chinese Management Review, 8(4), 19-37.

The International Journal of Organizational Innovation Vol 2 Num 4 Spring 2010 48
Hsu, H. M, Chen, C. T. (1996). “Aggregation of Fuzzy Opinions under Group Decision Making,” Fuzzy Sets and Systems, 79(3), 279-285.
Hwang, F. (1993). An Expert Decision Making Support System for Multiple Attribute Decision Making, Ph. D. Thesis, Dept. of Industrial Engg, Kansas State University.
Ishikawa, A., Amagasa, M., Shiga, T., Tomizawa, G., Tatsuta, R. and Mieno, H. (1993). “The Max-Min Delphi Method and Fuzzy Delphi Method via Fuzzy Integration”, Fuzzy Sets
and Systems, 55(2), 241-253.
Kacprzyk, J., Fedrizzi, M. and Nurmi, H. (1992). “Group Decision Making and Consensus under Fuzzy Preference and Fuzzy Majority”, Fuzzy Sets and Systems, 49(1), 21-31.
Lien, Ching-Yu & Chen, Yen-Jong (2005). Fuzzy Linguistic Scale Approach and Discrete Choice Theory for Building the Housing Consumption Choice Behavior Model in Household, City and Planning, 32(1), 57-81.
Matt, Georg E., Turingan, Maria R., Dinh, Quyen T., Felsch, Julie A., Hovell, Melbourne F. & Gehrman Christine (2003). Improving self-reports of drug-use: numeric estimates as fuzzy sets, Addiction, 98(9), 1239 – 1247.
Robalino, J., Bartlett, T. C., Chapman, R. W., Gross, P. S., Browdy, C. L. & Warr, G. W. (2007). Double-stranded RNA and antiviral immunity in marine shrimp: Inducible host mechanisms and evidence for the evolution of viral counter-responses. Developmental and Comparative Immunology. 31, 539-547.
Wang, X. H., Aliyari, R., Li, W. X., Li, H. W., K., Carthew, R., Atkinson, P. & Ding, W. (2006). RNA interference directs innate immunity against viruses in adult Drosophila. Science 312, 452-454.
Westenberg, H. W. Lincklaen, de Jong, S., von Meel, D. A., Quadt, J. F. A., Backer, E. & Duin, R. P. W. (2007). Fuzzy Set Theory Applied To Product Classification By A Sensory Panel, Journal of Sensory Studies, 4(1), pp. 55-72.
Zadeh, L. A. (1965). “Fuzzy Set”, Information and Control, 8, 338-353.
Zadeh, L.(1993). “Outline of a New Approach to the Analysis of Complex Systems and Decision Processes”, IEEE Trans. Syst. Syst., Man, Cybern., Vol. SMC-3, 28-44.
Kim, Jin-Gyu & Lee, Jae-Won (2009). “The Accuracy and Coverage of Internet-based Data Collection for Korea Population and Housing Census”, 24th Population Census Conference, Hong Kong, March 25-27.

The International Journal of Organizational Innovation Vol 2 Num 4 Spring 2010 49
LINKAGE COMMUNITY BASED INNOVATION AND SPEED TO MARKET: THE MEDIATING ROLE OF NEW PRODUCT DEVELOPMENT PROCESS
Hui-Chun Chan Fortune Institute of Technology, Taiwan
Abstract
The notion that firms can improve their innovativeness by tapping customers for knowledge has
become prominent in new product development studies. Specifically, we argue that link user
innovation and commercialization. Using the SEM analysis result to show that, this research
proposes the impacts of members participant the willingness on the stages of idea generation and
concepts and testing and launching are significant. This research also found the impacts of the
three stages of new product development showed significant influence on new product speed to
market. Finally, a complete model is developed for empirical testing. It seems to be a promising
source of innovation capabilities for new product development.
Keywords: Community Based Innovation, New Product Development, Speed to Market.

The International Journal of Organizational Innovation Vol 2 Num 4 Spring 2010 50
Introduction
New product development plays an important role in a firm’s growth and development.
Traditionally, new product development processes and the marketing of new products took place
within the firm boundaries, but several factors have led to the erosion of closed innovation.
Clayton Christensen (2003) indicates that a company that listens to its customers and provides
what they want still may lose out to the competition — because a cheaper, not-as-good but good-
enough competitor comes in and gains market share. Therefore, many researchers and
practitioners consider user participation in the development of new product is essential to the
success of new product (Mäkipää et al., 2005, p.19; Füller et al., 2007, p. 62; Fang, 2008, p. 91).
Community based innovations aggregate the efforts of individuals to create something that
serves a shared need, and explicitly includes the participation of customers. These efforts are
supported by formal or informal community partnerships that lower overhead, coordinate
behavior, and spread risks in order to create value that, oftentimes, otherwise would be
unavailable to the market. Since online communities offer a promising environment for creating
innovation, they offer an interesting context for further empirical studies of this topic (Mäkipää
et al., 2005; Füller et al., 2007; Ahonen et al., 2007). Such virtual interest communities are based
upon shared enthusiasm for an issue or an activity. They possess and exchange knowledge
concerning specific product domains and often are virtual meeting places for innovative users to
discuss opportunities for new products and ideas for product improvement. While data about
customers are readily available through existing customer knowledge. To be useful, managers
need to transform data into customer information and to integrate the information throughout the
firm to develop customer knowledge. It is the customer knowledge competence based on internal
firm processes that generate and integrate specific customer information, which enables firms to

The International Journal of Organizational Innovation Vol 2 Num 4 Spring 2010 51
develop customer-specific strategies. Thus, the remainder of this article proceeds as follows:
First, a theoretical framework is advanced to explore the nature of community based innovation
on new product development and speed to market. Second, this paper takes an inductive
approach and develops a model to understand participation in product-development
communities. The main research links user innovation and commercialization. Finally, we
discuss the theoretical and empirical implications, as well as limitations and future research
directions.
Research Conceptual Framework and Method
Research Conceptual Framework and Hypotheses
Figure 1 presents the proposed model, referred to as the community based innovation (CBI)
model. The research model for this study was designed to enables the researcher to examine the
antecedents of CBI in online communities, and then how firms can interact best with such groups
to get valuable input for new product development and may result in effects on new product
speed to market. The main research can remedy what literatures have not dealt with: linking user
innovation and commercialization.
Figure 1 Research Model and Hypotheses
H4 – H6 Willingness of CBI Participating
H1 – H3
Idea Generation and Concepts
Design and Engineering
Testing and Launching
Integrating CBI into NPD
Speed to Market

The International Journal of Organizational Innovation Vol 2 Num 4 Spring 2010 52
Reliability and Validity of Measures
Internal consistency was assessed by computing Cronbach’s alpha, and the alpha
coefficients for each construct of this study are presented in Table 1. As shown in Table 1,
Cronbach’s alpha for all items was found to be greater than 0.70, in accordance with Nunnally’s
standard (Nunnally, 1967). Following Anderson and Gerbing (1998), we also conducted
confirmatory factor analysis to further establish the reliability and discriminant validity of the
multi-item scales.
Survey Administration
The sample is 143 participants from five online communities of firms operating in Taiwan,
namely Microsoft, Working House, Inventec Corporation, Hometec Technology Inc., and
Asustek Computer Inc., that were contacted and asked to participate in the study. A banner with
a hyperlink connecting to our online survey was posted on the homepage of MY3Q
(http://www.my3q.com/home2/209/yim952008/18339.phtml) from March 19 to May 31, 2008,
and members with knowledge sharing experience were invited to complete this survey. The
surveys began with an introductory statement that asked respondents to give their own responses,
and assured them of confidentiality. The exclusion of 18 invalid questionnaires resulted in a total
of 143 complete and valid ones for data analysis. Table 2 lists the demographic information of
the respondents. This was followed by the measures and a request for demographic information.
The sample consisted of 125 respondents, including 59 with the educational background of
university and 53 service industry workers in Taiwan. The male/female ratio of the sample was
42.4 percent and 57.6 percent, respectively. In the sample, about 50 percent were in their
twenties and 35 percent were in their thirties, and just fewer than 70 percent of respondents were
single. The largest group of respondents, 42.4 percent, worked in the service industry.

The International Journal of Organizational Innovation Vol 2 Num 4 Spring 2010 53
Table 1 Summary of Measurement Scales
Construct/items Factor loading
t-value Construct Reliability
Cronbach’s α
The Willingness of CBI 0.741 0.781 CBI1 0.831** 20.844 CBI2 0.889** 21.447 CBI3 0.811** 19.684 CBI4 0.789** 19.100
Idea generation and concepts 0.742 0.911 IGC1 0.742** 17.231 IGC2 0.768** 18.659
Design and engineering 0.870 0.925 DE1 0.870** 17.221 DE2 0.891** 18.936
Testing and launching 0.825 0.903 TL1 0.825** 19.987 TL2 0.819** 18.145
Speed to Market 0.825 0.903 STM1 0.831** 18.890 STM2 0.814** 18.209 STM3 0.807** 18.113
Note: (** significant at the .001 level)
Table 2 Demographics (n=125)
Measure Items Nr. Percent Measure Items Nr. Percent
Male 53 42.4% High school or
below 21 16.8% Gender
Female 72 57.6% College/ University 59 47.2%
19-23 23 18.4%
Education
Graduate school or above
45 36.0%
24-28 41 32.8% Self-Employed 22 17.6%
29-35 27 21.6% Government 17 13.6%
36-42 18 14.4% Information Technology
15 12.0%
Age
42 or above 16 12.8% Manufacturing 7 5.6%
Single 85 68.0% Service Industry 53 42.4% Marital status Married 40 32.0%
Primary occupation
Student 11 8.8%

The International Journal of Organizational Innovation Vol 2 Num 4 Spring 2010 54
Questionnaire Data Analysis
Data analysis utilized a two-step approach, as recommended by Anderson & Gerbing
(1998). The ten constructs were allowed to covary freely in the CFA model. Model estimation
was done using the maximum likelihood approach, with the item correlation matrix as the input.
Table 3 presents the results of the CFA analysis.
Table 3 Correlations and AVE
Construct Construct Mean
Standard Deviation CBI IGC DE TL STM
CBI 3.896 0.761 0.798
IGC 3.675 0.834 0.548** 0.813
DE 3.406 0.857 0.322** 0.379** 0.769
TL 3.735 0.832 0.192** 0.280** 0.131* 0.905
STM 3.978 0.782 0.365** 0.413** 0.398** 0.374** 0.897 Diagonal elements are the square root of the average variance extracted (AVE). CBI:The Willingness of CBI
IGC:Idea generation and concepts
DE: Design and engineering TL: Testing and Launching STM: Speed to Market
These results suggest that discriminate validity was achieved. Therefore we conclude that
the scales should have sufficient construct validity.
Empirical Study
Questionnaire Data Analysis
AMOS 7.0 was used for testing the model and hypotheses shown in Figure 2. For the
current CFA model, covariance structure analysis testing of the proposed model (see Figure 3)
resulted in a chi-square statistic of 25.98 (df=11, p<0.01). Although the chi-square value was
significant, this statistic is sensitive to sample size and model complexity; as such, χ2/df was 2.36
(χ2 =25.98; df=11), NNFI was 0.94, and CFI was 0.92, AGFI was 0.93, RMR was 0.002 (<0.05),
the RMSEA was 0.009 (<0.05), indicating satisfactory model fit.
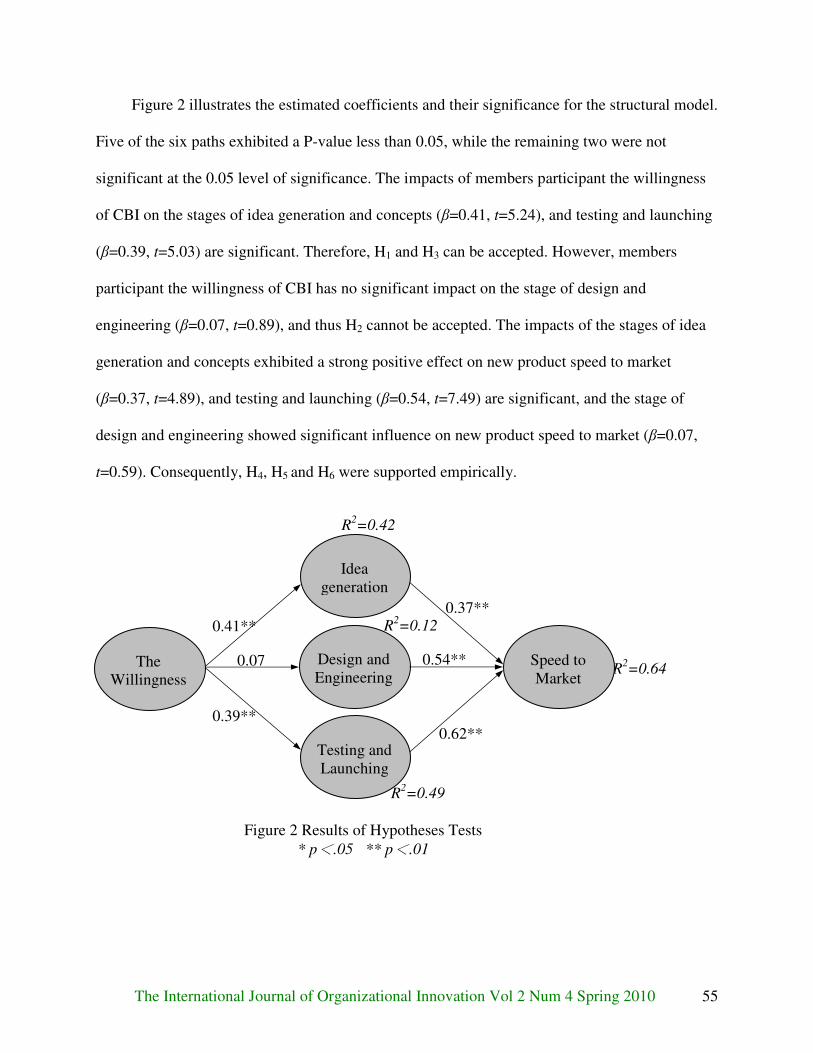
The International Journal of Organizational Innovation Vol 2 Num 4 Spring 2010 55
Figure 2 illustrates the estimated coefficients and their significance for the structural model.
Five of the six paths exhibited a P-value less than 0.05, while the remaining two were not
significant at the 0.05 level of significance. The impacts of members participant the willingness
of CBI on the stages of idea generation and concepts (β=0.41, t=5.24), and testing and launching
(β=0.39, t=5.03) are significant. Therefore, H1 and H3 can be accepted. However, members
participant the willingness of CBI has no significant impact on the stage of design and
engineering (β=0.07, t=0.89), and thus H2 cannot be accepted. The impacts of the stages of idea
generation and concepts exhibited a strong positive effect on new product speed to market
(β=0.37, t=4.89), and testing and launching (β=0.54, t=7.49) are significant, and the stage of
design and engineering showed significant influence on new product speed to market (β=0.07,
t=0.59). Consequently, H4, H5 and H6 were supported empirically.
R2=0.64
0.62**
0.54**
0.37**
R2=0.49
R2=0.12
0.39**
0.07
Figure 2 Results of Hypotheses Tests
* p<.05 ** p<.01
R2=0.42
0.41**
The Willingness
Idea generation
Design and Engineering
Testing and Launching
Speed to Market

The International Journal of Organizational Innovation Vol 2 Num 4 Spring 2010 56
Results
Finally, the explanatory power of the research model also is shown in Figure 3. The R2
values show that the items’ members participant the willingness of CBI account for 42 percent of
the variance of the idea generation and concepts stage, 12 percent of variance of the design and
engineering stage, and 49 percent of the testing and launching stage. And The R2 values show
that the items’ the idea generation and concepts stage, the design and engineering stage and the
testing and launching stage account for 64 percent of the variance of new product speed to
market.
Discussion and Implications
Summary of Results
The contribution of this work is to develop a model that highlights the role of new product
development process as mediators between interaction with customers and speed to the market. We
have developed an interpretation of the model that highlights the importance of formal organization
for successful userer innovation seen from the point of view of established innovating firms. The
findings of this work are as follows. First, the research model was designed to examine the
antecedents of CBI in online communities, and then how firms can interact best with them to get
valuable input for new product development and speed to market. Second, the threat of
competitors getting access to information that should be kept secret and the need to address a
sufficient number of participants from predefined market segments – especially important for the
testing and launching stages – require more careful consideration. Finally, Speed to Market is a
potentially misguided pursuit. Leading companies are investing to achieve mastery of the
product development life cycle. Achieving speed to market is one way companies are leveraging
their improved product development processes for competitive advantage. Speed, however, is
just one dimension -- quality, efficiency and capacity are others -- of this optimization. The

The International Journal of Organizational Innovation Vol 2 Num 4 Spring 2010 57
research found that in new product development's three stages, besides promotes the member to
participate in the new product development ideals generation and concepts stage has the help
regarding speed to market, the research also found that the third and second stage has a more
significant influence with the speed to market. Namely, members participates CBI in the Design,
Engineering, Testing and Launching of new product development process has the very helpful
regarding new product on speed to market. Namely regarding the development and design
suggestions of product prototypes, because the participant need itself has the high specialized
knowledge, but is not the common user rests on its use experience to be able to ford into. In the
testing and launching stage, consumers can become acquainted with the new product and give
their feedback on virtual presentations and test simulations. These ideas were ranked internally
as very attractive by using assessment scales including the dimensions “market potential,”
“degree of newness,” and “technical feasibility.” The presentation of entire product
specifications or finished prototypes by community members has not been seen yet. Such
contributions will require further modifications for the identification of communities, e.g., the
personal contact in closed communities of professional designers and experts, and for improved
incentive systems, e.g., patent sharing. However, the general principles of CBI also can also be
considered in this study.
Implications for Research and Practice
Online communities have gained increasing importance in scholarly and practitioner
writings on the management of innovation. This is because networks are seen as the locus of
innovation. The open innovation model is different. Opposite to the traditional model, the online
community as a form of open innovation based project, targets to undefined objectives, with the
possibility of changing and evolving objectives. Open innovation models also apply to the
The International Journal of Organizational Innovation Vol 2 Num 4 Spring 2010 58
commercialization phase, and companies may spin out already commercialized technologies in
which more value can be realized elsewhere, or acquire already commercialized product lines or
businesses that can provide immediate sources of new growth for the company. Traditionally,
many companies have relied on their internal R&D organizations to fuel innovation, but they
now can augment these efforts by engaging online communities that care about their products to
identify and capture innovations. Many of today's most innovative companies have adopted a
collaborative innovation strategy, one that taps the creativity, ingenuity, and knowledge of their
employees, customers, vendors, partners, suppliers, analysts. Global competition and an
accelerated business cycle make it imperative for companies to enlist their external communities
to collect and evaluate ideas efficiently and transform them into innovation.
In attracting such efforts, the fun-factor and intrinsic stimuli proved to be more important
than monetary incentives to motivate the participants to carry out the presented development
tasks. In this study, an average of 80 percent of the participants signaled their willingness to
support the innovating companies again in future initiatives for NPD. Several interactions over a
certain period of time may lead to a culture of trust and commitment, and the consumer thus
becomes a virtual co-innovator with strong ties to the company and the new product. The four-
step NPD procedure can be interpreted as a first course of interaction between users and the
innovating company. Thereby, companies can establish a “community of innovation” around
their products in development. Looking forward, when companies use online communities for
innovation to a greater extent, a competition for the most qualified users and a market for
sophisticated solutions will arise.
The International Journal of Organizational Innovation Vol 2 Num 4 Spring 2010 59
References
Ahonen, M., Antikainen, M. and Mäkipää, M. (2007). Supporting Collective Creativity within
Open Innovation, European Academy of Management (EURAM) Conference Paris 2007.
Anderson, J. C. and Gerbing, D.W. (1998). Structural Equation Modeling In Practice: A Review
And Recommended Two-Step Approach, Psychological Bulletin, 103(3), 411-423.
Christensen, C. M. (2003). The Growth Paradox, Insights: A publication of the Illinois Society
of CPAs, October.
Fang, E. (2008). Customer Participation and the Trade-Off between New Product Innovativeness
and Speed to Market, Journal of Marketing, 72(4), 90-104.
Füller, J., Jawecki, G. and Mühlbacher, H. (2007). Innovation creation by online basketball
communities, Journal of Business Research, 60, 60–71.
Hienerth, C. (2006). The Commercialization of User Innovations: The Development of the
Rodeo Kayak Industry, R&D Management, 36(3), 273-294.
Kozinets, R. (2002). The Field Behind the Screen: Using Netnography for Marketing Research in
Online Communications, Journal of Marketing Research, 39(1), 61-72.
Mäkipää, M., Ruohonen, M., Riihimaa, J., and Pentikäinen, R. (2005). Converging Mass
Customization and Mass Production – Case Left Foot Company, Proceedings of the MCPC
2005, Hong Kong, 18-21.
Morrison S.F., Cao, W. H. & Madden, C. J. (2004). Dorsomedial hypothalamic and brainstem
pathways controlling thermogenesis in brown adipose tissue, Journal Therm Biol, 29, 333–
337.
Nunnally, J. C. (1967). Psychometric Theory, N.Y.: McGraw-Hill Inc., 226.
Sawhney, M. and Prandelli, E. (2000). Communities of creation: Managing distributed
innovation in turbulent markets, California Management Review, 42(4), 24-55.

The International Journal of Organizational Innovation Vol 2 Num 4 Spring 2010 60
Verona, E., Sachs-Ericsson, N. and Joiner, T. E. (2004). Suicide attempts associated with
externalizing psychopathology in an epidemiological sample, American Journal of
Psychiatry, 161, 444–451.
Von Hippel Eric, (2005). Democratizing innovation, Cambridge, MA: MIT Press.

The International Journal of Organizational Innovation Vol 2 Num 4 Spring 2010 61
QUALITY COST IMPROVEMENT MODELS CONSIDERING FUZZY GOALS
Ming-Chu Weng
The Department of Business Administration
Kun Shan University, Taiwan
Jui-Min Hsiao
The Department of Business Administration
Kun Shan University, Taiwan
Liang-Hsuan Chen
Department of Industrial and Information Management
National Cheng Kung University, Taiwan
Abstract
Decreasing quality cost in the production process is an important issue for an operations manager
in the competitive environment. Traditionally, quality cost includes four main parts, namely
prevention cost, appraisal cost, internal failure cost, and external failure cost. The improvement
of quality cost in general is desirably performed by achieving more than one goal. These goals
possibly conflict with each other, and their levels may be difficult to determine. In order to deal
with this problem, this paper proposes a fuzzy goal programming (FGP) approach to determine
the settings of the associated decisive variables so as to achieve the desirability. The approach is
applicable to resolve multi-objective optimization problems, involving multiple conflicting goals
with imprecise information. In addition, different preemptive priorities of the goals can be
considered in the formulation based on the different importance of each goal, and the optimal
solutions can make the total achievement degrees of all goals maximal. A numerical example is
used to demonstrate the applicability of this approach.
Keywords: Fuzzy Goal Programming; Quality Costs; Decision Making; Fuzzy Sets

The International Journal of Organizational Innovation Vol 2 Num 4 Spring 2010 62
Introduction
Quality costs can be considered as a means for an operations manager to evaluate quality
levels in the operation activities. Several studies have investigated quality cost problems, such as
Oliver and Qu (1999), Halevy and Naveh (2000), and Tkaczyk and Jagla (2001). For the
measurements of quality cost, Giakatis and Rooney (2000) proposed a new method to identify
and measure quality costs. In addition, Tansey et al. (2001) developed new quality scales to
measure quality costs and used statistical analysis to identify the scale’s construct validity,
dimensionality and reliability.
Many authors used different quality cost structures to develop process design/control
models. Bernardo et al. (2001) and Lin and Nam (1999) used Taguchi loss functions to address
process design problems. Jiang and Tsui (2000) developed an average quality cost criterion to
evaluate the performance of statistical process control. Based on internal and external failure
costs, Tang et al. (2003) studied the process control policies and inventory holding time. And
Feiring et al. (1998) suggested a Markov chain model to estimate total failure costs by individual
parts. However, the studies based on quality cost structure to develop quality cost improvement
model are lack.
Traditionally, quality costs include four fundamental cost components: prevention cost,
appraisal cost, internal failure cost, and external failure cost. Prevention cost and appraisal cost

The International Journal of Organizational Innovation Vol 2 Num 4 Spring 2010 63
are considered as controllable variables for achieving the desired levels of the response variables,
i.e., internal failure and external failure costs. Feigenbaum (1974) claimed that as appraisal cost
rise, failure costs tend to fall. This is because more failures are discovered at the earlier stage.
Ittner (1996) indicated that effective prevention investments could reduce both appraisal and
failure costs. Several empirical studies have investigated the relationships among quality cost
components. Chauvel and Andre (1985) developed the relationship between the total quality cost
and prevention and appraisal costs based on correlation analysis. Ittner (1996) and Carr and
Ponemon (1994) applied various statistical techniques to perform hypothesis tests for the
relationship between quality cost components and the improved quality level based on past data
and experience. Krishnamoorthi (1989) applied regression analysis to fit statistical function
models for representing the relations of controllable variables and response variables in terms of
four quality cost components.
For improving quality costs, the use of quantitative relationship models is useful.
However, quality cost models in general are developed based on imprecise cost data (Freeman,
1995; Porter and Rayner, 1992). In addition, from the decision-making viewpoints, several goals
are desirably achieved in the planning stage. The goals may conflict with each other. In order to
deal with these problems, this study proposes a fuzzy goal programming approach to determine
the optimal settings of controllable variables and also maximally satisfy the operations

The International Journal of Organizational Innovation Vol 2 Num 4 Spring 2010 64
manager’s desirability. This model allows managers to consider different importance among
various goals, as well as to consider the fuzziness of each goal.
The remainder of the paper is organized as follows. Section 2 provides a review of
quality cost and various models of quality cost behavior. Fuzzy goal programming model is
formulated in Section 3. Based on the existing quality cost functions (Krishnamoorthi, 1989), a
numerical example is used to demonstrate the proposed model in Section 4. Finally, the
conclusion is presented in Section 5.
A Review of Quality Costs
It is widely recognized that a quality cost system includes all costs associated with
making, finding, repairing, and avoiding defects (Plunkett and Dale, 1988). These costs have
been classified into two categories: controllable and response variables. Controllable variables
have two different types: prevention cost and appraisal cost. Several studies indicated that each
investment in prevention provides a learning opportunity to decrease the future costs of
defectives. It is analogous to a capital investment that provides benefits over multiple periods
(Fine, 1986; Marcellus and Dada, 1991). Prevention cost usually includes employee education,
quality planning, supplier quality assurance, and so on. Appraisal cost is the expenditure incurred
due to the assessment of the products quality to determine their conformance to customers’

The International Journal of Organizational Innovation Vol 2 Num 4 Spring 2010 65
requirements. The costs include inspection labor and material costs as well as the cost of
maintenance test equipment.
Response variables are those required to examine and correct products or services that do
not conform to customers’ specifications. These costs can be classified into two subcategories:
internal failure and external failure costs. Internal failure cost occurs prior to the shipment of
products. Examples are reworking and scrapping costs. Managers often underestimate internal
failure costs or ignore hidden costs incurred within their firms, such as excessive inventory levels
held to accommodate poor quality (Bowman, 1994; Ittner, 1994), schedule changes and
downtime increase because of quality-related problems (Nandakumar et al., 1993), and the
disruptions in operations due to out-of-conformance products (Marcellus and Dada, 1991;
Deming, 1982). External failure cost occurs after the shipment of products. These costs include
warranty cost and complaint investigation (Feigenbaum, 1974). Juran and Gryna (1988) and
Goodstadt and Marti (1990) called external failure costs as intangible quality costs, including the
loss of customer goodwill, customer dissatisfaction costs, and future lost sales.
Typically in quality cost models, the relationship between quality levels and costs is
conveyed graphically (Plunkett and Dale, 1988). The traditional quality cost models portray an
optimal level of quality at the point where the increase of the marginal cost of prevention and
appraisal activities equals the reduction of the marginal benefit from internal and external failure

The International Journal of Organizational Innovation Vol 2 Num 4 Spring 2010 66
costs. Besides, a continuous improvement model (or called dynamic model) argues that the only
optimal point emerges when zero-defects occur, considering that putting enough efforts into
prevention will lead to no defects produced in the operations so as to have the advantages of zero
failure costs and obviating any need for appraisal. Empirical studies by Chauvel and Andre
(1985) and Krishnamoorthi (1989) supported the traditional models. Ittner (1996) and Burgess
(1996) suggested that the traditional model could be an accurate static representation of quality
cost system. Accordingly, this study employs the traditional models to develop a fuzzy goal
programming model for the quality improvements.
Satisfying external customers’ requirements is the most important challenge for a
business unit. Therefore, in general the goal for decreasing external failure costs is more
significant than the others. For reflecting different importance among the goals, this paper
applies a preemptive priority structure for achieving operations managers’ desirability.
Model Formulation
Let xj be the jth controllable item of quality cost variable, j = 1, …, n, and yi be
the response variable i to describe the relationship with controllable quality cost items,
i.e. yi = fi (x1,…, xn), i = 1, …, m. Response variables are considered as the goals for
determining the optimal inputs to achieve the desirable levels of the goals. A goal

The International Journal of Organizational Innovation Vol 2 Num 4 Spring 2010 67
programming model for quality cost improvement can be formulated as follows:
Find x1,…, xn which
maximize the achievements of (y1, …, ym),
subject to yi = fi (x1, …, xn) and jjj x ηε ≤≤ , j =1,…,n, (1)
where jε is the minimum amount needed on the controllable item j for ensuring the process
stability, and jη is the maximum amount that can support the controllable item j due to the
budgetary limitation.
Owing to the imprecise nature of quality costs and the consideration of more than one
improvement goal, a fuzzy goal programming (FGP) model is developed in this study. The FGP
can allow an operations manager to set up a goal linguistically and to determine the priority
among the goals. The objective is to maximize the overall achievement degree for all goals. The
managers first establish the aspiration level for each goal by a linguistic term, for example
“approximately 50%”. Let min
iy represent the aspiration level and max
iy be the maximally
allowable level of the goal iy . Let the vector x denote the controllable quality cost items, i.e., x
= (x1,…, xn). The managers would be completely satisfied with the input (x) at which
min)( ii yy ≤x , while the managers would be completely dissatisfied, if max)( ii yy ≥x . Accordingly,
the achievement degree can be formulated linearly as
The International Journal of Organizational Innovation Vol 2 Num 4 Spring 2010 68
≥
≤≤−
−
≤
=
.)(0
,)()(
,)(1
)(
max
maxmin
minmax
max
min
ii
iii
ii
ii
ii
i
yyif
yyyifyy
yy
yyif
x
xx
x
xµ (2)
where )(xiµ is the achievement degree of the ith goal at x, and can be viewed as the
membership function of the ith goal.
The fuzzy optimization scheme has been proven to be useful in modeling decision-
making problems involving human perception (Zimmermann, 1978; Lee and Wen, 1997). In
order to resolve a fuzzy optimization problem, in general it is reformed as an equivalent crisp
problem. Its objective function can be expressed as a weighted additive model, i.e.,
)(1
x∑ ==
m
i iiwz µ , where wi denotes the weight (the relative importance) of the ith fuzzy goal
with ∑ ==
m
i iw1
1 (Tiwari et al., 1987; Hannan, 1981). A major limitation of applying the
weighted additive model is that the model may produce undesirable solutions when the weights
are changed, as illustrated in Chen and Tsai (2001). Instead, the model proposed in this paper
takes into account that the goal with relatively high importance has a higher achievement degree
than the others, i.e., x)(x)( ki µµ ≥ , where the ith goal is more important than the kth one. Thus
the objective can be formulated as a simple additive function, which is suitable for showing the
overall achievement degree associated with multiple goals (Tiwari et al., 1987). The FGP model
can be expressed as

The International Journal of Organizational Innovation Vol 2 Num 4 Spring 2010 69
Maximize )x(1∑ =
m
i iµ (3)
subject to membership functions )x(iµ , i = 1,…,m,
system constraints, i.e., the allowable range of each controllable quality cost item, and
preemptive priorities of the goals, i.e., x)(x)( ki µµ ≥ ki ≠ , i, k = 1,…,m.
An Illustrative Example
The inputs of the FGP model are controllable quality cost items. They can
be the items in the prevention cost category, e.g., t raining, preventive
maintenance, quali ty engineering and so on, or the appraisal cost category, e.g. ,
inspection, quality audits , lab tests, and so on. For simplicity, without the loss
of generality, we adopt two aggregated costs as quality cost input variables,
proposed by Krishnamoorthi (1989), for illustration. Based on an empirical
study for industries, two quality cost relation functions are constructed as
21
1
2989.5
xxy += and (4)
2
1
2 213.0121
xx
y += , (5)
where 1x , 2x , 1y , and 2y denote prevention cost, appraisal cost, external failure cost and
internal failure cost, respectively, which are expressed as percentages of the total quality cost.
Equation (4) expresses external failure cost ( 1y ) as a function of prevention ( 1x ) and appraisal

The International Journal of Organizational Innovation Vol 2 Num 4 Spring 2010 70
( 2x ), indicating that 1y is inversely related to 1x and 2x . The large coefficient of 1/ 2x implies
that most of the decrease in 1y could be achieved from 2x . This means that the input of
prevention cost will have few impacts, while appraisal cost must be increased to reduce most of
external failure cost. Equation (5) indicates that internal failure cost is reduced much more than
external failure cost by an increase in prevention cost. Note that the increase in appraisal cost
tends to increase the internal failure cost, although the amount is little.
Suppose that an operations manager faces with the above quality cost relationships, and
external failure cost in Equation (4), internal failure cost in Equation (5), and controllable costs
are desirably minimized. They are defined as three goals, i.e., 1y , 2y , and y3= x1+ x2. Obviously,
these goals are conflicting and cannot be achieved simultaneously. Therefore, the priority order
is set as 1y , 2y , and y3. The achievement of the three goals can make the total quality cost
minimal, considering the determined priorities. Assume that the total quality cost is 10% of the
sales revenue, i.e., $100,000. The present prevention cost, appraisal cost and failure cost as
percentages of the total quality cost are 10%, 25% and 65%, respectively. Actually, this
allocation is often quoted as the norm for non-quality-enlightened organizations (Oakland,
1993).
This quality improvement problem involves three conflicting goals and will be resolved
by maximizing the overall achievement degree of goals. First, suppose the minimum amounts,

The International Journal of Organizational Innovation Vol 2 Num 4 Spring 2010 71
$5,000 and $12,000, should be invested on the purposes of prevention and appraisal,
respectively, to ensure process stability. In other words, 5 percent expenses on prevention
( 1ε =5%) and 12 percent expenses on appraisal ( 2ε =12%) are necessary. However, the expenses
cannot be greater than $15,000 and $30,000 (i.e., 1η =15%, 2η =30%), respectively, because of
the budgetary limitation. For implementing FGP, the aspiration level and maximally allowable
level of each goal yi (i.e., min
iy and max
iy ) should be determined beforehand. Although these two
levels can be determined subjectively, the model may produce an infeasible solution region, if
the levels seriously violate the system restrictions. To avoid this problem, we optimize each
individual goal to obtain the corresponding maximal achievement degree under the system
restrictions, and also determine the lowest achievement degree of each goal by using the input
variable solutions produced in optimizing the other goals. Thus the two levels of yi can be found
as follows: (10.33, 26.01) for y1, (10.62, 26.76) for y2, and (17, 45) for y3. Using the above
ranges, the associated membership functions, formulated as Equation (2), can be built up.
Based on the preemptive priority structure of the goals, their membership function
relationships in FGP can be represented as x)(x)( 21 µµ ≥ , and x)(x)( 32 µµ ≥ . Finally, a crisp
optimization model can be formulated as follows,
Maximize ++ x)(x)( 21 µµ )x(3µ

The International Journal of Organizational Innovation Vol 2 Num 4 Spring 2010 72
subject to
<≤≤<<≤≤<
≤≤≤≤
≥≥
−
+−≤
−
⋅+−≤
−
+−≤
10030120 ; 1001550
1x)(0 ; 1x)(0
x)(x)(x);(x)(
1745
)(45)x(
62.1076.26
)213.0/121(76.26)x(
33.1001.26
)/298/9.5(01.26)x(
21
21
3221
213
212
211
xx
xx
xx
xx
µµ
µµµµ
µ
µ
µ
(6)
We solve the above nonlinear programming problem using a computer software package,
namely GINO. The best compromise solutions of prevention and appraisal are 13.18 and 22.63
percents, respectively. This indicates that the optimum policy for minimizing quality cost needs
to increase the prevention percentage from the present 10% to 13.18% (i.e., $13,180), while
appraisal expense should be decreased to 22.63% from 25%. The achievement degrees of three
goals are 1µ =0.79, 2µ =0.79 and 3µ =0.33. The value of each goal is y1=13.62, y2=14, and
y3=35.81. This policy can be expected to result in a 36.57 percent reduction of total quality cost.
As mentioned before, external failure cost is more important than the others. Suppose
operations managers desire to raise its achievement degree (i.e., 1µ ) in order to make external
failure cost decreased. However, the increase of 1µ should have influences on the other quality
costs. For investigating the influences of different achievement degrees 1µ on the other quality
costs, several different degrees ( 1µ =0.8, 0.85, 0.9, 0.95) are used. Figures 1 to 3 at the end of this
paper depict the changes of total quality cost, prevention cost and appraisal cost when different

The International Journal of Organizational Innovation Vol 2 Num 4 Spring 2010 73
degrees of 1µ are desired. The results show that the changes of total quality cost, prevention cost
and appraisal cost when different degrees of 1µ are desired. The larger the achievement degree
of 1µ , the higher total quality cost is. This is because prevention cost and appraisal cost also
increase. The figures indicate that prevention cost can only be increased to $15,000 when
1µ =0.85, due to budgetary limitation, while appraisal cost is continuously increased to reduce
most of external failure cost.
Concluding Remarks
Quantitative relationship functions among the quality cost components are useful for
quality improvement decisions. An operations manager often desires to achieve more than one
goal for the improvements. From the practices, multiple goals may conflict with each other, and
the goal levels are not easy to be determined exactly. This study proposes a fuzzy goal
programming model to formulate the quality improvement problems involving conflicting goals.
The model allows managers to establish the aspiration level and maximally allowable level of
each goal, which can be formulated as a membership function to express the achievement degree
of the goal. In addition, it allows managers to specify the preemptive priority of all goals. Based
on the existing statistical functions of quality cost, an example is used to illustrate the feasibility
of the proposed model.
The International Journal of Organizational Innovation Vol 2 Num 4 Spring 2010 74
References
Bernardo, F.P., Pistikopoulos, E.N. and Saraiva, P.M. (2001), “Quality costs and robustness
criteria in chemical process design optimization”, Computers and Chemical Engineering,
Vol. 25, pp. 27-40.
Bowman, R.A. (1994), “Inventory: the opportunity cost of quality”, IIE Transactions, Vol. 26
No. 3, pp. 40-47.
Burgess, T.F. (1996), “Modeling quality-cost dynamics”, International Journal of Quality &
Reliability Management, Vol. 13 No. 3, pp. 8-26.
Carr, L.P. and Ponemon, L.A. (1994), “The behavior of quality costs: clarifying the confusion”,
Journal of Cost Management, Summer, pp. 26-34.
Chauvel, A.M. and Andre, Y.A. (1985), “Quality cost: better prevent than cure”, Quality
Progress, September, pp. 29-32.
Chen, L.H. and Tsai, F.C. (2001), “Fuzzy goal programming with different importance and
priorities”, European Journal of Operational Research, Vol. 133, pp. 548-556.
Deming, W.E. (1982), Quality, Productivity, and Competitive Position, MIT Center for Advanced
Engineering, Cambridge, Mass.
Feigenbaum, A.V. (1974), Total Quality Control, New York, McGraw-Hill.
Feiring, B.R., Sasfri, T.C.P., Rao Tummala, V.M. and Mak, R.W. (1998), “Modeling the cost of
poor quality in a five-state part manufacturing operation: a case study”, Journal of the
Operational Research Society, Vol. 49, pp. 1249-53.
Fine, C.H. (1986), “Quality improvement and learning in productive systems”, Management
Science, Vol. 32 No. 10, pp.1301-15.
Freeman, J.M. (1995), “Estimating quality costs”, Journal of the Operational Research Society,
Vol. 46, pp. 675-86.

The International Journal of Organizational Innovation Vol 2 Num 4 Spring 2010 75
Giakatis, G. and Rooney, E.M. (2000), “The use of quality costing to trigger process
improvement in an automotive company”, Total Quality Management, Vol. 11 No. 2, pp.
155-70.
Goodstand, P. and Marti, R. (1990), “Quality service at National Westminster Bank: the
continual striving for excellence”, International Journal of Quality & Reliability
Management, Vol. 7, pp. 19-28.
Halevy, A. and Naveh, E. (2000), “Measuring and reducing the national cost of non-quality”,
Total Quality Management, Vol. 11 No. 8, pp.1095-110.
Hannan, E.L. (1981), “Linear programming with multiple fuzzy goals”, Fuzzy sets and Systems,
Vol. 6, pp. 235-48.
Ittner, C.D. (1996), “Exploratory evidence on the behavior of quality costs”, Operations
Research, Vol. 44 No. 1, pp. 114-30.
Ittner, C.D. (1994), “An examination of the indirect productivity gains from quality
improvement”, Production and Operations Management, Summer, pp. 153-70.
Jiang, W. and Tsui, K.-L. (2000), “An economic model for integrated APC and SPC control
charts”, IIE Transactions, Vol. 32, pp. 505-13.
Juran, J.M. and Gryna, F.M. (1988), Quality Control Handbook, 4th ed., New York, McGraw-
Hill.
Krishnamoorthi, K.S. (1989), “Predict quality cost changes using regression”, Quality Progress,
December, pp. 52-55.
Lee, C.S. and Wen, C.G. (1997), “Fuzzy goal programming approach for water quality
management in a river basin”, Fuzzy Sets and Systems, Vol. 89, pp. 181-92.
Lin, J. and Nam, S.-H. (1999), “Regulated quality diffusion under quadratic costs”, International
Transactions in Operational Research, Vol. 6, pp. 393-409.

The International Journal of Organizational Innovation Vol 2 Num 4 Spring 2010 76
Marcellus, R.L. and Dada, M. (1991), “Interactive process quality improvement”, Management Science,
Vol. 37 No. 11, pp.1365-76.
Nandakumar, P., Datar, S.M. and Akella, R. (1993), “Models for measuring and accounting for cost of
conformance quality”, Management Science, Vol. 39 No. 19, pp. 1-16.
Oakland, J.S. (1993), Total Quality Management, 2nd ed., Oxford, Butterworth -Heinemann.
Oliver, J. and Qu, W. (1999), “Cost of quality reporting: some Australian evidence”, International
Journal of Applied Quality Management, Vol. 2 No. 2, pp. 233-50.
Plunkett, J.J. and Dale, B.G. (1988), “Quality costs: a critique of some economic cost of quality models”,
International Journal of Production Research, Vol. 26 No. 11, pp. 1713-26.
Porter, L.J. and Rayner, P. (1992), “Quality costing for total quality management”, International Journal
of Production Economics, Vol. 27, pp. 69-81.
Tang, K., Gong, L. and Chang, D.-S. (2003), “Optimal process control policies under a time-varying cost
structure”, European Journal of Operational Research, Vol. 149, pp. 197-210.
Tansey, R., Carroll, R.F. and Lin, Z.J. (2001), “On measuring cost of quality dimensions: an exploratory
study in the People’s Republic of China”, International Business Review, Vol. 10, pp. 175-95.
Tiwari, R.N., Dharmar, S. and Rao, J.R. (1987), “Fuzzy goal programming-an additive model”, Fuzzy
Sets and Systems, Vol. 24, pp. 27-34.
Tkaczyk, S. and Jagla, J. (2001), “The economic aspects of the implementation of a quality system
process in Polish enterprises”, Journal of Materials Processing Technology, Vol. 109, pp. 196-
205.
Zimmermann, H.J. (1978), “Fuzzy programming and LP with several objective functions”, Fuzzy Sets and
Systems, Vol. 1, pp. 45-55.

The International Journal of Organizational Innovation Vol 2 Num 4 Spring 2010 77
Figure 1. The changes of total quality cost with different achievement degrees of external
failure cost
0.8 0.85 0.9 0.95 60
62
64
66
68
Achievement degree of external failure costs
%
Total quality cost

The International Journal of Organizational Innovation Vol 2 Num 4 Spring 2010 78
Figure 2. The changes of prevention cost with different achievement degrees of external
failure cost
Achievement degree of external failure costs 0.8 0.85 0.9 0.95
13
14
15
%
Prevention cost

The International Journal of Organizational Innovation Vol 2 Num 4 Spring 2010 79
Figure 3. The changes of appraisal cost with different achievement degrees of external failure
cost
0.8 0.85 0.9 0.95 13
14
0.8 0.85 0.9 0.95 22
23
24
25
26
27
Achievement degree of external failure costs
%
Appraisal cost

The International Journal of Organizational Innovation Vol 2 Num 4 Spring 2010 80
INNOVATION CAPABILITY AND PERFORMANCE IN TAIWANESE
SCIENCE PARKS: EXPLORING THE MODERATING EFFECTS OF
INDUSTRIAL CLUSTERS FABRIC
Ming-Tien Tsai
Department of Business Administration
National Cheng Kung University, Taiwan
Chung-Lin Tsai
Department of Finance
Chang Jung Christian University, Taiwan
Abstract
This paper examines the impact of the innovation capability on business performance. Through
empirical study, it revealed that the innovation capability has a significant positive effect on
business performance. Value chain cluster in the fabric of industrial clusters has a moderating
effect on the innovation capability and performance of businesses. Since science parks promoted
business performance, construction of more industrial clusters should be a future trend.
Keywords: Innovation Capability, Industrial Clusters, Science Park, Performance

The International Journal of Organizational Innovation Vol 2 Num 4 Spring 2010 81
Introduction
Science's and technology's international competition is day by day intense with the
advent of its rapid development and the arrival of globalized time. Governments around the
world share a general consensus on seeking the country economic progress and the
comprehensive national strength enhancement based on science and technology development.
Facing the global intense economic competition challenge, the economy of Taiwan has also
entered a new era of reliance on advancements in science and technology to promote
development. To attract the foreign country high-tech enterprises’ investments and technology
transfer, the government must provide an industrial cluster space to achieve economies of scale
to reduce infrastructure costs such as staff training, factory, and land while also enjoying the
cluster economic benefits in the dissemination of technological innovations. According to the
2007-2008 Global Competitiveness Report published by the 2009 World Economic Forum
(WEF), Taiwan has again taken first place worldwide in the “state of cluster development”
index. The comparison total score 5.7 points (perfect score 7 points) shows an increase of 0.18
points from 5.52 points the previous year and indicates its outstanding industrial cluster. The
international competitiveness of Taiwan’s industrial clusters has continuously improved. It
placed second on this index from 2001 to 2003 and third from 2003 to 2004, climbed again to the
second place from 2004 to 2005 and stayed on from 2005 to 2006 and finally earned the first

The International Journal of Organizational Innovation Vol 2 Num 4 Spring 2010 82
place in the world from 2006 to 2007 which continued occupying the leading position from 2007
to 2008, making this the most superiority project among the indices for Taiwan’s
competitiveness.
On the other hand, under the progress of the economy unceasingly, industries in Taiwan
have gradually advanced from being manufacturing-oriented to investment-oriented. The
innovative capabilities and advantages have already been considered an important link to the
investment development in industrial technology policies. Innovation can strengthen the
flexibility of organizations and adaptive faculty towards the environment (Geroski, 1995).
Undeniably, effectively developing an excellent innovation capability is already one significant
issue which could not be evaded for enterprises for adapting to globalization and the highly
dynamic competitive market environment, making this an important research subjects in the
academia (Shane and Ulrich, 2004).
Afuah (2002) theory viewpoint revealed that although the innovation be introduced and
applied to new products and processes but more important is the manufacturer must connect the
innovation with exterior market to achieve a favorable achievement. According to James (2002)
research, innovation activities have evident regional differences and their effects in various
regions are also diverse which results from the dissimilarities in methods and weights attached to
their composite elements. Thus, this study examines the impact of the maturity of the innovation

The International Journal of Organizational Innovation Vol 2 Num 4 Spring 2010 83
capability and industrial clusters on the operation efficiency of firms in Taiwan’s science parks.
Findings from this study can be utilized by countries worldwide when planning for industrial
clusters in science parks and offers recommendations concerning the operations of firms located
in science parks.
Literature Review and Hypothesis
Innovation Capability
Regardless of from which point of view innovation is looked at, if firms intend to
innovate and improve their innovation performance, they must have innovation capability. Adler
and Shenbar (1990) defined innovation capability as the ability to develop and respond and
identified its four dimensions: (1) ability to develop new products that meet market needs; (2)
ability to apply appropriate process technologies to producing these new products; (3) ability to
develop and adopt these new products and process technologies to satisfy future needs; and (4)
ability to respond to related technology activities and unexpected activities created by
competitors. From this definition, it can be observed that the aim of innovation capability is to
apply a set of appropriate process technologies to producing new products that meet market
needs and at the same time, to be able to respond to unexpected technology activities and
competitive conditions. In other words, innovation capability not only resolves present problems

The International Journal of Organizational Innovation Vol 2 Num 4 Spring 2010 84
on products and processes of enterprises, but must also be able to respond to changes in the
external environment.
Guan and Ma (2003) proposed that innovation capability is a special asset of a firm. This
ability to quickly introduce new products and adopt new processes is very important for firms to
compete. They classified innovation capability into seven dimensions: learning, research and
development, manufacturing, marketing, organizational, resources exploiting, and strategic. In
line with this, Yam et al., (2004) suggested the concept of technological innovation capabilities
(TICs). They believed TICs are a kind of special assets or resources that include technology,
products, processes, knowledge, experience, and organization. Drucker (2006) suggested
developing a superior innovation capability as an important market strategy. That is, firms
transform competitive threats derived from changes in the environment into profits in the face of
highly uncertain market environments. The study of Tidd and Bessant (2009) concluded that
firms with a high degree of innovation capability are on average twice as profitable as other
firms.
Various researchers have offered different views on the categories of innovation
capability. Moore (2004) distinguished innovation capability into disruptive, applicative,
product, process, marketing, structural, and business model capabilities as he connected these
with the market development life cycle. In a study on high-tech firms in Taiwan, Chuang (2005)

The International Journal of Organizational Innovation Vol 2 Num 4 Spring 2010 85
categorized technological innovation as product and process innovations and administrative
innovation as staff innovation, marketing innovation, and organization structure innovation. Tsai
et al. (2001) believed innovation capability must be the administrative innovation of business
activities such as planning, organization, employment, leadership, and control and technological
innovation of products, processes and facilities obtained by firms from the outside and produced
within. Lin et al. (2004) proposed that aside from the technical aspect of products and processes,
innovation must also refer to changes or breakthroughs in administrative procedures and
management methods. Although there are many types of innovation capability, since the
statistical analysis of this study focuses on convergence, the study employed technology
innovation and management innovation, two innovation capabilities with more direct correlation
with business decisions of firms, as dimensions.
Industrial Clusters
The term ‘industrial cluster’ refers to the firms and institutions in close proximity to
each other in a particular field and area maintaining an interactive relationship, influencing and
supporting each other, where production efficiency is achieved and externalities are created
through a fine division of labor. From this, small firms are also able to achieve economies of
scale in production as enjoyed by large firms and at the same time, these production networks
The International Journal of Organizational Innovation Vol 2 Num 4 Spring 2010 86
encourage mutual learning and collaborative innovation and form more flexible production
systems (Porter, 1998; Rosenfeld, 1997; Swann and Prevezer, 1996).
Discussion on clusters can be traced back to the concept of ‘cluster economy’
extended by Marshall (1890). It emphasized that external economies and economies of scale
produced from the proximity of firms within an area reduce production and transaction costs
through the sharing of infrastructures, technology labor, and resources. Thus, external economies
and reduction of transaction costs are main factors of industrial clustering. Aside from these
economic reasons, lots of literature also stressed on the importance of social and culture factors.
Clusters are formed when actors or communities possessing innovation and management
capabilities exchange uncodified knowledge which results from the need to frequently interact
face-to-face in order to solve technology and management problems during industrial
development in an environment where collaborative relationships among firms; local firms
having common development goals, common views, values, norms, and support; and social
structures supporting local industry development termed as institutional thickness (Storper and
Salais, 1997; Saxanian, 1994) exist. Some scholars also believed clusters result from the
coincidence of several events. Once specialized clusters are formed, external economies of scale
are generated while promoting or maintaining the sources of external economies like the labor

The International Journal of Organizational Innovation Vol 2 Num 4 Spring 2010 87
market, specialized suppliers, and technology spillovers (Boschma and Lambooy, 1999; Cooke
et al., 1998).
Furman et al. (2002) indicated that industrial clusters are most advantageous for
industrial innovation. The competitive pressures and market opportunities experienced by
geographically proximate firms within the cluster are more visible and the rapid flow of
information and human resources is beneficial to introducing industry knowledge spillovers and
strengthening the advantage of industrial innovation. Moreover, within regional clusters, firms
can benefit from agglomeration economies and spillover effects stimulated, for example, through
labor force training or mobility, paid access to market information, collaborative relationships
with nearby research institutions, or the exchange of tacit knowledge (Shapira, 2008).
With regards to measuring the effects of industrial clusters, Anderson (1994) outlined
three types of industrial clusters while various other scholars have also proposed similar views in
recent years. This study summarized them as follows. The first category of industrial clusters is
buyer-supplier relationships. This industrial cluster is characterized by collaborative vertical
relationships of upstream suppliers and downstream buyers. It is a value chain cluster (e.g.,
Anderson, 1994; Porter, 1998; Feser and Bergman, 1999; Brenner, 2005) comprised of suppliers
of materials, related industries, places, and customers. Under the second category, competitor
and collaborator relationships, industrial clusters are formed from firms producing identical or

The International Journal of Organizational Innovation Vol 2 Num 4 Spring 2010 88
similar products and services. Here, relationships exist because competitors frequently share
information concerning products and production processes to innovate opportunities in the
market (e.g., Anderson, 1994; Porter, 1998; Feser and Bergman, 2000; Kim, 2003). The third
type refers to shared-resource relationships. Here, industrial clusters are referred to as social
entities composed of firms within a region where various resources such as technology,
knowledge, stock of product, infrastructure, and place are shared (e.g., Anderson, 1994; Porter,
1998; Rosenfeld, 2002; Morosini, 2004). From these, this study focused on three categories for
evaluating industrial clusters, namely: value chain clusters, coopetition clusters, and shared-
resource clusters.
Business Performance
Traditional performance assessment systems often stress on the “outcome” and not on
the “process,” easily overlooking conflicts caused by changes in the external environment.
Key factors for business success are not grasped, firms thus failing to achieve the ultimate goal
of performance assessment and losing its significance in management. Thus, the concept of
balanced scorecard has been increasingly employed for performance assessment. The balanced
scorecard (BSC) is both a performance framework and a management methodology. It was
developed by Robert Kaplan and David Norton after an extensive research project in 1990
(Voelker et al., 2001). The BSC is essentially a customized performance measurement system

The International Journal of Organizational Innovation Vol 2 Num 4 Spring 2010 89
that goes beyond conventional accounting and is based on organizational strategy. Kaplan and
Norton (1996) performed a study on future performance assessment system in all kinds of
industry by gathering the opinions from researchers and workers. Eventually, they came up with
the framework of balanced scorecard. This is a suite of new methodologies measuring firms’
short- and long-term achievements and a tool that can be used for planning strategies and
management decisions to measure performance in order to meet the demand of performance
measurement and management and improve weaknesses caused by traditional performance
assessment.
Traditional accounting-based performance measures evaluate business performance from
a financial viewpoint. However, in addition to a financial perspective, the balanced scorecard
also incorporated three other perspectives: customers, business processes, and growth and
learning. Aside from measuring tangible and intangible assets, the balanced scorecard also
evaluates whether strategies are effective. The four perspectives are described in detail as
follows:
(1) Financial Perspective
The financial perspective typically considers analysis of certain lagging indicators,
usually financial ratios and data that report on past performance. These include return on equity,

The International Journal of Organizational Innovation Vol 2 Num 4 Spring 2010 90
return on assets, net income, revenue, and cash flow information. Consideration of this
information has been a long-standing tradition in management of a firm (Bible et al., 2006).
(2) Customer Perspective
Businesses must first distinguish among markets and customers and measure their
performance in these areas. Indicators include market share ratio, customer satisfaction,
continuation of customers, acquirement of customers, and profitability of customers. The
balanced scorecard can assist firms in clearly identifying these indicators, seeking measuring
standards, and exerting control over these.
(3) Internal Business Process Perspective
Management needs to control essential internal processes to provide value and attract
their customers in the target market. Kaplan and Norton (1996) considered that management at
this perspective must establish the firm’s important internal processes which through
improvements in internal procedures, assist them in creating customer value and reach the
financial returns expected by shareholders. Indicators include innovation process, operation
process, and customer service process.
(4) Learning and Growth Perspective
Kaplan and Norton (1996) believed that the learning and growth perspective identifies
infrastructure that must be built to create long-term growth and improvement of innovative

The International Journal of Organizational Innovation Vol 2 Num 4 Spring 2010 91
companies. The balanced scorecard proposes that focus should not be only on investing in new
products and new facilities; organizations must also invest in people, systems, and processes.
Basing on experience with the BSC, Kaplan and Norton (1996) categorized this perspective into
three aspects: ability of employees, ability of information systems, and incentive, authority, and
fitness.
The Relationship between Innovation Capability and Industrial Clusters
on Business Performance
This study primarily examined the degree of innovation capability in firms and its impact
on business performance in regional innovation systems and industrial clusters. First, on the
matter of innovation capability and business performance, Garcia-Morales et al. (2007) pointed
out that technological organization with greater organizational innovation capability achieves a
better response from the environment, obtaining more easily the capabilities needed to increase
organizational performance and consolidate a sustainable competitive advantage. Moreover,
many systematic researches seem to reveal a positive relationship between innovation and
performance in businesses (Zangwill, 1992; Garcia-Morales et al., 2007; Koellinger, 2008).
From the above findings, the following hypothesis can be derived.
Hypothesis 1: Innovation Capability has a positive effect on Business Performance.
H1-1: Innovation Capability has a positive effect on Performance of Financial
Perspective.
H1-2: Innovation Capability has a positive effect on Performance of Customer
Perspective.

The International Journal of Organizational Innovation Vol 2 Num 4 Spring 2010 92
H1-3: Innovation Capability has a positive effect on Performance of Internal Business
Process Perspective.
H1-4: Innovation Capability has a positive effect on Performance of Learning and
Growth Perspective.
On the aspect of industrial clusters and business performance, Morosini (2004) believed
that if firms located in advanced country regions can be effective in promoting cooperation, this
has a significant performance-enhancing effect on their performance. Moreover, he also viewed
the cluster’s underlying social fabric has a potential for innovation and knowledge creation and
at the same time, elements such as competitive factors, geographic closeness, and degree of
knowledge integration within industrial regions produce a positive impact on the economic
performance of industrial clusters. Lai et al. (2005) argued that innovative activity comes from
direct contact with a variety of sources (e.g. suppliers, customers, competitors, and providers of
different kinds of services). Industrial clusters that accumulate high levels of innovative success
have assembled information that facilitates the next round of innovation, since the ability to
innovate successfully would be a function of the technological levels already achieved. From the
above findings, the following hypothesis can be derived.
Hypothesis 2: Industrial Clusters have a significant moderating effect between Innovation
Capability and Business Performance.
H2-1: Value Chain Clusters have a significant moderating effect between Innovation
Capability and Business Performance.
H2-2: Coopetition Clusters have a significant moderating effect between Innovation
Capability and Business Performance.

The International Journal of Organizational Innovation Vol 2 Num 4 Spring 2010 93
H2-3: Shared-Resource Clusters have a significant moderating effect between Innovation
Capability and Business Performance.
Method
Sample and Data Collection
Questionnaires were distributed to firms located in large science park in Taiwan, while
sampling was performed on the top managers from these firms. Taiwan has three science parks
presently including Hsinchu Science Park, Central Taiwan Science Park, and Southern Taiwan
Science Park, and the Hsinchu Science Park is the biggest. In the sampling design, this study
sampled the top 300 firms located in the Hsinchu science parks in Taiwan. Companies were first
contacted by phone in July 2008 to obtain their willingness to participate in the study. Upon
confirmation, questionnaires were then distributed by post. A total of 86 questionnaires were
collected until the end of December 2008, 82 of which were valid, giving a response rate of
27.3%.
Measurement Scales
This study constructed the questionnaire based on previous research on innovation
capability, industrial clusters, and business performance and modified for adaptation to the
context. SPSS17.0 was employed to conduct tests on the hypotheses. The questionnaire of this
study was tested with a high reliability and validity, as shown in Table 1.

The International Journal of Organizational Innovation Vol 2 Num 4 Spring 2010 94
To ensure that the survey design has a high degree of reliability and validity, this study
conducted reliability, validity, and factor analysis tests. This study employed construct validity
and criterion validity to evaluate the validity of the questionnaire. Zaltman and Burger (1975)
and Kerlinger and Lee (2000) proposed a method of selecting factor dimensions using principal
components analysis. Factors selected must conform to these conditions: (1) factor loadings must
be greater than 0.5; (2) rotation sums of squared loadings must be more than 50%; and (3)
Kaiser-Meyer-Olkin measure of sampling adequacy must be greater than 0.7. When these
conditions have been met, the test is considered stable. It can be seen on Table 1 that the validity
value of this study exceeded that of the standard value. In measuring reliability, Nunnally (1978)
proposed Cronbach's α coefficient as a measure of reliability; α coefficient greater than 0.7 is
high reliability while less than 0.35 is low reliability. From Table 1, it can be seen that the
composite reliability values are larger than 0.7, showing that this study has high reliability.
Table 1: Summary of validity and reliability analysis
Construct Validity Criterion validity
KMOa
Rotation Sums of Squared Loadings
Factor Loading Reliability
Innovation Capability 0.929*** 83.34% 0.689~0.892 0.937
Industrial Clusters 0.823*** 75.88% 0.606~0.875 0.901
Business Performance 0.919*** 81.79% 0.651~0.883 0.926
Note: a. Kaiser-Meyer-Olkin (KMO) is measure of sampling adequacy. b. *** denote significance at the 0.1% level.
Data Analysis and Results
Innovation Capability and Business Performance

The International Journal of Organizational Innovation Vol 2 Num 4 Spring 2010 95
Table 2 shows the results of multiple regression analyses. It can be seen here that the
innovation capability of sample firms has a positive effect on business performance. Within this,
technology innovation capability and management innovation capability have a positive impact
on performance perspectives such as financial, customer, internal business process, and learning
and growth. Thus, Hypothesis 1 is confirmed.
Table 2: Multiple regression results of Business Performance on Innovation Capability
Business Performance Financial Customer
Internal Business Process
Learning and Growth
Innovation Capability
Technology Innovation 0.346*** 0.339*** 0.248*** 0.203** Management Innovation 0.193** 0.274*** 0.362*** 0.307***
Adj. R2 0.247 0.261 0.258 0.183 F 21.732*** 24.963*** 23.877*** 16.379***
Notes: 1. ** and *** denote respectively significance at the 0.5% and 0.1% level. 2. The regression coefficients in the table are standardized.
Moderating Role of Industrial Clusters
To address changes in the impact of innovation capability, industrial clusters, and
regional innovation systems on business performance due to firm age and size, this study
employed a firm’s history and number of employees as control variables proposed by several
researchers (Li and Atuahene-Gima, 2001; Bharadwaj and Menon, 2000) to examine the
moderating effect of industrial clusters and regional innovation systems.

The International Journal of Organizational Innovation Vol 2 Num 4 Spring 2010 96
Before conducting moderating effect analysis, this research considered the question of
collinearity between these independent variables which possibly have significant correlations
between them. Therefore, before hierarchy regression analysis is performed, this research
separately subtracts each arithmetic mean from the factors of the innovation capability and the
industrial clusters and contains the interaction items between them. The scholar, Neter et al.
(1996), suggested the collinearity examination by Variance Inflation Factors and the path of the
VIF. If the VIF value is greater than 10, collinearity exists in the model. Otherwise, non-
collinearity exists.
Table 3 shows the results of hierarchical regression analyses. Several models are
estimated in this set of analyses. Model 1 includes control variables only. Model 2 reports the
direct effects of innovation capability on business performance. Model 3 tests the moderating
effects of industrial clusters. Model 4 tests the moderating effects of both industrial clusters and
interaction items. In addition, each VIF values of the Model 4 on Table 3 were discovered
smaller than 10 and demonstrated non-collinearity on this level of hierarchy regression.
From the Model 4 in Table 3, it can be seen that the interaction items of innovation capability
and value chain clusters has a positive moderating effect (β=0.262, p<0.05) on business
performance. In other words, if firms have a high degree of innovation capability and highly

The International Journal of Organizational Innovation Vol 2 Num 4 Spring 2010 97
concentrated value chain clusters within the industry, then these can be effective on the firms’
performance. Thus, Hypothesis 2 offers partial support (Hypothesis 2-1 is confirmed).
Table 3: Hierarchical regression results of Business Performance on Innovation
Capability and Industrial Clusters
Model 1 Model 2 Model 3 Model 4
Model 4 VIF
Control variables
Company's History 0.083 0.037 -0.006 -0.019 1.126
Number of Employees 0.176* 0.125 0.117 0.036 1.364
Independent variables
Innovation Capability(IC) 0.273** 0.251** 0.232** 2.683
Moderating Variables
Value Chain Clusters 0.262** 0.243** 1.974
Coopetition Clusters 0.086 0.088 1.962
Shared-Resource Clusters 0.113 0.073 1.941
IC×Value Chain Clusters 0.281** 2.342
IC×Coopetition Clusters -0.102 2.069
IC×Shared-Resource Clusters
-0.007 1.866
R2 0.167 0.268 0.341 0.422
F 18.428*** 22.573*** 17.139*** 12.313***
∆R2 0.167 0.101 0.073 0.082
∆F 18.428*** 12.316*** 7.449** 7.725**
Notes: 1. *, ** and *** denote respectively significance at the 0.1%, 0.5% and 0.01% levels, respectively. 2. The regression coefficients in the table are standardized.
Discussion, Implications and Limitations
The concepts of industrial clusters emphasize that through the close social networked
systems composed of actors from various firms, internal and external resources and information
are easily obtained, diffused, and gathered to build innovation and other capabilities in firms
(Morosini, 2004; Asheim, 2007). Empirical results show a positive relationship existing between
innovation capability and business performance, corresponding to arguments of a number of

The International Journal of Organizational Innovation Vol 2 Num 4 Spring 2010 98
researchers (e.g., Zangwill, 1992; Garcia-Morales et al., 2007; Koellinger, 2008). Further
analysis shows that when innovation capability is distinguished between technological and
management innovations and when balanced scorecard is used to measure performance, the
technological and management innovation capabilities of the sample firms have a significant
positive relationship on such performance perspectives as financial, customer, internal business
process, and learning and growth. This demonstrates that if firms can focus on each aspect of
innovation capability, improvements on performance of firms are evident.
On the moderating effect of industrial clusters, this study observed that the interaction of
innovation capability and value chain clusters has a positive moderating effect on business
performance. This result echoes the finding of Morosini (2004) that individual firms having high
innovation capability and clustered in a specific geographical region create a social fabric where
a high degree of cooperative effectiveness within vertical value chains leads to significant
improvements in business performance. However, the interaction of innovation capability with
coopetition clusters and shared-resource clusters did not demonstrate a significant level. From
these results, it can be inferred that the social fabric of firms in the science parks has only
achieved integration among vertical value chains. In another word, the compositive relation of
the industrial clusters are constructed from the industrial value chain between the entire upstream
and downstream members. It has not yet evolved to that of horizontal coopetition fabric and of
The International Journal of Organizational Innovation Vol 2 Num 4 Spring 2010 99
shared-resource clusters spanning a wide range of interactive dimensions. Therefore, the
relationships of the industrial clusters in Taiwanese science parks demonstrate that they have not
evolved the coopetition effectiveness by each other competitor and collaborator. As well as the
common network relationship of the sharing resources, achieve the overall operating scale
economy. These findings can be employed by future government organizations regarding the
administration of regional industry policies which should emphasize coopetition effects to
replace zero-sum effects among firms, and at the same time, strengthen effectiveness of
resource-sharing among industries so that the whole industry and national economy become
more robust.
A limitation of this study is the focus on Hsinchu science parks in Taiwan only for its
research sample. This sample is not enough for an overall representation. Therefore, it is
suggested that future research widen its scope, for example, Taiwanese all science parks to study
the samples. This study employed only industrial clusters as moderating variables for
examining innovation capability and business performance. Future research can include more
concepts such as regional innovation systems, organizational learning effectiveness, and
knowledge-sharing mechanisms as moderating variables to allow for a more comprehensive
study. Moreover, may also aim at the moderating effects of the innovation system and industrial
clusters fabric and carry on the further comparative research analysis.
The International Journal of Organizational Innovation Vol 2 Num 4 Spring 2010 100
References
Adler, P. S. and Shenbar, A. (1990) Adapting your technological base: The organizational
challenge. Sloan Management Review, 25, pp. 25-37.
Afuah, A. (2002), Innovation Management: Strategies, Implementation, and Profits, New York:
Oxford University Press.
Anderson, G. (1994). Industry Clustering for Economic Development. Economic Development
Review, 12(2), pp. 26-32.
Asheim, B. (2007). Differentiated Knowledge Bases and Varieties of Regional Innovation
Systems, Innovation, 20(3), pp. 223-241.
Bharadwaj, S. and Menon A. (2000). Making innovation happen in organizations: individual
creativity mechanisms, organizational creativity mechanisms or both? The Journal of
Product Innovation Management, 17(6): pp. 424-434.
Bible, L., Kerr, S. and Zanini, M. (2006) The Balanced Scorecard: Here and Back, Management
Accounting Quarterly, 7(4), pp.18-23.
Boschma, R. and Lambooy, J. (1999) Evolutionary economics and economic geography, Journal
of Evolutionary Economics, 9 (4): pp. 411-429.
Brenner, T. (2005) Innovation and Cooperation During the Emergence of Local Industrial
Clusters: An Empirical Study in Germany, European Planning Studies, 13(6), pp. 921-
938.
Chuang, L.M. (2005) An Empirical Study of the Construction of Measuring Model for
Organization Innovation in Taiwanese High-tech Enterprises, Journal of American
Academy of Business, 6(1), pp. 299-304.
Cooke. P., Uranga, M. G. and Etzebarria, G. (1998). Regional Systems of Innovation: An
Evolutionary Perspective. Environment and Planning, 30: pp. 1563-1584.
The International Journal of Organizational Innovation Vol 2 Num 4 Spring 2010 101
Drucker, P. (2006), Innovation and Entrepreneurship, Harper and Row, New York.
Fester, E. J. and Bergman, E. M. (1999). Industrial and Regional Clusters: Concepts and
Comparative Applications. The Web Book of Regional Science.
Furman, J. L., Porter, M. E. and Stern, S. (2002), The determinants of national innovative
capacity, Research Policy, 31, pp. 899-933.
Garcia-Morales, V. J., Ruiz-Moreno, A. and Llorens-Montes, F. J. (2007). Effects of Technology
Absorptive Capacity and Technology Proactivity on Organizational Learning, Innovation
and Performance: An Empirical Examination. Technology Analysis and Strategic
Management, 19(4), pp. 527-558.
Geroski, P. A. (1995) Market structure, corporate performance and innovative activity. Oxford:
Clarendon Press.
Guan, J., and Ma, N. (2003) Innovative capability and export performance of Chinese firms.
Technovation, 23(9): pp. 737-747.
James S. (2002) Knowledge spillovers and reasons for concentration of innovation SMEs, Urban
Studies, pp. 885- 902.
Kaplan, R. S. and Norton D. P. (1996) The balanced scorecard: Translating strategy into action,
Harvard Business School Press.
Kerlinger F, and Lee H. (2000) Foundations of Behavioral Research. Orlando, FL: Harcourt
College Publishers.
Kim, S. (2003). Industrial Clusters in Japan: The Regional System of Industrialization. Korea
Observer, 32(2), pp. 369-392.
Koellinger, P. (2008) The relationship between technology, innovation, and firm performance—
Empirical evidence from e-business in Europe. Research Policy, 37(8), pp. 1317-1328.

The International Journal of Organizational Innovation Vol 2 Num 4 Spring 2010 102
Lai, H-C, Chiu, Y-C, and Leu, H-D. (2005) Innovation capacity comparison of China's
information technology industrial clusters: The case of Shanghai, Kunshan, Shenzhen and
Dongguan. Technology Analysis and Strategic Management, 17(3), pp. 293-315
Li, H. and Atuahene-Gima K. (2001) Product innovation strategy and the performance of new
technology ventures in China. Academy of Management Journal, 44(6): pp. 1123-1134.
Lin, Y. P., Huang, J. Y. and Tung, Y. C., (2004). How Organizational Learning and
Organizational Innovations Mediate Market Orientation and Organizational Performance:
An Empirical Study of the Information Technology Industry in Scientific Industry,
Management Review, and 23(1): pp. 101-134.
Marshall, A. (1890) Principles of Economics. London: Macmillan.
Moore, G.A. (2004) Darwin and the Demon: Innovation within Established Enterprises, Harvard
Business Review, 82 (7/8), pp.86-92.
Morosini, P. (2004) Industrial Clusters, Knowledge Integration and Performance. World
Development, 32(2), pp. 305-326.
Neter, Kutner, M.H., Nactsheim, C.J. and Wasserman, W. (1996) Applied Linear Statistical
Model, 4th ed., Chicago: Irwin.
Nunnally, J.C. (1978), Psychometric Theory, 2nd ed., New York: McGraw-Hill.
Porter, M. E. (1998), Clusters and The New Economics of Competition, Harvard Business
Review, 76(6), pp. 77-90.
Rosenfeld, S. (1997) Bring business clusters into the mainstream of economic development,
European Planning Studies, 5 (1), pp. 3-23.
Rosenfeld, S. A. (2002) A Guide to Cluster Strategies in Less Favoured Regions. NC: Regional
Technology Strategies Inc.

The International Journal of Organizational Innovation Vol 2 Num 4 Spring 2010 103
Saxenian, A. (1994) Regional Advantage: Culture and Competition in Silicon Valley and Route
128, Cambridge, Mass: Harvard University Press.
Shane, S.A. and Ulrich, K.T. (2004) Technological Innovation, Product Development, and
Entrepreneurship in Management Science, Management Science, 50(2), pp. 133-144.
Shapira, P. (2008) Putting Innovation in Place: Policy Strategies for Industrial Services, Regional
Clusters, and Manufacturing SMEs in Japan and the United States. Prometheus, 26(1),
pp.69-87.
Storper, M. and Salais, R. (1997) Worlds of Production: the Action Frameworks of the Economy,
Cambridge, MA: Harvard University Press.
Swann, G. and Prevezer, M. (1996) A Comparison of the Dynamics of Industrial Clustering in
Computing and Biotechnology, Research Policy. 25, pp. 139-157.
Tidd, J. and Bessant, J. (2009) Managing Innovation: Integrating Technological, Market and
Organizational Change (10th
ed), Wiley, Chichester.
Tsai, C. T., Huang, K. L., and Kao, C. F. (2001) The Relationships among Organizational
Factors, Creativity of Organizational Members and Organizational Innovation, Journal of
Management, 18(4): pp. 527-566.
Voelker, K. E., Rakich, J. S. and French, G. R. (2001) The Balanced Scorecard in Healthcare
Organizations: A Performance Measurement and Strategic Planning Methodology.
Hospital Topics, 79(3), pp. 13-24.
Yam, R. C. M., Guan, J. C., Pun, K. F. and Tang, E. P. Y. (2004) An audit of technological
innovation capabilities in Chinese firms: some empirical findings in Beijing, China.
Research Policy, 33(8), pp. 1123-1140.
Zaltman, G. and Burger, P. C. (1975). Marketing Research: Fundamentals and Dynamics.
Stanford: International Thomson Publishing.
Zangwill, W. I., (1992) Lightning Strategies for Innovation. Lexington, MA: Lexington Books,

The International Journal of Organizational Innovation Vol 2 Num 4 Spring 2010 104
THE INFLUENCES OF THE FINANCIAL CRISIS ON THE CONSUMPTION OF HAIRDRESSING IN TAIWAN
Chien- Hua Wang
Department of Business Administration
Hsing Wu College, Taiwan
Abstract
By applying statistical methods, this study explored the consumption changes in hairdressing of the general public in Taiwan. Gray correlation was applied to analyze the consumption changes of the general public in Taiwan and calculate the change order of the items of consumption of hairdressing. The result proved that most people in Taiwan didn’t believe the financial crisis would influence their habit of consumption of hairdressing. However, part of the consumers believed their considerations of consumption would be influenced. Through an overall analysis on consumption, it was found that the order of willingness to consume in the hairdressing services differed according to where people live, which included Northern Taiwan, Central Taiwan, Southern Taiwan, and Eastern Taiwan. People in the Northern and Central Taiwan would first reduce their consumption of the item “Enjoying other services provided by hair salons”, while people in the Southern and Eastern Taiwan would first consider to reduce the consumption of “Haircut”, followed by “Hair dyeing" and “Shampoo”. Keywords: Gray Association Analysis, Consumption of Hairdressing

The International Journal of Organizational Innovation Vol 2 Num 4 Spring 2010 105
Research Motivations and Purposes
Since the global financial crisis broke out, the situation of anywhere influenced by it has
been terrible. The consumption has been low for almost two years. The service industry has
faced serious challenges because of consumers’ conservative attitude. The hairdressing business
has been popular in Taiwan, providing small customized services. It is invertible that this
business has been influenced by consumers’ conservative attitude during this financial crisis.
Therefore, this study tried to further explore if hairdressing consumers have changed their
behaviors of consumption of hairdressing, and find out the order of willingness to consume in the
services through grey relation analysis.
Literature Review
Once, beauty was the equivalent of luxury. But nowadays, it is interpreted differently.
Kuo, Min-Hua and Chung Li-Wei (2007) indicated in their study that beauty-related products are
not influenced by economy, while it is exactly the contrary for luxury goods. Their research
result matched foreign scholars’. There is indeed a significant and positive relationship between
the investments in beauty of women in Taiwan and their personal income. Therefore, from the
result of that research, we can be more assured that people’s investments in themselves can
benefit their careers. And beauty-related products have transformed into necessities. To be more
precise, beauty-related products can be considered as investment goods. Besides satisfying
people’s own desire for beauty, their income is also increased indirectly by these products (Kuo
and Chung, 2007).
The Factors of Choosing Salons Considered by Hairdressing Consumers
According to the study by Hsiao-Wen Kuo’s (2006), consumers with higher income,
motorcycles, and higher level of involvement in products would be more willing to consume in
The International Journal of Organizational Innovation Vol 2 Num 4 Spring 2010 106
hairdressing in a farther place. Secondly, people with higher income go to general places for
consumption of hairdressing less frequently, while visiting high-class hair salons more frequently
than chain salons. Thirdly, people of higher age more frequently change their hair styles.
Fourthly, younger people with higher level of involvement in products spend more money in
hairdressing (Kuo, 2006).
Ya-Hui Chen (2003) indicated in her study that consumers’ choices of hair salons are
influenced by corporate image and service quality. Their intention of consumption differs
according to their income, age, education background, and satisfaction (Chen, 2003).
According to the study by Chih-Lang Lai (2003), the reasons why hairdressing consumers switch
to different hair salons because of their previous experiences of consumption and information
searched before/after switch (Lai, 2003). This study similarly reflected the degree of consumers’
concern about quality of services provided by hairdressing salons and customer satisfaction. In
addition, retrieval of information on reputation of other salons’ services would influence
consumers’ decisions on switching to another salon.
According to the study by An-Tien Hsieh and Wen-Ting Chang (2004), the degree of
consumers’ involvement may have certain effect on price sensitivity. There are four dimensions
of association between consumers’ involvement and price sensitivity: consumers’ participation,
construction of relationship, information exchange, and intervention. The result of the study
indicated that the first three dimensions are not related to price sensitivity while the intervention
dimension is. Consumers’ participation includes preparation for purchase, communication with
companies during process of purchase, intervention, or feedbacks to enterprises after purchase.
Under the same conditions, the industries with the property of higher involvement, such as the
hair salon industry, compared with the industries with the property of lower involvement, such as

The International Journal of Organizational Innovation Vol 2 Num 4 Spring 2010 107
the restaurant industry, have lower price sensitivity. When consumers become aware of values of
services through involvement, their understanding of the result from increasing price sensitivity
would be enhanced. In addition, according to the scholar’s study, by improving consumers’
satisfaction, their tolerance of price would be improved as well. This way, their price sensitivity
would be reduced (Hsieh and Chang, 2004).
The Influences of the Changes in Consumption Environment and
Consumption Behaviors on the Service Industry
The Changes in Consumption Environment in Taiwan.
In the consumption environment in Taiwan, with the advancement of technology and
diversified development of consumers’ life styles, consumption behaviors are no longer simply
related to buying products because of their preference, but making purchases through actually
touch and experience to create personal tastes. Consumers with strong self-awareness and
merchants with sharp eyes can sense the trend of change. The development of the new
consumption trend has changed consumers’ traditional viewpoints on consumption. And with the
evolution of technology, different challenges have emerged. In order to find out how, in the
future, to seize the first opportunity in the market with new ways of thinking and sensitivities,
leaders of industries shall think over this issue carefully, and understand the new trend of modern
consumption with the properties of rapidness, changeability, and briefness.
Based on the development trend of consumption environment, if beauty salons still
operate following the traditional service model of pursuing the leading position in technology or
brand image, it would be edged out by consumers in the future due to their desire for a change to
something new. Therefore, how to integrate internet marketing and use e-business to develop
new customer sources has become the impact and challenge operators in this industry must face.
Because most operators in the hairdressing business in Taiwan are skilled workers unfamiliar

The International Journal of Organizational Innovation Vol 2 Num 4 Spring 2010 108
with the IT field, in the future, they should become managers instead of skilled workers,
separating skills from management, in order to stand out in the age of variety by using the right
specialties in the right fields.
The Influence of the Global Financial Crisis on the Service Industry
The Impacts the Service Industry Faces.
The 2009 first-season survey report on industrial and commercial business management
statuses released by the Department of Statistics, Ministry of Affairs in Taiwan shows that the
operating income of “other services industries” in the first season of 2009 is 31.1 billion NT
dollars, which has decreased by 9.23% compared with the first season of 2008. This means the
economic recession continues. Although the operation income of the hairdressing and beauty
industry is 11 billion NT dollars and that of the car maintenance and car care is 10.4 billion NT
dollars, as the first and the second highest among industries, their growth rates are negative, with
shortage of 20.72% and 0.64%, respectively (Taiwan Department of Statistics, 2009). According
to the statistics, with the low consumption caused by the financial crisis, the situations of
negative growth in service industries are very serious. Especially in the beauty and hairdressing
industries, the operation income has decrease by over 20%. In the labor and technology intensive
market, they are badly wounded.
The Influences of the Financial Crisis on Consumers’ Behaviors.
The financial crisis has caused global damage. The influences are even more serious for
Taiwan, a country with about 64% of GDP are from export trading businesses. To analyze from
the aspect of consumers’ behaviors, these external environment changes have caused consumers
to change in cognition, emotion, attitude, motivation, and learning. Because no one can predict
when the recession will be over, plus the reduction of disposable income while necessities of life

The International Journal of Organizational Innovation Vol 2 Num 4 Spring 2010 109
can not be reduced, in order to save money from expenses, consumers have become smarter and
more rational with changed consumption habits. All these changes are reflected in their
decisions. The most obvious phenomenon is “reduction of consumption”, which means money
has to be sent on important goods. The purchases of non-necessities and luxury goods can be
delayed, in order to mitigate the issue of reduced income. In sum, after the impact of the
financial tsunami, consumers’ behaviors have become more practical and conservative, in hopes
of making the best use of limited resources. Thus, most of the issues consumers care about focus
on how to spend less money to obtain the highest benefits.
The Theory of Grey Relation Analysis.
Grey relation analysis is one of the methods in the grey theories. It is a measurement
method used to analyze the degree of relations between discrete data series. The background in
which the theory was invented is the systems in our surroundings, such as a social system, an
economic system, etc. There are relations between systems, such as triggering relations,
conditioning relations, etc. The existence of these relations keeps the balance of sub-systems.
Some of the relations are known, some are not or just partly known. Therefore, how to discover
them and make use them is the key to the analysis on the systems. In view of this, the grey
system theory proposes the concept of applying “grey relation” analysis on each sub-system. It
attempts to determine the relations between sub-systems (or factors) in the systems with
numbers. The meaning of grey relation is that, in the development process of a system, if the
postures of two factors’ changes are identical, which means the degree of simultaneously change
is high, and then these two factors are highly related. On the contrary, the relation between them
is rather weak. Therefore, “grey relation analysis” provides a quantitative measure for the

The International Journal of Organizational Innovation Vol 2 Num 4 Spring 2010 110
posture of the system’s development change. It is very useful for dynamic process analysis (Lin,
2004; Kung and Wen, 2007).
Grey Association.
Grey association is a measurement method commonly used in grey relation analyses to
describe the degree of relations between series. Considering the series xi = (xi(1), xi(2)…….., xi
(m)) ∈X, i=1,2,…,n, where xi(k) represents any element in the series, in the factor set P(X) in
the grey relation space, the grey relation coefficients must be defined before determining the
degrees of grey relations. For local grey relation measurement, only x0(k) ∈X is used as
reference series, while other series xi is comparative series. Then the grey relation coefficient
between x0(k) and xi (k) is:
γ(x0(k), xi(k))=max0
maxmin
)( ∆+∆
∆∆ +
ζ
ζ
ki
…………..………………………………… (1)
Where ( )1,0∈ζ is the distinguished coefficient, )()()(0 0 KxKxki i−=∆ is the absolute
difference between x0(k) and xi(k), and
)(minmin0min Kiki ∆=∆ ∀∀ = )()(
minmin0 KxKx i
ki −∀∀ ……………………………….(2)
)(maxmax0max Kiki ∆=∆ ∀∀ = )()(
maxmax0 KxKx i
ki −∀∀ ……………………………..(3)
(1) For overall grey relation measurement, any one of the series xi, i=1,2,……n will become
the reference series in turn while others are comparative series. Then the grey relation coefficient
between xi(K) and xj(K) is:
γ(xi(K),xj(K))=max
maxmin
)( ∆+∆
∆+∆
ζ
ζ
Kij
…………………………………………………(4)
Where )()()( KxKxK jiij −=∆ is the absolute difference between xi(K) and xj(K). And

The International Journal of Organizational Innovation Vol 2 Num 4 Spring 2010 111
)()(minmin)(minmin
,,min KxKxK jikjiijkji −=∆=∆
∀∀∀∀∀∀ ……………………….………..(5)
)()(maxmax)(maxmax
,,min KxKxK jikjiijkji −=∆=∆
∀∀∀∀∀∀ ………………………………(6)
After grey relation coefficients are determined, through the following formulas, the measured
values of grey relation between x0 and xi or xi and xj can be obtained:
γ(x0,xi) = ∑=
Κ
m
k
i Kxkx1
0 ))(),((γβ ………………………………………………(7)
γ(xi,xj) = ∑=
Κ
m
k
ji Kxkx1
))(),((γβ ………………………………………………(8)
Where βk is the weight, and ∑=
Κ =m
k 1
1β . Under normal circumstances, different weights are given
according to the degree of factors’ actual importance to the system. If not specified, equal
weights are used to calculate grey relations.
After the measured values of grey relations between each factor, the order of the grey
relation series of the major factors which may influence the issue on hand can be determined by
the values of grey relations of influential factors. Then from the values of grey relations, the
degrees of importance for influential factors are clearly presented. In addition, in the process of
calculating grey relation coefficients, distinguished coefficient ζ is a parameter which can be
adjusted according to actual situations. The purpose is to adjust the comparative relation between
ij∆ , the values to be measured, and max∆ , the background value. Although the value of
distinguished coefficient ζ would influence the value of grey relation coefficients, it doesn’t
change the order of grey relation series. Under normal circumstances, the value of distinguished
coefficient ζ is set to 0.5. Generally speaking, the focus of analyses on issues is merely on the
order of grey relations between series, which is called the relational series. The final order can

The International Journal of Organizational Innovation Vol 2 Num 4 Spring 2010 112
help understand the major factors which influence the issues on hand and can be used as a
reference for decision making (Deng, 1989; Lin, 2005).
Research Design
Questionnaires were planned and designed for this study. A consumption survey was
conducted with the consumers from four regions, including northern, central, southern, and
eastern Taiwan. Then demographic variables were analyzed with statistic methods to find out
important features of the consumers. At last, by analyzing the questionnaires with statistic
methods, values of the degrees of identification were obtained. Grey relation analysis was
applied to obtain the order of important factors. Through the order of factors, the actual statuses
of consumers’ behavior change were obtained.
Applying Grey Relation Analysis to the Influences of Financial Crisis on Consumption of Hairdressing
Questionnaire Survey of Consumption of Hairdressing and Analysis of the Survey
A survey was conducted for this study on the regular services the hairdressing industry
usually provides, such as shampoo, hair dyeing, permanent, haircut, hair design, other services,
and sale of hairdressing products, hoping to find out through questionnaires, under the influences
of the financial crisis, if consumers have changed their habits in consumption, if they have
stopped consumption, if they have reduced their consumption of hairdressing, the model of
reduction of consumption if available, if the frequencies of their consumption of all the items
have been reduced or just part of them, and the frequencies of which items have been reduced
first.
In order to explore consumers’ habit changes in consumption of hairdressing in Taiwan,
the research subjects in this study were categorized into four groups according to where they
lived, including northern, central, southern, and eastern Taiwan. The chosen subjects were

The International Journal of Organizational Innovation Vol 2 Num 4 Spring 2010 113
consumers who had visited some middle or small sized chain salons in these four regions during
the period from March to November of 2009. Random sampling was applied for this
questionnaire survey. 100 questionnaires were distributed in each region. The numbers of
questionnaires retrieved were 84 in Northern Taiwan, 96 in Southern Taiwan, 100 in Central
Taiwan, and 73 in Eastern Taiwan. A total of 353 questionnaires were retrieved. The overall
response rate was 88%.
The Statuses of Consumption of Hairdressing for the Consumers in the Four Regions of Taiwan
A five-point scale was applied to the questions in the questionnaires (1 = totally agree, 2
= agree, 3 = partly agree, 4 = a little agree, and 5 = disagree). The percentage of people who
selected an option was used as the degree of intensity of that option.
(1) The result of the survey of southern hairdressing consumers’ consumption behaviors is
listed below in Table 1.
From the summary of the findings above, it is found the condition of people stopping
their consumption of hairdressing was not serious in Southern Taiwan. The statistics show that
only less than 13% of people have stopped their consumption in hairdressing, while 30%~56% of
people have not been influenced by the financial crisis.
(2) The result of the survey of central hairdressing consumers’ consumption behaviors is listed
below in Table 2.
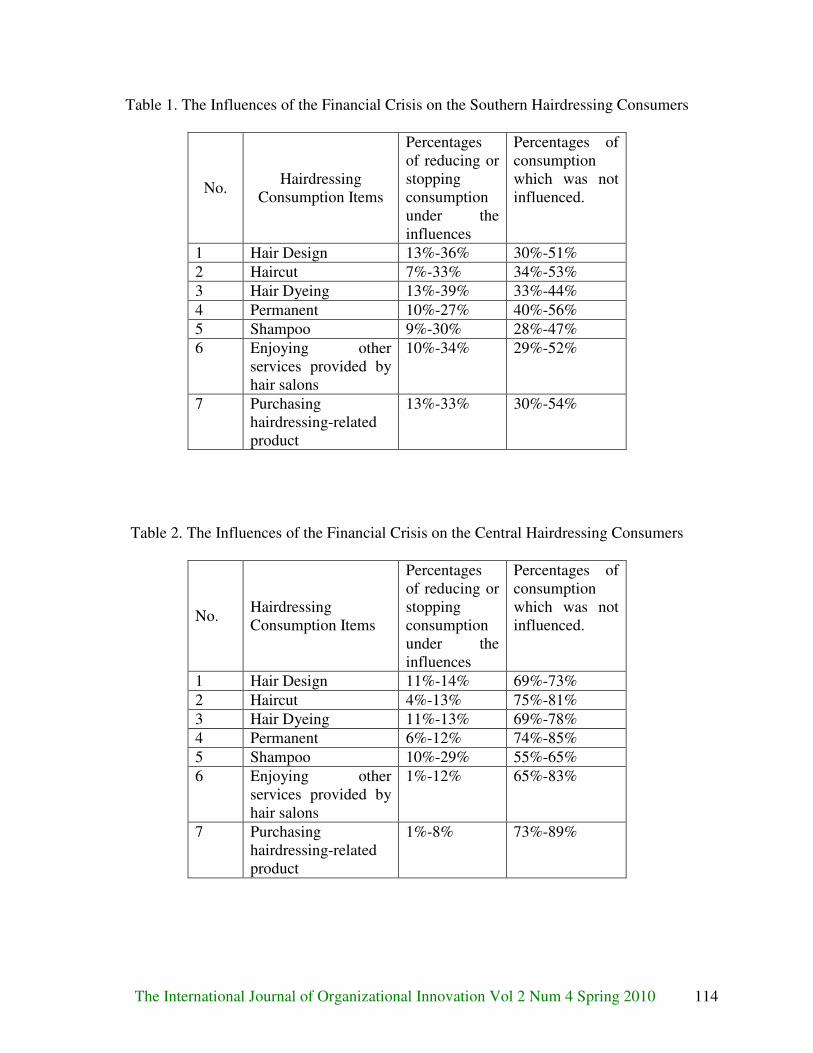
The International Journal of Organizational Innovation Vol 2 Num 4 Spring 2010 114
Table 1. The Influences of the Financial Crisis on the Southern Hairdressing Consumers
No. Hairdressing
Consumption Items
Percentages of reducing or stopping consumption under the influences
Percentages of consumption which was not influenced.
1 Hair Design 13%-36% 30%-51%
2 Haircut 7%-33% 34%-53%
3 Hair Dyeing 13%-39% 33%-44%
4 Permanent 10%-27% 40%-56%
5 Shampoo 9%-30% 28%-47%
6 Enjoying other services provided by hair salons
10%-34% 29%-52%
7 Purchasing hairdressing-related product
13%-33% 30%-54%
Table 2. The Influences of the Financial Crisis on the Central Hairdressing Consumers
No. Hairdressing Consumption Items
Percentages of reducing or stopping consumption under the influences
Percentages of consumption which was not influenced.
1 Hair Design 11%-14% 69%-73%
2 Haircut 4%-13% 75%-81%
3 Hair Dyeing 11%-13% 69%-78%
4 Permanent 6%-12% 74%-85%
5 Shampoo 10%-29% 55%-65%
6 Enjoying other services provided by hair salons
1%-12% 65%-83%
7 Purchasing hairdressing-related product
1%-8% 73%-89%

The International Journal of Organizational Innovation Vol 2 Num 4 Spring 2010 115
From the summary of the findings above, it is found that 55%~89% of the people in
Central Taiwan have not changed their hairdressing consumption habits. It is obvious that the
consumption capacity of people in Central Taiwan was high.
(3) The result of the survey of northern hairdressing consumers’ consumption behaviors is
listed below in Table 3. From the summary of the findings above, it is found that the
financial crisis had no significant influences on the respondents in North Taiwan. Only the
largest influence was on their consumption of hairdressing-related products.
Table 3. The Influences of the Financial Crisis on the Northern Hairdressing Consumers
No. Hairdressing Consumption Items
Percentages of reducing or stopping consumption under the influences
Percentages of consumption which was not influenced.
1 Hair Design 6%-39% 17%-30%
2 Haircut 7%-34% 16%-30%
3 Hair Dyeing 3%-37% 16%-26%
4 Permanent 3%-36% 13%-30%
5 Shampoo 6%-34% 9%-28%
6 Enjoying other services provided by hair salons
4%-28% 10%-29%
7 Purchasing hairdressing-related product
3%-45% 10%-21%
The result of the survey of eastern hairdressing consumers’ consumption behaviors is listed
below.
From the summary of the findings above, it is found that the percentage of the
respondents who believed that they were not influenced by the financial crisis was a little
bit higher than that of the respondents who believed that they were influenced.

The International Journal of Organizational Innovation Vol 2 Num 4 Spring 2010 116
Table 4. The Influences of the Financial Crisis on the Eastern Hairdressing Consumers
No. Hairdressing Consumption Items
Percentages of reducing or stopping consumption under the influences
Percentages of consumption which was not influenced.
1 Hair Design 1%-34% 1%-59%
2 Haircut 5%-23% 33%-48%
3 Hair Dyeing 10%-37% 32%-47%
4 Permanent 10%-31% 29%-43%
5 Shampoo 15%-50% 15%-29%
6 Enjoying other services provided by hair salons
12%-46% 18%-36%
7 Purchasing hairdressing-related product
12%-36% 14%-37%
Summarizing the consumption of hairdressing in all four regions:
The analysis result of the data from the four regions in Taiwan shows that most of the
respondents did not agree the financial crisis would influence their consumption of hairdressing-
related services.
Analysis on Consumers with Demographic Variables
This study summarized and analyzed the consumers’ occupation, income, gender, and
age by applying statistic methods to the basic data of the people randomly selected, using the
demographic variables.
(1) Analysis on Occupation
According to the summary of the statistics data of the variable “occupation”, the consumer
groups were a little bit different in different regions in Taiwan. In Northern Taiwan and
Eastern Taiwan, the consumers were mainly housewives, followed by commercial and
industrial personnel. In Central Taiwan and Southern Taiwan, the consumers were mainly
commercial and industrial personnel, followed by military personnel or public servants and

The International Journal of Organizational Innovation Vol 2 Num 4 Spring 2010 117
housewives, respectively. As for the third important group, it was retired personnel in
Northern Taiwan and students in all other three groups.
Table 5. The Order of Importance of the Consumers In the Four Regions In Taiwan
Region The Most Important Group
The Second Important Group
The Third Important Group
Northern Taiwan Housewife
Commercial or industrial personnel
Retired personnel
Central Taiwan
Commercial or industrial personnel
Military personnel or public servant
Student
Southern Taiwan
Commercial or industrial personnel
Housewife Student
Eastern Taiwan Housewife
Commercial or industrial personnel
Student
(2) Analysis on Income
Table 6. The Income Status of the Consumers in the Four Regions in Taiwan
Region The Most Important Group
The Second Important Group
Northern Taiwan
30000-60000 dollars
20000-30000 dollars
Central Taiwan
20000-30000 dollars
Dependent on families
Southern Taiwan
Under 20000 dollars
20000-30000 dollars
Eastern Taiwan
Dependent on families
20000-30000 dollars
Currency: NTD
According to the summary of the income statuses in the four regions in Taiwan, the
consumers in Northern Taiwan had rather high income with over 40% of consumers having

The International Journal of Organizational Innovation Vol 2 Num 4 Spring 2010 118
income over 30000 NT dollars. The second largest group was those with income of
20000~30000 dollars. In Central Taiwan, most of the consumers (32%) were dependent on
their families. The second largest group was those with income of 20000~30000 dollars,
followed by those with no income at all and those of income over 30000 NT dollars. In
Southern Taiwan, most of the consumers were of income under 20000 NT dollars. The
second largest group was those with income of 20000~30000 dollars. Overall, the major
customers of middle or small sized salons in Taiwan were mainly those with income of
20000~30000 NT dollars.
(3) Analysis on Gender
Table 7. Ratios of Consumers’ Gender
Region Male Female
Northern Taiwan
23% 77%
Central Taiwan
22% 78%
Southern Taiwan
19% 81%
Eastern Taiwan
10% 90%
According to the statistics above, females were the major consumers of hairdressing in all
four regions in Taiwan. And in Eastern Taiwan, the percentage of male hairdressing consumers
was significantly lower than that in the other regions.
(4) Analysis on Age
Table 8. The Age Groups of Major Consumers
Region The Most Important Group
The Second Important Group
The Third Important Group
Northern Taiwan
26-45 years old 18-25 years old 45-55 years old
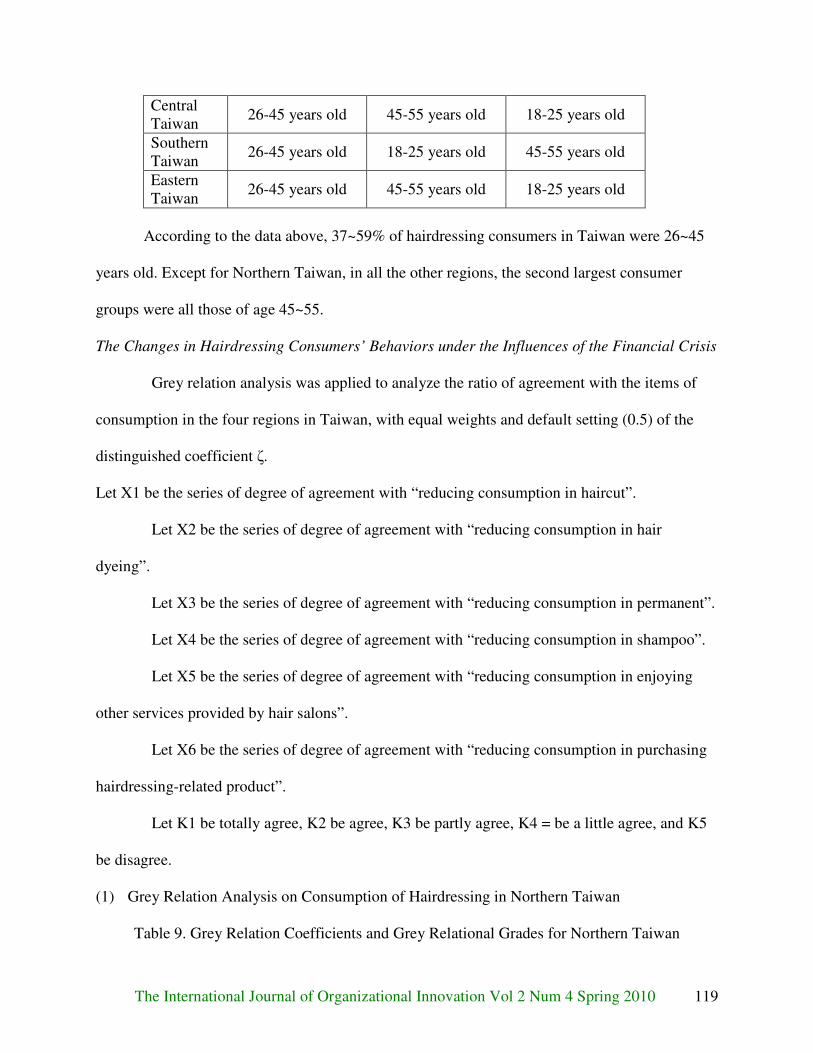
The International Journal of Organizational Innovation Vol 2 Num 4 Spring 2010 119
Central Taiwan
26-45 years old 45-55 years old 18-25 years old
Southern Taiwan
26-45 years old 18-25 years old 45-55 years old
Eastern Taiwan
26-45 years old 45-55 years old 18-25 years old
According to the data above, 37~59% of hairdressing consumers in Taiwan were 26~45
years old. Except for Northern Taiwan, in all the other regions, the second largest consumer
groups were all those of age 45~55.
The Changes in Hairdressing Consumers’ Behaviors under the Influences of the Financial Crisis
Grey relation analysis was applied to analyze the ratio of agreement with the items of
consumption in the four regions in Taiwan, with equal weights and default setting (0.5) of the
distinguished coefficient ζ.
Let X1 be the series of degree of agreement with “reducing consumption in haircut”.
Let X2 be the series of degree of agreement with “reducing consumption in hair
dyeing”.
Let X3 be the series of degree of agreement with “reducing consumption in permanent”.
Let X4 be the series of degree of agreement with “reducing consumption in shampoo”.
Let X5 be the series of degree of agreement with “reducing consumption in enjoying
other services provided by hair salons”.
Let X6 be the series of degree of agreement with “reducing consumption in purchasing
hairdressing-related product”.
Let K1 be totally agree, K2 be agree, K3 be partly agree, K4 = be a little agree, and K5
be disagree.
(1) Grey Relation Analysis on Consumption of Hairdressing in Northern Taiwan
Table 9. Grey Relation Coefficients and Grey Relational Grades for Northern Taiwan

The International Journal of Organizational Innovation Vol 2 Num 4 Spring 2010 120
Grey Relation
Coefficient
K 1 K 2 K 3 K 4 K 5 Relational grade
r(x 0, x 1) 0.8983 0.5354 0.3985 0.7910 0.6709 0.6588
r(x 0, x 2) 1.0000 0.6092 0.3759 0.6709 0.7067 0.6725
r(x 0, x 3) 0.8983 0.4380 0.4454 0.7260 0.8154 0.6646
r(x 0, x 4) 0.8983 0.4240 0.5248 0.6709 0.7260 0.6488
r(x 0, x 5) 0.8983 0.5248 0.3813 0.7260 0.8154 0.6692
r(x 0, x 6) 1.0000 0.4690 0.4454 0.6543 0.7681 0.6674
The grey relational grades were calculated and ordered
r(x 0, x 2) = 0.6725 > r(x 0, x 5) = 0.6692 > r(x 0, x 6) = 0.6674 > r(x 0, x 3) = 0.6646 >
r(x 0, x 1) = 0.6588 > r(x 0, x 4) = 0.6488
The analysis result:
Hair dyeing > Enjoying other services provided by hair salons > Purchasing hairdressing-related
product > Permanent > Haircut > Shampoo
(2) Grey Relation Analysis on Consumption of Hairdressing in Central Taiwan
Table 10. Grey Relation Coefficients and Grey Relational Grades for Central Taiwan
Grey Relation Coefficient
K 1 K 2 K 3 K 4 K 5 Relational grade
r(x 0, x 1) 0.8491 0.4545 0.7377 0.5294 0.4639 0.6069
r(x 0, x 2) 0.7895 0.4054 0.7895 0.5172 0.5294 0.6062
r(x 0, x 3) 0.7377 0.3846 0.6164 0.6338 0.6164 0.5978
r(x 0, x 4) 0.7377 0.4054 0.6716 0.6164 0.5556 0.5973
r(x 0, x 5) 1.0000 0.4054 0.7377 0.4054 0.6716 0.6440
r(x 0, x 6) 0.9574 0.4054 0.7377 0.4455 0.6164 0.6325
The grey relational grades were calculated and ordered
r(x 0, x 5) = 0.6440 > r(x 0, x 6) = 0.6325 > r(x 0, x 1) = 0.6069 > r(x 0, x 2) = 0.6062 >
r(x 0, x 3) = 0.5978 > r(x 0, x 4) = 0.5973
The analysis result:

The International Journal of Organizational Innovation Vol 2 Num 4 Spring 2010 121
Enjoying other services provided by hair salons > Purchasing hairdressing-related product >
Haircut > Hair dyeing > Permanent > Shampoo
(3) Grey Relation Analysis on Consumption of Hairdressing in Southern Taiwan
Table 11. Grey Relation Coefficients and Grey Relational Grades for Southern Taiwan
Grey Relation Coefficient
K 1 K 2 K 3 K 4 K 5 Relational grade
r(x 0, x 1) 1.0000 0.5269 0.6364 0.6712 0.7778 0.7225
r(x 0, x 2) 0.8596 0.6203 0.6203 0.7538 0.6712 0.7050
r(x 0, x 3) 0.7778 0.6203 0.6203 0.7538 0.7101 0.6965
r(x 0, x 4) 0.8596 0.5904 0.6364 0.6712 0.7538 0.7023
r(x 0, x 5) 0.7101 0.7538 0.5904 0.6364 0.7778 0.6937
r(x 0, x 6) 0.7538 0.6712 0.7101 0.5904 0.7538 0.6959
The grey relational grades were calculated and ordered
r(x 0, x 1) = 0.7225 > r(x 0, x 2) = 0.7050 > r(x 0, x 4) = 0.7023 > r(x 0, x 3) = 0.6965 >
r(x 0, x 6) = 0.6959 > r(x 0, x 5) = 0.6937
The analysis result:
Haircut > Hair dyeing > Shampoo > Permanent > Purchasing hairdressing-related product >
Enjoying other services provided by hair salons
(4) Grey Relation Analysis on Consumption of Hairdressing in Eastern Taiwan
Table 12. Grey relation coefficients and grey relational grades for Eastern Taiwan
Grey Relation Coefficient
K 1 K 2 K 3 K 4 K 5 Relational grade
r(x 0, x 1) 1.0000 0.5949 0.5402 0.5054 0.8246 0.6930
r(x 0, x 2) 0.8545 0.6104 0.5402 0.5402 0.8246 0.6740
r(x 0, x 3) 0.7705 0.5529 0.5529 0.6104 0.8246 0.6623
r(x 0, x 4) 0.8545 0.4747 0.5663 0.8545 0.6267 0.6754
r(x 0, x 5) 0.8868 0.5054 0.5949 0.6267 0.7231 0.6674
r(x 0, x 6) 0.8246 0.5054 0.6104 0.6267 0.7460 0.6626
The grey relational grades were calculated and ordered

The International Journal of Organizational Innovation Vol 2 Num 4 Spring 2010 122
r(x 0, x 1) = 0.6930 > r(x 0, x 4) = 0.6754 > r(x 0, x 2) = 0.6740 > r(x 0, x 5) = 0.6674 >
r(x 0, x 6) = 0.6626 > r(x 0, x 3) = 0.6623
The analysis result:
Haircut > Shampoo > Hair dyeing > Enjoying other services provided by hair salons >
Purchasing hairdressing-related product > Permanent
The summary of the above results of grey relation analyses:
(1) Hairdressing services ordered by consumers willingness to reduce consumption of them in
Northern Taiwan
Hair dyeing > Enjoying other services provided by hair salons > Purchasing hairdressing-related
product > Permanent > Haircut > Shampoo
(2) Hairdressing services ordered by consumers willingness to reduce consumption of them in
Central Taiwan
Enjoying other services provided by hair salons > Purchasing hairdressing-related product >
Haircut > Hair dyeing > Permanent > Shampoo
(3) Hairdressing services ordered by consumers willingness to reduce consumption of them in
Southern Taiwan
Haircut > Hair dyeing > Shampoo > Permanent > Purchasing hairdressing-related product >
Enjoying other services provided by hair salons
(4) Hairdressing services ordered by consumers willingness to reduce consumption of them in
Eastern Taiwan
Haircut > Shampoo > Hair dyeing > Enjoying other services provided by hair salons >
Purchasing hairdressing-related product > Permanent

The International Journal of Organizational Innovation Vol 2 Num 4 Spring 2010 123
Conclusions and Suggestions
After a series of questionnaire surveys and statistical analyses, it is found that, generally
speaking, most people in Taiwan, no matter which region they lived, believed the global
financial crisis would not influence their habit of consumption of hairdressing. Of course, still a
part of them believed their consumption frequencies or amounts would be reduced. Therefore,
through grey relation analysis, the orders to reduce consumption of the hairdressing services
were found.
Overall consumption analyses were performed on hair salons’ general services for this
study. The result shows that, for people from four different regions in Taiwan, the orders to
reduce consumption of the hairdressing services were different. People in Northern and Central
Taiwan would consider to reduce consumption of “enjoying other services provided by hair
salons”, while people in Southern and Eastern Taiwan would reduce consumption of “haircut”
first, and then “hair dyeing and shampoo”.
From the aspect of marketing, how to develop new strategies according to the factors
above to make a salon’s features stand out is something salon operators must think about during
the economic recession. Hair salons in Northern and Central Taiwan should use “additional
services” to attract customers, such as providing massage for scalp with shampoo for a cheaper
bundle package price, or adding a TV in salon for customers to watch while being serviced plus a
cup of expensive drink, to make them feel the service they’ve received is more valuable than its
price, so that they would deter from giving up “enjoying other services provided by hair salons”.
As for salons in Eastern and Southern Taiwan, “fast haircut with low price” would be attractive.
For example, the William Beauty Salon near Carrefour draw customers into the salon with 100-
dollar fast haircut and then try to sell them more services after they get in.

The International Journal of Organizational Innovation Vol 2 Num 4 Spring 2010 124
The financial crisis has influenced many industries, especially the financial industry, the
construction industry, and the manufacturing industry. Therefore, some civil industries and
service industries have been facing difficulties of reducing income. But it is proved that this
doesn’t necessarily lead to a dead end despite the influences. Take the hairdressing business in
this study for example, the survey result shows that hairdressing has already become a part of
people’s lives in Taiwan. Hairdressing is like a necessity. People still spend money on it but the
amount spent is lower. The result of this study can be used as reference for hairdressing business
operators to plan their marketing, so that they can develop strategies corresponding to the
different demands in different regions and create their own advantages in the recession.
Research Limitation
The research subjects of this study were consumers who had visited some middle or
small sized chain salons. People who did not consume weren’t included, and therefore
consumption information on this kind of people wasn’t considered in this study. Thus, the
conclusions of this study can provide operators only the viewpoints of those who still consume.
References
Chen, Y.H. (2003). The relationship among customers’ corporation image, service quality and
customer satisfaction of hair saloon chain stores in Taipei area. Unpublished master thesis. Chinese Culture University.
Deng, J.L. (1989). Introduction to Grey system theory. The Journal of Grey System. 1(1), 24. Hsieh, A. T. & Chang W. T. (2004). The effect of consumer participation on price sensitivity.
Journal of Consumer Affairs. 38(2), 282-296. Kung C.Y. & Wen K.L. (2007). Applying Grey Relational Analysis and Grey Decision-Making
to Evaluate the Relationship between Company Attributes and Its Financial Performance

The International Journal of Organizational Innovation Vol 2 Num 4 Spring 2010 125
- A Case Study of Venture Capital Enterprises In Taiwan (pp. 11). 2007, Netherlands: Elsevier Science Publishers.
Kuo, H.W. (2006). The effects of demographic, psychographic and geographic factors on
consumers’ transportation and consumption to beauty salon. Unpublished master thesis. National Chengchi University.
Kuo, M.H., & Chung L.W. (2007). Is beauty worth investing? Taiwan Economic Journal.
2007.07, 61-71. Lai, C.L. (2003). A Study of consumer decision making on services switching process in hair
salon business. Unpublished master thesis. National Kaohsiung First University of Science and Technology.
Lin, S.Y. (2004). Evaluation of business reputation in information service industry---an
application of grey relational analysis. Journal of Information, Technology and Society., 17.
Lin, S.Y. (2005). The application of grey relation analysis for evaluating ecotourism
destinations. Tourism Management Research. 4(2), 17. Taiwan Department of Statistics, M.A. (2009). 2009 M.. Affairs, Editor. 2009, Department of
Statistics. p. 12 ,http://2k3dmz2.moea.gov.tw/gnweb/Dynamic/wFrmDynamic.aspx

The International Journal of Organizational Innovation Vol 2 Num 4 Spring 2010 126
BOARD COMPOSITION AND CORPORATE VALUE IN TAIWAN HIGH-
TECHNOLOGY FIRMS
Derek TeShun Huang
and
Zhien Chia Liu
Department of Business Administration,
National Chung Cheng University, Taiwan
Abstract
Traditional accounting performance measures (return of equity, earnings per share) only reflect
short-term performance and are unable to express an enterprise's long-term value. The sample of
this study includes Taiwan listed firms from 1998 to 2008 and the ordinary least squares (OLS)
method to test our hypothesis. The empirical results show that independent directors' proportion
is positively related to Economic valued added (EVA) and that this variable plays an active role
in value creation in high-tech firms. However, independent directors' proportion exhibits an
insignificant relationship to Market value added (MVA).
Keywords: Board of Directors, Independent Director, Economic Value Added, Market Value
Added, High-technology

The International Journal of Organizational Innovation Vol 2 Num 4 Spring 2010 127
Introduction
Traditional accounting indexes measure performances such as return on assets (Bailey &
Helfat, 2003), earnings per share (Neumann & Voetmann, 2005), return on equity (Peng, 2004),
free cash flow (Neumann & Voetmann, 2005), return on stock price (Allgood & Farrell, 2003),
and stock price (Shen & Cannella, 2003). Such measurements are generated from financial
statements that follow the generally accepted accounting principles (GAAP), requiring
conservatism. Kaur & Narang (2008) concluded that traditional measures do not reflect the real
value of shareholders' wealth and thus EVA needs to be measured scientifically to obtain a real
idea about shareholders value.
Jensen & Meckling (1976) pointed out that one or many clients employ another agent and
empower them with decision-making power. However the client (owner) has not been
unanimous with the agent position for pursuing the principle that individual interests will create a
conflict of interests. Therefore, the client will limit agent behaviors to protect owner’s rights.
Previous literature has focused on the relationship between board composition and firm
value, measuring performance with Tobin’s Q (Beiner et al., 2006; Hu et al., 2009), book value
(Shen et al., 2006), and market to value book (Beiner et al., 2006) . This paper examines whether
the board of directors plays a critical role in creating a firm’s value in the high-tech industry of
Taiwan with the hope of offering some insights for enterprises and government.

The International Journal of Organizational Innovation Vol 2 Num 4 Spring 2010 128
Literature Review
This study used EVA to evaluate economic value and to assess resource allocating
efficiency (Stewart, 1991). Austin (2005) pointed to EVA as a benchmark and basis for pricing
and other strategies. Pohlen & Coleman (2005) also pointed to EVA to assess the operating and
supply chain. Compared to the above solutions, Kaur & Pal (2008) suggested that some
companies adopt the EVA technique to measure shareholder value.
Parrino et al., (2002) also pointed out that independent directors are the most important
organizational policymakers, with professional knowledge that serves as the objective in the
policymaker role. Petra (2005) showed that independent directors enhance the board, supervise
an administrator, and guarantee that the administrator makes the best decision for shareholder's
interests. Therefore, the higher independent directors' proportion has better performance.
This study used EVA to evaluate economic value, and reacted Market value added (MVA)
to calculate the enterprise's market value. This paper concludes that independent directors'
proportion improves the corporate mechanism and improves firms' performance, Therefore its
proportion has significant positive relationship with EVA and MVA.
H1: Independent directors' proportion has a significantly positive relationship with EVA.
H2: Independent directors' proportion has a significantly positive relationship with Market value
added.

The International Journal of Organizational Innovation Vol 2 Num 4 Spring 2010 129
Compared to the above-mentioned inferences, the increase of EVA and MVA derives from the
increase of independent directors' proportion. Therefore, EVA and MVA have a significant
positive relationship with independent directors' proportion.
H3: Economic value added has a significant positive relationship with independent directors'
proportion.
H4: Market value added has a significant positive relationship with independent directors'
proportion.
Methodology
The sample of this study comes from the TEJ database (Taiwan) and includes
listed firms in Taiwan high-technology firms from 1998 to 2008(N=1308). We used the ordinary
least squares (OLS) method. The proxy variables are as follows: tEVA is the economic valued
added measured in Appendix A. Market value added ( tMVA ) is at time t measured in the
difference between market value of equity and book value of equity. tINDEP is the proportion of
independent directors (more detailed in Appendix B ) at time t measured in independent
director's numbers divided by total directors. tINSOWN is the ratio of inside directors'
shareholding at time t measured in its' stock hold numbers divided by outstanding common
stocks. tDEBT is the proportion of long-term debt at time t measured in long term debt divided
by total asset× 100%. tBLOCK is the block shareholders (more detailed in Appendix B ) in

The International Journal of Organizational Innovation Vol 2 Num 4 Spring 2010 130
enterprises at time t measured in a dummy variable. If there are block shareholders in the
company, its value is 1 and 0 is the contrary. tGW is sales growth measured as the difference
between at time t sales and at time t-1 sales divided by at time t-1 sales. tINST is the institution
shareholding ratio at time t measured in government, bank, company, mutual-fund, foreign bank,
foreign company, foreign mutual-fund, fund institution shareholder stocks divided by
outstanding common stocks. tCAPEXP is capital investment at time t measured in net fixed
assets plus deprecation expense.
Results
Descriptive Statistics
From Table 1, EVA1 (unadjusted) is the highest and EVA2 (join adjusted items) is the
lowest. MVA shows that high-technology firms in Taiwan are 902798(NT dollars). The
difference between independent directors' proportion is very great (the minimum is 11% and the
maximum is 60%). The director's shareholding ratio is 22.78% and the institutional investor
holds 29.89%. Therefore, the institutional investor possesses powerful management influence in
high-technology firms. The proportion of long-term debt at 6.97% shows it to be financial
conservative. Sales growth at 16.49% also shows that high-technology firms in Taiwan are doing
well.
The International Journal of Organizational Innovation Vol 2 Num 4 Spring 2010 131
Empirical Test
Empirical results from Table 2 show that independent directors' proportion exhibits a
significant positive relationship with EVA, supporting hypothesis 1 because independent
directors are important policymakers in organizations. Abundant professional knowledge and
personal duty shows a low relation to an enterprise. The higher independent directors' proportion
impels the director to effectively supervise administrators to improve and ensure stockholders'
equity or create greater value. This is also in agreement with Parrino et al., (2002). However, the
independent director proportion has insignificant positive relationship with MVA. Hypothesis 2
is rejected, because investors have doubts about independent directors’ ability to supervise hi-
tech industry managers in Taiwan, which apparently does not influence stock price.
Table 3 shows that EVA and MVA have a significant positive relationship with
independent directors' proportion in the OLS model, revealing that enterprise's value increases
when independent directors' proportions increases, thus supporting hypothesis 3 & 4.
Other variables (Table 2), the inside directors' shareholding ratio positively relates to
EVA but only have a significant relationship with EVA1. This is because the inside director
holding ratio increases and the board of directors supervise the administrator to prevent the
administrator from damaging the enterprise's value, thereby improving performance.

The International Journal of Organizational Innovation Vol 2 Num 4 Spring 2010 132
Block shareholders in enterprises show a significant positive relationship between EVA2
and EVA3 because they effectively supervise the management. However, an institution's investor
holding ratio shows an insignificant relationship with EVA. This paper is unable point out its
relationships. The proportion of long-term debt has a significant negative relationship with
EVA2. Sales growth has a significant positive relationship with EVA1 because the rate of
increase shows enterprise's value creation. Capital expenditure has a significant positive
relationship with EVA1and EVA2 because it raises enterprise value while investing in capital
expenditure.
On the other hand, the institution stockholding ratio has a significant positive relationship
with MVA, showing that institutional investors have higher independence and professional
knowledge to supervise the enterprise's executive more closely and create enterprise value. Sales
growth has a significant positive relationship with MVA because it is favored by investors and it
promotes stock price. However , inside director's stockholding ratio、long-term debt、the block
stockholder、and capital expenditure have an insignificant relationship with MVA.
Compared to the above solutions (from Table 3), the proportion of long-term debt and
block stockholders has a significant negative relationship with independent director proportion
because it increases independent directors' proportion in the hi-tech industry. This improves
supervisory strength of the board of directors and prevents managers' from excessively

The International Journal of Organizational Innovation Vol 2 Num 4 Spring 2010 133
expanding credit to cause a financial crisis. This paper does not examine why block stockholders
have a significant negative relationship with independent directors, thus we cannot clearly point
out this relationship. Institution investor stockholding ratio、director stockholding ratio、sales
growth and capital expenditure also have an insignificant relationship with independent directors'
proportion. Therefore, these variables have no effect on independent directors' proportion.
Conclusion
Previous literature has used traditional indexes to measure firm value; however this
method only calculates short-term performance. This may lead the administrator to manipulate
short-term performance and sacrifice long-term interests, making it impossible to reflect true
value. EVA creates enterprise value This research measured performance using economic value
added (unadjusted、adjusted、economic depreciation ) and market valued added. Empirical
results show that independent directors' proportion increases EVA, because the independent
director has supervisory power over the administration and prevents fraud to ensure stockholder's
equities or creates greater value in the high-tech industry of Taiwan. On the other hand, this
research concludes that inside directors' proportion has a significant positive relationship with
EVA, because it plays a professional role to supervise administrators in the Taiwan hi-tech
industry.

The International Journal of Organizational Innovation Vol 2 Num 4 Spring 2010 134
Table 1: Descriptive Statistics for Variables
(N = 1308)
Variable Min Max Average S. dev.
EVA1 -979184 642,383 74,007 150,428
EVA2 -1,571,112 444,119 -42733 208,426
EVA3 -1,560,538 605,590 -9685 218,174
MVA -3,246,790 7,112,788 902,798 1,474,028
INDEP 11.11% 60.00% 30.55% 9.66%
INSOWN 0% 71.74% 22.78% 12.54 % DEBT 0% 41.81% 6.97% 8.70%
GW -82.46% 235.92% 16.49% 32.99%
INST 0% 100.% 29.89% 19.89% CAPEXP 0.9032 5.0846 1.0792 8.0698
Table 2 Regressions of Independent Directors' Proportion with EVA、MVA
(N=1308)
Independent variable
Intercept INDEP INSOWN DEBT BLOCK GW INST CAP adj- 2R
A 5.113*** .256*** .006** .004 .061 .003** .002 .005** 0.214
B 5.360*** .246*** .005 -.008* .235** .000 .002 .21** 0.215
C 5.369*** 273*** .005 -.007 .208** .000 .002 .004 0.237
D 4.268*** .125 0.01 -0.02 .117 2.357*** 1.136*** 0.05 0.327
*:p<0.1、**: p<0.05、***: P<0.01
Notes: 1.We used VIF to test linearity between variables. The values are all lower than 2,
showing lack of linearity.
2.Panel A: Dependent variable is EVA1;Panel B: Dependent variable is EVA2;Panel
C: Dependent variable is EVA3;Panel D: Dependent variable is MVA
3. Model:
ttttttttt CAPEXPINSTGWBLOCKDEBTINSOWNINDEPEVA εαααααααα ++++++++= 76543210
ttttttttt CAPEXPINSTGWBLOCKDEBTINSOWNINDEPMVA εαααααααα ++++++++= 76543210

The International Journal of Organizational Innovation Vol 2 Num 4 Spring 2010 135
Table 3: Regressions of EVA、MVA with independent directors' proportion
(N=1308)
Independent variable
A Intercept EVA1 INSOW DEBT BLOCK GW INST CAPEXP adj- 2R 1.222*** 0.148*** .003 -.005* .000 .001 -.001 .001 0.290 B Intercept EVA2 INSOW DEBT BLOCK GW INST CAPEXP adj- 2R 1.133*** 0.132*** .003 -.005* -.005* .001 -.001 .001 0.312 C Intercept EVA3 INSOW DEBT BLOCK GW INST CAPEXP adj- 2R 1.246*** 0.154*** 0.003 -0.005 0.005 0.001 -0.001 0.001 0.307 D Intercept MVA INSOW DEBT BLOCK GW INST CAPEXP adj- 2R 1.057*** 1.135*** 0.022 -0.877** -0.932** 0.025 0.018 0.036 0.322
*:p-value<0.1、**: p-value<0.05、***: P-value<0.01
Notes: 1 We used VIF to test linearity between variables. The values are all lower than 2,
showing lack of linearity.
2. Dependent variable is independent directors' Proportion
3. Model:
ttttttttt CAPEXPINSTGWBLOCKDEBTINSOWNEVAINDEP εαααααααα ++++++++= 76543210
ttttttttt CAPEXPINSTGWBLOCKDEBTINSOWNMVAINDEP εαααααααα ++++++++= 76543210
Compared to the above reference, the proportion of long term debt has a significantly
negative relationship with independent directors' proportion because independent directors'
proportion has more power to control the capital structure. This prevents the manager from
expanding financing that leads to a financial crisis. According to the above solutions, this
research focuses on the high-tech industry. This research cannot conclude why block
stockholders have a significantly negative relationship with independent directors. The authors
suggest that other variables, such as management quality and independent directors’ experiences
or education be added in future studies.

The International Journal of Organizational Innovation Vol 2 Num 4 Spring 2010 136
References
Allgood, S. & Farrell, K. A. (2003). The Match between CEO and Firm. Journal of Business, 76
(2), 317-340.
Austin, M. L. (2005). Benchmarking to economic value added: The case of Airways Corporation
of New Zealand. Benchmarking, 12(2), 138-151.
Bailey, E. E. & Helfat, C. E. (2003). External Management Succession, Human Capital and Firm
Performance: An Integrative Analysis. Managerial and Decision Economics, 24, 347-
369.
Beiner, S., Drobetz, W., Schmid, M. M., & Zimmermann, H. (2006). An Integrated Framework
of Corporate Governance and Firm Valuation. European Financial Management, 12(2),
249–283.
Hu, H. W., Tam, O. k., & Tan, M. (2009). Internal governance mechanisms and firm
performance in china. Asia Pacific Journal of Management, Forthcoming.
Jensen, M. C. & Meckling, W. H. (1976). Theory of the Firm: Managerial Behavior, Agency
Costs and Ownership Structure. Journal of Financial Economics, 3, 305-360.
Kaur, M. & Narang, S. (2008). Economic Value Added Reporting and Corporate Performance: A
Study of Satyam Computer Services Ltd. The ICFAI Journal of Accounting Research,
VII (2), 40-52.
Kaur, A. & Pal, k. (2008). Awareness of Economic Value Added Among Indian Corporate
Managers: Evidences from a Primary Survey. The Icfai Journal of Applied Finance,
14(8), 53-65.
Neumann, R. & Voetmann, T. (2005). Top Executive Turnovers: Separating Decision and
Control Rights. Managerial and Decision Economics, 26 (1), 25-37.
Parrino, R., Sias, R., & Starks, L. (2002). Voting With Their Feet: Ownership Changes around
Forced CEO Turnover. Journal of Financial Economics, 68, 3-46.
The International Journal of Organizational Innovation Vol 2 Num 4 Spring 2010 137
Peng, M.W. (2004). Outside Directors and Firm Performance during Institutional Transitions.
Strategic Management Journal, 25, 453-471.
Petra, S.T. (2005). Do outside independent directors strengthen corporate boards Corporate
Governance? International Journal of Business in Society, 5, 55-64.
Pohlen, L. T. & Coleman, J. B. (2005). Evaluating Internal Operations and Supply Chain
Performance Using EVA and ABC. SAM Advanced Management Journal, 70 (2), 45-58.
Shen, W. & Cannella, Jr, A. A. (2003). Will Succession Planning Increase Shareholder Wealth?
Evidence from Investor Reactions to Relay CEO Successions. Strategic Management
Journal, 24, 191-198
Shen, M. J., Hsu, C. C., & Chen, M. C. (2006). A Study of Ownership Structures and Firm
Values under Corporate Governance - the case of listed and OTC companies in Taiwan
Finance industry, Journal of American Academy of Business, Cambridge, 8(1), 184-191.
Stewart III, G. B. (1991). The Quest for Value: a Guide for Senior Managers, New York: Harper
Business.
Appendix A
This research defines the EVA (Steward, 1991) model in three ways as follows:
1. EVA1: (unadjusted EVA) = NOPAT-(WACC× IC)
NOPAT = Pretax operating income (1-cash tax rate)
Invest capital(IC) = asset- non bear debt- short term securities investment - construction
in process
2. EVA2: adjusted EVA (join adjusted items) = NOPAT- (WACC× IC)
NOPAT = pretax operating income (1-cash tax rate) + adjustment items
Invest capital(IC) = asset - non bear debt - short term securities investment-construction
in process + adjusted items
3. EVA3: adjusted EVA (join economic deprecation adjusted items) = NOPAT-(WACC× IC)
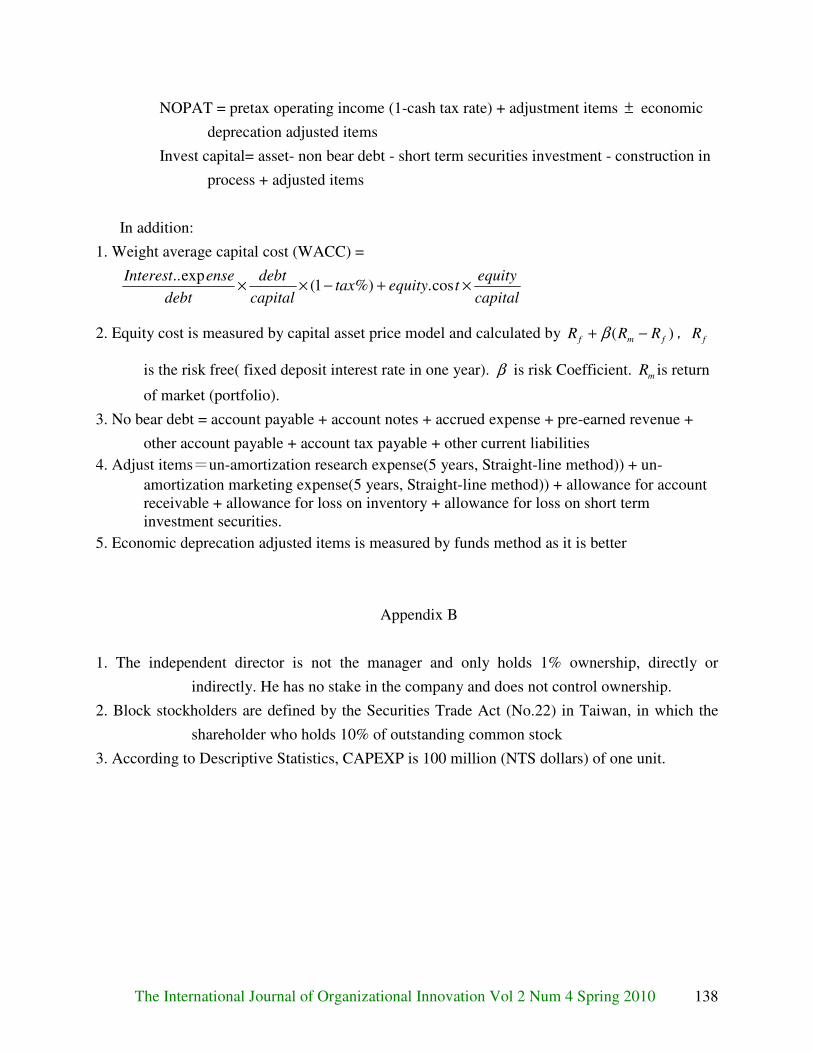
The International Journal of Organizational Innovation Vol 2 Num 4 Spring 2010 138
NOPAT = pretax operating income (1-cash tax rate) + adjustment items ± economic
deprecation adjusted items
Invest capital= asset- non bear debt - short term securities investment - construction in
process + adjusted items
In addition:
1. Weight average capital cost (WACC) =
capital
equitytequitytax
capital
debt
debt
enseInterest×+−×× cos.%)1(
exp..
2. Equity cost is measured by capital asset price model and calculated by )( fmf RRR −+ β ,
fR
is the risk free( fixed deposit interest rate in one year). β is risk Coefficient. mR is return
of market (portfolio).
3. No bear debt = account payable + account notes + accrued expense + pre-earned revenue +
other account payable + account tax payable + other current liabilities
4. Adjust items=un-amortization research expense(5 years, Straight-line method)) + un-
amortization marketing expense(5 years, Straight-line method)) + allowance for account receivable + allowance for loss on inventory + allowance for loss on short term investment securities.
5. Economic deprecation adjusted items is measured by funds method as it is better
Appendix B
1. The independent director is not the manager and only holds 1% ownership, directly or
indirectly. He has no stake in the company and does not control ownership.
2. Block stockholders are defined by the Securities Trade Act (No.22) in Taiwan, in which the
shareholder who holds 10% of outstanding common stock
3. According to Descriptive Statistics, CAPEXP is 100 million (NTS dollars) of one unit.

The International Journal of Organizational Innovation Vol 2 Num 4 Spring 2010 139
RESEARCH AND DEVELOPMENT ON THE APPLICATION OF TRIZ
INNOVATIVE PRINCIPLES TO BALANCED SAILBOAT PATENT
Liu, Mean-Shen
Wu, Sheu-Der
Hong, Wen-Che
Department of Food and Beverage Management
Far East University, Taiwan
Abstract
In these times of advanced technology and fierce competition, an enterprise must research and
develop a market-monopoly product if wanting to possess a particular competitive advantage.
This is the basis for an enterprise to keep sustainable management. Therefore, the concept of
“Innovation” will certainly become one of essential conditions for an enterprise to keep
sustainable management. In this Research, we try to apply the concept of Contradiction Matrix to
balanced sailboat. It is hoped with the help of this tool that an enterprise can have a principle to
follow in product innovation, research and development. If encountering a relative problem in
the future, an enterprise can use “Innovation” method to solve the problem. In this way, the
enterprise can not only remove unfavorable factors blocking its development, but also cultivate
capability of solving problems in the whole course, and then create brilliant achievements.
Keywords: TRIZ, Inventive, Contradictory, Matrix

The International Journal of Organizational Innovation Vol 2 Num 4 Spring 2010 140
Introduction
In the 21 centuries with advanced technology and fierce competition, an enterprise must
make full use of its internal resources to engage in innovation and invention and create values for
customers and whole society if wanting to establish a particular competitive advantage. Thus,
“Innovation” will certainly become one of essential conditions for an enterprise to keep
management advantages persistently.
With continuous importance attached to innovation industry, more and more people are
devoted to research on innovation and invention. But innovation is a kind of instinctive mental
process and innovative procedure is a kind of unscientific program, so it is not a task that
everyone is competent for. If with an assistant tool, an enterprise can shorten the time of
developing new products and make developing process more smooth and innovative process
scientific. In this Research, we try to use TRIZ as innovative tool. It is hoped that this set of
systematic process can be offered to enterprises or product developers for reference and assist
them to solve problems by innovative methods when they encounter bottlenecks in invention. In
this way, an enterprise can not only remove obstacles, but also cultivate capability of solving
problems in the whole course, obtain learning effect by all-round consideration, become familiar
with and internalize these methods and raise professional capability of organizational members.

The International Journal of Organizational Innovation Vol 2 Num 4 Spring 2010 141
In this Research, we try to apply the concept of Contradiction Matrix to innovation and
invention of balanced sailboat. It is hoped with the help of this tool that an enterprise can have a
principle to follow in product innovation and invention and a product developer can develop a
new product rapidly and scientifically.
Major themes in this Research are as below.
Ⅰ.Using 40 Innovative Principles of TRIZ for innovation and invention
Ⅱ.Using 39 Engineering Parameters of TRIZ for fit of product attributes
Ⅲ.Using Contradiction Matrix for analysis
Ⅳ.Illustrating feasibility of Innovative Principles corresponding to Single Engineering
Characteristic (lack of contradiction message)
TRIZ Innovative Principles
To engage in innovative methods, the need to use methods to facilitate the output of
innovative ideas, the commonly used methods are these methods,such as Brain Storming, Solo
Brain Storming, Gallery Method and Delphi Method.(Liu Zhicheng, 2003). Recently TRIZ is
often applied to product improvement, research and development. Quality Function
Development Method can assist enterprises to research and develop competitive products
meeting customers’ demands. It is considered in this Research that systematized thinking ways

The International Journal of Organizational Innovation Vol 2 Num 4 Spring 2010 142
of TRIZ can be more capable of assisting originators with research and development, so TRIZ
innovative methods are adopted.
Significance of TRIZ
TRIZ, a Russian abbreviation for Teoriya Reshniya Izobretatelskikh Zadatch, means
Theory of Inventive Problem Solving. TRIZ is an innovative method of concluding concrete
connotation of novel thoughts and problem improvement of all the innovators and inventors in
the world, enabling innovation to be considered in systematized ways, breaking through
limitation of individual inertial thinking and guiding product innovation to a correct direction.
TRIZ is a Tool of Resolving Contradictory Problems
Technical Contradiction
If two different parameters in a system conflict with each other, a technical contradiction
exists in this system. At the time of encountering a technical contradiction, we usually use
Contradiction Matrix to solve the problem. This is a two-dimension matrix, in which rows
represents improving parameters, columns stands for worsening parameters and the fields
corresponding to these two contradicted parameters are the inventive principles suggested for use
by TRIZ. In this article, Solution Mapping 5 Stage (Shulyak & Steven Rodman, 2002) is used for
analysis on present status, Contradiction Matrix and inventive principles. Stage 1 is to find out
the factors needing for improvement. Stage 2 is to contrast the factors needing for improvement

The International Journal of Organizational Innovation Vol 2 Num 4 Spring 2010 143
with Contradiction Matrix parameters. Stage 3 is to list possible directions of solving problems.
Stage 4 is to confirm if directions of solving problems appear with contradictions. Stage 5 is to
compare parameters with each other and find out possible inventive principles. Contradiction
Matrix is as shown in Table 1.
Table 1.Contradiction Matrix
1 9 21 39 Deteriorative characteristics
Improved characteristics
weight of moving object
speed
power productivity
1 weight of moving object
9 speed
21 power
39 productivity
40 Inventive (Innovative) Principles
40 Inventive Principles are the best way to resolving system contradictions. If
contradiction characteristics of a system are confirmed, suitable Innovative Principles can be
found in Contradiction Table to resolve contradictions. Concepts of 40 Innovative Principles are
as shown in Table 2.
Rules of Selecting TRIZ Innovative Principles
Using 40 Principles One by One

The International Journal of Organizational Innovation Vol 2 Num 4 Spring 2010 144
The simplest method is to browse TRIZ 40 Principles one by one, take them as hints of
inspiring innovation directly without regard for engineering parameters and contradictory
Table 2. 40 Principles of the Invention
1.Segmentation � dismantling of an object into several independent parts
( make an object easy to disassemble ( increase the level of division or partition
2. Separation � extracted from an object components or properties of unpleasant � extracted only the parts or attributes required.
3.Local quality � An object by the same composition structure transformation into different compositions � To make an object in its restrictions, every conceivable part of the components most appropriate action. � To make every part of an object can achieve different and useful function.
4.Asymmetry
� To an object by the
symmetric structure to asymmetric structures. � If an asymmetric structure of the original object, then change its degree of asymmetry.
5. Combination �To merge the same or similar objects, or a collection of the same or similar components to achieve the same operation. �The same or continuous operation iwill be integrated in time.
6. Multifunctional � An object or structure will have various functions, in order to eliminate the rest of demand
7. Nested structure � Objects can be placed inside another object � One object to another object through the holes.
8. Antigravity � To compensate for the weight of an object,that can be connected to the object of lifting force. �To compensate for the weight of an object thatcan be interact with the buoyancy of air power or water provided by the environment.
9. Prior counteraction � If necessary, they should consider the reaction in advance. � In an object in advance to give a pressure (Tension) force to counter the other
10. Prior Action � Be prepared in advance, so that Objects can be roles timely and in the appropriate place. � To complete all the action in advance
11. In advance to prevent � To compensate for the low reliability of the object can be pre-emptive measures.
12. Equipotentiality � To change the status of the work can reduce the object is lifted or reduce the number of times.

The International Journal of Organizational Innovation Vol 2 Num 4 Spring 2010 145
pressure (Tension) force of existence and known.
or at least the completion of part of the action.
13. Reversion � The way often used to solve specific problems is thinking in the reverse. � To a movable object is fixed, put a fixed object to can be moved. � The object or processwill be upside down.
14. Camber � The use of curve or surface to replace the straight-line components in order to replace the cube sphere. � The use of roller, ball or spiral. � The linear motion into a roll, using centrifugal force.
15. Dynamic � So that characteristics of the object or the external environment in various stages of operation in order to achieve optimal performance automatic adjustments. � Put an object into several parts and there are relative motion capabilities. � If an object or process is rigid or non-deflection, and turn it into a movable, or may be deflection.
16. The role of inadequate or excessive � If you can not easily be 100% of the expected results, then use the same method, consider using a little less the amount of one or more may be easier to resolve.
17. Transition to the new space � Move an object into two-dimensional or three-dimensional space. � In order to replace the single-layer multi-layer. � Projected image to the neighboring region or the other side of the object.
18. Mechanical Vibration � To object to vibrate. � Increase the frequency of vibration.� The use of resonant objects. � Replaced by mechanical vibrations using a piezoelectric vibration, combined with supersonic vibration, and electromagnetic fields.
19. Periodic Action � The use of the continuity of the movement to replace the periodic movement. � If you already have is periodic motion, then the change in amplitude or frequency. � Using pulse pause between the time to reach a different movement.
20. The usefulness of continuous movement � Uninterrupted completion of an action, the object of all the parts should be fully operational. � Remove useless and intermediate actions. � Replaced with the turning motion back and forth movement.
21. Rapid effect � At high speeds the completion of harmful or dangerous actions.
22. Would be detrimental to become a useful � So harmful factor to achieve a positive impact.
23. Feedback � Feedback to improve the introduction of an action or process.
24 Mediator � The use of an intermediate material to the conversion or complete an action.

The International Journal of Organizational Innovation Vol 2 Num 4 Spring 2010 146
� Of another harmful factor to replace the harmful factor. � Increase in harmful factor in the amount of damage until it stops.
� If feedback already exists, then change its size or influence.
� Being an object and another object will be connected together to facilitate remove it.
25. Self-help � Enable the object to him to supplement and repair operations. � So that materials and energy are not wasted.
26. Reproduce � A simple, inexpensive replica to replace the complex, expensive, fragile, not convenient to manipulate objects. � With optical copies, optical image instead of an object or system, a scale can be used to reduce or enlarge images. � In order to replace the visible light, infrared or ultraviolet copy to copy.
27. Disposable � The use of various composite low-cost substitutes for expensive items, to meet quality compromise.
28. Mechanical system replacement � Visual, auditory, olfactory system to replace the mechanical systems. � With electric field, magnetic field, electromagnetic field so that objects interacts. � The static field into a dynamic field, the structure of the market into non-structured games. � To make field and activation of particles (magnetic) combined.
29. The use of gas or liquid � Of gas or liquid to replace the solid parts of an object and these parts can use air or water or air or expansion of hydrostatic cushion.
30. Flexible shells and thin films � A flexible membrane and thin-film structure to replace the original. � To pure film will be isolated objects and the external environment.
31. Porous materials � To make or use an object-oriented add-porous porous component objects (embedded pieces, cover, etc.). � If the object has many holes, then the pre-populated with the material.
32. Color change � An object or to change the color of things around it. � An object or to change the color of things around it. � The use of color additives to observe an object or process is not easy to see. � If such additives have been used to re-trace the use of light-emitting elements.
33. Homogeneous � So that the interaction of objects derived from the same material or materials close to their behavior.
34. Disposal and recovery � When the object reached a post-functional or useless when it abandoned
35. Parameter changes � Changes in various states of an object, density, concentration, flexibility, temperature.
36. Phase transition � Phase in the material transformation process to achieve an effective growth. For example,
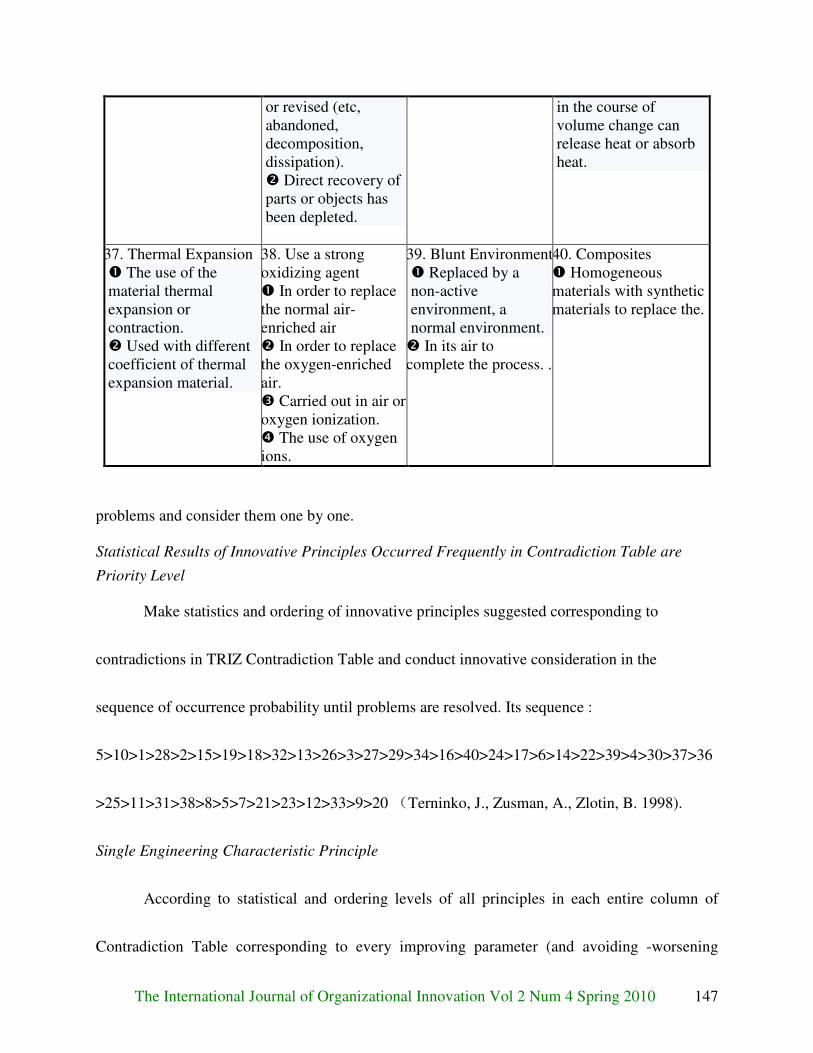
The International Journal of Organizational Innovation Vol 2 Num 4 Spring 2010 147
or revised (etc, abandoned, decomposition, dissipation). � Direct recovery of parts or objects has been depleted.
in the course of volume change can release heat or absorb heat.
37. Thermal Expansion � The use of the material thermal expansion or contraction. � Used with different coefficient of thermal expansion material.
38. Use a strong oxidizing agent � In order to replace the normal air-enriched air � In order to replace the oxygen-enriched air. � Carried out in air or oxygen ionization. � The use of oxygen ions.
39. Blunt Environment� Replaced by a non-active environment, a normal environment. � In its air to complete the process. .
40. Composites � Homogeneous materials with synthetic materials to replace the.
problems and consider them one by one.
Statistical Results of Innovative Principles Occurred Frequently in Contradiction Table are
Priority Level
Make statistics and ordering of innovative principles suggested corresponding to
contradictions in TRIZ Contradiction Table and conduct innovative consideration in the
sequence of occurrence probability until problems are resolved. Its sequence :
5>10>1>28>2>15>19>18>32>13>26>3>27>29>34>16>40>24>17>6>14>22>39>4>30>37>36
>25>11>31>38>8>5>7>21>23>12>33>9>20 (Terninko, J., Zusman, A., Zlotin, B. 1998).
Single Engineering Characteristic Principle
According to statistical and ordering levels of all principles in each entire column of
Contradiction Table corresponding to every improving parameter (and avoiding -worsening

The International Journal of Organizational Innovation Vol 2 Num 4 Spring 2010 148
parameter), the higher level an innovative principle is at, the more times this principle was ever
used for, i.e., the higher successful rate of resolving problems related to engineering parameters
by use of this innovative principle is. Therefore, level sequence should be used to find suitable
innovative principle when Single Engineering Characteristic Principle is adopted(Chen Liu and
Jahau Lewis Chen .2001).
Engineering Parameter Pairing Statistical Method
Firstly find out engineering parameters possibly affecting this design and regard each of
them as “improving” or “avoiding-worsening” parameter, secondly pair them to get multi-
groups of contradictions, and then seek out and record inventive principles corresponding to each
group by Contradiction Matrix. These inventive principles occurring for more times are the top-
priority solutions, and it is considered in the last place whether these engineering parameters are
fit for their designs or not. If necessary, people should be regarded as judgment basis(Zhang
Xiangtang, 2003).
Statistical Method of Innovative Principles after Contrasting Multi-groups of Contradictions to
Engineering Knowledge
Firstly obtain multi-groups of contradictory relations, secondly delete more inapplicable
or little-effect contradictions according to the degree of users’ grasping engineering knowledge
of this problem, and then make statistics of innovative principles and conduct creative
consideration one by one in the sequence of occurrence probability.

The International Journal of Organizational Innovation Vol 2 Num 4 Spring 2010 149
After Multi-groups of Contradictions Defining Statistical Method of Innovative Principles One
by One
List one by one the engineering parameters and their contradictory relations affecting
problems, hereby obtain innovative principles suggested to each group of contradictions by
TRIZ, and then make statistics of these principles and conduct creative consideration one by one
in the sequence of occurrence probability. (Chen Liu and Jahau Lewis Chen .2001).
Single Conflict for the Next to Innovative Principle Every Time
Firstly find out one “improving” engineering parameter and one “avoiding-worsening”
engineering parameter definitely, and then look up corresponding principles suggested in
Contradiction Table for innovative consideration.
Product Design Method
By taking Green Design Method of Liu Zhicheng and Wang Shuiduo (2007) for reference,
product design process is planned in this Research, as shown in Chart 1. For design objects, there
are 7 steps as below. First is to analyze a problem or demand of a product. Second is to establish a
subassembly function analysis table and confirm improving engineering parameters of the product.
Third is to try to find a feasible conventional method and analyze probably-caused side effects of
this method. Forth is to contrast it to contradiction contrast table of 39 engineering parameters, seek
one group or multi-groups of contradictions and find out an innovative principle suggested. Fifth is

The International Journal of Organizational Innovation Vol 2 Num 4 Spring 2010 150
to construct a feasible solution. If unable to find out contradiction message, you can use improving
parameters corresponding to Single Characteristic Innovative Principle to find an innovative
principle suggested and visualize a feasible solution. Sixth is to inquire about whether there is any
similar product or correlative patent in the market. If any, you should give up your design concept
and get back to conventional methods for analysis. Seventh is to file an application for a patent.
Unpatented
Patented
Chart 1 Product Design Process
Innovative principles corresponding to single engineering characteristic are applied in
this Research. Firstly apply each “improving engineering characteristic” in TRIZ Contradiction
Table, and then sort out their correspondent innovative principles. Here, occurrence times of
some principle can be regarded as the amount of kinds of “avoiding-worsening engineering
characteristics” probably matched at the time of improving “some engineering characteristic” of
a system. The more times some principle occurs for, the higher successful rate of solving
Design Object Analyze a
problem or demand of a
product. To establish a Subassembly function
analysis table (To confirm improving engineering parameters) To find a feasible
conventional method and worsening
Contradiction contrast table
Application for
A patent Single characteristic innovative principles Correlation innovative principles
Design Conceive
Evaluation

The International Journal of Organizational Innovation Vol 2 Num 4 Spring 2010 151
problems by this principle is. Here, vertical axis shows 39 engineering parameters of TRIZ, and
horizontal axis indicates occurrence times of innovative principle corresponding to this
engineering characteristic. Principle table is as shown in Table 3 (only list engineering
parameters applied in this Research that are No. 07, 27 and 33 parameters, and their occurrence
times), table of innovative principle corresponding to single engineering characteristic is as
shown in Table 3, and innovative principle flow chart is as shown in Chart 2.
Table 3 Innovative Rule Table Of Corresponding To The Single Engineering Properties
grade
Engineering parameters
A 19times or more
B 16~18 times
C 13~15 times
D 10~12 times
E 7~9
times
F 4~6 times
G 1~3 times
07. The volume of moving objects
35 02.10.
29
01.15.34
.04.06 13.40.
16.28.14.39.17.18.26 .22.30.25.37.36
24.28.11.12.32.19.09.23 .27.20.2105.03
27. Reliability 35.10.
11 40.
28.27.03
01 13.24.08 02.32.29
19.21.0414.16.2317.39.2615.36.06.
34.31 09.30.3825.05.18
33. Use of convenience
01. 13 02.28. 35.32.
12.15.
34.25.
16.26.17.27.
04.03.1024.40.19.39.29.
22.30.0518.23.06.08.0931.07.11
Data source:(Liu Zhicheng, 2003)Finishing this study

The International Journal of Organizational Innovation Vol 2 Num 4 Spring 2010 152
To improve characteristics Prevent further deterioration
Characteristics of an Engineering of the of an Engineering’s
Chart 2.Innovation Rule Flowchart Of Corresponding To The Single Engineering
Case Study
Product Name: Balanced Sailboat
Case Demand
Abecedarians of windsailing sport often overturn sailboats due to improper operation. In
this Research, we try to infuse water into the hole of balanced seat to prevent sailboat from being
overturned, and thereby improve safety and convenience of windsailing abecedarians’ using their
sailboats, reduce their feeling of fear and increase function of entertainment. Its subassembly
functions are as shown in Table 4.
Innovative rule or
Innovative rule table of corresponding to the single engineering

The International Journal of Organizational Innovation Vol 2 Num 4 Spring 2010 153
Table 4 Menu bar components
Code name
Component Function
1 Plate body First or second surface contains Plate body
11 First surface of Plate body
Sail body connecting to fixed mast
12 Second surface of Plate body
To connect balance block
2 Sail body To produce thrust
21 Mast To fix mast
3 Balance seat To lower center of gravity to the underwater
31 Cabin
Let water in and out to maintain a balance of the balance seat
32 Voids Let water flow out
Innovative Procedure
Seek for Improving Parameter.
Method of Using 40 Principles One by One is applied to this product. It is known from
Innovative Principle Table corresponding to Single Engineering Characteristic (Table 3) that this
product has improving engineering parameters, such as 07. Volume of Moving Object: 3-D
Measurement Moving Object; 27.Reliability: System has the ability to properly carry out its
functions; 33. Convenience of use: System was the ease of operational or use.
Innovative Principle Corresponding to Single Engineering Characteristic.
In accordance with No. 07, 27 and 33 improving engineering parameters of this product
and in contrast with single engineering parameter, it is found that No. 07 parameter (volume of
moving object) is applied more than once and correlative principles related to this product are
No. 03, 06, 08, 10 and 11 principles, No. 27 parameter (reliability) is applied more than once and

The International Journal of Organizational Innovation Vol 2 Num 4 Spring 2010 154
correlative principles related to this product are No. 03, 06, 08, 10 and 24 principles, and No. 33
parameter (convenience to use) is applied more than once and correlative principles related to
this product are No. 03, 06, 08, 10, 11 and 24 principles. Therefore, the innovative principles
correlated to this product are as below. No. 03 Principle -- Partial Quality: convert windsailing
steel plate structure into the structure made up of different components and enable each part with
different and useful functions. No. 06 Principle -- Multifunction: enable structure of balanced
sailboat with multifunction to eliminate demands of other parts. No. 08 Principle -- Antigravity:
produce interaction with water buoyancy in order to compensate weight of wind fans. No. 10
Principe -- Beforehand Function: preset balanced seat and capacity room of balanced sailboat for
needs of abecedarians. No. 11 Principle -- Prevention: take countermeasures of reducing center
of gravity in order to compensate possibility of sailboat overturn. No. 24 Principle -- Mediator:
use water to complete action of balance.
Presenting Design Concept.
In this Research, the principle of reducing gravity center is used for sailboat learners to
avoid risk of sailboat turnover and feeling of fear at the time of operating sailboats. By use of
No. 03 principle that is partial quality, sailboat plate is changed into 2 surfaces. A mast is fixed
on the first surface, and lashing ring of the second surface is connected with a balanced seat.

The International Journal of Organizational Innovation Vol 2 Num 4 Spring 2010 155
There is a capacity room set inside the balanced seat. Furthermore, plural holes penetrated into
the capacity room are set on the balanced seat.
By use of No. 06 principle that is multifunction, sailboat plate is able to stand on as well
as store water to increase gravity center. By use of No. 08 principle that is antigravity, gravity
center is reduced for increase of wind fans’ weight, and water in windsailing sport environment
enters into balanced seat of plate to realize the aim of balance. By use of No. 10 principle that is
beforehand function, balance room and capacity room preset in plate are convenient for
abecedarians to use before sailboat turnover so as to avoid turnover. By use of No. 11 principle
that is prevention, a balance room is preset for purpose of containing water to reduce sailboat
gravity center and prevent sailboat from turnover. By use of No. 24 principle that is mediator, a
mediator is added in order to increase gravity center, comes from inexhaustible water in
windsailing sport environment and possesses function of environmental protection. Such sailboat
with better balance designed on these grounds to reduce accident occurrence is easy for
abecedarians to overcome fear. Tridimensional appearance chart, plan profile chart, user
operation chart and forward moving chart of balanced sailboat are as shown in Chart 4, Chart 5,
Chart 6 and Chart 7.
Patent Search.

The International Journal of Organizational Innovation Vol 2 Num 4 Spring 2010 156
As to this design, search Patent Information Network of Republic of China, enquire
whether there is any correlative patent product registered or not. After inquiry with key word
“windsailing”, No. 1302513 patent is searched out. Search results are as shown in Table 5 & 6.
Table 5 Patent Search Results
Patent Search Keywords Search Results
Resemble Patent
Stabilizer 1 1
Source: Republic of China Patent Information Retrieval System
Table 6 Ship Stabilizer
Search Date:October 9, 2009
Certificate No:I302513
Applicants:Xie Minpu
Proposal Name:ship stabilizer
Source: Republic of China Patent Information Retrieval System
Comparison of Search Results.
Through search of each patent, a product with similar function named ship stabilizer is
found. This stabilizer mainly uses a servomotor to cause movement of a quality body and
generate from boat body corresponding to movement of the quality body a reaction moment as
anti-rolling moment to realize anti-rolling effect. It shows after evaluation that its structural parts
is more sophisticated than new-style patent studied in this Research as well as with higher cost,
so this creation is valuable.
Evaluation.

The International Journal of Organizational Innovation Vol 2 Num 4 Spring 2010 157
Except this creation, no design completely same with this creation is disclosed in Patent
Information Search System of Republic of China at present. Moreover, patents with similar
principle are with more sophisticated structural parts and higher cost. Therefore, this creation is
novel and progressive.
Conclusions
1) When this method of product design process is applicable to product innovation design,
design personnel can find out on the basis of this method an innovation design method beneficial
for product research and development.
2) Utilizing 39 attributes (engineering parameters), Contradiction Matrix and 40 innovative
principles of TRIZ as basis of product innovation can make creators feel convenient and
practical.
3) Utilizing Single Innovative Principle of TRIZ (lack of contradiction message) can simply
analysis process, offer possible solution and make innovation design more efficient.
References
Chen Liu and Jahau Lewis Chen (2001), “A TRIZ inventive design method without contradiction
information”, TRIZ Journal, September 2001, http://www.triz-journal.com.
Liu Zhicheng(2003),“TRIZ Methods to Improve and Research on Green Innovation Design Method”,
National Cheng Kung University, Department of Mechanical Engineering,Unpublished doctoral
dissertation. Tainan.

The International Journal of Organizational Innovation Vol 2 Num 4 Spring 2010 158
LIU Zhi-cheng,Wang Shuiduo(2007),“TRIZ Method Applied in Green Product Design”. Far East
Journal, 24(2),P131~141.
Long Shi chang(2005),“Research to Explore the Enterprise Strategy Formation by TRIZ” National
kaohsiung First University of Science and Technology, Enterprise Management Institute,
Unpublished Master's Thesis,Kaohsiung.
Liu Mingsheng, Hung Sanchan , Lin Xiumin(2008),“TRIZ Applications of Inventive Principles ”.
published in Quality monthly , 44 (2),P55~58.
Shulyak & StevenRodman(2002), “40 Principles”, Technical innovation Center,Inc,
7.Terninko, J., Zusman, A., Zlotin, B. (1998),“Systematic innovation: an introduction to TRIZ”, St. Lucie
Press.
Zhang Xiangtang(2003), “Research on Integration of TRIZ and Green Design Innovation of Extension
Method”, Institute of Mechanical Engineering, National Cheng Kung University, Unpublished
doctoral dissertation
Republic of China Patent Search System,
http://twpat3.tipo.gov.tw/tipotwoc/tipotwkm?000625D78D92000000000000000000A00000001E000000
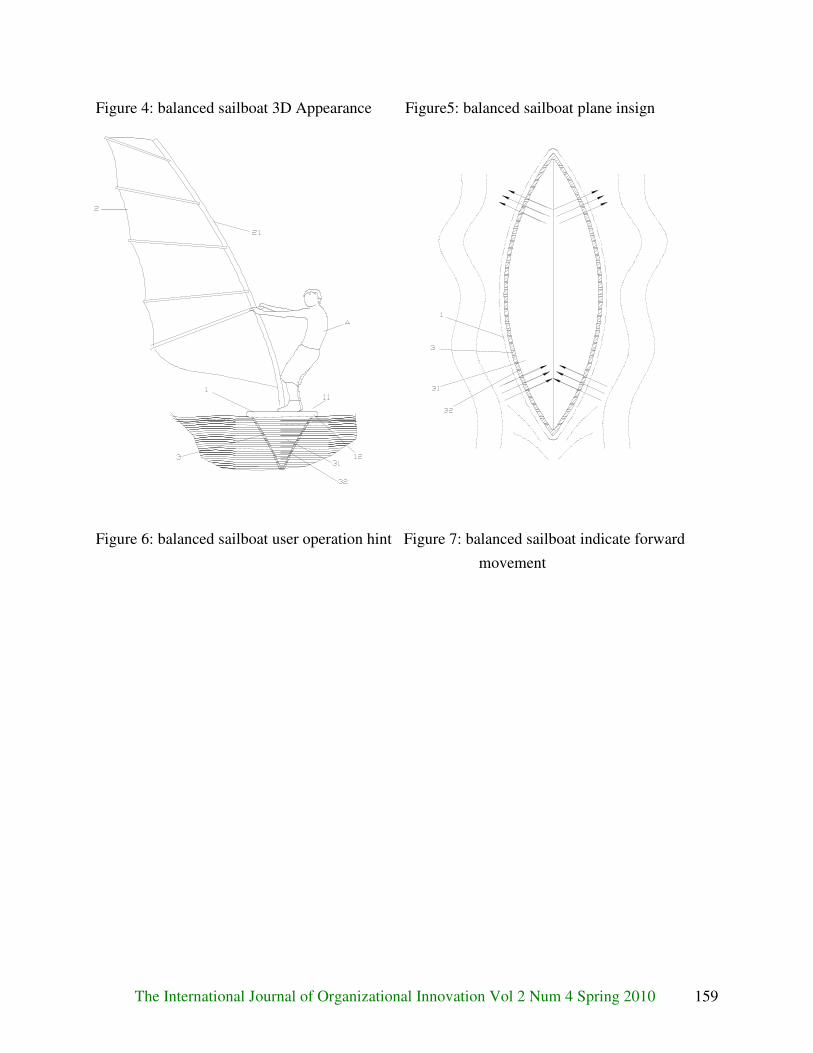
The International Journal of Organizational Innovation Vol 2 Num 4 Spring 2010 159
Figure 4: balanced sailboat 3D Appearance Figure5: balanced sailboat plane insign
Figure 6: balanced sailboat user operation hint Figure 7: balanced sailboat indicate forward
movement
The International Journal of Organizational Innovation Vol 2 Num 4 Spring 2010 160
A STUDY ON TAIWANESE ADULTS’COGNITION OF THE COLOR COMBINATIONS OF
HEALING TOYS
An Sheng Lee
National Chiayi University, Taiwan
Jyun-Wei Wang
Nanhua University, Taiwan
Abstract
The Japanese “癒す”means that comfort people and make favor for people. Recently,
people buy healing toys because a lot of people feel pain from their work and life. Healing toys
are used to make people happy and joy. Therefore, the colors are very important to healing toys.
The purposes of the study were as follows: (1) To analyze how healing toys of the market
match the colors. (2)To understand healing toys towards psychological cognition influence of
color combinations from adults’ views of different age brackets (3) To realize healing toys
towards satisfaction of color combinations from adults’ views of different age brackets. (4)To
explore adults of different age brackets towards main factors of color combinations of healing
toys.
The findings of the study were as follows: (1) The healing toys of the market now have soft
and warm color combinations. (2) The adults of age brackets prefer healing toys that have soft
and warm color combinations of people and animal styles. (3) Each adult of age bracket did not
show significant satisfaction difference. (4) The adults of age brackets towards matching color
images of healing toys the influence is affected by feeling factors.
Key words: Healing Toys, Color Image, Color Combinations
The International Journal of Organizational Innovation Vol 2 Num 4 Spring 2010 161
Introduction
Research Background and Motives
‘癒す’, a Japanese word, means healing in English, and it indicates one type of cultural
fashion in Japan in recent years. The fashion of healing toys has also begun to spread in the toy
market in Taiwan. Do the color combinations of healing toys meet Taiwanese adults’ needs?
What color combinations of healing toy do adults from different age groups, who have different
values and living styles, respectively prefer? These are both the motives behind the study. The
color of a commodity has influence on whether or not people need the commodity.
Consequently, it was expected to find out different-aged Taiwanese adults’ cognition of the color
combinations of healing toys as references and concrete suggestions for following research,
industries, the Government, and academia.
Research Purposes
The major purposes of the study are indicated as follows:
1. Analyzing and compiling the color combinations of healing toys available in the market.
2. Understanding the influence of the color combinations of healing toys on each adult age
group’s color cognition.
3. Studying each adult age group’s preference for the color combinations of healing toys.

The International Journal of Organizational Innovation Vol 2 Num 4 Spring 2010 162
4. Comprehending the major influential factors in each adult age group’s preference for the
color combinations of healing toys.
The study was expected to analyze and integrate the color combinations of healing toys
as well as to investigate the color combinations which fit in with each adult age group in Taiwan.
The principles of color combination in the study can be reference for designers and to the market
positioning of a product.
Research Scope and Limitations
The relationship between the color combinations of healing toys and each adult age group
in Taiwan was investigated in the study. The research scope and limitations are indicated as
follows:
1 Aiming at the healing toys currently available in the market in Taiwan.
2 Targeting only at the color combinations of healing toys and excluding other factors from the
investigation.
3. Investigating Taiwanese adults over 18 years old.
Literature Review
The Life Stress of Adults
The general definition of adult mainly focuses on one’s physical and psychological
changes and the social missions. Since adulthood is not stable, one, no matter internally or

The International Journal of Organizational Innovation Vol 2 Num 4 Spring 2010 163
externally, will have slow or dramatic physical and psychological changes in the entire
adulthood. Therefore, integrations and adjustments will unceasingly emerge in one’s entire
adulthood (Huang, 1992). In order to achieve social expectations, an adult has the so-called
stress generated when confronting the missions in each stage.
Stress can be resulted from diversified reasons. Due to the developing mission in the
adulthood, an adult’s stress comes more frequently from the financial stress of work. Siegrist
(2000), a German sociologist, deemed that the symptoms of stress emerged from the imbalance
between one’s work effort and work reward.
In terms of stress relief, Rice & Rice (1986) brought up the idea changing an individual’s
internal reactions through cognitive channels or transforming one’s mindset through
entertainment sublimation to enhance one’s positive emotions and ease the physical and
psychological fatigue. Healing toys designed and developed by Japanese manufacturers for
adults are exactly stress-releasing products aiming at adults’ stress resulted from the integrations
and adjustments of life or work.
Healing Toys
In the Chinese dictionary reedited by the Ministry of Education, Taiwan, a ‘toy’ is
interpreted as something playable. For an item to become a toy, there has to be a process in
which a toy player, namely a human, bestows meaning upon the item. It is the item which brings

The International Journal of Organizational Innovation Vol 2 Num 4 Spring 2010 164
a toy player, or a human, some kind of fun and satisfaction through certain formulas and ways
acting on itself.
Healing toys originated from the healing culture prevailing in Japan in recent years.
Healing indicates ’癒す’ in Japanese, which was translated from English, and the verbal
explanation is ‘to cure’, indicating curing illnesses or the needs resulted from mental
depressions. Healing series can also be called remedy series or curing series, and there is not a
particular name (Lan, 2006).
The healing culture basically originated from the 1980s, in which healing mainly
indicated, in terms of spirit, the religious world and, in terms of physical body, the pain caused
by illnesses and physical tortures when it was used as a noun. Until the later half of 1990, the
interpretation was extended to heart relief, which included higher psychological levels and
emphasized overall recovery.
Color Cognition
According to Zimbardo (1995), cognition is a psychological function, indicating the
progress for people to understand things.
Colors provoke one’s brain physically, further influence the psychology, and generate
emotional and active reactions in one’s daily life. Therefore, based on color quality, two
categories, namely color perception and color feeling, are generally established.

The International Journal of Organizational Innovation Vol 2 Num 4 Spring 2010 165
Hebb (1958), a Canadian psychologist, regarded perception as the direct process of the
stimuli resulted from the activities of sense organs and the medium process caused directly by
feelings. Consequently, color feeling is the most primitive and simple spiritual element whereas
color perception indicates the integration of feelings, which is more complicated than color
feeling (Tsou, 2000). Our facial features and all the organic organs frequently have various color
feelings about colors, which can be divided into, for instance, cool colors and warm colors as
well as advancing colors and receding colors. As for that colors influence perceptions,
physiologists have found that muscular strength and blood circulation will display different
colors of reaction rate due to different illumination colors (Hsieh, 2000). In light of the aforesaid,
colors indeed influence human beings physically and psychologically.
Color Images
A color image is interpreted as follows: ‘It indicates one’s ideas of, judgments on,
preferences for, and attitudes about colors; it emphasizes the content perceived on one’s mind or
in one’s feeling ; in short, colors make people generate psychology and feelings’ (Chen, 2008).
Aiming at color images, the Nippon Color & Design Research Institute (NCD) developed the
color image scale.
The classifications of the color image scale are based on the psychological feelings
caused by colors. The vertical axis of the scale indicates the colors from soft to strong, and the

The International Journal of Organizational Innovation Vol 2 Num 4 Spring 2010 166
horizontal one indicates the colors from warm to cool to form a rectangular coordinate system. In
addition, according to color images, the most appropriate location is chosen, and the arrangement
is applied to enable this system to construct a simple and convenient scale connecting color
images with verbal images.
Color Combinations
Cheng & Lin (2006) were of the opinion that color combination indicated that more than
two colors were combined to generate new visual effects. There are a lot of methods to combine
colors, including the combinations based on hue, those based on brightness, those based on
saturation, and those based on color tone. Furthermore, hue selecting is the top priority in the
combinations based on hue, in which the constructed effect and the predominant color hue of an
image should be considered, and the thinking associated with colors, color features, and the
differences between color preferences should be understood. Moreover, in the combinations
based on hue, colors are combined generally in light of color circle. According to the angles
constructed in the color circle, colors can be divided into the color combinations within the same
hue, those within similar hues, those within complementary hues, those within multiple hues, etc.
The combinations within multiple hues can be further divided into the combinations
within three hues and the combinations within four hues. In the color circle, the combinations
within three hues can be divided into the regular-triangle color combination and the isosceles-

The International Journal of Organizational Innovation Vol 2 Num 4 Spring 2010 167
triangle combination. The previous combination establishes a strongly contrastive and lively
feeling whereas the latter one creates a stable and tranquil feeling. Additionally, the
combinations within four hues can be divided into the square color combination and the four-
angle color combination (See Figure 1 for details). The previous combination has two pairs of
complementary colors, so the contrast is strong; the latter one is stable and unified. The
combinations within three hues may adopt the combination method of three equal colors or two-
to-one. The combination of three equal colors is tense; in the combination of two-to-one, one of
the colors can be the predominant color while the other two are the auxiliary colors.
Figure 1 Combinations within Multiple Hues
Data sources: Cheng & Lin (2006). Color Planning, p76.
In terms of color combination essentials, Cheng & Lin (2006) brought up the following
opinions:

The International Journal of Organizational Innovation Vol 2 Num 4 Spring 2010 168
1. Taking hold of the general goal, deciding the images of the major color tone, such as being
cool, warm, bright, dark, gorgeous, and simple, and the auxiliary colors, emphasizing the
relationship between color tones, and considering how to create more appropriate color
combinations and how to make better effects.
2. Selecting one proper predominant color according to the major color tone.
3. When selecting the second color, considering the contrast, balance, and brightness/darkness
of the color tones and the size and shapes of the colors according to the necessary effects.
4. In the following color combinations, considering the relationship between colors, applying
comparisons or auxiliary tools, such as color chip and color palette, in order to approximately
make sure the colors, and, then, slightly modifying in light of one’s aesthetic experience.
Hence, as for the color combinations of healing toys, it is necessary to decide the images
of color tone first, select then appropriately a predominant color and auxiliary colors, and match
up with the contrast, balance, and brightness/darkness of the color tones and the size and shapes
of the colors in order to create good color combinations consistent with one’s psychological
cognition.
Research Methodology and Implementation Steps
Research Methodology

The International Journal of Organizational Innovation Vol 2 Num 4 Spring 2010 169
The semantic differential technique, usually known as SD was employed in the study. It
have been extensively applied to diversified investigations and descriptions on psychological
feelings after being established by Charles E. Osgood et al., Ohio University, U.S.A., and the
major advantage lies in being able to further divide meaning into several stages to more minutely
comprehend one’s psychological feelings (Lai, 2006).
A SD profile linearly connects the means obtained by the application of the semantic
differential technique on the scale, by which feelings are objectively analyzed and compared
through values, the tendency of each set of color combination samples on the semantic scale is
discovered, and the images of each set of color combinations are further comprehended.
Research Implementation Steps
Stage 1: Selecting the Representative Samples of Healing Toys and the Adjectives for the Images
of Color Combinations.
This stage focused on selecting the representative samples of healing toys and the
adjectives for the color images. To select the representative samples of healing toys, the healing
toys currently available in the market in Taiwan were collected, categorized, and sifted out;
finally, by means of questionnaire survey, the representative samples most familiar to Taiwanese
adults from various age groups were selected for color combination.

The International Journal of Organizational Innovation Vol 2 Num 4 Spring 2010 170
In terms of the adjectives for the images of the color combinations of healing toys,
relevant literature and research were consulted to collect related adjectives, and a questionnaire
survey was conducted by interviewers with design background to select the adjectives suitable
for the investigation on the images resulted from the color combinations of healing toys.
Furthermore, 30 adults were pre-tested in order to revise or delete the adjectives difficult to
understand.
Selecting the Representative Samples of Healing Toys.
Lan (2006) classified healing toys into 3 categories, namely person, animal, and plant. In
the study, 30 person samples, 30 animal samples, and 30 plant samples, that is, totally 90
samples, were selected from the healing toys currently available in the market in Taiwan.
According to literature, the color combination of predominant color and auxiliary colors,
in which the predominant color should be larger in arrangement, was adopted in the study, so
respectively 9 person samples, 9 animal samples, and 9 plant samples, namely 27 samples in
total, were accordingly selected from the collected samples, and by means of questionnaire
survey, the most selected sample and the second most selected one in each category represented
respectively each category.
Selecting Adjectives for the Images of the Color Combinations of Healing Toys

The International Journal of Organizational Innovation Vol 2 Num 4 Spring 2010 171
As for the adjectives for the color images of healing toys, in the study consulted The
Color for Designer published by Image Research Institute Inc. (I.R.I.), Korea (compiled and
translated by Dr. Master Press, 2007), Color Image Scale by Nippon Color and Design Research
Institute (Kobayashi, 2000), An Investigation on Seniors’ Perceived Images of and Preference
for the Color Combinations of Web Pages (Huang, 2006), A Study on the Color Combinations of
Plastic Sunglasses from the Aspect of Color Cognition (Lin, 2007), and The Influence of the
Square Measure of Color Combination on Color Images (Chen, 2008). After the study compiled,
selected, and deleted repeated adjectives from the vocabulary suitable for describing healing
toys, 80 adjectives were finally selected.
Survey Result
This questionnaire survey was conducted in March, 2009, and the participants’ age was
between 18 and 32 years old. The questionnaire copies were delivered personally. In total, 30
copies were delivered, retrieved, and valid. From 9 person samples, 9 animal samples, and 9
plant samples, namely 27 samples in total, and 80 selected adjectives, the participants selected
the most familiar healing toys to be the representative samples of the color combinations of
healing toys and the adjectives for the images resulted from feeling.
As for the representative samples of healing toys, Sample 1 in the category of person was
the most selected, accounting for 40%, and the second most selected one was Sample 5,

The International Journal of Organizational Innovation Vol 2 Num 4 Spring 2010 172
accounting for 23%. Sample 5 in the category of animal was the most selected, accounting for
34%, and the second most selected one was Sample 8, accounting for 23%. In the category of
plant, the most selected one was Sample 3, accounting for 43%, and the second most selected
one was Sample 1, accounting for 30%. The detailed percentages are indicated by the following
table, from left to right and from high to low:
Table 1 Selected Percentage of Each Representative Sample of Healing Toys
No.1 No.5 No.2 No.6 No.8 No.4 No.3 No.7 No.9 Character Samples
% 40 23 13 7 7 7 3 0 0
No.5 No.8 No.7 No.4 No.3 No.1 No.2 No.9 No.6 Animal Samples
% 34 23 13 10 7 7 3 3 0
No.3 No.1 No.8 No.5 No.4 No.6 No.9 No.2 No.7 Plant Samples
% 43 30 10 10 7 0 0 0 0
The study statistically compiled the top 15 adjectives for the color images of healing toys.
From high to low, they were respectively comfortable (23 times), warm (22 times), gentle (21
times), delighted (20 times), broad-minded (19 times), optimistic (19 times), sensitive (18 times),

The International Journal of Organizational Innovation Vol 2 Num 4 Spring 2010 173
relaxed (18 times), close (17 times), light (17 times), soft (16 times), natural (15 times), sweet
(15 times), calm (15 times), and pleasant (15 times).
To be the test vocabulary, the top 15 adjectives were selected by means of questionnaire
survey, and proper opposite adjectives were discovered by referring to literature. The opposite
adjectives of ‘adorable’ and ‘pleasant’ both indicate ‘abominable’, and the meanings are too
close to each other, so ‘adorable,’ the selected times were less than those of ‘pleasant,’ was
deleted, and the rest adjectives were classified into totally 14 pairs.
To avoid the situation in which the participants misunderstand or do not understand the
vocabulary in the formal test, 30 adults were pre-tested by means of questionnaire to test the
semantic understanding of the opposite adjectives. The test location was in Daan District, Taipei
City, and the 30 participants were all adults. The 14 tested and revised pairs of opposite
adjectives are indicated by the following table 2:
Table 2 Revised Opposite Adjectives
Opposite Adjective Opposite Adjective
comfortable �----� painful relaxed �----� nervous warm �----� cold close �----� distant
gentle �----� passionate light �----� heavy delighted�----� sad soft �----� hard
broad-minded �----� heavyhearted natural �----�artificial optimistic �----� pessimistic sweet �----� bitter
sensitive �----� rational calm �----� lively
Stage 2: Selecting the Samples of the Color Combinations of Healing Toys

The International Journal of Organizational Innovation Vol 2 Num 4 Spring 2010 174
The purpose of this stage was to combine colors on the representative samples of each
healing toy category selected in Stage 1. Referring to literature, the color combinations were
based on the combination of predominant color and auxiliary colors within three hues.
In order to investigate whether or not the color combinations of the healing toys currently
available in the market in Taiwan met Taiwanese adults’ preference, the study intended to find
out the basis for color combination from the 90 collected samples of healing toys.
In addition, the samples of color combination were divided into the market group and the
control group. The color image scale mentioned in the literature was applied to the color
combination sampling of the market group to induce the color combination tendency of each
category of healing toys available in the market, from which the representative sample of color
combination was then selected. The control group employed the hue and tone system developed
by the Image Research Institute Inc. (I.R.I.), Korea to statistically calculate the most frequent
color in each category to be the samples of color combinations.
Since samples were displayed in images in the study, in order to avoid any error
occurring when the combined colors were displayed on the samples, it was necessary to picture
the representative samples to make the images more concise and simple. The pictured figures
were taken as the representative samples of color combination.
Selecting the Samples of the Color Combinations of the Market Group

The International Journal of Organizational Innovation Vol 2 Num 4 Spring 2010 175
The most appropriate coordinates for the samples of color combination in this group were
chosen on the color image scale on which the samples were arranged in order. Furthermore, by
means of the collected healing toys, including 30 person samples, 30 animal samples, and 30
plant samples, totally 90 samples, the distributing tendency of each category of healing toys on
the scale was induced, and, from each quadrant, a color combination with the most average
vertical and horizontal coordinates was selected to be one of the samples of the color
combinations of the market group.
The samples of the color combinations of the market group were induced as follows:
A. Person: Most of the color combinations tended to be located in the quadrant of warm
and soft. The sample of color combination with the most average vertical and horizontal
coordinates (2, 2) was selected as the representative sample (See Figure 2 for details).
B. Animal: Most of the color combinations tended to be located in the quadrant of warm
and soft. The sample of color combination with the most average vertical and horizontal
coordinates (1.8, 2) was selected as the representative sample (See Figure 3 for details).
C. Plant: Most of the color combinations tended to be located in the quadrant of cool and
soft. The sample of color combination with the most average vertical and horizontal
coordinates (2, 2) was selected as the representative sample (See Figure 4 for details).

The International Journal of Organizational Innovation Vol 2 Num 4 Spring 2010 176
After the aforementioned induction of color image scale, the color combination tendency
of each healing toy category was comprehended. The representative sample of color combination
selected from each category was then employed in the samples of healing toys, indicated Table
3. In this stage, by means of the hue & tone system, the most frequent color in each category was
discovered from 90 samples of healing toys to be the predominant color of the samples of color
combination. Moreover, by referring to the color combinations of regular triangle as well as
isosceles triangle in the color combinations with three hues in the literature, auxiliary colors were
Figure 2 Color Image Scale of Person

The International Journal of Organizational Innovation Vol 2 Num 4 Spring 2010 177
Figure 3 Color Image Scale of Animal
Figure 4 Color Image Scale of Plant

The International Journal of Organizational Innovation Vol 2 Num 4 Spring 2010 178
combined, and, eventually, two sets of the samples of the color combinations of the control
group were established. In order to achieve the purpose of the study, the color system of hue &
tone 120 (Figure 5) established by IRI, Korea was employed in the study. This color system is
based on the Munsell color system and ISCC-NBC color names, and it, meanwhile, indicates
color hue and color tones. Based on 10 color hues and 11 stages, the hue & tone 120 color
systems by IRI is composed of 110 colors and 10 stages of neutral colors distinguished in light of
brightness (See Table 4 for details). After statistic calculation, the most frequent color in each
category was employed as the predominant color, and by referring to the color tone of IRI color
system, consistent auxiliary colors were discovered on the color tone circles of the predominant
colors by means of the color combinations of regular triangle and isosceles triangle.
Table 3 Samples of the Color Combinations of the Market Group
Sample 1 Sample 2
Person
Animal

The International Journal of Organizational Innovation Vol 2 Num 4 Spring 2010 179
Plant
Selecting the Samples of the Color Combinations of the Control Group
Table 4 Abbreviations of IRI Hue & Tone 120 Color System
R YR Y GY G BG B PB P RP
Hue red yellow Red
yellow green yellow
green blue green
blue purple blue
purple red purple
V S B P Vp Lgr L Gr Dl Dp Dk Tone vivid strong bright pale very
pale light
grayish light grayish dull deep dark
Figure 5 Hue & tone 120 Color System Data sources: Youngjin.com. (2007) The Color for
Designer. (Drmaster. Comp. &Trans.). P:25
The result for the Samples of the Color Combinations of the Control Group

The International Journal of Organizational Innovation Vol 2 Num 2 Spring 2010 180
A. Animal: The color hues tended to focus on yellow red and yellow; the color tones tended
to be bright and pale. The top three hues in the color hue statistics were respectively
Yr(23 %), Y(21%), and Pb(16%); the top three tones in the color tone statistics were
respectively B(29%), P(18%), and V(13%). Yr/B, the most frequent color, was the
representative sample color (See Table 5).
B. Plant: The color hues tended to focus on yellow and green yellow; the color tone tended
to be pale and bright. The top three hues in the color hue statistics were respectively
Gy(31%), Y(17%), and Bg(14%); the top three tones in the color tone statistics were
respectively P(37%), B(21%), and Dl(17%). Gy/P, the most frequent color, was the
representative sample color (See Table 5).
Table 5 Statistics of the Color Hues and Color Tones of Each Category
The Distribution of Color Hues and Color Tones The Occurrence Frequency of Colors
Person
Animal
Plant
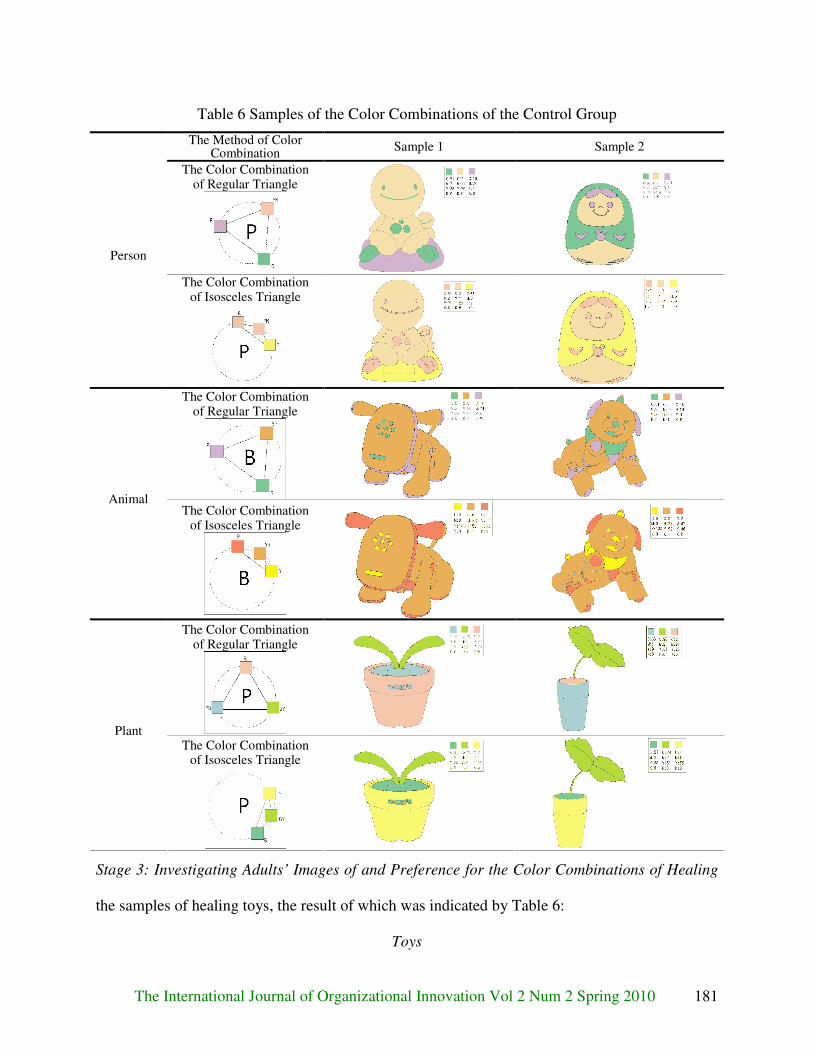
The International Journal of Organizational Innovation Vol 2 Num 2 Spring 2010 181
Table 6 Samples of the Color Combinations of the Control Group
The Method of Color Combination
Sample 1 Sample 2
The Color Combination of Regular Triangle
Person
The Color Combination of Isosceles Triangle
The Color Combination of Regular Triangle
Animal The Color Combination
of Isosceles Triangle
The Color Combination of Regular Triangle
Plant The Color Combination
of Isosceles Triangle
Stage 3: Investigating Adults’ Images of and Preference for the Color Combinations of Healing
the samples of healing toys, the result of which was indicated by Table 6:
Toys

The International Journal of Organizational Innovation Vol 2 Num 2 Spring 2010 182
The representative sample color of each category mentioned above was combined by
respectively the color combinations of regular triangle and isosceles triangle to discover the
consistent auxiliary colors. Additionally, each representative color combination was applied to
In this stage, the scale of the 14 pairs of opposite adjectives selected above was divided
into 7 stages by means of the semantic differential technique, in which 3 and -3 indicated the
strongest feeling, 2 and -2 indicated a very strong feeling, 1 and -1 indicated a strong feeling, and
0 indicated an ordinary feeling. The participants selected the values respectively on the scale
according to how they felt the images of the 18 representative samples of color combination. An
investigation on the preference for healing toys was also added to the questionnaire to analyze
the correlation between the image adjectives and the preference.
The formal investigation was implemented as follows:
A. The time of implementation: April, 2009.
B. The venue and environment of implementation: The laboratory of H407, Department of
Applied Arts and Design, Nanhua University, Taiwan. Day-light fluorescent lamps with
the color temperature of approximately 6500K were installed in terms of the indoor
environment.
C. The method of implementation: The questionnaires were delivered personally. The
participants were given a break of 3 minutes each time after accomplishing the survey of
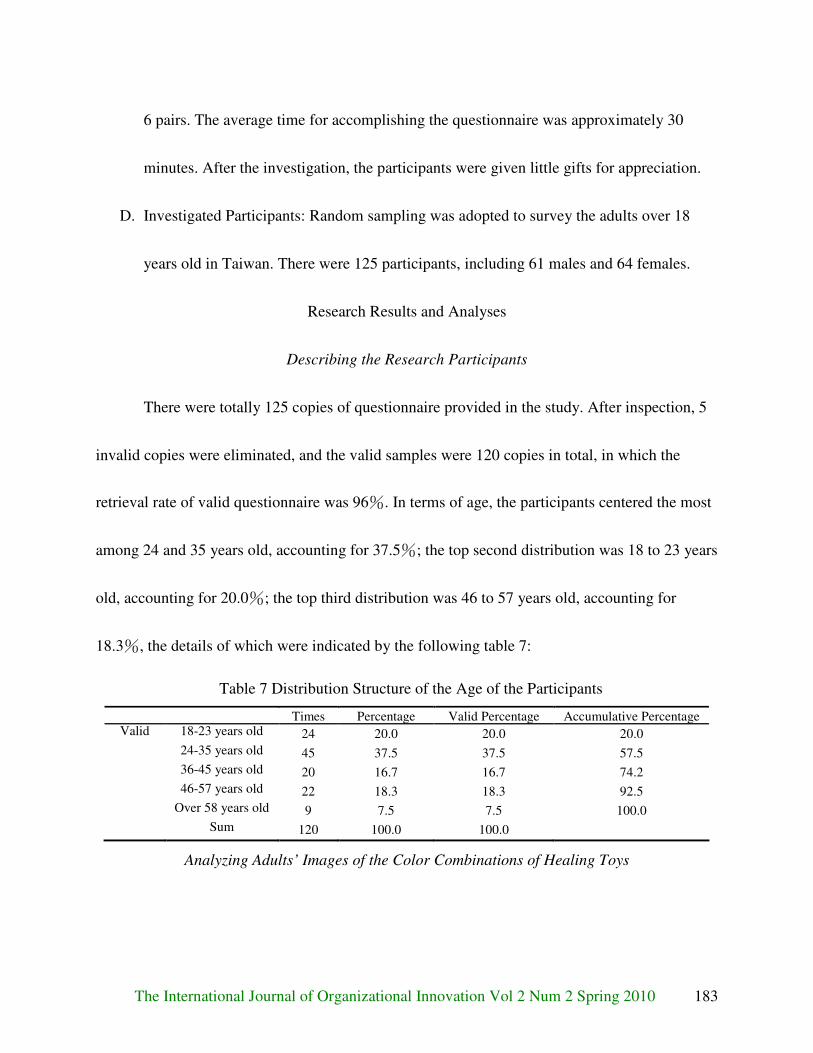
The International Journal of Organizational Innovation Vol 2 Num 2 Spring 2010 183
6 pairs. The average time for accomplishing the questionnaire was approximately 30
minutes. After the investigation, the participants were given little gifts for appreciation.
D. Investigated Participants: Random sampling was adopted to survey the adults over 18
years old in Taiwan. There were 125 participants, including 61 males and 64 females.
Research Results and Analyses
Describing the Research Participants
There were totally 125 copies of questionnaire provided in the study. After inspection, 5
invalid copies were eliminated, and the valid samples were 120 copies in total, in which the
retrieval rate of valid questionnaire was 96%. In terms of age, the participants centered the most
among 24 and 35 years old, accounting for 37.5%; the top second distribution was 18 to 23 years
old, accounting for 20.0%; the top third distribution was 46 to 57 years old, accounting for
18.3%, the details of which were indicated by the following table 7:
Table 7 Distribution Structure of the Age of the Participants
Times Percentage Valid Percentage Accumulative Percentage Valid 18-23 years old 24 20.0 20.0 20.0
24-35 years old 45 37.5 37.5 57.5
36-45 years old 20 16.7 16.7 74.2
46-57 years old 22 18.3 18.3 92.5
Over 58 years old 9 7.5 7.5 100.0
Sum 120 100.0 100.0
Analyzing Adults’ Images of the Color Combinations of Healing Toys

The International Journal of Organizational Innovation Vol 2 Num 2 Spring 2010 184
In order to employ statistic software for statistics, the scale of 3 to -3 was transformed
from right to left into the evaluation standard of 7 to 1, such as that 3 was transformed into 7 and
that 2 was transformed into 6. A mean between 3.50 and 4.49 on the scale indicated an ordinary
feeling; a mean between 3.00 and 3.49 or 4.50 and 4.99 indicated a slight feeling; a mean
between 2.00 and 2.99 or 5.00 and 5.99 indicated an apparent feeling; a mean smaller than 2.00
or greater than 5.99 indicated a strong feeling.
The SD profiles of person, animal, and plant were respectively indicated the following
table 8. In each figure, the blue line represented the samples of the color combination of the
market group, the red line represented the control group’s samples of the color combination of
isosceles triangle, and the pink line represented the control group’s samples of the color
combination of regular triangle:
Table 8 SD Profiles of Person, Animal, and Plant
Sample SD Profile
No. 1、2、3
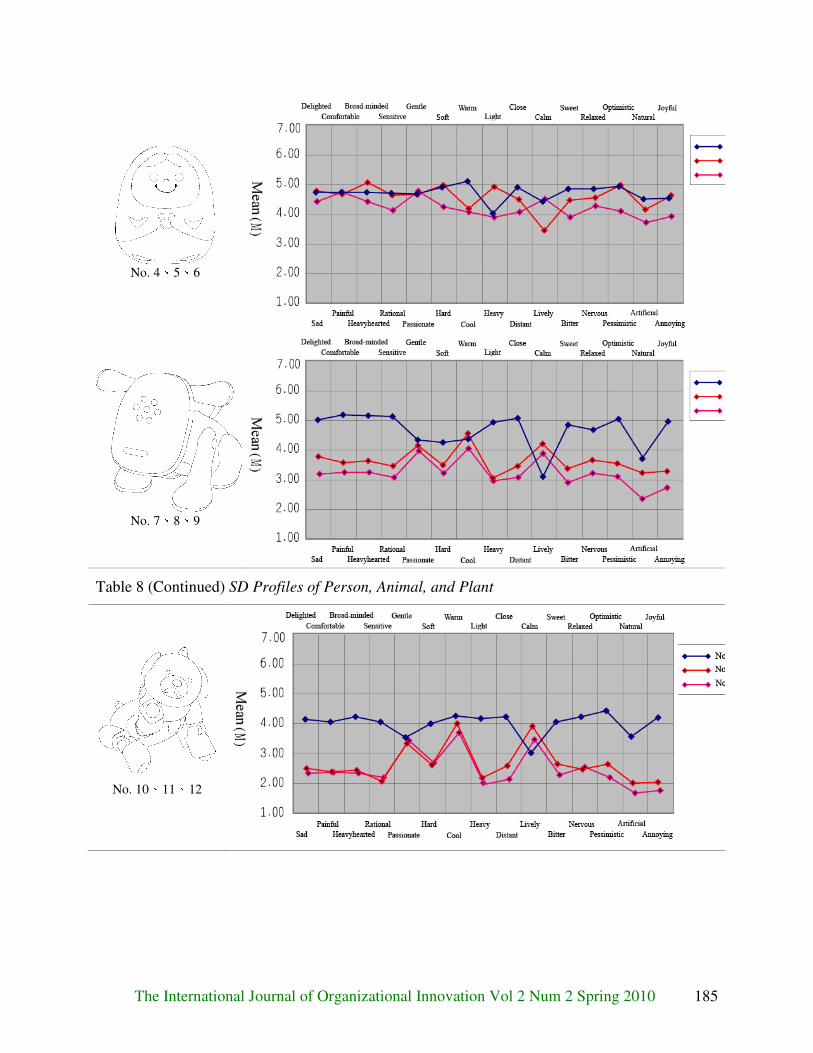
The International Journal of Organizational Innovation Vol 2 Num 2 Spring 2010 185
No. 4、5、6
No. 7、8、9
Table 8 (Continued) SD Profiles of Person, Animal, and Plant
No. 10、11、12

The International Journal of Organizational Innovation Vol 2 Num 2 Spring 2010 186
No. 13、14、15
No. 16、17、18
In the SD profiles of person (No. 1, 2, 3, 4, 5, and 6), it was found that the mean values of
the control group’s samples of the color combination of regular triangle (No. 3 and 6) were slight
smaller than those of the market group (No. 1 and 5) and those of the control group’s samples of
the color combination of isosceles triangle (No. 2 and 4). In the SD profiles of Animal (No. 7, 8,
9, 10, 11, and 12), it was found that the mean values of the market group (No. 7 and 10) and the
control group (No. 8, 9, 11, and 12) were obviously different; the two sets of the mean values

The International Journal of Organizational Innovation Vol 2 Num 2 Spring 2010 187
(M) of the market group were both greater than those of the control group. In the SD profiles of
plant (No. 13, 14, 15, 16, 17, and 18), it was found the mean values of the market group (No. 13
and 16) and the control group (No. 14, 15, 17, and 18) were similar.
Analyzing Each Adult Age Group’s Preference for the Color Combinations of Healing Toys
The mean values of the five age groups of 18 to 23 years old, 24 to 35 years old, 36 to 45
years old, 46 to 57 years old, and over 58 years old were respectively calculated and arranged
from high to low. The top three samples preferred by each age group were indicated by the
following table:
Table 9 Preference Ranking of Each Adult Age Group
Age 18~23 24~35 36~45 46~57 Over 58
Ranking 1 2 3 1 2 3 1 2 3 1 2 3 1 2 3
No. of Sample
No.13
No.14
No.16
No.13
No.7
No.14
No.14
No.17
No.15
No.13
No.14
No.17
No.6
No.13
No.17
Mean (M)
5.71 5.38 5.00 5.69 5.33 5.31 5.70 5.25 5.20 5.64 5.59 5.36 5.67 5.44 5.33
According to Table 9, it was found that the age group of 18 to 23 years old generally
preferred the color combinations of the market group of plant (No. 13 and 16). The age group of
24 to 35 years old generally preferred the color combinations of the market group of plant and
animal (No. 13 and 7). The age groups of 36 to 45 years old and 46 and 57 years old generally
preferred the isosceles-triangle color combination of the control group of plant (No. 14 and 17).
Analyzing the Influential Factors in the Images of Each Adult Age Group

The International Journal of Organizational Innovation Vol 2 Num 2 Spring 2010 188
Green and Salkind (2005) pointed out that factor analysis focused on analyzing factor
selection and factor replacement. Aiming to discover the common factors in the semantic
reactions of the adult age groups, factor analysis was employed in the study to obtain the factor
loading of each scale and further extract the common factors. The result of extract was described
as follows:
KMO (Kaiser-Meyer-Olkin) measure of sampling adequacy and Bartlett test of sphericity were
used, in which the value of KMO (Kaiser-Meyer-Olkin) measure of sampling adequacy was
0.697, which was greater than 0.6, indicating that it was suitable to carry out analyses. The
significance of the Bartlett test of sphericity was 0.000<0.05, indicating statistical validity.
After the tests, principal component analysis, a form of factor analysis, was employed to
extract the common factors. Based on the principle of selecting eigenvalues greater than 1 as the
common factors, two critical factors were selected in this analysis, and these two factors could
explain 80.636% of the overall variance. Furthermore, varimax was applied to the selected
factors, and each factor’s factor loadings greater than 0.5 were kept to make the meaning
represented by each factor more obvious and explainable, the details of which were indicated by
the following table 10:
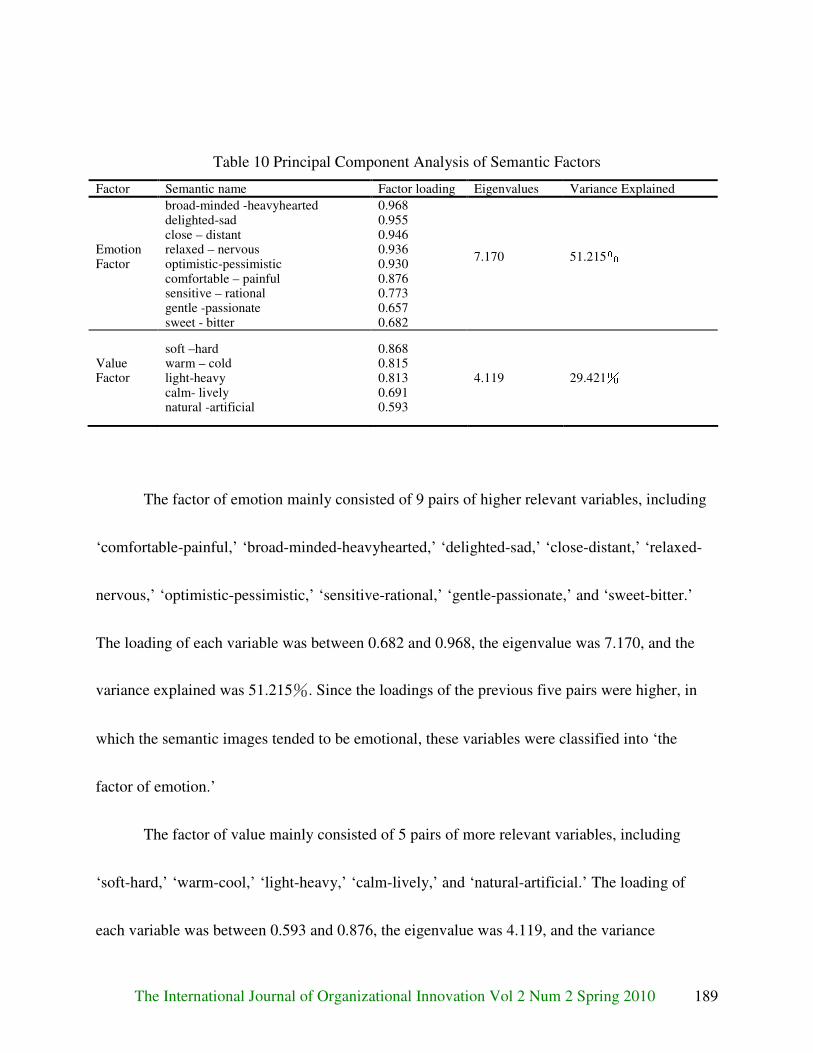
The International Journal of Organizational Innovation Vol 2 Num 2 Spring 2010 189
Table 10 Principal Component Analysis of Semantic Factors
Factor Semantic name Factor loading Eigenvalues Variance Explained
Emotion Factor
broad-minded -heavyhearted delighted-sad close – distant relaxed – nervous optimistic-pessimistic comfortable – painful sensitive – rational gentle -passionate sweet - bitter
0.968 0.955 0.946 0.936 0.930 0.876 0.773 0.657 0.682
7.170
51.215%
Value Factor
soft –hard warm – cold light-heavy calm- lively natural -artificial
0.868 0.815 0.813 0.691 0.593
4.119 29.421%
The factor of emotion mainly consisted of 9 pairs of higher relevant variables, including
‘comfortable-painful,’ ‘broad-minded-heavyhearted,’ ‘delighted-sad,’ ‘close-distant,’ ‘relaxed-
nervous,’ ‘optimistic-pessimistic,’ ‘sensitive-rational,’ ‘gentle-passionate,’ and ‘sweet-bitter.’
The loading of each variable was between 0.682 and 0.968, the eigenvalue was 7.170, and the
variance explained was 51.215%. Since the loadings of the previous five pairs were higher, in
which the semantic images tended to be emotional, these variables were classified into ‘the
factor of emotion.’
The factor of value mainly consisted of 5 pairs of more relevant variables, including
‘soft-hard,’ ‘warm-cool,’ ‘light-heavy,’ ‘calm-lively,’ and ‘natural-artificial.’ The loading of
each variable was between 0.593 and 0.876, the eigenvalue was 4.119, and the variance

The International Journal of Organizational Innovation Vol 2 Num 2 Spring 2010 190
explained was 29.421%. Since the loadings of the previous four pairs were higher, in which the
semantic images tended to be of value, these variables were categorized into ‘the factor of value’
in the study.
The total variance of the aforesaid factors of emotion and value was 80.636%, in which
the factor of emotion accounted for 51.215% of the variance whereas the factor of value
accounted for 29.421%. The variance of the factor of emotion was obviously greater than that of
the factors of value, which indicated that the surveyed adults tended to be influenced by the
factor of emotion more in terms of their cognition of the color combination samples of healing
toys.
To observe the distribution of each semantic phrase between the factors of emotion and
value, a figure for the semantic space of factors was established in the study, in which Axis X
indicated the factor of emotion whereas Axis Y indicated the factor of value. The figure 6 was
indicated in figure 6.
According to the distribution of the images on the coordinate system, it was discovered
that the images of the factor of emotion mainly centered in Quadrant 4 while the images of the
factor of value mainly distributed in Quadrant 1 and 2.
Conclusions and Recommendations

The International Journal of Organizational Innovation Vol 2 Num 2 Spring 2010 191
The study on Taiwanese adults’ cognition of the color combinations of healing toys was
concluded into the following four points:
Figure 6 Spatial Cognition of the Factors of Emotion and Value
1. The color combinations of the healing toys in the market in Taiwan: In terms of the healing
toys currently available in the market in Taiwan, the color combinations of the healing toys
in the category of person tend to be warm, pale, and soft, those of the healing toys in the
category of animal tend to be warm, bright, and pale, and those of the healing toys in the
category of plant tend to be cool, bright, and pale.

The International Journal of Organizational Innovation Vol 2 Num 2 Spring 2010 192
2. Each adult age group’s color cognition of the color combinations of healing toys: Adults
tend to feel better about the healing toys with warm and soft color combinations in the
categories of person and animal whereas they tend to feel better about the healing toys with
cool color combinations in the category of plant.
3. Different adult age groups’ preference for the color combinations of healing toys: There is
not significant difference between different age groups’ preference. The adults tended to
prefer the color combination samples of isosceles triangle in the control group of plant,
indicating that all the age groups prefer tranquil color combinations.
4. The major factors in adults’ preference for the color combinations of healing toys: Adults’
preference for the color combinations of healing toys is mainly influenced by the dimension
of emotion.
In conclusion, the research findings of the study on Taiwanese adults’ cognition of the
color combination design of healing toys will be provided as references and concrete suggestions
for following researchers, industries, the Government, and academia.

The International Journal of Organizational Innovation Vol 2 Num 2 Spring 2010 193
References
Chen, Y. F. (2008). The Influence of the Square Measure of Color Combination on Color
Images. Master dissertation, Department of Industrial Design, National Cheng Kung
University.
Cheng, K. Y. & Lin, P. S. (2006). Color Planning. Taipei: Yi Fong Tang.
Green, S.B., & Salkind, N.J. (2005). Using SPSS for Windows and Macintosh Analyzing and
understanding data (4th ed.). New Jersey: Pearson Education.
Hebb, D.O. (1958). Instructor's Manual for Textbook of Psychology. Philadelphia: Saunders.
Hsieh, Y. H. (2000). Introduction to Color Therapy. Symposium of Color Applications and Color
Science, 2000.
Huang, F. S. (1992). Adult Psychology. Taipei: National Open University.
Huang, H. C. (2006). An Investigation on Seniors’ Perceived Images of and Preference for the
Color Combinations of Web Pages. Master dissertation, Graduate School of Design
Management, Ming Chuan University.
Kobayashi, S. (2000). Color Image Scale, Tokyo: Kodansha.
Lai, C. C. (2006). The Color Psychology of Design. Taipei: Shichuan.
Lan, Y. J. (2006) An Investigation on the Design of Healing Toys. Master Dissertation, Visual
Communication Design Group, Graduate School of Plastic Arts, Fine Art College, National
Taiwan University of Arts.
Lin, Y. C. (2007). A Study on the Color Combinations of Plastic Sunglasses from the Aspect of
Color Cognition. Master Thesis, Graduate Institute of Design, National Taiwan University
of Science and Technology.
Rice, J., & Rice, D. (1986). Living through divorce. New York: The Guilford Press.
The International Journal of Organizational Innovation Vol 2 Num 2 Spring 2010 194
Siegrist, J. (2000). Work stress and beyond. European Journal of Public , 10(3), 223-224.
Tsou, C. (2000). General Psychology. Taipei: Commercial Press.
Youngjin.com (2007). The Color for Designer. (DrMaster, Comp. & Trans.). Taipei: DrMaster.
Zimbardo, P.G. (1995). Psychology. (You, H. S., Trans.). Taipei: Wunan.

The International Journal of Organizational Innovation Vol 2 Num 2 Spring 2010 195
MODERATION OF GENDER ON THE RELATIONSHIP BETWEEN TASK
CHARACTERISTICS AND PERFORMANCE
Setyabudi Indartono And
Chun-Hsi Vivian Chen
National Central University, Taiwan
Abstract
Gender as an individual characteristic has been used in many studies to provide some
explanations of different effects on outcomes. Different effects of gender on employee’s
attitudes and behavior has been found in many studies. Recent study by Humphrey et al
(2007) found out that successful work design innovation has positive impact on employee’s
behavior and attitudes such as performance, satisfaction, commitment, involvement,
motivation, role perception of outcomes, anxiety and stress. However, few scholars have
investigated the effects of gender on task characteristics and performance relationship. This
study employed self efficacy theory to provide further insight into gender differences in
this relationship. Work design proposed by Morgesson (2006) was used to explore task
characteristics of job design. Structural equation modeling was used to analyze the model.
The result showed that male and female employees have different effects on task
characteristics and performance relationship. Implications of the findings and suggestions
for future research are discussed
Keywords: Task Characteristics, Performance, Gender

The International Journal of Organizational Innovation Vol 2 Num 2 Spring 2010 196
Introduction
Work design becomes something of a fad among leaders and organizational consultants.
The practice of job design produced popular programs such as TQM and reengineering, and
human capital management (Deming, 1986; Juran et al 1988; Waldman, 1994; Hammer et al,
1993; Lepak & Snell, 1999). Job was designed to simplify employee activities at work, manage
social-interpersonal daily work, and help to achieve the goal of work efficiently. Hence
successful work design innovation had positive implications on employee’s behavior and
attitudes such as performance, satisfaction, commitment, involvement, motivation, perception of
outcomes, anxiety and stress (Humphrey et al 2007).
Conceptually, employees and organization’s conditions influence the design of job
(Humphrey et al, 2007, MacKinnon, 2008). Human resources department sometimes change the
requirement and characteristics of the job to increase organizational effectiveness and business
competitiveness, and improve employee capability and competency fit so as to accelerate their
performance achievement (O’Reilly et al 1991; Chatman, 1991; Edward, 1996; Judge, 1996;
Saks et al, 1997). Employee’s capability and competency fit on the job is related to individual
characteristics such as tenure, gender, ages, job experiences, and level of education. Hence
scholars have investigated employee’s cohort and demographic characteristics in order to
provide explanations of when and why workers have different performance at work (Frazier et

The International Journal of Organizational Innovation Vol 2 Num 2 Spring 2010 197
all, 2004; Judge, 2007). Gender has been used in social studies to provide explanations for
different effects on outcomes. It was found to have different effects several contexts ranging
from interpersonal relationships to household decision-making (Qualls, 1987, Baghat et al,
2008). For example, females were known to be more expressive than male, and this was
manifested in their socio-emotional behavior which in turn had affect on their attitude and
behavior at work (Meyers-Levy and Maheswaran, 1991).
Empirically, correlation between job design and job satisfaction, work motivation,
performance, and absenteeism, was found in various studies. Furthermore, various jobs also had
different affects on job design. Perker (1998) outline job performance based on self-efficacy.
Employees who feel confident are able to carry out broader and more proactive roles, and
achieve higher performance. However, Morgeson et al, (2008) found out that job characteristics
and performance relationship were influenced by the moderation effects of individual differences
such as urban-rural, middle-class norm, community size, religiosity, growth need strength, ability
level, quality of interpersonal relationships, and effectiveness in terms of the stable tendency to
experience emotions. Male and female employees were found to have an inverse working
achievement on the job. For example, Haswel et al. (1991) and Bernardi (2008) indicated that
females have better achievement at work, whereas O’neil et al. (2008) found that male have
better working performance. Different performance of male and female was also because of

The International Journal of Organizational Innovation Vol 2 Num 2 Spring 2010 198
differences in the type, nature and requirements of the job (Meece, 1991; Pajares et al, 1994;
Wigfield et al 1996; Eisenberget al, 1996; Wilson et al, 2009). However few scholars have
investigated gender to explore the effects of job characteristics innovation on job performance.
Researchers found that male and female employees have different sensitivity, expressive
behaviors, and motivational response on the job (Haswell et al., 1999; Lysonski and Gaidis,
1991; Whipple and Swords, 1992; Bernardi, 2008). This study employed self efficacy of
motivation theory to provide further insight into gender differences and outcome relationships
(Deci et al, 1985; Baghat et al, 2008). Hence, employee’s belief of their capabilities to perform
the task will influence the achievement of their job performance. Therefore, it is worthy of
exploring whether the task characteristics may engage employee’s gender-base to achieve higher
performance. Does a difference in gender of employees influence different beliefs to achieve
higher performance within certain task characteristics of jobs? Accordingly, by employing self
efficacy theory, this study has therefore attempted to investigate the relationship between task
characteristics and performance moderated by gender.
Task Characteristics of Work Design and Performance
Work design has emerged as a topic of central importance in the management discipline.
Interest was prompted by concerns that work design produced work quality effects on employee
well-being and performance (Hollman, 2009). A job can be defined as a collection of related

The International Journal of Organizational Innovation Vol 2 Num 2 Spring 2010 199
positions that are similar in terms of the work performed or goals served by the organization
(Brannick, Levine, & Morgeson, 2007). Work design thus refers to the content and structure of
jobs that is performed by employees (Oldham, 1996). The focus of work design research tends to
be on the tasks and activities that job incumbents perform on a day to day basis. Task
characteristics are primarily attributable to the traditional focus on job design of the work itself.
Recent research demonstrated the importance of task characteristics (Humphrey et al., 2007;
Morgeson & Humphrey, 2006).
Conceptually the task characteristics included five dimensions that make jobs more
satisfying for workers: autonomy, skill variety, task identity, task significance, and feedback
from the job (Morgeson and Humphrey, 2008). Autonomy is the freedom an individual should
have in carrying out work. Skill variety reflects the extent of which various skills are needed for
job performance. Task identity is the extent of which an individual completes an entire piece of
work. Task significance reflects the degree of which a job impacts the lives of others, both inside
and outside the organization. Feedback from the job is the extent of which a job imparts
information about an individual’s performance.
Empirically, Fried and Ferris (1987) found that dimensions of task characteristics were
strongly related to job satisfaction, growth satisfaction, and internal work motivation, with
weaker relationships to job performance and absenteeism. Partially support to Fried and Ferris,
The International Journal of Organizational Innovation Vol 2 Num 2 Spring 2010 200
Humphrey et al (2007), found that all five motivational characteristics were positively related to
job satisfaction, growth satisfaction, and internal work motivation. Autonomy was related to
objective performance. In contrast, autonomy, task identity, task significance, and feedback from
the job had non-zero correlations with subjective performance. However, they were all related to
absenteeism, but had zero significance on skill variety and task significance.
Task characteristics were expected to have effects on employee behavior such as decreased
absenteeism and increased job performance. Job performance is a commonly used, yet even the
concept is poorly defined. It refers to whether a person performs their job well. Performance is
an extremely important criterion that influences organizational outcomes and success. Among
the most commonly accepted theories of job performance are theories from the work of John P.
Campbell and colleagues (1990, 1993) who describe job performance as an individual level
variable. That is, performance is something a single person does. Conceptually, task
characteristics were closely related to high performance achievement. Autonomy is ability to
carry out work freely. Skill variety implies performing a job with different skills. Using task
identity, employees can complete a whole piece of work. Nevertheless, interaction of task
significance and other characteristics are able to influence performance achievement. Feedback
from the job is able to impart information about an individual’s performance (Humphrey et al,
2007).

The International Journal of Organizational Innovation Vol 2 Num 2 Spring 2010 201
Empirically, Morgeson et al (2008) concluded that overall these five task characteristics
have effect on performance. Autonomy has been linked to both objective and subjective
performance ratings. Skill variety does have the expected effect on keeping workers motivated,
involved and satisfied which in turn supports achievement of higher performance. Task identity
can be useful information to start and finish the work and it is related to performance evaluation.
Task significance is positively related to subjective performance. Nonetheless, feedback from the
job is able to timely provide reliable information and direct accurate feedback from the job
performed.
However, individually, a range of knowledge, skills, abilities and other characteristics
(KSAOs) are needed to perform a job. Job knowledge reflects the declarative and procedural
knowledge of the job and role, whereas technical skill reflects the capability to perform the work
itself. Knowledge of the job and technical skills will appear to be essential if one work
effectively in a job. Whereas, Self efficacy theory employed the understanding on the level of
employee belief in order to achieve higher performance with their actual skill level (Gist &
Mitchell, 1992). The level of employee belief found in the task experience is the most important
aspect (Tesluk and Jacobs, 1998). Task experience reflects the amount of time spent performing
a task and the number of times the task has been performed. Task experience confers job
knowledge, and thus provides workers with the ability to effectively enact their task

The International Journal of Organizational Innovation Vol 2 Num 2 Spring 2010 202
responsibilities. Therefore, it is likely that having higher task experience will help workers
perform successfully in jobs that have breadth or depth of knowledge, whereas technical skills
are reflected in the capacity to perform the broader roles. It was implied by many of the task on
work characteristics. Hence, it is directly related to the performance of work (Morgeson, Reider,
& Campion, 2005). It is also supported by Burr and Cordery (2001) who provided evidence on
the importance of further skills of self-management. Therefore, the theory of efficacy strengthens
the evidence of task characteristics and performance relationship. Based on the aforesaid
discussion, the following hypothesis is proposed:
Hypothesis 1: task characteristics related to performance positively
Gender of employee is known as one of the controlled variable in researches. Different
effects of gender on employee’s attitude and behavior have been found in many studies. Gender
was found to have an effect on outcomes such as performance, commitment, satisfaction,
involvement, and stress (Bernardi, 2008, Baghat, 2008, William, 2008, Tanriverdi, 2009; Burke,
et al, 2008, Jones et al, 2009). For example, job career of female employees has been identified
as pattern of their larger-life contexts, families and careers, career paths patterns, and human and
social capital are critical factors for their career (O’Neil et al, 2008). Empirically, O’Neil et al
(2008) indicated that females tend to be more expressive (Meyers-Levy and Maheswaran, 1991),
and sensitive (Haswell et al., 1999; Lysonski and Gaidis, 1991; Whipple and Swords, 1992,
The International Journal of Organizational Innovation Vol 2 Num 2 Spring 2010 203
Bernardi, 2008). Accordingly, females respond to work design and thus achieve work
performance differently from male (Haswel et al, 1991; Meece, 1991; Pajares et al, 1994;
Wigfield et al 1996; Eisenberget al, 1996; Bernardi, 2008; O’Neil et al, 2008; Wilson et al, 2009)
Self-efficacy beliefs function as an important set of proximal determinants of human
motivation, affect, and action [which] operate on action through motivational, cognitive, and
affective intervening processes. Identification allows the observers to feel a one-to-one
connection with the individual being imitated and will be more likely to achieve those imitations
if the observers feel that they have the ability to follow through with the mimicked action. It is
believed that if how some future event turns out is under their control, they may or may not
believe that they are capable of behaving in a way that will produce the desired result. Research
found evidence that male may have a greater believe that they control their life related to
academic achievement (Schultz & Schultz, 2005). Expressiveness of female employee suggested
reinforces the autonomy and strengthens the task variety of job (O’Neil, 2008). Besides,
sensitivity characteristics of female precipitates precisely impart information on performance and
may influence the degree of live impact (Bernardi, 2008). Accordingly, self-efficacy theory
strengthened the evidence of task characteristics and performance relationship and therefore it
proposed that:
Hypothesis 2: Male and female employees have different effects performance

The International Journal of Organizational Innovation Vol 2 Num 2 Spring 2010 204
Hypothesis 3: Male and female employee have different effects on the task characteristics and
performance relationship
Aut=autonomy, TV=task variety, TS=task significant, TI=task identity, FFJ=feedback from job,
P=performance
Figure 1
Model Of Moderating Of Gender On Autonomy, Task Variety, Task Significant, Task
Identity, Feedback From Job, And Performance Relationship
Methods
Sample
This study collected 412 responses from 750 questionnaires distributed to various
businesses (55% response rate). They were approximately 35.16 years old and worked for 13.36
years, 299 (72.6%) were married, and 150 (36.4%) were men. From the participants 145 (35.2%)
graduated from college, 121 (29.4%) held a graduate degree, 21 (5.1%) held a master degree and
32 (7.8%) held a doctorate degree.

The International Journal of Organizational Innovation Vol 2 Num 2 Spring 2010 205
Measures
Items were written by the authors or obtained from previous research. After reviewing of
words, content, and so forth, 31 item sets for total items were retained for inclusion in the
instrument. Responses were made on a 5-point Likert-type scale with scale anchors ranging from
1 (strongly disagree) to 5(strongly agree). Task characteristics were measured using 24 items
taken from Morgeson & Humphrey’s (2006) WDQ. Participants were asked i.e., “The job allows
me to make my own decisions about how to schedule my work”. The five task characteristics
dimension included work scheduling autonomy, decision-making autonomy, work-method
autonomy, task variety, task significant, task identity and feedback from job. Performance was
measured using 7 items taken from William and Andersons (1991). Participants supervisor were
asked i.e., “Adequately completes assigned duties”.
Result and Analysis
Measurement Model Analysis
This study tested the assumptions underlying the use of structural equation modeling.
Confirmatory analysis using the traditional factor loading of SPSS generated the formulation of
each construct. Initial solution with KMO and Bartlett’s test of sphericity, maximum likelihood
extraction method, and varimax rotation was used in this CFA. The result on the Table 1
extended the Hackman (1974) study by combining the work scheduling autonomy, decision-

The International Journal of Organizational Innovation Vol 2 Num 2 Spring 2010 206
making autonomy, and work-method autonomy into one single dimension “autonomy”.
Table 1
Rotated factors and loading for task characteristics
DMA= Decision making autonomy, WMA=work-method autonomy, TV=task variety, TS=task significant,
TI=task identity, FFJ=feedback from job
A confirmatory factor analysis using AMOS 7.0 was conducted to test the measurement
model. The chi-squared (χ2 = 279) was significant (p <0.05; Bollen 1989). The ratio of chi-
Autonomy Performance
Task Variance
Task Identity
Task Significant
Feedback from Job
Autonomy Autonomy_1 0.520 Autonomy_2 0.588 Autonomy_3 0.616 DMA_1 0.658 DMA_2 0.679 DMA_3 0.672 WMA_1 0.642 WMA_2 0.661 WMA_3 0.642 Task Variety TV_1 0.610 TV_2 0.794 TV_3 0.765 TV_4 0.786
TS_1 0.409 Task Significant TS_2 0.423 TS_3 0.923 TS_4 0.782 Task Identity TI_1 0.574 TI_2 0.693 TI_3 0.807 TI_4 0.717
FFJ_1 0.519 Feedback from Job FFJ_2 0.889 FFJ_3 0.803 Performance P1 0.734 P2 0.711 P3 0.726 P4 0.700 P5 0.609 P6 P7

The International Journal of Organizational Innovation Vol 2 Num 2 Spring 2010 207
square to degree of freedom (df.) was 1.516 for measurement model not exceed 2 (Marsh and
Hovecar 1985). Goodness-of-fit of the model represented on the root mean square error of
approximation (RMSEA) .039 and the standardized root mean square residual (RMR) = .028.
RMSEA values was less than .06 and RMR values was less than .08 therefore, indicating a good
fit of the model to the data (Hu & Bentler, 1999, Browne & Cudeck, 1992; Steiger, 1990). The
goodness-of-fit index (GFI) = .926, the adjustment goodness-of-fit index (AGFI) = .900, the
comparative fit index (CFI) =.970, Non-normed Fit Index (NFI) = .927, and the Tucker–Lewis
index (TLI) =.963. According to Marcoulides and schumacker’s (1996) standard of fitting, the
result of CFA indicated a satisfactory fit for the measurement model. Second order analysis
confirmed the single factor of task characteristics was with the following model of fit GFI=.920,
AGFI=.891, RMR=.044 CFI= .953, TLI = .942, IFI= .953, RFI=.902, NFI=920, and RMSEA=
.0457 (Kline, 2004; Byrne, 2006).
Confirmatory factor analysis (CFA) is adopted to test for the quality and adequacy of the
measurement model (Anderson and garbing, 1988). Therefore, this study investigates reliability,
convergent validity, and discriminant validity. Evidence for the unidimensionality of each
construct included appropriate items that loaded at least 0.524 on their respective hypothesized
component and loaded larger than .30 on other components in a factor of analysis. In addition,
the overall goodness of fit supported unidimensionality (Steenkamp and van Trijp 1991).

The International Journal of Organizational Innovation Vol 2 Num 2 Spring 2010 208
Convergent validity was supported by all loadings being significant (p < 0.01) and all SMC
(square of multiple correlation) exceeding 0.275 (Hildebrandt 1987). This study assessed
reliability jointly for all items of a construct by computing the composite reliability and average
variance extracted (Steenkamp and van Trijp 1991). Cronbach’s α is the most widely used
criteria to measure the reliability of the items for each construct (Cronbach’s, 1991). The
Cronbach’s α of constructs are shown in table 2. Cronbach’s α of perception of Autonomy =
.867 (eight six items), Task Variety = .866 (four items), Task Significant= .798 (three items),
Task Identity = .878 (four items), Feedback from Job = .817 (three items), and performance=
=.830 (five items) are all greater than 0.7. Hence internal consistency of each measurement
construct has been achieved.
Table 2
Correlations and Cronbach α
1 2 3 4 5 6 7 8
1. Gender -
2. Autonomy .018 0.867
3. Task variety .045 .420** 0.866
4. Task significant .040 .428** .332** 0.798
5. Task identity .029 .394** .380** .479** 0.878
6. Feedback from Job -.037 .240** .236** .318** .494** 0.817
7. Task Characteristics .029 .698** .694** .741** .756** .634** 0.736
8. Performance .152** .183** .144** .192** .216** .252** .277** 0.830
** Correlation is significant at the 0.01 level (2-tailed).
Cronbach α value are shown in parentheses

The International Journal of Organizational Innovation Vol 2 Num 2 Spring 2010 209
Convergent validity is determined by the reliability of each construct and the average
variance extracted (AVE) of each construct. Anderson and Gerbing (1988) suggested that
convergent validity can be assessed from the measurement model by determining whether each
indicator’s estimated pattern coefficient on its posited underlying construct factor is significant
or not. Table 3 revealed that each item’s factor loading is more than 0.5 and their loading range
is between 0.55 and 0.99, which are in line with Anderson and Gerbing’s (1988) suggestion.
Variance extracted is not only the average percentage of variation explained among the items,
but also a summary measure of convergence among a set of items representing a latent construct.
Variance extracted is computed as the total of all squared standardized factor loadings divided by
the number of items. In other words, it is the average squared factor loading. Fornell and Larcker
(1981) suggested that variance extracted of 0.5 or greater than squared multiple correlations is
good. Table 4 shows AVE exceeding correlations in all squared multiple correlations. Therefore
the indicator variables of this study have a good convergent validity. Discriminant validity
describes the degree to which the operationalization is not similar to (diverges from) other
operationalizations that it theoretically should not be similar to. Campbell and Fiske (1959)
introduced the concept of discriminant validity in their discussion on evaluation of validity test.
They stressed the importance of using both discriminant and convergent validation techniques
when assessing new tests. A successful evaluation of Table 3

The International Journal of Organizational Innovation Vol 2 Num 2 Spring 2010 210
Table 3
Convergent Validity and Reliability
t-value SMC C.R. AVE
Autonomy Autonomy_2 0.568 0.323 0.867 0.459 Autonomy_3 0.669 12.630 0.448 DMA_1 0.657 10.460 0.432 DMA_2 0.713 9.206 0.508 DMA_3 0.721 9.201 0.520 WMA_1 0.693 9.605 0.480 WMA_2 0.681 9.315 0.464 WMA_3 0.705 8.780 0.497 Task Variety TV_1 0.658 0.433 0.866 0.621
TV_2 0.828 14.244 0.686 TV_3 0.837 14.248 0.701 TV_4 0.815 13.885 0.664 Task Significant TS_2 0.524 0.275 0.798 0.646
TS_3 0.898 10.114 0.806 TS_4 0.926 10.210 0.857 Task Identity TI_1 0.692 0.479 0.878 0.635
TI_2 0.725 16.693 0.526 TI_3 0.890 16.521 0.792 TI_4 0.862 15.948 0.743 Feedback from Job FFJ_1 0.602 0.362 0.817 0.631
FFJ_2 0.933 12.325 0.870 FFJ_3 0.812 12.729 0.659 Performance ip1 0.744 0.554 0.830 0.493
ip2 0.716 13.424 0.513 ip3 0.716 13.252 0.513 ip4 0.718 12.996 0.516 ip5 0.608 11.333 0.370
DMA= Decision making autonomy, WMA=work-method autonomy, TV=task variety, TS=task
significant, TI=task identity, FFJ=feedback from job
discriminant validity shows that a test of a concept is not highly correlated with other tests
designed to measure theoretically different concepts. In showing that two scales do not correlate,
it is necessary to correct for attenuation in the correlation due to measurement error. It is possible
to calculate the extent of which the two scales overlap by using the following formula where rxy
is correlation between x and y, rxx is the reliability of x, and ryy is the reliability of y:

The International Journal of Organizational Innovation Vol 2 Num 2 Spring 2010 211
Although there is no standard value for discriminant validity, a result less than .85 tells us
that discriminant validity likely exists between the two scales. A result greater than .85, however,
tells us that the two constructs overlap greatly and they are likely measuring the same thing.
Therefore, the results shown in table 4, demonstrated adequate unidimensionality, convergent
validity, reliability, and discriminant validity.
Table 4
Average Variance Extracted, square correlation, and
Discriminate Validity
1 2 3 4 5 6
1. Autonomy 0.459 0.176 0.183 0.155 0.058 0.033
2. Task variety 0.485 0.621 0.110 0.144 0.056 0.021
3. Task significant 0.515 0.399 0.646 0.229 0.101 0.037
4. Task identity 0.452 0.436 0.572 0.635 0.244 0.047
5. Feedback from Job 0.285 0.281 0.394 0.583 0.631 0.064
6. Performance 0.216 0.170 0.236 0.253 0.306 0.493
AVE value are shown in parentheses
Discriminate validity are shown on the left side AVE value
HypothesisTtesting
Table 2 shows that task characteristics are positively related to performance. Gender was
also found to be positively related to performance, implying that 262 female employees
(mean=4.04) achieved higher performance (t value = -107.427, p<.001) than 150 male
counterparts (mean=3.884). Thus hypothesis 1 and 2 were supported.

The International Journal of Organizational Innovation Vol 2 Num 2 Spring 2010 212
Hierarchical moderated regression analysis was conducted to test the mediating effect of
employee gender. Table 5 shows the result of the estimations of the main effect and the
moderating effect of gender. The result indicates that moderating effect of gender is significant
for dimension of autonomy, task identity, task significant, feedback from job and construct of
task characteristics. Although female employees achieved higher performance, the moderation of
gender shows that effect of task characteristics and its dimensions on performance were higher
for male employees than female employees.
Table 5
Testing result of main effect and moderating effect of gender
Performance
M1 M2 M3 M4 M5 M6 M7
Main effect
Autonomy .053 .334**
Task variety .032 .194*
Task significant .073 .323**
Task identity .061 .377**
Feedback from Job .179** .454**
Task Characteristics .509**
Moderator
Gender .146** .145** .142** .144** .165** .140**
Interaction effect
Autonomy x gender -.210*
Task variety x gender -.071
Task significant x gender -.177*
Task identity x gender -.198*
Feedback from Job x gender -.235**
Task Characteristics x gender -.291**
R2 .085 .059 .044 .070 .080 .106 .119
∆R2 .085 .012 .002 .011 .012 .017 .025
∆F 7.559 5.326 .772 5.400 5.268 7.735 11.788
p .000 .022 .380 .021 .022 .006 .001
M1=main effect model; M2= Model of moderation effect of Autonomy; M3= Model of moderation effect of Task Variety;
M4=Model of moderation effect of Task Significant; M5= Model of moderation effect of Task identity; M6= Model of
moderation effect of Feedback from job; M7= Model of moderation effect of Task characteristics
The International Journal of Organizational Innovation Vol 2 Num 2 Spring 2010 213
Moderation effect of gender analyzed using structural equation modeling shown in table 6
was also found equal. To test hypothesis-3, this study built separate structural models for the
male and female sub-samples, and conducted tests of moderation to determine whether the
respective path coefficients differed. Table 6 summarizes the analyses and results. The procedure
that this study used was as follows for each test: this study constructed two multiple-sample
models. In the first model, all paths were unconstrained between the two groups. This is the “no
constraints” or baseline model in Table 6. In the second model, this study constrained the
relevant path to be equal for both sub-samples. This is the “equal paths” model. The difference in
chi-square values between the two models provides a test for the equality of the path for the two
groups. Similarly, the path is stronger for the male than for female. Gender moderate task
characteristics and its dimensions are related to performance. Thus, hypothesis-3 is supported for
moderating variables.
Figure 1 provides graphical representation of moderating effects of gender. The graphs
show that when the construct of task characteristics is high, male employees demonstrate higher
performance, than female employees. Whereas on high and low level of autonomy, task
significant, task identity, and feedback from job, female employees demonstrate higher
performance than male employees. Male consistently shows higher sloop (γ) of all task

The International Journal of Organizational Innovation Vol 2 Num 2 Spring 2010 214
characteristics and performance relationship.
Table 6
SEM Moderation effect of Gender on Task Characteristics and Performance relationship
Gender Path
Male Female
Baseline (unconstrained) model: χ2 ( 61) = 243.719 Constrained model: χ2 ( 122 ) = 304.227
γ = .204 γ = .113 Autonomy ���� Performance
t = -2.711, p =.001 RMR=.045, GFI= . 888, AGFI= .833, NFI=.864, RFI=.825, IFI=.908, TLI=.881, CFI=. 907, RMSEA=.066
Baseline (unconstrained) model: χ2 (26) = 29.746 Constrained model: χ2 (52) = 55.028
γ = .204 γ = .141 Task Variety ���� Performance
t =-.768 , p =.17 RMR=.016, GFI= .984, AGFI= .973, NFI=.980, RFI=.973, IFI=.997, TLI=.997, CFI= . 997, RMSEA=.019
Baseline (unconstrained) model: χ2 (19) = 35.911 Constrained model: χ2 (38) = 55.543
γ = .340. γ = .018 Task significant ���� Performance
t = -3.020, p =.001 RMR=.022, GFI=. 979, AGFI= .960, NFI=.973, RFI=.960, IFI=.987, TLI=.981, CFI . 987, RMSEA=.047
Baseline (unconstrained) model: χ2 ( 26) = 103.054 Constrained model: χ2 ( 52) = 126.996
γ =.363 γ = .153 Task Identity ���� Performance
t = -.2.455, p =.024 RMR=.017, GFI= .950, AGFI=.913, NFI=.939, RFI=.916, IFI=.954, TLI=.936, CFI=954, RMSEA=.085
Baseline (unconstrained) model: χ2 (19) = 54.667 Constrained model: χ2 (38) = 82.723
γ = .375 Γ = .204 Feedback from job ����
Performance t = -1.996 , p =.043 RMR=.030, GFI= .969, AGFI= .942, NFI=.957, RFI=.937, IFI=.972, TLI=.958, CFI=.972, RMSEA=.068
Baseline (unconstrained) model: χ2 (34) = 74.037 Constrained model: χ2 (68) = 113.038
γ = .549 Γ = .217 Task characteristics ����
Performance t = -2.852, p =.004 RMR=.024, GFI= .949, AGFI= .917, NFI=.905, RFI=.874, IFI=.960, TLI=.946, CFI .959, RMSEA=.040

The International Journal of Organizational Innovation Vol 2 Num 2 Spring 2010 215
Autonomy
3.855
4.066
4.039
3.596
Low High
Perf
orm
an
ce
Female
male
a Task Variety
3.886
4.034
3.935
3.703
Low High
Perf
orm
an
ce
Female
male
Task Significant
3.857
4.067
4.034
3.611
Low High
Perf
orm
an
ce
Female
male
Task Identity
3.833
4.090
4.061
3.580
Low High
Perf
orm
an
ce
Female
male
Feedback from Job
3.798
4.109
4.081
3.504
Low High
Perf
orm
an
ce
Female
male
Task Characteristics
3.795
4.1304.156
3.494
Low High
Perf
orm
an
ce
Female
male
Figure 2
Moderating of gender on task characteristics, autonomy, task variety, task significant, task
identity, feedback from job, and performance relationship

The International Journal of Organizational Innovation Vol 2 Num 2 Spring 2010 216
Conclusion
Discussion
This study employed self-efficacy theory to investigate the different effects of task
characteristics on the performance achieved by gender. Although female employees were found
to achieve higher performance than male employees, the results of this study revealed that male
employees have higher effect of task characteristics on performance. Therefore male employees
indicated to be more confident than female employees. This result is consistent with the findings
by Meece (1991), Pajares et al (1994) and a study by Wigfield et al (1996).
Acceptance of the hypotheses provided some notes. It explains that gender has a significant
individual attachment effects on performance. Female employees were found to be more likely to
accept higher job performance. Expressiveness of female employees (O’Neil et al, 2008) might
influence the support of work achievement. However Haswell et al., (1999) and Bernardi (2008)
indicated that female employees’ sensitivities might inhibit their effort to achieve higher outputs.
Therefore, that explains why the effect of task characteristics on performance was higher for
male than female employees. This applies to all dimensions of task characteristics.
Expressiveness and sensitivities of gender are important in developing jobs. Zin (2006)
indicated that the responsibility for children affect job commitment among female employees. In
situations where both family and work roles are equally salient, however, the difficulty of

The International Journal of Organizational Innovation Vol 2 Num 2 Spring 2010 217
balancing role obligations may precipitate work-family conflict. These conflicts are predicted in
the form of stress, hence affect weakened performance. Therefore, the findings of this study
indicate that managers must pay attention to this when designing the tasks for male and female.
Limitation and Future Research Direction
Notwithstanding these contributions, this study also has several limitations. Specific task
and level of performance should be determined. Different task might influence the confidence of
both male and female employees to achieve high performance. Hence exploring the task and
achievement in the academic field might be different from entrepreneurial field (Meece, 1991;
Pajares et al, 1994; Wigfield et al 1996; Eisenberget al, 1996; Wilson et al, 2009).
Although these findings lend strong support to self-efficacy theory, future researchers may,
however, want to attempt to develop this work further, incorporating other related psychological
theories such as expectancy theory. The use of different theories may enrich the accumulation of
related knowledge and further understanding of empirical practices. Another possible direction
for further development is to investigate the impact of task characteristics on commitment, work
satisfaction and other possible outcomes.
Based on Tesluk and Jacob (1998) suggestion, further investigation on the joint moderating
effects of gender and tenure is imperative. Even though, the findings supported one of various
job design characteristics, it is still open for further inquiries. Different characteristics of job

The International Journal of Organizational Innovation Vol 2 Num 2 Spring 2010 218
design affect performance differently. It is also possible to investigate gender effects on other
forms of performance. This study used role performance to represent the performance explored.
Extra role performance such as organizational citizenship behavior (OCB) may enrich further
understanding of total performance related to task characteristics of job design. Experimental or
quasi-experimental research designs are needed to help in ruling out potential alternative
explanations for these results (Morgeson, 2006). The sampling data collected was inadequate to
improve on the group level analysis (HLM). Other studies can also investigate the effects of
individual assessments on the job, since team assessment has become a fad.
References
Baghat, Parimal S., Williams, Jerome D. (2008), Understanding gender differences in
professional service relationships, Journal of Consumer Marketing, 25/1, 16–22
Bernardi, Richard A., Guptil , Steven T., , (2008), Social Desirability Response Bias, Gender,
and Factors Influencing Organizational Commitment: An International Study, Journal of
Business Ethics, 81:797–809
Brief, A.P., (1998), Attitudes In and Around Organizations, Thousand Oaks, CA: Sage
Publications
Burke, Ronald J., Koyuncu, Mustafa, Fiksenbaum, Lisa, (2008), “Work experiences,
satisfactions and psychological well-being of female and male managers in the hospitality
sector in Turkey”, Equal Opportunities International Vol. 27 No. 6, pp. 505-518

The International Journal of Organizational Innovation Vol 2 Num 2 Spring 2010 219
Campbell, J. P. (1990), Modeling the performance prediction problem in industrial and
organizational psychology. In M. D. Dunnette & L. M. Hough (Eds.), Handbook of
Industrial and Organizational Psychology (pp. 687-732). Palo Alto, CA: Consulting
Psychologists Press, Inc.
Campbell, J. P., McCloy, R. A., Oppler, S. H., & Sager, C. E., (1993), A theory of performance:
In N. Schmitt & W. C. Borman (Eds.), Personnel Selection in Organizations (pp. 35-70).
San Francisco: Jossey-Bass.
Campion M. A., & McClelland, C. L. (1993). Follow-up and extension of the interdisciplinary
costs and benefits of enlarged jobs, Journal of Applied Psychology, 78, 339–351
Chatman, J.A., (1991), matching people and organizations: selection and socialization in public
accounting firms, Administrative science quarterly, 36 pp. 459-484
Deci, E.L. and Ryan, R.M., (1985), Intrinsic Motivation and Self-determination in Human
Behavior, Plenum Press, New York, NY
Deming. W. E. (1986). Out of the crisis. Cambridge: Massachusetts Institute of Technology,
Center for Advanced Engineering Study
Edward, JR. (1996), An examination of competing versions of the person-environment fit
approach to stress. Academy of Management Journal, 392), 292-339.
Ferris, GR, Adams, G, Kolodinsky, RW, (2002), Perceptions of organizational politics: Theory
and research directions, Research in multi issues, Vol. 1 pg. 179-254
George, J.M., & Jones, G.R., , (2008), Understanding and managing Organizational Behavior
(Fifth Edition) Upper Saddle River: New Jersey, Pearson Prentice Hall
Ghazawwi, Issam, (2008), Job Satisfaction Antecedents and Consequences: A New Conceptual
Framework and Research Agenda, The Business Review, Vol. 11, Num. 2
Hackman J. R., & Oldham, G. R. (1980). Work redesign. Reading, MA: Addison-Wesley.
The International Journal of Organizational Innovation Vol 2 Num 2 Spring 2010 220
Hammer, Michael and Champy, James (1993), Reengineering the corporation A Manifesto For
Business Revolution
Haswell, S., P. Jubb and B. Wearing, (1999), ‘Accounting Students and Cheating: A
Comparative Study for Australia, South Africa and the UK’, Teaching Business Ethics
3(3), 211–239.
Humprey, Stephen E., Nahrgang, Jennifer D., Morgeson Frederick P., (2007), “Integrating
motivational, social, and contextual work design features: A meta analytic summary and
theoretical extention of the work design literature, Journal of Applied Psychology, vol
92., No. 5, pg. 1332-1356
Judge Timothy A, Robins P Stephen, (2007), Organizational Behavior – 12th edition, Pearson
international edition
Judge, T.A., Cable, D.M. (1996), person organization fit, job choice decision and organizational
entry, Organizational behavior and Human decision processes 67 pp 294-311
Juran, JM, (1988), Planning for quality, Free press New York
Lepak & Snell, (1999) in Samuel Ngunia, Peter Sleegersb, and Eddie Denessen, (2006),
Transformational and Transactional Leadership Effects on Teachers’ Job Satisfaction,
Organizational Commitment, and Organizational Citizenship Behavior in Primary
Schools: The Tanzanian case, School Effectiveness and School Improvement, Vol. 17,
No. 2, , pp. 145 – 177
Lysonski, S. and W. Gaidis, (1991), ‘A Cross-Cultural Comparison of the Ethics of Business
Students’, Journal of Business Ethics 10(2), 141–150.
MacKinnon, David P., (2008), Introduction to statistical mediation analysis, Lawrence Erlbaum
Associates NY
Meyers-Levy, J. and Maheswaran, D. (1991), “Exploring differences in males’ and females’
processing strategies”, Journal of Consumer Research, Vol. 18, June, pp. 63-70

The International Journal of Organizational Innovation Vol 2 Num 2 Spring 2010 221
Morgeson F. P., & Campion, M. A. (2003), Work design, In W. C. Borman, D. R. Ilgen, & R. J.
Klimoski Eds., Handbook of psychology: Industrial and organizational psychology Vol.
12, pp. 423–452). Hoboken, NJ: Wiley.
Morgeson Frederick P. and Stephen E. Humphrey, (2006), The Work Design Questionnaire
WDQ): Developing and Validating a Comprehensive Measure for Assessing Job Design
and the Nature of Work, Journal of Applied Psychology (2006), Vol. 91, No. 6, 1321–
1339
O’Neil, Deborah A, Hopkins, Margaret M, Bilimoria, Diana, (2008), Women's Careers at the
Start of the 21st Century: Patterns and Paradoxes Journal of Business Ethics, Vol. 80, Iss.
4; p. 727
O’Reilly III, C.C., Chatman, J., and Caldwell, D.F., (1991), people and organizational culture: A
profile comparison approach to assessing person-organization fit, Academy of
management journal, pp. 487-516
Qualls, W.J., (1987), “Household decision behavior: the impact of husbands’ and wives’ sex role
orientation”, Journal of Consumer Research, Vol. 14, pp. 264-79
Saks, A.M., and Ashfort, B.E., (1997) A longitudinal investigation of the relationships between
job information source, applicant perceptions of fit, and work outcomes., personnel
psychology, 50, pp. 395-426
Schultz, D.P. & Schultz, S.E., (2005), Theories of Personality 8th Edition, Wadsworth:
Thomson. I.S.B.N.: 0-534-62403-2
Smith, Elizabeth A, (2005), Communities of Competence: new resources in the workplace,
Journal of Workplace Learning, Vol. 17, Iss. 1/2; p. 7
Tanriverdi, Haluk , (2008), Workers' Job Satisfaction and Organizational Commitment: Mediator
Variable Relationships of Organizational Commitment Factors, Journal of American
Academy of Business, Vol. 14, Iss. 1; p. 152 (12 pages)
Tesluk, PE and Jacobs, R. R. (1998), Toward integrated model of work experience, personnel
psychology, 51, 321-355

The International Journal of Organizational Innovation Vol 2 Num 2 Spring 2010 222
Whipple, T. W. and D. S. Swords, (1992), ‘Business Ethics Judgments: A Cross-Cultural
Comparison’, Journal of Business Ethics 11(9), 671–678.
William, H. Sumrall, David W. Cox, D. Adrian Doss, and Don W. Jones, (2008), Participative
Decisions and Organizational Commitment: A Quantitative Analysis, Southern Business
Review, 39-52
Wilson, Fiona; Kickul, Jill; Marlino, Deborah; Barbosa, Saulo D.; Griffiths, Mark D., (2009), an
nalysis of the role of gender and self efficacy in developing female entrepreneurial
interest and behavior, Journal of Developmental Entrepreneurship, Vol. 14, Iss. 2; pg.
105

The International Journal of Organizational Innovation Vol 2 Num 2 Spring 2010 223
An Empirical Study on the Impact of Differences in Bed and Breakfast Service
Quality Attributes on Customers’ Revisiting Desires
Wu-Chung Wu
The Postgraduate School of Hospitality Management
National Kaohsiung Hospitality College
Chih-Yun Yang
Department of Hospitality Marketing Management
National Kaohsiung Hospitality College
Abstract
In recent years, Bed and Breakfast (B&B) operations have quickly grown popular, and, in
particular, growth in the Tsing-Ching area of Taiwan has been the fastest and most concentrated.
Previous studies have shown that tourists’ satisfaction from a visit is significantly and positively
related to their desire for revisiting that B&B. But, it seems that from the tourists’ satisfaction
level we cannot differentiate revisiting incentives deployed by B&B operators with varying
characteristics. This paper presents an empirical study, based on questionnaires, on the impact of
differing levels of B&B service quality on customers’ desires to revisit. The Kano table is first
applied to define each quality element, and then through one-way ANOVA analysis the service
quality elements perceived by customers with the most significant difference are isolated.
Logistic regression is applied to the customers’ desire to revisit each B&B to uncover the
preferences they hold for specific quality elements that contribute to their decisions to revisit,
even among B&Bs that provide similar service elements. This provides an explanation for why
customers choose and continue to return to specific B&B businesses over others within highly
competitive areas in popular tourist destinations.
Keywords: B&B, service quality attributes, SERVQUAL, logistic regression

The International Journal of Organizational Innovation Vol 2 Num 2 Spring 2010 224
Introduction
In years past, Taiwan’s scenic areas during the holidays were often overfilled with tourists
and hotel accommodations were woefully insufficient. Gradually, local residents began to
provide their surplus rooms to address the deficiency, and this was the beginning of the Bed and
Breakfasts (B&Bs). Naturally, B&Bs were mostly simple and basic, and they did not provide
true competition to the resort hotels.
In recent years, however, more and more money has been invested in B&Bs, and the
government has introduced legislation for better B&B industry management. B&Bs have sprung
up all over Tsing-Ching areas of Taiwan due to demand and profitable business opportunities. In
an effort to develop mountainous regions and recreational agriculture, government policies have
encouraged the development of B&Bs to expand beyond providing basic accommodation and
dining. B&Bs now combine the advantageous resources of local culture, ecology, and scenery to
transform themselves into leisure facilities with unique styles and attractions. Tourists now
expect better quality of service and satisfaction from the environment and local features in these
leisure facilities.
Baker and Crompton (2000) alleged that tourists’ satisfaction towards the accommodations
depended on a whole, aggregated feeling of comfort, derived from a judgment and analysis
process after receiving the services of a B&B. Yet, customer satisfaction with the
accommodations cannot be the only indicator when rating competitiveness among B&B
operators in Tsing-Ching areas with high B&B density. Previously, promotional activities often
emphasized the winning of new customers but neglected the fact that winning new customers
was five times more costly than retaining an existing one (Heskett, Sasser and Hart, 1989),
making repeat business significant in the overall profitability of an enterprise. Thus, this study
The International Journal of Organizational Innovation Vol 2 Num 2 Spring 2010 225
focuses on the specific elements of service quality that contributes to customer loyalty and return
patronage.
Morrison et al. (1996) believed that tourists chose B&Bs for the personalized interactions
with their operators. Zane (1997) polled 1,400 American B&B customers and found that
personalized service, comfort of the bed, the homeliness feel, privacy, cleanliness, and a B&B
owner’s advice on things like tourist attractions and restaurants were the most important factors
in their choice of a B&B. Norman (1988) discovered that individualized interactions and “unique
touches” were the biggest reasons for B&B patronage. Hence, we believe that there exist specific
service quality attributes which attract customers, and that the satisfaction from these service
quality attributes affects the customers’ revisiting desires. This study assumed that, in Tsing-
Ching areas, B&Bs, each with their own style of management, provides different levels of
service quality, and that customers, in recognizing these differences, will develop a ranked
preference when choosing B&B establishments. Based on this, this study sought to uncover the
service quality attributes among sample B&Bs and, at the same time, using Kano’s two-
dimensional quality model, define the characteristics of service quality attributes and compare
differences among customers’ cognition of those attributes. Finally, the study aimed to identify
the impact of differing service quality attributes on, and their relationship to, customers’
motivations for revisiting.
Literature Review
PZB Service Quality Measurement Table
Gronroos (1982) pointed out that on certain levels “service” can be seen as a process that
needs the participation of the customer in both its creation and consumption. When customers

The International Journal of Organizational Innovation Vol 2 Num 2 Spring 2010 226
compare their anticipated and received levels of service, the result can be called the “perceived
service quality”. Parasuraman et al. (1985) pointed out that, to consumers, service quality is
harder to evaluate than product quality, thus a customer’s cognition of service quality is the
result of comparing the expected and actual service received, and that evaluation also includes
the process by which the service was delivered. Parasuraman et al., in research published in
1985, came up with 10 common service quality elements, and in follow-up research further
grouped the 10 elements into 5 major categories: Tangibility, Reliability, Responsiveness,
Assurance, and Empathy. Along with 22 topics and using the Likert scale as a measurement
basis, this is the now well-known SERVQUAL measurement table (Parasuraman et al., 1988,
1991, 1991a). To this day, the SERVQUAL measurement table is used by many different service
sectors.
2.2 The Kano two-dimensional quality elements model
Kano’s (1984) approach to quality evaluation was different than others, and he believed that
the sufficient presence of quality elements did not necessarily bring about customer satisfaction
and sometimes even caused dissatisfaction or indifference. Kano also believed that quality
elements were dynamic and shifted with time. In 1984, Kano and others applied Herzberg’s
Two-Factor Hygiene and Motivation Theory to classify quality elements and came up with the
following five types:
1. Attractive quality element: when this element is present in sufficient amounts, customers will
feel satisfied; but when lacking, customers will accept its levels as “matter of fact”.
2. One-dimensional quality element: presence of this element brings about customer satisfaction;
lack of this element causes dissatisfaction. This element is similar to the motivational factor in
Herzberg’s Two-Factor Hygiene and Motivation Theory.

The International Journal of Organizational Innovation Vol 2 Num 2 Spring 2010 227
3. Must-be quality element: presence of this element is acceptable to the customer but does not
make the customer satisfied; lack of this element causes dissatisfaction. This element is similar
to the hygiene factor in Herzberg’s Two-Factor Hygiene and Motivation Theory.
4. Indifferent quality element: this element’s existence or lack thereof does not affect a
customer’s satisfaction level.
5. Reverse quality element: presence of this element will cause customer dissatisfaction, and the
lack of it will cause customer satisfaction.
From this we see that the Kano two-dimensional model primarily focuses on a customer’s
satisfaction and feelings toward quality elements, and that the evaluation of quality is based on a
customer’s subjective perception, making this model suitable for application to the service
industry (Yang, 1993). To management, Kano’s model provides a precise and easy-to-understand
method of gleaming insight into a customer’s true feelings towards the product or service and an
understanding of the quality elements from the customer’s perspective, both of which can be
applied to a company’s product development and improvement processes in order to get one step
closer to the customer’s ideal product. In applying it to operational and sales strategies, a
company can maintain growth and competitiveness by consistently examining strategy results
and feedback on a regular basis. Thus this study used the Kano quality model to explore B&Bs’
service quality elements, and attempted to uncover the elements among B&Bs with different
characteristics that significantly increased a customer’s desire to revisit.
Research Method and Questionnaire Design
Questionnaire Design
Typically, research involving service quality consists of one common characteristic, and
that is, due to the fact that “service” is considered intangible and variable and the “construction”
The International Journal of Organizational Innovation Vol 2 Num 2 Spring 2010 228
and “consumption” of service usually happens simultaneously, the process of evaluating service
quality is unique from evaluation of tangible products. Obviously, it is difficult to identify the
specific quality elements from a traditional SERVQUAL measurement table that affect a
consumer’s decision to re-consume. Because of this, this study used a different approach on
certain parts when designing the measurement table. This study’s questionnaire was divided into
three sections; the first being Kano’s two-dimensional quality measurement table, the second
being a single question asking the customer whether they plan to revisit, and the third being
questions related to population statistics and variables.
The design of the questionnaire was divided into two steps. First, a pre-test questionnaire
consisting of 36 questions was produced after review of related literature and referencing the
SERVQUAL measurement table and B&B facilities and service data. It used the Likert 5-point
interval scale to measure the answer to each question: Strongly Agree, Agree, Neutral, Disagree,
and Strongly Disagree. Before formally distributing the questionnaire examining service quality
elements and B&B customer revisiting desires, this study analyzed the results from the pre-test.
The pre-test target audience was Tsing-Ching area B&B customers. We sent out 150
questionnaires, and received back 134, making the effective return rate 89.3%. After validity and
reliability analysis, we deleted 11 questions which did not meet our requirements, leaving 25
questions. The KMO value was 0.801 for this pre-test questionnaire, which achieved an
explainable standard. The Chi-square value of the Bartlett’s Sphericity test was 958.913, with a
degree of freedom of 300, making the sampling of this exercise suitable for applying factor
analysis. We used principle component analysis to extract the common factor. Then, we applied
Kaiser’s method to choose the factors with eigenvalues great than 1. For the purpose of simple
structure, we used Varimax for orthogonal rotations. Finally, we created five constructs out of

The International Journal of Organizational Innovation Vol 2 Num 2 Spring 2010 229
the service quality elements, as follows: hardware (facilities), software (service), environment,
management, and emotion. Then, per Kano’s model each of the 25 pre-test questions was
assigned as positive or negative (based on sufficiency or lack of the quality element), and this
Kano two-dimensional quality classification questionnaire was presented to the subjects.
Research Sample Range and Research Period
This paper’s primary focus is on tourists who patronize B&Bs during their visits to Tsing-
Ching areas. Because there are no distinct tourist lists to reference in advance, we conducted
sampling from B&B tourists who visited Tsing-Ching areas during our research period. Within
the registered B&B list published by the Ministry of Transportation Tourism Bureau, we selected
six large, legally registered B&Bs with unique characteristics as our research subject.
Questionnaires were deployed to collect B&B customer data, and convenient cluster sampling
was the sampling method. Questionnaires were placed at check-in counters of selected B&Bs
and delivered to customers when they checked-in, and returned to us when they checked-out. As
a generally survey, and the data we get via questionnaire is discrete data. The size of the sample
can be estimated by the following formula:
( )2
2
2/ 1
e
ppZn
−××= α (1)
n = sample size
e = estimated error
Zα = Z value for which right-tailed area is α/2
1- α = reliability coefficient
p = probability of an attribute displaying difference
Although the actual p value is unknown, we know that when p=1/2, sample size will be the
largest, so this was used as the baseline. For a confidence interval of 95%, and an estimated error
of 5%, we should collect around 300 questionnaires for analysis. For a total of six B&Bs in the

The International Journal of Organizational Innovation Vol 2 Num 2 Spring 2010 230
Tsing-Ching area, we had to deliver 50 questionnaires to each location. But to avoid collection
problems and ineffective questionnaires reducing our usable sample size, we opted to distribute
75 questionnaires to each B&B instead, making the total number of questionnaires sent 450. This
study chose to conduct the sampling from January 1, 2008 through February 28, 2008, which is
peak travel time for the Tsing-Ching areas due to the Chinese New Year holiday. 302 copies of
the questionnaire were returned, for a return rate of 67.1%. Seven questionnaires deemed
ineffective were eliminated, leaving 295 as an effective sample size (n=295), with a Cronbach’s
α value of 0.859. This high level of reliability meant that we had a highly consistent
questionnaire. Even though the number of questionnaires returned did not meet the expected
number of 300, the effect was negligible on our overall results.
Within the 295 effective samples, male subjects totaled 141 (47.8%) and female subjects
totaled 154 (52.2%), making females a slightly higher majority among B&B patrons. Within
subject age groups, 21 to 30 year-olds dominated with 149 in total for a percentage of 50.5; next,
31 to 40 year-olds came in at 92 people (31.2%); 61 year-old and above were the lowest in
number at 2 (0.7%). From this, we can see that younger customers dominate among those who
choose B&B-type lodging. The number of subjects who stayed at B&Bs on average of 1-3 times
a year ranked the highest at 166 (56.3%), the next being those who averaged 4-6 times a year
with 75 (25.4%). As a result, this study’s sample can be seen as primarily represented by
younger patrons, which included students and young families.
Data Analysis and Method
4.1 Categorization of Kano Quality Elements
In processing the data, the Kano model was used to categorize the questions by relative
majority, and the B&B-supplied quality element attributes were defined. This study categorized
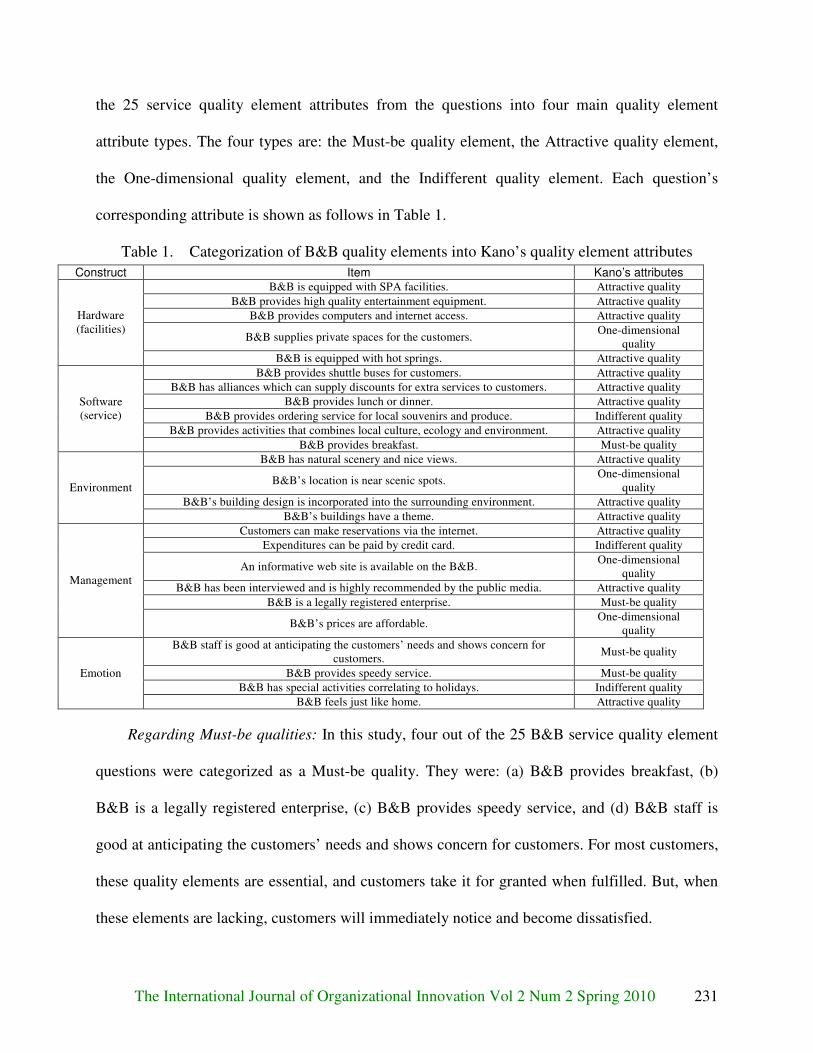
The International Journal of Organizational Innovation Vol 2 Num 2 Spring 2010 231
the 25 service quality element attributes from the questions into four main quality element
attribute types. The four types are: the Must-be quality element, the Attractive quality element,
the One-dimensional quality element, and the Indifferent quality element. Each question’s
corresponding attribute is shown as follows in Table 1.
Table 1. Categorization of B&B quality elements into Kano’s quality element attributes
Construct Item Kano’s attributes B&B is equipped with SPA facilities. Attractive quality
B&B provides high quality entertainment equipment. Attractive quality
B&B provides computers and internet access. Attractive quality
B&B supplies private spaces for the customers. One-dimensional
quality
Hardware (facilities)
B&B is equipped with hot springs. Attractive quality
B&B provides shuttle buses for customers. Attractive quality
B&B has alliances which can supply discounts for extra services to customers. Attractive quality
B&B provides lunch or dinner. Attractive quality
B&B provides ordering service for local souvenirs and produce. Indifferent quality
B&B provides activities that combines local culture, ecology and environment. Attractive quality
Software (service)
B&B provides breakfast. Must-be quality
B&B has natural scenery and nice views. Attractive quality
B&B’s location is near scenic spots. One-dimensional
quality
B&B’s building design is incorporated into the surrounding environment. Attractive quality
Environment
B&B’s buildings have a theme. Attractive quality
Customers can make reservations via the internet. Attractive quality
Expenditures can be paid by credit card. Indifferent quality
An informative web site is available on the B&B. One-dimensional
quality
B&B has been interviewed and is highly recommended by the public media. Attractive quality
B&B is a legally registered enterprise. Must-be quality
Management
B&B’s prices are affordable. One-dimensional
quality
B&B staff is good at anticipating the customers’ needs and shows concern for customers.
Must-be quality
B&B provides speedy service. Must-be quality
B&B has special activities correlating to holidays. Indifferent quality
Emotion
B&B feels just like home. Attractive quality
Regarding Must-be qualities: In this study, four out of the 25 B&B service quality element
questions were categorized as a Must-be quality. They were: (a) B&B provides breakfast, (b)
B&B is a legally registered enterprise, (c) B&B provides speedy service, and (d) B&B staff is
good at anticipating the customers’ needs and shows concern for customers. For most customers,
these quality elements are essential, and customers take it for granted when fulfilled. But, when
these elements are lacking, customers will immediately notice and become dissatisfied.

The International Journal of Organizational Innovation Vol 2 Num 2 Spring 2010 232
Regarding Attractive qualities: Fourteen out of the 25 B&B service quality element
questions were categorized as an Attractive quality. They are:
(a) B&B is equipped with SPA facilities.
(b) B&B provides high quality entertainment equipment.
(c) B&B provides computers and internet access.
(d) B&B is equipped with hot springs.
(e) B&B provides shuttle buses for customers.
(f) B&B has alliances which can supply discounts for extra services to customers.
(g) B&B provides lunch or dinner.
(h) B&B provides activities that combine local culture, ecology and environment.
(i) B&B has natural scenery and nice views.
(j) B&B’s building design is incorporated into the environment.
(k) B&B’s buildings have a theme.
(l) B&B allows reservations from the internet.
(m) B&B has been interviewed and is highly recommended by the public media.
(o) B&B feels just like home.
For most customers, these quality elements are extra efforts to attract customers. When they
are fulfilled, customers are satisfied but generally will not take it for granted. Therefore, it will
not result in dissatisfaction when they are lacking, but when they are present, the customers’
satisfaction will increase.
Regarding One-dimensional qualities: There were four quality elements categorized as a
One-dimensional quality out of the 25 B&B service quality element questions. They are: (a)
B&B supplies private spaces for the customers, (b) B&B’s location is near scenic spots, (c) An
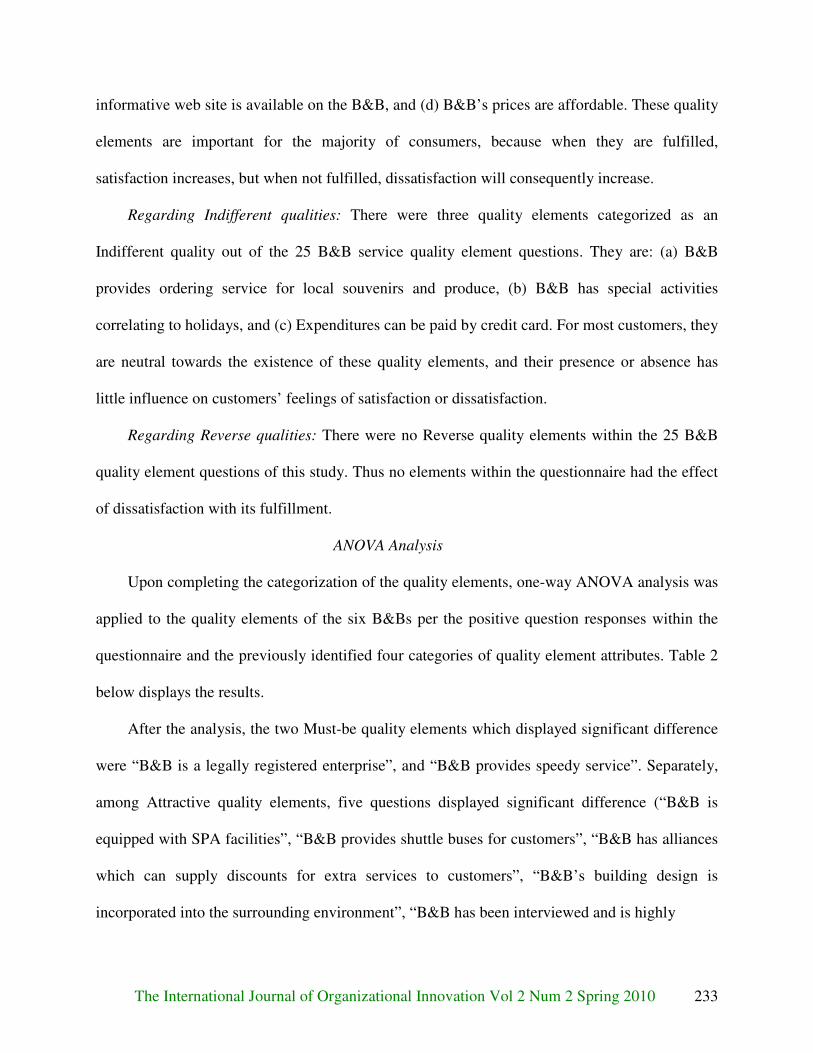
The International Journal of Organizational Innovation Vol 2 Num 2 Spring 2010 233
informative web site is available on the B&B, and (d) B&B’s prices are affordable. These quality
elements are important for the majority of consumers, because when they are fulfilled,
satisfaction increases, but when not fulfilled, dissatisfaction will consequently increase.
Regarding Indifferent qualities: There were three quality elements categorized as an
Indifferent quality out of the 25 B&B service quality element questions. They are: (a) B&B
provides ordering service for local souvenirs and produce, (b) B&B has special activities
correlating to holidays, and (c) Expenditures can be paid by credit card. For most customers, they
are neutral towards the existence of these quality elements, and their presence or absence has
little influence on customers’ feelings of satisfaction or dissatisfaction.
Regarding Reverse qualities: There were no Reverse quality elements within the 25 B&B
quality element questions of this study. Thus no elements within the questionnaire had the effect
of dissatisfaction with its fulfillment.
ANOVA Analysis
Upon completing the categorization of the quality elements, one-way ANOVA analysis was
applied to the quality elements of the six B&Bs per the positive question responses within the
questionnaire and the previously identified four categories of quality element attributes. Table 2
below displays the results.
After the analysis, the two Must-be quality elements which displayed significant difference
were “B&B is a legally registered enterprise”, and “B&B provides speedy service”. Separately,
among Attractive quality elements, five questions displayed significant difference (“B&B is
equipped with SPA facilities”, “B&B provides shuttle buses for customers”, “B&B has alliances
which can supply discounts for extra services to customers”, “B&B’s building design is
incorporated into the surrounding environment”, “B&B has been interviewed and is highly
The International Journal of Organizational Innovation Vol 2 Num 2 Spring 2010 234
Table 2. Result of ANOVA analysis on quality elements from six selected bed & breakfasts
Sum of squares
Mean square
F p-Value
Must-be quality
B&B provides breakfast 2.563 .513 1.5 0.172
B&B is a legally registered enterprise 5.700 1.140 2.939 0.038*
B&B staff is good at anticipating the customers’ needs and shows concern for customers
1.939 .388 1.121 0.349
B&B provides speedy service 6.611 1.322 2.635 0.24*
Attractive quality
B&B is equipped with SPA facilities 7.206 1.441 1.377 0.233
B&B provides high quality entertainment equipment 4.003 0.801 1.247 0.287
B&B provides computers and internet access 3.603 0.721 0.701 0.623
B&B is equipped with hot springs 13.397 2.679 2.685 0.022*
B&B provides shuttle buses for customers 18.884 3.777 3.599 0.004*
B&B has alliances which can supply discounts for extra services to customers
17.098 3.420 2.567 0.027*
B&B has natural scenery and nice views 4.356 0.871 2.060 0.071
B&B’s building design is incorporated into the surrounding environment
6.450 1.290 2.336 0.052
B&B’s buildings have a theme 3.602 0.720 1.922 0.091
Customers can make reservations via the internet 8.014 1.603 1.558 0.172
B&B has been interviewed and is highly recommended by the public media
14.192 2.838 2.375 0.039*
B&B feels just like home 5.617 1.123 2.281 0.017*
One-dimensional quality
B&B supplies private spaces for the customers 12.908 2.582 3.968 0.002*
B&B’s location is near scenic spots 0.638 0.128 0.413 0.840
An informative web site is available on the B&B 32.354 6.471 5.298 0.000*
B&B’s prices are affordable 6.606 1.321 2.711 0.021*
Indifferent quality
B&B provides ordering service for local souvenirs and produce 2.732 0.546 0.447 0.815
Expenditures can be paid by credit card 3.282 0.656 0.861 0.508
B&B has special activities correlating to holidays 1.005 0.201 0.266 0.931
Note: * = P<.05
recommended by the public media”, and “B&B feels just like home”). For One-dimensional
quality elements, “B&B supplies private spaces for the customers”, “An informative web site is
available on the B&B”, and “B&B’s prices are affordable” were the three displaying significant
difference. In total, through one-way ANOVA analysis, it is found that ten quality elements
within the customer’s recognition display significant difference due to a B&B’s distinct
characteristics.
Logistic Regression Analysis
Lastly, we applied logistic regression analysis to the ten quality elements with significant
difference identified above through one-way ANOVA and the question of the customers’
willingness to revisit. Logistic regression is most suitable for dichotomous dependent variable

The International Journal of Organizational Innovation Vol 2 Num 2 Spring 2010 235
analysis, in cases where the data consists only of two statuses, such as “success” or “fail”.
Logistic regression analysis resembles traditional regression except that it transforms discrete
data into a continuous value between 0 and 1 first, before applying the analysis. The main
purpose of logistic regression analysis is to find the relation between categorical-type response
variables and a series of explanatory variables. This study first assumed willingness to revisit as
1, and unwillingness to revisit as 0, then analyzed the quality elements identified above as having
significant difference. Results are shown in Table 3 below.
These results from Table 3 show that, for the customers of B&B 1, the two Must-be
qualities of “B&B is a legally registered enterprise” and “B&B provides speedy service” and the
two One-dimensional qualities of “An informative web site is available on the B&B” and
“B&B’s prices are affordable” are significantly linked to their willingness to revisit. In other
words, for the customers of B&B 1, these four quality elements are the main factors in their
decision to revisit the facility. It is worth mentioning that, for the customers of B&B 1, the
element of “affordable prices” displays a strong positive correlation of β=2.830. We believe that
this might be due to B&B 1’s operator providing the other three quality elements in such a way
Table 3 Result of logistic regression analysis on quality elements with significant difference and willingness to revisit for each B&B
Quality element
B&B 1 (n=51)
B&B 2 (n=55)
B&B 3 (n=48)
B&B 4 (n=46)
B&B 5 (n=49)
B&B 6 (n=46)
B&B is a legally registered enterprise
MQ 0.027* (2.386)
0.313 0.023* (1.532)
0.291 0.167 0.022* (5.351)
The B&B provides speedy service MQ 0.028* (2.034)
0.487 0.278 0.991 0.778 0.092
B&B is equipped with hot springs AQ 0.093 0.797 0.058 0.040* (2.190)
0.659 0.209
B&B provides shuttle buses for customers
AQ 0.229 0.902 0.534 0.022* (2.529)
0.520 0.911
B&B has alliances which can supply discounts for extra services to customers
AQ 0.724 0.032* (1.534)
0.209 0.184 0.943 0.979
B&B has been interviewed and is highly recommended by the public
AQ 0.599 0.349 0.050* (0.902)
0.722 0.021* (2.384)
0.746

The International Journal of Organizational Innovation Vol 2 Num 2 Spring 2010 236
media
B&B feels just like home AQ 0.530 0.763 0.451 0.489 0.617 0.812
B&B supplies private spaces for the customers
OQ 0.292 0.686 0.184 0.400 0.889 0.027* (1.534)
An informative web site is available on the B&B
OQ 0.029* (1.734)
0564 0.045* (1.381)
0.367 0.455 0.286
B&B’s prices are affordable OQ 0.017* (2.830)
0.346 0.235 0.301 0.707 0.016* (1.534)
Note: * = P<.05 MQ = Must-be Quality AQ = Attractive Quality
OQ = One-dimensional Quality
( ) = β Value
that made their customers feel the price they paid was well worth the cost. Things like
expeditious service and detailed, convenient guides to the facility perhaps added value to the
package and hence became a main reason for revisiting.
The customers of B&B 2 appeared to have a strong preference for the special deals and
packages that the B&B’s alliances with other businesses provided for its guests. This was the
most attractive for customers out of all the quality elements and consequently provided this
operator with an advantage in this highly competitive market. For the customers of B&B 3, the
fact that the “B&B is a legally registered enterprise”, the “B&B has been interviewed and is
highly recommended by the public media”, and “An informative web site is available on the
B&B” was the most attractive to them. This demonstrated that, while, in general, travelers often
regard advertising or media coverage of a product with suspicion because they have an
awareness of prices in an open and fair market (Chan and Wong, 2005), when travelers actually
experience the product and the service level matched or exceeded the media’s coverage, the
media’s effects change into an important and influential quality element for them. The customers
of B&B 5 seemed to display reactions similar to those from the customers of B&B 3.
As for the customers of B&B 4, the two quality elements of “B&B is equipped with hot
springs”, and the “B&B provides shuttle buses for customers” were most emphasized. B&B 4
advertised itself as being a bed & breakfast equipped with a natural hot spring, which is

The International Journal of Organizational Innovation Vol 2 Num 2 Spring 2010 237
considered a unique selling point among a B&B’s facilities. In absorbing the transportation costs
of providing a shuttle service to increase accessibility, this B&B also increased its customers’
willingness to revisit (β=2.830). The customers of B&B 6 found that the “B&B is a legally
registered enterprise”, the “B&B supplies private spaces for the customers”, and the “B&B’s
prices are affordable” were the most important quality elements to them. This outcome is very
similar to that of B&B 1’s and shows that B&B 6’s customers also believed that the operator
provided services and accommodations well worth the money they had paid and hence are
willing to return.
Conclusion and Suggestions for Future Research
Past service quality research which examined tourists’ recognition of service quality
considered the customer’s overall satisfaction level with the services and compared the
customers’ anticipation with actual services received (Parasuraman et al., 1985). From the
research results above, we see that travelers differentiate between and acknowledge different
service providers supplying distinct styles, features, and service delivery capabilities via their
bed and breakfast businesses, and that these service features do influence the customers’
willingness to return for repeat business. This study employed the Kano two-dimensional model
and targeted various service quality elements from select B&Bs for categorization. After
examining these quality elements, we discovered that cognition of and preference for different
service quality elements will change with variations in the facilities’ service characteristics. At
the same time, the results also show that even with the highest B&B density in Taiwan’s Tsing-
Ching areas, B&B businesses are able to differentiate themselves enough with unique service
elements to facilitate the development of preferences among its customers, thereby ensuring
repeat business and the ability to survive among intense competition. It is important to note,

The International Journal of Organizational Innovation Vol 2 Num 2 Spring 2010 238
though, that the five quality elements from this Kano model will change and evolve with the
passing of time; an Attractive quality element may change into a One-dimensional quality
element, and a One-dimensional quality element may change into a Must-be quality element.
This study applied a combination of the Kano two-dimensional quality model and the
SERVQUAL service quality measurement table to the results of a sample taken within a defined
period. B&B businesses should not assume they can take the key quality elements identified out
of the five quality attributes outlined in this study and increase competitiveness based on them
and be free from worry. Attention needs to be paid to changes in a quality element’s attribute, so
that a high level of competitiveness can be maintained by keeping a constant pulse on the
suitability of the service elements being offered.
Additionally, this study’s main goal was to explore how different quality elements
affected the customers’ willingness to return, and did not take it one step further to examine, on a
micro-level, how each quality element is perceived by customers with disparate backgrounds.
Thus, it is suggested that further research can target one or many bed and breakfasts and expand
the sample size, to make comparisons between quality elements and tourist population variables.
Also, due to this study’s limited human resources, the investigative scope only included B&Bs in
Taiwan’s Tsing-Ching areas, and there is the worry that the possibility of homogenous sampling
is higher, so future research involving a larger scope (possibly including all of Taiwan’s tourist
attraction areas with high B&B density) and a longer timeline is called for.
Lastly, we suggest that future researchers can adopt a Resource-Based View (RBV)
(Barney, 1991) to extract the highly valuable or irreplaceable quality elements from individual
B&B’s existing enterprise resources. One can also attempt to apply the Quality Function
The International Journal of Organizational Innovation Vol 2 Num 2 Spring 2010 239
Deployment process in designing a superior package of service quality elements after arriving at
a thorough understanding of the traveler’s needs via focus group interviews.
References
Barney, J. B. 1991. Firm resources and sustained competitive advantage. Journal of
Management, 17(1), 99-120.
Baker, D. A. and Crompton, J. L., 2000, Quality, satisfaction and behavioral intentions, Annals
of Tourism Research, 27(3), 785-804.
Chen, T. S. and Lin, C. F., 2006, A study on the visitors’ satisfaction and revisited of home stay
facilities in Tsing-Ching area, Tourism Management Research, 6(1), 21-44.
Gronroos, 1982, An applied service marketing theory, European journal of marketing, 16, 36.
Heskett, J. L., Sasser W. E., Jr., & Hart, C. W. 1989, Service breakthrough, New York:The
Free Press.
Kano, N., Seraku, N., Takahashi, F. & Tsuji, S. 1984. Attractive Quality and Must-be Quality.
Hinshitsu Quality, the Journal of Japanese Society for Quality Control, 14: 39~48.
Lin, C. F., 2004, The study of tourist’s satisfaction for King-Man, Journal of Business, 7, 33-68.
Malley O., Mitra, K, J, Mooney, J P, Fancher, J, Laszlo J., 1993, Market focus, Modern Plastics,
New York: Mid-Nov., 70(12), 15.
Matzler, K. and Hinterhuber, H. H., 1998, How to make product development projects more
successful by integrating Kano’s model of customer satisfaction into quality function
deployment, Technovation, 18(1), 25-38.
Morrison, E. W. 1996, Longitudinal study of the effects of information seeking on newcomer
socialization, Journal of Applied Psychology, 78, pp.173-183.
Norman, D. A. 1988, The psychology of everyday things. New York: Basic Book.

The International Journal of Organizational Innovation Vol 2 Num 2 Spring 2010 240
Parasuraman, A., Zeithaml, V. A. and Berry, L. L., 1985, SERVOUAL:A Multiple –Item Scale
for Measuring Consumer Perception of Service Quality, Journal of Marketing, 64, 13-40.
Parasuraman, A., Zeithaml, V A., and Berry, L. L.1988. SERVQUAL :A Multiple-item Scale
for Measuring Consumer Perceptions of Service Quality, Journal of Retailing, 64:1, 12-
40.
Parasuraman, A., Zeithaml, V A., and Berry, L. L.1991.Refinement and Reassessment of the
SERVQUAL Scale, Journal of Retailing, 67:4, 420-450.
Schvaneveldt, S. J., Enkawa, T. and Miyakawa, M., 1991, Consumer Evaluation Perspectives of
Service Quality: Evaluation Factors and Two-way Model of Quality, Total Quality
Management, 59, 63-74.
Yang, C. C., 1993, Applying Kano Model to the service quality, Quality Control Journal.
Zane, B. 1997, The B & B Guest: A Comprehensive View, The Cornell Hotel and Restaurant
Administration Quarterly, 38(4), pp.69-75.

The International Journal of Organizational Innovation Vol 2 Num 2 Spring 2010 241
USING DATA MINING TO SOLVE FLOW SHOP SCHEDULING PROBLEMS
Chinyao Low
Department of Industrial Engineering
Da-Yeh University, Chang-hua, Taiwan 640, ROC
Shiang-Huei Kung,
Department of Industrial Engineering and Management
National Yunlin University of Science and Technology, Douliou, Taiwan 640, ROC
Department of Industrial Engineering and Management
Chinmin Institute of Technology, Miaoli, Taiwan 110, ROC
Chikong Huang
Department of Industrial Engineering and Management
National Yunlin University of Science and Technology, Douliou, Taiwan 640, ROC
Abstract
This paper presents a novel use of data mining algorithms for the extraction of knowledge from a large set
of flow shop schedules. The purpose of this work is to apply rough set methodologies to explore the
patterns in data generated by the simulated annealing algorithm performing in a scheduling operation.
These patterns are then used to develop a rule set. In using the simulated annealing for flow shop
scheduling problems, the solutions are represented by operational sequences for job allocation. Among
these optimal or near optimal solutions, similar relationships may exist between the characteristics of
operations and the order of jobs’ sequence. Rough set methodology is then used to explore the
relationship between the attributes of resources and the operation sequence. A set of rules are then
developed and these rules can duplicate the performance of simulated annealing on a similar problem. It
is believed that these rules can provide the solutions which are superior to a simple dispatching rule in a
similar problem.
Keywords: Rough Set; Data Mining; Flow Shop Scheduling; Simulated Snnealing

The International Journal of Organizational Innovation Vol 2 Num 2 Spring 2010 242
Introduction
Scheduling is an important process widely used in manufacturing, production,
management, and computer science. It mainly concerns allocating resources to tasks over time
under necessary constraints. A good scheduling can increase effective utilization for resources
and reduce the otiose waste. A general flow shop scheduling problem is a production problem
which can be defined as a set of n jobs which has to be processed with the identical flow pattern
on m machines. Since the sequence of job processing on all machines is the same, the flow shop
sequencing production environment is also known as the permutation flow shop. No job passing
is permitted and the number of possible schedules for n jobs is up to n!. Usually, the schedule
performance measure is related to an efficient resource utilization which will minimize the
makespan. Therefore, the makespan, that is, the total time to complete all jobs, is the major
performance measure in this research.
The scheduling problem discussed in this paper is generally based on the following
assumptions: (i) the operation processing times on the machines are known and fixed. Some of
them may be zero if some job is not processed on a machine. (ii) Set-up times are included in the
processing times and they are independent of the job sequence. (iii) Each job is processed by one
and only one machine at any time and each machine processes one job only. (iv) The job
operations on the machines can not be preempted.

The International Journal of Organizational Innovation Vol 2 Num 2 Spring 2010 243
Significant research efforts have been devoted to sequencing jobs in a flow shop with the
objective of minimizing the makespan. However, since this scheduling problem is NP-hard
(Garey, M. R. et al, 1976), the search for an optimal solution is more theoretical than practical
importance. Since the 1960s, a number of heuristic methods that provide near optimal or good
solutions with limited computation efforts have been proposed for schedule sequencing (Nagano
M.S. et al, 2002),. This paper collects the near optimal solutions to form database and extracts
“knowledge” from this database. Feature extraction is important to help humans learn gain
necessary knowledge about a specific part of a real or abstract world and further use the
knowledge to make sound decisions (Zhai Lian-Yin, et al, 2002).
Simulated annealing (SA) can often provide fast solutions to the traditional numeric
problems, especially for the manufacturing flow shop problems. Nevertheless, SA does not
demonstrate repeatability or provide an explanation of how a solution is developed. This paper
presents a methodology for inducting rules from the solutions of an SA that can describe its
behavior. These rules have also been applied to other similar job shop cases with success.
Basic Concept
This paper develops a methodology to find rules extracting from the database which
consists of optimal solutions generated by the SA algorithm. Those extracted rules can be
dispatching rules for shop problems. The following subsections will review the concept of SA

The International Journal of Organizational Innovation Vol 2 Num 2 Spring 2010 244
algorithm and rough set, respectively.
Simulated Annealing
Kirkpatrick initially presented the simulated annealing algorithm, attempts to solve hard
combinatorial optimization problems through controlled randomization (Kirkpatrick S., et al,
1983). It is motivated by an analogy to the thermodynamics of annealing in solids, such as
growing silicon in the form of highly ordered and defect-free crystals.
Simulated annealing is a generic name for a class of optimization heuristics that perform
a stochastic neighborhood search of the solution space. At each iteration stage, the new solution
searched from the neighborhood of the current solution is accepted as the solution is better. If it
is a worse solution, it still can be accepted with a probability that decreases as the temperature is
reduced. This temperature, which is simply a positive number, is periodically reduced by a
temperature scheme, so that it moves gradually from a relatively high value to near zero as the
method progresses (Low C., 2005).
The most important characteristic of this algorithm is the possibility of accepting the
worse solutions, which can allow it to escape from a local minimum. Besides this probability, an
annealing algorithm also includes the following four components (Tang O. 2004):

The International Journal of Organizational Innovation Vol 2 Num 2 Spring 2010 245
(i) Configuration: A description of possible problem solutions among which the researchers
search for an optimal one. Very often, the decision variables are multidimensional, discrete and
having upper and lower bounds.
(ii) Cost function: An objective function to measure how well the system performs when a
certain configuration is given.
(iii) Move set: A generator of random changes in the configuration. It is a set of allowable moves
that will reach all feasible configurations.
(iv) Cooling schedule: A definition of the cooling speed to anneal the problem from a random
solution to a good, frozen one. In details, it must provide a starting temperature, together with the
rules to determine when and how much the temperature should be reduced and when the
annealing should be terminated.
Rough Set
The theory of rough set was developed in the 1980s by (Pawlak Z., 1982, 1984, 1991)
and (Pawlak Z. et al. 1995). Among others, it deals with the problem of indiscernibility between
objects in a set. Rough set theory is useful when “the classes into which the objects are to be
classified are imprecise, but can nevertheless be approximated with precise (crisp) sets” (Nurmi
H., et al, 1996) .
Although rough set theory is related, in some respects, to other mathematical tools

The International Journal of Organizational Innovation Vol 2 Num 2 Spring 2010 246
developed to deal with vagueness and uncertainty, it is a somewhat different approach. “One of
the main advantages of rough set theory is that it does not need any preliminary or additional
information about the data, such as probability distributions in statistics, basic probability
assignment in the Dempster-Shafer theory, or grade of membership, or the value of possibility in
fuzzy set theory” (Pawlak Z., 1991) .
Objects characterized by the same properly selected information (referred to as attributes
or features) are indiscernible in view of the available information. Data of the objects, i.e.
attribute values, is often presented in an information table or decision table (Polkowski S.L.,
1998). The information table with its rows and columns is corresponding to objects and
attributes. The rules can identify data patterns hidden in an information table. The procedure of
capturing decision rules from a set of raw data is known as rule induction (Pawlak Z., 1991).
Kusiak (2000) compiled the reduct generation algorithm (Pawlak Z., 1991) as follows:
Step 0. Initialize object number i=1.
Step 1. Select object i and find a set of reducts with one feature only. If found, go to Step 3;
otherwise go to Step 2.
Step 2. For object i, find a reduct with m-1 features, where m is the number of input features.
This step is accomplished by deleting one feature at a time.
Step 3. Set i=i+1. If all objects have been considered, stop; otherwise go to step 1.

The International Journal of Organizational Innovation Vol 2 Num 2 Spring 2010 247
This algorithm can be applied to categorical data as well as numerical data (Kusiak A.,
2000). If the attribute values are large or differences of the attribute values between different
output categories are significant, the numerical data can be transformed into discrete form based
on predefined continuous intervals.
Since the scheduling problem is the major concern in this paper, several attributes may be
generated from the scheduling problem. Therefore, the reduct generation algorithm is suitable to
be directly applied to the scheduling problem and extract knowledge rules.
The Feature Extraction Framework System
The framework of feature system is shown in Fig. 1. The primary function of the system
is to extract rules. The system comprises three main modules: a pre-processor, a rough set
analyzer, and a rule pruner. A stepwise description is given as follows.
Step 1: Pre-processor
The raw knowledge or data gleaned from near optimal or good solutions is stored and
subsequently forwarded to the system for feature extraction. The pre-processor module performs
three tasks: accessing input data, collecting SA near optimal solutions, and designing useful
attributions.
The purpose of this system is to extract good rule from the database; therefore, the data
set generated from pre-processor must be correct. This research uses simulated annealing

The International Journal of Organizational Innovation Vol 2 Num 2 Spring 2010 248
Pre-processor
Conflicting?
Lower
Approximation
Upper
Approximation
Certain Rules
Possible Rules
Reliability Analysis
Output
Y
N
Rule pruner
Knowing Optimum Solution
Collecting Optimal Data by
Simulated Annealing
Attributes Design
Coding
Calculating Approximations
Pruning Rule
Rough set
analyzer
Figure 1. The Feature Extraction Framework System

The International Journal of Organizational Innovation Vol 2 Num 2 Spring 2010 249
algorithm to collect near optimal solutions under many different conditions. These solutions form
a data mining’s database. It obtains adaptable rules of this database through the following step.
The design of attributes is important because the better design of attributes is, the more useful
rules can get. The design of attributes is divided into the needed layer series which will transfer
the coding to SA input data.
Step 2: Rough set analyzer
The rough set analyzer carries out three sub-tasks, namely consistency check, concept
forming, and approximation. It scans the data obtained from the pre-processor module and
checks its consistency. Once an inconsistency is spotted, it will activate the approximation
operator to carry out the analysis using rough set theory. The approximation operator employs
the lower and upper approximators to calculate the lower and upper approximations. During this
step, the training data set is split into the certain training data set and the possible training data
set based on consistency check and approximation.
Take a simple example to explain the lower and upper approximations to extract certain
and possible rule. As indicated in Table 1, the information table with its rows and columns is
corresponding to objects and attributes. Table 1 shows a typical information system used for
rough set analysis. The set of Obj(i) (i = 1,2,…10) represents objects of the set U to be classified.
The set of aj (j = 1,2) denotes the condition attributes. In addition, d represents the decision

The International Journal of Organizational Innovation Vol 2 Num 2 Spring 2010 250
attribute.
More specific definitions are shown as follows:
U is the universe which contains a finite set of all training examples (objects).
U = {Obj1, Obj
2, Obj3, Obj
4, Obj5, Obj
6, Obj7, Obj
8, Obj9, Obj
10}
A is the set of all attributes describing the examples.
A = { a1, a2}
B is an arbitrary subset of A.
B = { a1} , {a2} , { a1, a2}
D is the set of classes to be determined.
D = {d}
jaV is the value domain of an attribute aj.
jaV = { daa VVV ,,21
} = {{0, 1}, {0, 1, 2}, {0, 1}}
When two objects Obj(i) and Obj
(k) have the same value of attribute Aj (i.e., )()( k
a
i
a jjVV = ),
Obj(i) and Obj
(k) are said to have an indiscernibility relation (or equivalent relation) on attribute aj.
Similarly, if Obj(i) and Obj
(k) have the same values for each attribute in subset B of A, then Obj(i)
and Obj(k) are said to have an indiscenibility relation on attribute set B. Table 1 shows that Obj
(4),
Obj(5) , and Obj
(7) are indiscernible by condition attributes a1 and a2. Furthermore, they possess
different decision attributes. This implies that there exists a conflict (or inconsistency) between
objects Obj(4) , Obj
(5) , and Obj(7).

The International Journal of Organizational Innovation Vol 2 Num 2 Spring 2010 251
Table 1. A Typical Information System For Rough Set Analysis
Objects U Attributes a1 Attributes a2 Decision d
Obj(1)
1 0 0 Obj
(2) 1 1 1
Obj(3)
1 2 1 Obj
(4) 0 1 0
Obj(5)
0 1 0 Obj
(6) 0 2 1
Obj(7)
0 1 1 Obj
(8) 0 2 1
Obj(9)
1 0 0 Obj
(10) 1 1 1
Rough set theory offers a means to deal with inconsistency in information system. Let X
be an arbitrary subset of the universe U, and B an arbitrary subset of attribute set A. For a
concept X, the greatest definable set contained in the concept is known as the lower
approximation of )(* XB . )(* XB represents the set of objects(x) on U which can be certain
classified in the set of attributes, B. )(* XB is represented in equation (1).
{ }XxBUxxXB ⊆∈= )( ,)(* (1)
On the other hand, the least definable set containing concept X is called the upper
approximation of )(* XB . )(* XB represents the set of objects(x) on U which can be possible
classified in the set of attributes, B. )(* XB is represented in equation (2).
}X)( ,{)(* φ≠∈= IxBandUxxXB (2)
Elements are belonging to only the upper approximation that composes the boundary region
(BRB) or the doubtful area. Mathematically, a boundary region can be expressed as equation (3).

The International Journal of Organizational Innovation Vol 2 Num 2 Spring 2010 252
BRB(X) = )()( *
* XBXB − . (3)
Rough set theory offers a powerful means to deal with inconsistency in an information system.
The lower approximation (B*(X)) can confirm certain rules and the boundary region (BRB(X)) can
confirm possible rules. For example, in Table 1, universe U consists of ten objects and can be
described using two decision namely Vd =0 and Vd =1. The conflict, object Obj(4), Obj
(5) , and
Obj(7), exists in the data set. The conflict causes the objects to be indiscernible and constitutes
doubtful areas by BRB(Vd=0) or BRB(Vd=1), respectively, as shown in Fig. 2. The lower
approximation of decision Vd=0 is given by Set { Obj(1), Obj
(9)}, which forms the certain training
data set of decision Vd= 0. On the other hand, the upper approximation is represented by object
Set { Obj(1), Obj
(4), Obj(5), Obj
(7), Obj(9)}, which contains the possible training data set of decision
)0()0()0( *
*===+= ddBd VBVBRVB
)0(* =dVB
)1()1()1( *
*===+= ddBd VBVBRVB
)1(* =dVB
Figure 2. Basic Concepts Of Rough Set Theory

The International Journal of Organizational Innovation Vol 2 Num 2 Spring 2010 253
Table 2. Rules Generated From The Example Decision Vd = 0 Certain rule
When a2=0, then d=0.
When a1=1 and a2=0, then d=0. Decision Vd = 1 Certain rule
When a1 = 0 and a2 = 2, then d = 1. When a1 = 1 and a2 = 1, then d = 1. When a2 = 2, then d = 1.
Conflicting Possible rule
When a1 = 0 and a2 = 1, then d = 0 or 1.
Vd=0. Decision Vd=1 can be similarly interpreted. The certain and possible rules are acquired
through the lower approximations and the boundary region, respectively, as shown in Table 2.
Step 3: Prune rule
The pruning rule performs two tasks: pruning (or simplifying) and rule evaluation. It
examines all the certain and possible rules. During the pruning operation, the redundant rules are
removed. In addition, the related rules are clustered and generalized during simplification.
Possible rules are not definitely true. Therefore, the misclassification of possible rules must be
further assessed.
Let two sets X and Y be the two subsets of the universe set ),( UYXU ⊂ and X is totally
included in )( YXY ⊂ . The misclassification of possible rules is defined as equation (4).
)(
)(1) ,(
Xcard
YXcardYX
∩−=µ (4)
The threshold value is called β. If the misclassification of possible rules is less than β, the
possible rule could be accepted.

The International Journal of Organizational Innovation Vol 2 Num 2 Spring 2010 254
By using the data set in Table 1 and temporary rules in Table 2 as examples, let X={
Obj(4), Obj
(5) , Obj(7) } and threshold β=0.4. When a1 = 0 and a2 = 1, then Vd = 0; the
misclassification of possible rules can be calculated as follows.
4.033.03
1
3
21
})Obj,Obj,Obj({
})Obj,Obj{}Obj,Obj,Obj({1)),((
(7)(5)(4)
(5)(4)(7)(5)(4)
0211 ≤==−=∩
−===card
cardXxaaµ
The possible rule is assessed when a1 = 0 and a2 = 1, then Vd = 0. But the
misclassification of possible rule that when a1 = 0 and a2 = 1, then Vd = 1 is equal 0.66. That is
more than β, so the possible rule is not assessed.
Through pruning rule and calculating the misclassification of possible rules, the results
including certain rules and possible rules are indicated in Table 3.
Table 3. Result Of Pruned And Calculated Rules
Decision Vd = 0 Certain rule
When a2=0, then d=0.
Decision Vd = 1 Certain rule
When a1 = 1 and a2 = 1, then d = 1. When a2 = 2, then d = 1.
Conflicting Possible rule
When a1 = 0 and a2 = 1, then d = 0.
Once all the rules are extracted from the data set, the significant features with respect to
the target object can be examined.
Example Of Flow Shop Problem
To demonstrate its effectiveness, the developed methodology in this research is applied to

The International Journal of Organizational Innovation Vol 2 Num 2 Spring 2010 255
a flow shop problem. According to feature extraction framework system, it uses Mosheiov
(2003) research to be the dataset of knowing optimum solution. Mosheiov uses branch and
bound process to solve flow shop problems. The objective function of these problems is the
minimum of makespan. The problem size contains totally 6 kinds of combinations that are 20
jobs×5 machines, 20 jobs×10 machines, 20 jobs×20 machines, 50 jobs×5 machines, 50 jobs×10
machines, and 50 jobs×20 machines. Every combination has 5 different process times. Since the
research paper provides the minimum of makespan only, it is necessary for us to generate the
jobs’ sequence by using SA algorithm. These results are then used to find its attribution for good
solution quality in the same problem size. Design parameters of SA algorithm are indicated as
follows: starting temperature 200, cooling temperature α(T)=0.9897, and ending temperature
0.0001. Table 4 shows the best solutions of makespan generated by SA and Mosheiov, G.’s
research.
Attributions
The efficient Johnson’s algorithm (1954) obtains an optimal solution for the flow
shop problem with unlimited jobs performed by two or three machines. Therefore, the
attributions are identified according to the concept of Johnson’s rule. Typically, the size
of flow shop problem is n job and m machine. ijT is the process time of job i in machine j.

The International Journal of Organizational Innovation Vol 2 Num 2 Spring 2010 256
Table 4. The Results From Simulated Annealing
Problem size (job×machine_no.)
Mosheiov (2003)
SA Problem size
(job×machine_no.) Mosheiov
(2003). SA
20×5_1 1278 1278* 50×5_1 2724 2729
20×5_2 1359 1360 50×5_2 2836 2838
20×5_3 1081 1081* 50×5_3 2621 2622
20×5_4 1293 1297 50×5_4 2751 2753
20×5_5 1235 1235* 50×5_5 2863 2864
20×10_1 1582 1587 50×10_1 3037 3046
20×10_2 1659 1664 50×10_2 2911 2911
20×10_3 1496 1508 50×10_3 2871 2871
20×10_4 1377 1390 50×10_4 3067 3071
20×10_5 1419 1423 50×10_5 3011 3021
20×20_1 2297 2310 50×20_1 3886 3943
20×20_2 2099 2120 50×20_2 3733 3820
20×20_3 2326 2341 50×20_3 3673 3752
20×20_4 2223 2248 50×20_4 3755 3814
20×20_5 2291 2318 50×20_5 3648 3719
* : The underline indicates that GA generates the optimal solution.
The design of attributions is explained as follows:
(1) ∑=
=m
j
iji TU1
represents total process time for each job through all machines. The maximum
and minimum of iU are indicated as equation (5) and (6), respectively.
[ ]ni
m
j
m
j
njjii UUUTTUU ,,max/,,max/max_ 1
1 1
1 LL =
= ∑ ∑
= =
for i∀ (5)
[ ] ]),,min[],,/(max[),,min(min_ 111 nnnii UUUUUUUU LLL −−= for i∀ (6)
The values of max_iU and min_iU are ranging form 0 to 1. No matter how many jobs
they have, there are only two attributions.

The International Journal of Organizational Innovation Vol 2 Num 2 Spring 2010 257
(2) ∑=
=n
i
ijj TX1
represents that each machine should need to spend total process time through all
jobs. The maximum and minimum of jX are indicated as equation (7) and (8), respectively.
],,max[/],max[/max_ 1
11
1 mj
n
i
im
n
i
ijj XXXTTXX LL == ∑∑==
for j∀ (7)
]),,min[],,/(max[]),,min[(min_ 111 mmmjj XXXXXXXX LLL −−= for j∀ (8)
The values of max_jX and min_jX are ranging form 0 to 1. For the case of m
machines, the number of attributes is m×2 .
(3) ijT is the process time of job i in machine j. The maximum and minimum of ijT for all jobs
and machines are indicated as equation (9) and (10), respectively. The maximum and minimum
of ijT for all jobs in the same machines are indicated as equation (11) and (12), respectively.
=
nmn
m
ijij
TT
TT
TT
K
MOM
L
1
111
max/max_ for i∀ j∀ (9)
)min/(max)min(min_
1
111
1
111
1
111
−
−=
nmn
m
nmn
m
nmn
m
ijij
TT
TT
TT
TT
TT
TT
TT
K
MOM
L
K
MOM
L
K
MOM
L for i∀ j∀ (10)
The value of max_ijT and min_ijT are ranging from 0 to 1. For the case of m machines,
the number of attributes is m×2 .
]),,max[/max_ 1 imiiji TTTY L= for i∀ (11)
]),,min[],,/(max[]),,min[(min_ 111 imiimiimiiji TTTTTTTY LLL −−= for i∀ (12)
The value of max_iY and min_iY are ranging form 0 to 1. For the case of m machines, the

The International Journal of Organizational Innovation Vol 2 Num 2 Spring 2010 258
number of attributes is m×2 .
For the case of n jobs and m machines, the total number of attributions is 2+m×6. For
example, if m= 5, the total number of attributions is 32. If m= 10, the total number of
attributions is 62. If m= 20, the total number of attributions is 122. Because the value of all
attributes is ranging from 0 to 1, five classes can be classified as follows: (1) 0 ~ 1/5 as 0, (2) 1/5
~ 2/5 as 1, (3) 2/5 ~ 3/5 as 2, (4) 3/5 ~ 4/5 as3, (4) 4/5 ~ 1 as 4.
The mining task is to find the relationship between attributes and its order from SA
solutions sequence. Therefore, the researchers predict the sequence position of an operation
giving its characteristics. For example, if a flow shop problem with 20 sequence positions is
possible, a decision should be made that five abstract concepts would be substituted during rule
induction. The priority of decision attribute is defined as a range of sequence positions from the
SA solutions. Thus, the value of position is classified into five classes: {1,2,3,4} as 0, {5,6,7,8}
as 1, {9,10,11,12} as 2, {13,14,15,16} as 3, {17,18,19,20} as 4. Each problem size has 5 training
data sets. By using the reduct generation algorithm and pruning rules, the total number of rules
can be gained and indicated in Table 5.
Testing and Result
The applicability of these rules should be further tested using 10 times in the same size of
problems. Those are 20j5m, 20j10m, 20j20m, 50j5m, 50j10m, 50j20m flow shop test cases which

The International Journal of Organizational Innovation Vol 2 Num 2 Spring 2010 259
Table 5. The number of rule form the training cases
problem size (job×machine)
certain rules possible rules The number of training case
20j×5m 580 159 5 20j×10m 1714 308 5 20j×20m 7350 606 5 50j×5m 87 159 5
50j×10m 63 308 5 50j×20m 315 606 5
process times generated at random. These cases were all scheduled by using the following
algorithms: SA, shortest processing time (SPT), first come first service (FIFO), and priority
rules. Under the same size of problems and process times, the makespans of the schedules
generated in 20 jobs and 50 jobs by SA, SPT, FIFO, and learned rules are indicated in Figure 3
and 4, respectively. The learned rules were acquired by the application of the feature extraction
system. Figure 3 and 4 shows that in 20 jobs and 50 jobs the learned rules were able to produce
shorter makespan than shortest processing time and first come first service. Table 6 summarized
the average makespan of the same problem size that no matter in 20 jobs or 50 jobs, the learned
rules were able to produce shorter makespan than SPT and FIFO. By comparing the averaged of
makespan, the difference between SA and learned rules would be no more than 11.7%.

The International Journal of Organizational Innovation Vol 2 Num 2 Spring 2010 260
0
50
100
150
200
250
300
350
5_1 5_2 5_3 5_4 5_5 5_6 5_7 5_8 5_9 5_10 10_1 10_2 10_3 10_4 10_5 10_6 10_7 10_8 10_9 10_10 20_1 20_2 20_3 20_4 20_5 20_6 20_7 20_8 20_9 20_10
ma
kes
pan
(tim
e)
FIFO
SPT
SA
learned rules
5 machines
10 machines
20 machines
Figure 3. Makespans Of The Schedules Generated In 20 Jobs By
SA, SPT, FIFO, And Discovered Rules
0
100
200
300
400
500
600
700
5_1 5_2 5_3 5_4 5_5 5_6 5_7 5_8 5_9 5_10 10_1 10_2 10_3 10_4 10_5 10_6 10_7 10_8 10_9 10_10 20_1 20_2 20_3 20_4 20_5 20_6 20_7 20_8 20_9 20_10
ma
kes
pan
(tim
e)
FIFO
SPT
SA
learned rules
5 machines
10 machines
20 machines
Figure 4. Makespans of the Schedules Generated In 50 Jobs By
SA, SPT, FIFO, and Discovered Rules

The International Journal of Organizational Innovation Vol 2 Num 2 Spring 2010 261
Table 6. The Average Makespan Of The Same Problem’s Size
Problem size FIFO SPT SA (1) Learned rules (2) Difference (%)*
20j×5m 165.9 161 135.5 149.6 9.43%
20j×10m 214.7 212.8 172.1 193.3 10.97%
20j×20m 294.3 292.1 244.7 274.2 10.76%
50j×5m 405.3 349.8 299 331.1 9.69%
50j×10m 458.7 411.4 341.8 395.5 13.58%
50j×20m 579.1 511.2 421 499.9 15.78%
Average 353 323.05 269.02 307.27 11.70%
* : difference = )2(
)2()1( −%
Conclusion
This research has shown that data mining in rough set can be learned from flow shop
schedules produced by simulated annealing. In practice, the efforts required to duplicate the SA’s
performance were significant.
In this study, the researchers were able to apply the sequencing knowledge from different
sizes flow shop problems solved by simulated annealing. And then it could be generated rules
learned form the optimal or near optimal solutions that could be solve an identical problem.
When compared to problems with the same structure (20j5m, 20j10m, 20j20m, 50j5m, 50j10m,
50j20m Flow Shop) and different operation times and sequences, the rules were able to
consistently outperform the Shortest Processing Time and First Come First Service heuristic.
However, the learned rules were unable to match the performance of the simulated annealing on
these problems. Future research should use the feature extraction system in other problems or

The International Journal of Organizational Innovation Vol 2 Num 2 Spring 2010 262
incremental learning into the mining process.
References
Garey MR, Johnson DS, Sethi R. Complexity of flow-shop and job-shop scheduling. Math Ops
Res 1976;1:117-129.
Johnson SM. (1954). Optimal two-and three-stage production schedules with setup times
included. Nav Res Log Quart 1954;1:61-68.
Kirkpatrick S, Gelatt CD, Vecchi MP . Optimization by simulated annealing. Science 1983;
200(4956):671-680.
Kusiak A. Computational Intelligence in Design and manufacturing. John Wiley & Sons, New
York, 2000.
Low C. Simulated annealing heuristic for flow shop scheduling problems with unrelated parallel
machines. Computers & Operations Research 2005; 32:2013-2025.
Mosheiov G.. Scheduling unit processing time jobs on an m-machine flow-shop. Journal of the
Operational Research Society 2003; 54(4):437-441.
Nagano MS, Moccellin JV. A high quality solution constructive heuristic for flow shop
sequencing. Journal of the Operational Research Society 2002; 53:1374-1379.
Nurmi H, Kacprzyk J, Fedrizzi M. Probabilistic, fuzzy and rough concepts in social choice.
European Journal of Operational Research 1996; 95:264-277.
Pawlak Z. Rough sets. International Journal of Computer and Information Science 1982; 11:341-
356.
Pawlak Z. Rough classification. International Journal of Man–Machine Studies 1984; 20:469-
483.
The International Journal of Organizational Innovation Vol 2 Num 2 Spring 2010 263
Pawlak Z. Rough Sets: Theoretical Aspects of Reasoning about Data. Kluwer Academic
Publishers, Dordrecht,1991.
Pawlak Z, Grzymala-Busse J, Slowinski R, Ziarko W. Rough sets. Communications of the ACM
Association for Computing Machinery 1995;38(11):89-97.
Polkowski SL, Skowron A. Rough Sets in Knowledge Discovery 1: Methodology and
Applications. Physical- Verlag, Heidelberg,1998.
Tang O. Simulated annealing in lot sizing problems. Int. J. Production Economics 2004; 88:173-
181.
Zhai Lian-Yin, Khoo Li-Pheng, Fok San-Cheong. Feature extraction using rough set theory and
genetic algorithms- an application for the simplification of product quality evaluation.
Computers &Industrial Engineering 2002; 43:661-676.