Microsimulation of Demand and Supply of Autonomous ... · PDF file1 Microsimulation of Demand...
20
Microsimulation of Demand and Supply of 1 Autonomous Mobility On-Demand 2 *Carlos Lima Azevedo Singapore-MIT Alliance for Research and Technology 1 Create Way, 138602, Singapore email: [email protected] Katarzyna Marczuk National University of Singapore 21 Lower Kent Ridge Road 119077, Singapore email: [email protected] Sebastián Raveau Singapore-MIT Alliance for Research and Technology 1 Create Way, 138602, Singapore email: [email protected] Harold Soh Singapore-MIT Alliance for Research and Technology 1 Create Way, 138602, Singapore email: [email protected] Muhammad Adnan Singapore-MIT Alliance for Research and Technology 1 Create Way, 138602, Singapore email: [email protected] Kakali Basak Singapore-MIT Alliance for Research and Technology 1 Create Way, 138602, Singapore email: [email protected] Harish Loganathan Singapore-MIT Alliance for Research and Technology 1 Create Way, 138602, Singapore email: [email protected] Neeraj Deshmunkh Singapore-MIT Alliance for Research and Technology 1 Create Way, 138602, Singapore email: [email protected] Der-Horng Lee National University of Singapore 21 Lower Kent Ridge Road 119077, Singapore email: [email protected] Emilio Frazzoli Massachusetts Institute of Technology 77 Mass. Ave., Cambridge, MA 02139, US email: [email protected] Moshe Ben-Akiva Massachusetts Institute of Technology 77 Mass. Ave., Cambridge, MA 02139, US email: [email protected] 3 * corresponding author 4 6141 words + 8 figures + 0 tables 5 August 1, 2015 6
Transcript of Microsimulation of Demand and Supply of Autonomous ... · PDF file1 Microsimulation of Demand...

Microsimulation of Demand and Supply of1
Autonomous Mobility On-Demand2
*Carlos Lima AzevedoSingapore-MIT Alliance for Research andTechnology1 Create Way, 138602, Singaporeemail: [email protected]
Katarzyna MarczukNational University of Singapore21 Lower Kent Ridge Road119077, Singaporeemail: [email protected]
Sebastián RaveauSingapore-MIT Alliance for Research andTechnology1 Create Way, 138602, Singaporeemail: [email protected]
Harold SohSingapore-MIT Alliance for Research andTechnology1 Create Way, 138602, Singaporeemail: [email protected]
Muhammad AdnanSingapore-MIT Alliance for Research andTechnology1 Create Way, 138602, Singaporeemail: [email protected]
Kakali BasakSingapore-MIT Alliance for Research andTechnology1 Create Way, 138602, Singaporeemail: [email protected]
Harish LoganathanSingapore-MIT Alliance for Research andTechnology1 Create Way, 138602, Singaporeemail: [email protected]
Neeraj DeshmunkhSingapore-MIT Alliance for Research andTechnology1 Create Way, 138602, Singaporeemail: [email protected]
Der-Horng LeeNational University of Singapore21 Lower Kent Ridge Road119077, Singaporeemail: [email protected]
Emilio FrazzoliMassachusetts Institute of Technology77 Mass. Ave., Cambridge, MA 02139, USemail: [email protected]
Moshe Ben-AkivaMassachusetts Institute of Technology77 Mass. Ave., Cambridge, MA 02139, USemail: [email protected]
3
* corresponding author4
6141 words + 8 figures + 0 tables5August 1, 20156

ABSTRACT1Agent-based models have gained wide acceptance in transportation planning, as with increasing2computational power it is now possible to run large-scale people-centric mobility simulations.3Several modeling efforts have been reported in the literature both on the demand side (with so-4phisticated activity-based models that focus on individual’s day activity pattern) and on the supply5side (with detailed representation of network dynamics through simulation based dynamic traffic6assignment models). This paper proposes an extension to a state-of-the-art integrated agent-based7demand and supply model, SimMobility, for the design and evaluation of autonomous vehicle8systems. SimMobility integrates various mobility-sensitive behavioral models within a multiple9time-scale structure, comprised of three simulation levels: (i) a long-term level that captures land10use and economic activity, with special emphasis on accessibility, (ii) a mid-term level that han-11dles agents’ activities and travel patterns, and (iii) a short-term level, that simulates movement of12agents, operational systems and decisions at a microscopic granularity. Within this context, this13paper presents a detailed framework for modeling and simulating autonomous vehicle supply mod-14els and its impacts on travel behavior. We showcase the features of this proposed framework with15a pioneer case study on the potential impacts of introducing an Autonomous Mobility-on-Demand16(AMOD) service in a car-restricted zone of Singapore. SimMobility was used in an integrated17manner to determine the fleet size and parking stations requirements for the AMOD service and to18uncover changes in agents’ activity travel patterns specifically in terms of modal shares, routes and19activity destinations.20

Lima Azevedo et al. 2
1 INTRODUCTION1Although the initial developments of autonomous vehicles (AV) technologies was carried out2during the 80’s (1), vehicle automation technology has been under the spotlight since the 20143DARPA’s Grand Challenge (2). It is currently considered a key research effort in many car man-4ufacturer and mobility/robotics research centers (3) and has recently started to be marketed for5personal use (4, 5, 6). AV rely on extensive technological developments in terms of software and6hardware integration, high-level control design, sensor technology and data fusion techniques, mo-7tion control algorithms, and vehicle communication tasks (7). All these components keep evolving8and being rethought for particular deployments, such as new fault-tolerance sensing frameworks9(8), first- and last-mile targeted systems (9) or innovative communications for vehicular networks10design (10). These developments target the change in terms of efficiency, safety and cost of vehic-11ular systems. Yet, aspirations for its contributions in solving large scale transportation problems12such as pollution, road congestion and land use are also high, but are still to be clarified, as they13may rely on the design of the integrated service itself and the environment were it is deployed (3).14
Recent studies have focused on the design and operation of specific AV systems beyond15the private use, such as Autonomous Mobility on-Demand (AMOD) services (11, 12, 13, 14, 15).16Zachariah and Mufti (14), for example, model the implementation of a fleet of autonomous taxis in17New Jersey, based on origin-destination trips derived from travel surveys and focusing on vehicle18occupancy rates. The studies of Pavone et al. (11) and Smith et al. (12) show a theoretical solution19to fleet sizing by introducing rebalancing assignments that minimize the number of empty vehicles20traveling in the network and the number of rebalancing drivers needed, while ensuring stability.21The introduced rebalancing policy (based on a fluidic model) has been tested in a low-fidelity22simulation developed in Matlab, and using both theoretical and simulation results it is possible to23determine the minimum number of vehicles required to maintain system stability. Note that in case24of AMOD systems, fleet sizing is similar to fleet sizing of Mobility On-Demand (MOD) systems25with human-driven vehicles, but with the advantage that the vehicles can redistribute themselves.26Barrios and Godier (16), for example, evaluated three different rebalancing strategies (zero, pe-27riodic and continuous redistribution) for MOD systems. This evaluation was performed for both28station-based (i.e. vehicles can be picked-up and dropped-off only at predefined stations) and free-29floating (i.e. vehicle can be picked up and dropped off anywhere within an operating zone) system.30Analysis was performed using an agent-based simulation approach and tested on a square grid31with a random demand. Similarly, Brownell and Kornhauser (13) focused on analysis of an au-32tonomous Taxi system. The authors evaluated the necessary fleet size for two models: (i) personal33rapid transit, and (ii) smart paratransit. While the models did not account for rebalancing, they do34give insight into the upper and lower bounds of the fleet size required for both models.35
Only recently the mobility impacts of these systems have started to be analyzed. In (15)36the impacts on car fleet size, volume of travel and parking requirements over two different time37scales (24-hour average and peak hour period) for shared and non-shared AMOD configurations are38analyzed in an agent-based simulated scenario for Lisbon, Portugal. The study points a potential39reduction of 9 out of every 10 existing cars, but noticing the increased fleet millage. However, the40analysis did not include a dynamic traffic model which would simulate vehicle-level interactions41(and therefore congestion effects). Also mid-term and long-term impacts on individual choices42were not considered. Fagnant and Kockelman (17) turned the spotlight to the analysis of impacts43of a shared non-electric AMOD fleet in a simulated city with size of Austin, Texas. A model share44of 3.5% is assumed and simulated for the AMOD system, where intermediate stops for pick up and45

Lima Azevedo et al. 3
drop off of additional passengers are not allowed. Each vehicle would serve 31 to 41 persons a day,1with an average waiting time below 20 seconds, and would replace nearly 12 conventional vehicles.211 parking spaces per AMOD vehicle would also be freed. The overall distance traveled increased3by 11% compared to a traditional human-driven self-owned fleet. Yet, the scenario analyzed does4not rely on a real urban network, ignoring heterogeneous land use and travel patterns, and does5not consider long-term behavioral shifts. Burns et al. (18) focused on the impacts of network6configuration and service cost of shared AMOD fleets. Three different network environments7were analyzed: a mid-sized city (Ann Arbor, Michigan, US), a low-density suburban development8(Babcock Ranch, Florida, US) and a large and densely-populated urban context (Manhattan, New9York, US). Using queuing theory and network models, travel patterns, cost estimates and vehicle10requirements are computed for each scenario.11
Studies on the potential impacts of AVs on land use and long-term choices of urban resi-12dents and firms is limited. In a recent study on the potential impacts of autonomous vehicles and13policy preparations, Fagnant and Kockelman (3) summarizes the anticipating effects may brought14by autonomous vehicles, mostly focusing on the travel behaviors and safety (19). Using various15simulation results, they found that each shared autonomous vehicle (SAV) "could serve the same16number of trips as 10 household-owned vehicles", indicating the potential impact of autonomous17vehicle on vehicle ownership. In addition, a number of studies mentioned urban form can be ben-18efited from AVs by releasing part of lands in urban areas from parking areas. By one estimate,19about 31% of the space in the central business districts of 41 major cities in the US was devoted to20parking, and more space would be available for improving the built environment (20, 21). How-21ever, the effect of AVs on the spatial choices of urban residents and firms is less known and less22studied. On the one side, AVs can provide safer and improved accessibility for the population (e.g.23the disabled, the elderly and children) who cannot drive. Therefore, a place with SAVs service24may become preferable for these people. On the other side, the AVs may also change the goods25delivery system, which could have an impact of the location choice of those affected businesses.26
In terms of simulation tools, agent-based approaches have been shown to capture and repro-27duce different transportation-related phenomena, at different levels of details (from traffic micro-28simulation to long-term land use models) (22). Using agent-based models for decision-making29offers many advantages. Agents (individuals, households, vehicles, or other relevant units of anal-30ysis) can be modeled in detail, with heterogeneous characteristics and preferences. Their behavior31can be validated at individual level, leading to new possibilities for studying and evaluation poli-32cies, including AV. In (15, 17), the benefits of using agent-based approaches were demonstrated,33in terms of the flexibility in assessing different scenarios of AV, the potential comprehensiveness34in the analysis of different impacts and the detailed level of the outputs obtained. Yet, agent-based35models have reached a level of integration and complexity that elevate the potential of such meth-36ods in the analysis of mobility-targeted disruptive technologies.37
It is clear that the first steps in simulating AV have been successfully carried out and pro-38vided important insights on which modeling and simulation efforts must be taken and where further39research is needed. The extension of impact assessment to individual behavioral decision making40is necessary. The design and optimization of AV solutions should be carried out together with41integrated behavioral simulation models to account for more realistic changes in demand and sup-42ply of the overall transportation system. In this paper we present our most recent efforts in using43state-of-the-art simulation frameworks for the analysis of AV systems in urban environments. In44the next Section we describe how integrated and multi-level demand and supply can be modeled45

Lima Azevedo et al. 4
together, having in mind the impact of AV technologies. In Section 3 the set-up and the results of1a specific simulation scenario of an AMOD service in Singapore under the proposed framework2is presented. Finally in the last Section, the main conclusions of our study and the on-going and3future research are described.4
2 INTEGRATED SIMULATION OF AMOD DEMAND AND SUPPLY5The generic approach to model multi-level demand and supply is through loose coupling of differ-6ent simulators, each one specialized on a specific component (23). The typical interface between7models consists of exchanging files or API (Application Programming Interface) calls. For exam-8ple, Urbansim combines land-use, demographic and business establishment models, where agents9make long-term decisions (e.g. home and job relocation) by considering, among others, transport10accessibility (24). A common approach to obtain accessibility measures is by calling travel mod-11els, such as Transcad (25), which runs a 4-step model, TRANSIMS (26), or MATSim (27), the12latter two following an activity-based paradigm. The challenge is then to make these models speak13with each other and guaranteeing full consistency (e.g. same population in Urbansim and Tran-14scad, same spatial and temporal resolution and references). A similar reasoning can be established15when combining the above mentioned travel models with detailed control and motion simulation16models, such as SUMO (28), VISSIM (29) and AIMSUN (30). In (31) for example, MATSim and17SUMO were combined by means of file exchange and a SUMO call from MATSim API to account18for detailed traffic light control in agent’s travel plans for a toy network. Yet again, the consistency19in terms of agents characteristics (e.g. individual preferences), model formulation (e.g. consistent20route-choice models) and time resolution (e.g. trip time attributes) remained at stake.21
To tackle these challenges SimMobility, a new simulation platform that integrates vari-22ous mobility-sensitive behavioral models within a multi-scale framework that considers land-use,23transportation and communication interactions, has recently been proposed (23, 32).24
2.1 SimMobility25The high-level architecture of SimMobility is shown in Figure 1. SimMobility is comprised by26three main modules differentiated by the time-frame in which we model the behavior of an urban27system. The Short-Term (ST) simulator works at the operational level: it simulates movement of28agents at a microscopic granularity (i.e. within day). It synthesizes driving and travel behavior29in detail, and also interacts with a communication simulator that models the impact of device-to-30device communication on these behaviors. The Mid-Term (MT) simulator handles transportation31demand and supply on a day-to-day basis; it simulates agents’ behavior in terms of their activities32and travel patterns. The MT represents moving vehicles at an aggregate level, and routes are33generated by behavior-based demand models. The Long-Term (LT) simulator captures land use34and economic activity on a year-to-year scale, with special emphasis on accessibility. It predicts35the evolution of land use and property development and use, determines the associated life cycle36decisions of agents, and accounts for interactions among individuals and firms. Roughly speaking,37SimMoobility Short-, Mid- and Long-Term correspond to the traditional micro, meso and macro38levels of transportation analysis.39
SimMobility’s framework is fully modular in a way that each level can run independently40and only interact with the other level when necessary. The key to multi-scale integration in Sim-41Mobility is a single database model and a single code base that is shared across all levels. Every42agent exists and is recognized by all levels, and information is used according to each level’s needs.43
Lima Azevedo et al. 5
FIGURE 1 : SimMobility Framework
In this way, and agent’s behavior and characteristics will remain consistent in the three simulators.1Similarly, the code structure and functions are shared by the three levels, assuring consistency2among sub-models. Further details on SimMobility, in terms of modeling details and integration,3can be found in (23, 32)4
2.2 Integrating Autonomous Mobility On-Demand in SimMobility5To analyze the impacts of specific AV technologies on travel patterns, SimMobility demand and6supply simulation components were extended with dedicated AMOD service and vehicle access7restrictions features.8
Short-Term Model9SimMobility ST is responsible for advancing agents on the transportation network according to10their respective behavioral and decision models. It is based on the open-source microscopic traf-11fic simulation application MITSIM (33). A probabilistic model is used to capture drivers’ route12choice decisions and driving behavior parameters and vehicle characteristics are randomly assigned13to each driver-vehicle unit. SimMobility ST moves vehicles according to route choice, accelera-14tion and lane changing models. The acceleration model captures drivers’ response to neighboring15conditions as a function of surrounding vehicles motion parameters. The lane changing model in-16tegrates mandatory and discretionary lane-changes in a single model. Merging, drivers’ responses17to traffic signals, speed limits and incidents. The generic driving behavior models and parameters18implemented in SimMobility ST are those estimated by Yang and Koutsopoulos (33), Ahmed (34)19and Toledo et al. (35). Several additional enhancements were recently made its original driving20behavior such as: an enhanced reaction and perception time formulation, lateral movement during21lane-change, within lane and also intersection behavior driving based on the conflicts technique.22

Lima Azevedo et al. 6
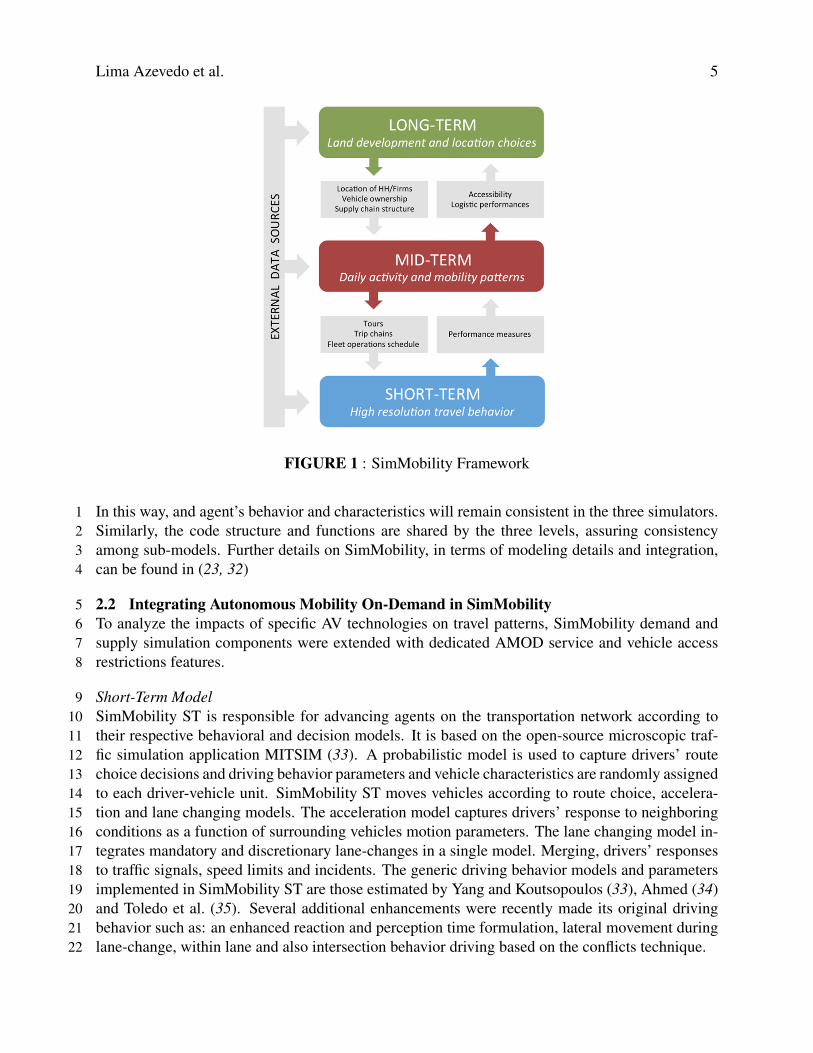
A Control and Operation system module simulates control centers, such as traffic control,1parking manager or bus control. We extended the Control and Operation system module with2a dedicated AMOD controller for managing AV. This is a comprehensive change on the supply3capabilities of SimMobility ST. Our AMOD Controller is an integrated, but detachable, module4composed of: an initialization, a fleet management and a vehicle tracking component (see Figure52). Detailed description of each component can be found in (36).6
FIGURE 2 : AMOD controller integration
The fleet management module is responsible for facility location, vehicle assignment and7routing and vehicle rebalancing.8
The facility location model estimates what are the best locations to place distribution cen-9ters (also called stations or car parks) of AMOD vehicles. Stations aim to provide charging and10maintenance facilities for vehicles, assuming an electric mobility solution. Vehicles can also be11parked there when waiting for future requests. The vehicle assignment and routing model decides12how vehicles should be assigned to customers and routed to destinations while minimizing dis-13tance traveled on the network. The rebalancing aims to move vehicles to where they are/will be14needed. Due to asymmetries in travel patterns the AMOD system—similarly to any one-way car-15sharing system—tends to become unbalanced, i.e., during morning peak majority of people travel16to work in downtown and leave their vehicles there. Vehicles build up at some stations, and be-17come depleted at others. Rebalancing mechanisms are therefore required to realign the supply of18vehicles with the future demand (12, 37). Furthermore, AMOD Controller uses a Gaussian process19to predict future demand for each station. The future demand is then fed to rebalancing model.20
Finally, the decision making models for the AV should, preferably, be based on the motion21control algorithms under development by the AV manufacturers. For this first-cut implementation,22the existing acceleration and lane-changing models in SimMobility ST were adjusted to exclude23human (driver’s) heterogeneity factors and individual behavior stochasticity. All AV behave the24same way, and the safety margins in terms of gap acceptance, safety headway and reaction time25were reduced (to 1.0s, 1.0s and 0.5s respectively).26
Mid-Term Model27SimMobility MT simulates daily activities and travels at an individual level. It combines activity-28based microscopic simulation on the demand side with macroscopic simulation on the supply side29(32). The demand side comprises two groups of behavioral models: pre-day models and within-30
Lima Azevedo et al. 7
day models. The pre-day models follow an econometric Day Activity Schedule approach (38)1to predict a daily activity schedule for the agents, particularly in terms of: (i) activity sequence2(including home-based tours, work-based sub-tours, and intermediate stops), (ii) trip destinations3and modes, and (iii) departure times (on half-hour slots). This is based on a sequential application4of hierarchical discrete choice models using a Monte Carlo simulation.5
At the pre-day level, the implementation of a car-restricted area with AMOD services was6assumed to affect directly the destination and mode choice models. Mode availability for trips7involving origins and/or destinations within the restricted area will change, leading to multimodal8trips that can combine private vehicles (in the case those are the modes restricted) outside the9implementation area, and AMOD inside the implementation area. As transferring between modes10is forced for these trips, it is necessary to properly model the agents’ behavioral response in terms11of decisions. The utility specification of the combined mode and destination choice for the car-12restricted area with AMOD service was based on the individual preferences towards taxi due to the13lack of individual AMOD-specific data for estimation. For mandatory trips with fixed destination14(such as going to work or school) the agents will only be able to change modes, but for non-15mandatory trips (such as going shopping) the agents will have the possibility of changing mode16and/or destination, as well as deciding to skip the trip.17
Once the daily activity schedules are obtained for all agents, the within-day models predict18the routes for their trips, transforming the activity schedule into actual trips. Depending on the19traffic conditions and effective travel times, the agents could reschedule the remainder of the day,20cancel an activity, re-route while traveling (including alighting a bus to change route), or run an21opportunistic activity, like shopping while waiting (32). Furthermore, at the within-day level,22the implementation of a restricted area with AMOD services affects the route choice, in terms of23available alternatives. For trips outside the restricted area, all potential paths between origin and24destination will have to go around, leading to a potential increase in travel times.25
The supply simulator follows the dynamic traffic assignment (DTA) paradigm as used pre-26viously in (39), including both private and public transport modes. Particularly for public transport,27MT model allows for bus line scheduling and headway based operations are currently being im-28plemented. We also explicitly represent on-road bus stops and bus bays, which allows for accurate29estimation of impacts of the bus operations on the road traffic.30
Within the MT simulator, the interaction between the within-day and supply is responsible31to bring the system to consistency. The MT simulator takes input in the form of a population (which32could come from the LT simulator, if the integration is desired) that contains detailed characteristics33of each agent, and a multimodal network. As an output, it can pass accessibility measure (in the34form of Logsums) from pre-day models to the LT simulator. The MT simulator can also provide35the ST simulator with trip chains as input demand to simulate smaller region traffic in more detail.36
Long-Term Model37The LT simulator of SimMobility models the behavior of agents in the housing market, and ulti-38mately the commercial real estate market and the job market. It simulates the year-to-year impacts39of alternative future mobility scenarios on residential and workplace locations, vehicle ownership,40land use distribution, and value of the built environment. The LT simulator is therefore responsible41for the generation and updating of a population of agents and their corresponding demographic42and spatial attributes.43
A two-stage data synthesis methodology is employed for construction of a synthetic pop-44

Lima Azevedo et al. 8
ulation of households and firm establishments at building scale (40). The approach is designed1to accommodate the need for spatially disaggregated details in a manner that can be readily ad-2justed and rerun to incorporate new data sources, changed time frames, and updated relationships3and hierarchies across overlapping datasets. Long-term behaviors of agents and their effects on4urban form, markets and other agents are implemented by a group of behavioral models that are5connected in a sequential/event-based framework.6
These behavioral models take account of demographic and economic factors of agents, spa-7tial amenities and the regulatory variables translated from exogenous policies. The LT simulator8centers on a real estate market module, which emulates the dynamic interaction process between9demand and supply in the market. The market module include a series of models that simulate10(i) "awakening" of households who begin searching for new housing, (ii) eligibility, affordability,11and screening constraints, (iii) daily housing market bidding, and (iv) modeling developer be-12havior regarding when, where, what type, and how much built space to construct by taking into13account market cycle and uncertainty. Changes in residential location then trigger a household’s14re-assessment of private vehicle ownership and possible re-assignment of workers (students) to15jobs (schools).16
As mentioned, the LT simulator is integrated with the MT simulator via built-in functions17facilitating the exchanges of data related to land use and transportation performance. One set of18functions computes accessibility measures (in the form of Logsums) for individuals considering19alternative residential, work, or school locations, and alternative vehicle ownership conditions.20On the other hand, another set of functions allows the LT simulator to pass to the MT simulator21population information with updated residential and job locations as well as vehicle ownership.22Currently this exchange is done for each simulated year.23
At this stage all sub-models of the MT simulator are being calibrated, using different24sources of information (including MT Logsums), in order to produce an appropriate synthetic25population; the inclusion of long-term impacts in the present study (both by using their population26and analyzing the effect of AMOD) is still in progress.27
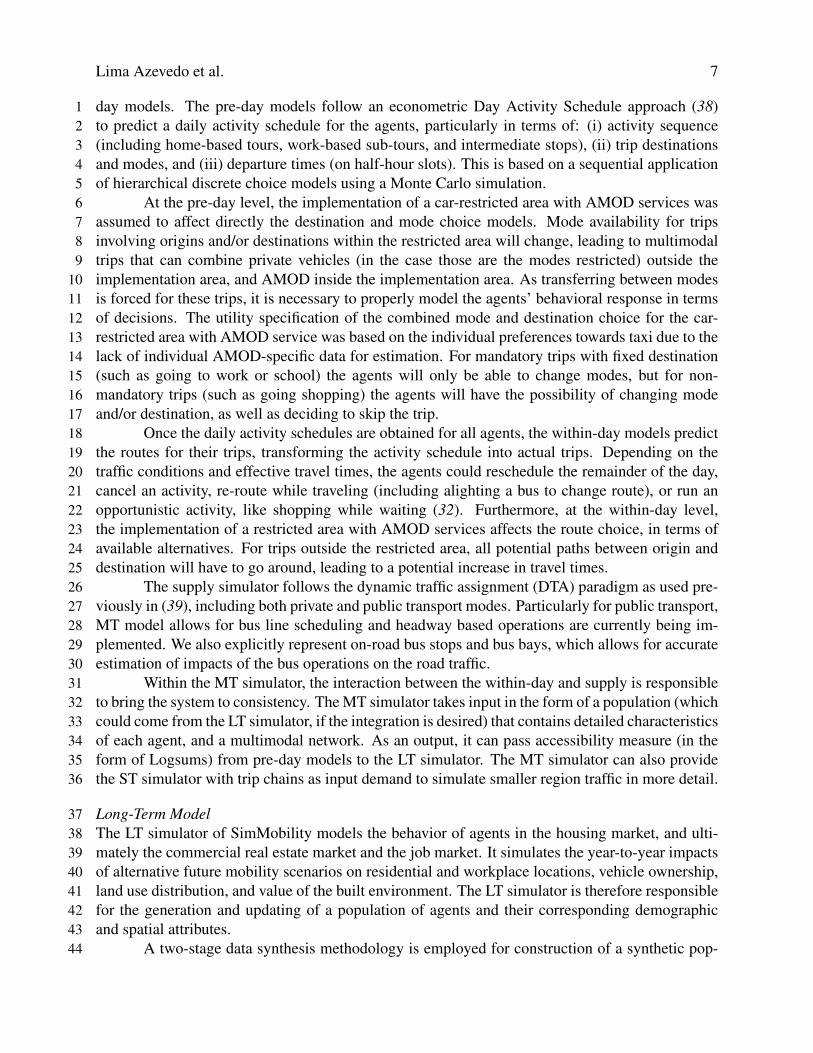
3 CASE STUDY ON THE CENTRAL BUSINESS DISTRICT (CBD) IN SINGAPORE28To test the above implementation a case study of a specific AMOD system in Singapore is used.29Firstly, private vehicles are not allowed to access a 14Km2 restricted zone in the CBD in Singapore30(see green area in Figure 3). A smart-phone based AMOD service was introduced as an alternative31mode within the restricted area. Yet, the access to this area was granted to the existing bus lines,32Mass Rapid Transit (MRT) trains and taxis.33
The AMOD system uses autonomous mid-size sedans without car-pooling services. The34cost of the AMOD service was assumed as 40% less than the regular taxi service in Singapore,35resulting in an average cost of about $3 SGD within the CBD area. The other modes were assumed36to remain unchanged (i.e. buses and MRT kept their frequencies, fares and capacities and the taxi37fleet and cost remained the same). Similarly, no changes in the road network and traffic control38systems were assumed for this case study.39
On the demand side, the population socio-demographic characteristics, individual prefer-40ences and the land use configuration was kept unchanged. The impacts of AMOD parking locations41within the CDB on land-use were ignored and residents of the CBD area were not given the priv-42ilege of driving their own vehicle within the restricted area.It is worth noting that some of these43assumptions will be relaxed and optimized in our future simulations of this and other simulation44

Lima Azevedo et al. 9
FIGURE 3 : Car-restricted area with AMOD system (in green)
scenarios.1A set of performance figures for the AMOD system and for the overall transportation sys-2
tem in Singapore (congestion levels, destination choice and mode shares) were assessed and com-3pared to the existing supply.4
3.1 Data5For the calibration of SimMobility the following data sets from Singapore were used:6
1. Land-use data, including residential buildings, firm and school locations and its respec-7tive characteristics;8
2. Household interview travel survey (HITS) collected in 2012;9
3. 4.5 months of detailed GPS traces from a taxi fleet of about 15,000 vehicles;10
4. 3 months of public transport smart-card data (EZ-link card) with tap-ins and tap-outs11for buses and MRT.12
5. Google transit network data for the buses routes and schedules;13
6. SCATS traffic light timings;14
7. Detailed road network configuration from multiple sources.15
A synthetic population of 4.06 million agents was generated for the entire island (for further16details on this process see 32, 40). The HITS data allowed the estimation and validation of all MT17pre-day choice models, resulting in activity-schedules for the full synthetic population. On the18supply side, the road and public transportation network were coded using information from the19

Lima Azevedo et al. 10
Land Transport Authority (LTA), the Google transit and the NAVTEQ databases. Despite the fact1that all levels of SimMobility use the same network database, the level-specific supply models use2it differently (e.g., while ST lane change models need detailed lane attributes, MT uses them to3compute segment capacities for speed-density functions). The traffic lights used in SimMobility4ST were simulated according to the specific configuration of each intersection using LTA’s data5and a SCATS-like algorithm. Driver’s route-choice was estimated using the taxi GPS data while6public transit route-choice used the EZ-link card data set.7
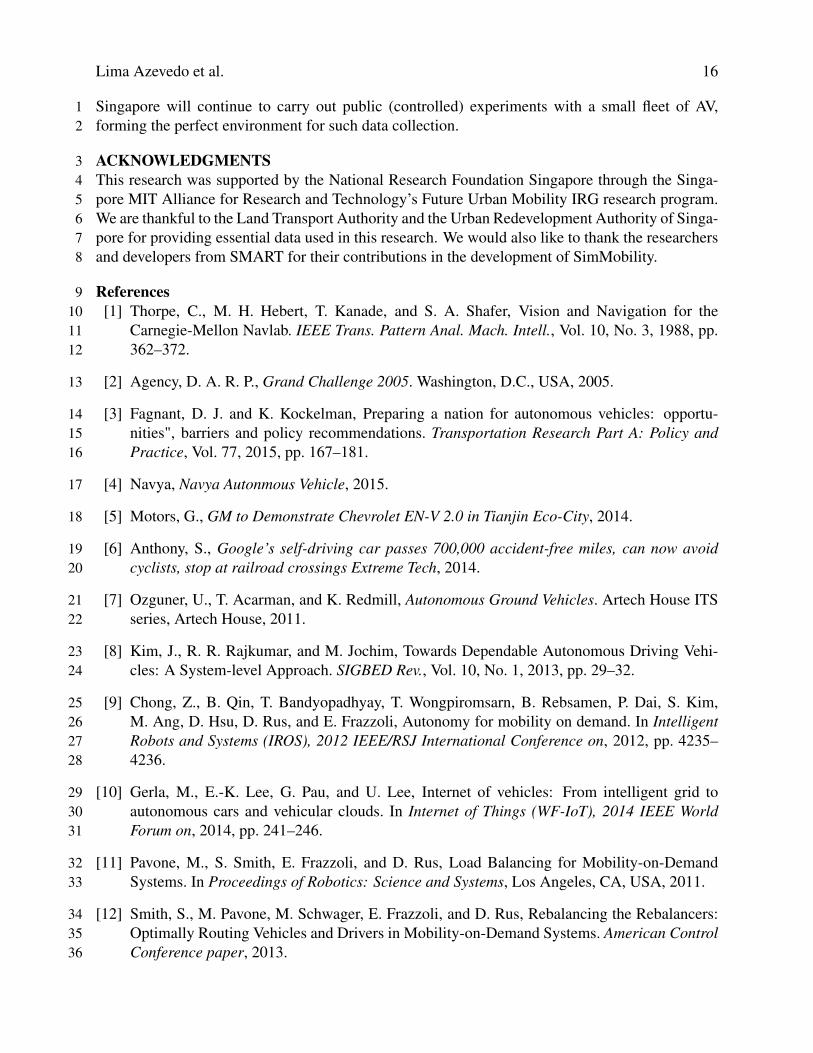
Calibration results for SimMobility MT pre-day models are shown in Figure 4. These8results cover all levels of decisions modeled in pre-day: daily activity patters (in terms of tours9and intermediate stops), mode and destination choice for all tours, and time of day for all trips.10These results correspond to the base case (i.e. without AMOD) of our study case, and reproduce11the mobility and activity patterns observed in practice. It is interesting to notice that in Singapore12about 57% of the motorized trips recorded in HITS (and therefore predicted by MT simulator) are13performed in public transport, while 41% correspond to private modes and the remaining 3% to14taxi.15
FIGURE 4 : Base case validation

Lima Azevedo et al. 11
3.2 Optimizing the AMOD system1The configuration of the AMOD system was carried out by defining individual optimization al-2gorithms for the facility location, vehicle assignment and routing and vehicle rebalancing, respec-3tively.4
The algorithm solving Facility Location Problem was selected based on the literature re-5view presented in (41). It is formulated as the classical covering problem in a graph. The algorithm6is run offline based on the historical demand. Vertices are generated at every location of the his-7torical demand. Given demand nodes i and facility nodes j, a set of the potential facility nodes Ni,8so that Ni =
{j|di j ≤ S
}, a maximum acceptable service distance S (tested values between 850-9
1000m for our application) and a binary variable x j indicating whether there should be a facility at10j or not, the objective function of the model is to minimize number of required facilities covering11all demand points (eq. 1).12
minimizen
∑j=1
x j
subject to ∑j∈Ni
x j ≥ 1, i = 1, ...,m
x j ∈ {0,1}
(1)
The first constraint shows the service requirement for the demand node i. The second13constraint is the integrality constraint.14
Passenger-to-Vehicle Assignment is formulated as the minimum weight bipartite matching15problem. Given a list of passengers waiting to be served P, where each passenger p j is described16by its current location (x, y), a list of available vehicles V, where each vehicle vi is described by17its current location (x, y) and status, a cost of picking up passenger i by vehicle j, ci j and decision18variable bi j describing whether or not vehicle j is assigned to passenger i; bi j = 1 if vehicle j is19assigned to passenger i, 0 otherwise. The objective is to minimize the distance traveled by vehicles20to pick up passengers (what is equivalent to maximization of the inverted cost).21
maximize ∑i j
1ci j
bi j
subject to ∑i
b ji ≤ 1 j ∈ P
∑j
b ji ≤ 1 i ∈V
bi j ≥ 0, integer
(2)
Meaning of the constraint 1 and 2: each passenger can be assigned to at most 1 vehicle and each22vehicle can be assigned to at most 1 passenger, respectively. The cost is defined as follows:23
ci j = fd · cdisti j + ft · ctime
i j (3)
where fd · cdisti j is the distance cost factor multiplied by the distance from current position of the24
vehicle to the customer location, in meters; ft · ctimei j is the waiting time cost factor multiplied by25
the expected waiting time of the customer, in seconds; currently both factors are set to 1.0.26

Lima Azevedo et al. 12
Rebalancing of the Vehicles Rebalancing was performed every hour to reduce customer1waiting time during the high-demand periods, while ensuring that we rebalance a minimum re-2quired number of vehicles as empty vehicle trips contribute to congestion. The problem is formu-3lated as follows: Let V be a total number of vehicles in the system and vi and di be the number4of vehicles and anticipated demand at station i. Excess demand at each station is defined as the5number of customers who cannot be serviced only by vehicles at station i, i.e., de
i = vi− di. The6cost of sending one vehicle from station i to station j is represented di j and measured as a shortest7travel time distance between i and j. Decision variable ri j describes the number of vehicles to send8from i to j. The objective is to minimize total cost of rebalancing trips.9
minimize ∑i
di jri j
subject to dei ≤∑
j(r ji− ri j)∀i, j
∑j
ri j ≤ vi∀i
ri j ≥ 0,
(4)
The first constraint is the flow conservation at each node. The second constraint prevent us10from sending more vehicles than we have available.11
3.3 Assessing the impacts of the AMOD system12For the assessment of the AMOD system and its impacts on travel behavior, SimMobility ST13and MT simulators were used together, exchanging trip chains from the top-down and supply14performance measures bottom-up. SimMobility MT simulated the entire island while ST simulated15the CBD car-restricted area and the AMOD system operation in detail.16
In SimMobility ST different fleet sizes for the AMOD system, number of parking stations17and configurations with and without rebalancing were tested. These simulations were ran using the18demand in the form of trip chains from the SimMobility MT simulator. This was done by dividing19the trips, which were destined or originated in the CBD region and have their origin and destination20outside the CBD region into sub-trips. The inside CBD sub-trip is simulated using SimMobility21ST, while the rest of the trip chains were simulated sing the within-day SimMobility MT simulator.22Trips who have their origin and destination within the CBD region were also simulated at the ST23level. This allowed us to reach a high level of detail when simulating the operation of the AMOD24system and its integration with the existing (and, eventually, future) control systems.25
This process is carried out in an iterative fashion, with the trip chains generated by MT26being passed to ST which computes itself performance measures (waiting times, travel times, costs,27etc) that will be used again to generate a new set of individual choices.28
3.4 Results29In Figure 5, different waiting time performances for different AMOD fleet sizes are presented for a3012 hours simulation (3am to 3pm) using 20 parking stations and with rebalancing. The rebalancing31and the 20 parking stations were found to be optimal for the demand and area of this case-study.32It can be seen from the figure that the average waiting time decreases with the increase in the fleet33size, and it is equal to 5 minutes when AMOD fleet size is around 2200 vehicles. Further increase34in the fleet size is not able to significantly decrease the waiting time. A similar finding was obtained35

Lima Azevedo et al. 13
for an increasing number of parking stations.1
FIGURE 5 : Average waiting time vs. fleet size, for all requests during a 12 hours simulation(3am to 3pm) using 20 parking stations and with rebalancing
The obtained performance measures for the above optimum scenario, were transferred back2to the SimMobility MT simulator. Within the SimMobility MT simulator, the travel times, waiting3times and cost for all sub-trips performed inside CBD were combined with outside CBD sub-4trip attributes (obtained from the supply of SimMobility MT) and stored in a manner that it can be5aggregated and feedback to the pre-day component of the SimMobility MT. The individual choices6for the entire population can be re-simulated once again.7
In Figure 6 the combined effect of the restricted zone and the changes in the transportation8system performance on route choice decisions is shown for the agents driving a specific origin-9destination pair. This impact on through traffic will inevitably affect the performance of the road10network in terms of travel times and congestion levels in the periphery of the CBD.11
In Figure 7 the changes in mode shares computed by the pre-day model are represented12for all the trips having the origin and/or the destination within the CBD. Such analysis allows the13assessment of increased demand for the other modes, and eventually test potential measures to14mitigate undesirable impacts (crowdedness in buses).15
These two example showcase the potential of using integrated agent-based simulation tools16for the analysis of different impacts of AMOD systems, estimating the changes in the travel pat-17terns and on the overall system performance.18
Some of the above mentioned scenario assumptions are being relaxed in on-going simu-19lation exercises. Indeed, testing the proposed framework in other settings will most likely pose20different challenges presented here. Larger areas, such as area in red in Figure 3, have already21been simulated. For this specific scenario, computational time of SimMobility ST was tested suc-22cessfully and the benefits of using the proposed framework compared to less detailed simulators23was also analyzed. In Figure 8, the AMOD system performance outputs in terms of travel time24and waiting time for different fleet sizes are shown using SimMobility and a basic simulator (a25

Lima Azevedo et al. 14
FIGURE 6 : AMOD-restricted area impact on through traffic
coarse simulator, without detailed rad network but using euclidean distances between origin and1destination nodes and ignoring agent interactions and therefore congestion). As expected the more2realistic representation of the supply in SimMobility has a clear impact on the results of the AMOD3design and operation performance.4
4 DISCUSSION AND CONCLUSIONS5In this paper, we presented an extension to SimMobility, a multi-agent micro-simulator, for model-6ing and simulating AMOD systems. The benefits of using integrated agent-based traffic simulator7built on disaggregated behavior models in both demand and supply, in the design and assessment8of disruptive technologies was shown through a specific AMOD case-study. The modular ap-9proach taken in our extension allows for different models to be integrated and evaluated within the10SimMobility framework. As shown in this paper, technical design features can be optimized and11policies incorporating a mix of transportation modes can be evaluated, having in mind individual12choices and the environment affecting these choices.13
We are currently working on extending our calibration framework using other existing14databases. The outputs of the both the ST and MT supply simulators can be improved using traffic15count and speed measurements on the network in Singapore. The on-going work on extending the16impact assessment to SimMobility LT using the proposed integrated fashion is expected to bring17another set of powerful analysis instruments. AMOD impacts on car-ownership decisions, land18pricing and individual and firm location decisions along with its combined effects with long-term19targeted policies represent our main on-going research effort.20
The flexibility of the proposed simulation framework to study complex scenarios also21brings new possibilities to the detailed design of AMOD systems. SimMobility ST has a network22communication simulator that will allow us to test alternative AV communication technologies23and assess its impacts on its performance. Similarly, AV-specific solutions for intersection man-24

Lima Azevedo et al. 15
���
���
����
���
��
���
��
��
���
��
���
���
�� ������������ ���������������� ���� ����
��!������������������"�����
��!���������������"�����
FIGURE 7 : Car-restricted area with AMOD impact on mode choice
Number of AMOD Vehicles1000 2000 3000 4000 5000 6000 7000 8000 9000 10000
Tra
vel T
ime
(min
s)
2
4
6
8
10
12
14
16
18Mean Travel Time vs Fleet Size
SimMobilityBasic Simulator
(a) Travel time comparison.Number of AMOD Vehicles
1000 2000 3000 4000 5000 6000 7000 8000 9000 10000
Wai
ting
Tim
e (m
ins)
0
20
40
60
80
100
120
140
160Mean Waiting Time vs Fleet Size
SimMobilityBasic Simulator
(b) Wait time comparison.
FIGURE 8 : Comparison of travel time and waiting time for basic simulator and SimMobility.
agement can significantly improve an AMOD system performance. The first steps have already1been made in testing AV-specific slot-based intelligent intersection algorithms within the Control2and Operation module of SimMobility ST.3
As future work, collecting useful data on individual preferences regarding AMOD is the4main objective. Stated preferences surveys are typically used to collect such data, as revealed5preferences are not yet feasible. However, one must not ignore the possibility of biased results6from such data collection procedure, as the AMOD experience might be totally different from the7expectations that a respondent might currently have. This issue can be minimized by collecting8stated preferences together with simulator or pilot experiments. In fact, our research center in9
Lima Azevedo et al. 16
Singapore will continue to carry out public (controlled) experiments with a small fleet of AV,1forming the perfect environment for such data collection.2
ACKNOWLEDGMENTS3This research was supported by the National Research Foundation Singapore through the Singa-4pore MIT Alliance for Research and Technology’s Future Urban Mobility IRG research program.5We are thankful to the Land Transport Authority and the Urban Redevelopment Authority of Singa-6pore for providing essential data used in this research. We would also like to thank the researchers7and developers from SMART for their contributions in the development of SimMobility.8
References9[1] Thorpe, C., M. H. Hebert, T. Kanade, and S. A. Shafer, Vision and Navigation for the10
Carnegie-Mellon Navlab. IEEE Trans. Pattern Anal. Mach. Intell., Vol. 10, No. 3, 1988, pp.11362–372.12
[2] Agency, D. A. R. P., Grand Challenge 2005. Washington, D.C., USA, 2005.13
[3] Fagnant, D. J. and K. Kockelman, Preparing a nation for autonomous vehicles: opportu-14nities", barriers and policy recommendations. Transportation Research Part A: Policy and15Practice, Vol. 77, 2015, pp. 167–181.16
[4] Navya, Navya Autonmous Vehicle, 2015.17
[5] Motors, G., GM to Demonstrate Chevrolet EN-V 2.0 in Tianjin Eco-City, 2014.18
[6] Anthony, S., Google’s self-driving car passes 700,000 accident-free miles, can now avoid19cyclists, stop at railroad crossings Extreme Tech, 2014.20
[7] Ozguner, U., T. Acarman, and K. Redmill, Autonomous Ground Vehicles. Artech House ITS21series, Artech House, 2011.22
[8] Kim, J., R. R. Rajkumar, and M. Jochim, Towards Dependable Autonomous Driving Vehi-23cles: A System-level Approach. SIGBED Rev., Vol. 10, No. 1, 2013, pp. 29–32.24
[9] Chong, Z., B. Qin, T. Bandyopadhyay, T. Wongpiromsarn, B. Rebsamen, P. Dai, S. Kim,25M. Ang, D. Hsu, D. Rus, and E. Frazzoli, Autonomy for mobility on demand. In Intelligent26Robots and Systems (IROS), 2012 IEEE/RSJ International Conference on, 2012, pp. 4235–274236.28
[10] Gerla, M., E.-K. Lee, G. Pau, and U. Lee, Internet of vehicles: From intelligent grid to29autonomous cars and vehicular clouds. In Internet of Things (WF-IoT), 2014 IEEE World30Forum on, 2014, pp. 241–246.31
[11] Pavone, M., S. Smith, E. Frazzoli, and D. Rus, Load Balancing for Mobility-on-Demand32Systems. In Proceedings of Robotics: Science and Systems, Los Angeles, CA, USA, 2011.33
[12] Smith, S., M. Pavone, M. Schwager, E. Frazzoli, and D. Rus, Rebalancing the Rebalancers:34Optimally Routing Vehicles and Drivers in Mobility-on-Demand Systems. American Control35Conference paper, 2013.36

Lima Azevedo et al. 17
[13] Brownell, C. and A. Kornhauser, A Driverless Alternative. Fleet Size and Cost Requirements1for a Statewide Autonomous Taxi Network in New Jersey. Transportation Research Record:2Journal of the Transportation Research Board, Vol. 2416, 2014, pp. 73–81.3
[14] J. Zachariah, A. K., J. Gao and T. Mufti, Uncongested mobility for all: A proposal for an area4wise autonomous taxi system in New Jersey. TRB Annual Meeting Online - TRB 94th Annual5Meeting, January 11-15, 2015, 2015.6
[15] ITF, Urban Mobility System Upgrade: How shared self-driving cars could change city traffic.7USA, 2015.8
[16] Barrios, J. A. and J. D. Godier, Fleet Sizing for Flexible Carsharing Systems Simulation-9Based Approach. Transportation Research Record: Journal of the Transportation Research10Board, , No. 2416, 2014, pp. 1–9.11
[17] Fagnant, D. J. and K. M. Kockelman, The travel and environmental implications of shared12autonomous vehicles, using agent-based model scenarios. Transportation Research Part C:13Emerging Technologies, Vol. 40, 2014, pp. 1–13.14
[18] Burns, L., W. Jordon, and B. Scarborough, Transforming personal mobility, 2013.15
[19] Fagnant, D. and K. Kockelman, Dynamic Ride-Sharing and Optimal Fleet Sizing for a System16of Shared Autonomous Vehicles. TRB Annual Meeting Online - TRB 94th Annual Meeting,17January 11-15, 2015, 2015.18
[20] Folsom, t. . S. j. . I. p. . . a. . C. y. . ., Tyler C, ????19
[21] Litman, T., Autonomous Vehicle Implementation Predictions. Victoria Transport Policy In-20stitute, Vol. 28, 2014.21
[22] Bazzan, A. L. C. and F. Klügl, A review on agent-based technology for traffic and transporta-22tion. The Knowledge Engineering Review, Vol. 29, No. 03, 2013, pp. 375–403.23
[23] Mouse, M., SimMobility: multi-scale integrated activity-based modeling. Submitted to the2495th TRB Annual Meeting, January, 2016, 2016.25
[24] Waddell, P., UrbanSim: Modeling Urban Development for Land Use, Transportation, and26Environmental Planning. Journal of the American Planning Association, Vol. 68, No. 3, 2002,27pp. 297–314.28
[25] Corporation, C., TransCAD transportation workstation software. Caliper Corporation, 1989.29
[26] Troy, A., D. Azaria, B. Voigt, and A. Sadek, Integrating a traffic router and microsimulator30into a land use and travel demand model. Transportation Planning and Technology, Vol. 35,31No. 8, 2012, pp. 737–751.32
[27] Nicolai, T. W., L. Wang, K. Nagel, and P. Waddell, Coupling an urban simulation model with33a travel model - a first sensitivity test. Computers in Urban Planning and Urban Management,34Vol. 23, 2011.35
Lima Azevedo et al. 18
[28] Krajzewicz, D., Traffic Simulation with SUMO - Simulation of Urban Mobility. In Funda-1mentals of Traffic Simulation (J. Barceló, ed.), Springer New York, Vol. 145 of International2Series in Operations Research and Management Science, 2010, pp. 269–293.3
[29] AG, P., VISSIM 5.40 User Manual. epubli GmbH, 2012.4
[30] System, T. S., Aimsun Dynamic Simulator User Manual - version 7.0, 2011.5
[31] Bazzan, A. L. C., K. Nagel, I. F. L, S. T. Systems, and T. Berlin, Integrating MATSim and IT-6SUMO for daily replanning under congestion. In In: Proceedings of the 35th Latin-American7Informatics Conference, CLEI, 2009.8
[32] Lu, Y., M. Adnan, K. Basak, F. C. Pereira, C. Carrion, V. Saber, H. Loganathan, and M. E.9Ben-Akiva, SimMobility Mid-Term Simulator: A State of the Art Integrated Agent Based10Demand and Supply Model. TRB Annual Meeting Online - TRB 94th Annual Meeting, Jan-11uary 11-15, 2015, 2015.12
[33] Yang, Q. and H. N. Koutsopoulos, A Microscopic Traffic Simulator for evaluation of dynamic13traffic management systems. Transportation Research Part C: Emerging Technologies, Vol. 4,14No. 3, 1996, pp. 113 – 129.15
[34] Ahmed, K., Modeling Drivers’ Acceleration and Lane Changing Behavior. Ph.D. thesis,16Massachusetts Institute of Technology, 1999.17
[35] Toledo, T., H. N. Koutsopoulos, and M. E. Ben-Akiva, Estimation of an integrated driving18behavior model. Transportation Research Part C, Vol. 17, No. 4, 2009, pp. 365–380.19
[36] Marczuk, K., H. Soh, C. L. Azevedo, E. Frazzoli, and D. H. Lee, Autonomous Mobility on20Demand in SimMobility: Case Study of the Central Business District in Singapore. In In:217th IEEE International Conference on Cybernetics and Intelligent Systems (CIS) and the 7th22IEEE International Conference on Robotics, Automation and Mechatronics (RAM), Angkor23Wat, Cambodia, 2015.24
[37] Spieser, K., K. Treleaven, R. Zhang, E. Frazzoli, D. Morton, and M. Pavone, Toward a Sys-25tematic Approach to the Design and Evaluation of Automated Mobility-on-Demand Systems:26A Case Study in Singapore. In Road Vehicle Automation (G. Meyer and S. Beiker, eds.),27Springer International Publishing, Lecture Notes in Mobility, 2014, pp. 229–245.28
[38] Bowman, J. and M. Ben-Akiva, Activity-based disaggregate travel demand model system29with activity schedules. Transportation Research Part A: Policy and Practice, Vol. 35, No. 1,302001, pp. 1 – 28.31
[39] Ben-Akiva, M., H. Koutsopoulos, C. Antoniou, and R. Balakrishna, Traffic Simulation with32DynaMIT. In Fundamentals of Traffic Simulation (J. Barceló, ed.), Springer New York, Vol.33145 of International Series in Operations Research and Management Science, 2010, pp. 363–34398.35

Lima Azevedo et al. 19
[40] Zhu, Y. and J. Ferreira, Synthetic population generation at disaggregated spatial scales for1land use and transportation microsimulation. Transportation Research Record: Journal of2the Transportation Research Board, , No. 2429, 2014, pp. 168–177.3
[41] Farahani, R. Z., N. Asgari, N. Heidari, M. Hosseininia, and M. Goh, Covering problems in4facility location: A review. Computers and Industrial Engineering, Vol. 62, No. 1, 2012, pp.5368 – 407.6