Microscopic Estimation of Freeway Vehicle Positions...
14
Proceedings of the 91st Annual Meeting of the Transportation Research Board, Washington, DC, January 2012 Microscopic Estimation of Freeway Vehicle Positions Using Mobile Sensors Authors: Noah J. Goodall, Brian L. Smith, Byungkyu (Brian) Park
-
Upload
vuongquynh -
Category
Documents
-
view
219 -
download
4
Transcript of Microscopic Estimation of Freeway Vehicle Positions...

Proceedings of the 91st Annual Meeting of the Transportation Research Board,
Washington, DC, January 2012
Microscopic Estimation of Freeway Vehicle
Positions Using Mobile Sensors
Authors: Noah J. Goodall, Brian L. Smith, Byungkyu (Brian) Park

2
ABSTRACT
The introduction of mobile sensors, i.e. probe vehicles with GPS-enabled smart phones or
connected vehicle technology, will potentially provide more comprehensive information
on roadway conditions than conventional point detection alone. Several mobility
applications have been proposed that utilize this new vehicle-specific data rather than
aggregated speed, density, and flow. Because of bandwidth limitations of cellular and an
expected slow deployment of connected vehicles, only a portion of vehicles on the
roadway will be able to report their positions at any given time. This paper proposes a
novel technique to analyze the behavior of freeway vehicles equipped with GPS receivers
and accelerometers to estimate the quantity, locations, and speeds of those vehicles that
do not have similar equipment. If an equipped vehicle deviates significantly from a car-
following model’s expected behavior, the deviation is assumed to be the result of an
interaction with an unequipped vehicle (i.e. an undetectable “ghost” vehicle). This
unequipped vehicle is then inserted into a rolling estimation of individual vehicle
movements. Because this technique is dependent on vehicles interacting during
congestion, a second scenario uses an upstream detector to detect and insert unequipped
vehicles at the point of detection, essentially “seeding” the network. An evaluation using
the NGSIM US-101 dataset shows realistic vehicle density estimations during and
immediately after congestion. Introducing an upstream detector to supply initial locations
of unequipped vehicles improves accuracy in free flow conditions, thereby improving the
root mean squared error of the number of vehicles within a 120-foot cell from 3.8
vehicles without a detector, to 2.4 vehicles with a detector, as compared to ground truth.
3
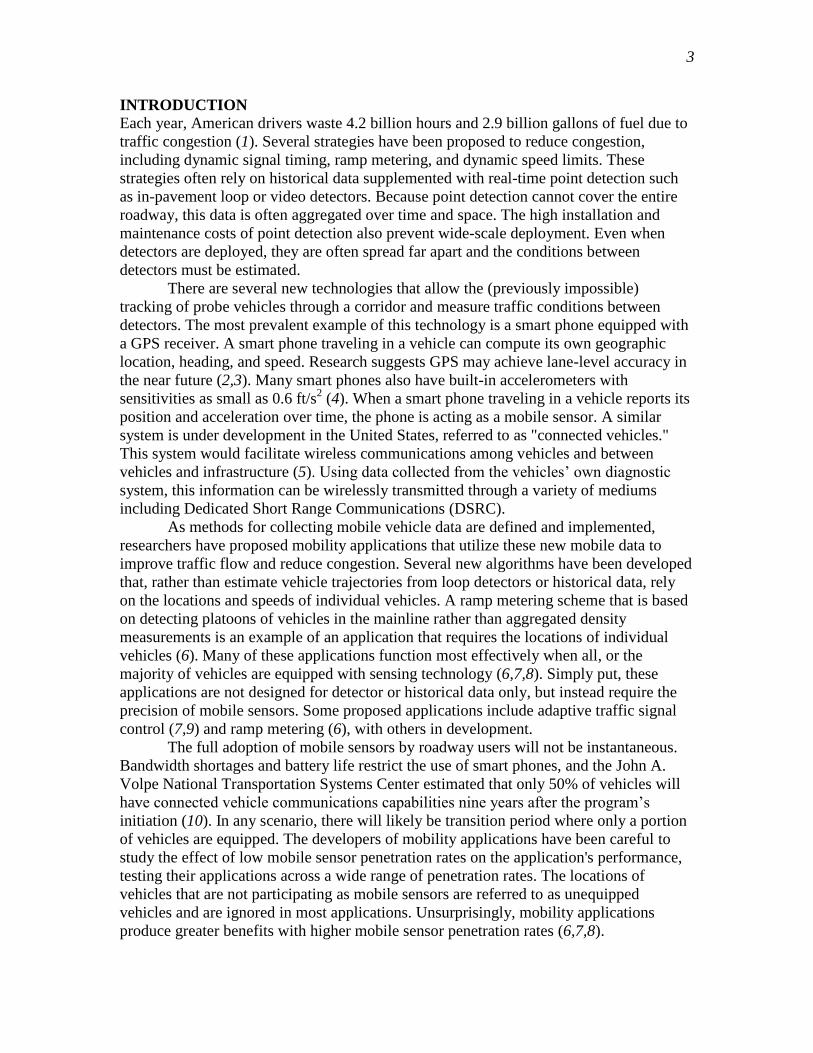
INTRODUCTION
Each year, American drivers waste 4.2 billion hours and 2.9 billion gallons of fuel due to
traffic congestion (1). Several strategies have been proposed to reduce congestion,
including dynamic signal timing, ramp metering, and dynamic speed limits. These
strategies often rely on historical data supplemented with real-time point detection such
as in-pavement loop or video detectors. Because point detection cannot cover the entire
roadway, this data is often aggregated over time and space. The high installation and
maintenance costs of point detection also prevent wide-scale deployment. Even when
detectors are deployed, they are often spread far apart and the conditions between
detectors must be estimated.
There are several new technologies that allow the (previously impossible)
tracking of probe vehicles through a corridor and measure traffic conditions between
detectors. The most prevalent example of this technology is a smart phone equipped with
a GPS receiver. A smart phone traveling in a vehicle can compute its own geographic
location, heading, and speed. Research suggests GPS may achieve lane-level accuracy in
the near future (2,3). Many smart phones also have built-in accelerometers with
sensitivities as small as 0.6 ft/s2 (4). When a smart phone traveling in a vehicle reports its
position and acceleration over time, the phone is acting as a mobile sensor. A similar
system is under development in the United States, referred to as "connected vehicles."
This system would facilitate wireless communications among vehicles and between
vehicles and infrastructure (5). Using data collected from the vehicles’ own diagnostic
system, this information can be wirelessly transmitted through a variety of mediums
including Dedicated Short Range Communications (DSRC).
As methods for collecting mobile vehicle data are defined and implemented,
researchers have proposed mobility applications that utilize these new mobile data to
improve traffic flow and reduce congestion. Several new algorithms have been developed
that, rather than estimate vehicle trajectories from loop detectors or historical data, rely
on the locations and speeds of individual vehicles. A ramp metering scheme that is based
on detecting platoons of vehicles in the mainline rather than aggregated density
measurements is an example of an application that requires the locations of individual
vehicles (6). Many of these applications function most effectively when all, or the
majority of vehicles are equipped with sensing technology (6,7,8). Simply put, these
applications are not designed for detector or historical data only, but instead require the
precision of mobile sensors. Some proposed applications include adaptive traffic signal
control (7,9) and ramp metering (6), with others in development.
The full adoption of mobile sensors by roadway users will not be instantaneous.
Bandwidth shortages and battery life restrict the use of smart phones, and the John A.
Volpe National Transportation Systems Center estimated that only 50% of vehicles will
have connected vehicle communications capabilities nine years after the program’s
initiation (10). In any scenario, there will likely be transition period where only a portion
of vehicles are equipped. The developers of mobility applications have been careful to
study the effect of low mobile sensor penetration rates on the application's performance,
testing their applications across a wide range of penetration rates. The locations of
vehicles that are not participating as mobile sensors are referred to as unequipped
vehicles and are ignored in most applications. Unsurprisingly, mobility applications
produce greater benefits with higher mobile sensor penetration rates (6,7,8).

4
One can assume that with a reasonable approximation of the locations and speeds
of unequipped vehicles, the performance of mobility applications will be significantly
improved. This paper proposes a method to estimate the quantity, locations, and speeds of
unequipped vehicles on a freeway with a portion of vehicles acting as mobile sensors,
based on the detection of unexpected behavior of the equipped vehicles. By estimating
the locations of these unequipped vehicles, a mobility application that relies on mobile
sensors can use these estimates to improve its performance, thereby increasing the
effective penetration rate of mobile sensors.
BACKGROUND
Predicting the locations of individual vehicles based on mobile sensor data is a recent
area of interest. Preliminary work focused on estimating freeway travel states rather than
individual vehicle locations. The earliest work was based on vehicle location and travel
time information as determined from cell tower signal triangulation (11,12,13). Later
work focused on the much more accurate, although sparsely collected, GPS data (14).
Mobile sensor data was eventually integrated with point detection data, and used to
estimate vehicle travel time by Nanthawichit et al. (15). Herrera and Bayen used Kalman
filtering techniques and Newtonian relaxation to integrate point detection and mobile
sensor data into a high resolution traffic state estimation of a freeway (16). Their
algorithms were evaluated with both empirical ground truth freeway data (17) and actual
in-vehicle cell phones with GPS receivers (18).
One technique has been proposed to estimate vehicle locations based on their
travel times through a section. Ban et al. used the reported travel times of a portion of
vehicles traveling through an intersection to calculate their individual delays (19). This
information was then used to determine the amount of time each vehicle was in the
signal’s queue. Using this information, Ban et al. could estimate the arrival rate at the
intersection, and by assuming uniform flow rate and constant discharge rate, could
estimate the total length of the queue with only 30% of vehicles reporting their locations.
Building on this technique, Sun and Ban attempted to estimate the precise
trajectories of the unequipped vehicles that make up the total queue, whose length was
estimated using the technique described above (20). However, the number of unequipped
vehicles arriving between equipped vehicles is known, implying the use of an upstream
detector. The behavior of these unequipped vehicles did not follow a car-following
model, but instead showed immediate speed changes from free flow to stopped and back
again. No techniques have yet been proposed to estimate individual vehicle locations
based on the behavior of equipped vehicles beyond queuing analysis.
DESCRIPTION OF THE ALGORITHMS
To develop a microscopic estimation of vehicle locations and speeds, the proposed
algorithms determine when an equipped vehicle is behaving differently than would be
expected based on the locations and speeds of vehicles directly ahead. This requires a
definition of expected vehicle behavior. Car-following models, which attempt to predict
the behavior of individual vehicles, are used here as an approximation of a vehicle's
expected behavior. For this study, the Wiedemann model is used as the car-following
model. The Wiedemann model is a psychophysical model which estimates the thresholds
for a driver's decision to accelerate or decelerate based on drivers' perceptions of changes

5
in relative velocity (21). The model uses four stages: free driving, following,
approaching, and braking/emergency (22). A vehicle’s current stage is based its change in
headway and relative velocity to the leading vehicle. The Wiedemann model has gained
acceptance as the basis for the microscopic simulation software VISSIM (22).
Originally introduced in 1974 (23), the Wiedemann model was later refined,
calibrated, and validated by Wiedemann and Reiter in 1992 based on empirical freeway
traffic data (24). To avoid overfitting the Wiedemann model to the evaluation data set
(discussed later), the model as applied here uses the calibration parameters proposed by
Wiedemann and Reiter in 1992, and based on the empirical data they collected at the
time. While Wiedemann and Reiter defined some parameters explicitly, others were
estimated from their charts and graphs by Olstam and Tapani (25). For the proposed
algorithm, the Wiedemann model is also limited to in-lane car-following; lane changing
decisions are not modeled.
Mobile Sensor Only Scenario
To predict the location of unequipped vehicles, first the locations, speeds, and
accelerations of all vehicles at a given time t are used to populate a virtual roadway. The
expected position of all vehicles are updated to time t+1 based on the Wiedemann model
considering all known equipped vehicles as well as the estimated positions of unequipped
vehicles at time t. The positions of all vehicles, equipped and unequipped, are checked
against two criteria. First, if an unequipped vehicle is found to overlap with an equipped
vehicle, the unequipped vehicle is erased from the rolling estimation. Second, if an
equipped vehicle is found to have an acceleration that is less than expected by a
predetermined threshold, it is assumed that the sample vehicle is reacting to an unseen
unequipped vehicle. The equipped vehicle is expected to be in the closing stage of the
Wiedemann model, whose acceleration bn is determined by Equation 1.
1
1
2
2
1
n
n
n bLxABX
vb (1)
In Equation 1, ABX is the desired minimum following distance at low speed
differences, Δv is the difference in speed between the n-1 lead vehicle and vehicle n, Δx
is the space headway from vehicle n and vehicle n-1, Ln-1 is the length of vehicle n-1, and
bn-1 is the deceleration of the n-1 lead vehicle. A more detailed description of the model
can be found in (24) and (25).
Because the actual acceleration bn of vehicle n is known, Equation 1 can be
rearranged to determine the space headway, thereby predicting the location of the leading
vehicle n-1. The speed of the leading vehicle must be assumed as equal to some fraction
q of vehicle n’s speed. By making this assumption, the difference in speed between the
leading and following vehicles can be calculated using Equation 2.
nnn vqqvvv )1( (2)

6
The leading vehicle is assumed to have zero acceleration, and a standard vehicle
length of 15.6 feet. Equation 3 demonstrates this rearrangement of Wiedemann and
Reiter’s closing acceleration equation with the new assumptions.
1
21
2
1
n
n
n Lb
vqABXx (3)
By assuming the lead vehicle (i.e. the unseen, unequipped vehicle) has 90% of
the speed of the following vehicle (q = 0.9) and has an acceleration of zero, the headway
of the two vehicles is quickly calculated, and the lead vehicle is inserted at the
appropriate location and speed. The new vehicle’s location and speed can be found from
Equations 4 and 5.
xxx nn 1 (4)
nn vqv 1 (5)
The inserted vehicle now exists in the rolling estimation of the traffic network,
and continues to move forward and interact with other equipped and unequipped vehicles
according to the Wiedemann car-following model, although it never changes lanes. The
inserted vehicle is only removed from the simulation when an equipped vehicle no longer
reacts to it and overlaps positions, essentially running over the unequipped vehicle.
This algorithm does not require conventional point detection such as loop
detectors. When it is used without point detection, the scenario is referred to as mobile
sensor only.
Detector-Supplemented Scenario
The proposed algorithm is limited in that it can only predict the presence of unequipped
vehicles once an equipped vehicle shows a reaction. This generally doesn't happen in free
flow traffic, but only during congestion. Although the predicted locations of unequipped
vehicles are updated each time step, i.e. they move forward as though simulated vehicles
and can therefore predict densities downstream of congestion, the algorithm cannot
predict vehicle locations upstream of congestion during free flow. To improve these
predictions, the use of an upstream detector can be utilized. When the vehicle presence is
detected, vehicles can be inserted at the correct lane and the correct speed. In this way,
the rolling estimation is seeded with correct vehicle locations, and is updated throughout
the length of the freeway corridor based on vehicle behaviors and interactions. The
scenario using the upstream detector is referred to as detector supplemented.
EVALUATION
The proposed algorithms are tested using data from the Next-Generation Simulation
(NGSIM) project. NGSIM is a field-collected dataset of vehicle movements along several
corridors in the United States. Vehicle movements were collected from video recordings,
and then extracted via specialized software. This study used the dataset collected from a
0.4 mile stretch of US101 in Los Angeles, California between 7:50 AM and 8:35 AM on
June 15, 2005. The roadway has five lanes in the southbound direction, along with a one

7
on-ramp and one off-ramp. The activity on the ramps and merge lanes are not analyzed,
only the behavior of vehicles traveling in the main lanes. Figure 1 shows an overview of
the network. Because the NGSIM data records the position of every vehicle ten times per
second, it can be treated as ground truth data. To develop a test data set of mobile
sensors, a portion of vehicles are randomly assigned as mobile sensors and their
movements are pulled from the full data set. For both scenarios, 25% of vehicles were
designated as sample vehicles that report their locations once per second.
Figure 1 Section of US 101 highway used in the NGSIM dataset.
To test the algorithm, several assumptions and thresholds were set. First, the
maximum speed of a vehicle, and therefore the free flow speed of the corridor, was
assigned as 68 miles per hour based on field observations. Second, the threshold
difference in acceleration between a vehicle’s expected and actual accelerations to trigger
an inserted vehicle was set to 0.2g (6.43 ft/s2). This amount seemed reasonable, as the
threshold for determining a potential incident in naturalistic driving studies is a 0.5g
deceleration (26). Also, the car-following model used here has a maximum acceleration
of 0.36g (11.5 ft/s2) when a vehicle is at standstill, which decreases as the vehicle’s speed
increases, so that a vehicle that should be accelerating, but is not acceleration, will trigger
an insertion.
Furthermore, if a vehicle is inserted into the roadway, its initial speed is 90% (q =
0.9) of the initiating equipped vehicle, and its initial placement assumes that the vehicle
has zero acceleration. Finally, the algorithm assumes that equipped vehicles report their
lane, location, speed (which if not reported directly can be determined from the
difference in location since the last transmission), and instantaneous acceleration. The
vehicles are assumed to report once per second.
The algorithm was evaluated under two scenarios. In the mobile sensor only
scenario, the algorithm does not use any detectors in the roadway, and simply bases its
results on data reported from the mobile sensors. In the detector supplemented scenario, a
detector at the beginning of the corridor is used to insert a vehicle in the correct lane
immediately after it is detected, to ensure that the corridor is properly seeded with
vehicles, even during free flow. Each scenario was evaluated over twenty repetitions,
with each repetition designating a different set of randomly selected vehicles as the
equipped vehicles.
1920 ft

8
RESULTS
The two scenarios, mobile sensor only and detector supplemented, were implemented as
described previously. For a high-level view of the behavior of the algorithm, Figure 2
shows a time-space diagram of the predicted locations of unequipped vehicles at 25%
market penetration. Equipped vehicles are not shown.
Figure 2 A time-space diagram showing the positions of unequipped vehicles for (a) ground truth
and estimated vehicle locations for (b) mobile sensor only and (c) detector supplemented. Equipped
vehicles, comprising 25% of the total volume, are not shown.
Figure 2 shows that without an upstream detector to seed vehicle locations, the
mobile sensor only scenario (b) is inaccurate in free flow conditions, especially in free
flow conditions prior to congestion. This is particularly noticeable in the early part of the
corridor, near zero distance. During congestion, vehicles begin to interact more often,
producing improved estimates of vehicle location estimates. In the area immediately
downstream of the congestion, many of the vehicles “created” during the congestion
survive, providing a good approximation of vehicle density. Using the detector
supplemented scenario (c), accuracy of vehicle density and locations upstream of
congestion was substantially improved. Vehicle trajectories are not as continuous in the
mobile sensor only and detector supplemented scenarios. This is likely because the
algorithm is continually creating and deleting vehicles as positions are updated and
unequipped vehicles change lanes.
To evaluate the performance of the algorithm quantitatively, the ideal metric is
the root mean square error (RMSE) of the location and speed of each individual vehicle.
Unfortunately, because there is not a one-to-one ratio between number of observed
vehicles (the ground truth) and the number of estimated vehicles (the result of the
algorithm), this type of comparison is impossible. Instead, the network is subdivided by
segment length and time, and the estimated total number of vehicles within a cell at a
given time is compared to the observed number of vehicles. The evaluation used here is
based on the method used by Herrera and Bayen, with some modification (16). The
8:28
8:29
8:30
0 640 1280
Distance (ft)
(c)
8:28
8:29
8:30
0 640 1280
Distance (ft)
(b)
8:28
8:29
8:30
0 640 1280
Distance (ft)
(a)

9
roadway is segmented into 16 cells of size 120 feet each. Densities are evaluated once per
second, for a total of 2700 time steps. In total, for each of the 20 simulation repetitions
for each scenario, 43200 measurements were taken. All lanes are combined in these
measurements, although lane-specific measurements are possible.
For the mobile sensor only scenario, the RMSE of the number of vehicles present
in each cell at each time step over twenty repetitions is 3.8 vehicles. For the detector
supplemented scenario, the RMSE is 2.4 vehicles. For comparison, the RMSE of a
system assuming a linear average using only values measured at upstream and
downstream detectors is 2.6 vehicles as determined by Herrera and Bayen (16).
Figure 3 shows the number of vehicles within a cell at any given time. For the
mobile sensor only scenario, the algorithm is able to detect the shockwaves with a
reasonable degree of accuracy, but is unable to estimate realistic densities during
uncongested periods. For the detector supplemented scenario, the estimates are accurate
near the upstream detector, as is expected. The accuracy during uncongested conditions is
also substantially improved. Although this discussion refers to the average measured
densities over 20 runs, the variation of estimated values is also important. For
comparison, subfigures (c) and (e) show the results of a single repetition of each scenario.
The single repetitions are still able to identify the periods of congestion, although the
estimated densities tend to fluctuate rapidly from second to second, as groups of vehicles
are rapidly added or deleted as congestion begins and dissipates. Some smoothing of the
estimates over time (e.g. five seconds) may improve visualization.
Figure 3 Number of vehicles in each of 16 cells during each second of the NGSIM data set for (a)
ground truth, (b) mobile sensors only averaged over twenty repetitions, (c) mobile sensors only for a
single repetition, (d), detector supplemented averaged over twenty repetitions, and (e) detector
supplemented for a single repetition.
Dis
tance (
ft)
(a)
8:05 8:20 8:35
Dis
tance (
ft)
(b)
8:05 8:20 8:35
Dis
tance (
ft)
(c)
8:05 8:20 8:35
5
10
15
20
Dis
tance (
ft)
(d)
8:05 8:20 8:35
Dis
tance (
ft)
(e)
8:05 8:20 8:35

10
To better demonstrate the performance of the algorithm during both scenarios,
Figure 4 shows the total number of vehicles in the network over the 45 minute evaluation
period for the ground truth, mobile sensor only, and detector supplement scenarios. The
detector supplemented scenario is able to match the ground truth volumes throughout the
test period. The mobile sensor only scenario experiences similar peaks and valleys, but
provides low estimates of vehicles present. The mobile sensor only scenario has greater
accuracy when vehicle volumes are high, suggesting improved performance during
congestion.
Figure 4 Total number of vehicles in the network at any given time.
The algorithm is designed not just to detect vehicle densities, but the approximate
locations of these vehicles. Because there is not a one-to-one ratio of estimated and
observed vehicles, a direct comparison between actual and estimated location is
impossible. However, it is possible to measure the geometric center of all vehicles within
a cell, by finding the average location both longitudinally (i.e. the distance along the
roadway) and the laterally (i.e. a vehicle’s lane). Table 1 shows the RMSE between
several methods for calculating the geometric center and the ground truth data. The
detector supplemented scenario was able to outperform the mobile sensor only scenario.
Both scenarios were more accurate than using only the positions of equipped vehicles
without applying the algorithm. However, the most accurate technique was to assume the
true center of the cell (in this case, 60 feet longitudinally and 30 feet laterally) as the
geometric center. This technique benefitted from the generally uniform distribution of
vehicles within a cell.
7:50 8:05 8:20 8:350
50
100
150
200
Time
Tota
l N
um
ber
of
Vehic
les o
n t
he F
reew
ay S
egm
ent
Ground Truth
Mobile Sensor Only
Detector Supplemented

11
Table 1 The root mean squared error of the geometric center of all vehicles as compared to ground
truth. The results are separated by the method of estimation, and the longitudinal (along the
roadway), latitudinal (lane position across the roadway), and absolute distance. Lanes are twelve feet
wide.
Root Mean Squared Error (ft)
Method
Longitudinal
Distance
Latitudinal
Distance
Absolute
Distance
Mobile sensor only 15.9 8.2 17.9
Detector supplemented 12.6 5.2 13.6
Equipped vehicles only,
algorithm not applied 23.2 11.6 25.9
True center of the cell (assumes
uniform distribution of vehicles) 8.8 3.8 9.6
CONCLUSIONS
An algorithm for predicting the number and locations of individual vehicles, both with
and without an upstream detector, have been proposed. The algorithm uses speed,
location, and acceleration data collected once per second from a portion of vehicles
acting as mobile sensors. In a deployment, this data could be collected with GPS and
accelerometers on smart phones, or in a connected vehicle environment using DSRC. The
algorithm shows that analyzing the behavior of 25% of vehicles on the roadway to
identify likely interactions with unequipped vehicles is able to accurately estimate most
densities during congestion. The algorithm is also able to predict the densities of vehicles
immediately after a congestion period, by assuming that invented vehicles drive as
predicted by the Wiedemann car-following model. Using this method, with no point
detection present, the algorithm was able to estimate the number of vehicles within each
120-foot cell every second with an RMSE of 3.8 vehicles. However when using the
mobile sensor data only without any conventional point detection, performance is poor in
areas with free flow traffic (and therefore few vehicle interactions), especially in areas
that are not immediately downstream of congestion. This shortcoming can be remedied
by the integration of point detection data. With an upstream detector, the initial speed and
location of vehicles passing the detector are known, and these estimated vehicles can be
seeded into the network, drastically improving algorithm performance during free flow
conditions. Using an upstream detector, the algorithm was able to estimate the number of
vehicles with each 120-foot cell every second with an RMSE of 2.4 vehicles.
Although the Wiedemann model was used to determine expected vehicle
behavior, the model itself was chosen because of its versatility and lack of reliance on
calibration factors. The model itself was not calibrated to fit the observed traffic in order
to prevent overfit, and instead used default values. It is realistic to assume that any other

12
model that is space continuous and outputs expected vehicle accelerations would work
just as well. Improvements in car-following models may be imminent, as more data on
individual vehicle behaviors is collected through mobile sensors, connected vehicles, or
naturalistic driving studies (27).
The algorithm differs significantly from Herrera and Bayen’s work, which relies
heavily on a correct formulation of the fundamental diagram (16). In their algorithms,
vehicle speeds from mobile sensors are directly converted to the corresponding densities
based on the fundamental diagram, and these new values are used to adjust the sensor
data. The algorithm proposed here may be better suited for situations where
reconstruction of the fundamental diagram may be excessively difficult, e.g. few or no
conventional point detectors present, or during incidents where flow on a single lane is
dramatically affected. Future research will investigate the algorithm’s effectiveness in
these situations.
As more mobility applications are developed that require vehicle locations and
speeds as inputs, the greater the need for algorithms that can predict the locations of
vehicles that are unequipped with sensing technology, thereby improving the
performance of these applications. The algorithm proposed in this paper is a first step
towards a microscopic level view of traffic using mobile sensors, and may yet generate
new applications that have yet to be determined.
This algorithm also serves as a first step towards the integration of vehicles with
more advanced detections systems. For example, autonomous vehicles use laser scanners
to detect nearby vehicles. These measurements could be used as estimates of actual
vehicle locations, and the algorithm proposed here could quickly integrate these new
measurements to improve its performance. Furthermore, with human drivers, a distinct
limitation is the car-following model, where a vehicle’s observed behavior will not fit the
model perfectly, resulting in incorrect estimations of unequipped vehicle presence and
locations. Autonomous vehicles, by contrast, would likely follow some fixed
predetermined logic when encountering an unequipped vehicle. Therefore, by knowing
the speed and deceleration rate of the autonomous vehicle, the lead vehicle’s speed and
location could be determined with much greater accuracy.

13
REFERENCES
1. Schrank, D., T. Lomax, and S. Turner. 2010 Urban Mobility Report. Texas
Transportation Institute, 2010, pp. 60.
2. Du, J., and M. J. Barth. Next-Generation Automated Vehicle Location Systems:
Positioning at the Lane Level. IEEE Transactions on Intelligent Transportation
Systems, Vol. 9, no. 1, March 2008, pp. 48-57.
3. He, Q., and L. Head. Lane Level Vehicle Positioning with Low Cost GPS. Presented
at 89th
Meeting of the Transportation Research Board, Washington D.C., 2010.
4. STMicroelectronics. LIS302DL MEMS Motion Sensor. STMicroelectronics, 2008.
www.st.com/stonline/products/literature/ds/12726.pdf. Accessed July 16, 2011.
5. Lockkheed Martin Corporation. Core System Concept of Operations. Washington
D.C.: United States Department of Transportation Research and Innovative
Technology Administration, 2011.
6. Park, H. Development of Ramp Metering Algorithms Using Individual Vehicular Data
and Control Under Vehicle Infrastructure Integration. Dissertation, University of
Virginia, 2008.
7. Priemer, C., and B. Friedrich. A Decentralized Adaptive Traffic Signal Control Using
V2I Communication Data. Presented at 2009 12th International IEEE Conference on
Intelligent Transportation Systems, St. Louis, 2009, pp. 1-6.
8. Smith, B.L., H. Park, R. Venkatanarayana, N. J. Goodall, J. Datesh, and C. Skeritt.
Report on Evaluation Results of Traffic Signal Control Algorithms in the Simulated
IntelliDrive Environment. IntelliDrive Pooled Fund Study, 2010.
9. Smith, B.L., H. Park, R. Venkatanarayana, N. J. Goodall, J. Datesh, and C. Skeritt,
Development of New Traffic Signal Control Algorithms under IntelliDrive.
IntelliDrive Pooled Fund Study, 2010.
10. John A. Volpe National Transportation Systems Center. Vehicle-Infrastructure
Integration (VII) Initiative Benefit-Cost Analysis Version 2.3 (Draft). Federal
Highway Administration, 2008, pp. 79.
11. Bargera, H. Evaluation of a Cellular Phone-based System for Measurements of
Traffic Speeds and Travel Times: A Case Study from Israel. Transportation Research
Part C: Emerging Technologies, vol. 15, no. 6, December 2007, pp. 380-391.
12. Westerman, M., R. Litjens, and J. P. Linnartz. Integration of Probe Vehicle and
Induction Loop Data-estimation of Travel Times and Automatic Incident Detection.
Berkeley, CA: Institute of Transportation Studies, University of California, Berkeley,
1996.
13. Sanwal, K., and J. Walrand. Vehicles as Probes. Berkeley, CA: Institute of
Transportation Studies, University of California Berkeley, 1995.
14. Krause, A., E. Horvitz, A. Kansal, and F. Zhao. Toward Community Sensing. In 2008
International Conference on Information Processing in Sensor Networks, St. Louis,
MO, USA, 2008, pp. 481-492.
15. Nanthawichit, C., T. Nakatsuji, and H. Suzuki. Application of Probe-Vehicle Data for
Real-Time Traffic-State Estimation and Short-Term Travel-Time Prediction on a
Freeway. In Transportation Research Record: Journal of the Transportation
Research Board, No. 1855, Transportation Research Board of the National
Academies, Washington, D.C., 2003, pp. 49-59.

14
16. Herrera, J.C. and A.M. Bayen. Incorporation of Lagrangian Measurements in
Freeway Traffic State Estimation. Transportation Research Part B: Methodological,
vol. 44, no. 4, May 2010, pp. 460-481.
17. Traffic Analysis Tools: Next Generation Simulation - FHWA Operations. Federal
Highway Administration. ops.fhwa.dot.gov/trafficanalysistools/ngsim.htm. Accessed
November 15, 2010.
18. Herrera, J.C. et al. Mobile Century - Using GPS Mobile Phones as Traffic Sensors: A
Field Experiment. Presented at the 15th World Congress on Intelligent Transportation
Systems, New York, NY, 2008.
19. Ban, X., P. Hao, and Z. Sun. Real Time Queue Length Estimation for Signalized
Intersections Using Travel Times from Mobile Sensors. Transportation Research
Part C: Emerging Technologies, February. 2011.
20. Sun, Z. and X. Ban. Vehicle Trajectory Reconstruction for Signalized Intersections
Using Variational Formulation of Kinematic Waves. Presented at 87th
Annual
Meeting of the Transportation Research Board, Washington D.C., 2011.
21. Brackstone, M., and M. McDonald. Car-following: A Historical Review.
Transportation Research Part F: Traffic Psychology and Behaviour, vol. 2, no. 4,
Dec. 1999, pp. 181-196.
22. PTV. VISSIM 5.30-04 User Manual. Planung Transport Verkehr AG, February, 2011.
23. Wiedemann, R. Simulation des Strassenverkehrsflusses. University Karlsruhe, 1974.
24. Wiedemann R., and U. Reiter. Microscopic Traffic Simulation: The Simulation
System MISSION, Background and Actual State. Brussels: CEC, 1992.
25. Olstam, J.J., and A. Tapani. Comparison of Car-following Models. Linköping,
Sweden: Swedish National Road and Transport Research Institute, 2004.
26. Dingus, T.A., et al. The 100-Car Naturalistic Driving Study, Phase II – Results of the
100-Car Field Experiment. Publication DOT HS 810 593. National Highway Traffic
Safety Administration (NHTSA), April 2006.
27. Chong, L., M.M. Abbas, and A.M. Flintsch. Driver Behavior Simulation Using
Agent-based Backpropagation Neural Network. Presented at 90th Annual Meeting of
the Transportation Research Board, Washington D.C., 2011.